1. Introduction
Amid the comprehensive implementation of the dual-carbon strategy and the clean substitution of fossil fuels, green hydrogen, as a zero-carbon clean fuel with distinctive advantages including zero carbon emissions, diverse feedstock sources, and combustion products consisting solely of water vapor, is gaining rapid traction in engineering applications spanning thermal equipment such as coal-fired boilers retrofitted with hydrogen co-firing, hydrogen-fueled gas turbines, industrial hydrogen-fired kilns, and hydrogen internal combustion engines. Produced via electrolysis powered by renewables such as wind and solar, or recovered via purification of industrial by-products, hydrogen has become a core alternative fuel carrier for carbon reduction retrofits in the thermal power sector and the low-carbon transition of the energy structure [
1,
2]. In the high-temperature combustion environment of thermal equipment furnaces, radiative heat transfer accounts for over 70% of the total heat exchange and governs the furnace temperature field, wall heat flux, equipment thermal efficiency, and formation of pollutants such as NO
x [
3]. The accuracy of flue gas radiation calculations is therefore critical to the structural design optimization and safe, economical operation of hydrogen co-firing combustion systems.
Since O
2 and N
2 in air exhibit virtually no thermal radiation, and among the combustion products of carbonaceous fuels such as coal and natural gas, only CO
2 and H
2O possess significant radiative capability, traditional engineering flue gas radiation models are built exclusively around these two species. The classic weighted-sum-of-gray-gases model (WSGGM) proposed by Smith [
4] has been embedded into mainstream CFD software such as ANSYS FLUENT, striking a balance between computational accuracy and efficiency, and remains one of the most widely adopted gas radiation models for full-scale combustion simulations [
5].
To date, research on gas radiation characteristics has focused predominantly on oxy-fuel combustion, driven by the fact that the high CO
2 mole fraction fundamentally alters the gas radiation properties of the combustion atmosphere. Numerous scholars have investigated gas radiation behavior under oxy-fuel conditions, refined Smith’s model, and proposed a series of improved WSGGMs, as shown in
Table 1. Yin [
6,
7] employed four gray gases based on the EWBM to derive a set of WSGGM coefficients applicable to both air and oxy-fuel conditions, tabulating the coefficients for 11 cases as functions of CO
2 and H
2O partial pressures and total pressure. Johansson et al. [
8] used a statistical narrow-band model to calculate the emissivity of CO
2–H
2O mixtures and proposed WSGGM correlation coefficients based on four gray gases. Guo et al. [
9] combined the features of the full-spectrum k-distribution model with the WSGGM and directly fitted the weighting factors and absorption coefficients of an improved WSGGM to the k-distribution.
Some scholars have also employed the line-by-line (LBL) method to calculate the total emissivity of gas mixtures for fitting WSGGMs. Kangwanpongpan et al. [
10] fitted new WSGGM correlation coefficients based on the HITEMP 2010 spectroscopic database and tabulated seven sets of coefficients applicable to different H
2O/CO
2 molar ratio conditions. Bordbar et al. [
11] fitted a new set of WSGGM coefficients using five gray gases, covering the entire range of H
2O/CO
2 molar ratios.
Wu et al. [
12] proposed a gas radiation model accounting for high CO mole fraction in oxy-fuel staged combustion. Based on the HITEMP 2010 spectroscopic database, this model extends the radiatively absorbing gases from H
2O and CO
2 to H
2O, CO
2, and CO, enabling more accurate calculation of the radiation under high CO mole fraction in the primary combustion zone and reduction zone of oxy-fuel staged combustion. All the aforementioned studies are limited to the H
2O–CO
2 mixed flue gas system arising from carbonaceous fuel combustion. For such systems, temperature is generally the primary factor governing gas emissivity.
Nevertheless, existing combustion radiation experiments and model development efforts have been predominantly concentrated on carbonaceous fuels such as coal and natural gas [
13,
14,
15], while systematic investigations specifically targeting hydrogen combustion systems remain limited. Notably, in hydrogen combustion with air, the reaction is 2H
2 + O
2 = 2H
2O, where N
2 acts merely as a diluent with negligible radiative contribution. Although trace dissociation products may form at elevated temperatures, their effect on radiation is negligible. Accordingly, H
2O is treated as the sole radiatively significant species in the combustion products for the entire scope of this study. In hydrogen co-firing combustion, as the hydrogen blending ratio increases, the flue gas H
2O mole fraction rises continuously from the 5–23% typical of conventional coal combustion [
16]. Under pure hydrogen oxy-fuel combustion conditions, the H
2O mole fraction is substantially higher and frequently exceeds the range over which traditional WSGGMs were originally fitted. To the authors’ knowledge, few studies have systematically covered the high-temperature radiation behavior of high H
2O mole fraction gases across the combined parameter ranges of 500–3000 K, 0.01–60 m radiation path length, and 1–100% H
2O mole fraction at 1 atm. Directly applying traditional radiation models to hydrogen combustion scenarios can introduce substantial calculation errors, making them unsuitable for the high-fidelity simulation and engineering design of equipment such as pure hydrogen/hydrogen–coal co-fired boilers and hydrogen gas turbines.
To address this gap, this study utilizes the HITEMP 2010 high-temperature spectroscopic database and a high-accuracy line-by-line method to generate a high-temperature emissivity dataset for pure H2O at 1 atm, and systematically evaluates the effects of temperature, total pressure, radiation path length, and H2O mole fraction on the emissivity of hydrogen combustion flue gas. Based on this high-accuracy LBL benchmark dataset, the Levenberg–Marquardt (LM) nonlinear regression algorithm is employed to fit new WSGGM coefficients tailored to high-H2O-mole-fraction conditions. The resulting radiation data and the fitted engineering model provide essential inputs for radiative heat transfer calculations in various hydrogen-fueled thermal systems, and serve as a reliable foundation for the numerical simulation and low-carbon retrofitting of hydrogen-fired boilers and gas turbines.
2. Computational Methods
2.1. Radiative Spectral Database
This study adopts the HITEMP2010 high-temperature spectroscopic database, selecting spectral parameters of the H2O species, including line position, line intensity, broadening half-width coefficient, air-broadening half-width, and other data, to ensure calculation accuracy in the high-temperature range.
2.2. Emissivity Calculation Method
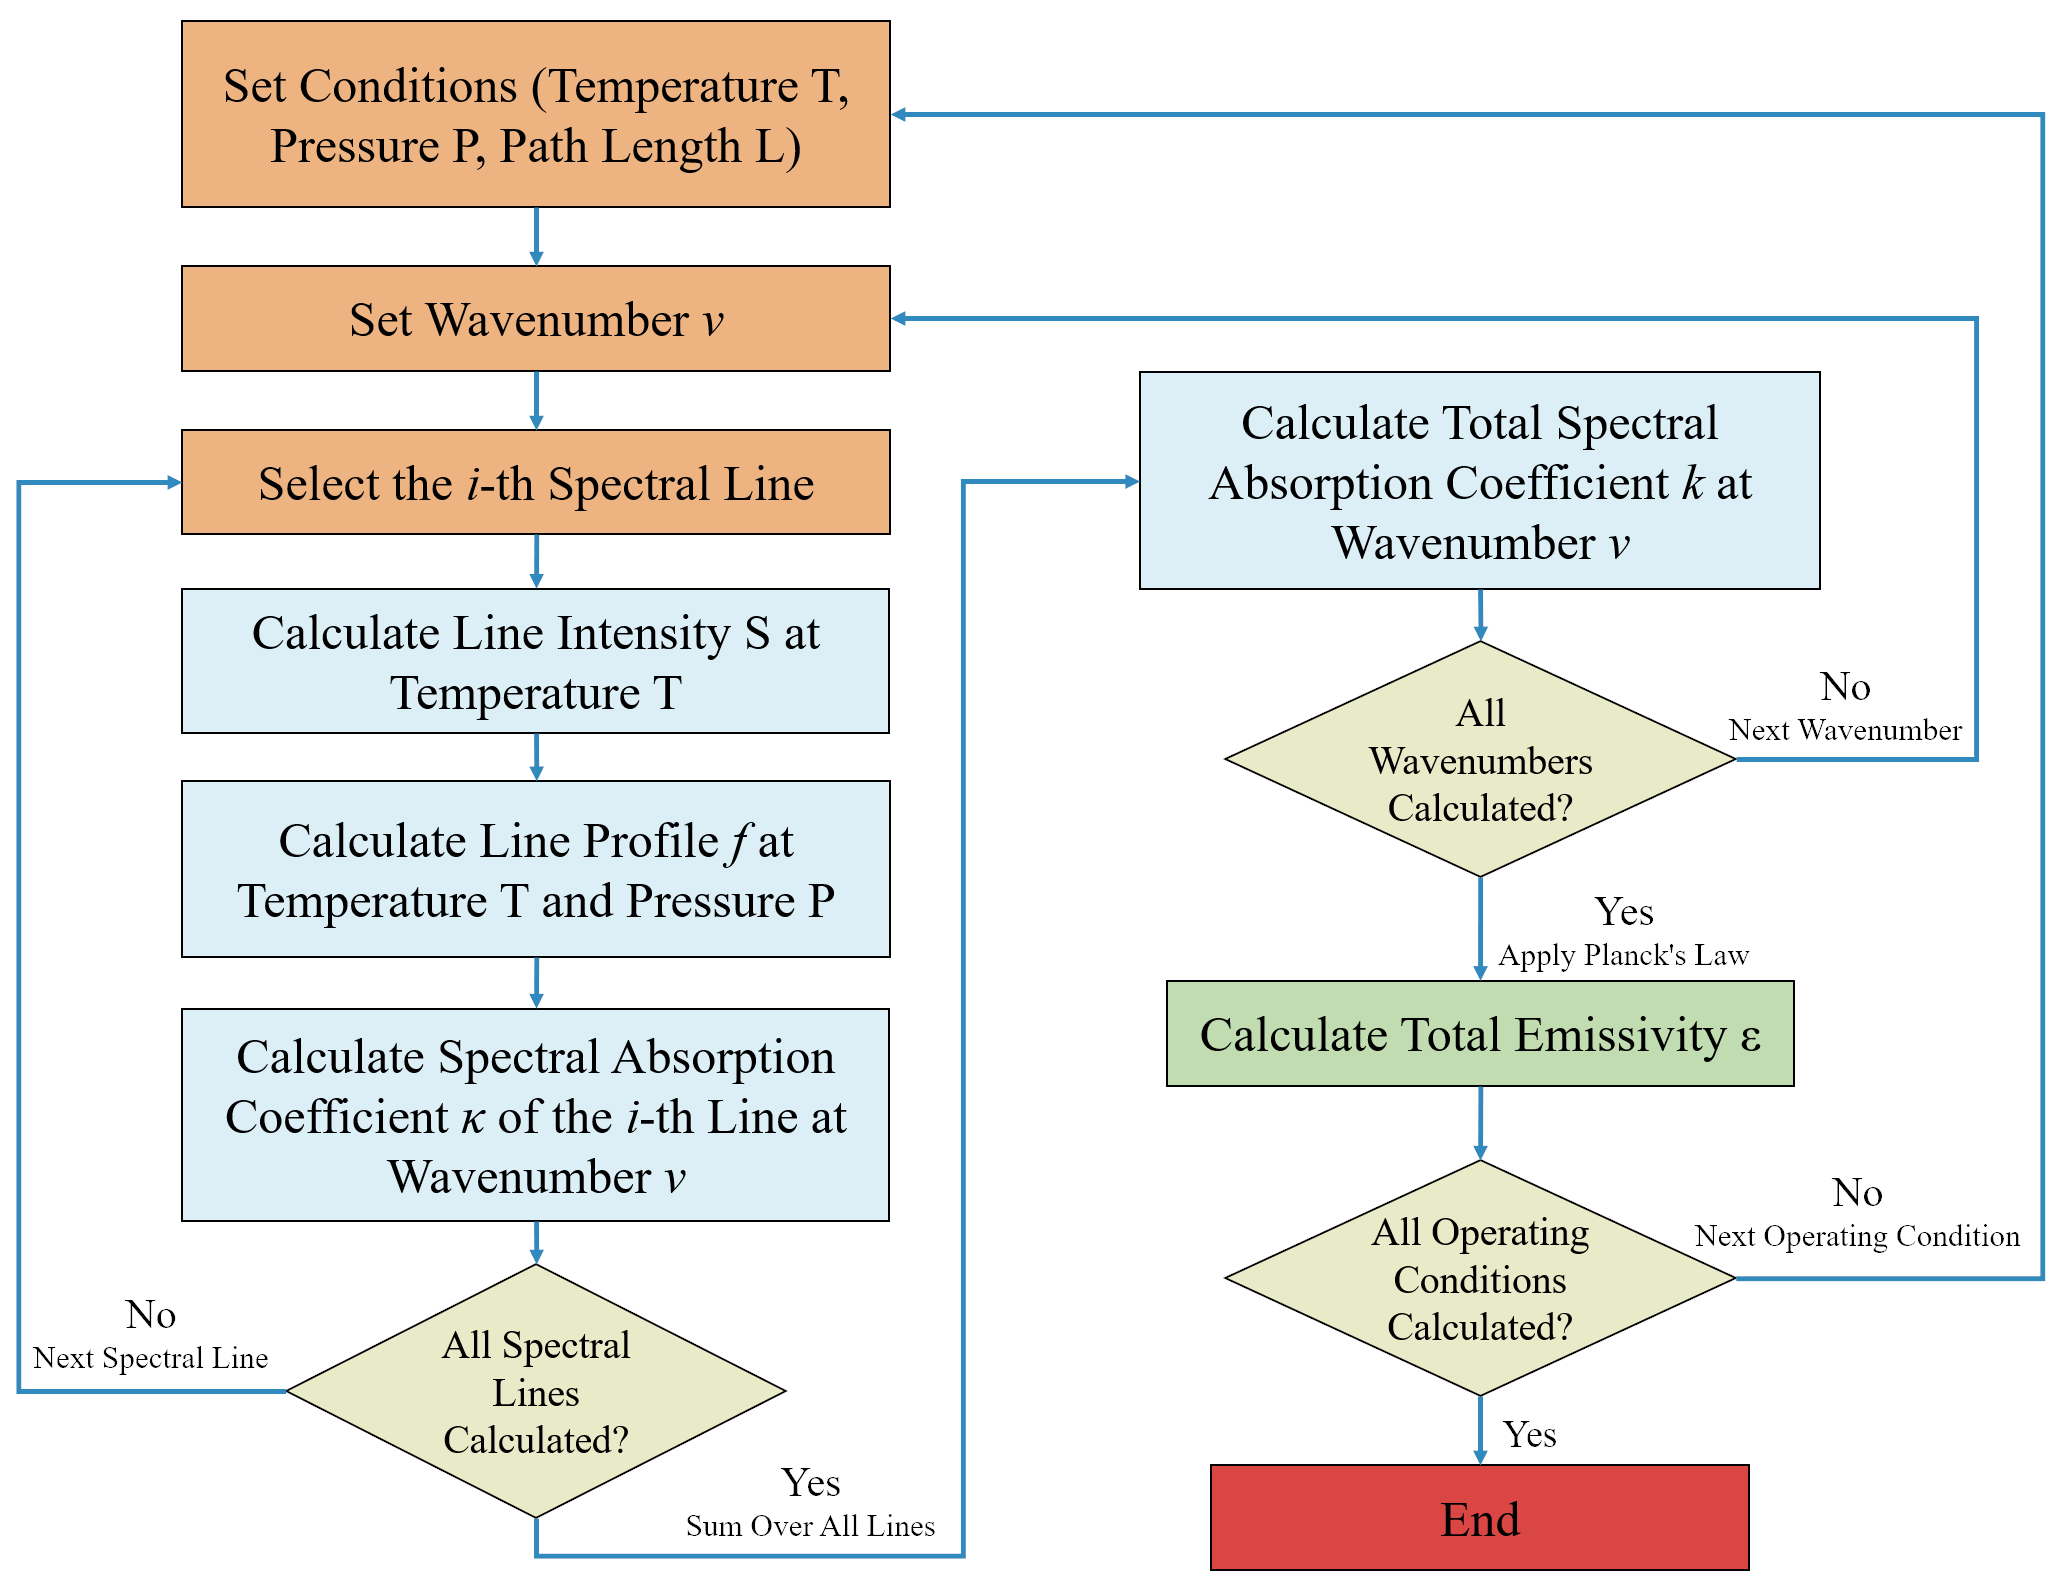
Based on the line-by-line method, the radiation parameters of the H
2O species in hydrogen combustion flue gas are calculated. The overall solution procedure is shown in
Figure 1.
For a single absorbing gas molecule such as H
2O, the spectral absorption coefficient at any wavenumber on a specific spectral line can be calculated using Equation (1):
where
is the spectral absorption coefficient at wavenumber ν on the i-th spectral line;
is the line intensity of the absorbing gas at the current temperature
T; and
is the line shape function at the current temperature
T and pressure
p.
The line intensity of the absorbing gas at temperature
T,
, is calculated based on Equation (2):
where
Q is the total internal partition sum at the corresponding temperature;
is the second radiation constant;
is the lower-state energy of the transition;
is the wavenumber of the line transition in vacuum; and
is the reference temperature, 296 K.
The expression for the second radiation constant
is:
where h is Planck’s constant,
c is the speed of light, and k is Boltzmann’s constant.
The line shape function
is chosen as the Lorentz line shape function. The Lorentz line shape function accounts for pressure broadening (collision broadening) effects, and the influence of pressure broadening is considered at moderate temperatures and higher pressures. The Lorentz line shape function is expressed as:
where
is the Lorentz pressure broadening half-width;
is the pressure shift coefficient.
The Lorentz pressure broadening half-width
is calculated by Equation (5):
where
is the temperature-dependent air-broadening half-width coefficient;
is the air-broadening half-width at half maximum;
is the self-broadening half-width at half maximum; and
is the partial pressure of the absorbing gas. Available values of
are very scarce, and current spectroscopic databases lack a large amount of
data. Therefore,
is taken as zero in the Lorentz line shape function. Ultimately, the expression for the Lorentz line shape function is:
The spectral absorption coefficient at any wavenumber is calculated by summing the spectral absorption coefficients of all gas molecules over all spectral lines, as shown in Equation (7):
where
is the number density of the absorbing gas molecules, calculated by Equation (8):
where
is the Avogadro constant, and
R is the universal gas constant. For a gas mixture composed of different species, its spectral absorption coefficient is the sum of the spectral absorption coefficients of the individual absorbing gas species. In the hydrogen combustion process, only H
2O is a radiatively active species in the combustion atmosphere; therefore, the monochromatic absorption coefficient of hydrogen combustion flue gas is contributed solely by H
2O, and is expressed by the following equation:
Through the above calculations, the spectral absorption coefficient of the gas mixture at different wavenumbers can be obtained, thereby establishing the relationship between the spectral absorption coefficient and wavenumber, which is used to calculate the total emissivity of the gas mixture. The calculated total emissivity of the gas mixture can serve as a benchmark to evaluate the accuracy of other gas radiation models. Using Planck’s law, the expression for the total emissivity of the gas mixture is:
where
σ is the Stefan–Boltzmann constant,
is the monochromatic emissivity, and
is the monochromatic emissive power of a blackbody. Based on the histogram of spectral absorption coefficients obtained from the line-by-line method, after discretizing the above integral, the formula for calculating the total emissivity of the gas mixture is:
All emissivity calculations in this study consider only the radiative contribution of H2O in the gas mixture; N2 and O2 are treated as inert diluent gases and do not participate in the radiative heat transfer process.
2.3. Parameter Fitting Method for the New WSGGM
The WSGGM was first proposed by Hottel and Sarofim [
17]; later, Smith [
4] developed and fitted the most widely used WSGGM parameters, and it has been widely applied in CFD calculations. The WSGGM simulates the non-gray radiation characteristics of real gases using several hypothetical gray gases and one transparent gas, and assumes that the absorption coefficient of each hypothetical gray gas is independent of wavenumber. Using the WSGGM, the emissivity of the gas mixture can be calculated by the following formula:
where
is the number of hypothetical gray gases,
is the emissivity weighting factor for the i-th hypothetical gray gas,
is the absorption coefficient of the
i-th hypothetical gray gas,
is the partial pressure of the absorbing gases, and
L is the mean beam length. It should be noted that
is the weighting factor for the transparent gas, and its absorption coefficient
is zero.
can be calculated by the following formula:
where
is the total pressure, and
is the mole fraction of the absorbing gases.
In commonly used WSGGMs,
is a temperature-dependent function, whose expression is:
where
is the polynomial coefficient of temperature for the i-th hypothetical gas. Meanwhile, with changes in
, L, and T,
and
are considered nearly constant and can therefore be treated as constants. In other studies, to improve the accuracy of WSGGM,
and
have been developed into functions related to the mole fraction of the absorbing gases or relative temperature. In this paper, the following WSGGM formulation is adopted, which is expressed as:
where
is the relative temperature,
is the mole fraction of H
2O, and
and
are the polynomial coefficients of
and
, respectively. Nonlinear multivariate regression analysis is employed for parameter fitting, using the Levenberg–Marquardt algorithm (LM algorithm) to solve the nonlinear curve-fitting problem in this paper. The WSGGM polynomial is first expanded, and the 120 unknown coefficients (100
and 20
) are directly fitted.
In the fitting process, the final weighting factors and absorption coefficients are calculated from these polynomial expansions as defined in Equations (15)–(18). The are constrained to be non-negative and to sum to unity (, ), while the are constrained to be positive. All calculations were conducted in MATLAB R2022b using in–house codes.
2.4. Computational Conditions
For the calculation of the gas mixture emissivity under different hydrogen combustion conditions, multiple sets of conditions were designed over a wide temperature range of 500–3000 K to systematically investigate the effects of temperature, total pressure, radiation path length, and H2O mole fraction on the gas mixture emissivity. The specific computational conditions and parameter definitions are as follows:
Temperature range: 500–3000 K with an interval of 100 K, yielding 26 temperature points;
Total pressure: 1, 2, 3, 5, 10, 20, and 50 atm, covering low- to high-pressure conditions (seven pressure levels);
Radiation path length: 0.01, 0.05, 0.1, 0.2, 0.3, 0.4, 0.5, 0.75, 1, 1.5, 2, 3, 5, 10, 15, 20, 30, 40, 50, and 60 m, covering short to long radiation path lengths that can correspond to combustion devices of different scales, from laboratory apparatus to utility boilers (20 radiation path lengths);
H2O mole fraction: selected as 1%, 5%, 10%, 15%, 20%, 25%, 30%, 45%, 60%, 75%, 90%, and 100% (12 levels);
Spectral range: 0–15,000 cm−1 at a resolution of 0.02 cm−1;
No line cutoff criteria were applied, as all spectral lines from the HITEMP2010 database were retained to ensure spectral completeness;
The numerical integration of spectral absorption coefficients was performed using the methods described in Equations (10) and (11).
Therefore, the computational conditions in this study fully account for temperature, total pressure, radiation path length, and H2O mole fraction, totaling 43,680 cases.
3. Results and Discussion
3.1. Effect of Temperature on Emissivity
Temperature is one of the core factors influencing gas radiation characteristics, and its mechanism is closely related to the molecular energy level distribution and the evolution of line intensity with temperature.
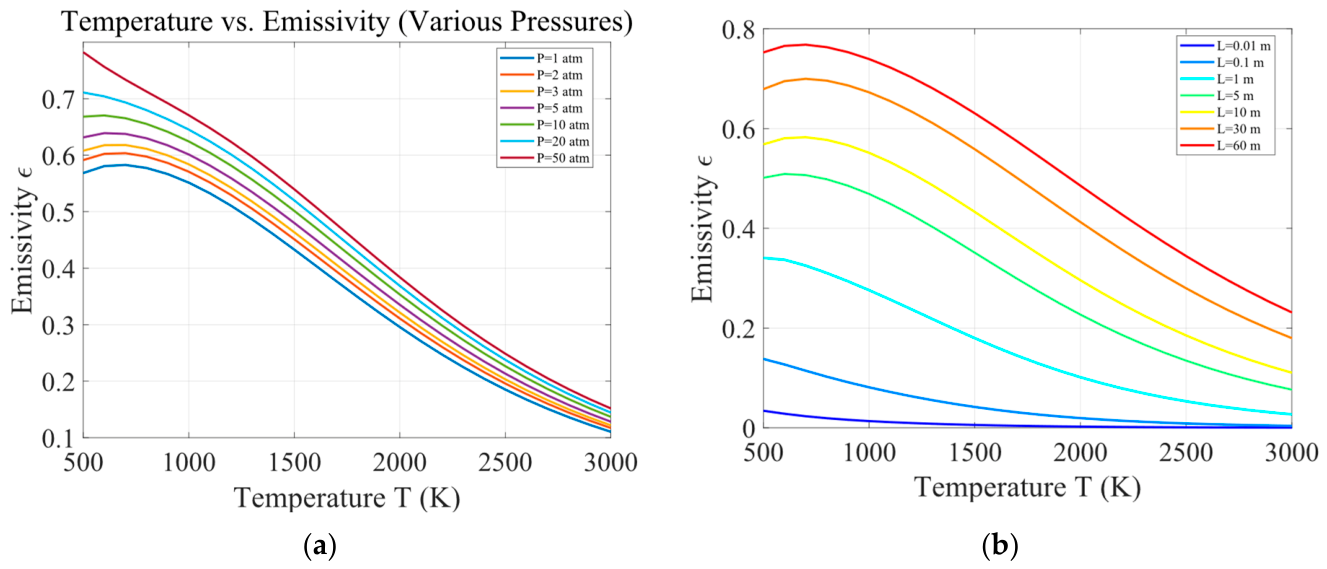
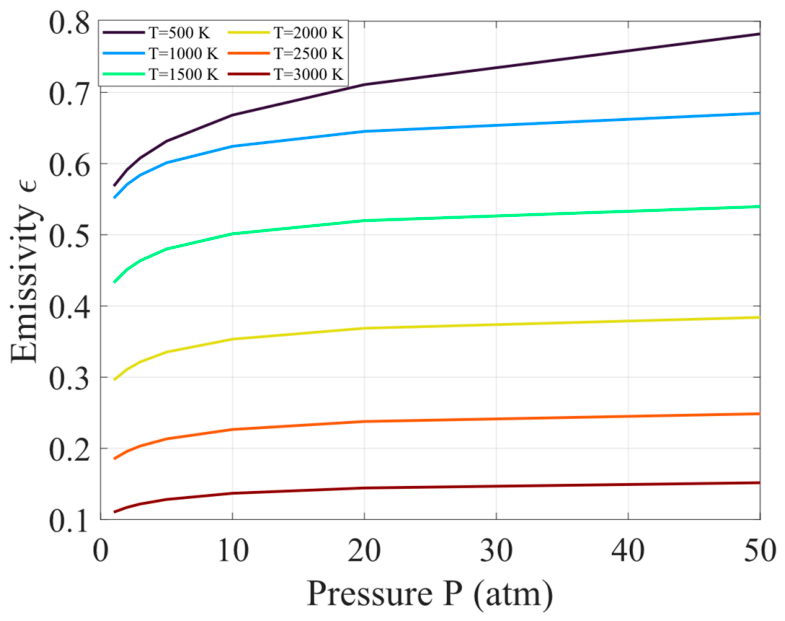
Figure 2a shows the relationship between temperature and emissivity under different pressures at a radiation path length of 10 m and an H
2O mole fraction of 30%. As the temperature increases, the total emissivity of the gas mixture gradually decreases. When the total gas pressure is 1 atm, the temperature rises from 500 K to 3000 K, and the total gas mixture emissivity decreases from 0.57 to 0.11, a reduction of approximately 80.7%. When the total gas pressure is 50 atm, the total gas mixture emissivity decreases from 0.78 to 0.15, also a reduction of approximately 80.7%. This phenomenon indicates that increasing pressure only raises the baseline of water vapor emissivity at all temperatures by enhancing H
2O radiation capability through collision broadening, but cannot alter the temperature-dominated emissivity attenuation trend. The root cause lies in the single-species radiation characteristics of pure hydrogen combustion flue gas, lacking the multi-band complementary buffering mechanism provided by CO
2 and other species. This forms a clear distinction from the behavior of multi-component gas mixtures, and also confirms the limitations of traditional radiation models based on carbonaceous fuel flue gas under hydrogen combustion conditions.
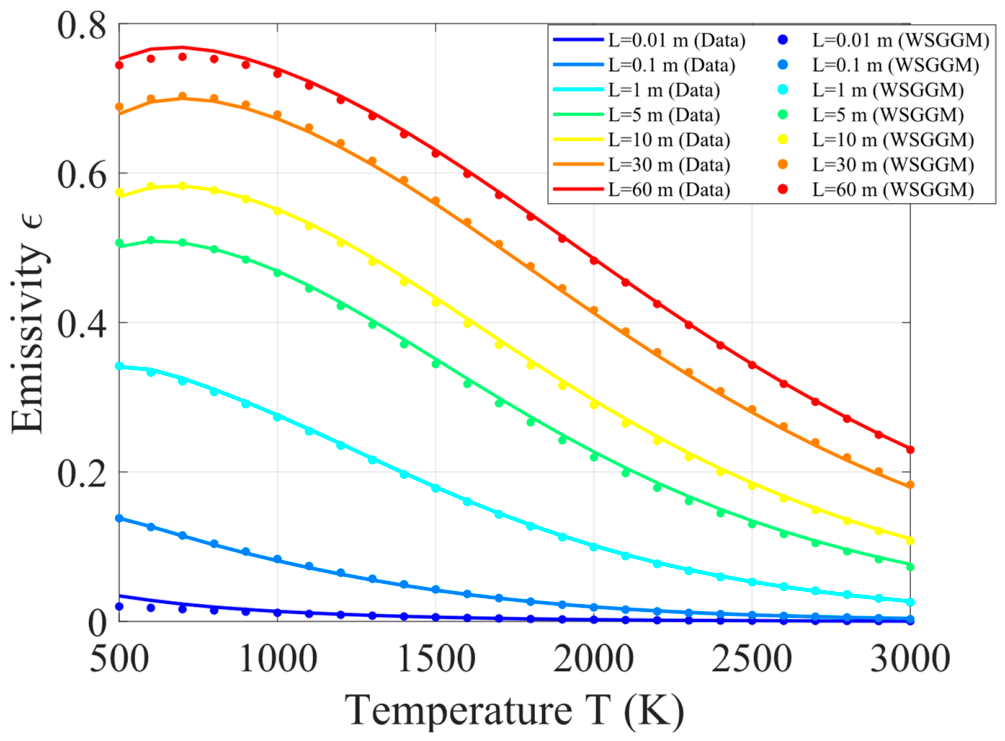
Figure 2b shows the relationship between temperature and emissivity under different radiation path lengths at a total gas pressure of 1 atm and an H
2O mole fraction of 30%. Under all radiation path length conditions, the water vapor emissivity decreases gradually with increasing temperature. When the radiation path length is 0.01 m, as the temperature rises from 500 K to 3000 K, the total gas mixture emissivity decreases from 0.03 to near zero, a reduction of approximately 99.97%. When the radiation path length is 60 m, the total gas mixture emissivity decreases from 0.75 to 0.23, a reduction of approximately 69.3%. The radiation path length determines the cumulative effect of infrared radiation interacting with water molecules: under short radiation path lengths, the radiation effect is inherently weak, and high temperature can cause its radiation capability to be almost completely lost; long radiation path lengths rely on the path accumulation effect, which can effectively mitigate the radiation attenuation caused by temperature.
3.2. Effect of H2O Mole Fraction on Emissivity
The H
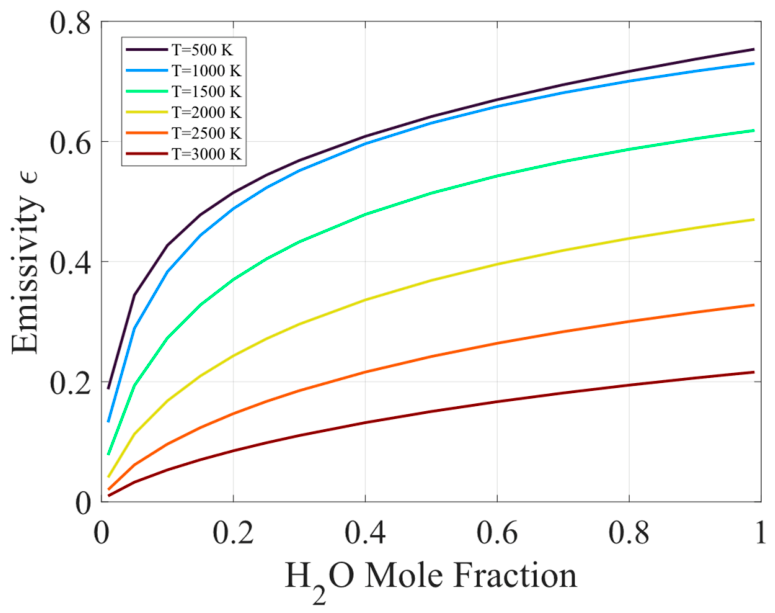
2O mole fraction is a core variable controlling gas mixture emissivity. As shown in
Figure 3, at a total pressure of 1 atm and a radiation path length of 10 m, emissivity increases with H
2O mole fraction, exhibiting a rapid rise followed by a gradual saturation. When the mole fraction increases from 1% to 10% at 500 K, emissivity rises from 0.19 to 0.43, accounting for 42.9% of the total increase; further increasing the mole fraction from 20% to 99% yields only a 0.23 increase, indicating higher sensitivity in the low-mole-fraction region.
This saturation behavior is governed by the gas radiation saturation effect. At low mole fractions, adding H2O rapidly provides effective radiation carriers, causing emissivity to surge; at high mole fractions, the infrared absorption bands become saturated, and the contribution of additional water molecules diminishes. Temperature further modulates the growth rate: at low temperatures, a high proportion of ground-state molecules yields strong single-molecule radiation efficiency and a steep initial slope; at high temperatures, excited-state molecules dominate, resulting in lower efficiency and a gentler increase. As the mole fraction increases, emissivity under all temperatures gradually approaches saturation, and the growth rate differences narrow and eventually converge.
3.3. Effect of Radiation Path Length on Emissivity
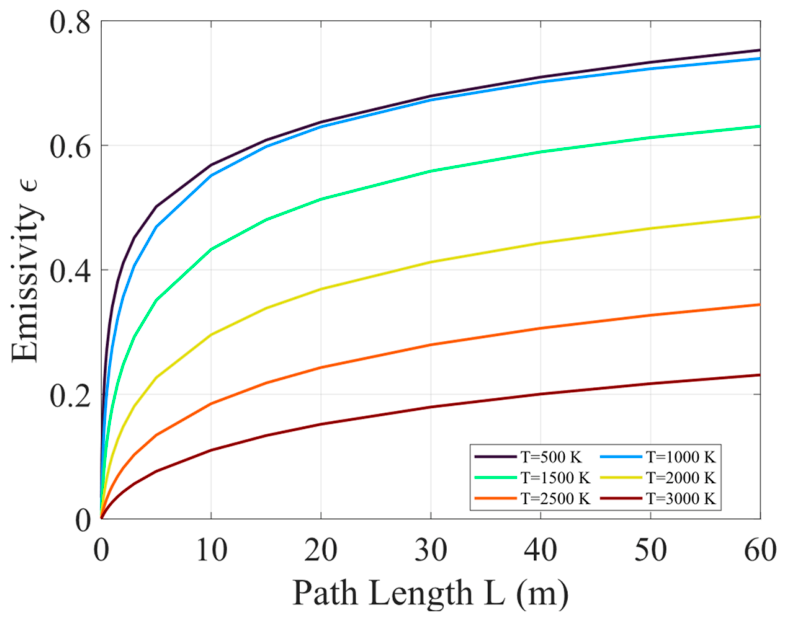
Radiation path length is a core parameter determining the radiation absorption path of gases, and the gas mixture emissivity exhibits a typical saturation growth characteristic with increasing radiation path length. As shown in
Figure 4, in the short radiation path length range of 0–5 m, the emissivity rises rapidly with radiation path length; under the low-temperature condition of 500 K, the emissivity increases from 0.18 to 0.5, an absolute increase of 0.32, accounting for 56.1% of the total increase over the entire range. In the 5–20 m range, the growth rate gradually slows; when the radiation path length exceeds 20 m, the emissivity essentially stabilizes and reaches a saturation level. It can be seen that the lower the gas temperature, the higher the initial emissivity of the gas mixture, and the earlier the saturation trend appears.
Furnace geometry directly determines the radiation path length used in radiation calculations, thereby altering the radiative emission level of hydrogen combustion flue gas. Laboratory-scale combustion devices correspond to short radiation path length conditions, where the gas emissivity is generally low. In contrast, in large furnaces such as utility boilers, the radiation path length can reach tens of meters; the long radiation path length allows the cumulative effect of radiation absorption to be fully manifested, significantly increasing the emissivity of the gas mixture in the furnace. Under identical conditions of temperature, total pressure, and flue gas composition, the emissivity of pure hydrogen combustion flue gas can vary by more than an order of magnitude with the characteristic size of the equipment. Engineering radiation modeling must account for the emissivity variation caused by differences in radiation path length; otherwise, severe heat transfer calculation errors will occur.
3.4. Effect of Total Pressure on Emissivity
The influence of pressure on gas radiation characteristics primarily originates from the spectral line collision broadening effect: as the total pressure increases, the collision frequency of gas molecules rises, the absorption line width increases significantly, and the degree of line overlap intensifies, thereby enhancing the overall absorption and emission capability of the gas mixture.
Figure 5 presents the variation of the gas mixture emissivity with total pressure during hydrogen combustion at different radiation path lengths. It can be observed that over the entire temperature range, the emissivity increases monotonically with increasing total pressure, exhibiting a distinct two-stage variation: in the low-pressure range of 0–10 atm, the emissivity grows with pressure by a certain magnitude; after the pressure exceeds 10 atm, the emissivity growth rate slows sharply and the curves become nearly horizontal. The above behavior is particularly pronounced under high-temperature conditions. Taking the 3000 K condition as an example, when the pressure increases from 1 atm to 10 atm, the emissivity rises from 0.11 to 0.14, an absolute increase of only 0.03; when the pressure further rises to 50 atm, the emissivity reaches 0.15, with a total increase over the entire range of merely 0.04. This indicates that increasing the total pressure only elevates the baseline of water vapor emissivity at all temperatures, and its enhancement effect on emissivity rapidly saturates above 10 atm.
The physical essence of this phenomenon lies in the coupling between the energy level distribution of water molecules and spectral line broadening. At low temperatures, the vast majority of water molecules are stably in the ground state, yielding high infrared absorption line intensities; the Lorentz collision broadening induced by increasing pressure can widen the absorption bands to a certain extent. However, since pure hydrogen combustion flue gas contains only H2O as the single radiative species and its characteristic absorption band range is limited, when the pressure rises above 10 atm, the main absorption bands are already substantially broadened and overlapped, and further pressure increase produces negligible gain in absorption capability. At high temperatures, a large number of water molecules are excited to high-energy excited states, leaving scarce effective radiation carriers; even though pressure broadening increases the absorption cross-section, the improvement in overall radiation capability is even more limited.
3.5. Multi-Parameter Coupling Analysis
3.5.1. Range Analysis and Variance Contribution Ratio
To clarify the influence patterns and primary and secondary weights of multiple parameters—temperature, radiation path length, total pressure, and H
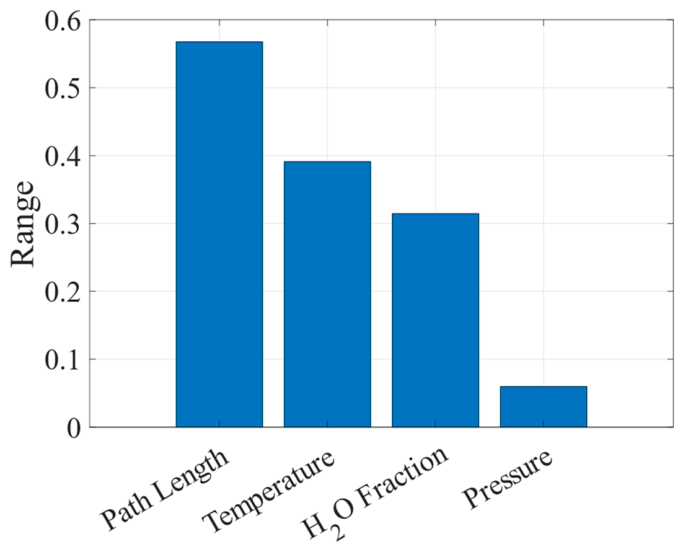
2O mole fraction—on the emissivity of the gas mixture, a multi-factor sensitivity analysis was conducted using the range analysis method. The range analysis method is a simple and intuitive statistical tool for investigating multi-factor patterns; by calculating the range values of emissivity at different levels of each influencing factor, it characterizes the intensity of the factor’s influence on the target indicator. To eliminate the influence of differing units and scales among the parameters, the range values were computed based on standardized dimensionless variables. The standardized range statistics for each factor are shown in
Table 2 and
Figure A1: temperature range 0.390978, radiation path length range 0.567748, pressure range 0.059705, and H
2O mole fraction range 0.314399.
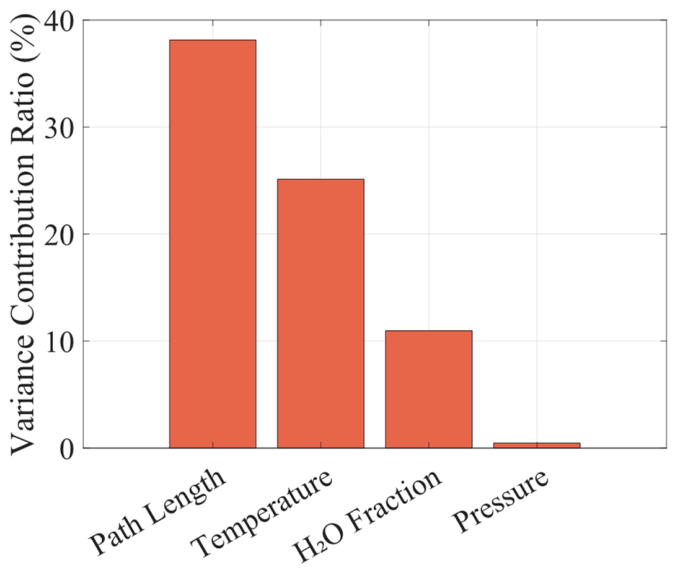
To further verify the ranking, a variance-based sensitivity analysis was also performed, and the variance contribution ratio was calculated. represents the proportion of each parameter’s contribution to the total variance of emissivity, with a larger value indicating a stronger explanatory power. The results are as follows: radiation path length = 0.3813 (38.13% variance contribution), temperature = 0.2512 (25.12%), H2O mole fraction = 0.1098 (10.98%), and pressure = 0.0047 (0.47%). The sum of these ratios accounts for approximately 74.7% of the total variance, capturing the majority of the variance in emissivity. Both the standardized range analysis and the variance-based sensitivity analysis yield an identical ranking: radiation path length > temperature > H2O mole fraction > total pressure.
The radiation path length has the largest range value and variance contribution ratio and is the primary controlling factor of the radiation characteristics of pure hydrogen combustion flue gas, which is completely consistent with the three-stage saturation growth pattern described in
Section 3.3. This result is fundamentally different from the rule in multi-component gas mixtures that temperature is the primary controlling factor: in multi-component systems, the characteristic bands of different species exhibit a temperature complementarity effect, whereas the pure hydrogen system contains only H
2O as a single radiative species, and its radiation capability relies entirely on the cumulative interaction between infrared radiation and water molecules; therefore, the influence of radiation path length is significantly amplified. The influences of temperature and H
2O mole fraction are secondary, regulating emissivity by altering the energy level distribution of water molecules and the number of effective radiation carriers, respectively. The influence of pressure is the weakest, only slightly enhancing the gas absorption capacity through collision broadening; moreover, in a single-species system, the characteristic absorption band range of H
2O is limited—when the pressure rises above 10 atm, the spectral line broadening and overlap have essentially reached saturation, and further pressure increases yield negligible gains in emissivity.
3.5.2. Coupling Characteristics of Radiation Path Length and Temperature
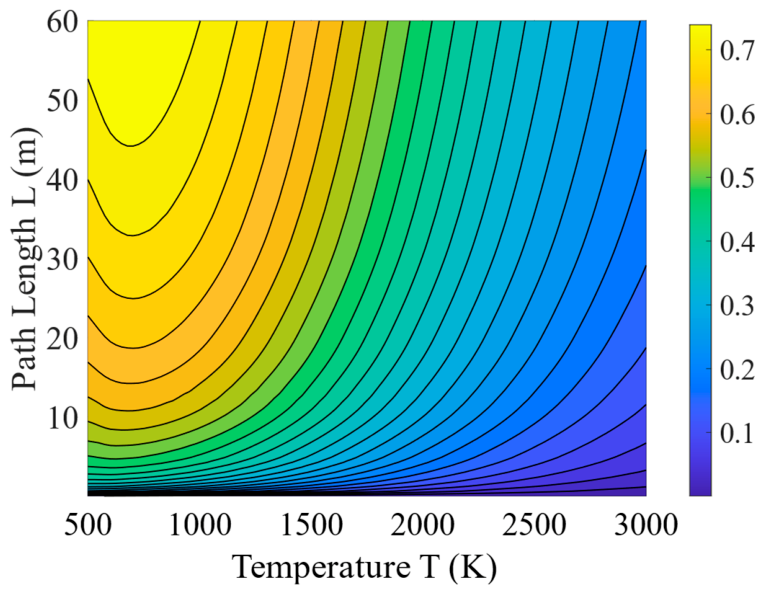
Since radiation path length and temperature are the two most influential parameters,
Figure 6 presents the contour plot of gas emissivity at different radiation path lengths and temperatures; the denser the contours, the more sensitive the emissivity is to temperature and radiation path length. Overall, the emissivity exhibits a gradient distribution with high values in the low-temperature, long-path-length region and low values in the high-temperature, short-path-length region, and contours are densest in the 500–1500 K and 0–20 m range, indicating the highest sensitivity, while above 2000 K and 20 m the contours are markedly sparse and the influence of parameter variations is significantly weakened. The coupling between radiation path length and temperature is mutually weakening: the influence of radiation path length gradually diminishes with increasing temperature, and the influence of temperature gradually diminishes with increasing radiation path length. This behavior originates from the single-species radiation characteristics of pure hydrogen flue gas—at low temperatures, ground-state water molecules dominate, resulting in strong radiation capability and a significant radiation path length accumulation effect, whereas at short radiation path lengths or high temperatures the radiation capability is inherently weak and is easily lost.
These findings provide clear guidance for engineering design and numerical simulation of hydrogen-fueled thermal equipment. Furnace structure design should prioritize the dominant role of characteristic size (radiation path length), with particular attention to radiation path length matching in short-path-length, high-sensitivity zones such as low-temperature convection flue ducts. Numerical simulations must ensure high accuracy of radiation path length and temperature fields, and finer grids and radiation solving algorithms should be adopted in short-path-length, low-temperature regions. For the vast majority of industrial boilers and utility boilers operating at atmospheric pressure, the pressure effect can be appropriately simplified, whereas high-pressure equipment such as hydrogen gas turbines and hydrogen internal combustion engines should incorporate pressure dependence.
3.6. New WSGGM
3.6.1. Model Development and Parameterization
This study adopts an improved weighted-sum-of-gray-gases model (WSGGM) that simultaneously considers the effects of temperature and H
2O mole fraction on both the weighting factors and the absorption coefficients, enabling better adaptation to the single-species radiation characteristics of pure hydrogen combustion flue gas. Its specific expression is given in Equations (15)–(19) in
Section 2.3. Based on the 43,680 sets of high-accuracy line-by-line (LBL) benchmark data calculated previously, the Levenberg–Marquardt (LM) nonlinear regression algorithm is employed to fit the parameters of a four-gray-gas WSGGM suitable for pure hydrogen combustion flue gas, as listed in
Table A1 and
Table A2. This model covers the full temperature range of 500–3000 K, the full-scale radiation path length range of 0.01–60 m, and the entire H
2O mole fraction range of 1–100% at 1 atm. Furthermore, it can be directly implemented in mainstream CFD platforms including ANSYS FLUENT.
To quantitatively evaluate the fitting performance of the new WSGGM, three statistical indicators—the coefficient of determination (R2), root mean square error (RMSE), and mean absolute error (MAE)—are used for accuracy evaluation. The coefficient of determination R2 measures the model’s ability to explain the benchmark data, with a value closer to 1 indicating better fitting performance; the root mean square error RMSE and mean absolute error MAE reflect the average deviation and absolute average deviation between the model predictions and the line-by-line (LBL) benchmark values, respectively, with smaller values indicating higher fitting accuracy. The calculated results are: R2 = 0.999820, RMSE = 0.003193, MAE = 0.002153, demonstrating that the new WSGGM achieves excellent agreement with the 43,680 sets of high-accuracy LBL benchmark data.
3.6.2. Model Validation
To comprehensively validate the reliability of the new WSGGM under various operating conditions, a systematic verification is carried out from two dimensions: overall global accuracy and single-parameter local characteristics. First, at the global level,
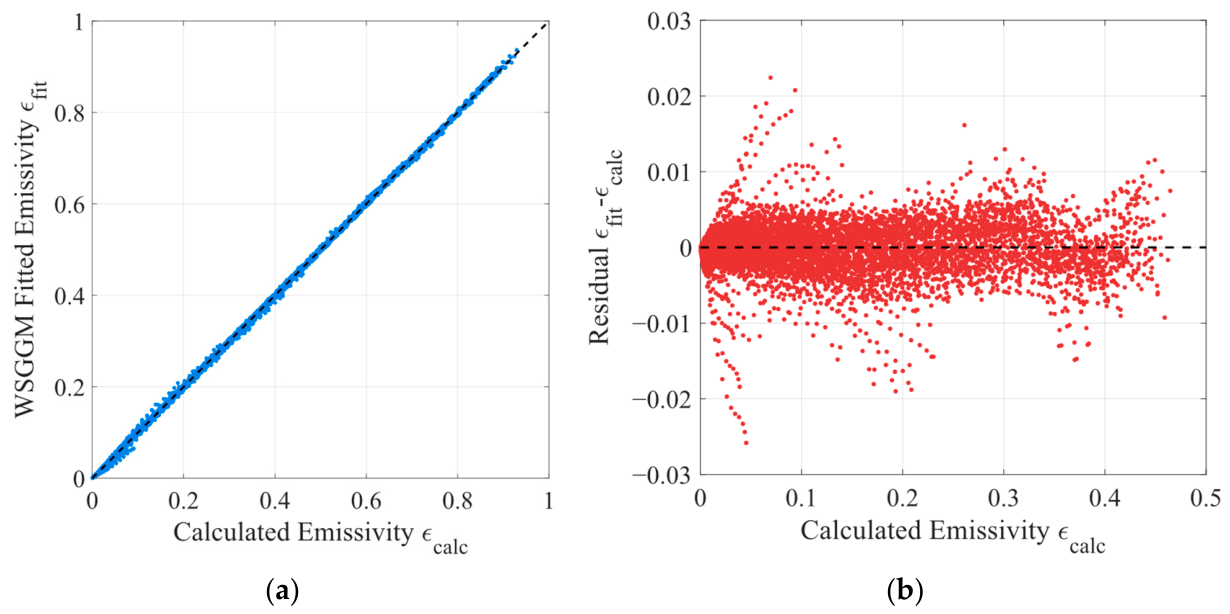
Figure 7 presents the overall comparison between the model-predicted emissivity and the LBL benchmark emissivity.
From the scatter plot, it can be observed that the data points for the 43,680 calculated cases are almost entirely distributed along the diagonal line, with no obvious systematic deviation. Even under extreme conditions, such as the high-emissivity region (ε > 0.7, corresponding to low-temperature, long-radiation-path-length conditions) and the low-emissivity region (ε < 0.1, corresponding to high-temperature, short-radiation-path-length conditions), the model-predicted values remain closely fitted to the benchmark values, indicating that the new model possesses extremely high prediction accuracy across the entire range of operating conditions. The error distribution plot further quantifies the prediction deviation of the model: the errors for the majority of cases are concentrated within ±0.01, the maximum absolute error does not exceed ±0.027, and the errors exhibit an approximately normal distribution with no obvious positive or negative bias. Given that relative errors tend to be amplified at very low emissivity levels, targeted statistical analysis was performed for the low-emissivity subset (ε < 0.1). The results show a mean absolute error of 0.0013 and a mean relative error of 7.25% for this region, confirming that the proposed WSGGM maintains favorable reliability and accuracy in the low-emissivity regime. This result demonstrates that the model has no systematic deviation, and its prediction accuracy fully meets the requirements of engineering numerical simulation.
Based on the global validation, the local capability of the model to capture single-parameter variations such as radiation path length, temperature, and H
2O mole fraction is further examined.
Figure 8 presents a comparison between the model-predicted values and the LBL benchmark values as a function of temperature for different radiation path lengths under a total gas pressure of 1 atm and an H
2O mole fraction of 30%.
The results show that the model curves and the LBL data points are almost completely coincident over the entire temperature range of 500–3000 K, accurately reproducing the overall monotonic decay law of emissivity with increasing temperature. Notably, the model still maintains extremely high prediction accuracy in the low-temperature, high-sensitivity region of 500–1500 K, as well as under the extreme conditions of a short radiation path length of 0.01 m and a long radiation path length of 60 m.
Regarding the effect of H
2O mole fraction,
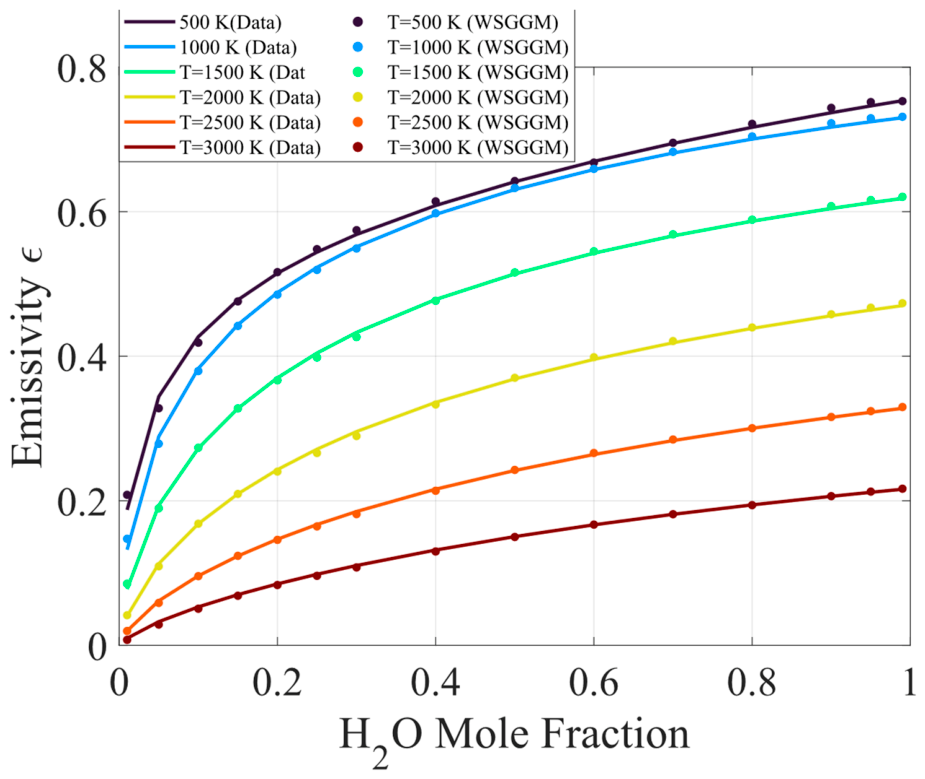
Figure 9 presents a comparison between the model-predicted values and the LBL benchmark values as a function of H
2O mole fraction at different temperatures under the conditions of a radiation path length of 10 m and a total gas pressure of 1 atm. The model accurately predicts the emissivity variation across the full H
2O mole fraction range of 1–100%, and exhibits excellent fitting performance particularly in the high H
2O mole fraction range of 30–100%, which is the primary failure range of traditional WSGGMs. Meanwhile, the model successfully captures the saturation growth characteristics of emissivity with increasing H
2O mole fraction—namely, an initial rapid rise followed by a gradual slowdown—as well as the pattern that the emissivity increases faster in the low-mole-fraction region at low temperatures, which is fully consistent with the analysis results presented in
Section 3.2.
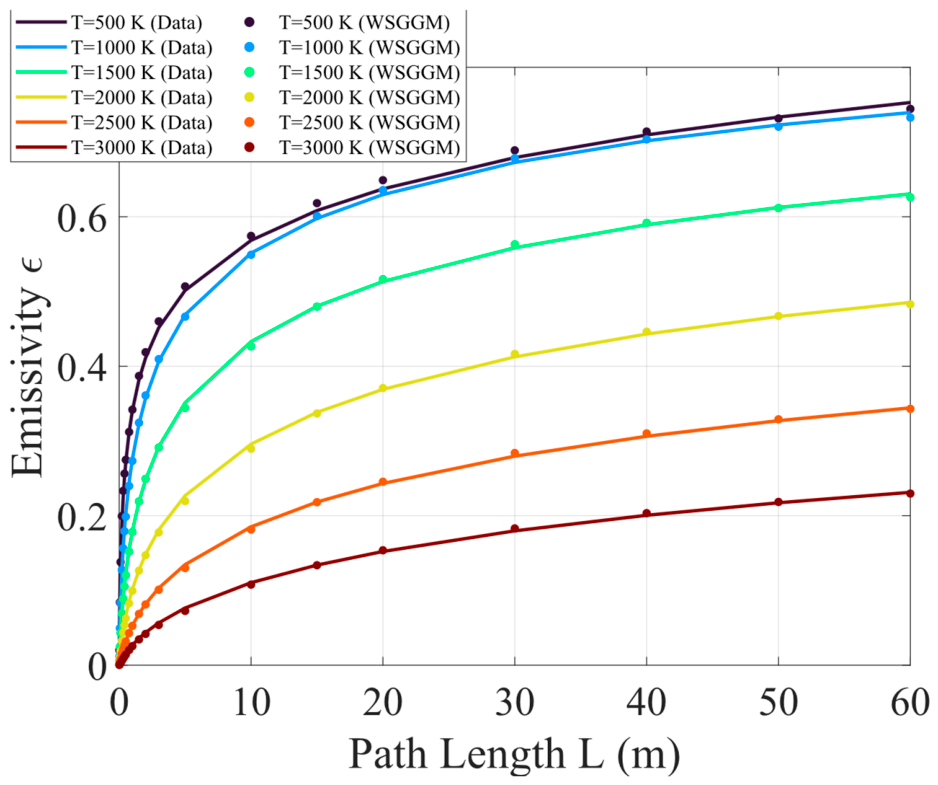
Regarding the effect of radiation path length,
Figure 10 presents a comparison between the model-predicted values and the LBL benchmark values as a function of radiation path length at different temperatures under a total gas pressure of 1 atm and an H
2O mole fraction of 30%. The model agrees well with the benchmark data over the entire radiation path length range of 0.01–60 m, and can accurately reproduce the three-stage characteristics of emissivity variation with radiation path length—namely, rapid increase, growth slowdown, and saturation. Specifically, the emissivity rises rapidly in the short radiation path length range of 0–5 m, the growth rate gradually slows in the 5–20 m range, and the emissivity tends toward saturation above 20 m. Meanwhile, the model accurately captures the pattern that the lower the temperature, the earlier the emissivity saturation trend appears, which is consistent with the analysis in
Section 3.3, and the dominant role of radiation path length across the entire range corresponds well with the conclusion in
Section 3.5.1 that radiation path length is the primary controlling factor of the radiation characteristics of pure hydrogen combustion flue gas.