Article

Purification of Carbon Dots: The Role of Dialysis Time for Effective Photocatalytic Hydrogen Production


Instituto de Ciencia y Tecnología del Carbono, INCAR-CSIC, Francisco Pintado Fe 26, 33011 Oviedo, Spain
*
Author to whom correspondence should be addressed.
Energies 2026, 19(14), 3332; https://doi.org/10.3390/en19143332
Submission received: 7 May 2026 / Revised: 29 June 2026 / Accepted: 8 July 2026 / Published: 15 July 2026

Abstract

The synthesis of metal-free heterostructures is useful for the generation of sustainable green hydrogen production and is becoming more relevant in the last years. Among emerging materials, carbon nitride (CN) decorated with carbon dots (CDs) offers a suitable alternative to traditional semiconductors due to its low cost and tuneable optical properties. In this paper, the interaction between carbon dots (CDs) and carbon nitride (CN) is studied to evaluate how the degree of purification affects the efficiency of photocatalytic water-splitting reactions. The CDs were synthetized via a hydrothermal carbonization process at 180 °C for 8 h from citric acid and ethylenediamine (EDA) as precursors and then they are subjected to purification through dialysis (0–72 h). This synthesis generates a complex mixture of CDs, unreacted precursors and molecular fluorophores. The purification degree presents a direct impact on the HER values, increasing them 1.7 times compared to the initial value of the pristine CN (1941 μmol/h·g. The analysis of the CN/CD properties and the CDs characterization reveals that the surrounded matrix around the CDs and the functional groups attached to them are essential for avoiding the recombination of photogenerated electron/hole pairs, raising the charge density on the system and reducing the transfer barrier.

1. Introduction

The dependence on fossil fuels since the Industrial Revolution has led to a global energy and environmental crisis characterized by the depletion of conventional resources and the rise in greenhouse gas emissions. The international agreements to achieve zero emission (Net Zero) entail the transition to renewable energies, with solar energies as one of the most compelling and free sources [1,2,3].
In the transition between these technologies, the production of hydrogen as an energy vector has emerged as a promising alternative, with water as the sole byproduct [4]. Hydrogen has an extremely high energy density (≈142 kJ/mol), approximately twice that of gasoline or natural gas. However, the main problem facing this type of energy is that most of it is produced using “grey hydrogen”, which relies on fossil fuels and emits CO2 in the process [2]. The production of green hydrogen via solar photocatalysis for water-splitting reactions is an appealing alternative [5,6].
While inorganic semiconductors have traditionally dominated this field, recent years have witnessed the emergence of polymeric semiconductors based on carbon and nitrogen, driven by the need for suitable, metal-free materials. Carbon nitrides, constituted by a tridimensional network with conjugated units based on tri-s-triazine, have emerged as a low-cost catalyst with earth-abundant precursors, easy synthesis, and exceptional thermal and physicochemical characteristics, including a moderate bandgap of ≈2.7 eV and high visible light absorption and response [1,7,8]. Nevertheless, this kind of polymer exhibits some limitations that drastically reduce its quantum efficiency, such as low specific surface area, high charge carrier recombination rate (electron/hole pairs), or weak redox capability [1,7]. To mitigate these aspects, various modification strategies with elemental doping have been reported. Both cationic or metallic and anionic or non-metallic doping have been explored. Metal doping includes alkali—such as potassium by Xiong et al., or sodium by Zhang et al. [9,10] and transition metals like Cu or Fe, prepared by Li et al. [11]. Similarly, non-metallic doping includes elements such as phosphorus, sulfur, and halogens, among others [12,13,14,15].
Implementing sustainable and metal-free alternatives, Liu et al., in 2015, proposed the use of Carbon Dots (CDs) as heterostructures used to enhance the CN properties [16]. These carbon nanomaterials possess unique physicochemical properties and have been used in numerous fields, including biosensing, optoelectronics, and photocatalysis. Among their properties, it can be found optical absorption in the UV-VIS region, tunable photoluminescence or photoinduced electron transfer properties [17,18]. When both materials are integrated, the modification of the optical properties and the use of the carbon dots as an electron reservoir produce a catalytic impact that improves the reaction outcomes [19].
Regularly, CDs are synthesized via solvothermal/hydrothermal carbonization methods, as in this work. These methods provide an easy and highly versatile synthesis in which low-molecular-weight organic molecules, such as citric acid, and a nitrogen-containing source are placed in a high-temperature/high-pressure confined system [20,21]. Under this approach, multiple reaction pathways typically occur. According to Bian et al., and Hoang et al., the main steps include dehydration and intramolecular condensation, followed by polymerization and, eventually, aromatization and graphitization of the CDs’ core [20,21]. However, these reactions are rarely quantitative; consequently, many entities coexist at the end of the reaction, including mature CD, short-chain oligomers, unreacted precursors, and fluorescent molecular species [20,22,23].
The prevalence of these fluorescent particles is a subject of considerable controversy in the literature. Essner et al., have made a clear effort to reduce the structural ambiguity arising from these by-products, highlighting the need for rigorous purification and the use of dialysis as the predominant method [23]. The inherent simplicity and low cost, driven by passive diffusion and governed by the molecular weight cutoff (MWCO), make it highly compatible with the purification requirements for carbon dots. Both Essner et al., and Hu et al., among others, stated that most of the investigations related to carbon dots, fail in the choice of the MWCO being too low, leaving the molecular fluorophores in solution and generating “false properties” [20,22,23,24]. Veloso et al., state that dialysis must not be considered solely as a physical separation of components in the reaction medium, but rather as a thermodynamic process that affects the surface structure of the particles, for example, by oxidizing functional groups [25].
This study evaluates how dialysis time (0–72 h) modifies the surface chemistry of carbon dots, as well as their optical characteristics, and the impact of this modification on the efficiency of the CN/CD composite during photocatalytic water-splitting reactions. A prolonged purification eliminated fluorophores and impurities but also modified the functional groups that enable electron transfer and electron reservoir capacity, reducing hydrogen production.

2. Materials and Methods

2.1. CN Synthesis

The synthesis of the CN consisted of the calcination in a horizontal furnace of 20 g of powdered urea at 600 °C for 2 h in a lidded crucible. The heating rate was 1 °C/min and was performed in a CO2 atmosphere with a constant flow of 100 mL/min. [26] The resultant solid was ground in an agate mortar and washed with deionized water, 1M HCl and 1M NaOH. Finally, the samples were washed with deionized water until reaching a neutral pH.

2.2. CD Synthesis

Carbon dots were synthesized using a hydrothermal method, as in our previous studies [27]. 5 g of anhydrous citric acid (≥99.5%, from VWR International, Radnor, PA, USA) and 800 μL of ethylenediamine (Sigma-Aldrich, St. Louis, MO, USA) were dissolved in 50 mL of deionized water, reaching a pH of 3.3. After 15 min of ultrasonication, the solution was transferred into a 180 mL Teflon-sealed steel autoclave. The hydrothermal treatment was conducted at 180 °C for 8 h and allowed to cool naturally to room temperature.

2.3. CD Purification

Purification consisted of filtering the resultant solutions through a 0.22 μm syringe filter, dialyzing in MilliQ water for 1, 24, 46, and 72h in a cellulose 12-14 kDa membrane and posterior lyophilization. Samples were labelled as CD-180-Xh, based on the dialysis hours.

2.4. Preparation of CN/CD Composites

To prepare the composites, procedures similar to those described in previous studies [27] were followed. CN (200 mg) was dispersed in 60 mL of EtOH, and a suitable amount of a CDs solution in EtOH of known concentration was added to reach a final CD content of 0.75% by weight of the composite. The mixture was sonicated for 1 h to ensure uniformity, then the solvent was evaporated at 80 °C. The resulting solid was heated to 300 °C in a N2 atmosphere with a heating rate of 1 °C/min. When cooled, the composites were ground into a fine powder labelled as CN/CD-180-Xh, with X being the dialysis hours.

2.5. Characterization of the Composites and CDs

The XRD patterns of the composites were collected using a D8 Advance diffractometer (Bruker AXS GmbH, Karlsruhe, Germany) with Cu Kα radiation.
Textural properties were determined from N2 adsorption isotherms at 77 K in a Micromeritics ASAP 2420 equipment (Micromeritics Instrument Corp., Norcross, GA, USA). The samples were first degasified under vacuum at 120 °C for 18 h before the adsorption experiments. Surface area was obtained by applying the BET equation, and the total pore volume was determined at a relative pressure of p/p0 = 0.975. Pore size distribution was subsequently calculated from the desorption branch of the isotherm using the Barrett–Joyner–Halenda (BJH) model.
To investigate the nanomorphology of the composites and carbon dots, TEM images were obtained using a JEOL JEM 1011 electron microscope (JEOL Ltd., Akishima, Tokyo, Japan).
The photoluminescence (PL) spectra of the composites were recorded on an FS5 spectrofluorometer (Edinburgh Instruments Ltd., Livingston, Scotland, UK) under the excitation wavelength of 470 nm.
An Autolab/PGSTAT204 potentiostat (Metrohm AG, Herisau, Switzerland) was used for electrochemical impedance spectroscopy (EIS) measurements. These measurements were carried out with a three-electrode cell and Na2SO4 aqueous solution as electrolyte. The frequency used was 100–1 × 10⁵ kHz in the absence of light.
The elemental analysis was carried out in a LECO TruSpec Micro elemental analyzer (LECO Corp., St. Joseph, MI, USA), and the oxygen content was measured using a LECO TruSpec Micro-O (LECO Corp.).
To study the functional groups in carbon dots, a Nicolet iS50 Fourier Transform Infrared Spectrophotometer (Thermo Fisher Scientific, Madison, WI, USA) was used. The instrument was equipped with a multiband diamond crystal attenuated total reflection (ATR) accessory and a pyroelectric detector. Spectra were recorded from 4000 to 600 cm−1.
X-ray photoelectron spectroscopy (XPS) spectra were recorded using a SPECS spectrometer (SPECS GmbH, Berlin, Germany) with a monochromatic Al Kα X–ray source operating at 14 kV and 175 W. CasaXPS software (version 2.3.18; CasaXPS Software Ltd., Teignmouth, UK) was used to determine the chemical states of the samples.
Thermal stability was carried out using a Q600 thermogravimetric analyzer (TA Instruments, New Castle, DE, USA). Samples were heated using a ramp of 10 °C/min, from 20 to 800 °C, in N2 atmosphere. The thermogravimetric analysis (TG) data were used to compute the derivative of the mass loss curve (DTG curve).
Optical properties were studied using a Shimadzu UV 2450 UV-VIS spectrophotometer (Shimadzu Corp., Kyoto, Japan) in order to measure the absorbance of carbon dot solutions prepared with the same concentration and the diffuse reflectance spectra (DRS) of the composites. The Tauc plot was used to obtain the apparent band gap.
The quantum yield (QY) of the synthesized CDs was measured in aqueous dispersions of the samples using an Edinburgh FS5 Spectrofluorometer equipped with an integrating sphere (Edinburgh Instruments Ltd., Livingston, Scotland, UK). Deionized water was used as the blank to subtract the solvent Raman/inhomogeneous scattering contribution. Samples were excited at 340 nm, maintaining the absorbance below 0.1. The calculations were performed by Fluoracle® software (version 2.4.1; Edinburgh Instruments Ltd.).

2.6. Photocatalytic Experiments

Following the procedures described in previous reports, the photocatalytic activity of the samples was evaluated [26,27]. Briefly, 30 mg of the sample was dispersed by sonication and added to 150 mL of water with 13% triethanolamine (TEOA) as sacrificial agent and H2PtCl6 to photo-deposit 3% Pt. The reaction was conducted at atmospheric pressure and 25 °C and irradiated with a 300 W Xe lamp that simulated solar light (with λ > 320 nm, output at λ < 390 nm = 2.6 W). The amount of H2 was determined by an Agilent 490 microGC (Agilent Technologies, Santa Clara, CA, USA) with a thermal conductivity detector and Ar as carrier gas. At least two different tests were conducted, with the absolute difference between the HERs being lower than 100 μmol/h·g for the same sample.
The same procedure was used for determination of the apparent quantum yield except that a monochromatic band pass filter (λ = 400 nm) was placed between the reactor and the light source. An Apogee SS-110 radiometer (Apogee Instruments, Inc., Logan, UT, USA) was used to measure the light intensity.

3. Results and Discussion

3.1. Photocatalytic Water Splitting Activity

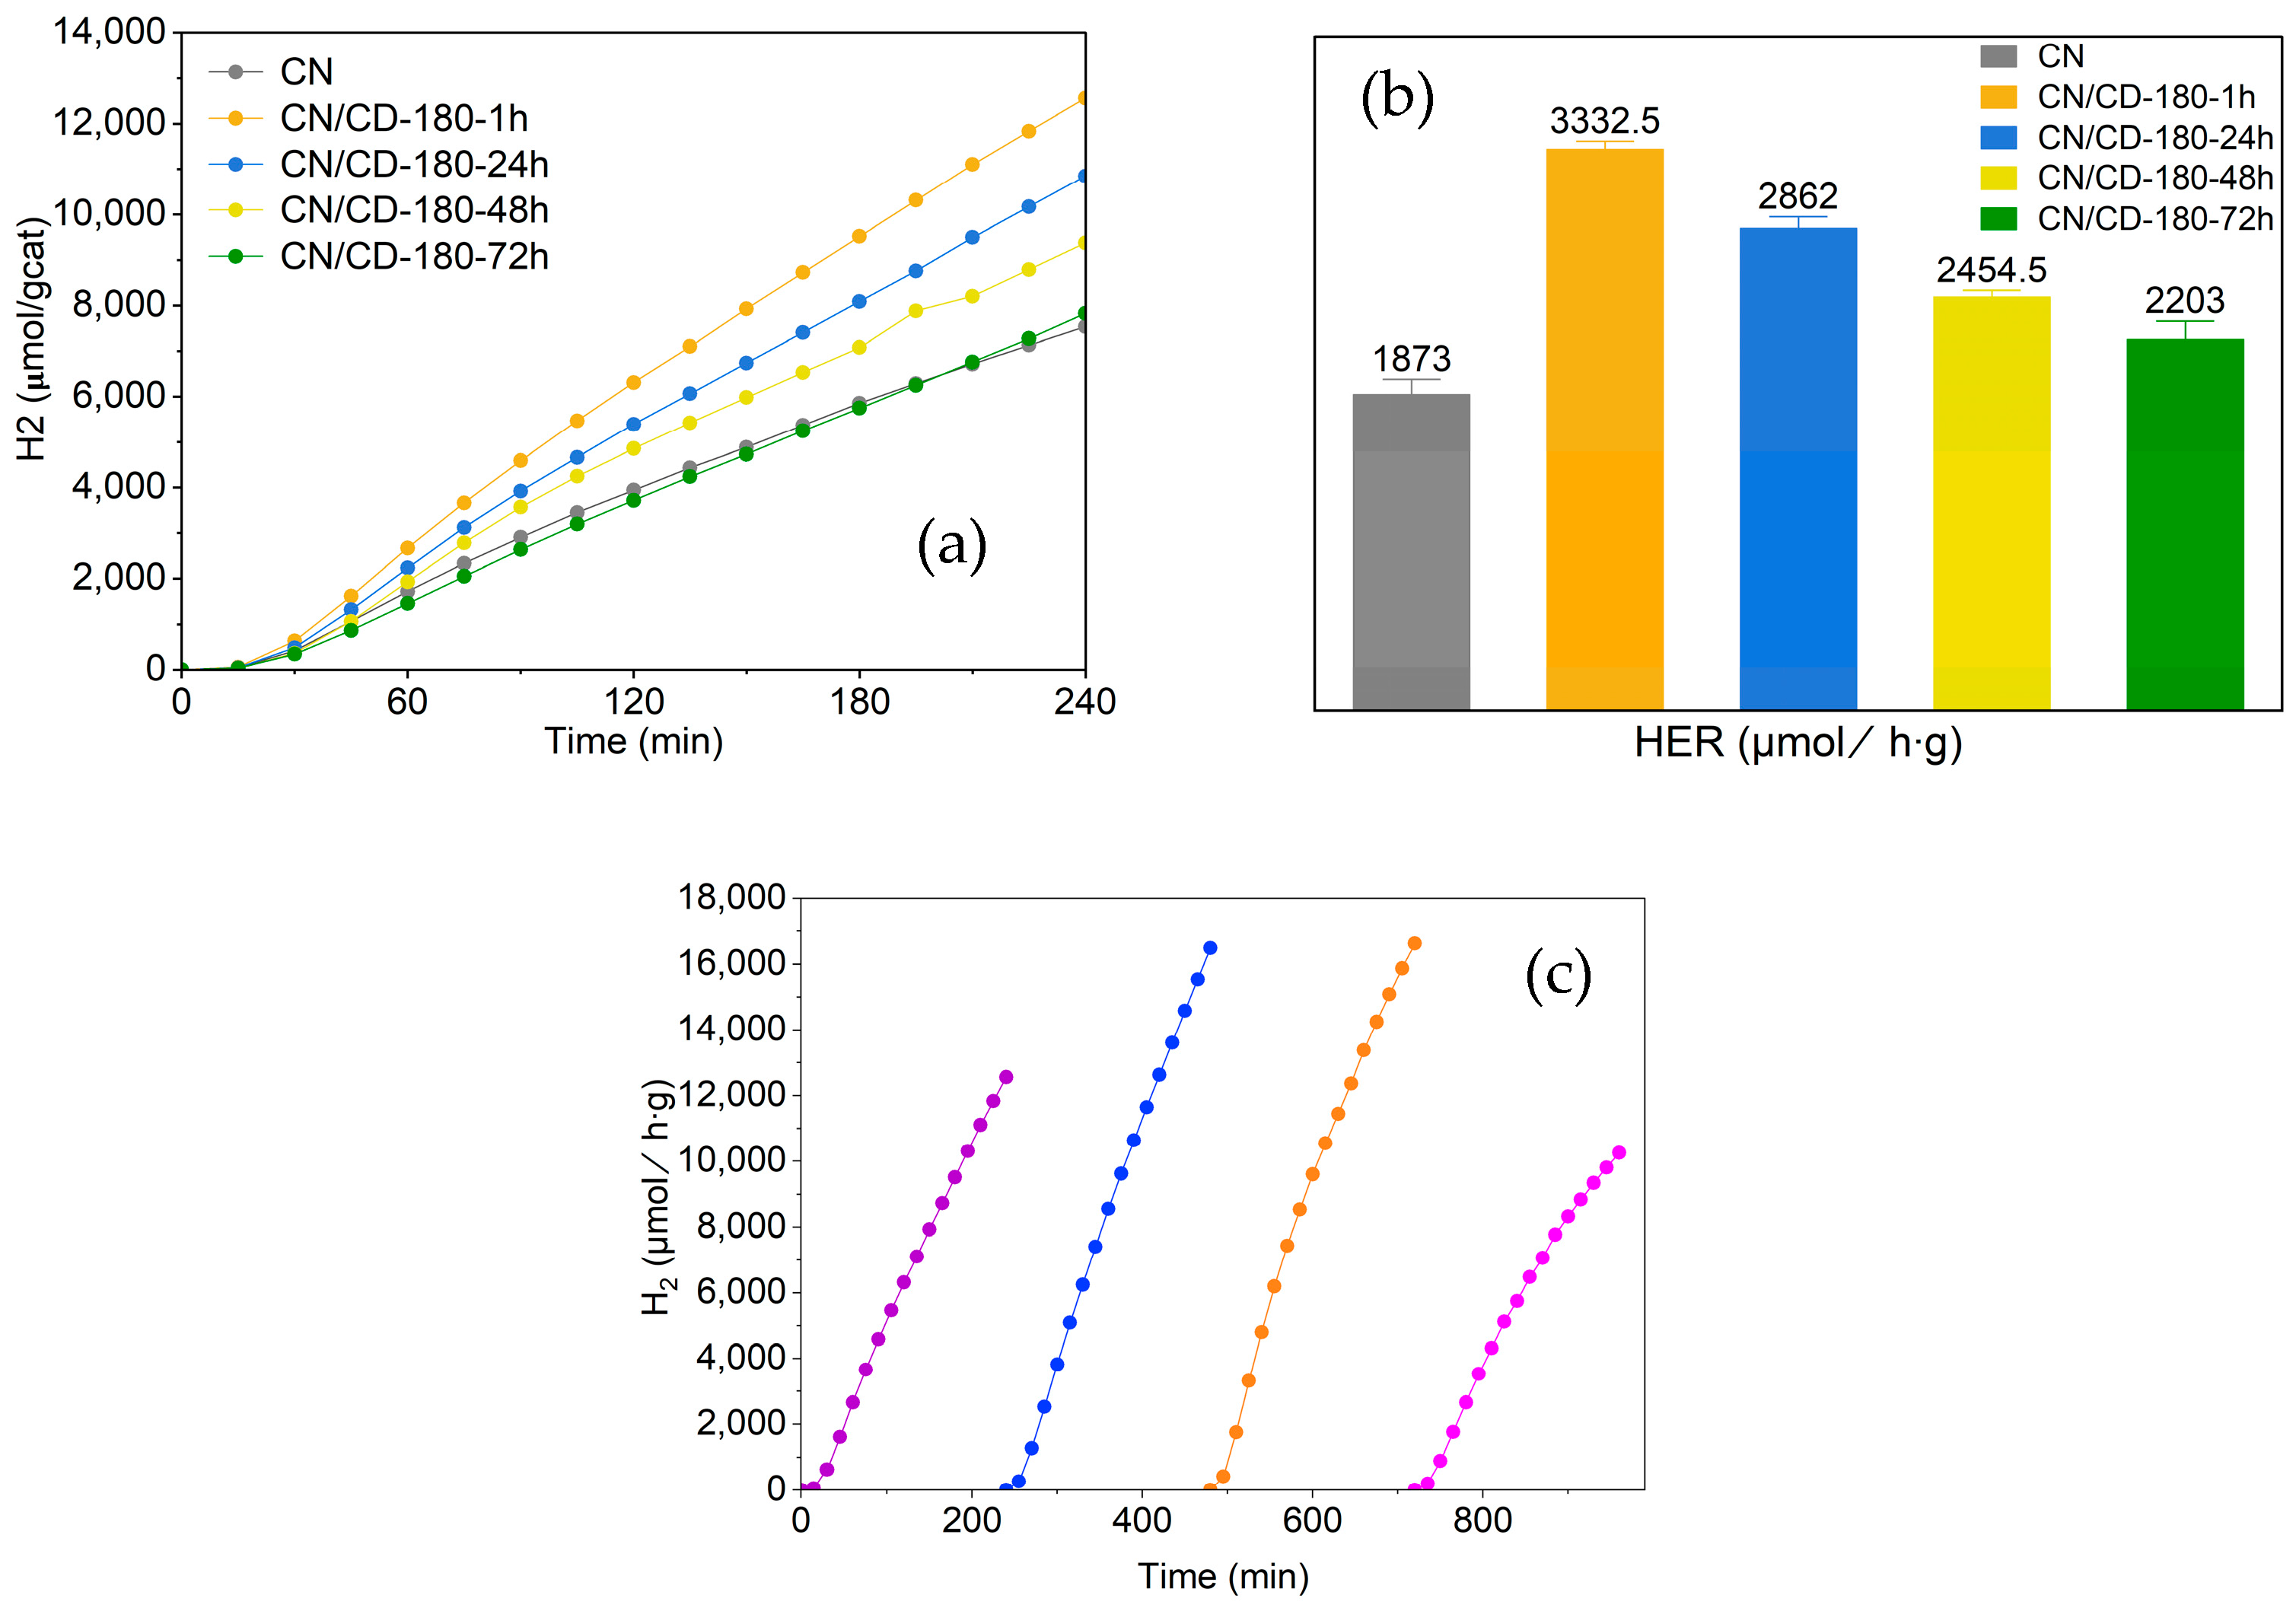
The photocatalytic activity of the composites has been evaluated for the hydrogen evolution reaction. To maximize the system’s efficiency, the hydrogen evolution rate was determined to assess the best dialysis time. The incorporation of the CDs boosted the HER values. The optimum value was achieved for the composite prepared using carbon dots under 1 h of dialysis (CN/CD-180-1h), which exhibited a rise of 1.7 times compared to the initial value of the pristine CN (1941 μmol/h·g, getting values up to 3298 μmol/h·g, demonstrating the strong synergy on the composite CN/CD. Surprisingly, when the dialysis time increases, a progressive fall of the photocatalytic activity occurs, as can be seen in Figure 1a,b. This behavior indicates that the excessive purification of carbon dots eliminates molecular species (fluorophores and oligomers) and surface CDs ligands acting as electron reservoirs [22,23,28]. The stability of the CN/CD-180-1h composite was assessed through sequential photocatalytic cycles, as shown in Figure 1c. After each run, the catalyst was recovered by vacuum filtration, dried, and reintroduced into the reaction under identical operational conditions. The data confirm that the interfacial coupling between the CN matrix and the carbonaceous domains remains structurally and functionally robust, as evidenced by the high cyclability and minimal loss of photocatalytic performance.
The apparent quantum yield obtained for the sample CN/CD-180-1h was 16.4%.
Table S1 gives a comparison of the best photocatalytic HERs obtained in the present study with the best published by other authors. The optimized composite on this work is highly competitive (3298 µmol/h·g) when compared to other recent carbon/g-C3N4 systems, under similar reaction conditions. While variations in the reaction parameters can be misleading, some systems reported on the literature use higher sacrificial agent concentrations but lower Pt concentration, such as Xu et al., with a catalytic performance of 220 µmol/h·g or Wang et al., with values of HER of 1493 µmol/h·g [29,30]. Other authors as Mou et al., use same reaction conditions and their best sample reaches an HER value of 2792 µmol/h·g [31]. To understand the origin of this photocatalytic performance and the pronounced effect of the dialysis time, the morphological, optical, and electronic structure of the composites was investigated.

3.2. Characterization of the Photocatalyst

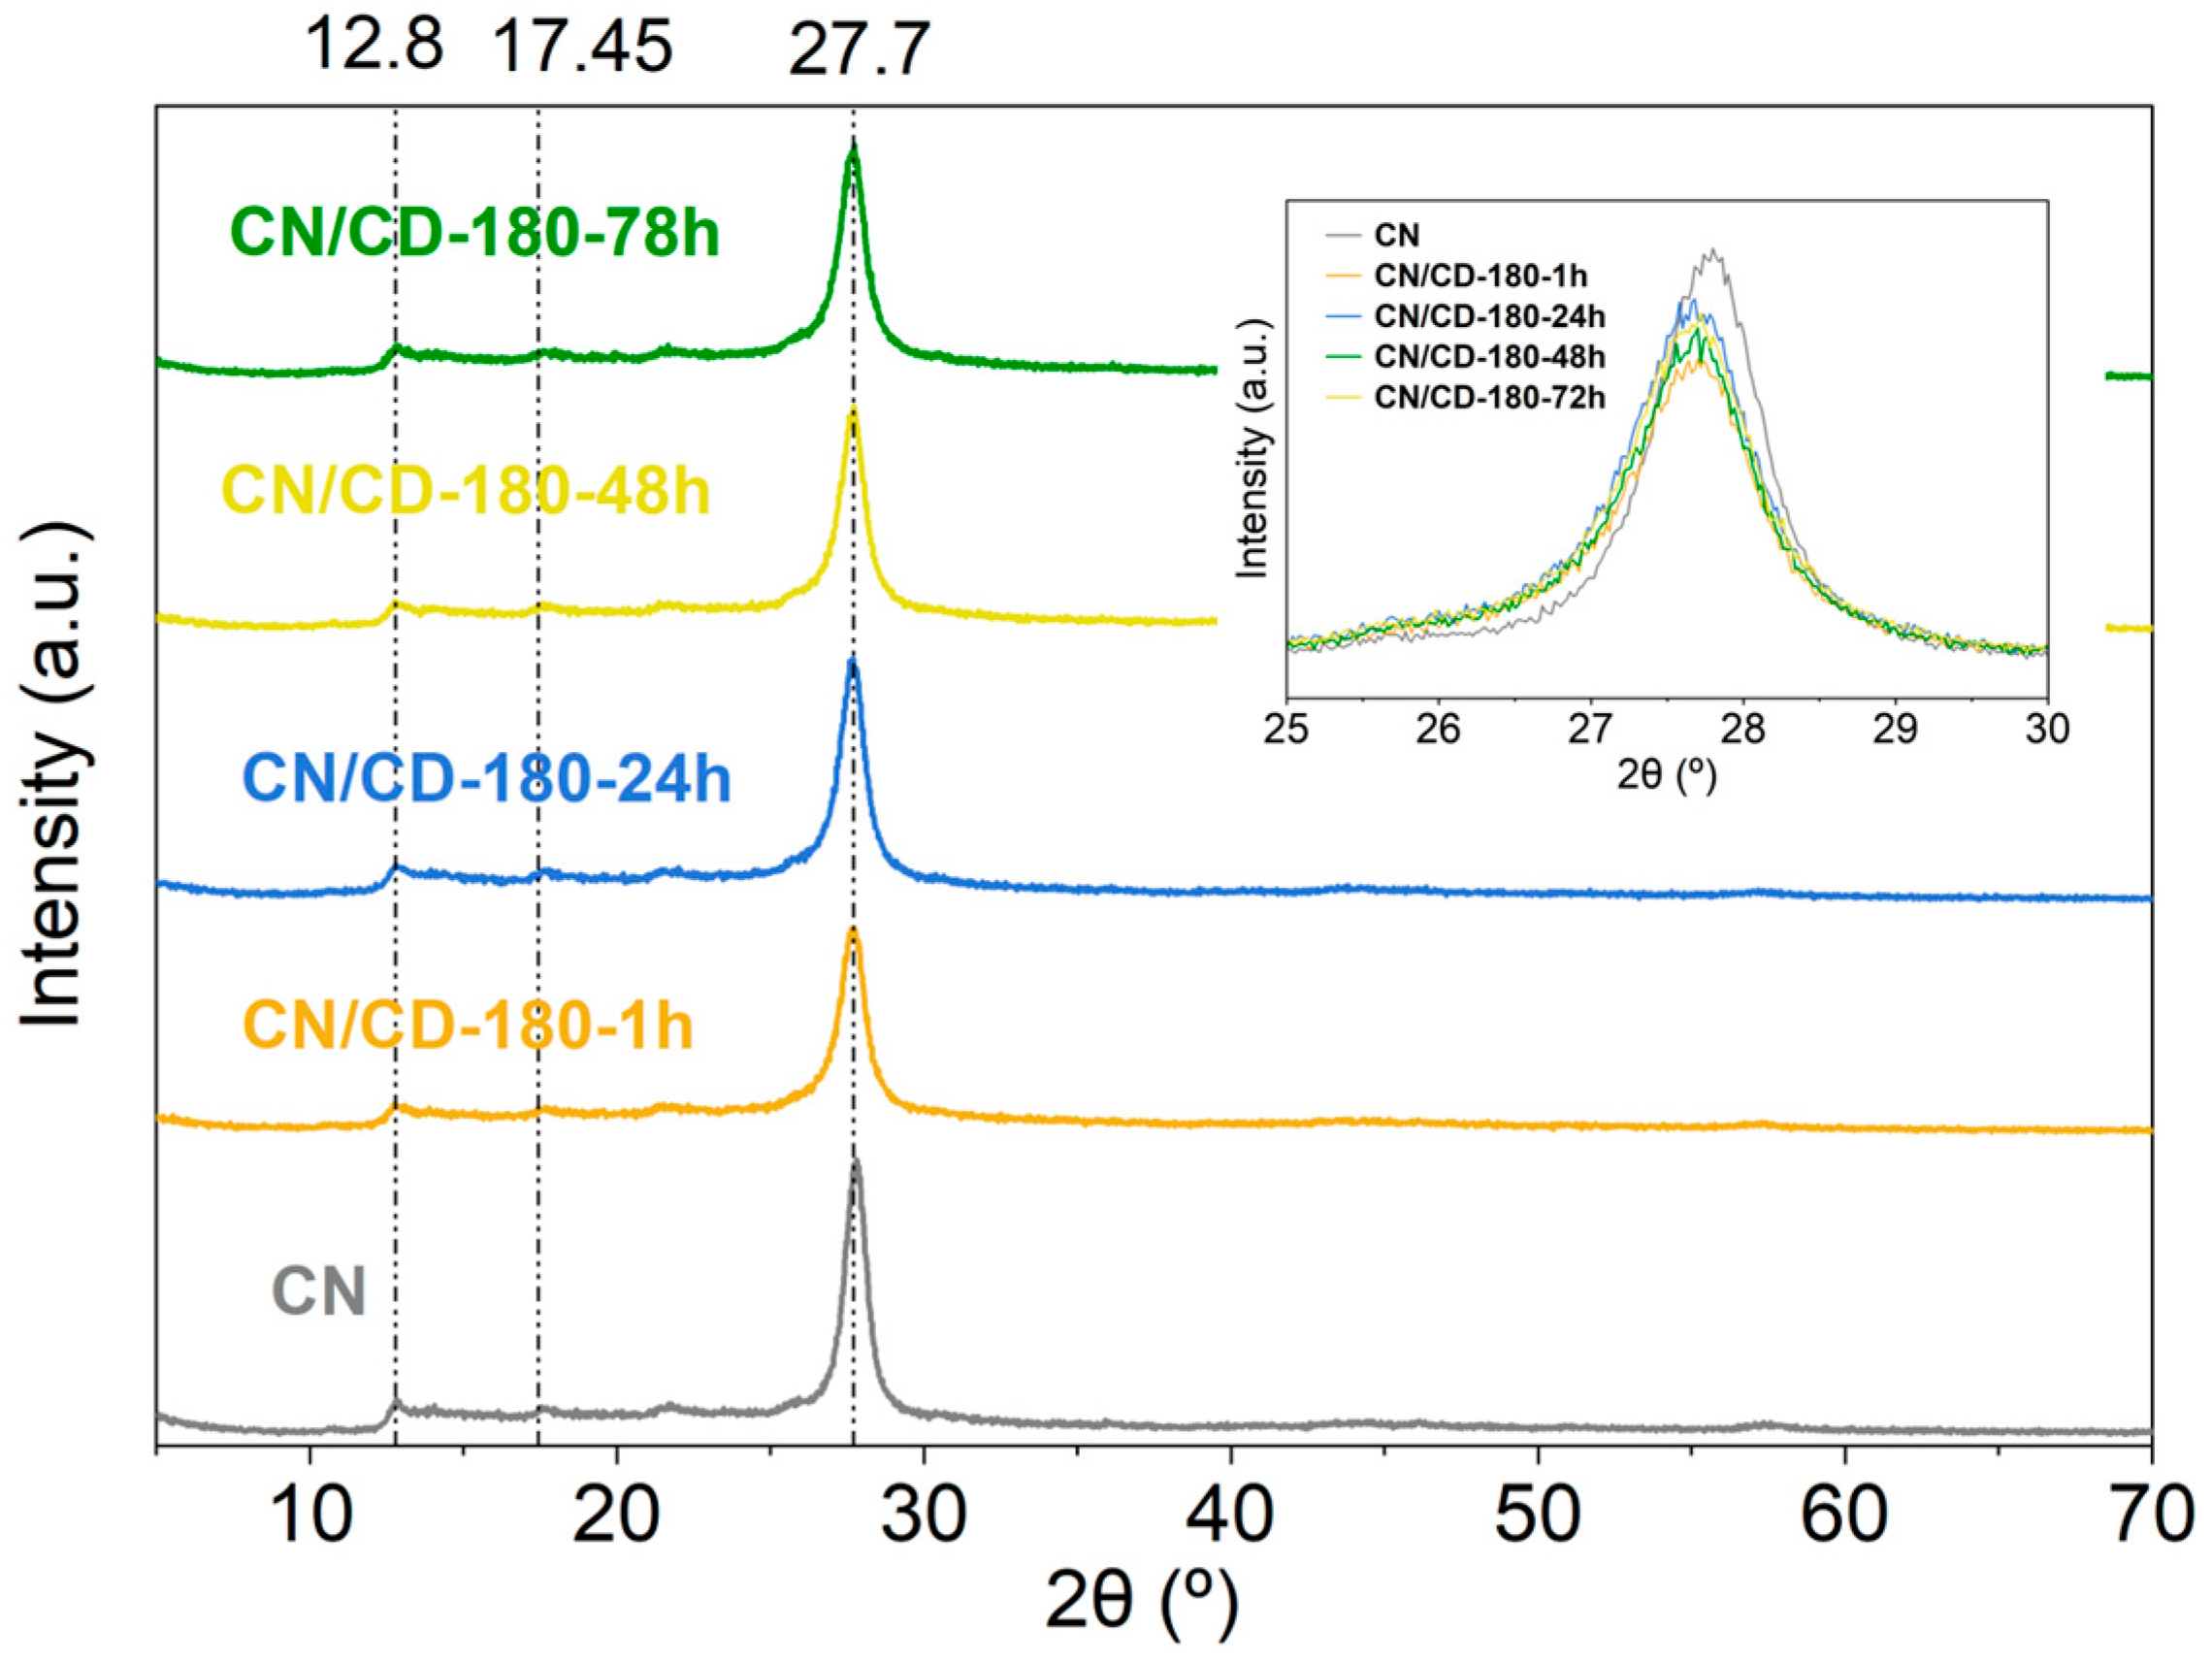
The crystallinity of the samples and the preservation of their structure after the incorporation of the CDs was evaluated with XRD. In Figure 2, XRD patterns of the pristine CN and the composites are shown. The structure of the CN is maintained after the CD incorporation, with all the samples having similar diffraction peaks. A low intensity peak at 12.8°, corresponding to the plane (100), reflecting the in-plane tri-s-triazine units, and a sharp peak at 27.7° corresponding with the (002) plane, which is the interplanar π-π stacking of conjugated aromatic rings [29,30,31].
Moreover, another small peak at 17.45° is observed, corresponding to the s-triazine units in the structure of the carbon nitride [27]. No characteristic peaks corresponding to CDs were observed on the diffractogram, probably due to the small amount of CD incorporated in the CN matrix and the lack of crystallinity for the CDs, in conjunction with the fact that the usual peak of the CDs appears between 23–25°, overlapping with the (002) plane of the CN [32,33,34].
Some authors have reported changes in the crystallinity of the CN structure when the CDs are introduced. Zhang et al. observed a decrease in the 27.7° peak intensity and a wider peak, along with a shift toward lower 2θ angles, when the carbon dots are introduced in the CN matrix, implying a lower crystallinity and an interlayer distance expansion [35]. As it can be seen in Figure 2, a decrease in the intensity is also present for this peak on our samples, with the CN/CD-180-1h being the one with the lowest intensity. All four composites have a small shift to lower angles, implying the CD junction on the CN layers [27,35].
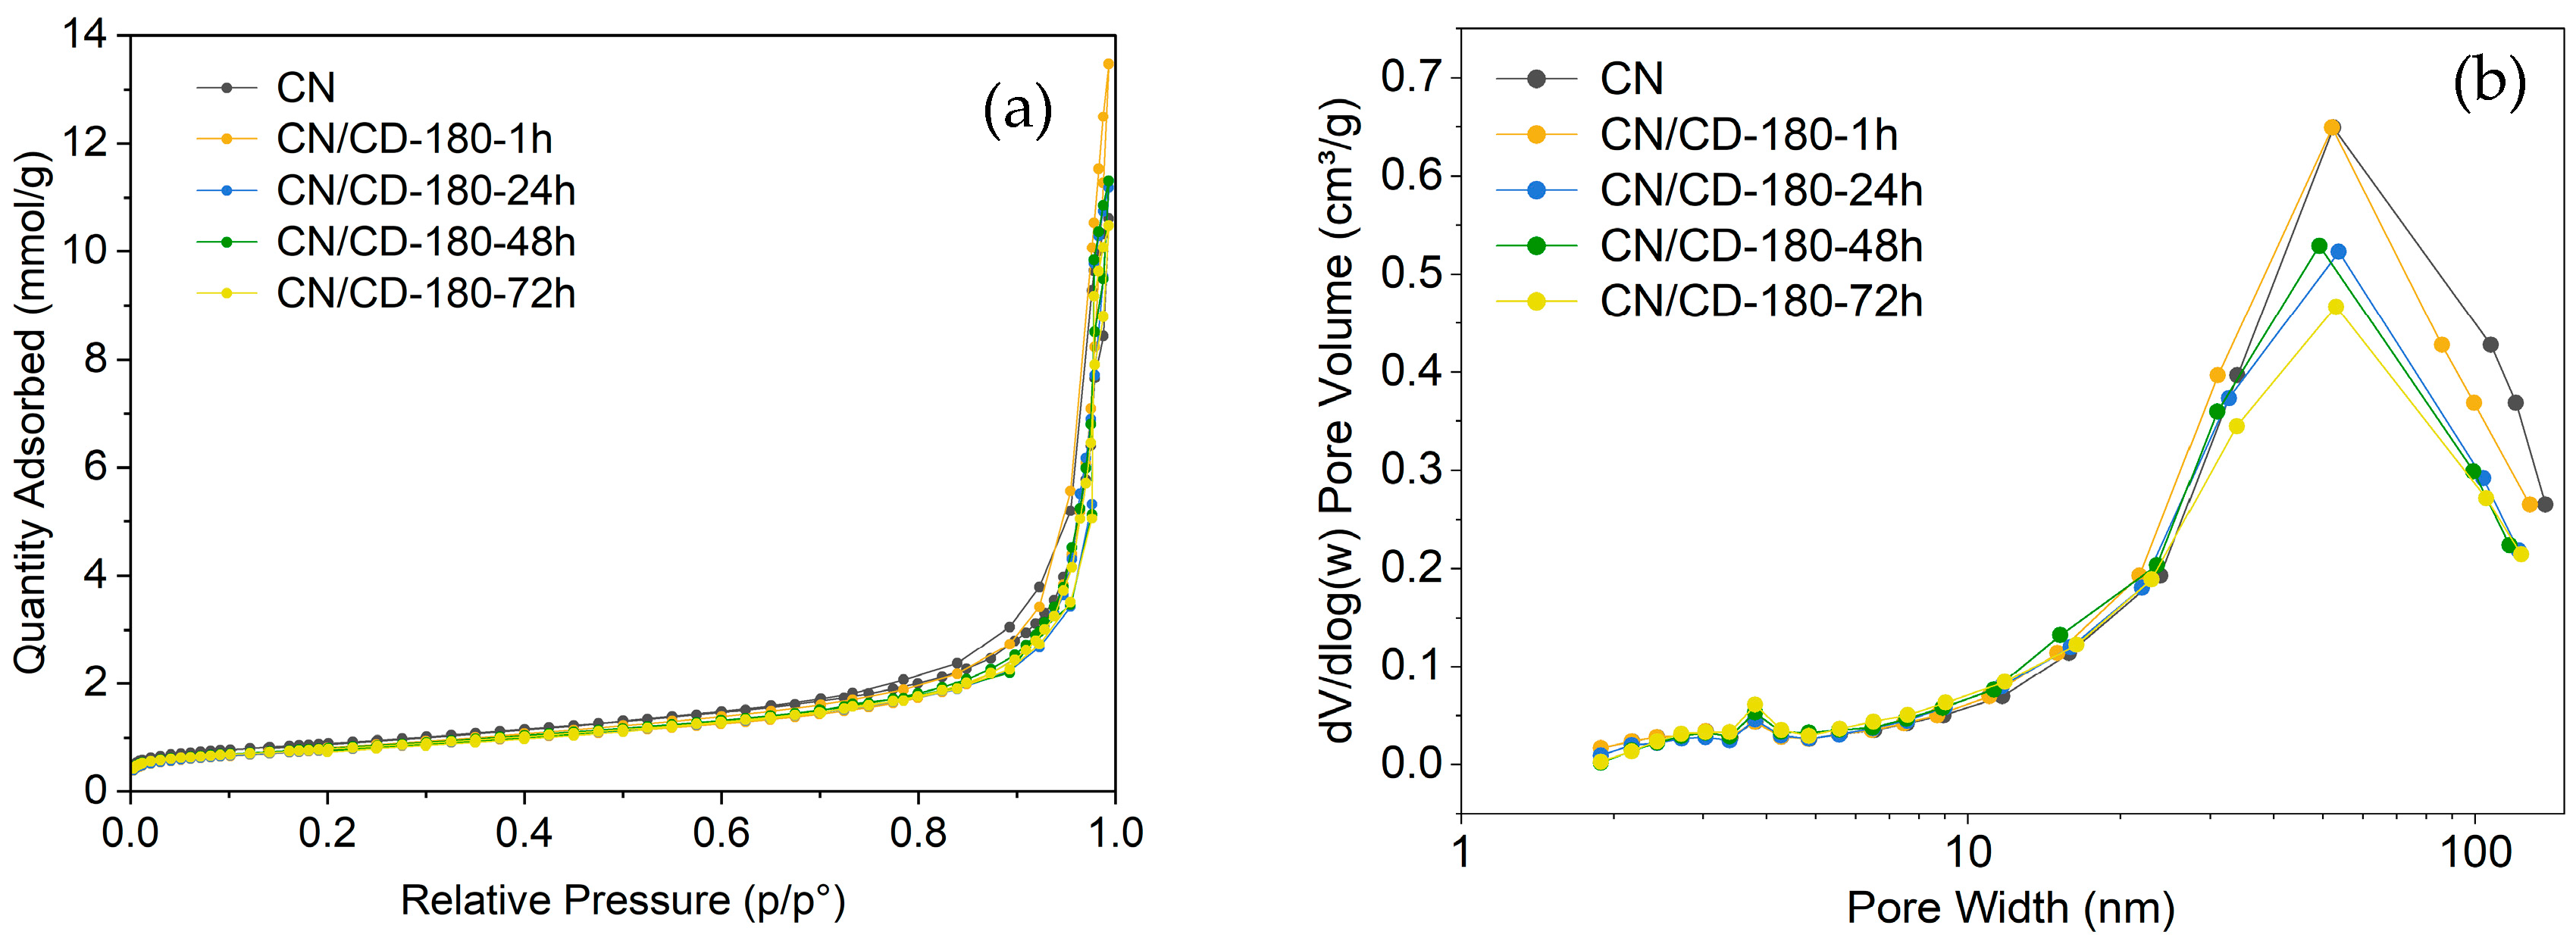
Figure 3 presents absorption-desorption isotherms at 77 K and the corresponding pore size distributions derived from the BJH model. The samples exhibited the usual behavior of the type IV isotherms with small hysteresis loops [36,37]. The textural properties derived from these measurements are summarized in Table 1. The pristine CN sample presented a specific surface area of 71 m2/g, calculated according to the Brunauer–Emmett–Teller method (BET), a total pore volume of 0.222 cm3/g and a BJH mesopore volume (Vmeso BJH) of 0.155 cm3/g, derived from the BJH method. After the incorporation of the CDs, the surface area of the composite experienced a slight reduction, reaching values between 62 to 64 m2/g. This mild decrease is commonly attributed to the partial blockage of the mesopores of the CN by the deposition of the CDs [32]. However, looking to the pore volume data, both the total pore volume and the mesopore volume exhibit an increase in the values, reaching a maximum for the composite CN/CD-180-1h, subsequently decreasing as the dialysis times are extended. The mesopore volume decreases from 0.165 cm3/g for the CN/CD-180-1h sample to 0.089 cm3/g for the CN/CD-180-72h sample. The reduction in this value affects mass diffusion of the reactants, active-site accessibility, and Pt nanoparticle dispersion during photo deposition, making it an important factor related to the decrease in HER. Furthermore, the pore size distribution, also calculated with the BJH method, revealed that the peak pore sizes for the composites are comprised between 49 and 52 nm, without a clear trend, suggesting that the occupation of the CDs on the CN network do not affect the predominant pore diameter.
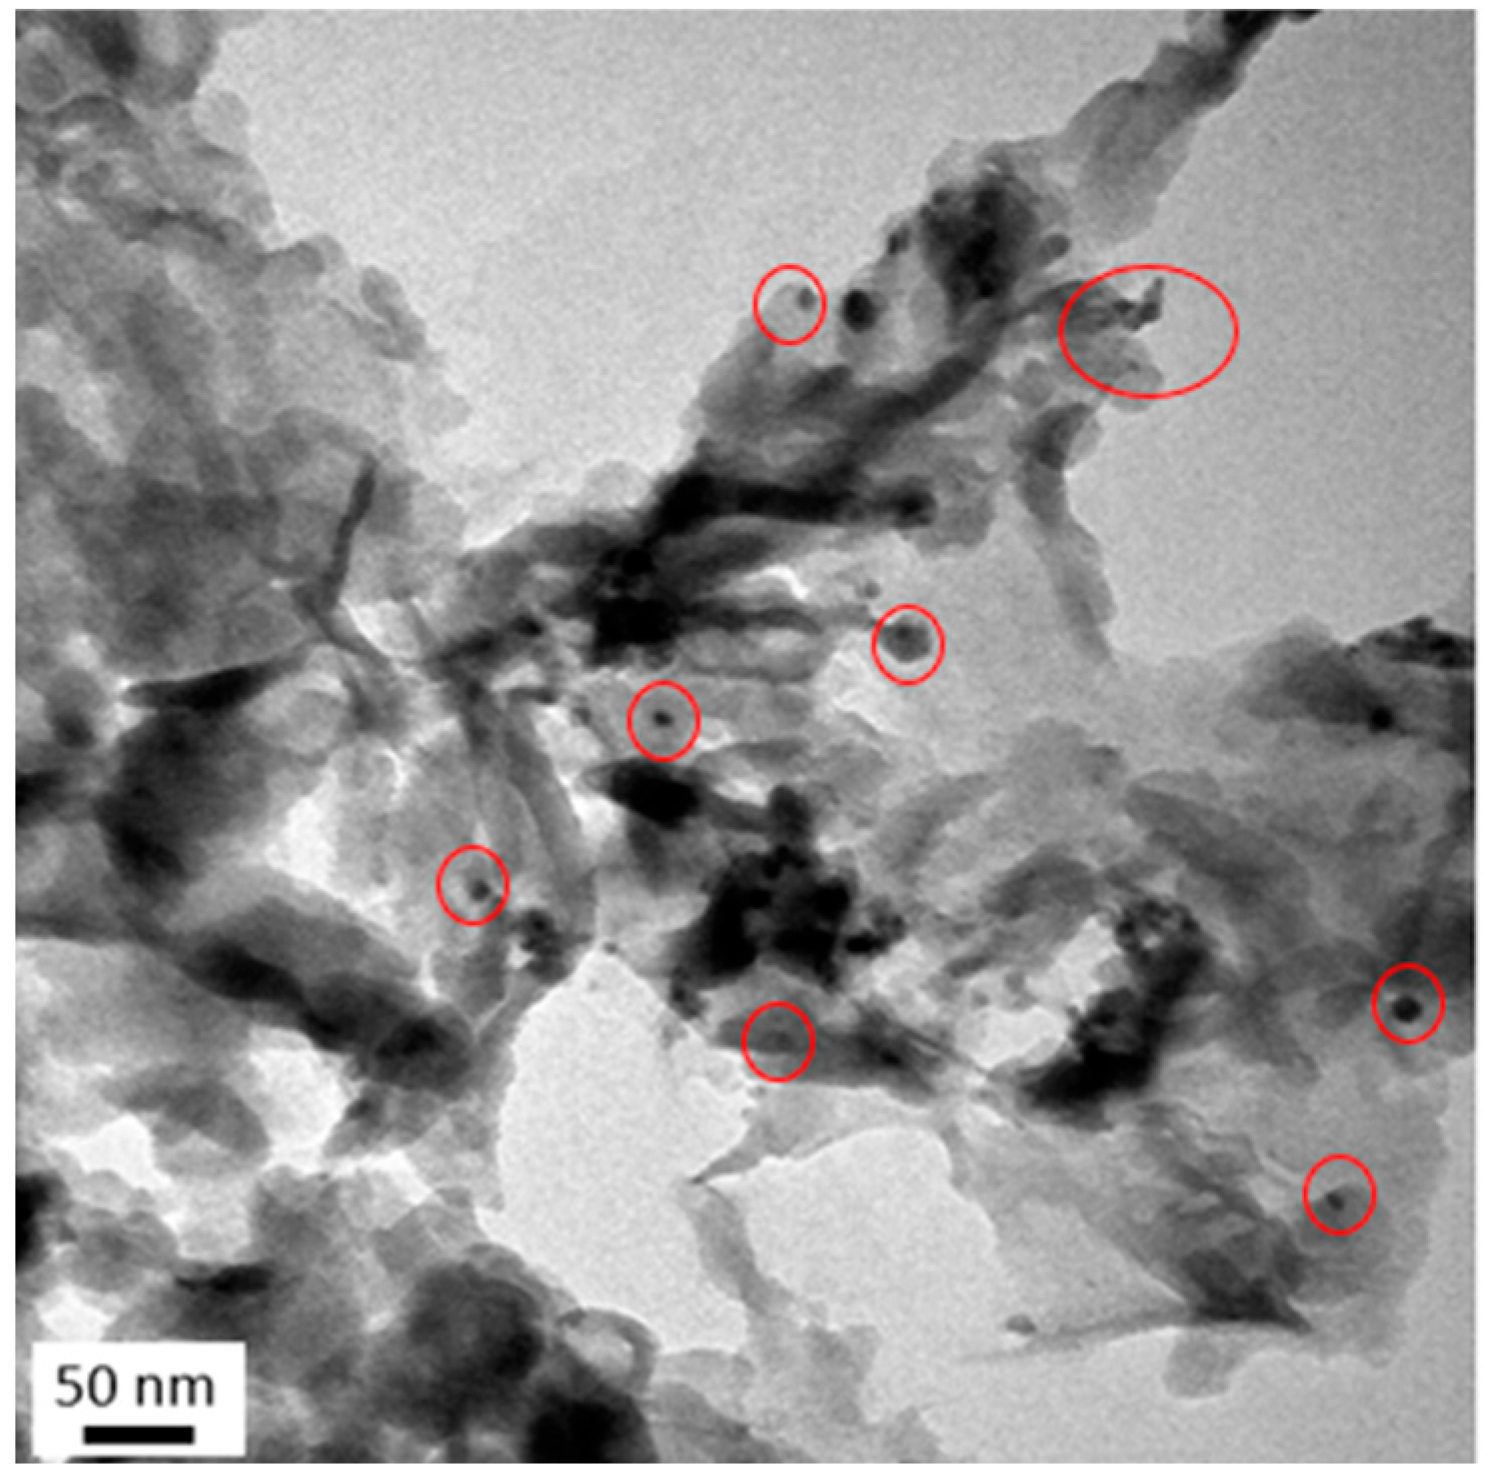
Complementing the XRD and surface area calculations, the direct interaction of the CDs with the CN was confirmed with the transmission electron microscope (TEM). Figure 4 contributes to the determination of the microstructure of the composite, presenting an irregular morphology with the CDs embedded on the surface.
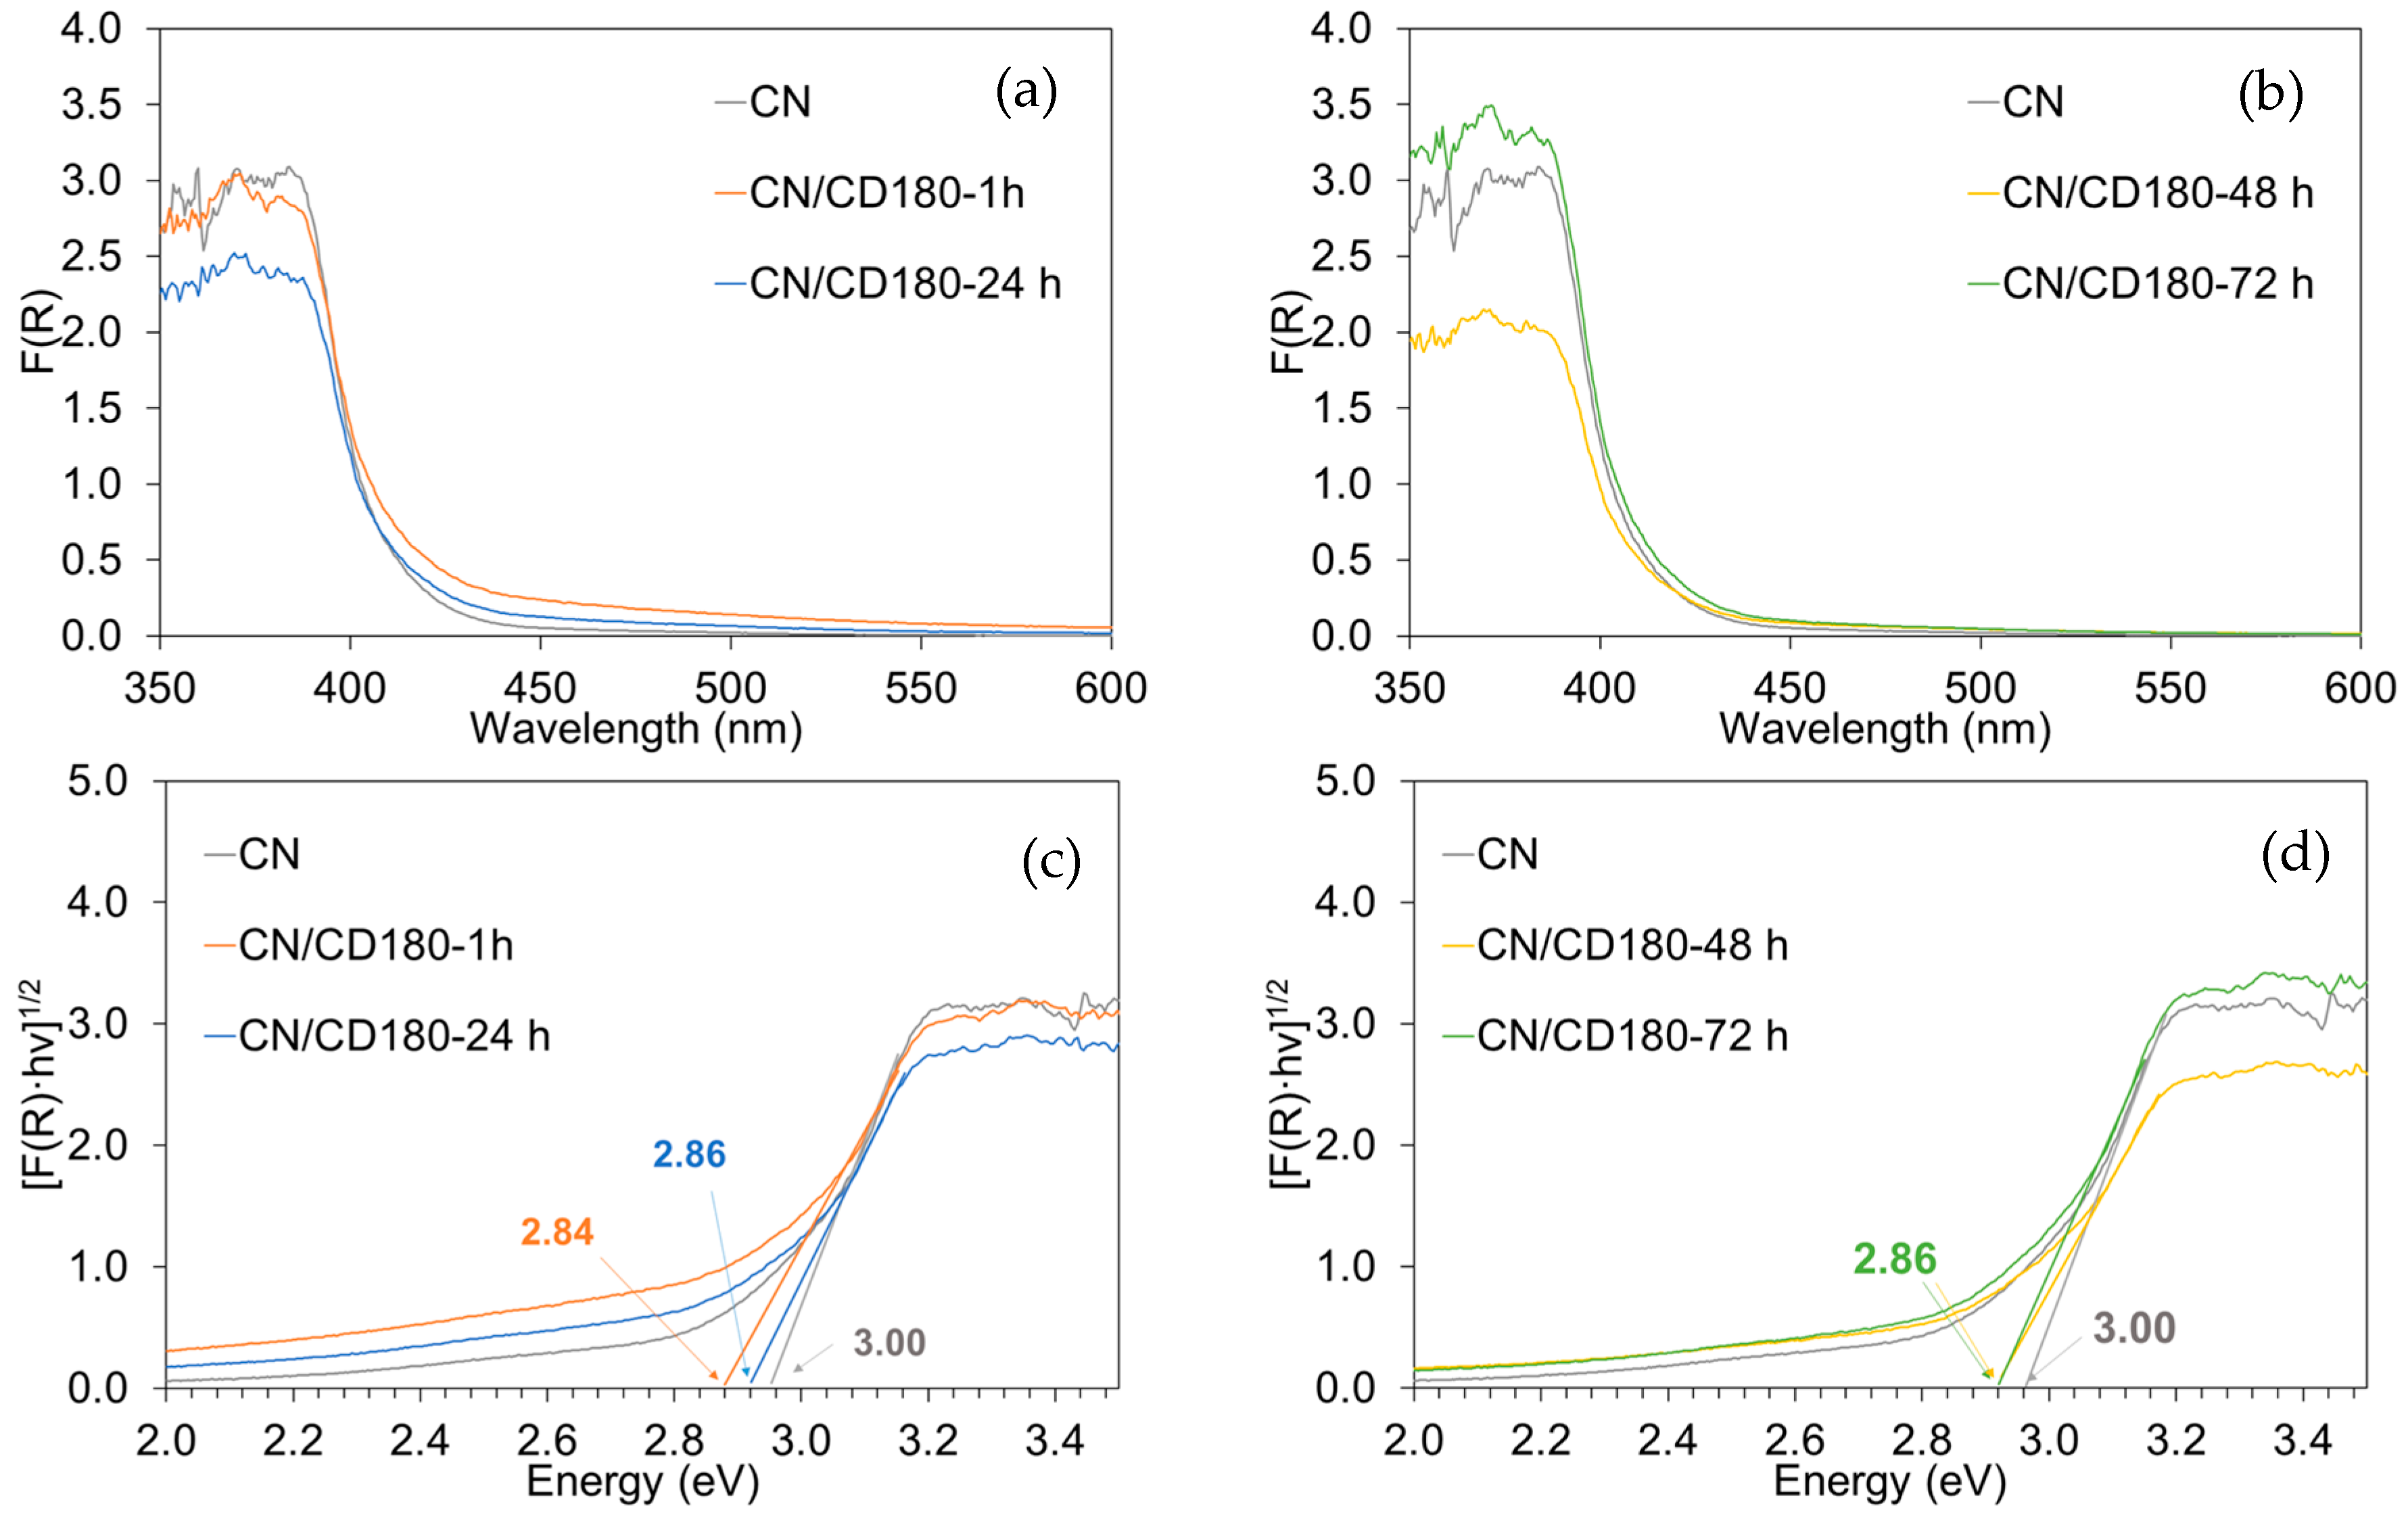
Beyond the structural properties, the optical characteristics of the composites were investigated to evaluate their light-harvesting capability. The band gap (Eg) values were calculated from the Tauc plots depicted in Figure 5c,d from their UV-Vis spectra (Figure 5a,b). The CN exhibited a value of 3.00 eV, whereas a narrowing was observed for the composites, reaching a minimum of 2.84 eV for the CN/CD-180-1h and values of 2.86 eV for the ones with higher dialysis time. Jiang et al., had already reported a similar value for the intrinsic band gap, giving values of 2.98 eV for their carbon nitride [1]. The diminishing of the band gap for the composites is also widely reported. Zhang et al. presented a reduction of the band gap when incorporating the CDs from 2.77 eV to 2.68 eV for their best composite [35].
Previous reports attribute the reduction of the band gap to the facilitation of the excitation of the electrons from the valence band (VB) to the conduction band (CB) [19]. The incorporation of the carbon dots on the CN matrix likely induces new intermediate energy levels, thereby expanding the π conjugated network. Notably, the composite exhibiting the lowest value is the one with the best electronic interactions between the CN and the CDs, facilitating the electronic flux to the active sites [38,39]. The composites with a lower band gap correspond to the ones with the highest HER values. The CDs have allowed the CN to harvest a higher fraction of the solar spectrum, generating a higher amount of photogenerated electron-hole pairs that will participate in the water splitting reaction, accelerating the charge mobility and prolonging the lifetime of the charge carriers [1,35].
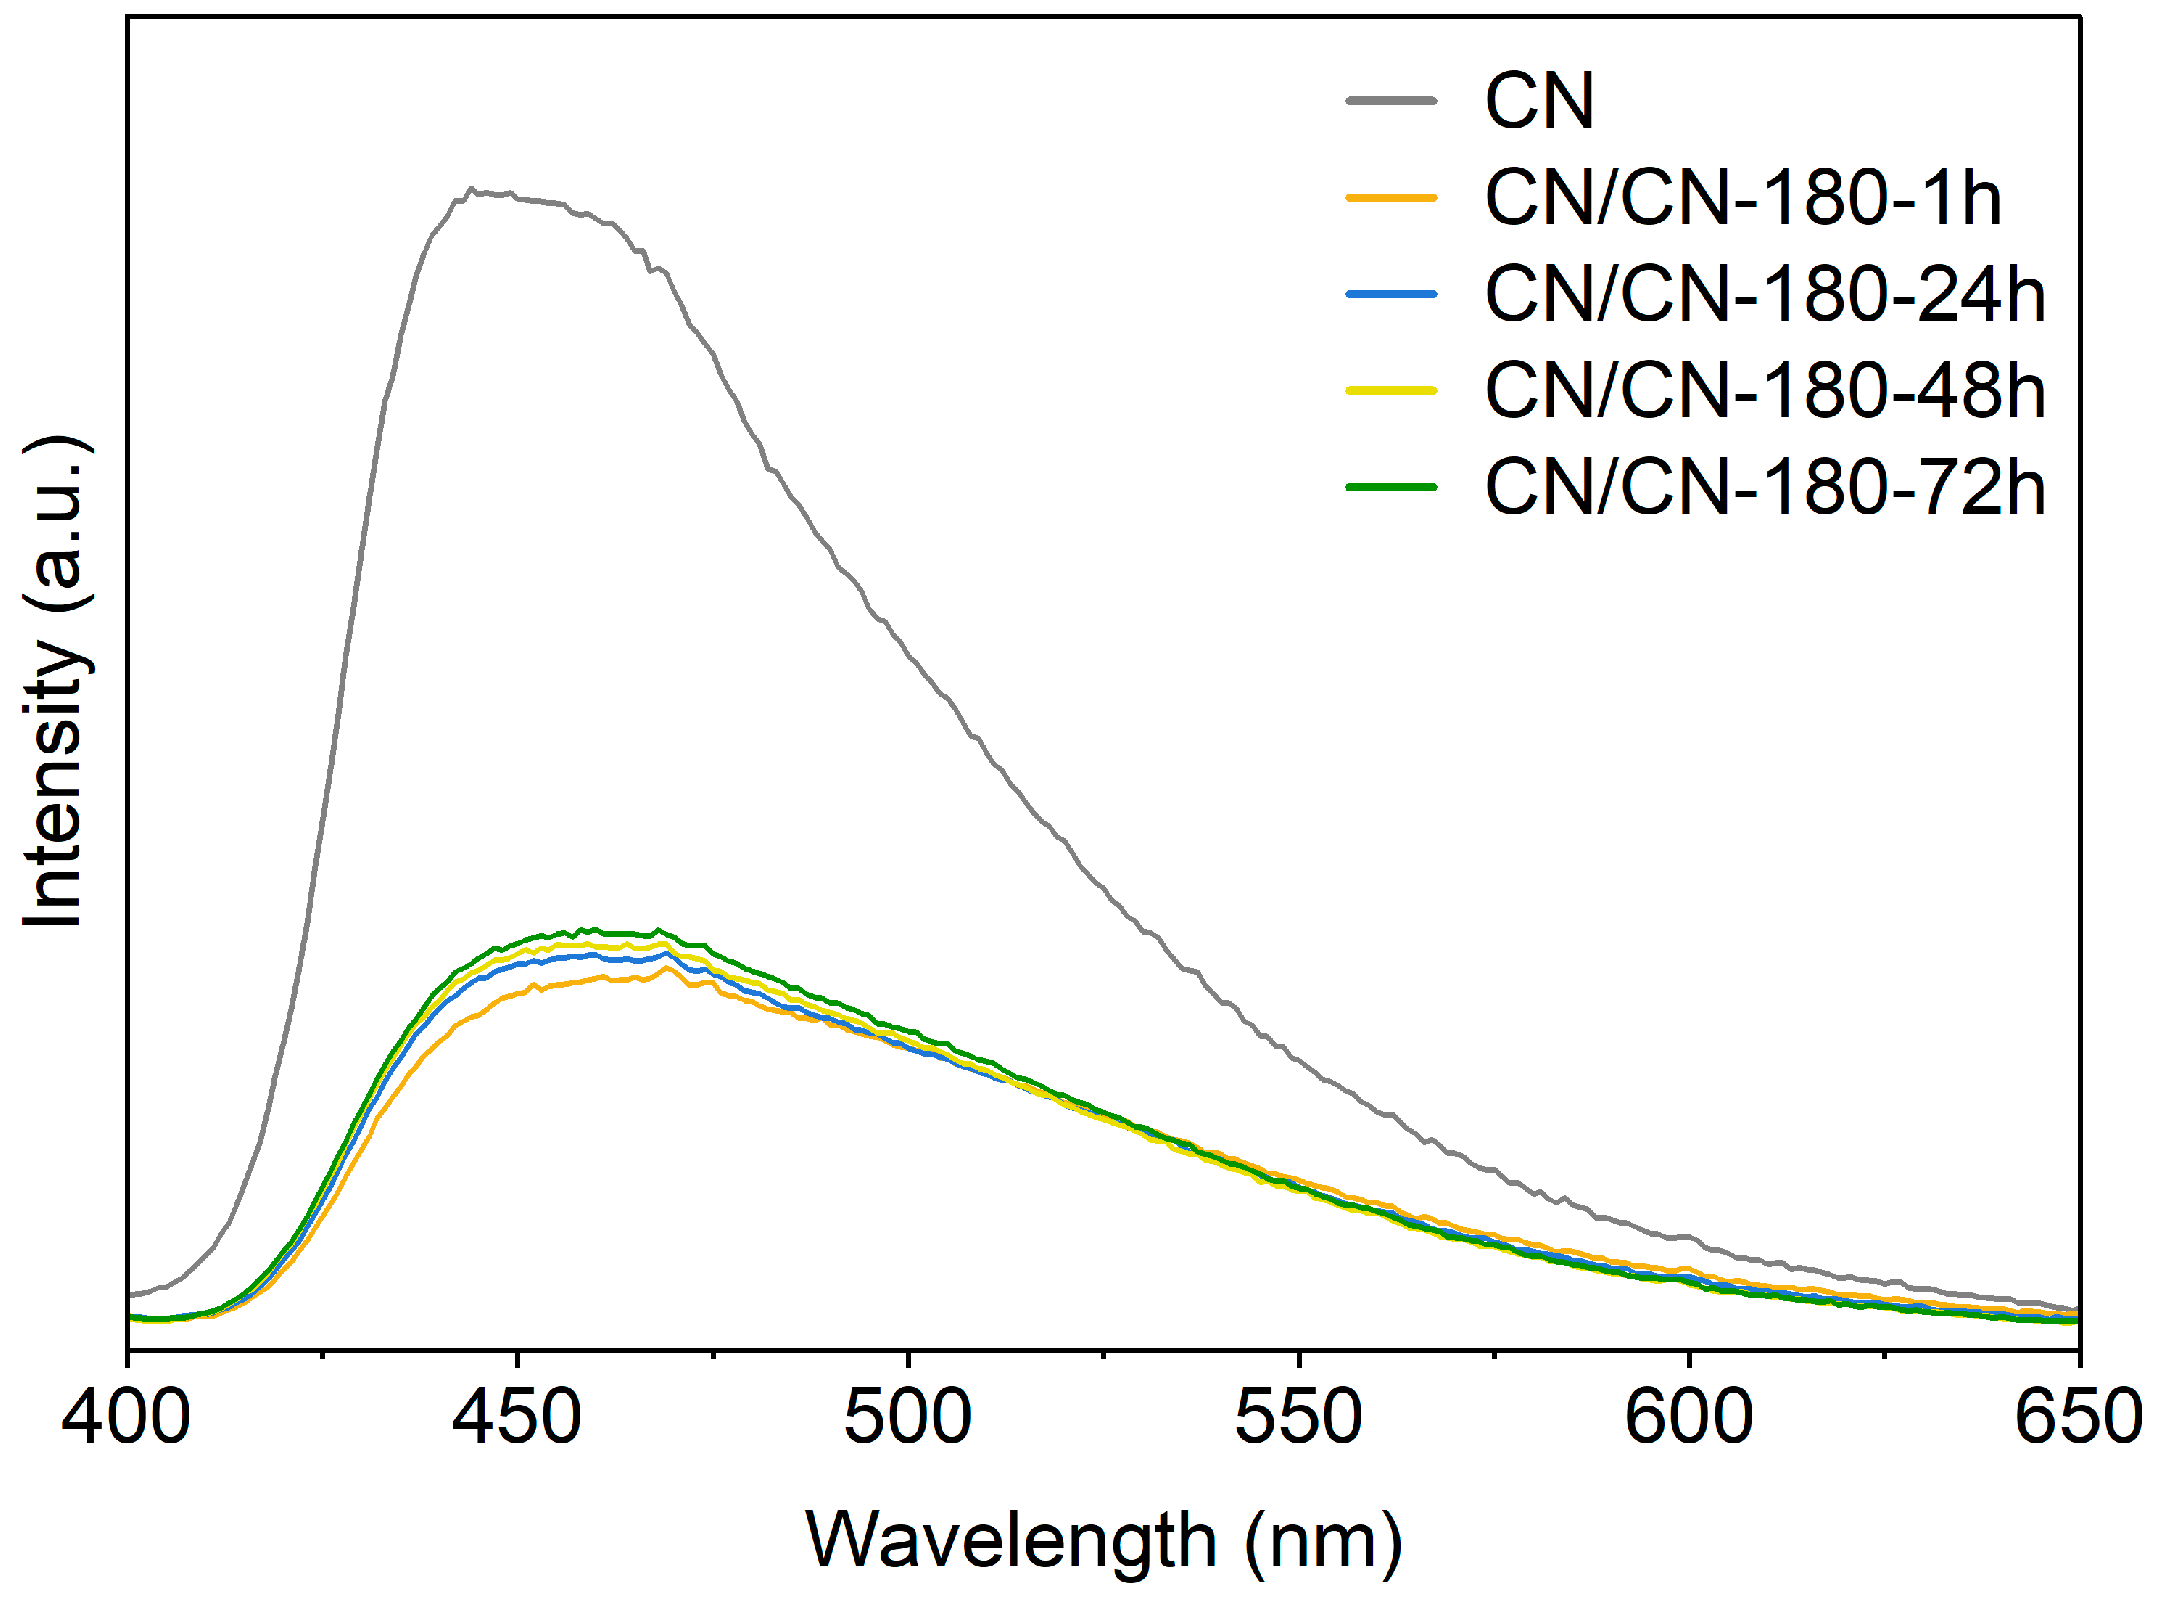
The efficiency of the charge separation was measured with the photoluminescence spectra represented in Figure 6. The above-mentioned trends are confirmed with this technique. The samples present a maximum emission peak around 450 nm. When the CD are incorporated on the CN, the PL intensity decreases. The CN/CD-180-1h presents the lowest emission patterns, and as the HER decreases, the PL intensity increases. The increase in the PL emission entails the fast recombination of photogenerated electron/hole pairs, meaning that for the CN/CD-180-1h, this problem has been attenuated, and the electrons are captured and transferred efficiently to the carbon dots and therefore presenting a better photocatalytic activity [31,35].
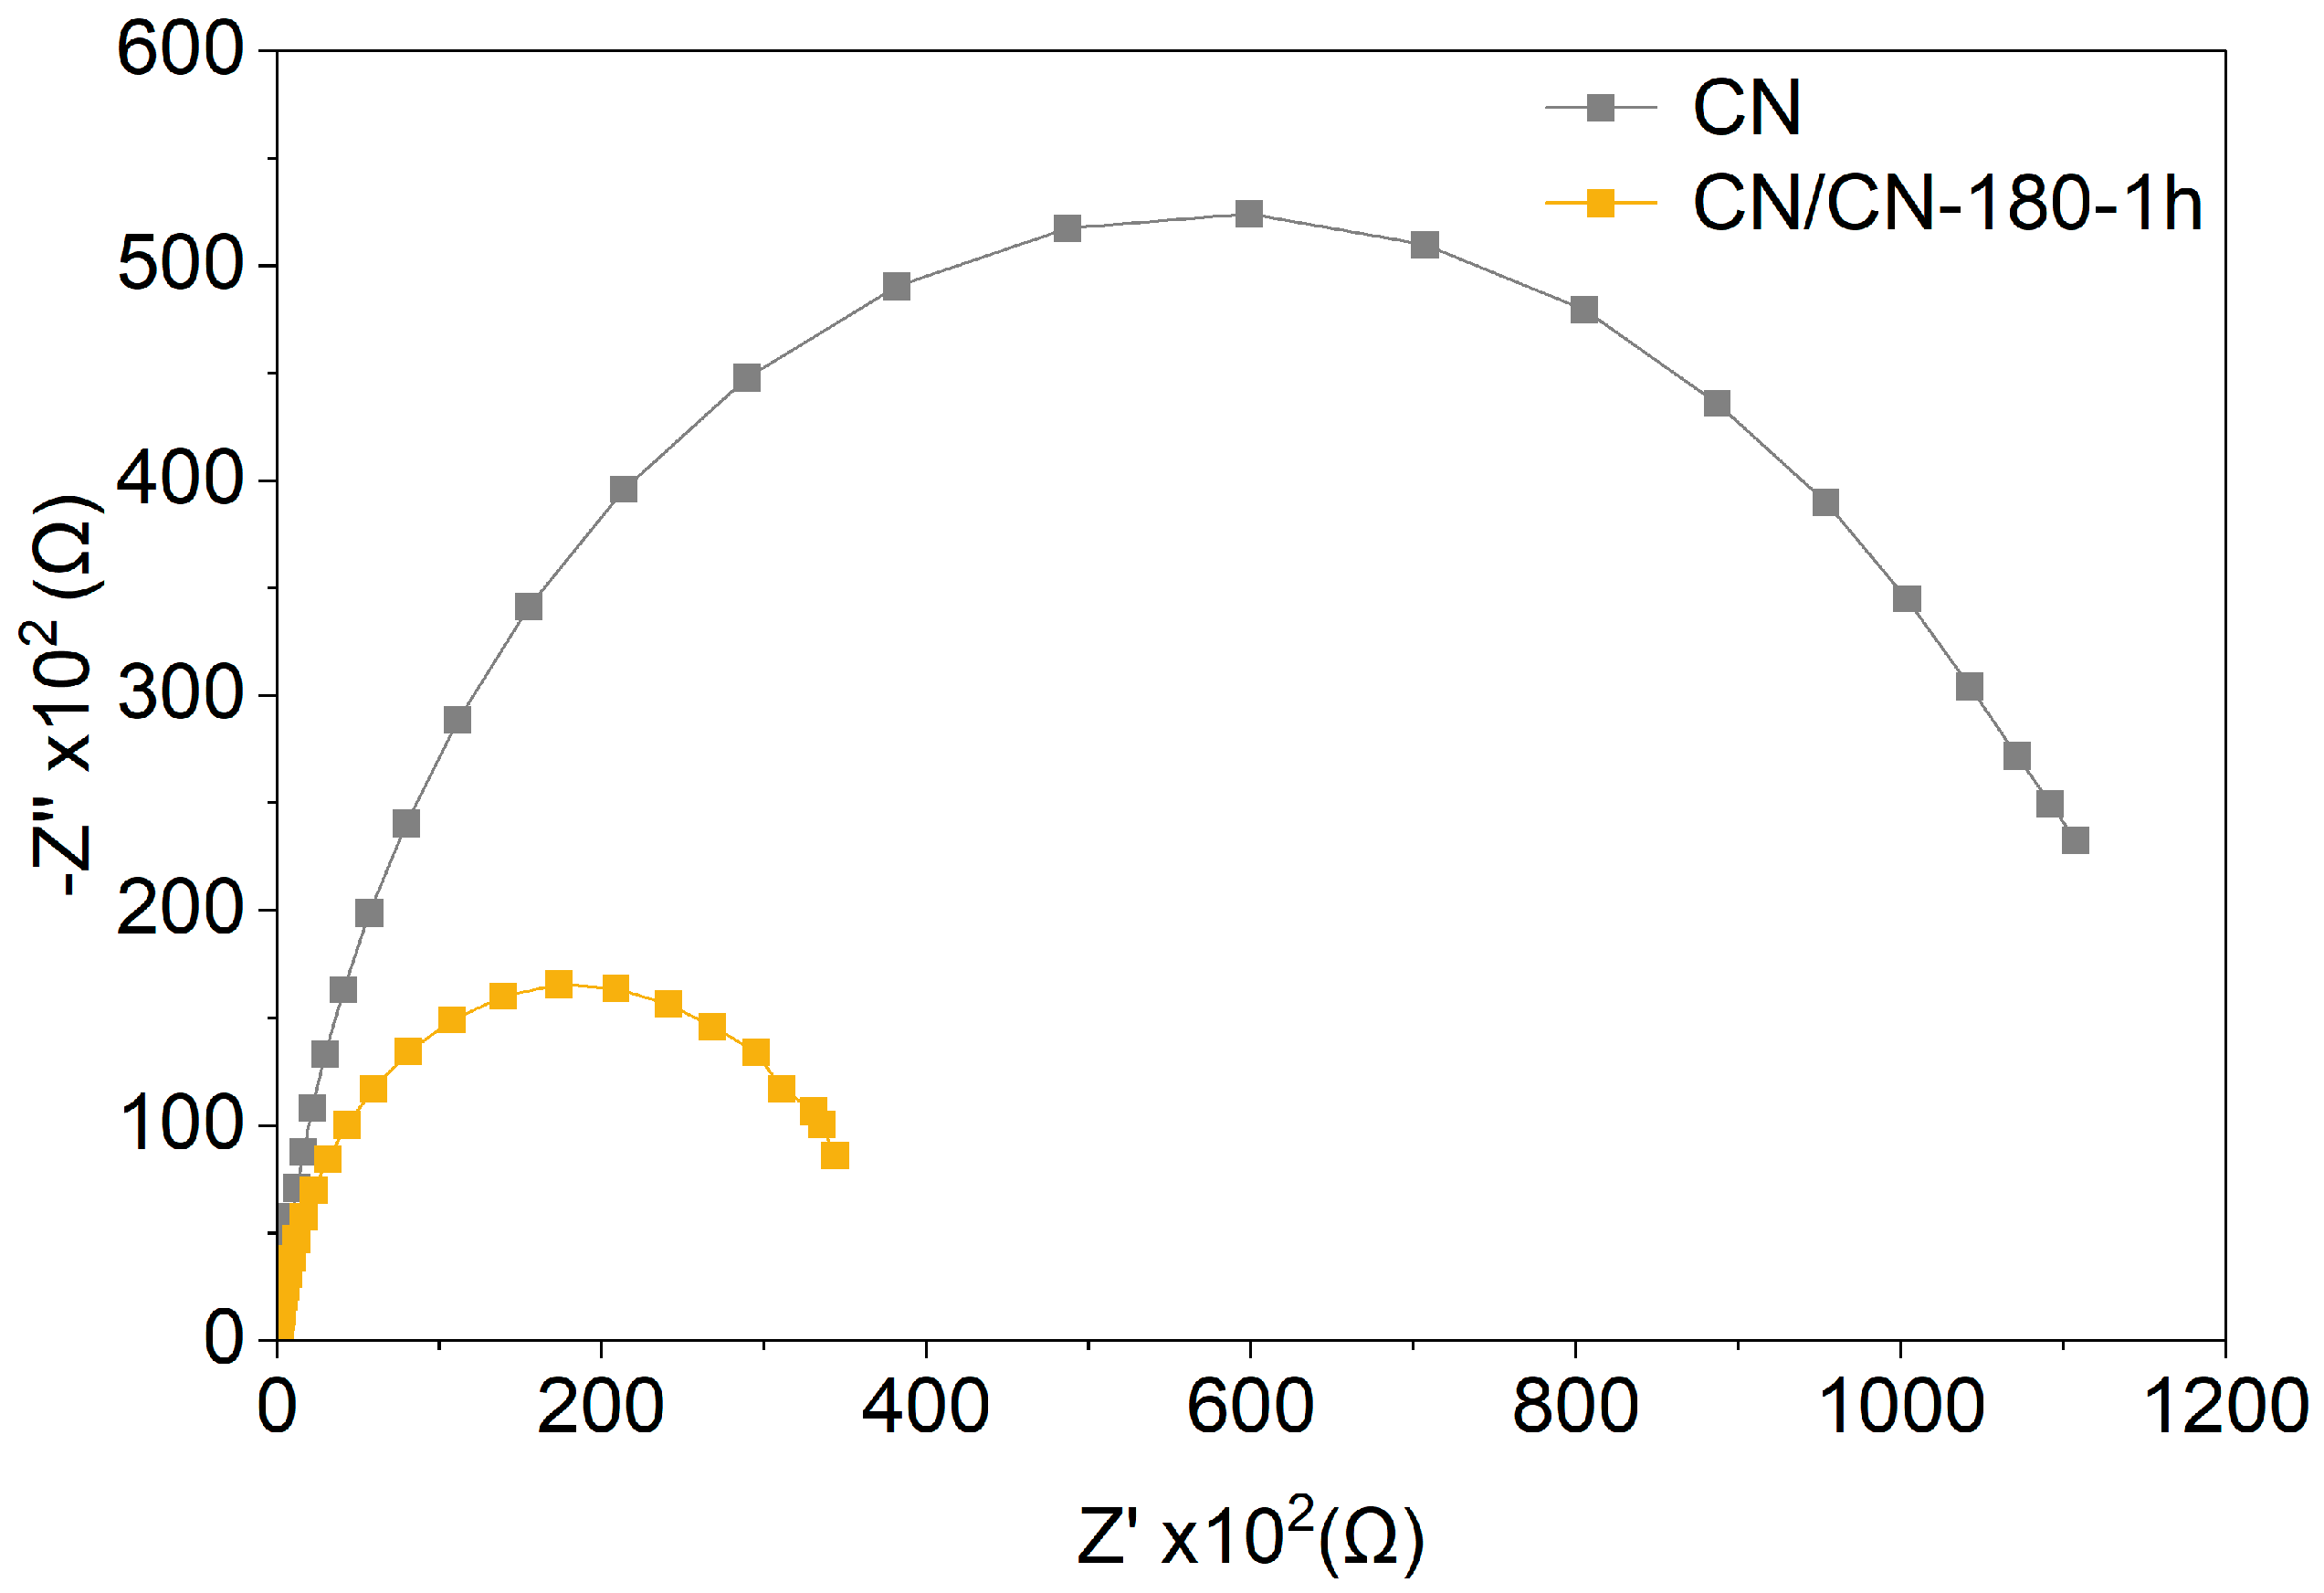
To fully understand the photocatalytic performance of the composites, electrochemical impedance measurements were done for the pristine CN and the best photocatalyst, the CN/CD-180-1h. This technique is essential to assess the electrical conductivity of the sample, the good mobility of the electrons, the charge transfer resistance, and to validate the results of the efficiency of the electron-hole pair separation seen with the PL spectra [37,40]. In agreement with the results of photoluminescence and following the trend with the band gap, the Nyquist diagram illustrated in Figure 7, depicts that the composite exhibits a smaller radius than the sole CN, meaning a smaller resistance to the charge transference and a faster electron transfer kinetics [19]. The high arc for the CN indicates a higher resistance and a higher energetic barrier that impairs the electrons’ mobility [27,31]. This observation has a direct impact on the photocatalytic reaction; the introduction of the carbon dots raises the charge density on the system and reduces the transfer barrier. The migration of electrons to the surface is accelerated and allows them to participate in the hydrogen evolution reaction [27,31,41].

3.3. Characterization of CDs Prepared with Different Dialysis Time

The purification degree was found to be a critical parameter for the H2 evolution rate. As mentioned, the composite prepared with the CD dialyzed for only one hour exhibited the highest photocatalytic performance, reaching values up to 3298 µmol/g·h. This section provides an extensive characterization of the synthesized CDs, focusing on the change in their physicochemical properties and how they correlate with the observed HER values, trying to clarify the reason for the observed trends in the previous section. In Figure S1, the macroscopic appearance of the four CDs is presented.
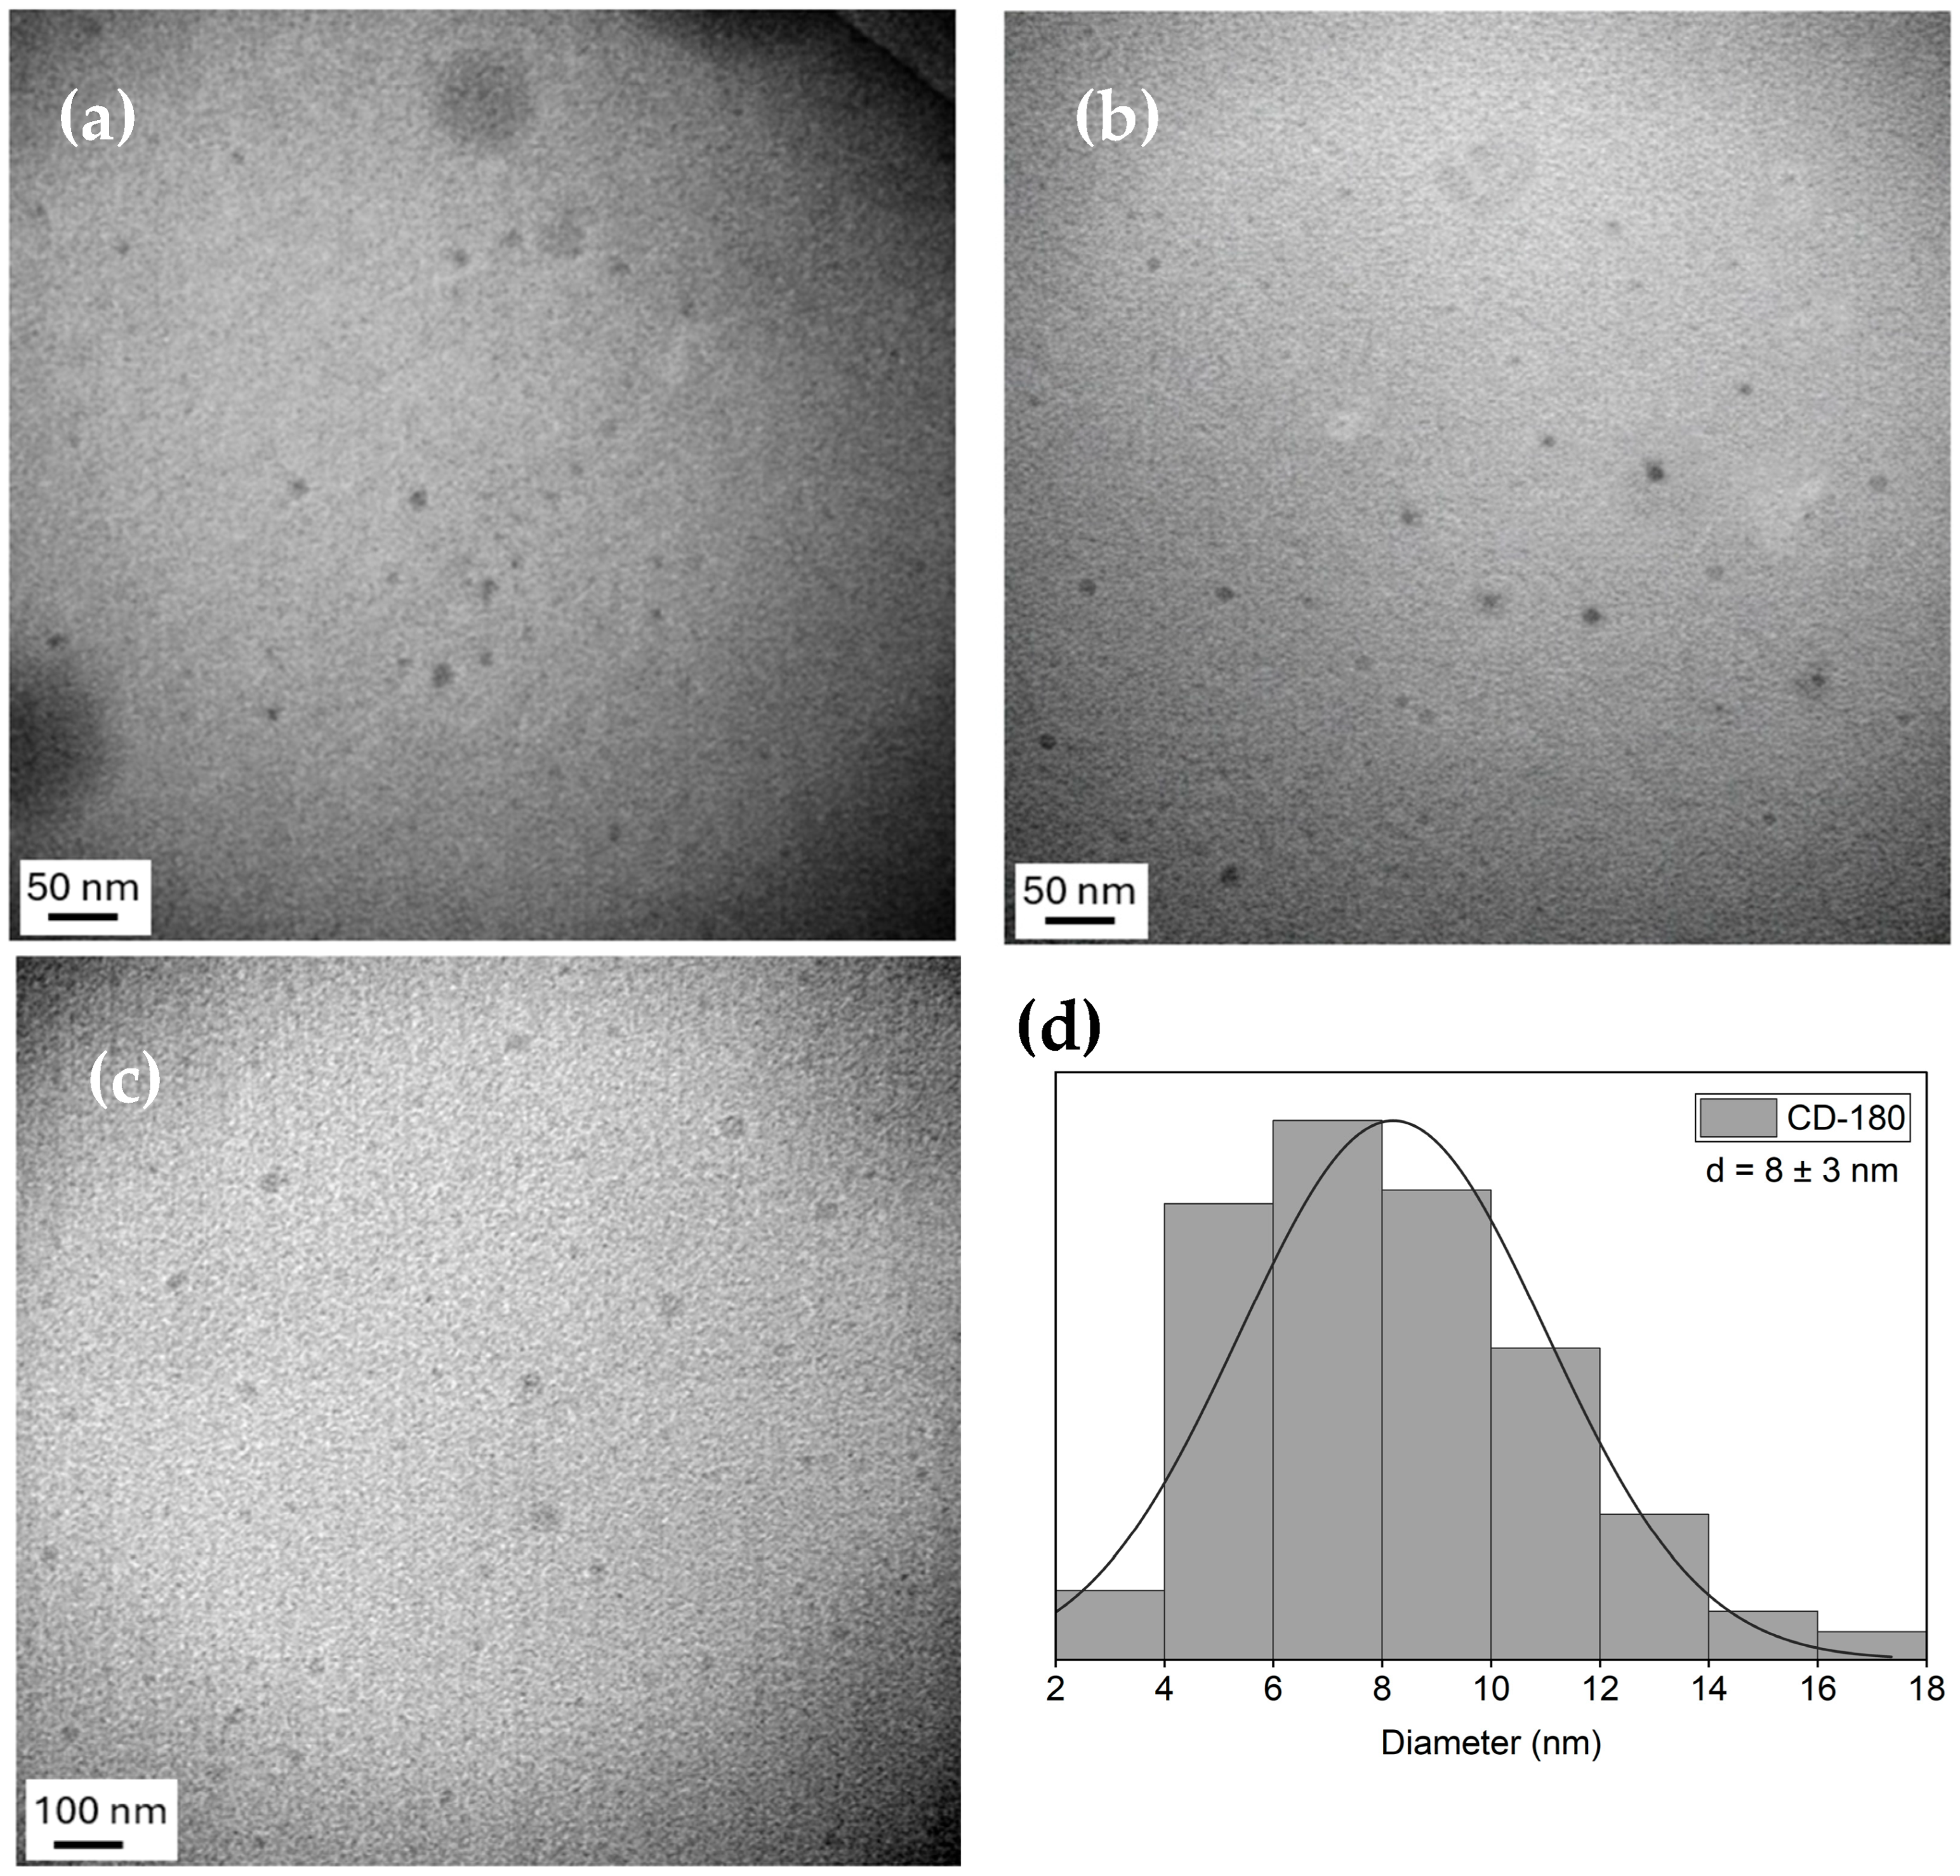
Firstly, the CDs were studied under the transmission electron microscope to elucidate their morphology (Figure 8). The images revealed rounded nanoparticles with around 8 ± 3 nm and blurred boundaries, with very similar morphologies and size distributions. These similarities might be due to TEM images primarily highlighting higher contrast (dense) structures, making it highly sensitive to the sp2 carbonaceous core, but lower for the highly functionalized surface and the oligomers and fluorophores, which have low-electron density, and provide negligible contrasts against the core. Even though the core exhibits a low-density aspect, typical of the CDs synthesized by bottom-up routes, having a more polymeric or amorphous structure, rather than graphitic [20,42]. Prolonged dialysis periods allow molecular species to diffuse through the membrane, resulting in isolated CDs. Veloso et al., have reported that prolonged times are not just a “purification method” but significantly affect the CDs composition [25].
This mentioned structural cleaning has massive implications on the mass yield. When the yields for the retained solid samples were calculated, an exponential drop of the values was observed as the dialysis time increased. The sample with just one hour of dialysis presented a 7% of yield, which fell to 1% for the CD-180-24h and to 0.5% and 0.2% for the CD-180-48h and CD-180-72h.
This fall confirms the idea that part of the synthesized product generated during the synthesis are not only CDs, but a complex mix of unreacted precursors, molecular fluorophores and low-weight oligomers, which can escape through the porous membrane [43,44]. To elucidate the structure of this matrix and the CDs, some characterization was done, such as elemental analyses, FTIR, and XPS assays.
The elemental analyses reflect the weight fractions of the main atoms present on the carbon dots, both the core and surface functionalities. In Table 2 are summarized the values obtained for the four samples. This analysis revealed similar proportions of C, N, O, and H, independent of the purification time of the CDs. This behavior is a direct consequence of the type of synthesis, in which the condensation reaction generates a mixture of carbon dots and other byproducts as oligomers and molecular fluorophores [23,24]. This species passes progressively through the cellulose membrane, but they share similar stoichiometry and empirical formula with the synthesized CDs. However, the C/N atomic ratio shows an increase in the values which correlates with the dialysis time. This phenomenon is driven by the rate of depletion in nitrogen compared to carbon [25]. Consequently, the core of the particles retained is gradually enriched in carbon content. This trend suggest that nitrogen-rich moieties are removed or transformed.
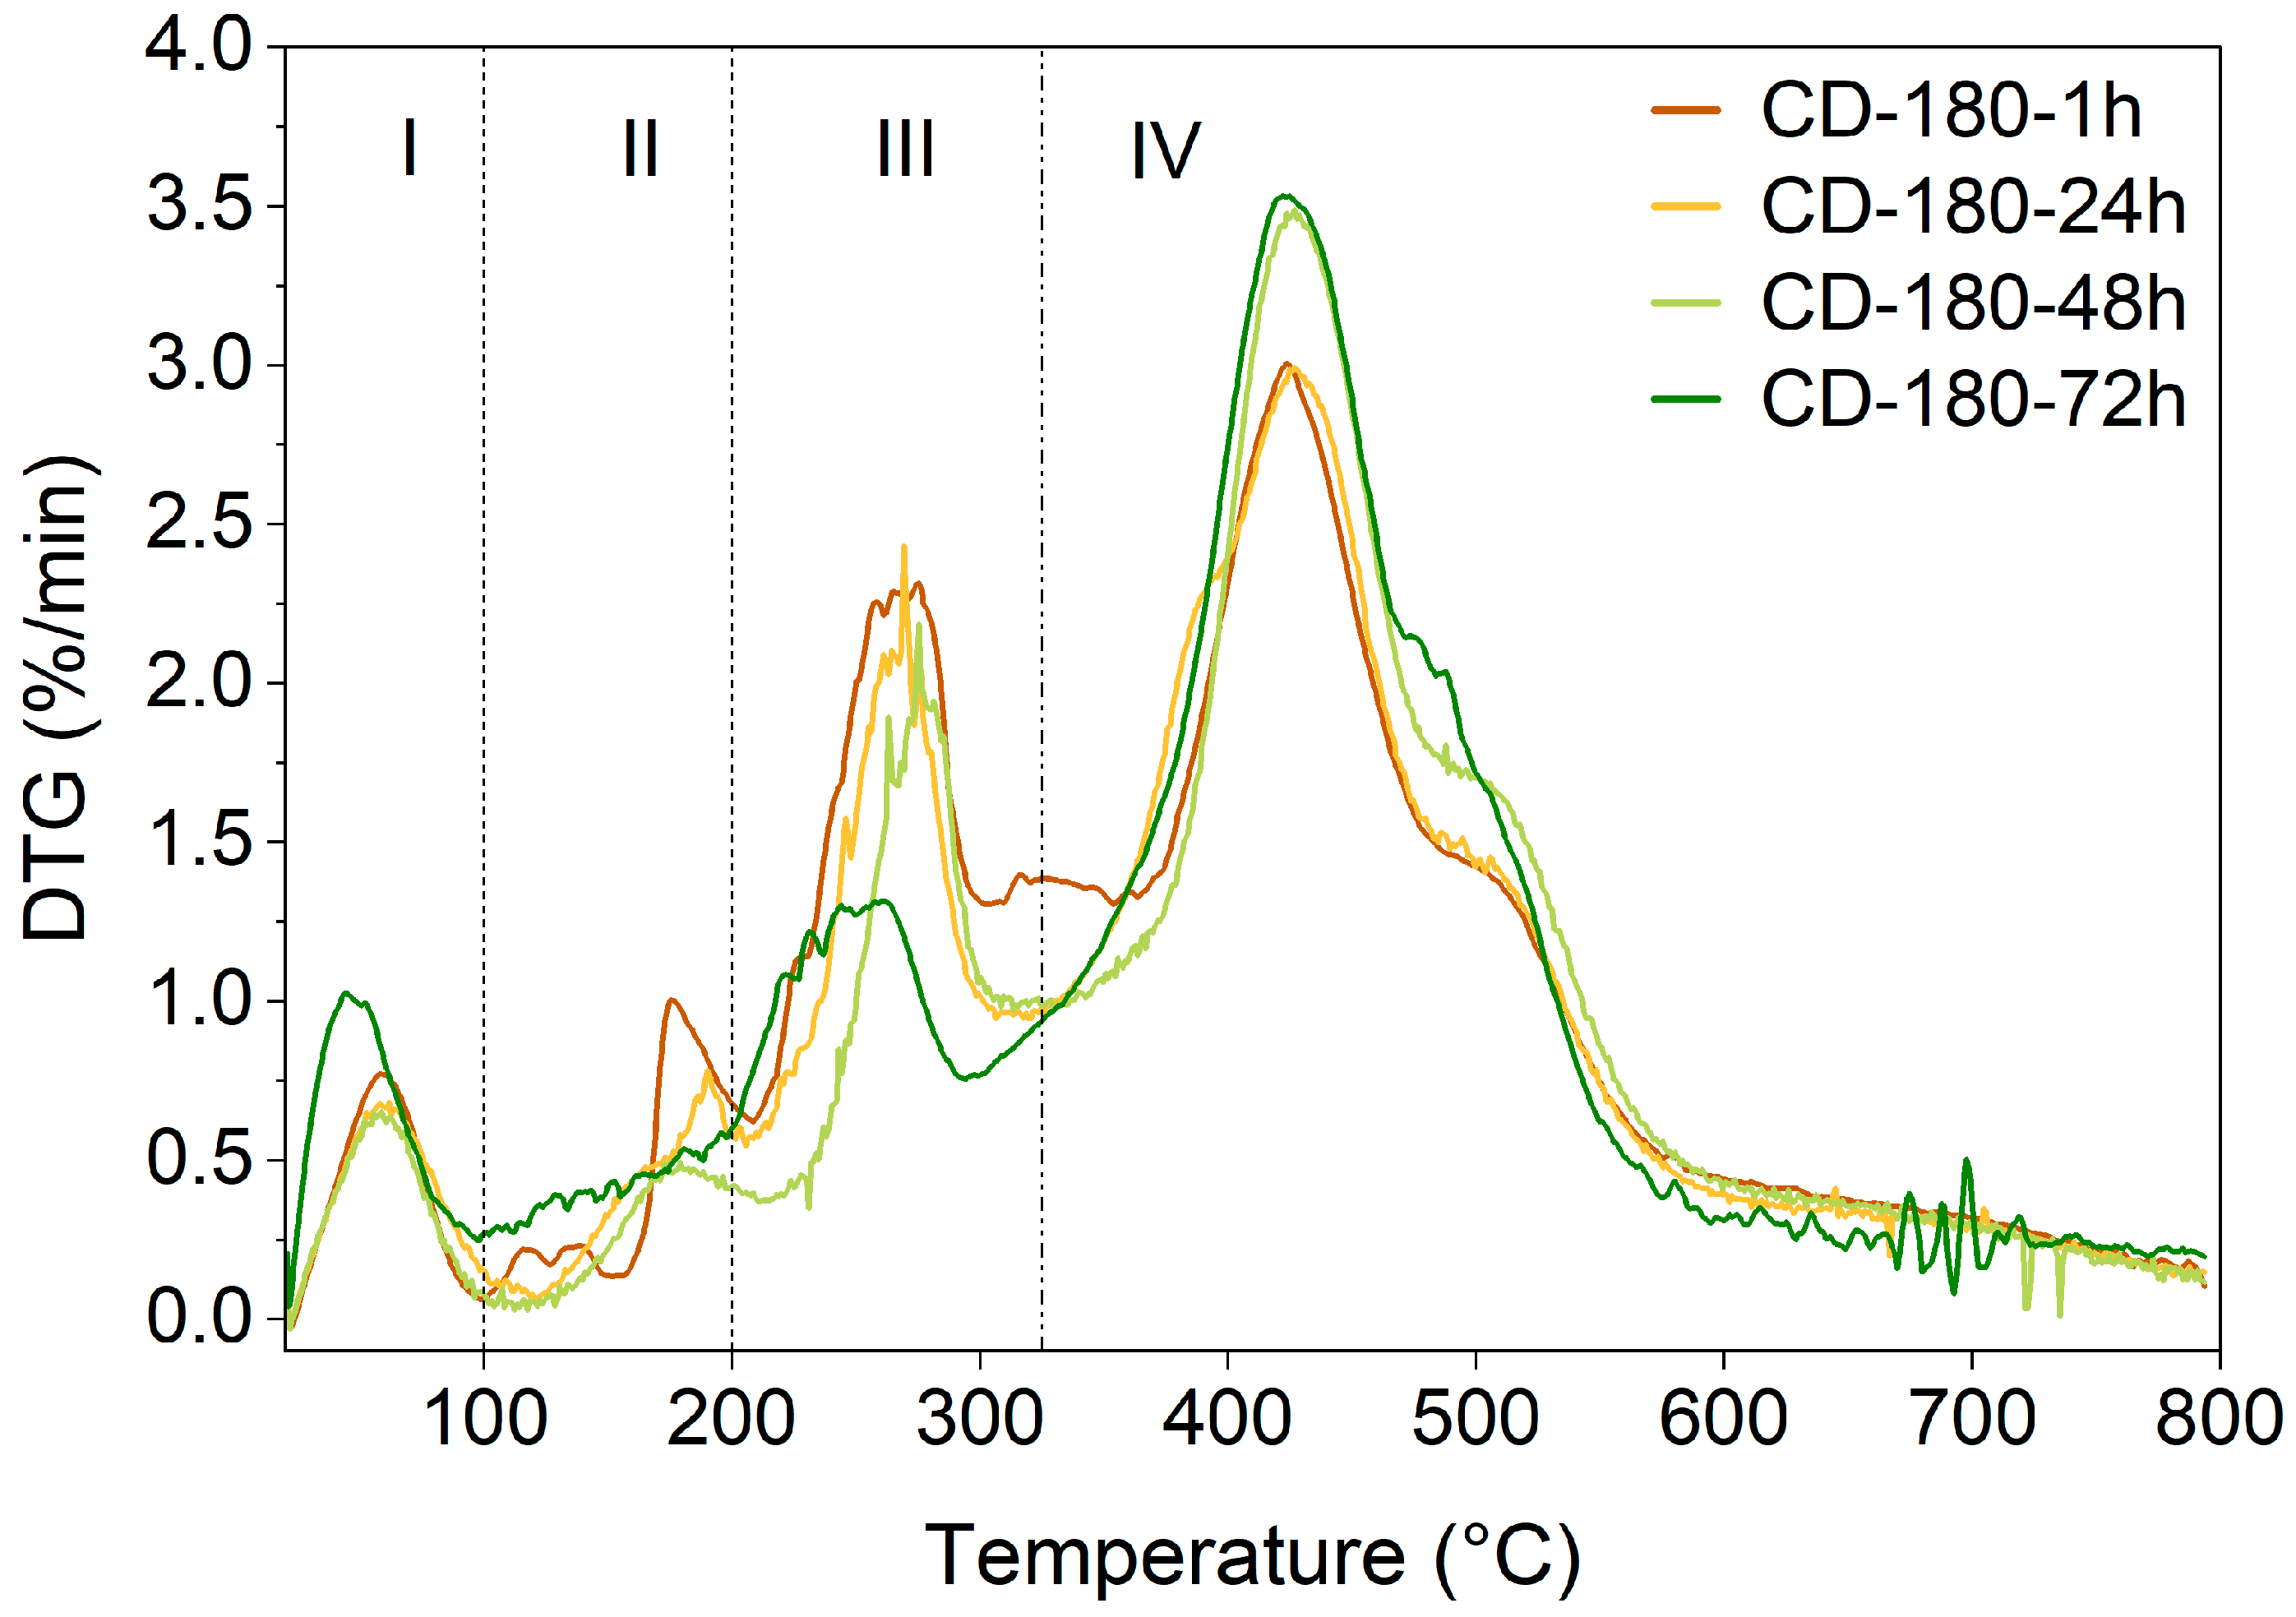
Although the evolution of the C/N ratio suggests the diminishing of nitrogen-rich species, this will be further evaluated through TGA analysis, FTIR spectroscopy, and XPS measurements. The thermal stability was evaluated by thermogravimetric analysis and its derivative. The DTG curve presented in Figure 9 revealed four decomposition stages strongly dependent on the purification time, with initial stages corresponding to the decomposition of the surface functional groups and non-purified molecular fluorophores and later steps corresponding to the carbonaceous core, closely related to the optical properties [28,45]. The thermograms present a similar profile for all of the four samples, with differences in the derivative intensity.
The first stage, between 0° and 100 °C, corresponds with the loss of encapsulated water and very volatile components. This initial mass loss is related to the high hydrophilicity of the CDs due to the polar groups on their surface [45,46]. The second stage, between 100 °C and 200 °C, is more revealing, exhibiting a pronounced peak for the CD-180-1h at 170 °C. This instability at low temperatures is distinctive of the fast decomposition of volatile byproducts and the matrix wrapping the CDs with molecular fluorophores, more reactive functional groups and short-chain oligomers. Notably, this peak diminished for the CD-180-24h and completely disappeared for the last two samples (CD-180-48h and CD-180-72h), which display no peak in this region. The fact that it is only present on low-dialyzed CDs confirms the trend suggested by the elemental analysis of the cleaning of the surface of the CDs and the elimination of impurities with dialysis time [44,45]. The third stage peak (200–320 °C) is usually associated with the decomposition of some surface functional groups (-COOH, -C=O and amides) and the fragmentation of polymeric chains [45,47]. A gradual attenuation of this peak can be observed from the CD-180-1h to the CD-180-72h, meaning that more polymeric chains and labile groups, which are present in the low-dialyzed groups, could have suffered a detachment during high-time dialysis. In the last stage, between 320 and 800 °C, is where the thermal decomposition of the carbonaceous core network occurs [45]. A higher rate is observed for the CD-180-2d and CD-180-3d samples, and a lower one for the CD-180-1h and CD-180-24h. On the latest ones, the core represents a lower fraction of the total mass of the sample, whereas in the first ones, this peak represents a higher portion of the sample. The four samples present a solid yield of ~30%. The results obtained by thermogravimetric analysis confirms the progressive purification of CDs and elimination of fluorophores present due to bottom-up synthesis.
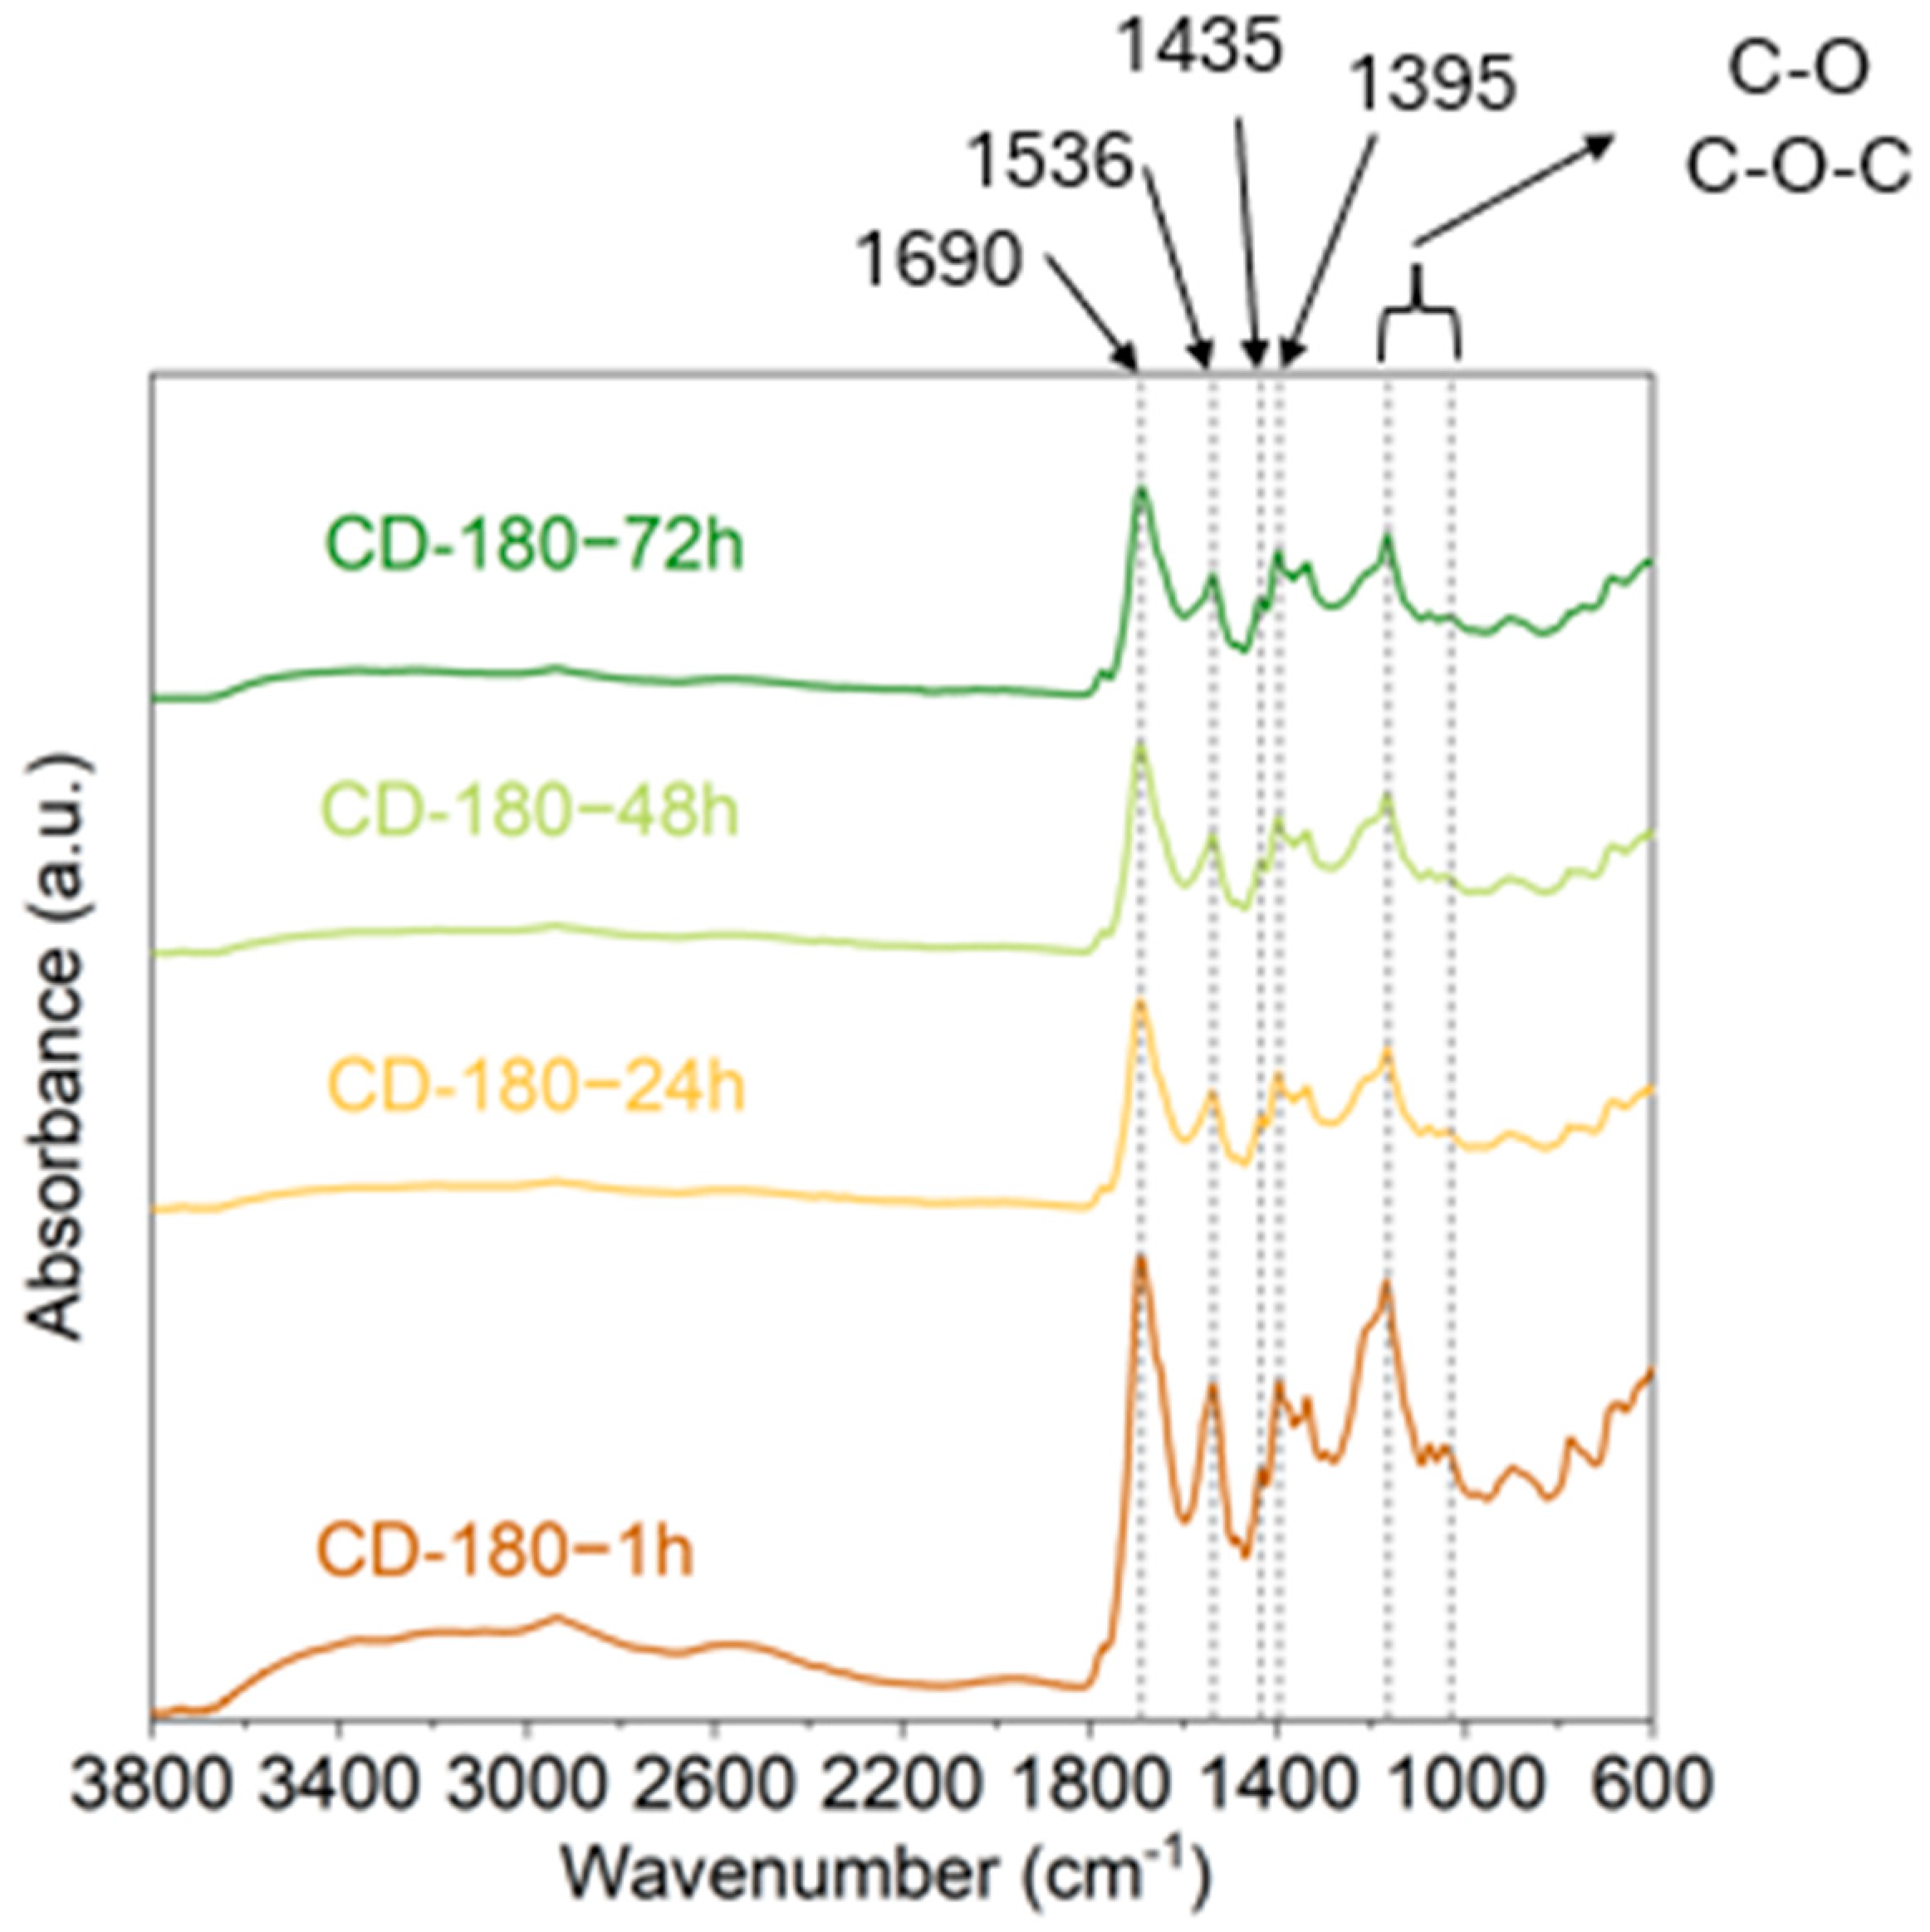
The Fourier transform infrared spectroscopy (FTIR) of the samples was used to evaluate the superficial chemistry of the CDs, along with the XPS. Figure 10 depicts the profiles for the four samples. As the curves presented for the TGA, the shape is similar, changing the absorbance of the peaks, meaning that the functional groups remain constant, but their abundance in the sample changes.
For most peaks, absorbance decreases with increasing dialysis time. The infrared profile displays a very broad band in the 3000 cm−1 to 3500 cm−1 corresponding to the stretching vibrations of the O-H and N-H groups [44]. Likewise, characteristic signals were detected at 1690 cm−1 attributed to the C=O stretching vibrations of carbonyls, carboxylic acids, and amides [48]. The bands around this area (1735–1640 cm−1) have been attributed by several authors, such as Veloso et al., or Gonzalez-Vera et al., to ester, carboxylic acids, C-O groups, and N-C-O in amides [25,44]. In our samples, these bands overlap and are presented as one big, sharp band, although a small hump is discernible at 1650 cm−1, probably corresponding to N-H or N-C-O stretching. Regarding the nitrogenated functionalities, a peak at 1536 cm−1 is identified as the N-H bending of amine groups and the N-O groups [49,50] and another at 1435 cm−1 is reported as the stretching of the C-N groups in amides [49]. The 1395 cm−1 band is attributed to the symmetric deformation of methyl groups adherent to the carbon dots surface [51]. Lastly, the bands around 1330 to 1050 cm−1 are related to oxygenated functionalities, such as C-O-C (1329 cm−1, [51]), C-O (1164 and 1050 cm−1 [17,52]). For this last band, Gonzalez-Vera et al., states that the band is due to alcohols joined to primarily aliphatic carbons [44]. The gradual decrease in the absorbance of functional groups with increasing dialysis time is evidence that by-products and labile functional groups attached to the CD surface are lost during the process, as indicated by the elemental analysis and TGA analyses.
An analysis of the XPS spectra across the different purification times was conducted to corroborate the structural loss of species and to elucidate the chemical evolution of the CDs interface. This analysis reveals that the prolonged dialysis times induce chemical and structural changes in the CDs.
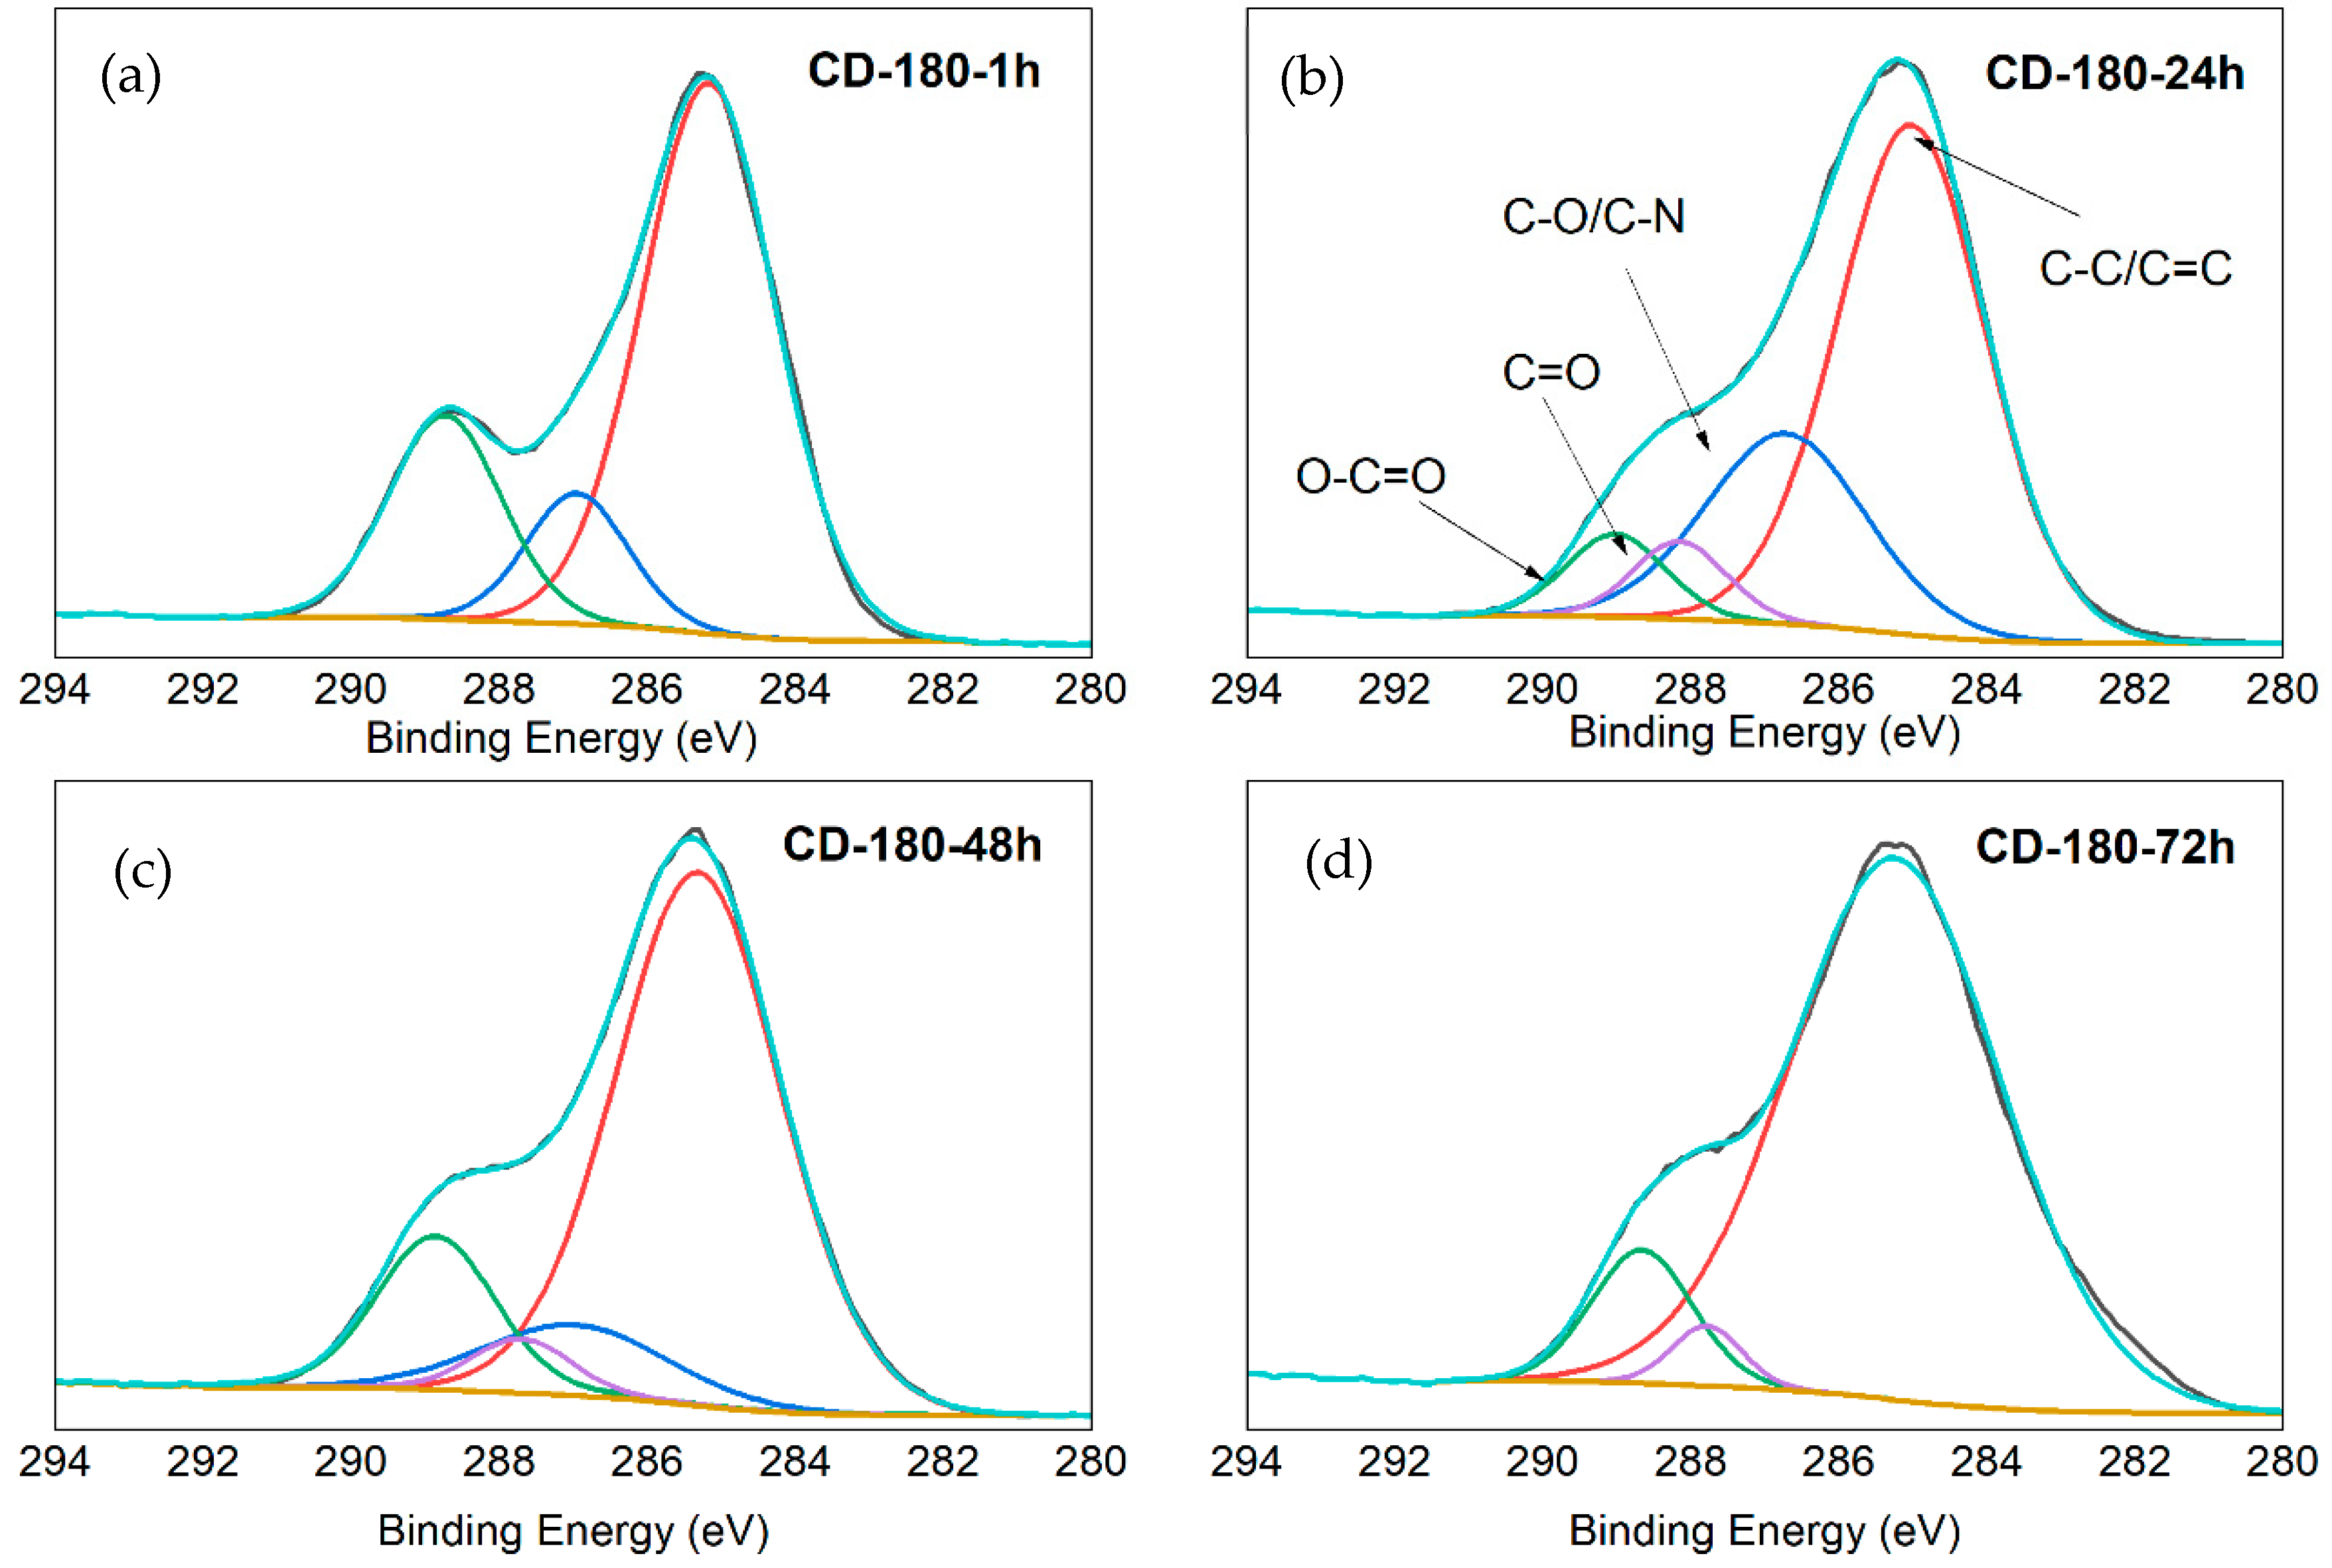
The general spectra are included in Figure S2. and show the contribution of C1s at around 288 eV, N1s at around 398 eV, and O1s at approximately 530 eV. The high resolution XPS of the C1s for the sample shows the presence of three peaks for the CD-180-1h and CD-180-72h (Figure 11a,d), four for the CD-180-24h, CD-180-48h (Figure 11b,c), which are attributed to C-C/C=C (~285.3 eV), C-N/C-O (~286.7 eV), C=O (~288 eV), and O-C=O (~289 eV) [45,53]. The N1s spectrum for the CD-180-1h (Figure S3a) shows peaks at ~400.8 eV attributed to tertiary amines (N-(C)3) and amino functional groups and for the CD-180-24h, CD-180-48h, and CD-180-72h (Figure S3b–d) and at ~398 eV related to C=N and at ~400 eV corresponding to C-N-C/C-N-H bonds [54,55]. Lastly, the O1s deconvolution (Figure S4) spectra show the presence of C=O bonds at ~529.9 eV and C-O-C/C-O-H ~531.4 eV for the more dialyzed samples (Figure S4b–d) and two different peaks for the CD-180-1h (Figure S4a) at ~533.4 eV related to C-O and ~533.4 eV attributed to -OH/-COOH [20,56,57].
The XPS analysis is the proof for the loss of essential functional groups and fluorophores attached to the CDs nucleus. This is evidenced by the increased total carbon content in the samples (Table S2), which indicates a surface largely lacking functional chemistry and may explain the decrease in HER values. The CDs obtained after prolonged dialysis exhibit lower functionalization, which originally acted as a stabilizing layer, provided electron-sink sites, and facilitated the charge-transfer processes required for the photocatalytic reaction. In addition, these highly dialyzed CDs become more hydrophobic, preventing proper interaction with the reaction medium or with CN.
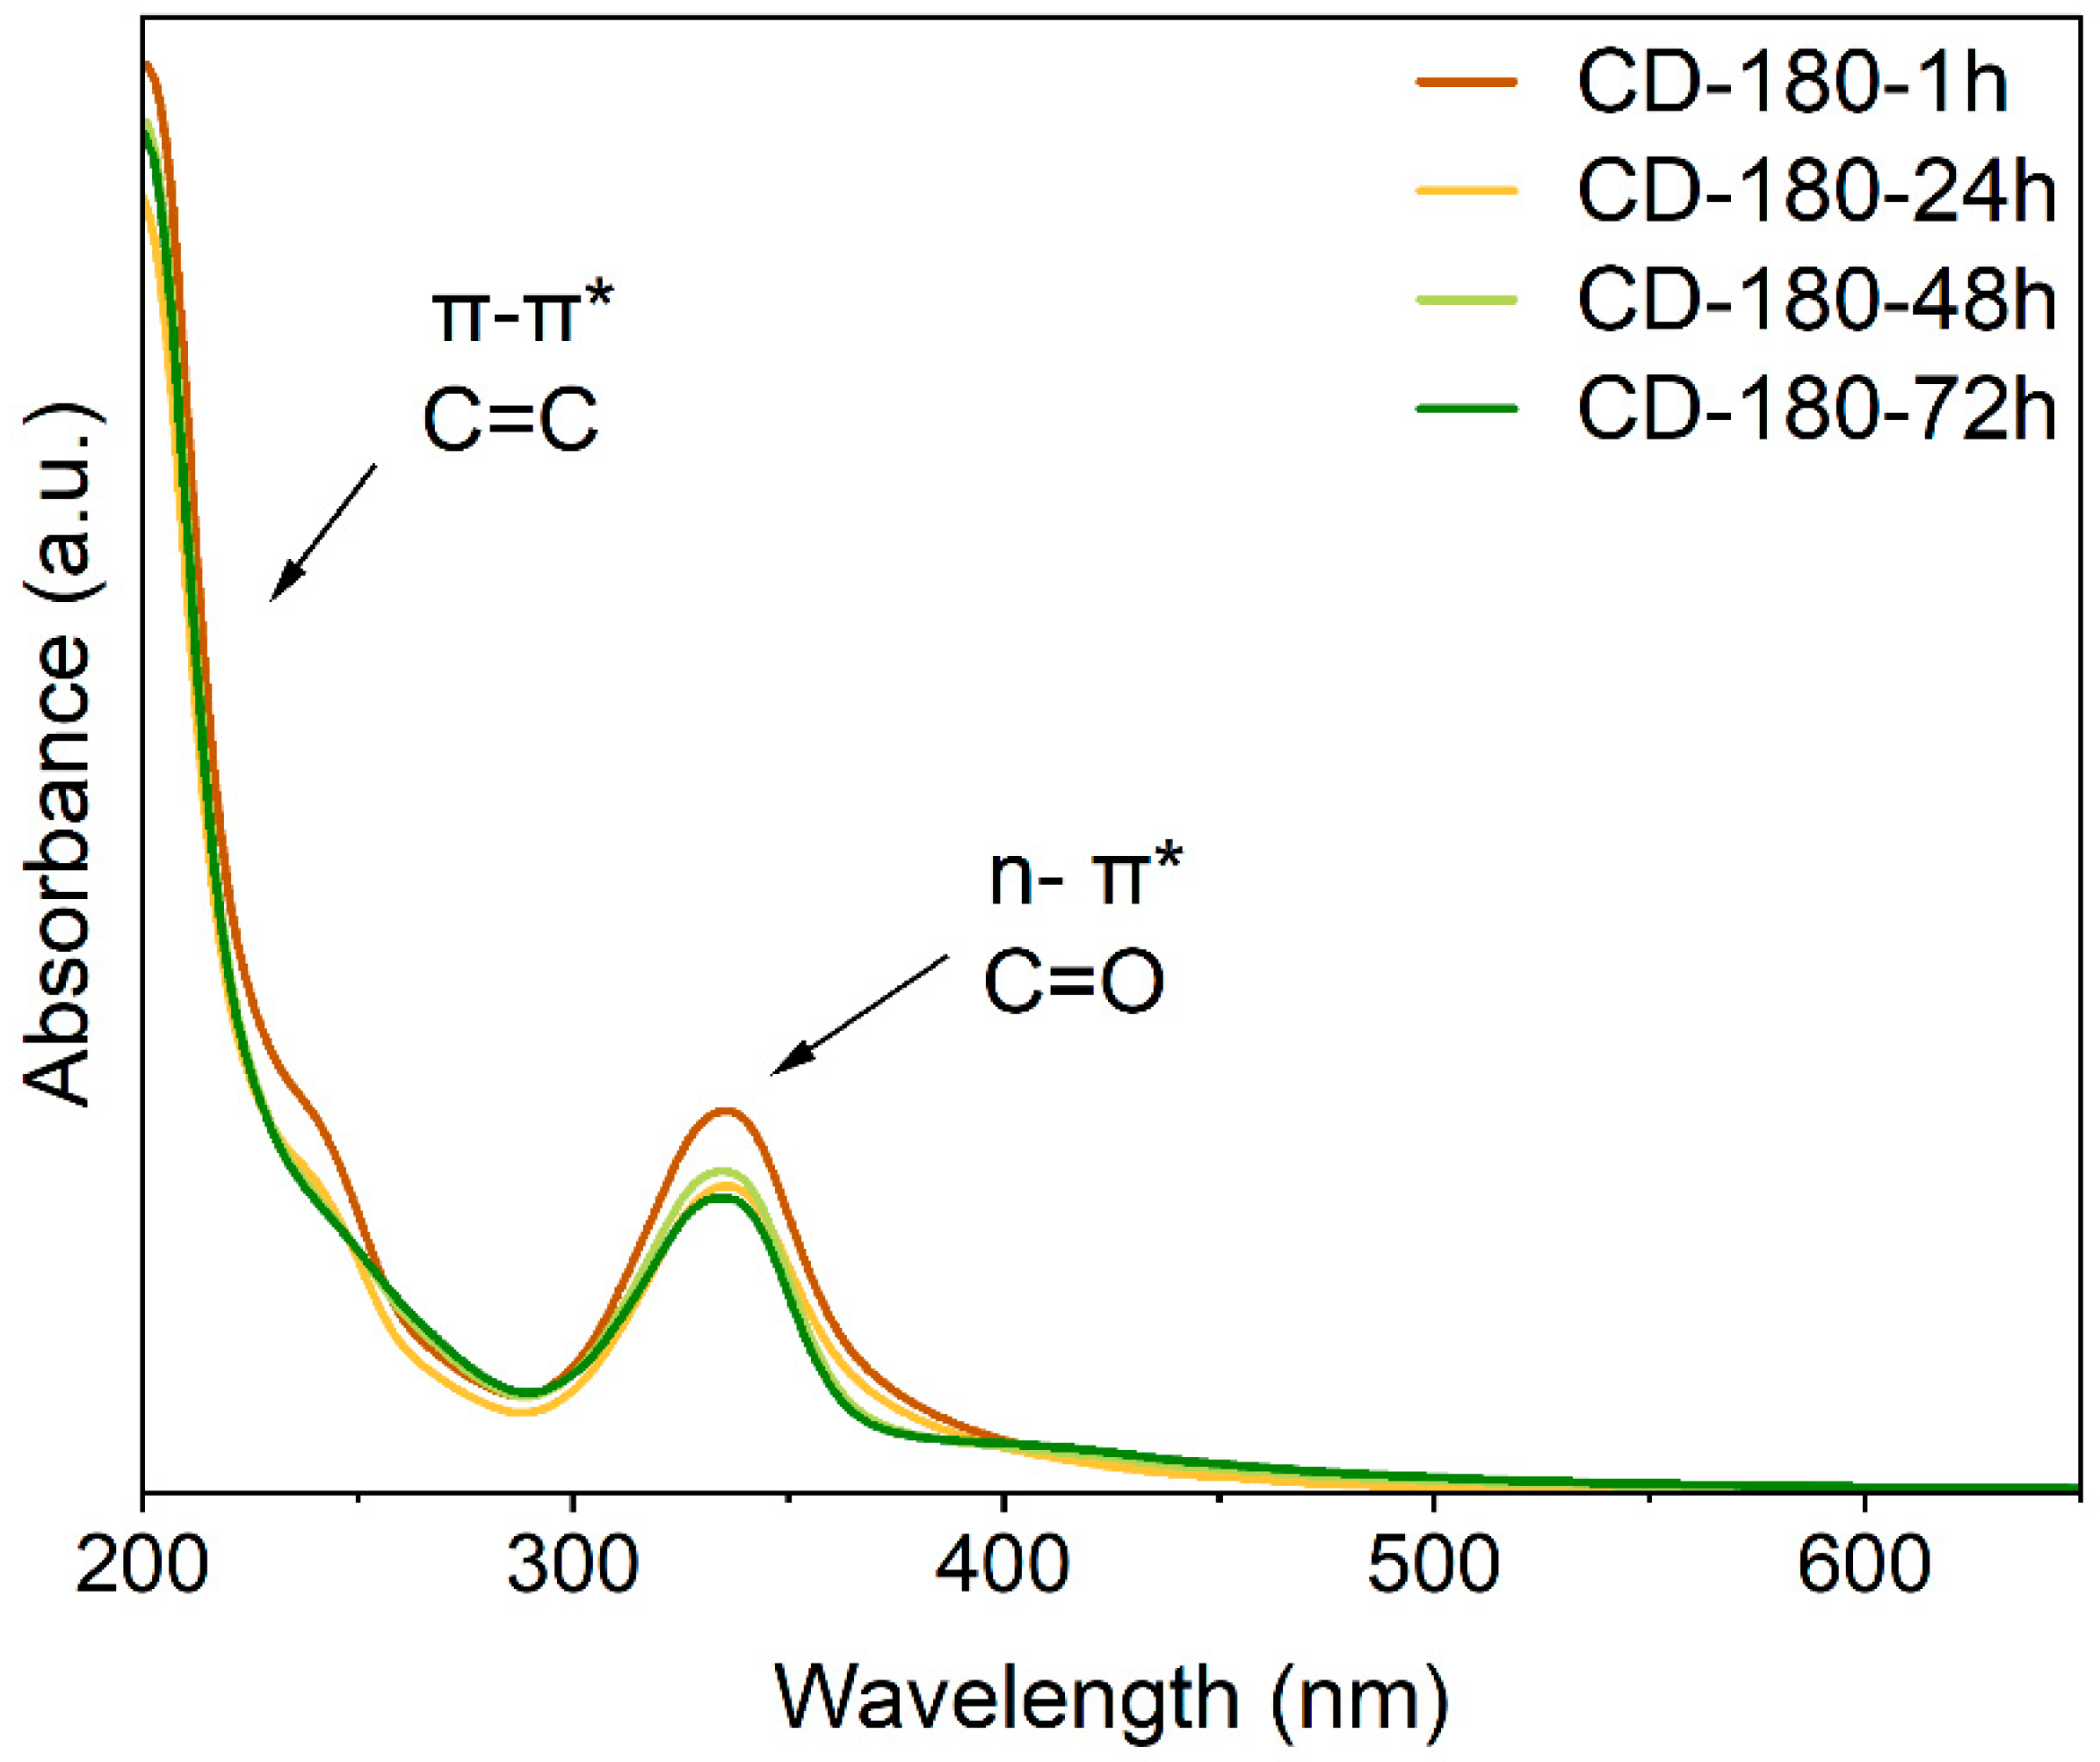
The UV-Vis spectra shown in Figure 12 revealed an optical transition during the CDs purification. The samples revealed two electronic transition peaks, one band around 200 nm corresponding to the π-π* transition of the aromatic domains with sp2 hybridization (C=C) and another peak around 330 nm associated with the n-π* transitions of the oxygenated and nitrogenated functional groups (C=O and C=N) present in the surface of the CDs [21,47]. The sample with just 1 h of dialysis time shows a slightly higher absorbance at 330 nm than the rest of the dialyzed CDs. This could be related to the retention of molecular by-products and nitrogen-rich oligomers. By extending the dialysis time, the absorbance approach yields similar values.
The direct impact of the purification on the emission efficiency was evaluated by the calculation of the photoluminescence quantum yield (QY), which was calculated from the diffuse reflectance spectra of the carbon dots (Figure S5). The progressive elimination of the molecular by-products that the bottom-up synthesis generates, as highly emissive molecular fluorophores and oligomers, has a direct impact on the optical properties of the samples [20,58]. The measurements for the QY revealed a systematic drop as a function of the purification time: the sample subjected to one hour (CD-180-1h) exhibited a high value of 44%, whereas the values collapsed progressively to the 31% for the CD-180-24h, 27% for the CD-180-48h and 24% for the CD-180-72h (the values reported are specific to 340 nm excitation). This behavior agrees with the elimination of fluorophores, which causes the drop in the QY. High values of QY are reported by Essner et al., and Chen et al., who demonstrated that QY of the retained fraction drops with the elimination of impurities. As the pure carbon core is a weaker emitter, the QY falls [23,43]. Despite having the same absorbance values, the QY of the samples falls, stating the elimination of fluorophores that do not affect to the absorbance but do affect the emission properties. As the emissive particles diffuse through the membrane, which has been proven with the elemental analysis, the thermogravimetry, the FTIR and the XPS results, the global luminescence falls.
In the photocatalytic reactions, the loss of the QY corresponds to the loss of essential components required for our reaction. In previous studies, it has been proven that a certain dialysis is needed for the elimination of unreacted precursors and molecular byproducts in the mixture [27]. The fluorescent molecules attached to the CDs, far for being an interference, act as photosensitizers in the composite, absorbing light and facilitating the energy and electron transfer improving the effectivity of the photocatalysis [22,42,54]. In our composite, we have a hybrid structure between fluorophore molecules and carbon dots with small-chain polymers and labile functional groups anchored to their surface, which, when joined to the CN, generates a perfect synergy for the boost of the HER.

4. Conclusions

This research effectively demonstrates the relationship between the purification degree of the carbon dots and the photocatalytic activity of composites made of carbon nitride and CDs. The results reveal that the CN/CD-180-1h sample exhibits the highest HER performance, which then decrease with extended dialysis times. Through the physicochemical characterization of the CDs, a progressive fall of the superficial functional groups and the surrounding matrix of fluorophores can be observed, leading to a smaller photocatalytic activity. In the DTG analysis, the loss of these species is observed in the early stages of decomposition, while the FTIR and XPS results show a general decrease in functional groups associated with nitrogen- and oxygen-containing functionalities, giving rise to more aromatic structures. As a consequence, the QY drops from 44% for the CD-180-1h to 24% for the CD-180-72h. All the evidence for the loss of functional groups is also reflected in the optical properties of the composites, where a reduction in the band gap, an increase in charge-transfer efficiency, or a lower recombination rate of photogenerated electron–hole pairs for the samples with the highest HER values confirm this trend.

Supplementary Materials

The following supporting information can be downloaded at: https://www.mdpi.com/article/10.3390/en19143332/s1. Table S1: Comparison of HER values of CDs/g-C3N4 photocatalysts toward water splitting. Figure S1: Appearance and morphology of the Carbon Dots (CDs) synthetised at different temperatures. (a) CD-180-1h; (b) CD-180-24h; (c) CD-180-48h; (d) CD-180-48h. Figure S2: XPS spectra of (a) CD-180-1h (b) CD-180-24h (c) CD-180-48h and (d) CD-180-72h. Figure S3: Deconvolution of N1s of CD-180-X. Figure S4: Deconvolution of O1s of CD-180-X. Table S2: Percentages of O1s, C1s and N1s of the samples by XPS analysis. Figure S5: Quantum yield of Carbon dots dialyzed at (a) 1 h (b) 24 h (c) 48 h and (d) 72 h. References [29,30,31,33,40,59,60,61,62] are cited in supplementary file.

Author Contributions

Conceptualization, M.F.V. and C.B.; Methodology, M.F.V.; Validation, E.D.-F.; Formal analysis, E.D.-F.; Investigation, N.R.; Writing—original draft, N.R. and C.B.; Writing—review & editing, C.B.; Supervision, M.F.V. and C.B. All authors have read and agreed to the published version of the manuscript.

Funding

The research work was financed by Gobierno del Principado de Asturias (IDE/2024/000792).

Data Availability Statement

The original contributions presented in the study are included in the article/Supplementary Material, further inquiries can be directed to the corresponding author.

Conflicts of Interest

The authors declare no conflict of interest.

References

  1. Jiang, L.; Yuan, X.; Pan, Y.; Liang, J.; Zeng, G.; Wu, Z.; Wang, H. Doping of Graphitic Carbon Nitride for Photocatalysis: A Review. Appl. Catal. B Environ. 2017, 217, 388–406. [Google Scholar] [CrossRef]
  2. Isaacs, M.; Garcia-Navarro, J.; Ong, W.-J.; Jiménez-Calvo, P. Is Photocatalysis the Next Technology to Produce Green Hydrogen to Enable the Net Zero Emissions Goal? Glob. Chall. 2023, 7, 2200165. [Google Scholar] [CrossRef] [PubMed]
  3. Bie, C.; Yang, J.; Zeng, X.; Wang, Z.; Sun, X.; Yang, Z.; Yu, J.; Zhang, X. Nanoconfinement Effects in Electrocatalysis and Photocatalysis. Small 2025, 21, 2411184. [Google Scholar] [CrossRef] [PubMed]
  4. Advances in Photocatalysis, Electrocatalysis and Photoelectrocatalysis for Hydrogen Production. Focus Catal. 2025, 2025, 7. [CrossRef]
  5. Takanabe, K. Photocatalytic Water Splitting: Quantitative Approaches toward Photocatalyst by Design. ACS Catal. 2017, 7, 8006–8022. [Google Scholar] [CrossRef]
  6. Alvarado-Ávila, M.I.; Ye, F.; Dutta, J. Visible Light Photocatalysis: Green Hydrogen Production. Meet. Abstr. 2023, MA2023-02, 2334. [Google Scholar] [CrossRef]
  7. Ruan, Y.; Hu, Y.; Cheng, H. Recent Progress in G-C3N4-Based Photocatalysts for Organic Pollutant Degradation: Strategies to Improve Photocatalytic Activity. Catalysts 2025, 15, 148. [Google Scholar] [CrossRef]
  8. Wang, X.; Maeda, K.; Thomas, A.; Takanabe, K.; Xin, G.; Carlsson, J.M.; Domen, K.; Antonietti, M. A Metal-Free Polymeric Photocatalyst for Hydrogen Production from Water under Visible Light. Nat. Mater. 2009, 8, 76–80. [Google Scholar] [CrossRef] [PubMed]
  9. Xiong, T.; Cen, W.; Zhang, Y.; Dong, F. Bridging the G-C3N4 Interlayers for Enhanced Photocatalysis. ACS Catal. 2016, 6, 2462–2472. [Google Scholar] [CrossRef]
  10. Zhang, J.; Hu, S.; Wang, Y. A Convenient Method to Prepare a Novel Alkali Metal Sodium Doped Carbon Nitride Photocatalyst with a Tunable Band Structure. RSC Adv. 2014, 4, 62912–62919. [Google Scholar] [CrossRef]
  11. Li, Z.; Kong, C.; Lu, G. Visible Photocatalytic Water Splitting and Photocatalytic Two-Electron Oxygen Formation over Cu- and Fe-Doped g-C3N4. J. Phys. Chem. C 2016, 120, 56–63. [Google Scholar] [CrossRef]
  12. Lan, D.-H.; Wang, H.-T.; Chen, L.; Au, C.-T.; Yin, S.-F. Phosphorous-Modified Bulk Graphitic Carbon Nitride: Facile Preparation and Application as an Acid-Base Bifunctional and Efficient Catalyst for CO2 Cycloaddition with Epoxides. Carbon 2016, 100, 81–89. [Google Scholar] [CrossRef]
  13. Liu, G.; Niu, P.; Sun, C.; Smith, S.C.; Chen, Z.; Lu, G.Q.; Cheng, H.-M. Unique Electronic Structure Induced High Photoreactivity of Sulfur-Doped Graphitic C3N4. J. Am. Chem. Soc. 2010, 132, 11642–11648. [Google Scholar] [CrossRef] [PubMed]
  14. Zhang, G.; Zhang, M.; Ye, X.; Qiu, X.; Lin, S.; Wang, X. Iodine Modified Carbon Nitride Semiconductors as Visible Light Photocatalysts for Hydrogen Evolution. Adv. Mater. 2014, 26, 805–809. [Google Scholar] [CrossRef] [PubMed]
  15. Antil, B.; Kumar, L.; Reddy, K.P.; Gopinath, C.S.; Deka, S. Direct Thermal Polymerization Approach to N-Rich Holey Carbon Nitride Nanosheets and Their Promising Photocatalytic H2 Evolution and Charge-Storage Activities. ACS Sustain. Chem. Eng. 2019, 7, 9428–9438. [Google Scholar] [CrossRef]
  16. Liu, J.; Liu, Y.; Liu, N.; Han, Y.; Zhang, X.; Huang, H.; Lifshitz, Y.; Lee, S.-T.; Zhong, J.; Kang, Z. Metal-Free Efficient Photocatalyst for Stable Visible Water Splitting via a Two-Electron Pathway. Science 2015, 347, 970–974. [Google Scholar] [CrossRef] [PubMed]
  17. Wang, R.; Lu, K.-Q.; Tang, Z.-R.; Xu, Y.-J. Recent Progress in Carbon Quantum Dots: Synthesis, Properties and Applications in Photocatalysis. J. Mater. Chem. A 2017, 5, 3717–3734. [Google Scholar] [CrossRef]
  18. Wang, X.; Cao, L.; Lu, F.; Meziani, M.J.; Li, H.; Qi, G.; Zhou, B.; Harruff, B.A.; Kermarrec, F.; Sun, Y.-P. Photoinduced Electron Transfers with Carbon Dots. Chem. Commun. 2009, 45, 3774–3776. [Google Scholar] [CrossRef] [PubMed]
  19. Zhang, H.; Zhao, L.; Geng, F.; Guo, L.-H.; Wan, B.; Yang, Y. Carbon Dots Decorated Graphitic Carbon Nitride as an Efficient Metal-Free Photocatalyst for Phenol Degradation. Appl. Catal. B Environ. 2016, 180, 656–662. [Google Scholar] [CrossRef]
  20. Bian, Z.; Gomez, E.; Gruebele, M.; Levine, B.G.; Link, S.; Mehmood, A.; Nie, S. Bottom-up Carbon Dots: Purification, Single-Particle Dynamics, and Electronic Structure. Chem. Sci. 2025, 16, 4195–4212. [Google Scholar] [CrossRef] [PubMed]
  21. Hoang, N.M.; Thi Bich Ngoc, N.; Tran, N.-A.; Ho, N.X.; Thi Dang, H.-L.; Cuong, D.V.; Trang, V.T.; Thi Lan Huong, P.; Thi Thanh Huyen, P.; Jamil, M.S.; et al. Dual-Emission Carbon Dots: Synthesis, Applications, Advances and Challenges. J. Environ. Chem. Eng. 2025, 13, 117696. [Google Scholar] [CrossRef]
  22. Hu, Y.; Seivert, O.; Tang, Y.; Karahan, H.E.; Bianco, A. Carbon Dot Synthesis and Purification: Trends, Challenges and Recommendations. Angew. Chem. Int. Ed. 2024, 63, e202412341. [Google Scholar] [CrossRef] [PubMed]
  23. Essner, J.B.; Kist, J.A.; Polo-Parada, L.; Baker, G.A. Artifacts and Errors Associated with the Ubiquitous Presence of Fluorescent Impurities in Carbon Nanodots. Chem. Mater. 2018, 30, 1878–1887. [Google Scholar] [CrossRef]
  24. Bartolomei, B.; Prato, M. The Importance of the Purification Step and the Characterization of the Products in the Synthesis of Carbon Nanodots. Small 2023, 19, 2206714. [Google Scholar] [CrossRef] [PubMed]
  25. Veloso, A.D.; Ferraria, A.M.; Botelho do Rego, A.M.; Viana, A.S.; Fernandes, A.J.S.; Fielding, A.J.; Videira, R.A.; Oliveira, M.C. Structural Effects Induced by Dialysis-Based Purification of Carbon Nanomaterials. Nano Mater. Sci. 2024, 6, 475–483. [Google Scholar] [CrossRef]
  26. Florentino-Madiedo, L.; Díaz-Faes, E.; Barriocanal, C. Relationship between gCN Structure and Photocatalytic Water Splitting Efficiency. Carbon 2022, 187, 462–476. [Google Scholar] [CrossRef]
  27. Vega, M.F.; Díaz-Faes, E.; Barriocanal, C. Nanocarbon Modified Carbon Nitride for Improved Photocatalytic H2 Production. FlatChem 2025, 51, 100876. [Google Scholar] [CrossRef]
  28. Mintz, K.J.; Zhou, Y.; Leblanc, R.M. Recent Development of Carbon Quantum Dots Regarding Their Optical Properties, Photoluminescence Mechanism, and Core Structure. Nanoscale 2019, 11, 4634–4652. [Google Scholar] [CrossRef] [PubMed]
  29. Wang, H.; Wang, B.; Bian, Y.; Dai, L. Enhancing Photocatalytic Activity of Graphitic Carbon Nitride by Codoping with P and C for Efficient Hydrogen Generation. ACS Appl. Mater. Interfaces 2017, 9, 21730–21737. [Google Scholar] [CrossRef] [PubMed]
  30. Xu, Q.; Cheng, B.; Yu, J.; Liu, G. Making Co-Condensed Amorphous Carbon/g-C3N4 Composites with Improved Visible-Light Photocatalytic H2-Production Performance Using Pt as Cocatalyst. Carbon 2017, 118, 241–249. [Google Scholar] [CrossRef]
  31. Mou, Z.; Lu, C.; Yu, K.; Wu, H.; Zhang, H.; Sun, J.; Zhu, M.; Cynthia Goh, M. Chemical Interaction in Nitrogen-Doped Graphene Quantum Dots/Graphitic Carbon Nitride Heterostructures with Enhanced Photocatalytic H2 Evolution. Energy Technol. 2019, 7, 1800589. [Google Scholar] [CrossRef]
  32. Cao, Y.; Sheng, L.; Cheng, H.; Wang, C.; Sun, Y.; Fu, Q. In Situ Synthesis of Metal-Free N-GQD@g-C3N4 Photocatalyst for Enhancing Photocatalytic Activity. Micro Nano Lett. 2021, 16, 77–82. [Google Scholar] [CrossRef]
  33. Ge, L.; Han, C. Synthesis of MWNTs/g-C3N4 Composite Photocatalysts with Efficient Visible Light Photocatalytic Hydrogen Evolution Activity. Appl. Catal. B Environ. 2012, 117–118, 268–274. [Google Scholar] [CrossRef]
  34. Antil, B.; Elkasabi, Y.; Strahan, G.D.; Vander Wal, R.L. Development of Graphitic and Non-Graphitic Carbons Using Different Grade Biopitch Sources. Carbon 2025, 232, 119770. [Google Scholar] [CrossRef]
  35. Zhang, L.; Zhang, J.; Xia, Y.; Xun, M.; Chen, H.; Liu, X.; Yin, X. Metal-Free Carbon Quantum Dots Implant Graphitic Carbon Nitride: Enhanced Photocatalytic Dye Wastewater Purification with Simultaneous Hydrogen Production. IJMS 2020, 21, 1052. [Google Scholar] [CrossRef] [PubMed]
  36. Li, Y.; Xu, X.; Wang, J.; Luo, W.; Zhang, Z.; Cheng, X.; Wu, J.; Yang, Y.; Chen, G.; Sun, S.; et al. Post-Redox Engineering Electron Configurations of Atomic Thick C3N4 Nanosheets for Enhanced Photocatalytic Hydrogen Evolution. Appl. Catal. B Environ. 2020, 270, 118855. [Google Scholar] [CrossRef]
  37. Fang, L.J.; Wang, X.L.; Zhao, J.J.; Li, Y.H.; Wang, Y.L.; Du, X.L.; He, Z.F.; Zeng, H.D.; Yang, H.G. One-Step Fabrication of Porous Oxygen-Doped g-C3N4 with Feeble Nitrogen Vacancies for Enhanced Photocatalytic Performance. Chem. Commun. 2016, 52, 14408–14411. [Google Scholar] [CrossRef] [PubMed]
  38. Li, K.; Su, F.-Y.; Zhang, W.-D. Modification of G-C3N4 Nanosheets by Carbon Quantum Dots for Highly Efficient Photocatalytic Generation of Hydrogen. Appl. Surf. Sci. 2016, 375, 110–117. [Google Scholar] [CrossRef]
  39. Li, Q.; Zhang, L.; Liu, J.; Zhou, J.; Jiao, Y.; Xiao, X.; Zhao, C.; Zhou, Y.; Ye, S.; Jiang, B.; et al. Porous Carbon Nitride Thin Strip: Precise Carbon Doping Regulating Delocalized π-Electron Induces Elevated Photocatalytic Hydrogen Evolution. Small 2021, 17, 2006622. [Google Scholar] [CrossRef] [PubMed]
  40. Wang, S.; Chen, L.; Zhao, X.; Zhang, J.; Ao, Z.; Liu, W.; Wu, H.; Shi, L.; Yin, Y.; Xu, X.; et al. Efficient Photocatalytic Overall Water Splitting on Metal-Free 1D SWCNT/2D Ultrathin C3N4 Heterojunctions via Novel Non-Resonant Plasmonic Effect. Appl. Catal. B Environ. 2020, 278, 119312. [Google Scholar] [CrossRef]
  41. Wang, J.; Song, J.; Kang, X.; Wang, D.; Tian, C.; Zhang, Q.; Zhao, H.; Liu, J. Carbon Dots Anchoring Single-Atom Pt on C3N4 Boosting Photocatalytic Hydrogen Evolution. Molecules 2024, 29, 1890. [Google Scholar] [CrossRef] [PubMed]
  42. Zhu, S.; Song, Y.; Zhao, X.; Shao, J.; Zhang, J.; Yang, B. The Photoluminescence Mechanism in Carbon Dots (Graphene Quantum Dots, Carbon Nanodots, and Polymer Dots): Current State and Future Perspective. Nano Res. 2015, 8, 355–381. [Google Scholar] [CrossRef]
  43. Chen, C.-Y.; Tsai, Y.-H.; Chang, C.-W. Evaluation of the Dialysis Time Required for Carbon Dots by HPLC and the Properties of Carbon Dots after HPLC Fractionation. New J. Chem. 2019, 43, 6153–6159. [Google Scholar] [CrossRef]
  44. Gonzalez-Vera, A.S.; Pineda-Arellano, C.A.; Ramírez-Monroy, A.; Matos, J.; Chazaro-Ruiz, L.F.; Rangel-Mendez, J.R.; Ania, C.O. Influence of the Sequential Purification of Biomass-Derived Carbon Dots on Their Colloidal and Optical Properties. Carbon Trends 2025, 19, 100460. [Google Scholar] [CrossRef]
  45. Mintz, K.J.; Bartoli, M.; Rovere, M.; Zhou, Y.; Hettiarachchi, S.D.; Paudyal, S.; Chen, J.; Domena, J.B.; Liyanage, P.Y.; Sampson, R.; et al. A Deep Investigation into the Structure of Carbon Dots. Carbon 2021, 173, 433–447. [Google Scholar] [CrossRef]
  46. Zhou, S.; Sui, Y.; Zhu, X.; Sun, X.; Zhuo, S.; Li, H. Study and Comparison on Purification Methods of Multicolor Emission Carbon Dots. Chem.–Asian J. 2021, 16, 348–354. [Google Scholar] [CrossRef] [PubMed]
  47. Zhang, M.; Long, X.; Ma, Y.; Wu, S. Re-Discussion on the Essence of the Ultra-Bright Fluorescent Carbon Dots Synthesized by Citric Acid and Ethylenediamine. Opt. Mater. 2023, 135, 113311. [Google Scholar] [CrossRef]
  48. Nizam, N.U.M.; Hanafiah, M.M.; Mahmoudi, E.; Mohammad, A.W. Synthesis of Highly Fluorescent Carbon Quantum Dots from Rubber Seed Shells for the Adsorption and Photocatalytic Degradation of Dyes. Sci. Rep. 2023, 13, 12777. [Google Scholar] [CrossRef] [PubMed]
  49. Dhenadhayalan, N.; Lin, K.-C.; Suresh, R.; Ramamurthy, P. Unravelling the Multiple Emissive States in Citric-Acid-Derived Carbon Dots. J. Phys. Chem. C 2016, 120, 1252–1261. [Google Scholar] [CrossRef]
  50. Zhou, Y.; Desserre, A.; Sharma, S.K.; Li, S.; Marksberry, M.H.; Chusuei, C.C.; Blackwelder, P.L.; Leblanc, R.M. Gel-like Carbon Dots: Characterization and Their Potential Applications. ChemPhysChem 2017, 18, 890–897. [Google Scholar] [CrossRef] [PubMed]
  51. Li, H.; Kang, Z.; Liu, Y.; Lee, S.-T. Carbon Nanodots: Synthesis, Properties and Applications. J. Mater. Chem. 2012, 22, 24230–24253. [Google Scholar] [CrossRef]
  52. Krishna Saraswat, S.; Ahmed Mustafa, M.; Kamil Ghadir, G.; Kaur, M.; Guamán Lozada, D.F.; Hasen Shuhata Alubiady, M.; Muzahem Al-Ani, A.; Alshahrani, M.Y.; Kadhem Abid, M.; Salih Jumaa, S.; et al. Carbon Quantum Dots: A Comprehensive Review of Green Synthesis, Characterization and Investigation Their Applications in Bioimaging. Inorg. Chem. Commun. 2024, 162, 112279. [Google Scholar] [CrossRef]
  53. Mehta, V.N.; Jha, S.; Singhal, R.K.; Kailasa, S.K. Preparation of Multicolor Emitting Carbon Dots for HeLa Cell Imaging. New J. Chem. 2014, 38, 6152–6160. [Google Scholar] [CrossRef]
  54. Sim, L.C.; Wong, J.L.; Hak, C.H.; Tai, J.Y.; Leong, K.H.; Saravanan, P. Sugarcane Juice Derived Carbon Dot–Graphitic Carbon Nitride Composites for Bisphenol A Degradation under Sunlight Irradiation. Beilstein J. Nanotechnol. 2018, 9, 353–363. [Google Scholar] [CrossRef] [PubMed]
  55. Qu, D.; Zheng, M.; Zhang, L.; Zhao, H.; Xie, Z.; Jing, X.; Haddad, R.E.; Fan, H.; Sun, Z. Formation Mechanism and Optimization of Highly Luminescent N-Doped Graphene Quantum Dots. Sci. Rep. 2014, 4, 5294. [Google Scholar] [CrossRef] [PubMed]
  56. Da Silva Pinto, T.; Ferreira, A.H.; Taborda, N.C.; De Mesquita, J.P.; Fraga Freitas, E.T.; Do Amparo, S.Z.S.; Soares, E.A.; Donnici, C.L.; De Paula, E.L.; Pereira, F.V. Structure-Property Relationship between Different Molecular Precursors and the Final Properties of Carbon Dots: Preparation, Characterization and Applications as Sensors for Metal Ions. Opt. Mater. 2024, 156, 115999. [Google Scholar] [CrossRef]
  57. Wong, K.T.; Jang, S.B.; Saravanan, P.; Nah, I.W.; Park, S.; Choi, J.; Park, C.; Kim, Y.; Yoon, Y.; Jang, M. Critical Insight on the Hydrothermal Effects toward Exfoliation of G-C3N4 and Simultaneous in-Situ Deposition of Carbon Quantum Dots. Appl. Surf. Sci. 2019, 471, 703–713. [Google Scholar] [CrossRef]
  58. Schneider, J.; Reckmeier, C.J.; Xiong, Y.; Von Seckendorff, M.; Susha, A.S.; Kasák, P.; Rogach, A.L. Molecular Fluorescence in Citric Acid-Based Carbon Dots. J. Phys. Chem. C 2017, 121, 2014–2022. [Google Scholar] [CrossRef]
  59. Zhang, J.; Li, Y.; Zhao, X.; Zhang, H.; Wang, L.; Chen, H.; Wang, S.; Xu, X.; Shi, L.; Zhang, L.-C.; et al. A Hydrogen-Initiated Chemical Epitaxial Growth Strategy for In-Plane Heterostructured Photocatalyst. ACS Nano 2020, 14, 17505–17514. [Google Scholar] [CrossRef] [PubMed]
  60. Xiang, Q.; Yu, J.; Jaroniec, M. Preparation and Enhanced Visible-Light Photocatalytic H2-Production Activity of Graphene/C3N4 Composites. J. Phys. Chem. C 2011, 115, 7355–7363. [Google Scholar] [CrossRef]
  61. Liang, Q.; Li, Z.; Huang, Z.-H.; Kang, F.; Yang, Q.-H. Holey Graphitic Carbon Nitride Nanosheets with Carbon Vacancies for Highly Improved Photocatalytic Hydrogen Production. Adv. Funct. Mater. 2015, 25, 6885–6892. [Google Scholar] [CrossRef]
  62. Liu, E.; Lin, X.; Hong, Y.; Yang, L.; Luo, B.; Shi, W.; Shi, J. Rational Copolymerization Strategy Engineered C Self-Doped g-C3N4 for Efficient and Robust Solar Photocatalytic H2 Evolution. Renew. Energy 2021, 178, 757–765. [Google Scholar] [CrossRef]
Figure 1. Photocatalytic H2 evolution of photocatalysts (CN and CN/CD-180-Xh) for the first 4 h (a). Comparison of the H2 evolution rate of photocatalysts (b). Stability tests corresponding to sample CN/CD-180-1h. Different colors represent consecutive photocatalytic runs (c).
Energies 19 03332 g001
Figure 2. XRD patterns of the CN and the composites (CN/CD-180-Xh) and inset of the 27.7° peak.
Energies 19 03332 g002
Figure 3. N2-sorption isotherms (a) and pore size distribution (b) for CN and CN/CD-180-Xh samples.
Energies 19 03332 g003
Figure 4. TEM image of CN/CD-180-24h. Red circles enclose the CDs attached to the CN.
Energies 19 03332 g004
Figure 5. UV–vis diffuse reflectance spectra of CN, CN/CD-180-1h, and CN/CD-180-24h (a) and CN, CN/CD-180-48h, and CN/CD-180-72h (b). Band gap energy (Eg) determination from the Tauc plot of CN, CN/CD-180-1h, and CN/CD-180-24h (c) and CN, CN/CD-180-48h, and CN/CD-180-72h (d).
Energies 19 03332 g005
Figure 6. PL emission spectra of CN/CD-180-Xh.
Energies 19 03332 g006
Figure 7. Nyquist plot of CN and CN/CD-180-1h.
Energies 19 03332 g007
Figure 8. TEM images and size distribution of the CDs. (a) CD-180-1h (b) CD-180-24h (c) CD-180-48h (d) Histogram of CD-180-24h. Histogram was made by counting 300 particles in the TEM images.
Energies 19 03332 g008
Figure 9. DTG curves for the samples: CD-180-1h, CD-180-24h, CD-180-48h, and CD-180-72h. The dashed lines define: (I) 0–100 °C; (II) 100–200 °C; (III) 200–320 °C; (IV) 320–800 °C.
Energies 19 03332 g009
Figure 10. FTIR spectra of the samples CD-180-1h, CD-180-24h, CD-180-48h, and CD-180-72h.
Energies 19 03332 g010
Figure 11. Deconvolution of C1s of (a) CD-180-1h, (b) CD-180-24h, (c) CD-180-48h and (d) CD-180-72h. The black line represents the experimental data, the cyan line corresponds to the overall fit, the dark yellow line represents the Shirley background. The deconvolute component peaks correspond to: C-C/C=C (red), C-O/C-N (blue), C=O (green), and O-C=O (purple).
Energies 19 03332 g011
Figure 12. UV–vis spectra of CD-180-Xh. The asterisk denotes the anti-bonding orbital corresponding to the n-π* and π-π* transitions.
Energies 19 03332 g012
Table 1. SBET, total pore volume, and peak pore size of CN and CN/CD-180-Xh samples.
SBET (m2/g)Total Pore Volume (cm3/g) aVmeso BJH (cm3/g)Peak Pore Size (nm)
CN710.2220.15552
CN/CD-180-1h620.2460.16552
CN/CD-180-24h620.2390.15754
CN/CD-180-48h640.2360.14949
CN/CD-180-72h630.2240.08953
a Total pore volume determined at p/po of ~0.975.
Table 2. Elemental analysis and atomic ratio C/N for the CDs synthesized at 180 °C with different dialysis times.
Carbon (wt.% db a)Hydrogen (wt.% db a)Nitrogen (wt.% db a)Oxygen (wt.% db a)C/N b (%)
CD-180-1h51.74.89.933.16.10
CD-180-24h48.24.79.036.76.24
CD-180-48h52.04.89.634.06.35
CD-180-72h50.74.88.835.86.76
a Dry basis b Atomic ratio.
Disclaimer/Publisher’s Note: The statements, opinions and data contained in all publications are solely those of the individual author(s) and contributor(s) and not of MDPI and/or the editor(s). MDPI and/or the editor(s) disclaim responsibility for any injury to people or property resulting from any ideas, methods, instructions or products referred to in the content.