Article

Integrated Reactor-State Descriptors for Predicting Electrical Output in Kefir-Derived Microbial Fuel Cells

by
Samuel Valle-Asan
*,
Carlos Bastidas-Sánchez
,
Martin Villalva-Vera
,
Gustavo Vaca-Triviño
and
Miguel Ángel Reinoso
*
Facultad de Ciencias e Ingenierías, Universidad Estatal de Milagro, Milagro 091706, Ecuador
*
Authors to whom correspondence should be addressed.
Energies 2026, 19(13), 3156; https://doi.org/10.3390/en19133156
Submission received: 30 April 2026 / Revised: 22 June 2026 / Accepted: 26 June 2026 / Published: 3 July 2026
(This article belongs to the Special Issue Microbial Fuel Cells: Innovations and Applications)

Abstract

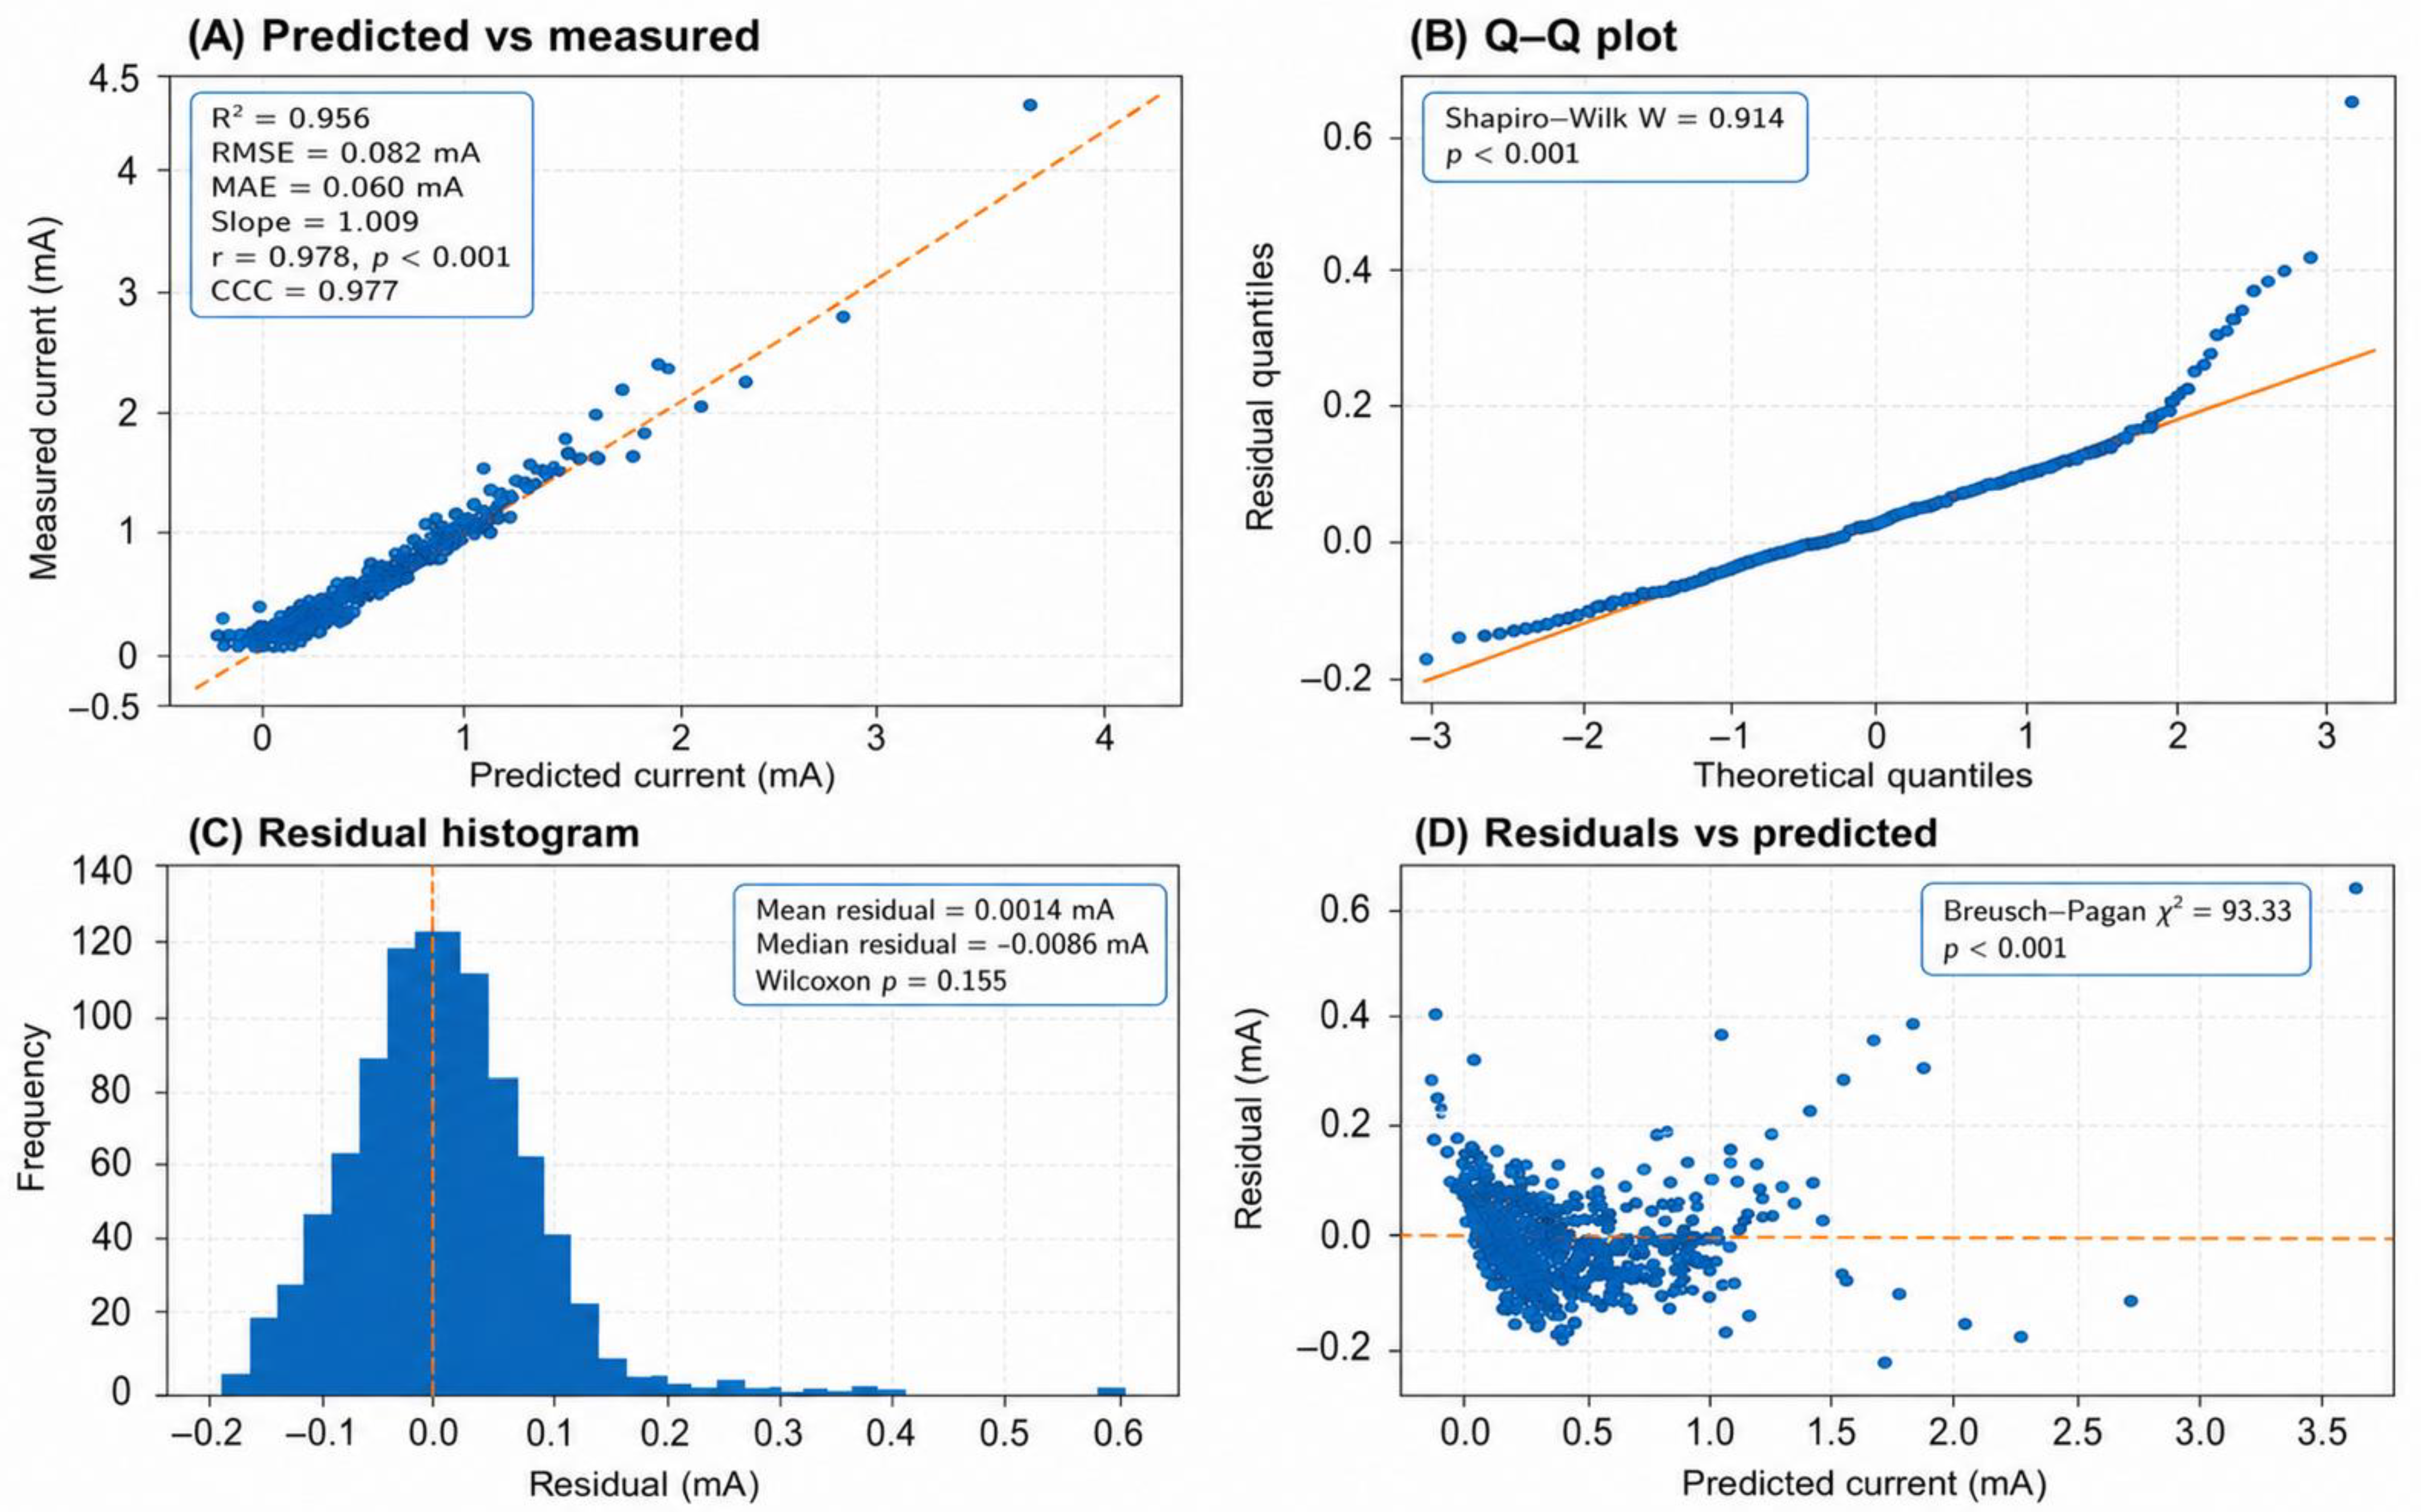
Salt-bridge kefir-derived microbial fuel cells (MFCs) provide a low-cost platform for studying fermentation-linked electrical output, but their behavior is often evaluated through isolated current or voltage traces rather than integrated reactor-state evidence. This study assessed laboratory-scale double-chamber MFCs operated under fed-batch conditions with a kefir-derived mixed consortium and molasses-based substrate. Thirty-three independent reactors, including graphite- and graphene-anode configurations, were monitored from day 0 to day 20, generating 693 reactor-day observations. Electrical, redox, temperature, substrate-related, UV–Vis soluble-phase, baseline sequencing, endpoint SEM, FTIR functional-group evidence, and semimechanistic descriptors were integrated to diagnose reactor evolution and predict fixed-condition current output. Current declined from 0.8985 to 0.1133 mA, residual glucose-equivalent decreased from 5.3124 to 0.0127 g L−1, and the glucose-consumption fraction reached 0.9977. Fixed-condition apparent power decreased from 0.8636 to 0.0856 mW, while cumulative charge and cumulative apparent energy averaged 595.02 C and 456.69 J per reactor. FTIR bands supported carbohydrate/EPS, organic-acid, and proteinaceous-matrix signatures consistent with a fermentation–redox–biofilm cascade. The random-forest model showed strong grouped cross-validation performance (R2 = 0.956, RMSE = 0.082 mA, MAE = 0.060 mA, slope = 1.009, r = 0.978). This work supports state-aware current and fixed-condition power-output prediction in kefir-driven MFCs without claiming maximum power-density or complete electrochemical characterization.

1. Introduction

Kefir is a consortium-driven fermentation ecosystem rather than a single microbial inoculant or a fixed functional product. Its functional relevance arises from the coexistence of lactic acid bacteria, yeasts, acetic bacteria, and associated minor guilds that collectively transform substrates into a dynamic soluble extracellular phase [1,2]. This phase is not chemically static; instead, it changes with microbial succession, nutrient accessibility, and environmental constraints. Accordingly, kefir should be viewed as a temporally organized biochemical system whose output depends on community interactions rather than on a single dominant microorganism.
This interpretation is supported by sequencing-based and time-resolved studies showing that kefir grains and derived beverages contain heterogeneous but reproducible bacterial and yeast assemblages embedded in a polysaccharide-rich matrix [3], and that these communities undergo ordered succession during fermentation [4]. Such temporal plasticity is especially relevant here because it implies that kefir can sustain state-dependent biochemical outputs under controlled reactor conditions. This point becomes even more important in non-dairy and sugar-rich alternative matrices, where kefir consortia can preserve mixed microbial functionality beyond conventional milk fermentation [5]. In the present study, this flexibility is central because the system was evaluated not as a food fermentation but as a molasses-fed bioelectrochemical platform.
Among the extracellular components associated with kefir systems, kefiran and related exopolysaccharides are especially relevant because they connect biochemical output with structural organization [6]. Likewise, extracellular polymeric substances (EPS) producing lactobacilli from kefir grains influence the rheological and structural behavior of fermented systems [7]. In reactor terms, these extracellular polymers may contribute to adhesion, diffusion barriers, interfacial stabilization, and soluble-phase retention once the system is coupled to an electrode. Kefir fermentation is also characterized by the progressive generation of peptide-rich soluble fractions. Proteomic studies have shown that fermentation-dependent soluble-phase restructuring [8] and targeted manipulation of the proteolytic system of Lactococcus lactis have further linked proteolysis to functionally relevant output [9]. In the present context, this literature does not serve to claim direct compound identification from bulk absorbance measurements; rather, it supports the interpretation that the soluble phase of a kefir-derived system can undergo real compositional restructuring during operation, including changes associated with peptide release, proteolysis, and aromatic-rich metabolites.
The redox dimension of that restructuring is equally important. In lactic acid bacteria such as Lactococcus lactis, glutathione-mediated protection improves oxidative-stress tolerance, illustrating how intracellular and extracellular redox buffering can shape fermentation resilience and metabolic stability [10]. Once a mixed kefir-derived community is placed in a bioelectrochemical reactor, such effects are no longer governed only by conventional fermentation parameters. They become linked to the presence of an anodic electron sink and to the evolving physicochemical state of the chamber. For that reason, kefir-driven microbial fuel cells should not be interpreted through a simple substrate-to-current narrative, but through the coupled progression of fermentation, redox balance, extracellular restructuring, and interfacial development.
This is precisely the conceptual domain of microbial fuel cells (MFCs). Classical microbial electrochemistry established that current generation depends on the ability of microorganisms to transfer electrons, directly or indirectly, to an electrode [11]. Subsequent work showed that extracellular electron transfer can be interpreted within a bioelectrochemical redox framework [12,13]. In mixed-consortium systems, this relationship becomes more complex because fermentative and non-fermentative guilds coexist, soluble redox-active compounds may accumulate, and the anodic environment acts as a selective constraint on the overall metabolic state. Under these conditions, the reactor must be interpreted as a bioelectrochemical ecosystem rather than as hardware with microbes simply added to it.
Redox mediators extend this perspective because they can reshape microbial electron-disposal routes and alter the relationship between substrate conversion and current generation [14]. This broader view is aligned with electro-fermentation, in which electrodes modulate fermentation through oxidative or reductive control of the microbial environment [15,16]. Within this framework, the electrode is not merely a passive electron collector, but part of the environment that shapes redox balance, metabolite partitioning, and microbial interactions. This concept is especially useful here because it provides a coherent basis for understanding why a kefir-derived consortium may display coupled changes in substrate-use proxies, UV–visible fingerprints, and electrical output during fed-batch operation.
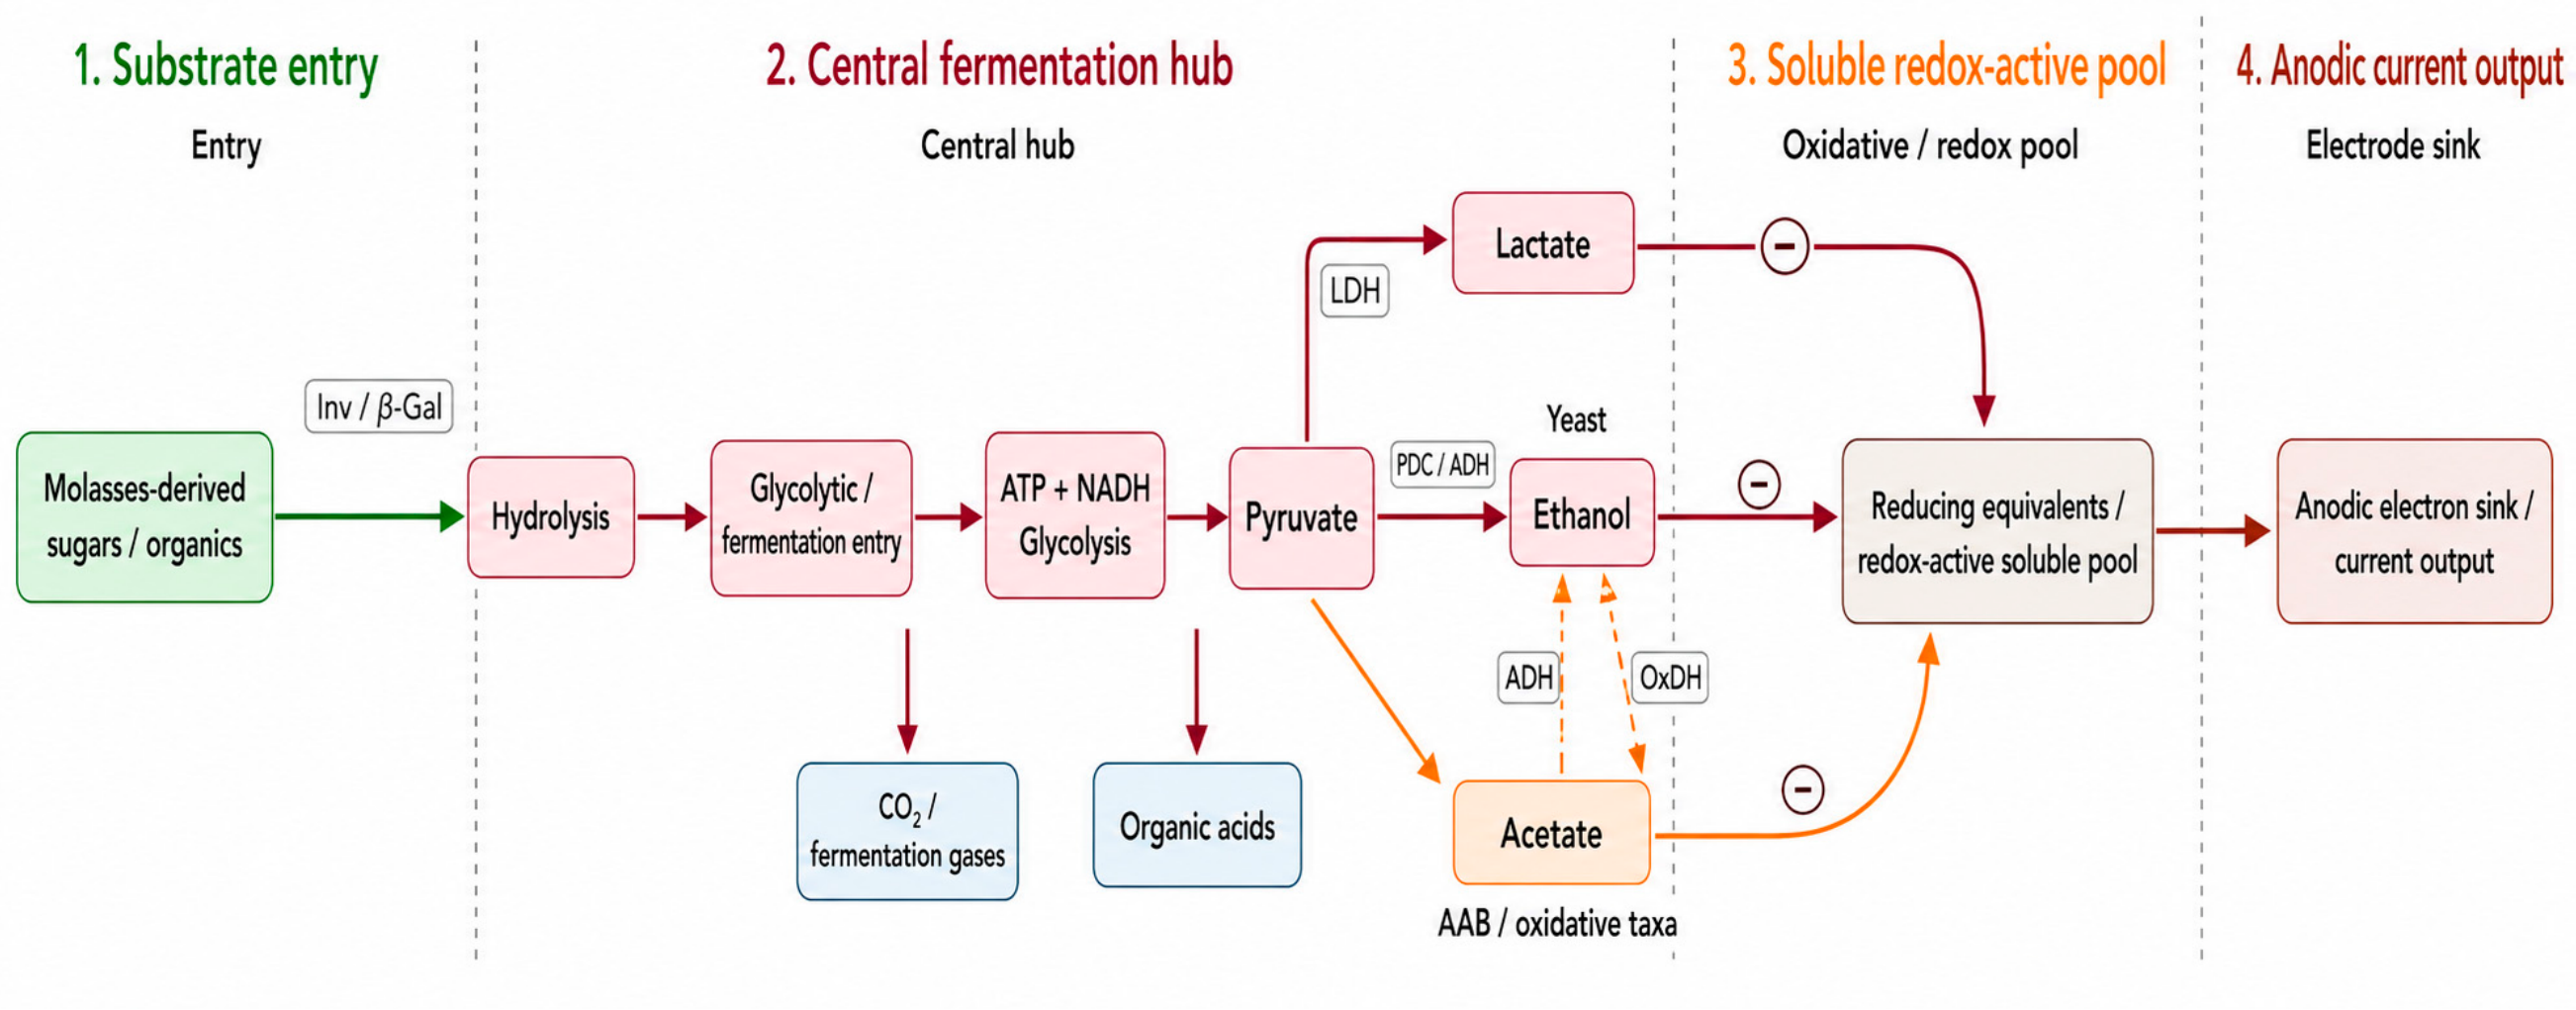
The reactor logic explored in this manuscript is summarized in Figure 1 as a conceptual operational framework rather than as direct mechanistic proof of a specific extracellular electron-transfer pathway. Kefir was treated as a mixed fermentation ecosystem because previous studies describe kefir grains and kefir-derived beverages as polymicrobial systems composed of lactic acid bacteria, yeasts, acetic/oxidative bacteria, and other associated taxa that may undergo temporal succession during fermentation [1,2,3,4,5]. The extracellular soluble phase was included in the framework because kefir-associated exopolysaccharides, matrix-forming components, and fermentation-derived peptides can contribute to extracellular restructuring, although the present ultraviolet–visible measurements were used only as operational soluble-phase proxies and not as compound-specific identification [6,7,8,9]. Redox context was incorporated because fermentative microorganisms can display redox-buffering behavior that affects metabolic stability under changing environmental conditions [10]. Finally, the connection between fermentation-derived reducing equivalents and the anodic compartment was framed using microbial fuel cell, redox mediator, and electro-fermentation literature, where electrodes can operate as electron sinks and may influence microbial redox balance through direct or indirect extracellular electron-transfer processes [11,12,13,14,15,16] (Table 1).
Therefore, Figure 1 should be interpreted as an analytical map of reactor-state progression, not as evidence that a single taxon, metabolite, or electron-transfer route controlled the measured current.
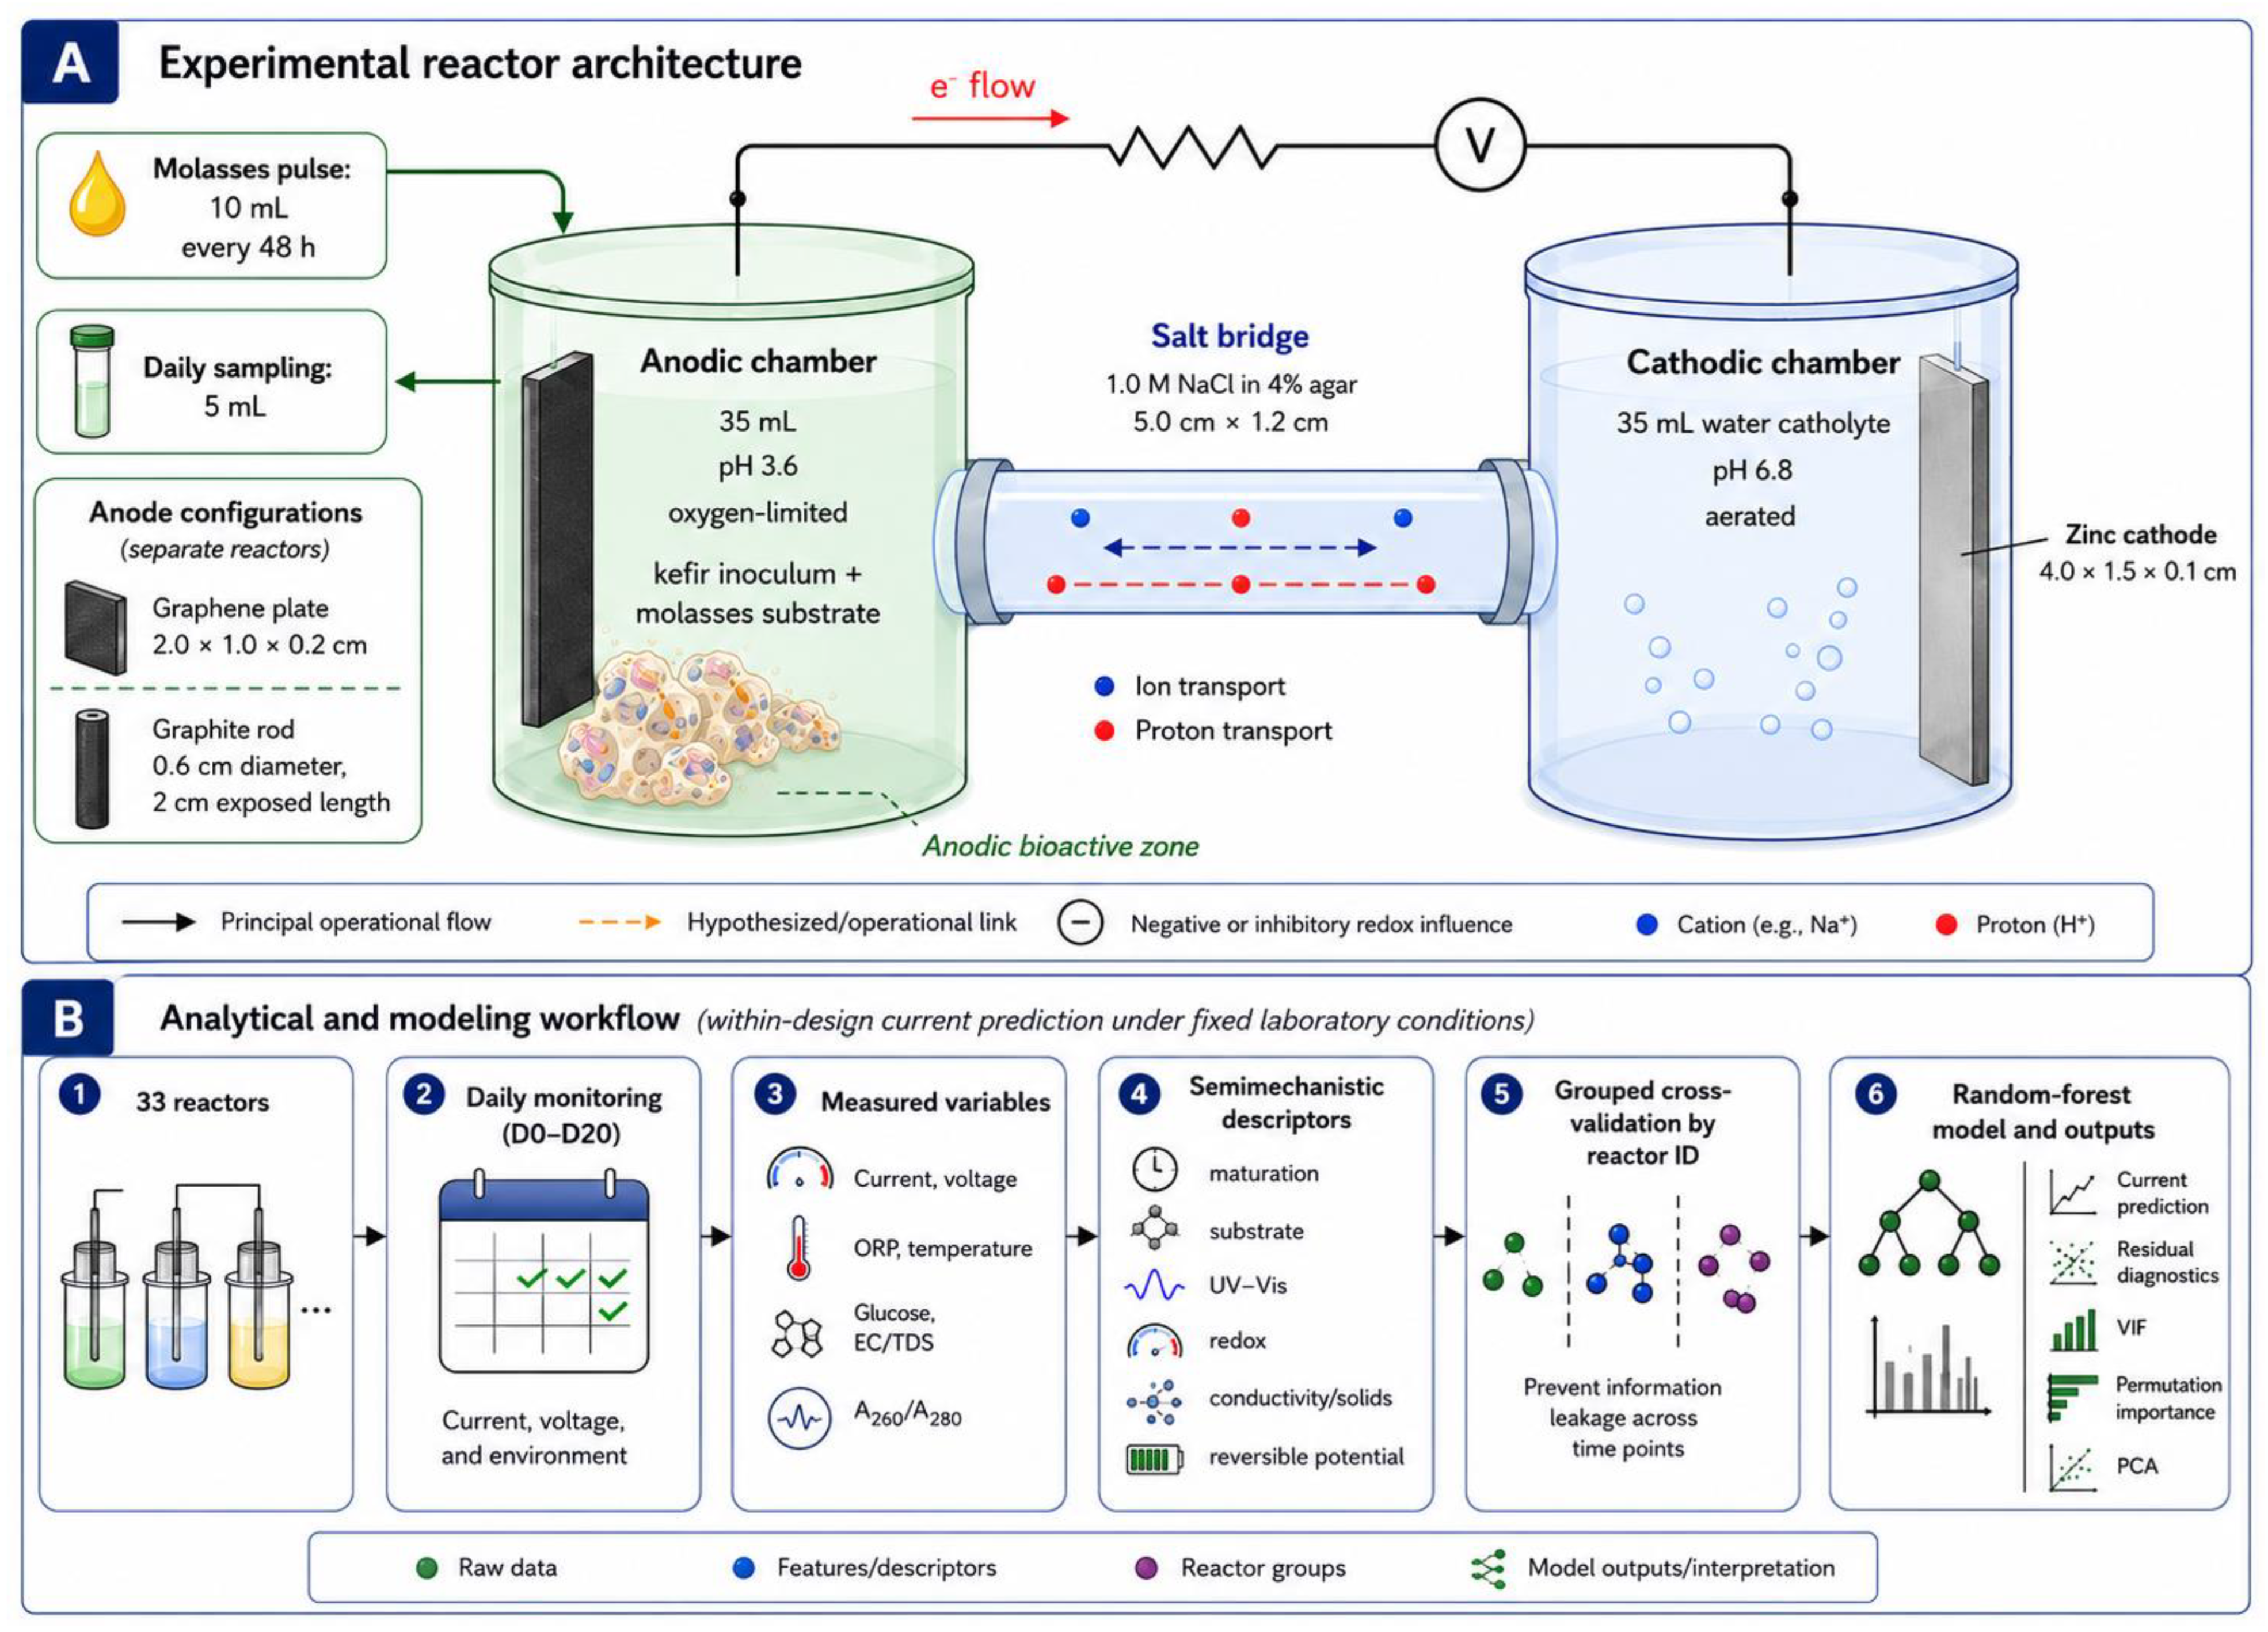
The physical implementation of the conceptual framework is summarized in Figure 2, which integrates the experimental reactor architecture with the analytical workflow used for current-output prediction. A double-chamber microbial fuel cell was selected because this configuration physically separates the fermentation-driven anodic compartment from the aerated cathodic compartment while maintaining electrochemical communication through ionic migration across the salt bridge [17,18]. This separation is advantageous for kefir-driven systems because it permits oxygen limitation in the anode, independent cathodic aeration, standardized cathode conditions, and controlled evaluation of anode configuration as the only intentionally varied structural factor. Accordingly, graphene and graphite were evaluated in separate reactors under the same fed-batch regime, sampling schedule, salt-bridge geometry, cathodic architecture, and measurement conditions. Figure 2 also summarizes the reduced analytical workflow used to convert daily reactor monitoring into semimechanistic descriptors and random-forest-based current prediction under grouped validation by reactor identity. Thus, the figure links the physical cell design to the modeling strategy while clarifying that the model was developed for within-design current prediction under fixed laboratory conditions, rather than for universal electrochemical performance estimation.
Within that configuration, the role of the anode cannot be reduced to its nominal material name. Carbon-electrode behavior depends on surface properties, startup colonization, attachment dynamics, porosity, conductivity, and the interaction between surface/interface structure and microbial development [19,20]. However, in a mixed kefir-driven system, the central question is not simply whether graphite or graphene performs better in isolation. Rather, it is whether the dominant source of variation arises from nominal anode category or from the shared temporal progression of reactor state.
The motivation for this study is the need for low-cost diagnostic and predictive tools for microbial fuel cells in which complete electrochemical characterization is not always available during exploratory screening. In many low-cost reactor studies, current, substrate depletion, redox conditions, and optical soluble-phase changes are reported as separate outcomes, which limits interpretation of the reactor as an integrated evolving system. Here, salt-bridge kefir-driven microbial fuel cells were examined as time-dependent reactor-state systems operating under a shared fed-batch regime. The novelty of the work lies in integrating time-resolved electrical, redox, substrate-related, and ultraviolet–visible variables with baseline biological context, endpoint morphological evidence, FTIR functional-group support, and semimechanistic descriptors into a single framework for predicting current output under fixed laboratory-scale conditions. Anode configuration was retained as a controlled structural factor, but the central aim was to determine whether current evolution was better explained by the coordinated progression of reactor state than by anode category alone. From a sustainability perspective, the evaluated configuration is relevant because it combines a mixed kefir-derived consortium, a molasses-based substrate, and low-cost reactor monitoring into a screening-oriented bioelectrochemical platform. The aim is not to claim optimized power production, but to determine whether inexpensive electrical, physicochemical, and optical measurements can be integrated into a reproducible diagnostic framework for early-stage microbial fuel cell evaluation. This distinction is important because sustainable MFC development requires not only improved electrode or reactor materials, but also low-cost monitoring strategies capable of identifying productive, depleted, and transition states before more resource-intensive electrochemical assays are performed.

2. Materials and Methods

2.1. Experimental Design and Analytical Framework

This study was designed as a controlled comparative bioelectrochemical experiment using kefir-driven microbial fuel cells operated under a shared fed-batch regime and monitored longitudinally over 20 consecutive days. The experimental objective was to determine whether the temporal evolution of current generation and reactor behavior was better explained by integrated physicochemical, UV-visible, and semimechanistic process descriptors than by anode category/configuration alone. To preserve interpretability, the design was restricted to a single reactor-level comparison axis, namely anode configuration, while all other reactor components, feeding conditions, measurement procedures, and operating settings were kept constant across units.
A total of 33 independent microbial fuel cells were assembled and monitored, including 16 reactors equipped with graphite anodes and 17 reactors equipped with graphene anodes. Daily measurements were performed from day 0 to day 20, yielding 21 observation points per reactor and a total analytical matrix of 693 time-resolved observations. The experimental logic followed established methodological principles for dual-chamber microbial fuel cell operation, including anodic oxygen limitation, fixed cathodic architecture, identical external circuit conditions, and repeated monitoring under constant operating settings [21,22,23]. To address reproducibility of the reactor configuration, the technical design and operational standardization of the experimental system are summarized in Table 2. The table distinguishes between fixed components, such as chamber configuration, salt-bridge connection, cathodic architecture, working volumes, feeding schedule, and monitoring conditions, and the only intentionally varied structural factor, namely anode configuration. Graphite and graphene anodes were used in separate reactors and should therefore be interpreted as two operational anode configurations rather than as a strict material-only benchmark.

2.2. Salt-Bridge Double-Chamber Microbial Fuel Cell Configuration and Anode Surface Normalization

All units were assembled as salt-bridge double-chamber microbial fuel cells, replacing the earlier low-cost PEM terminology. This modification was necessary because the present reactor system did not rely on a polymer electrolyte membrane, but on an interchamber ionic connector consisting of a porous cellulosic matrix impregnated with electrolyte solution. This separator was positioned between the anodic and cathodic chambers to facilitate ion transport and preserve electroneutrality during reactor operation. The double-chamber architecture was selected because it enables physical separation of the anodic and cathodic compartments while maintaining charge balance through ionic migration, which is a well-established configuration in microbial fuel cell research [21,24,25]. To avoid separator-related variability, the composition, dimensions, and placement of the electrolyte-impregnated cellulosic bridge were kept identical across all reactors.
The anodic chamber served as the fermentation-driven bioelectrochemical compartment and received the kefir-derived inoculum together with the molasses-based substrate. The cathodic chamber operated as the oxidant-side compartment and contained a zinc cathode in all units. Cathode configuration, immersion conditions, and relative positioning were standardized throughout the entire experimental set. Therefore, anode material represented the only intentionally varied structural factor among reactors.
Two carbon-based anode materials were compared, namely graphite and graphene, since carbonaceous electrodes remain widely used in MFC research due to their electrical conductivity, chemical stability, and compatibility with microbial adhesion and biofilm formation. However, the two anodes differed not only in material identity but also in macroscopic geometry. The graphene anode was used as a flat porous plate, normalized to a projected area of 2 cm2, expressed as:
A proj , graphene = 2   c m 2
By contrast, the graphite anode consisted of a cylindrical rod with an exposed length of 2 cm. For this electrode, the geometric exposed area depended on the cylinder diameter ( d ) and exposed length ( L ). When only the lateral surface was exposed to the anodic medium, the area was defined as:
A graphite , lateral = π d L
and when both circular ends were also exposed, the total geometric area was:
A graphite , total = π d L + 2 π d 2 2
where L = 2 cm and d corresponds to the graphite rod diameter. Thus, whereas the graphene electrode was normalized by projected planar footprint, the graphite electrode was dimensionally defined by cylindrical geometry.
Because the graphene plate exhibited a porous and irregular architecture rather than a compact planar surface, projected-area normalization alone was insufficient to represent the biologically accessible interface of the anode. In contrast to the graphite rod, whose external dimensions permitted straightforward geometrical estimation, the graphene electrode contained pores, cavities, and roughened domains that increased its accessible interface beyond its nominal 2 cm2 footprint. Accordingly, the real accessible area of the graphene electrode was expected to exceed its projected value:
A real , graphene > A proj , graphene
Since direct surface-area quantification by BET, double-layer capacitance, or related methods was not performed, a SEM-based geometrical approximation was introduced as a comparative morphological tool. The accessible area of the graphene anode was estimated as:
A real A proj ( 1 ϕ ) + 4 ϕ h d p R μ
where A proj is the projected area, ϕ is the visible areal porosity, h is the effective pore depth, d p is the equivalent pore diameter, and R μ is a micro-roughness correction factor associated with fine flake-like surface development. This equation was incorporated because the graphene anode offered an irregular three-dimensional surface not adequately represented by projected area alone. Therefore, it was used to support comparative interpretation of biofilm accommodation and interfacial complexity, rather than to provide an absolute electrochemical surface metrology value.
Graphite and graphene anodes were used in separate reactors, not sequentially within the same reactor. Sixteen reactors were equipped with graphite anodes, and seventeen reactors were equipped with graphene anodes. Because the two groups differed simultaneously in material identity and macroscopic geometry, the comparison was not designed as a strict material-only benchmark. Instead, graphite and graphene were treated as two operational anode configurations evaluated under identical chamber architecture, feeding schedule, cathodic condition, and monitoring procedures. Therefore, any anode-associated differences are interpreted cautiously as configuration-associated responses within the broader reactor-state framework.

2.3. Inoculum Source and Anodic Inoculation

The bioelectrochemical system was inoculated with a kefir-derived microbial consortium originating from a concentrated fermentation bioreactor operated with kefir grains. Within the context of this study, the inoculum was treated as a pre-activated, microbially enriched mixed consortium rather than as a purified electroactive isolate. This approach was consistent with the analytical objective of the study, which focused on the emergence of reactor-scale process signatures, including substrate conversion, UV–visible extracellular restructuring, and current generation under fermentation-linked bioelectrochemical operation.
Each anodic chamber received 35 mL of the pre-activated kefir-derived fermentation broth. The inoculum was introduced under the same handling conditions in all reactors in order to minimize inoculation-derived variability. Because the inoculum originated from a concentrated fermentation bioreactor containing kefir grains, it was assumed to provide a dense and metabolically active mixed microbial population suitable for rapid anodic establishment. No additional lag-phase conditioning step was applied after reactor assembly; electrical monitoring started immediately after cell construction. This standardized startup procedure was important because the downstream analyses were based on repeated temporal comparisons between reactors and required that the only deliberate reactor-level difference be the anode configuration.

2.4. Substrate Formulation, Fed-Batch Operation, and Thermal Handling of the Feed

The reactors were operated in true fed-batch mode throughout the 20-day period, with substrate pulses applied every 48 h. Fed-batch operation was chosen because it offers a controlled balance between metabolic continuity and temporal contrast, allowing substrate depletion, reactor maturation, and late-phase disruption to manifest as measurable process dimensions rather than being masked by continuous-flow dilution or complete batch depletion [26,27,28].
The initial working volume of each anodic chamber was 35 mL. During operation, 5 mL analytical aliquots were withdrawn daily from the anodic chamber for monitoring and were not returned to the reactor. Every 48 h, each unit received a 10 mL pulse of freshly sterilized molasses adjusted to 12.5 °Brix after sterilization. Under this regime, the operating anodic volume did not increase cumulatively through time; instead, it oscillated within the feeding–sampling cycle and was periodically restored by substrate addition. Accordingly, the fed-batch design should be interpreted as pulse-based substrate replenishment under repeated analytical withdrawal rather than as a replacement-feed system or a strictly cumulative volume-expansion regime. This detail is methodologically relevant because reactor-state progression reflected substrate conversion under a dynamic but controlled sampling-and-feeding schedule.
Residual soluble solids measured by refractometry (°Bx) were converted to an apparent glucose-equivalent concentration G e q , t g / L using the operational expression G e q , t = 10 × ρ t × B x t × f G E , where B x t is the refractometric reading at time t , ρ t is broth density in kg/L, and f G E is the fixed conversion factor representing the fermentable-sugar fraction of the diluted molasses expressed on a glucose-equivalent basis. When density was not measured independently for the dilute reactor broth, ρ t was approximated as 1.00 kg/L. Thus, if no additional compositional correction was applied, the conversion simplifies to G e q , t 10 × B x t . Apparent consumed glucose-equivalent was then calculated as G c o n s , t = G e q , 0 G e q , t , and substrate-use fraction as ( G e q , 0 G e q , t ) / G e q , 0 . Because this variable was derived from refractometric soluble solids rather than from a glucose-specific assay, it is reported throughout the manuscript as residual glucose-equivalent concentration. Accordingly, apparent consumption and consumption fraction should be interpreted as operational substrate-state descriptors, not as direct stoichiometric glucose conversion.

2.5. Operational Conditions of the Anodic and Cathodic Compartments

Throughout the experiment, the anodic chamber was maintained as an oxygen-limited fermentation-driven bioelectrochemical compartment. The anodic units were pressure-sealed in order to restrict oxygen ingress and preserve the fermentative character of the system [21,22]. The initial anodic working volume was 35 mL, and the initial anolyte pH was 3.6. These conditions were selected to maintain a stable acidic and oxygen-restricted environment suitable for kefir-derived consortium activity and anodic interfacial development.
The cathodic compartment was kept structurally constant across all reactors and contained 35 mL of water as catholyte together with a zinc cathode. The initial catholyte pH was 6.8. In contrast to the anodic side, the cathodic chamber was aerated in order to maintain the oxidant-side environment under comparable conditions across the full reactor set. By keeping catholyte composition, cathodic volume, aeration conditions, and cathode material constant, the study minimized ambiguity in the interpretation of reactor-level differences and ensured that the downstream multivariate structure was not confounded by multiple simultaneous hardware changes.

2.6. Daily Physicochemical Monitoring

Daily monitoring of the physicochemical environment was performed to characterize the redox, thermal, ionic, and dissolved-solids background in which the kefir-driven system evolved. The principal environmental variables recorded were oxidation–reduction potential (ORP, mV), temperature (°C), electrical conductivity (EC, µS/cm), and total dissolved solids (TDS, ppm), measured using a Yieryi BLE-C600 multiparameter meter (Shenzhen Yieryi Technology Co., Ltd., Shenzhen, China). EC and TDS were included because ionic transport and dissolved-phase loading were later used as measured inputs for the integrated reactor-state descriptor system.
Daily physicochemical monitoring was necessary for two reasons. First, it provided quality control over reactor stability during the 20-day run. Second, it allowed environmental and redox context to be integrated into the broader interpretation of current generation and UV-visible changes. In the updated analytical framework, ORP and temperature were particularly important because they were later incorporated directly or indirectly into the semimechanistic descriptor space. The physicochemical variables and instrumentation are listed in Table 3.

2.7. Electrical Measurements and Standardized Circuit Conditions

This distinction is methodologically relevant. In microbial fuel cell studies, current and voltage may be monitored either for strict electrochemical characterization or for controlled comparative assessment under constant operational settings [21,23,29]. The present design followed the second logic. Voltage was recorded under open-circuit conditions using a Proskit 1225 multimeter (Prokit’s Industries Co., Ltd., New Taipei City, Taiwan). Current was measured separately by direct meter reading after a stabilization interval of 5 s. Because the current measurement was obtained instrumentally rather than derived from Ohm’s law, the 1 Ω LED resistor present in the reactor assembly was not used as the basis for current calculation.

2.8. UV-Visible Spectrophotometric Measurements

To characterize changes in the extracellular UV-active pool, daily aliquots were collected from the anodic compartment and processed for UV-visible spectrophotometry. Samples were clarified by centrifugation at 10,000× g for 10 min at 4 °C, and the resulting supernatant was transferred to 1 cm path-length UV-grade quartz cuvettes. Absorbance was measured in technical duplicate at 260 nm and 280 nm using a GENESYS 10S UV-Vis spectrophotometer (Thermo Fisher Scientific, Waltham, MA, USA; spectral range 190–1100 nm; spectral bandwidth 1.8 nm). Blank correction was performed using the corresponding sterile anolyte matrix processed under the same conditions.
The absorbance values were recorded as A 260 t and A 280 t , where t denotes sampling day. In addition to the raw absorbance variables, the absorbance ratio was calculated as:
A 260 / A 280 t = A 260 t A 280 t
In the present study, A260, A280, and A260/A280 were not used as compound-specific identifiers, but as operational descriptors of the UV-responsive soluble extracellular pool. Their analytical role was to capture directional changes in soluble-phase composition through time and to test whether those changes carried predictive value for current output when interpreted jointly with redox and maturation variables. Because current prediction was a primary objective, the UV–Vis variables were incorporated not only as descriptive fingerprints but as candidate predictor variables representing soluble-phase restructuring in the semimechanistic model.

2.9. Fourier-Transform Infrared Analysis of the Kefir-Derived Bioreactor Sample

Fourier-transform infrared spectroscopy was used as qualitative chemical support for interpreting the functional-group composition of the kefir-derived bioreactor material. A 1 mL aliquot was collected from the bioreactor using a micropipette and transferred to the ATR sampling interface according to the instrument protocol. Spectral acquisition was performed using a JASCO FT/IR-4100 type A spectrometer (JASCO International Co., Ltd., Hachioji, Tokyo, Japan) equipped with an ATR PRO450-S accessory and a TGS detector. The spectrum was acquired in transmittance mode using 80 accumulations, 16 cm−1 resolution, cosine apodization, automatic gain, and a spectral interval of approximately 3.86 cm−1. The exported spectrum covered 547.68–4003.50 cm−1 and contained 897 spectral points.
The FTIR spectrum was interpreted as bulk functional-group evidence rather than as compound-specific chemical identification. Transmittance minima were treated as relative absorption features and assigned to broad biochemical regions associated with hydroxyl-rich polysaccharides, proteinaceous and peptide-associated material, carboxylated fermentation products, phosphate-containing biomass, glycosidic structures, and extracellular matrix material. These functional-group assignments were interpreted in relation to the reported biochemical composition of sugary kefir systems, including kefiran-like exopolysaccharides, EPS-producing lactobacilli, fermentation-derived peptides, and proteolytic activity in kefir-associated or lactic-acid bacterial systems [5,6,7,8,9]. Therefore, the FTIR layer was used to support the proposed fermentation–redox–biofilm cascade, but not to infer specific enzyme activity, taxon-specific metabolism, compound identity, or direct extracellular electron-transfer pathways.

2.10. Residual Soluble Solids (°Bx-Based Proxy) Quantification and Derived Substrate-State Variables

Residual soluble solids were treated as the directly measured carbon-state proxy for each reactor and sampling day. From this operational proxy, two derived descriptors were calculated: apparent substrate consumption and substrate-use fraction:
G c o n s , t = G 0 , c G t
F G , t = G 0 , c G t G 0 , c
where G t is the residual soluble solids (°Bx-based proxy) concentration at time t , G 0 , c is the cycle-start substrate proxy value corresponding to the relevant feeding interval, G c o n s , t is the apparent substrate consumption, and F G , t is the substrate-use fraction relative to the cycle-start state. These derived variables were necessary because the study sought not only to quantify how much substrate proxy signal remained, but also to place each daily observation within a progression from substrate-rich to substrate-exhausted conditions.

2.11. Baseline Amplicon Sequencing of the Initial Inoculum

To characterize the microbial composition of the starting consortium, amplicon sequencing was performed on a single inoculum sample collected prior to reactor inoculation. This sequencing block was included exclusively as baseline biological context and was not intended to represent terminal reactor communities, material-specific end-point colonization, or within-reactor ecological succession.
Total DNA was extracted from the inoculum using a bead-beating step followed by silica-column purification with the BioExtract DNA extraction kit (Microbial Insights, Knoxville, TN, USA). DNA concentration was quantified using the Qubit dsDNA HS assay (Thermo Fisher Scientific, Waltham, MA, USA). For bacterial profiling, the V3–V4 region of the 16S rRNA gene was amplified using primers 341F/806R with Illumina overhang adapters. For fungal and yeast profiling, the ITS1 region was amplified using primers ITS1F/ITS2, also with Illumina overhang adapters. Libraries were generated using a dual-index two-step PCR workflow, purified with AMPure XP magnetic beads (Beckman Coulter, Brea, CA, USA), and sequenced on an Illumina MiSeq (Illumina, Inc., San Diego, CA, USA) platform using 2 × 300 bp paired-end chemistry [30,31].
Bioinformatic processing followed standard high-throughput amplicon analysis principles. Denoising and amplicon sequence variant inference were performed with DADA2, and downstream feature-table handling and taxonomic summarization were organized within the QIIME 2 framework [32,33]. Because the sequencing analysis was restricted to the initial inoculum, all resulting taxonomic summaries were interpreted strictly as baseline biological context for the kefir-derived consortium.

2.12. Scanning Electron Microscopy

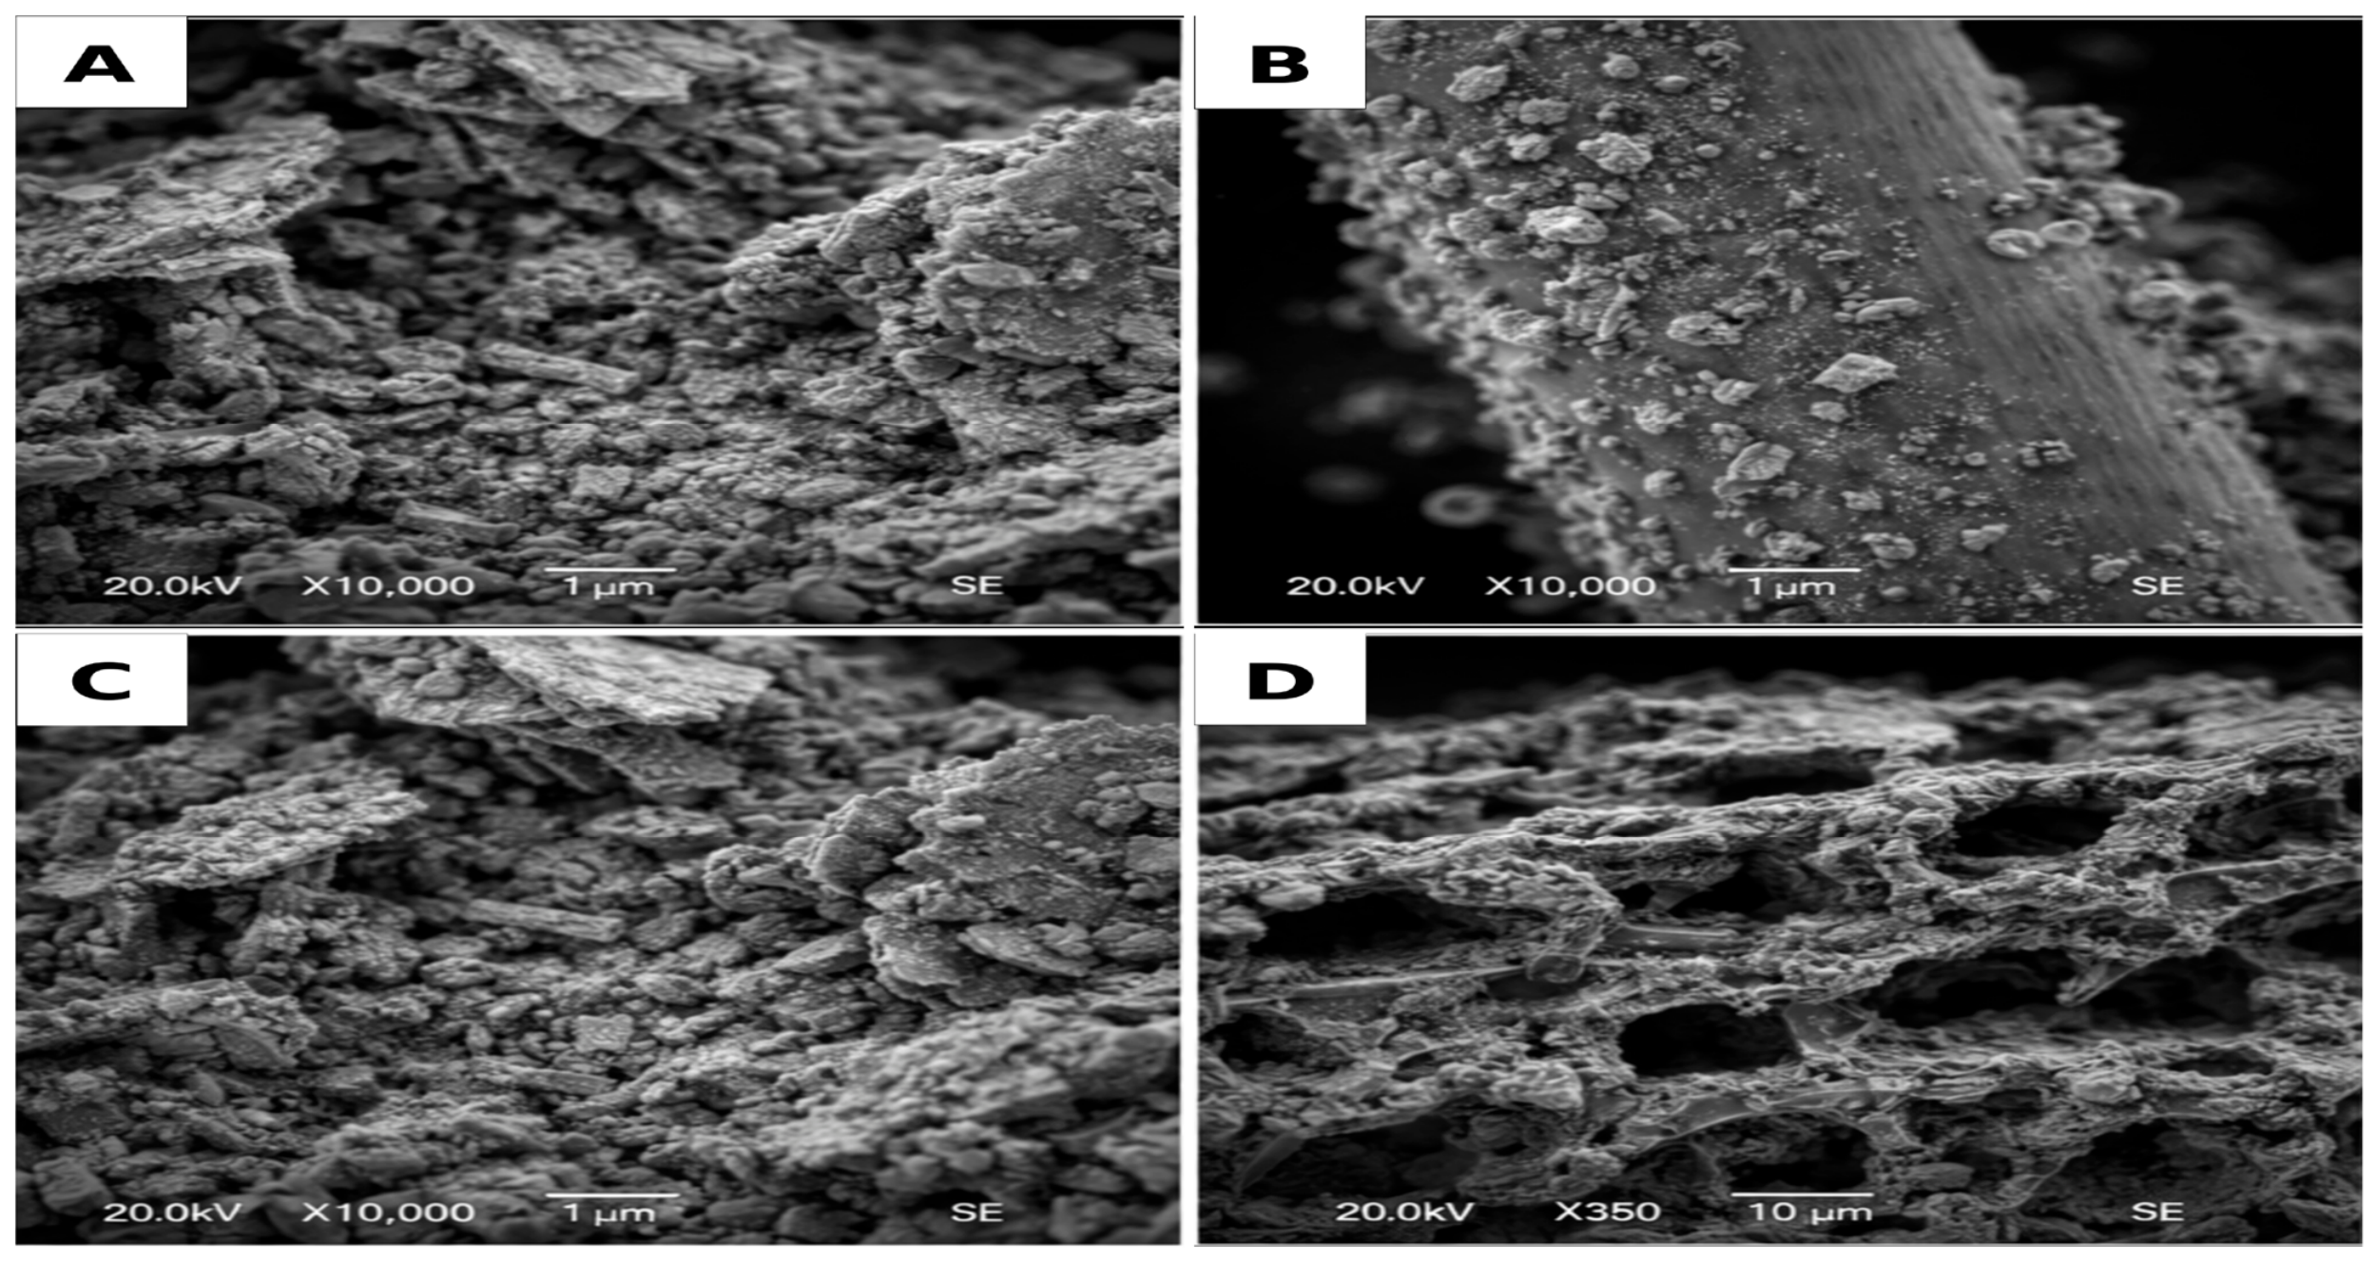
Endpoint electrode-associated microstructures were examined by scanning electron microscopy (SEM) using a SIGMA 500 field-emission SEM (Carl Zeiss Microscopy GmbH, Oberkochen, Germany) operated in secondary electron mode. Samples were fixed in 2.5% glutaraldehyde, dehydrated through graded ethanol solutions (30–100%), dried, sputter-coated with Au/Pd (~10 nm), and imaged at 20 kV over a magnification range of 350× to 10,000×. The imaged specimen corresponded to the day-20 graphene anode.
In the analytical logic of the present study, SEM was used as an endpoint structural descriptor to document biofilm coverage, extracellular matrix deposition, particle adhesion, and electrode–microbe interfacial organization, rather than as a stand-alone mechanistic assay. This interpretation is consistent with the established role of biofilm architecture and attached growth in structuring electron-transfer behavior in bioelectrochemical systems [34,35]. Accordingly, SEM observations were interpreted jointly with the temporal electrochemical response, the baseline sequencing profile, and the integrated semimechanistic descriptors.

2.13. Construction of a Fully Integrated Semimechanistic Descriptor System

To move beyond descriptive time series and toward an interpretable reactor-state framework, an integrated semimechanistic descriptor system was constructed from the measured electrical, redox, temperature, substrate-related, and ultraviolet–visible variables. The descriptors were defined as operational variables rather than as direct measurements of elementary electrochemical or molecular processes. Their purpose was to encode reactor maturation, substrate availability, soluble-phase optical structure, redox context, voltage-related behavior, and temperature-weighted effective transfer conditions into interpretable predictors suitable for current-output modeling. Equations derived from established kinetic, electrochemical, or statistical concepts are cited accordingly, whereas study-specific composite descriptors are explicitly identified as author-defined operational constructs [35,36,37,38,39,40,41,42]. The graphite area expressions correspond to standard geometric definitions for cylindrical electrodes, whereas the graphene accessible-area expression was formulated by the authors as a SEM-informed morphological approximation. It was not used as a BET-derived, capacitance-derived, or electrochemically active surface-area measurement; therefore, it supports qualitative comparison of interfacial complexity rather than absolute surface metrology. FTIR functional-group evidence was not included as a daily predictor in the random-forest model because it was obtained as a qualitative bulk spectral layer from the kefir-derived bioreactor sample rather than as a reactor-day variable. Instead, FTIR was used as complementary chemical support for interpreting the fermentation–redox–biofilm cascade.
Let t denote time (days), S t residual glucose (g/L), A 260 t and A 280 t the UV absorbance values, O R P t the oxidation–reduction potential (mV), p H t the measured pH, E C t the electrical conductivity, T D S t the total dissolved solids, V t the measured voltage (V), T t the absolute temperature (K), and A n an anode indicator. The following descriptors were defined.
The biofilm maturation index was expressed as:
B t = 1 1 + e x p [ ( 1.575 + 0.45 t ) ]
This term was used to represent the time-dependent increase in attached biomass maturity and interfacial consolidation.
The substrate saturation index was defined from a Monod-type expression:
S t * = S t K S + S t
where K S was fixed at 0.20 g/L to preserve sensitivity within the low-range residual glucose domain observed experimentally.
Two UV–Vis descriptors were included. The first was the UV–Vis redox proxy:
Φ U V , t = l n A 260 t A 280 t
and the second was the UV–Vis soluble pool:
U t = A 260 t + A 280 t 2
The first term was interpreted as a compact optical proxy of soluble-phase restructuring, whereas the second represented the bulk UV-active soluble fraction.
A redox-driving descriptor was defined as:
R t = O R P t
so that more reducing conditions contributed positively to the electroactive interpretation of the system.
To incorporate proton-related effects, the proton activity term was defined as:
H t = 10 p H t
This variable was included as a compact descriptor of acid-base conditions potentially affecting charge-transfer and metabolic balance.
To represent transport and dissolved-phase loading, the following terms were calculated:
C t = l n ( 1 + E C t )
L t = l n ( 1 + T D S t )
where C t approximates the ionic transport environment and L t reflects total soluble loading.
Because true electrochemical voltage losses were not directly measured, an estimated reversible potential was defined as:
E r e v , t = V t + η l o s s
where η l o s s = 0.12   V was treated as a theory-constrained constant representing unresolved internal voltage losses.
To introduce a theory-guided transfer term inspired by nonadiabatic electron-transfer considerations, a quantum-inspired effective electron-transfer factor was defined as:
M t = e x p Δ G λ ) 2 4 λ k B T t
where λ = 0.35   eV and Δ G = 0.20   eV were fixed theory-based constants, k B is the Boltzmann constant, and T t is the absolute temperature. Since neither reorganization energy nor free-energy change was experimentally determined in the present work, both parameters were treated as constrained constants rather than fitted variables.
A hybrid quantum electron-transfer effective descriptor was then defined as:
Q E T t = M t × Φ U V , t × R t
This term was not interpreted as a direct microscopic measurement of tunneling or hopping, but as a semimechanistic construct integrating temperature-dependent transfer favorability, soluble-phase restructuring, and redox forcing within a unified theory-guided descriptor [36,37,38,39,40,41,42].
All continuous variables were standardized prior to ordination and predictive modeling according to:
Z x = x μ x σ x
where μ x and σ x denote the mean and standard deviation of variable x , respectively.
Operational state labels, namely Lag, Productive, Competitive, and Hyperproductive, were used only for a posteriori visualization and biological interpretation. They were not used as clustering targets and were not included as training labels in the predictive model.

2.14. Temporal Analysis and Principal Component Analysis of Integrated Reactor States

The temporal structure of the experiment was first examined through day-resolved trajectories of current, voltage, oxidation–reduction potential, temperature, residual glucose, consumed glucose, glucose consumption fraction, A260, A280, and A260/A280. This temporal layer was used to identify early adjustment, intermediate stabilization, and late-stage perturbation patterns across the monitored variables.
To summarize the joint organization of the measured and transformed descriptors, principal component analysis (PCA) was performed on the standardized integrated dataset. The PCA matrix included the main electrochemical, physicochemical, UV–Vis, substrate-related, and semimechanistic descriptors defined in Section 2.13, including the biofilm maturation index, substrate saturation index, UV–Vis redox proxy, UV–Vis soluble pool, redox-driving force, proton activity term, electrolyte conductivity term, solids-loading term, estimated reversible potential, and the quantum-inspired effective transfer term.
PCA was used strictly as a dimensionality-reduction and visualization tool to identify the dominant axes of reactor-state progression and the relative contribution of maturation-, substrate-, redox-, optical-, and transport-related terms. In the revised analytical design, no k-means optimization, silhouette-based cluster selection, or hierarchical heatmap was used as a primary inferential framework. Instead, the operational state labels Lag, Productive, Competitive, and Hyperproductive were overlaid a posteriori on the PCA score space to facilitate biological interpretation of the integrated reactor-state continuum.

2.15. Predictive Modeling of Current and Fully Integrated Equation System

The final analytical layer aimed to determine whether current output could be predicted from a fully integrated set of theory-guided descriptors jointly representing reactor maturation, substrate accessibility, soluble-phase restructuring, redox forcing, proton activity, ionic transport environment, electrochemical potential, and effective electron-transfer favorability [42,43,44].
The response variable was current, expressed as I t (mA). The integrated predictor system was defined as:
I ^ t = f R F ( B t , S t * , Φ U V , t , U t , R t , H t , C t , L t , E r e v , t , M t , Q E T t , A n )
where f R F ( ) denotes the fitted random-forest regression function, and the component descriptors are:
B t = 1 1 + e x p [ ( 1.575 + 0.45 t ) ]
S t * = S t K S + S t
Φ U V , t = l n A 260 t A 280 t
U t = A 260 t + A 280 t 2
R t = O R P t
H t = 10 p H t
C t = l n ( 1 + E C t )
L t = l n ( 1 + T D S t )
E r e v , t = V t + η l o s s
M t = e x p Δ G λ ) 2 4 λ k B T t
Q E T t = M t × Φ U V , t × R t
where t is time (days), S t is residual glucose (g/L), A 260 t and A 280 t are UV absorbance values, O R P t is oxidation–reduction potential (mV), p H t is the measured pH, E C t is electrical conductivity, T D S t is total dissolved solids, V t is measured voltage (V), T t is absolute temperature (K), A n is the anode indicator, K S = 0.20   g / L , η l o s s = 0.12   V , λ = 0.35   eV , and Δ G = 0.20   eV . Because true electrochemical voltage losses and quantum electron-transfer parameters were not directly measured in the present study, these quantities were introduced as theory-constrained constants rather than fitted experimental variables.
For explicit completeness, the fully expanded integrated predictor system can be written as:
I ^ t = f R F 1 1 + e x p [ ( 1.575 + 0.45 t ) ] ,   S t K S + S t ,   l n A 260 t A 280 t ,   A 260 t + A 280 t 2 ,   ( O R P t ) ,   10 p H t ,   l n ( 1 + E C t ) ,   l n ( 1                               + T D S t ) ,   ( V t + η l o s s ) ,   e x p Δ G λ ) 2 4 λ k B T t ,   e x p Δ G λ ) 2 4 λ k B T t l n A 260 t A 280 t ( O R P t ) ,   A n
This formulation was designed to preserve interpretability while allowing nonlinear interaction structures to be learned directly from the data. In this framework, B t represents biofilm maturation, S t * represents substrate saturation, Φ U V , t and U t capture soluble-phase UV–Vis restructuring, R t captures redox-driving force, H t captures proton activity, C t and L t represent ionic transport and dissolved-phase loading, E r e v , t provides an electrochemically grounded voltage-related term, and M t Q E T t introduce a constrained temperature-weighted effective transfer descriptor [35,36,37,38,39,40,41,42]. The temperature-weighted effective transfer descriptor was included as an operational approximation designed to encode the temperature dependence of transfer-favorability conditions within the integrated predictor matrix. It should not be interpreted as direct evidence of microscopic electron tunneling, Marcus-type transfer, or a measured extracellular electron-transfer rate. The descriptor was retained only as a theory-constrained state variable for predictive modeling.
Candidate predictors were standardized within the modeling workflow before model fitting. Current prediction was performed using random-forest regression because this algorithm can accommodate nonlinear responses and interaction-rich predictor spaces without imposing restrictive linearity assumptions [42,43,44]. Predictive performance was assessed using grouped cross-validation, in which reactor identity was used as the grouping factor so that repeated observations from the same reactor were not split between training and validation partitions [44]. This strategy was used to reduce leakage and to evaluate whether the integrated descriptor system predicted current across reactor-specific partitions rather than merely fitting repeated measurements from the same unit [45].
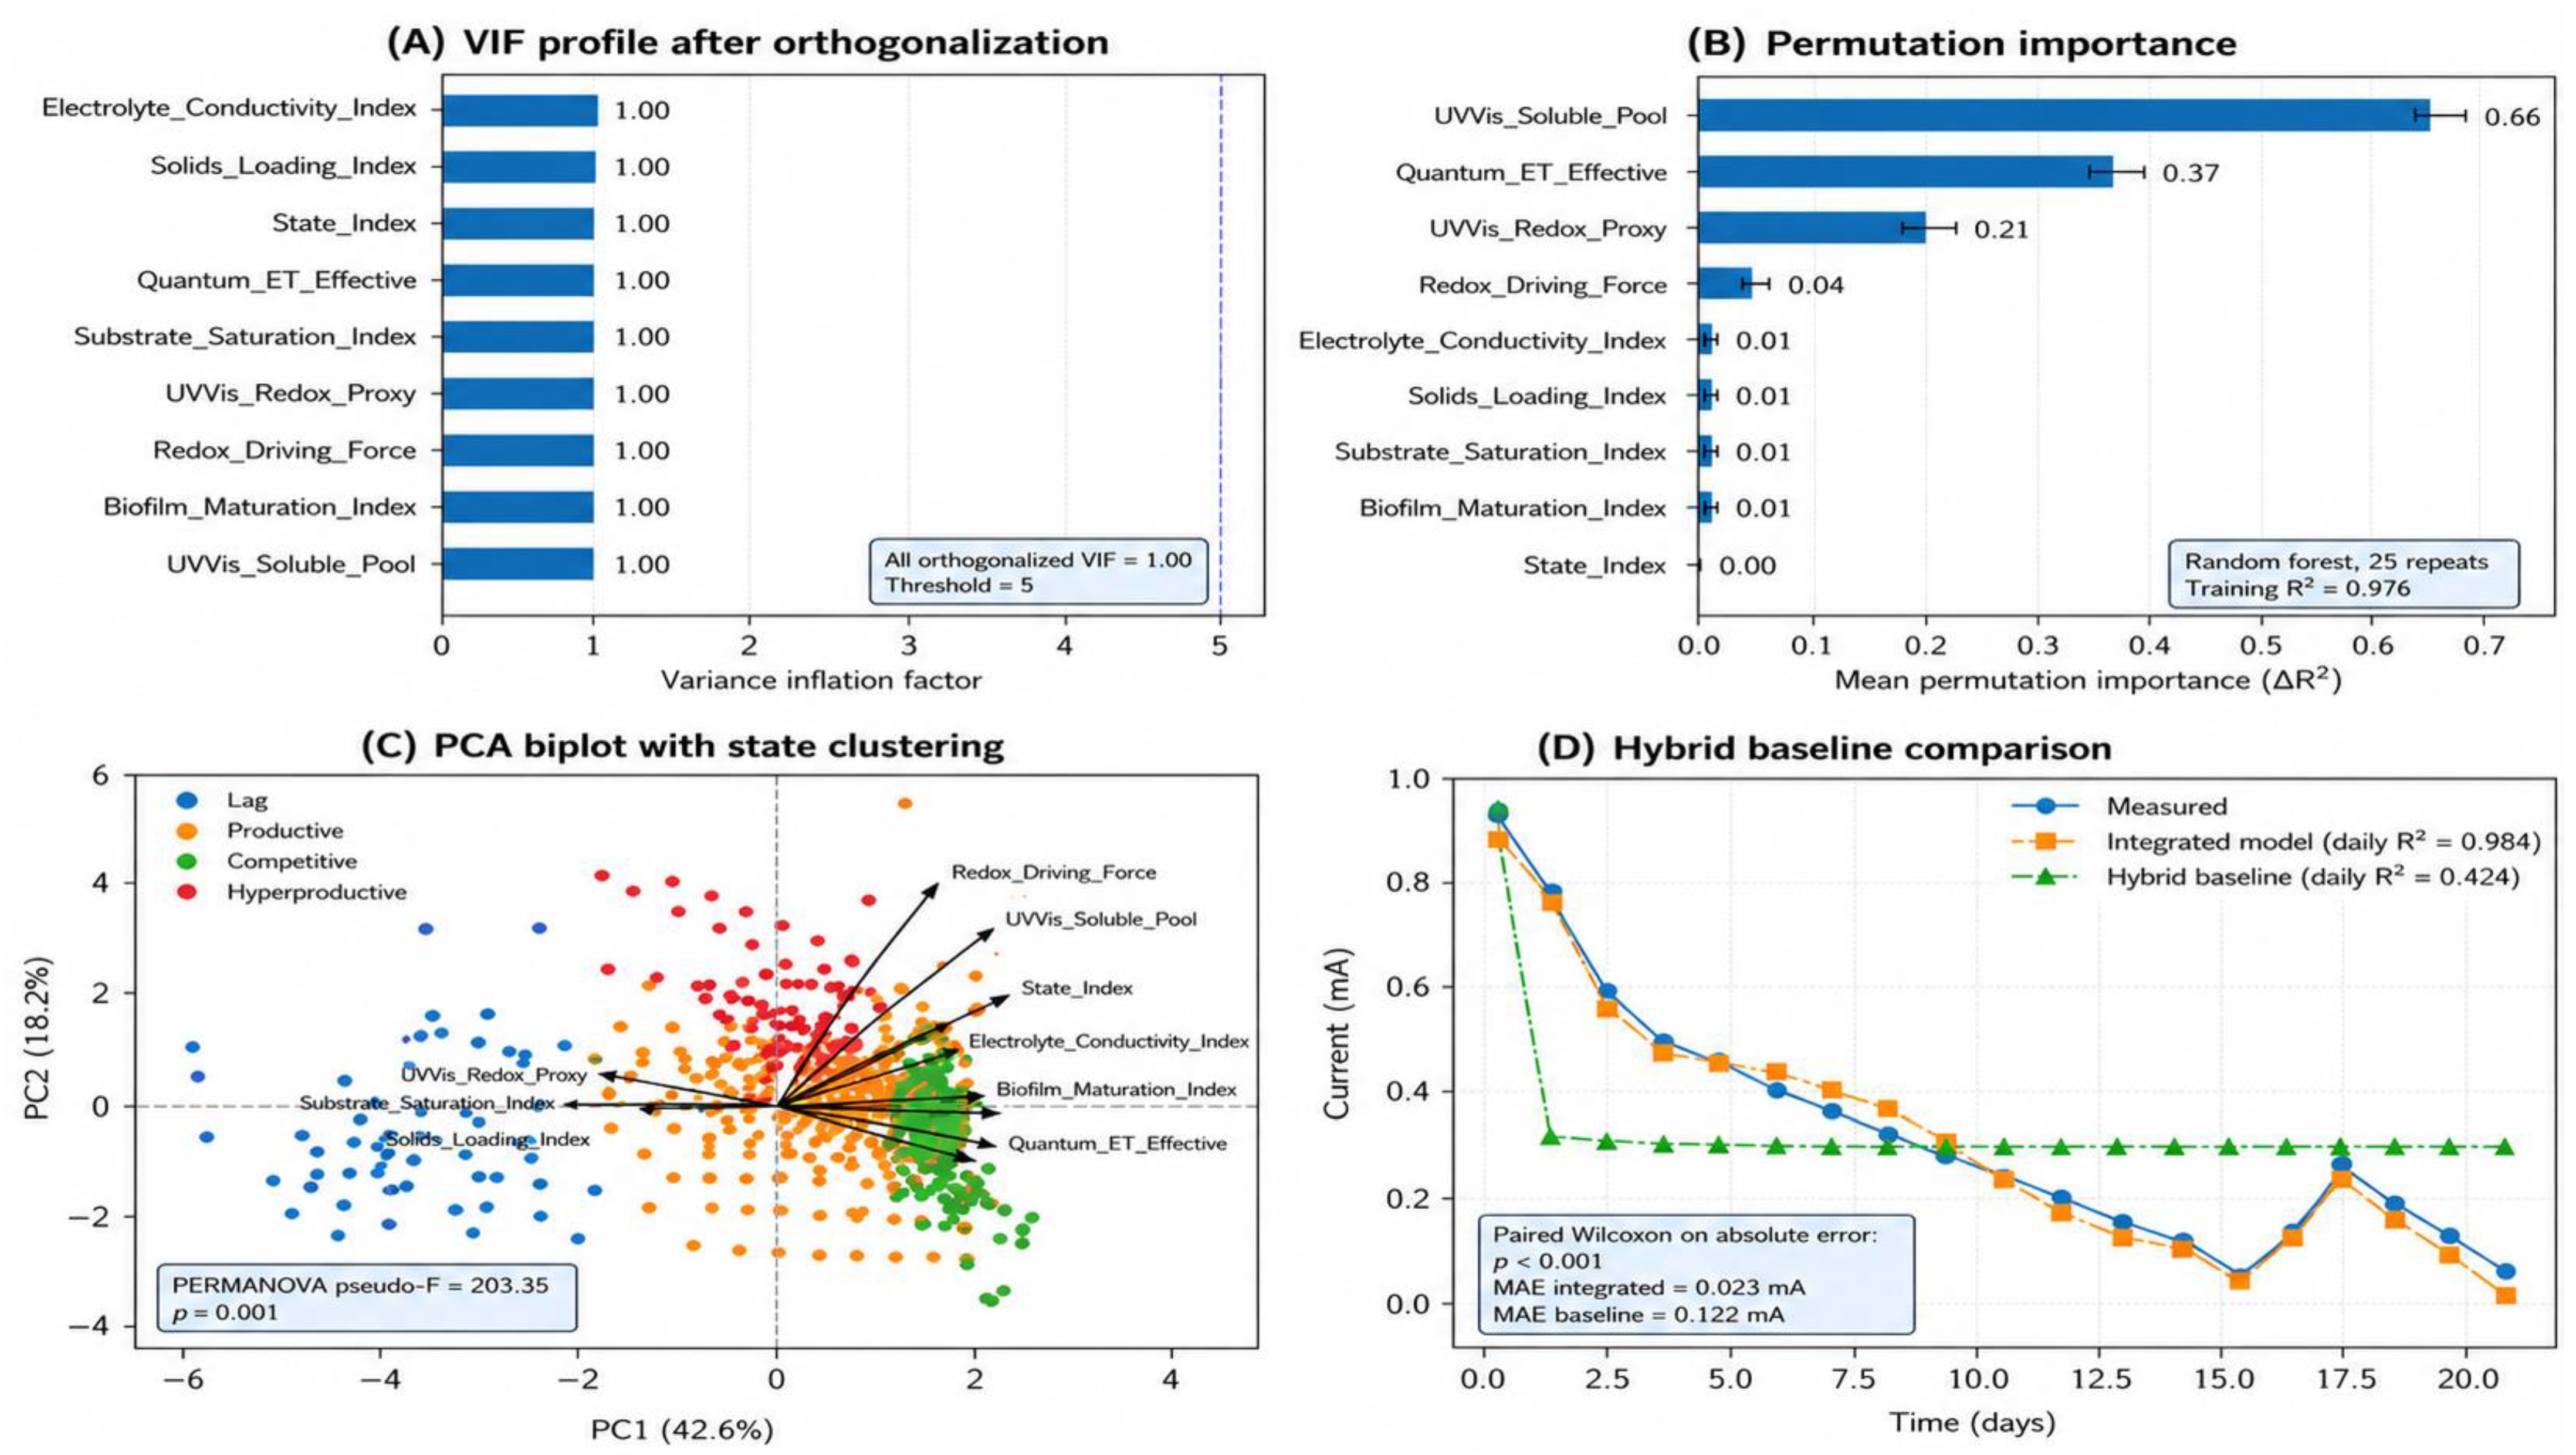
Model performance was summarized using the coefficient of determination, root mean square error, mean absolute error, and the slope of the observed-versus-predicted relationship. Diagnostic evaluation included observed-versus-predicted current, residual distribution, quantile–quantile residual behavior, residuals versus predicted current, variance inflation factor profiling, and permutation importance. Predictor contribution was interpreted jointly from grouped cross-validation behavior, residual diagnostics, collinearity screening, and coherence with the underlying reactor-state constructs. Model development was performed using a reactor-level grouped validation strategy. Reactor identity was used as the grouping variable so that all repeated daily observations from a given reactor were assigned to the same validation fold, thereby reducing leakage from within-reactor temporal dependence. Random-forest regression was selected after preliminary comparison with simpler regression alternatives because it allowed nonlinear responses and interaction-rich descriptor behavior without requiring strict linearity. Hyperparameter tuning was restricted to a predefined grid including the number of trees, maximum tree depth, minimum samples per leaf, and maximum number of candidate predictors per split. The final model was selected according to grouped cross-validated coefficient of determination, root mean square error, mean absolute error, residual behavior, and observed-versus-predicted slope. The final reported metrics therefore represent within-design predictive performance under the fixed laboratory configuration rather than an external validation across independent reactor architectures (Table 4).
For comparative interpretation only, a reduced hybrid biofilm–redox/electrochemical reference was constructed from normalized values of the principal theory-constrained descriptors associated with maturation, substrate saturation, redox forcing, and electrochemical potential. This hybrid reference was plotted against the measured current trajectory and the fitted integrated model as an interpretive baseline in panel H, but it was not treated as an independently trained predictive model.
Heteroscedasticity was screened using the Breusch–Pagan framework [46], and departure from normality was evaluated using the Shapiro–Wilk test [47]. Predictor contribution was interpreted jointly from permutation importance, grouped cross-validation behavior, residual diagnostics, and coherence with the underlying semimechanistic constructs rather than from any single statistic in isolation.

2.16. Statistical Analysis

All statistical analyses were performed in Python (v.3.13.2). Time-resolved variables were summarized according to the graphical and modeling purpose of each panel, and a repeated-measures structure was preserved throughout the temporal interpretation of the dataset. Continuous predictors were standardized before multivariate ordination and predictive modeling to ensure comparability across descriptors defined on different physical scales. Descriptive temporal summaries were reported as mean ± standard deviation according to anode configuration and sampling day. This reporting format was used to make between-reactor dispersion explicit while preserving the longitudinal structure of the 33-reactor dataset.
Assumption checking and inferential support analyses were performed before formal interpretation of the final model. Predictor collinearity was evaluated using variance inflation factors (VIF), and values below 5 were considered acceptable for the retained integrated predictor set [45]. Residual behavior was examined both graphically and analytically. Heteroscedasticity was screened using the Breusch–Pagan approach [46], and residual departure from normality was evaluated using the Shapiro–Wilk test [47]. Agreement between measured and predicted current was quantified using Lin’s concordance correlation coefficient to complement the coefficient of determination and error-based metrics [48]. Residual median bias and the paired comparison of absolute prediction errors between the integrated model and the reduced hybrid baseline were evaluated using the Wilcoxon signed-rank test [49]. Multivariate differentiation among operational reactor-state labels in the integrated descriptor space was assessed using a permutation-based non-parametric multivariate analysis of variance framework, consistent with PERMANOVA [50]. These inferential procedures were used to support within-design interpretation of model adequacy, descriptor organization, and comparative prediction performance rather than to claim universal validity beyond the experimental reactor configuration.
All statistical outputs were interpreted within the limits of the fixed experimental design. The analysis was intended to evaluate within-design current predictability and reactor-state progression, not to estimate universal performance parameters for all kefir-driven microbial fuel cells. Apparent power was calculated only as the product of measured voltage and current under fixed measurement conditions and was not interpreted as power density or maximum power density, because electrode-area-normalized polarization curves and load-sweep assays were not performed.
To provide additional electrical-output descriptors supporting the microbial fuel cell interpretation under fixed monitoring conditions, apparent power, cumulative charge, and cumulative apparent energy were calculated from the reactor-day voltage and current measurements. Apparent power was calculated as:
P a p p , t = V t × I t
where V t is the measured voltage and I t is the measured current in mA. Because I t was expressed in mA, P a p p , t is expressed in mW. Time-integrated current generation was summarized as cumulative charge using trapezoidal numerical integration:
Q c u m = t = 1 20 I t + I t 1 2 × Δ t × 86.4
where Δ t is the interval between consecutive sampling days, and 86.4 converts mA·day to coulombs. Cumulative apparent electrical energy was calculated as:
E a p p , c u m = t = 1 20 P a p p , t + P a p p , t 1 2 × Δ t × 86.4
where E a p p , c u m is expressed in joules because mW·day is converted to J using the same 86.4 factor. These descriptors were used to support fixed-condition electrical-output interpretation and were not interpreted as maximum power, maximum power density, coulombic efficiency, or optimized MFC performance because load-sweep, polarization, and electron-recovery assays were not performed.
In the revised analytical design, the statistical workflow was structured to support the integrated semimechanistic interpretation of reactor-state progression rather than to prioritize stand-alone multivariate partitioning procedures. Accordingly, the inferential emphasis of the study was placed on the combined evidence from temporal trajectories, endpoint SEM, baseline sequencing context, FTIR functional-group evidence, integrated descriptor construction, PCA-based reactor-state organization, and cross-validated predictive modeling.

2.17. Dataset Scope and Generalization Limits

The analytical dataset contained 693 reactor-day observations generated from 33 independent reactors monitored over 21 time points. Although this structure provides sufficient repeated temporal resolution for within-design reactor-state modeling, the observations are not statistically equivalent to 693 fully independent reactor architectures because measurements were nested within reactors. This limitation was addressed by grouped cross-validation using reactor identity as the grouping factor. Consequently, the model should be interpreted as a within-design current-prediction tool for the fixed salt-bridge kefir-driven configuration evaluated here, not as a universal model for all kefir-based microbial fuel cells, electrode geometries, substrates, or operating regimes.

2.18. Model-Linked Hypotheses and Inferential Decision Structure

To connect the predictive objective of the study with formal statistical interpretation, the final analytical layer was structured around five model-linked hypotheses. These hypotheses were defined as within-design hypotheses because all data were generated under the same laboratory-scale salt-bridge double-chamber microbial fuel cell configuration and were nested within reactor identity. Therefore, the hypotheses were intended to test whether the integrated descriptor system could explain and predict current output within the evaluated reactor design, not whether the model was universally transferable to other microbial fuel cell architectures.
H1 tested whether the integrated semimechanistic descriptor system provided significant predictive information for current output. The null hypothesis was that predicted and measured current would show weak agreement and no meaningful correspondence beyond random association. The alternative hypothesis was that the integrated model would show strong agreement between predicted and measured current under grouped cross-validation by reactor identity. This hypothesis was evaluated using the coefficient of determination, RMSE, MAE, observed-versus-predicted slope, Pearson correlation, and Lin’s concordance correlation coefficient. Support for H1 required high explained variance, low error, an observed-versus-predicted slope close to unity, significant correlation, and high concordance.
H2 tested whether the model residuals were centered near zero and therefore free from systematic median prediction bias. The null hypothesis was that the residual distribution was shifted away from zero, indicating systematic overprediction or underprediction. The alternative hypothesis was that the residual median did not differ significantly from zero. This hypothesis was evaluated using residual plots, residual distribution analysis, and the Wilcoxon signed-rank test on residual location. Shapiro–Wilk and Breusch–Pagan tests were used as complementary diagnostics to assess residual normality departure and heteroscedasticity, respectively. Because current-output data from microbial fuel cells can exhibit nonlinear and state-dependent variance, rejection of residual normality or homoscedasticity was interpreted as a diagnostic limitation rather than as direct rejection of model usefulness, provided that residual bias and predictive error remained low.
H3 tested whether the retained predictor matrix contained complementary descriptor information rather than excessive redundancy. The null hypothesis was that the integrated descriptor matrix was dominated by problematic multicollinearity, limiting interpretability of descriptor-level contributions. The alternative hypothesis was that the retained predictor matrix showed acceptable collinearity behavior. This hypothesis was evaluated using the variance inflation factor profile, with VIF values below 5 considered acceptable for interpretation. When orthogonalized descriptors were used, the VIF profile was interpreted as a stability check of the retained predictor space rather than as evidence that the original measured variables were independent.
H4 tested whether the integrated descriptor space encoded a structured operational reactor-state continuum. The null hypothesis was that the operational reactor-state labels did not differ significantly in multivariate descriptor space. The alternative hypothesis was that the reactor-state labels occupied significantly different regions of the integrated descriptor space. This hypothesis was evaluated using PCA visualization and a PERMANOVA-style non-parametric multivariate test. Statistical support for H4 indicated that the descriptors captured organized reactor-state progression rather than random dispersion of observations. These state labels were interpreted as operational reactor-state overlays, not as independently validated ecological or taxonomic classes.
H5 tested whether the fully integrated model provided additional predictive value relative to a reduced hybrid biofilm–redox/electrochemical baseline. The null hypothesis was that the integrated model did not reduce prediction error relative to the reduced hybrid baseline. The alternative hypothesis was that the integrated model produced significantly lower absolute prediction error. This hypothesis was evaluated by comparing daily absolute errors between the integrated model and the reduced baseline using a paired Wilcoxon signed-rank test. Support for H5 indicated that the full descriptor system added predictive value beyond a simplified theory-constrained approximation.
Together, these hypotheses were used to determine whether current output could be statistically linked to coordinated reactor-state descriptors under fixed laboratory conditions. The study was considered to support the integrated reactor-state modeling framework when the model showed strong predicted-versus-measured agreement, limited residual median bias, acceptable collinearity, significant multivariate state organization, and lower prediction error than the reduced hybrid baseline. These criteria were used to evaluate current-output predictability and descriptor-level organization, not to claim complete electrochemical power characterization or universal mechanistic transferability.

3. Results

3.1. Temporal Structuring of the Measured Experimental Layer

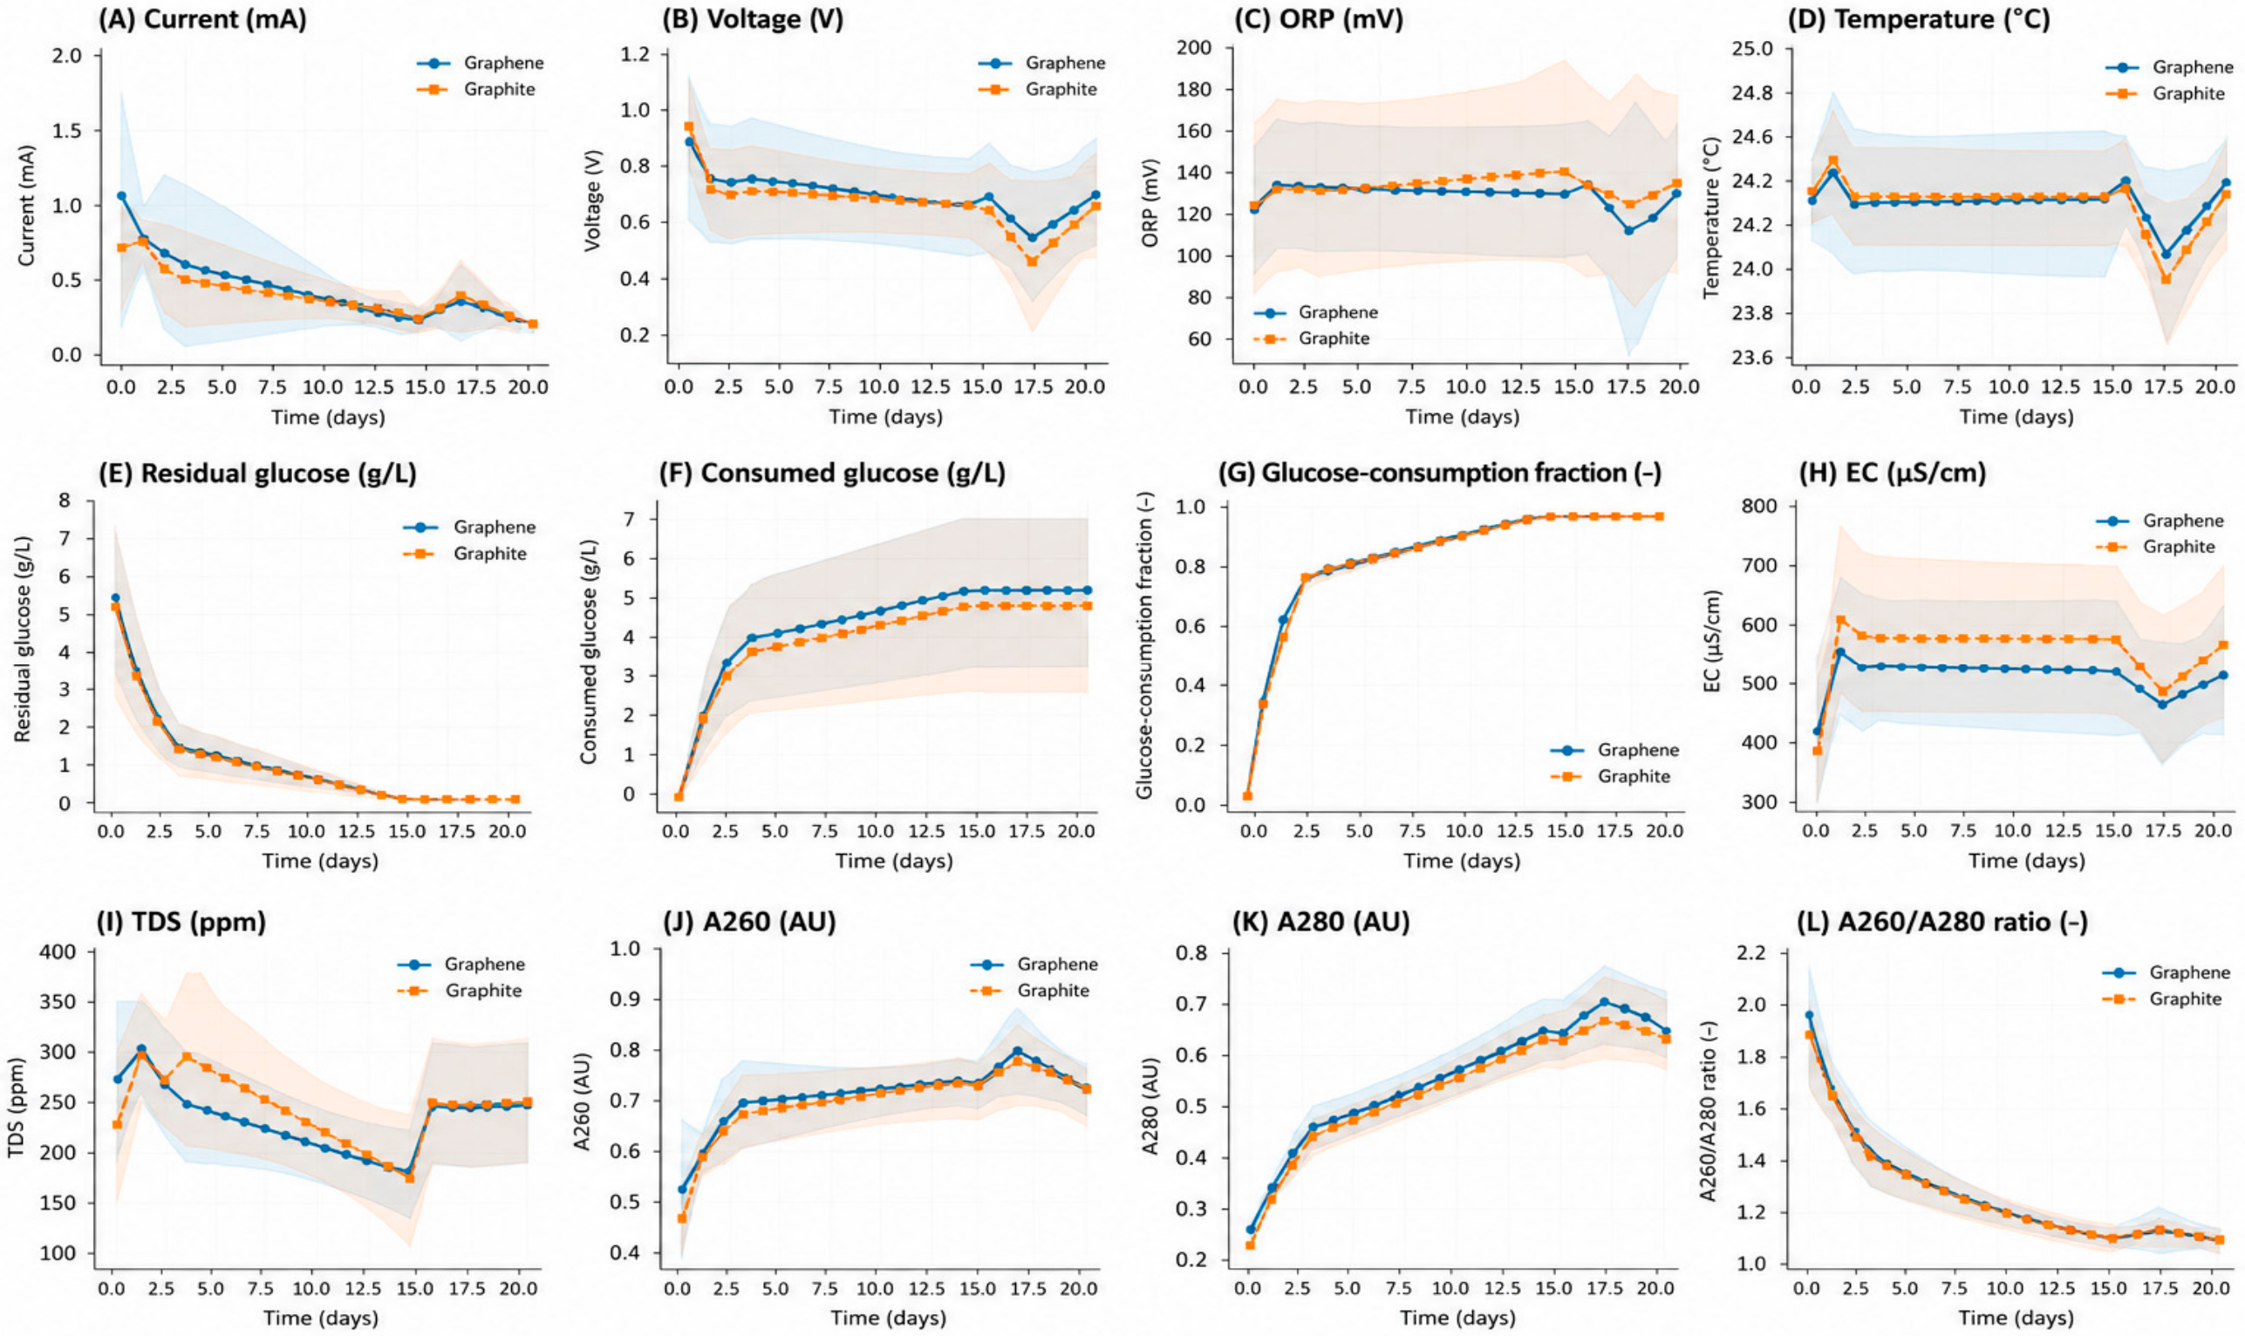
Figure 3 shows the temporal evolution of the measured experimental variables in microbial fuel cells equipped with graphene and graphite anode configurations. Both anode groups followed a similar reactor-state trajectory characterized by declining electrical output, progressive substrate depletion, increasing glucose-consumption fraction, and sustained changes in the physicochemical and ultraviolet–visible layers. Graphene-anode reactors showed a higher initial mean current than graphite-anode reactors, decreasing from 1.1212 mA at day 0 to 0.1200 mA at day 20. Graphite-anode reactors decreased from 0.6619 mA at day 0 to 0.1062 mA at day 20. Voltage also declined over time, from 0.9141 to 0.7200 V in graphene-anode reactors and from 0.9981 to 0.6794 V in graphite-anode reactors. Across the complete dataset, graphene-anode reactors maintained slightly higher current values than graphite-anode reactors, although both configurations converged toward a low-current late-stage condition.
Substrate-related variables showed a strong and consistent temporal transition in both anode configurations. In graphene-anode reactors, residual glucose decreased from 5.4759 g/L at day 0 to 0.0070 g/L at day 20, while the glucose-consumption fraction increased from 0.0000 to 0.9989. In graphite-anode reactors, residual glucose decreased from 5.1387 to 0.0187 g/L, and the glucose-consumption fraction increased from 0.0000 to 0.9964. These results indicate that both configurations moved from a substrate-rich early state to an almost substrate-depleted late state. The consumed-glucose curves followed the opposite trend, confirming that substrate conversion progressed in parallel with the decline in current output.
The physicochemical layer also showed structured temporal behavior. Electrical conductivity increased from 405.4118 to 535.4706 µS/cm in graphene-anode reactors and from 369.9375 to 600.5000 µS/cm in graphite-anode reactors between day 0 and day 20. Total dissolved solids changed from 302.5294 to 260.4706 ppm in graphene-anode reactors and from 244.1875 to 264.3125 ppm in graphite-anode reactors. These EC and TDS trajectories indicate that ionic and dissolved-solids conditions changed during fed-batch operation, supporting the interpretation that the reactors evolved as integrated physicochemical systems rather than as purely electrical devices.
The ultraviolet–visible variables indicated that soluble-phase restructuring persisted despite the decline in current and substrate availability. In graphene-anode reactors, A260 increased from 0.5326 to 0.7773 AU, A280 increased from 0.2658 to 0.7049 AU, and the A260/A280 ratio decreased from 1.9696 to 1.1029. In graphite-anode reactors, A260 increased from 0.4637 to 0.7714 AU, A280 increased from 0.2495 to 0.6989 AU, and the A260/A280 ratio decreased from 1.8554 to 1.1034. Therefore, Figure 3 supports the interpretation that current decline was associated with substrate depletion, ionic/solids-state changes, and reactor-state progression rather than with disappearance of the ultraviolet-responsive soluble pool. Because graphene and graphite anodes differed in both material identity and macroscopic geometry, these trends are interpreted as an operational anode-configuration comparison rather than as a strict material-only benchmark.
To make the dispersion of the principal measured variables explicit in the study, Table 5 summarizes the initial and final reactor-state values as mean ± standard deviation for each anode configuration.
Because microbial fuel cell studies require explicit electrical-output evidence, additional fixed-condition power-related descriptors were calculated from the measured voltage and current data. Table 6 summarizes apparent power, cumulative charge, and cumulative apparent energy by anode configuration. These descriptors support measurable electrical-output generation in the evaluated salt-bridge MFCs while preserving the scope of the study as fixed-condition current and power-output analysis rather than complete electrochemical power-performance characterization.
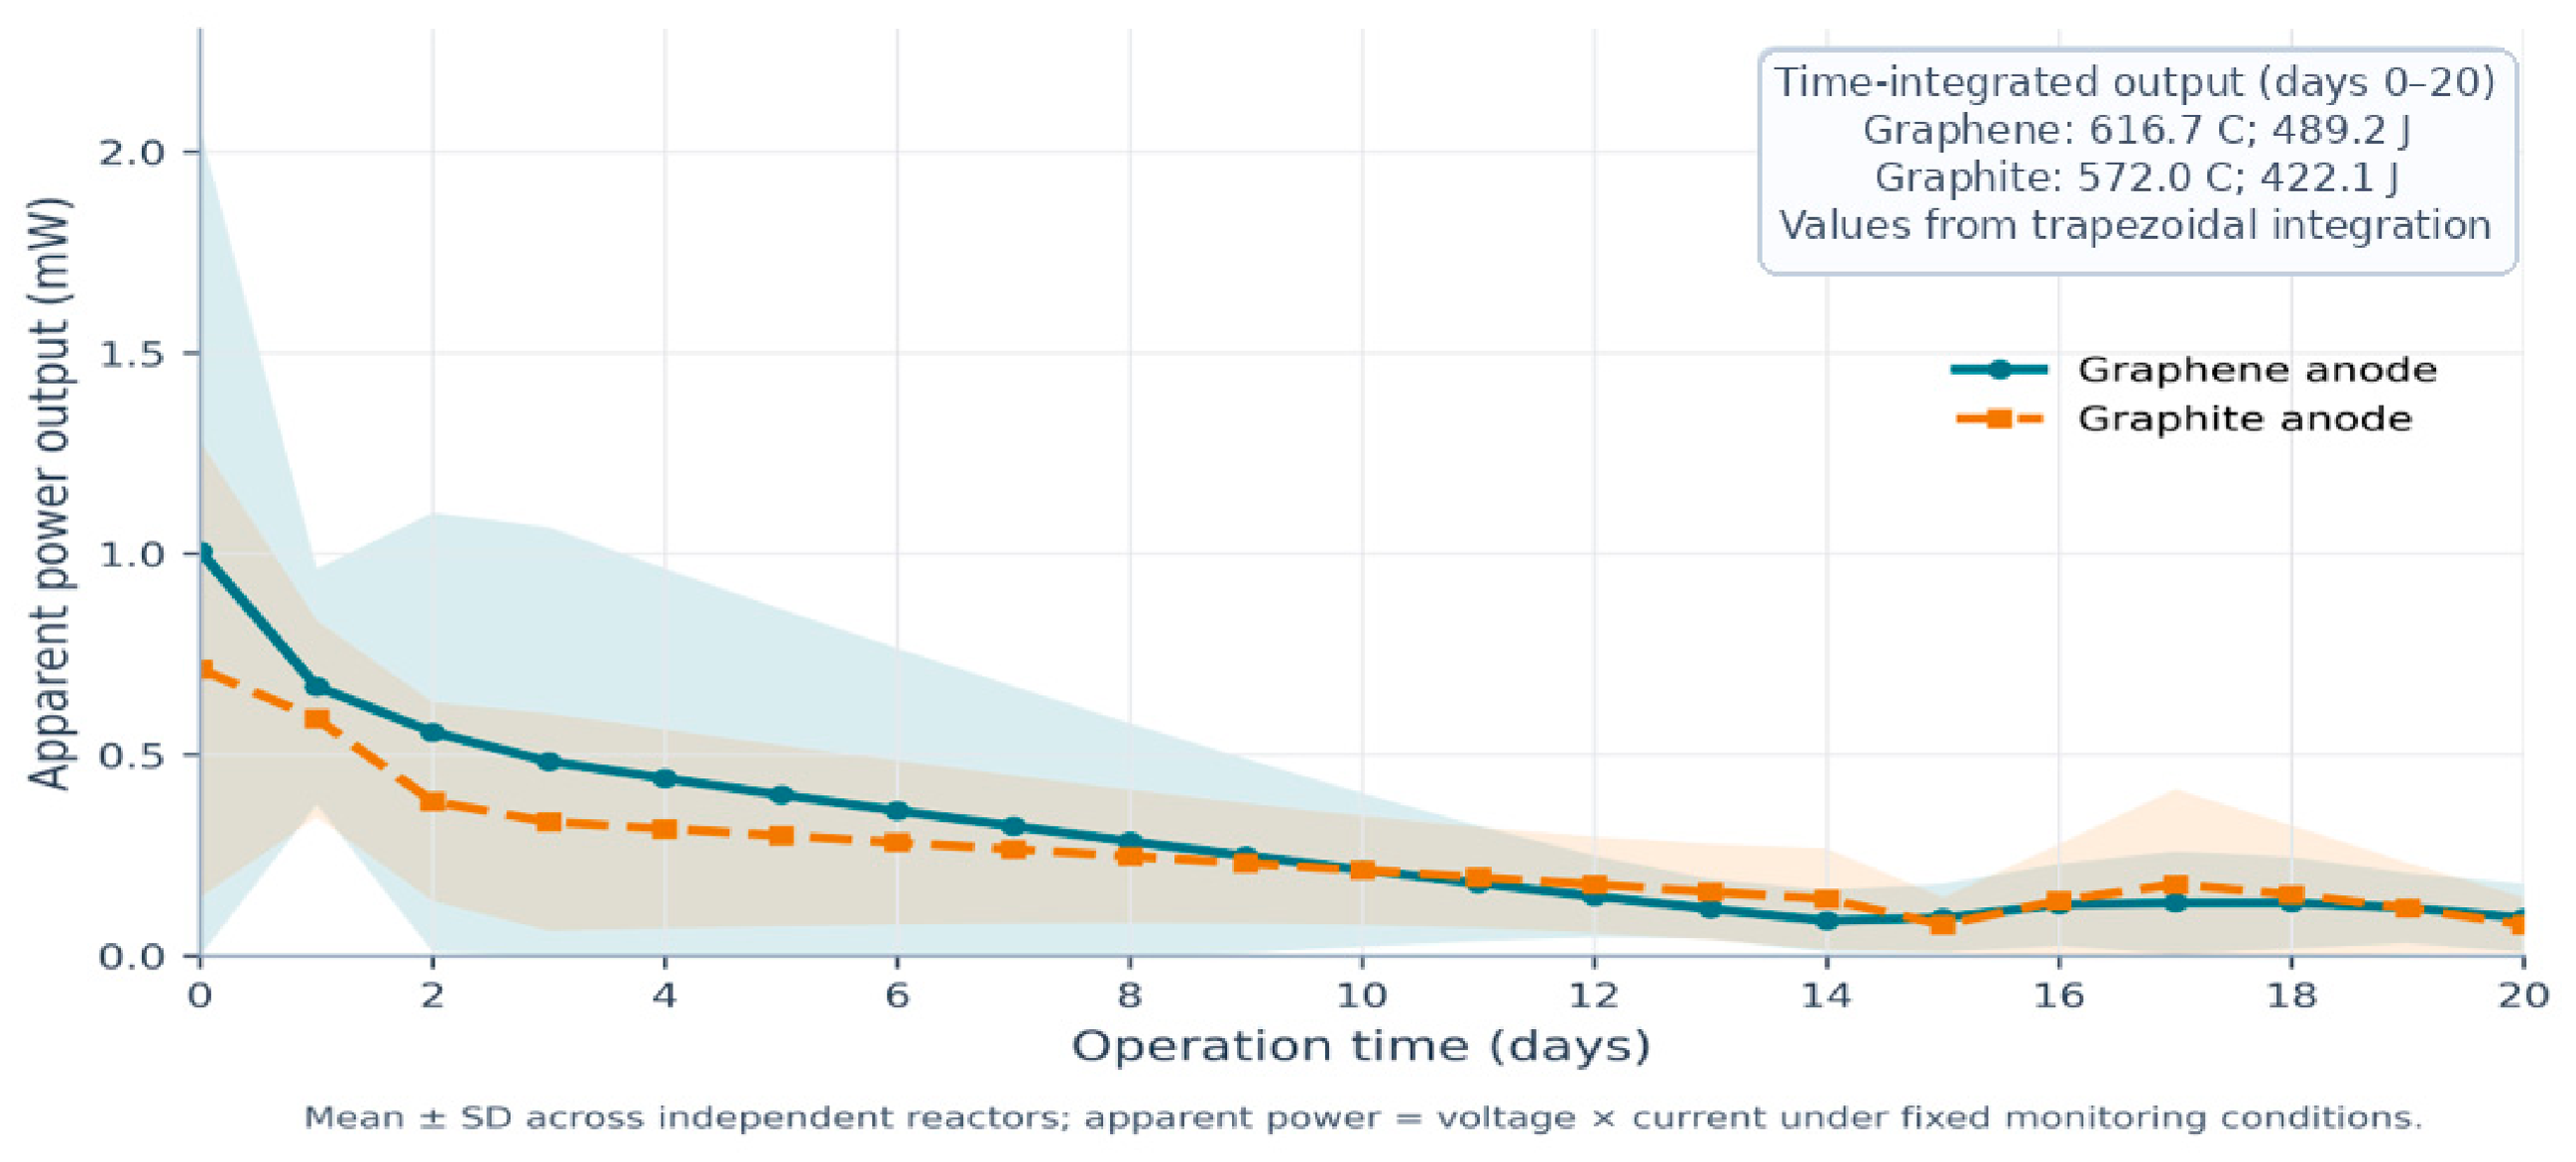
The additional fixed-condition electrical-output descriptors confirmed measurable power-related output in both anode configurations. Overall apparent power decreased from 0.8636 ± 0.8516 mW at day 0 to 0.0856 ± 0.0772 mW at day 20, corresponding to a 90.09% decline. Graphene-anode reactors showed higher mean apparent power than graphite-anode reactors across the complete period, with 0.2958 ± 0.2327 mW compared with 0.2515 ± 0.1212 mW. Time-integrated electrical-output descriptors followed the same trend: cumulative charge averaged 616.65 ± 414.73 C in graphene-anode reactors and 572.04 ± 243.83 C in graphite-anode reactors, while cumulative apparent energy averaged 489.21 ± 380.20 J and 422.14 ± 203.41 J, respectively. These results support fixed-condition electrical-output generation in the evaluated microbial fuel cells, although they do not represent maximum power density because polarization and load-sweep analyses were not performed. The temporal apparent-power trajectory is shown in Figure 4 to visualize how fixed-condition electrical output evolved during fed-batch operation. The pattern paralleled the current decline observed in Figure 3, with the highest apparent-power output occurring during the early substrate-rich interval and lower values dominating the late substrate-depleted phase.

3.2. Temporal Evolution of Integrated Semimechanistic Reactor-State Descriptors

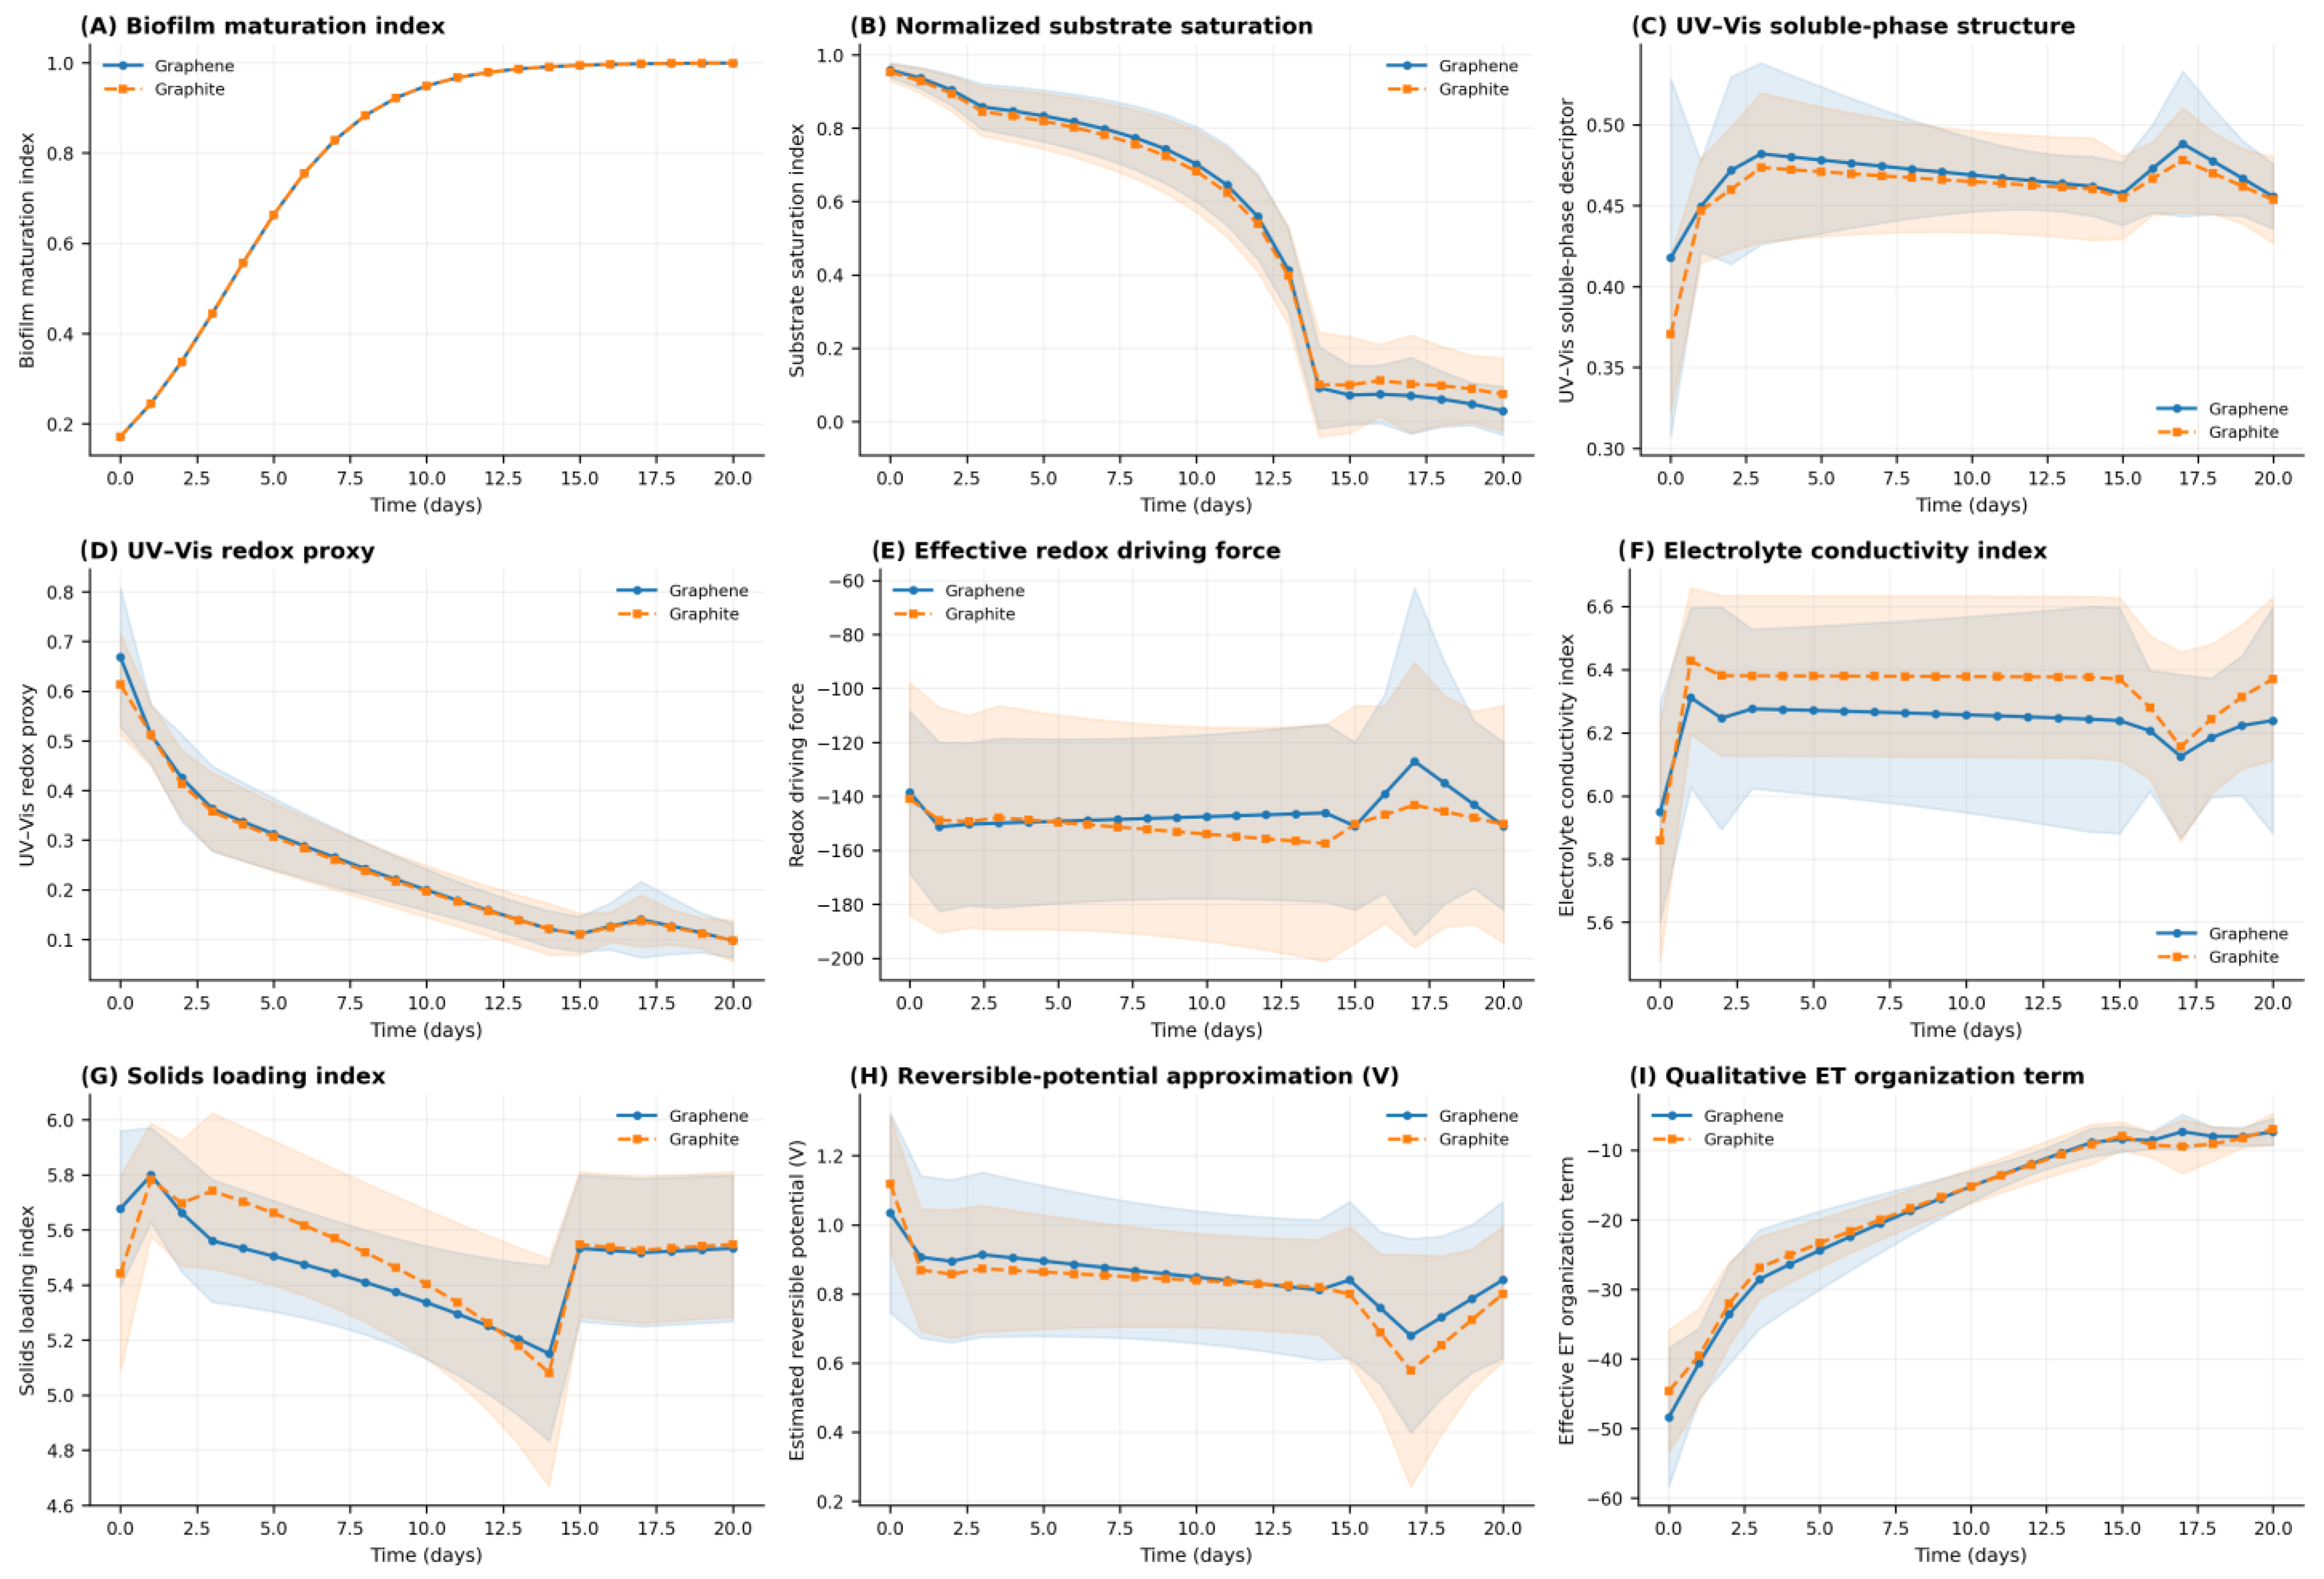
After the measured layer established a time-ordered process, the next step was to evaluate whether this progression could be represented through integrated operational descriptors linked to maturation, substrate accessibility, soluble-phase optical structure, redox context, voltage-related behavior, and temperature-weighted effective transfer conditions. Figure 5 shows that these transformed descriptors preserved the temporal logic of the measured layer while providing a more interpretable representation of reactor-state progression. These descriptors are interpreted as operational state variables, not as direct measurements of specific extracellular electron-transfer mechanisms.
Quantitatively, the biofilm maturation index increased from 0.1715 at day 0 to 0.9994 at day 20 in both anode configurations, reflecting the imposed time-dependent maturation structure of the descriptor. The substrate saturation index decreased from 0.9583 to 0.0289 in graphene-anode reactors and from 0.9530 to 0.0739 in graphite-anode reactors, confirming the transition toward low substrate accessibility. The UV–Vis soluble-pool descriptor increased from 0.4178 to 0.4557 in graphene-anode reactors and from 0.3707 to 0.4536 in graphite-anode reactors, whereas the UV–Vis redox proxy decreased from 0.6684 to 0.0974 and from 0.6133 to 0.0976, respectively. These numerical trends show that bulk UV-responsive soluble material remained detectable while the optical redox proxy declined markedly.
The biofilm maturation index increased monotonically with time and approached saturation during the second half of the experiment (Figure 5A), consistent with progressive interfacial consolidation rather than abrupt colonization dynamics. In parallel, the normalized substrate saturation term declined from high initial values to near-zero levels by the late phase (Figure 5B), confirming that the dominant temporal transition in the system was the progressive exhaustion of accessible substrate. These two variables jointly define the broad reactor-state axis: early operation was characterized by low maturation and high substrate availability, whereas late operation was characterized by mature interfacial conditions under strongly reduced substrate accessibility.
The UV–Vis-derived descriptors captured a second dimension of organization. The UV–Vis soluble-phase structure descriptor increased rapidly during the initial days and then remained elevated with only minor late fluctuations (Figure 5C), indicating persistent accumulation or stabilization of a UV-active extracellular fraction. By contrast, the UV–Vis redox proxy decreased progressively across the experiment (Figure 5D), with only a slight late rebound. This divergence is important because it shows that the soluble-phase pool was not changing along a single scalar dimension; rather, bulk UV activity and redox-linked optical structure evolved differently through time.
The transport- and electrochemical-state descriptors also changed in a configuration-dependent but temporally coherent manner. The electrolyte conductivity index increased from 5.9486 to 6.2382 in graphene-anode reactors and from 5.8584 to 6.3698 in graphite-anode reactors. The solids loading index changed from 5.6766 to 5.5327 in graphene-anode reactors and from 5.4415 to 5.5473 in graphite-anode reactors. The reversible-potential approximation decreased from 1.0341 to 0.8400 V in graphene-anode reactors and from 1.1181 to 0.7994 V in graphite-anode reactors. Finally, the qualitative electron-transfer organization term shifted from −48.3980 to −7.3627 in graphene-anode reactors and from −44.6369 to −6.9565 in graphite-anode reactors, indicating a strong temporal reorganization of the integrated transfer descriptor.
The effective redox driving force remained relatively stable over much of the operational window but displayed a transient late perturbation (Figure 5E), suggesting that redox conditions remained broadly permissive while their effective electroactive contribution shifted during the transition to the late stage. The electrolyte conductivity index was also comparatively stable, with only limited temporal deviation and a modest late decrease followed by recovery (Figure 5F). Similarly, the solids loading index followed a gradual downward trajectory and then stabilized (Figure 5G), indicating that the dissolved-phase transport environment changed more slowly than the substrate signal itself.
The reversible-potential approximation showed a gradual decline across the experiment, with a marked late drop and partial recovery (Figure 5H), whereas the qualitative electron-transfer organization term increased strongly from the earliest days onward and then approached a high late-stage plateau (Figure 5I). Read jointly, these descriptors indicate that the system became progressively more mature and structurally organized even while its immediately available substrate and instantaneous current declined. In other words, the late reactor was not an inactive state, but a reorganized one defined by mature interfacial development, depleted substrate accessibility, and a reweighted soluble-phase/redox configuration.
Graphite and graphene anodes were evaluated in separate reactors. Across the full dataset, graphene-anode reactors showed a mean current of 0.3694 ± 0.4704 mA, whereas graphite-anode reactors showed a mean current of 0.3336 ± 0.2855 mA. Mean voltage was 0.7285 ± 0.2272 V for graphene-anode reactors and 0.7008 ± 0.2067 V for graphite-anode reactors. These values indicate modest configuration-associated differences. However, because the two anode groups differed in both material identity and macroscopic geometry, the results are not interpreted as a strict material-only ranking. Instead, the main pattern was the shared temporal reactor-state transition observed across both configurations. Overall, Figure 5 condenses the measured temporal signal into an interpretable reactor-state progression. The dominant pattern was not a simple graphite-versus-graphene split, but a coordinated temporal transition linking maturation, substrate depletion, soluble-phase restructuring, and redox-electrochemical organization.

3.3. Endpoint Structural Evidence from Scanning Electron Microscopy

To complement the time-resolved electrochemical and semimechanistic analyses, endpoint SEM imaging was used as a structural descriptor of the anode-associated biofilm and electrode–microbe interface (Figure 6). The micrographs revealed a mature and heterogeneous surface architecture rather than a bare or weakly colonized electrode.
At high magnification, the electrode surface showed dense particulate and matrix-like deposits distributed over irregular topographic regions (Figure 6A,C). These deposits formed compact aggregates and surface coatings consistent with extensive attached growth and extracellular material accumulation. In panel B, adherent material was also visible along elongated surface features, indicating that colonization was not restricted to isolated points but extended over available interfacial structures. At lower magnification, the surface displayed a porous, reticulated architecture with cavities and interconnected regions coated by extracellular material (Figure 6D), supporting the interpretation of a spatially structured endpoint biofilm rather than a homogeneous film of uniform thickness.
These images are consistent with the maturation trend inferred from Figure 5A. Importantly, the SEM evidence does not by itself identify electron-transfer pathways or taxonomic composition, but it does confirm that the anode reached a physically developed endpoint characterized by coverage, matrix deposition, and heterogeneous microstructural organization. In the logic of the present study, this structural endpoint supports the broader interpretation that current output was embedded in a progressively maturing interfacial system whose functional behavior must be understood jointly with substrate-state, UV–Vis restructuring, and redox forcing.

3.4. Baseline Sequencing Context of the Kefir Inoculum

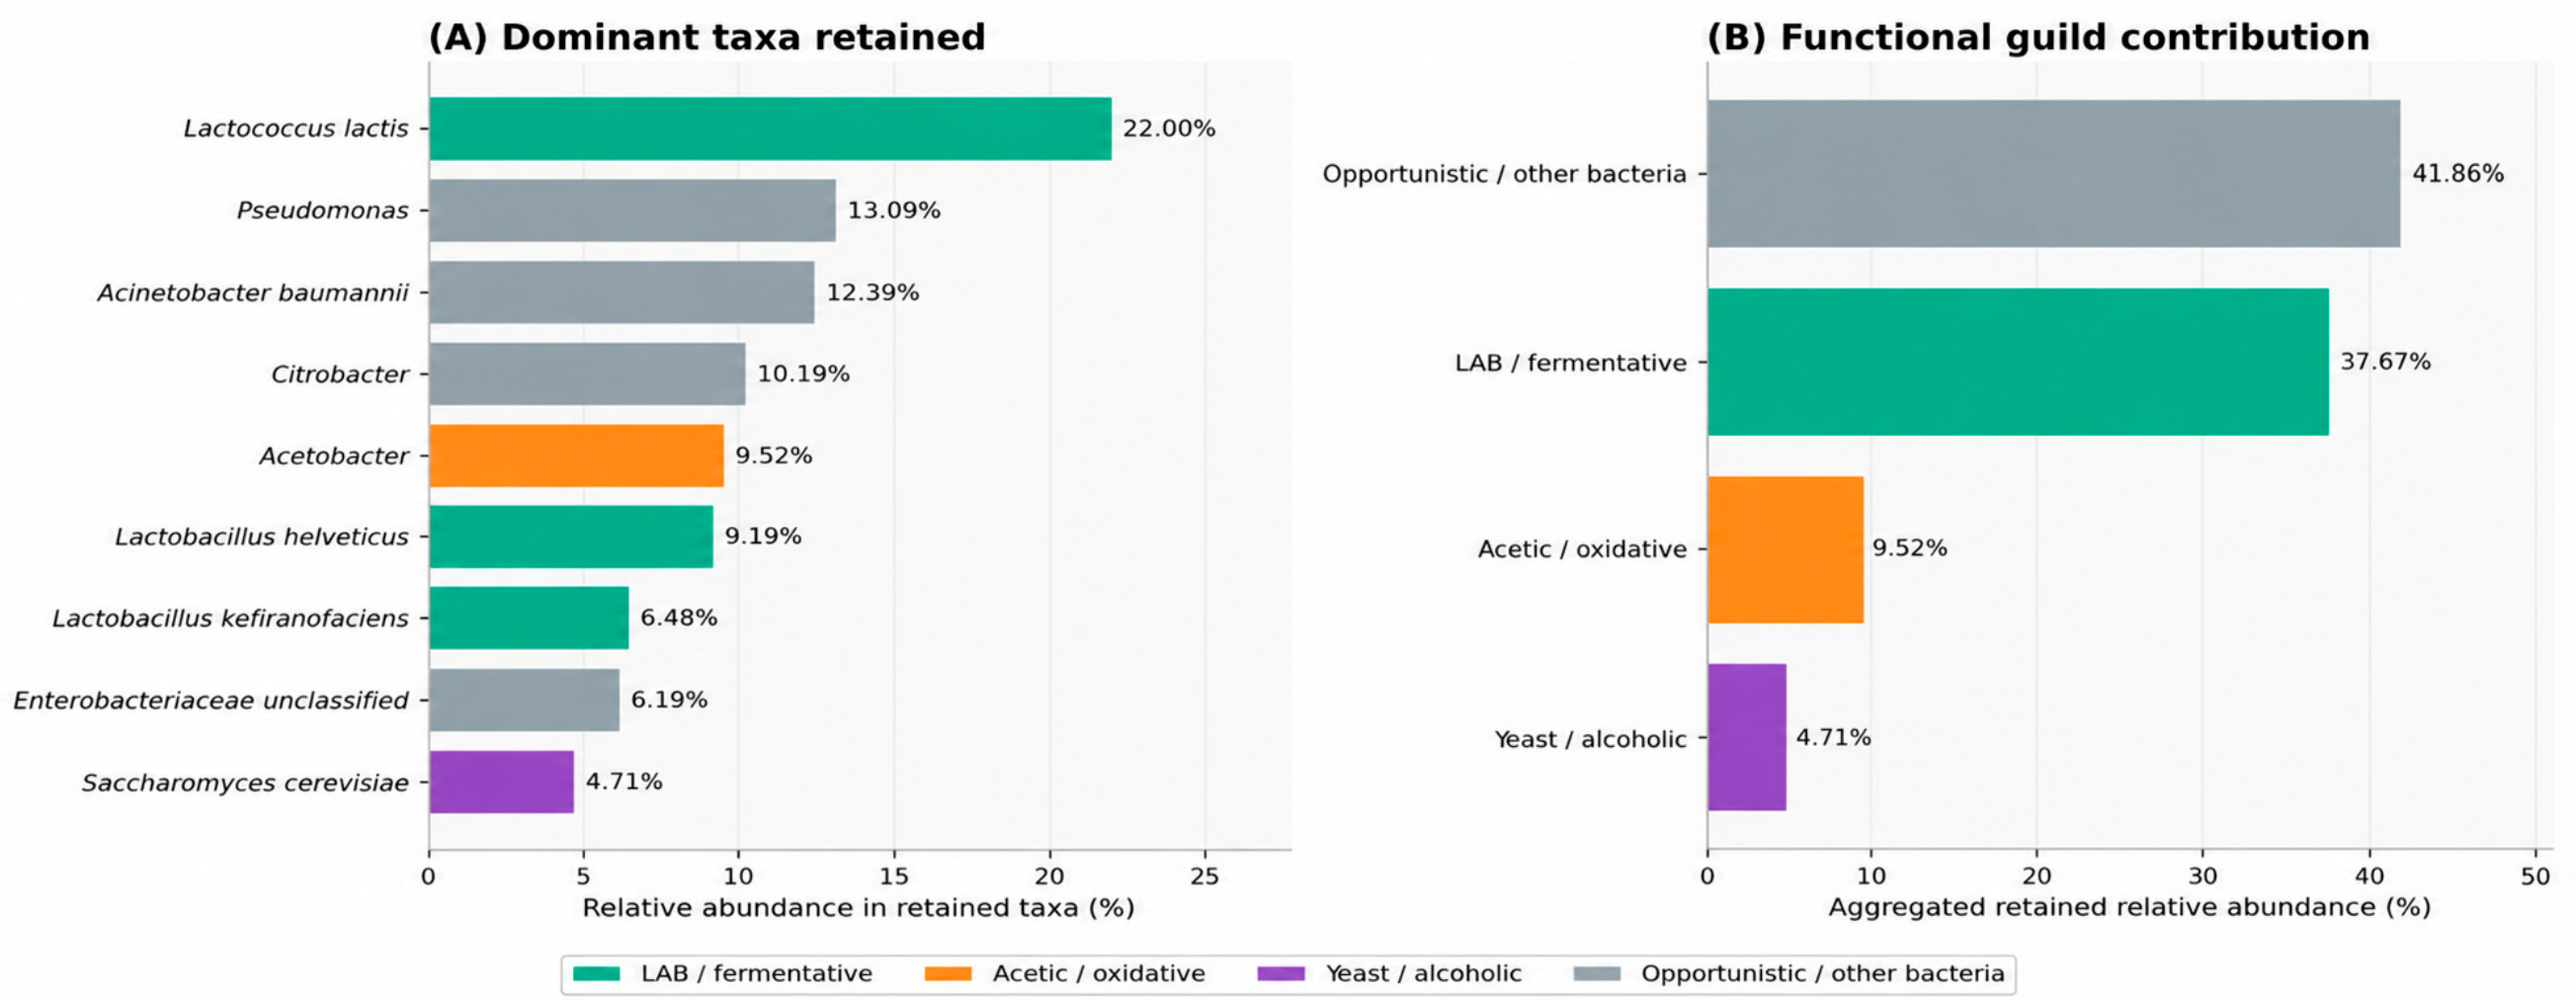
The baseline sequencing profile provided biological context for the starting consortium used to inoculate the reactors (Figure 7). Because this analysis was performed on the initial inoculum rather than on terminal reactor communities, it is interpreted here as contextual background rather than as direct evidence of endpoint colonization dynamics.
Within the retained dominant taxa, Lactococcus lactis was the most abundant taxon (22.00%), followed by Pseudomonas (13.09%), Acinetobacter baumannii (12.39%), Citrobacter (10.19%), Acetobacter (9.52%), and Lactobacillus helveticus (9.19%) (Figure 7A). Additional retained taxa included Lactobacillus kefiranofaciens (6.48%), unclassified Enterobacteriaceae (6.19%), and Saccharomyces cerevisiae (4.71%). This composition indicates that the inoculum was not a narrowly specialized culture, but a mixed consortium containing fermentative lactic acid bacteria, acetic/oxidative bacteria, yeast, and additional bacterial groups with potentially distinct ecological roles.
The reduced functional guild view confirmed that mixed metabolic potential was already present at inoculation (Figure 7B). When the retained taxa were aggregated by functional guild, opportunistic/other bacteria accounted for 41.86% of the retained abundance, followed by LAB/fermentative taxa with 37.67%, acetic/oxidative taxa with 9.52%, and yeast/alcoholic taxa with 4.71%. This distribution supports the interpretation of the starting inoculum as a polymicrobial consortium with fermentative, oxidative, yeast-associated, and accessory bacterial components. These values should not be read as a full community-wide mass-balance reconstruction, but as a reduced functional summary of the dominant taxa retained in the figure.
The sequencing results were interpreted strictly as baseline inoculum context. They confirm that the kefir-derived broth introduced into the anodic chambers was a polymicrobial consortium containing fermentative, yeast-associated, acetic/oxidative, and opportunistic bacterial components. However, because sequencing was not performed longitudinally and was not conducted specifically on terminal anode-associated biofilms, these data cannot identify the taxa directly responsible for current generation, material-specific colonization, or extracellular electron-transfer activity. Therefore, the sequencing layer was used only to contextualize the biological complexity of the inoculum that generated the measured reactor-state trajectories. To address the mechanistic role of the detected consortium in current generation, Table 7 links the dominant baseline taxa and functional guilds to current-supporting metabolic functions. Because enzyme assays, transcriptomics, proteomics, and terminal anode-community sequencing were not performed, this table is interpreted as a consortium-level mechanistic framework supported by baseline sequencing, endpoint SEM morphology, and published bioelectrochemical knowledge, rather than as direct enzyme-specific proof.

3.5. FTIR Functional-Group Evidence Supporting the Fermentation–Redox–Biofilm Cascade

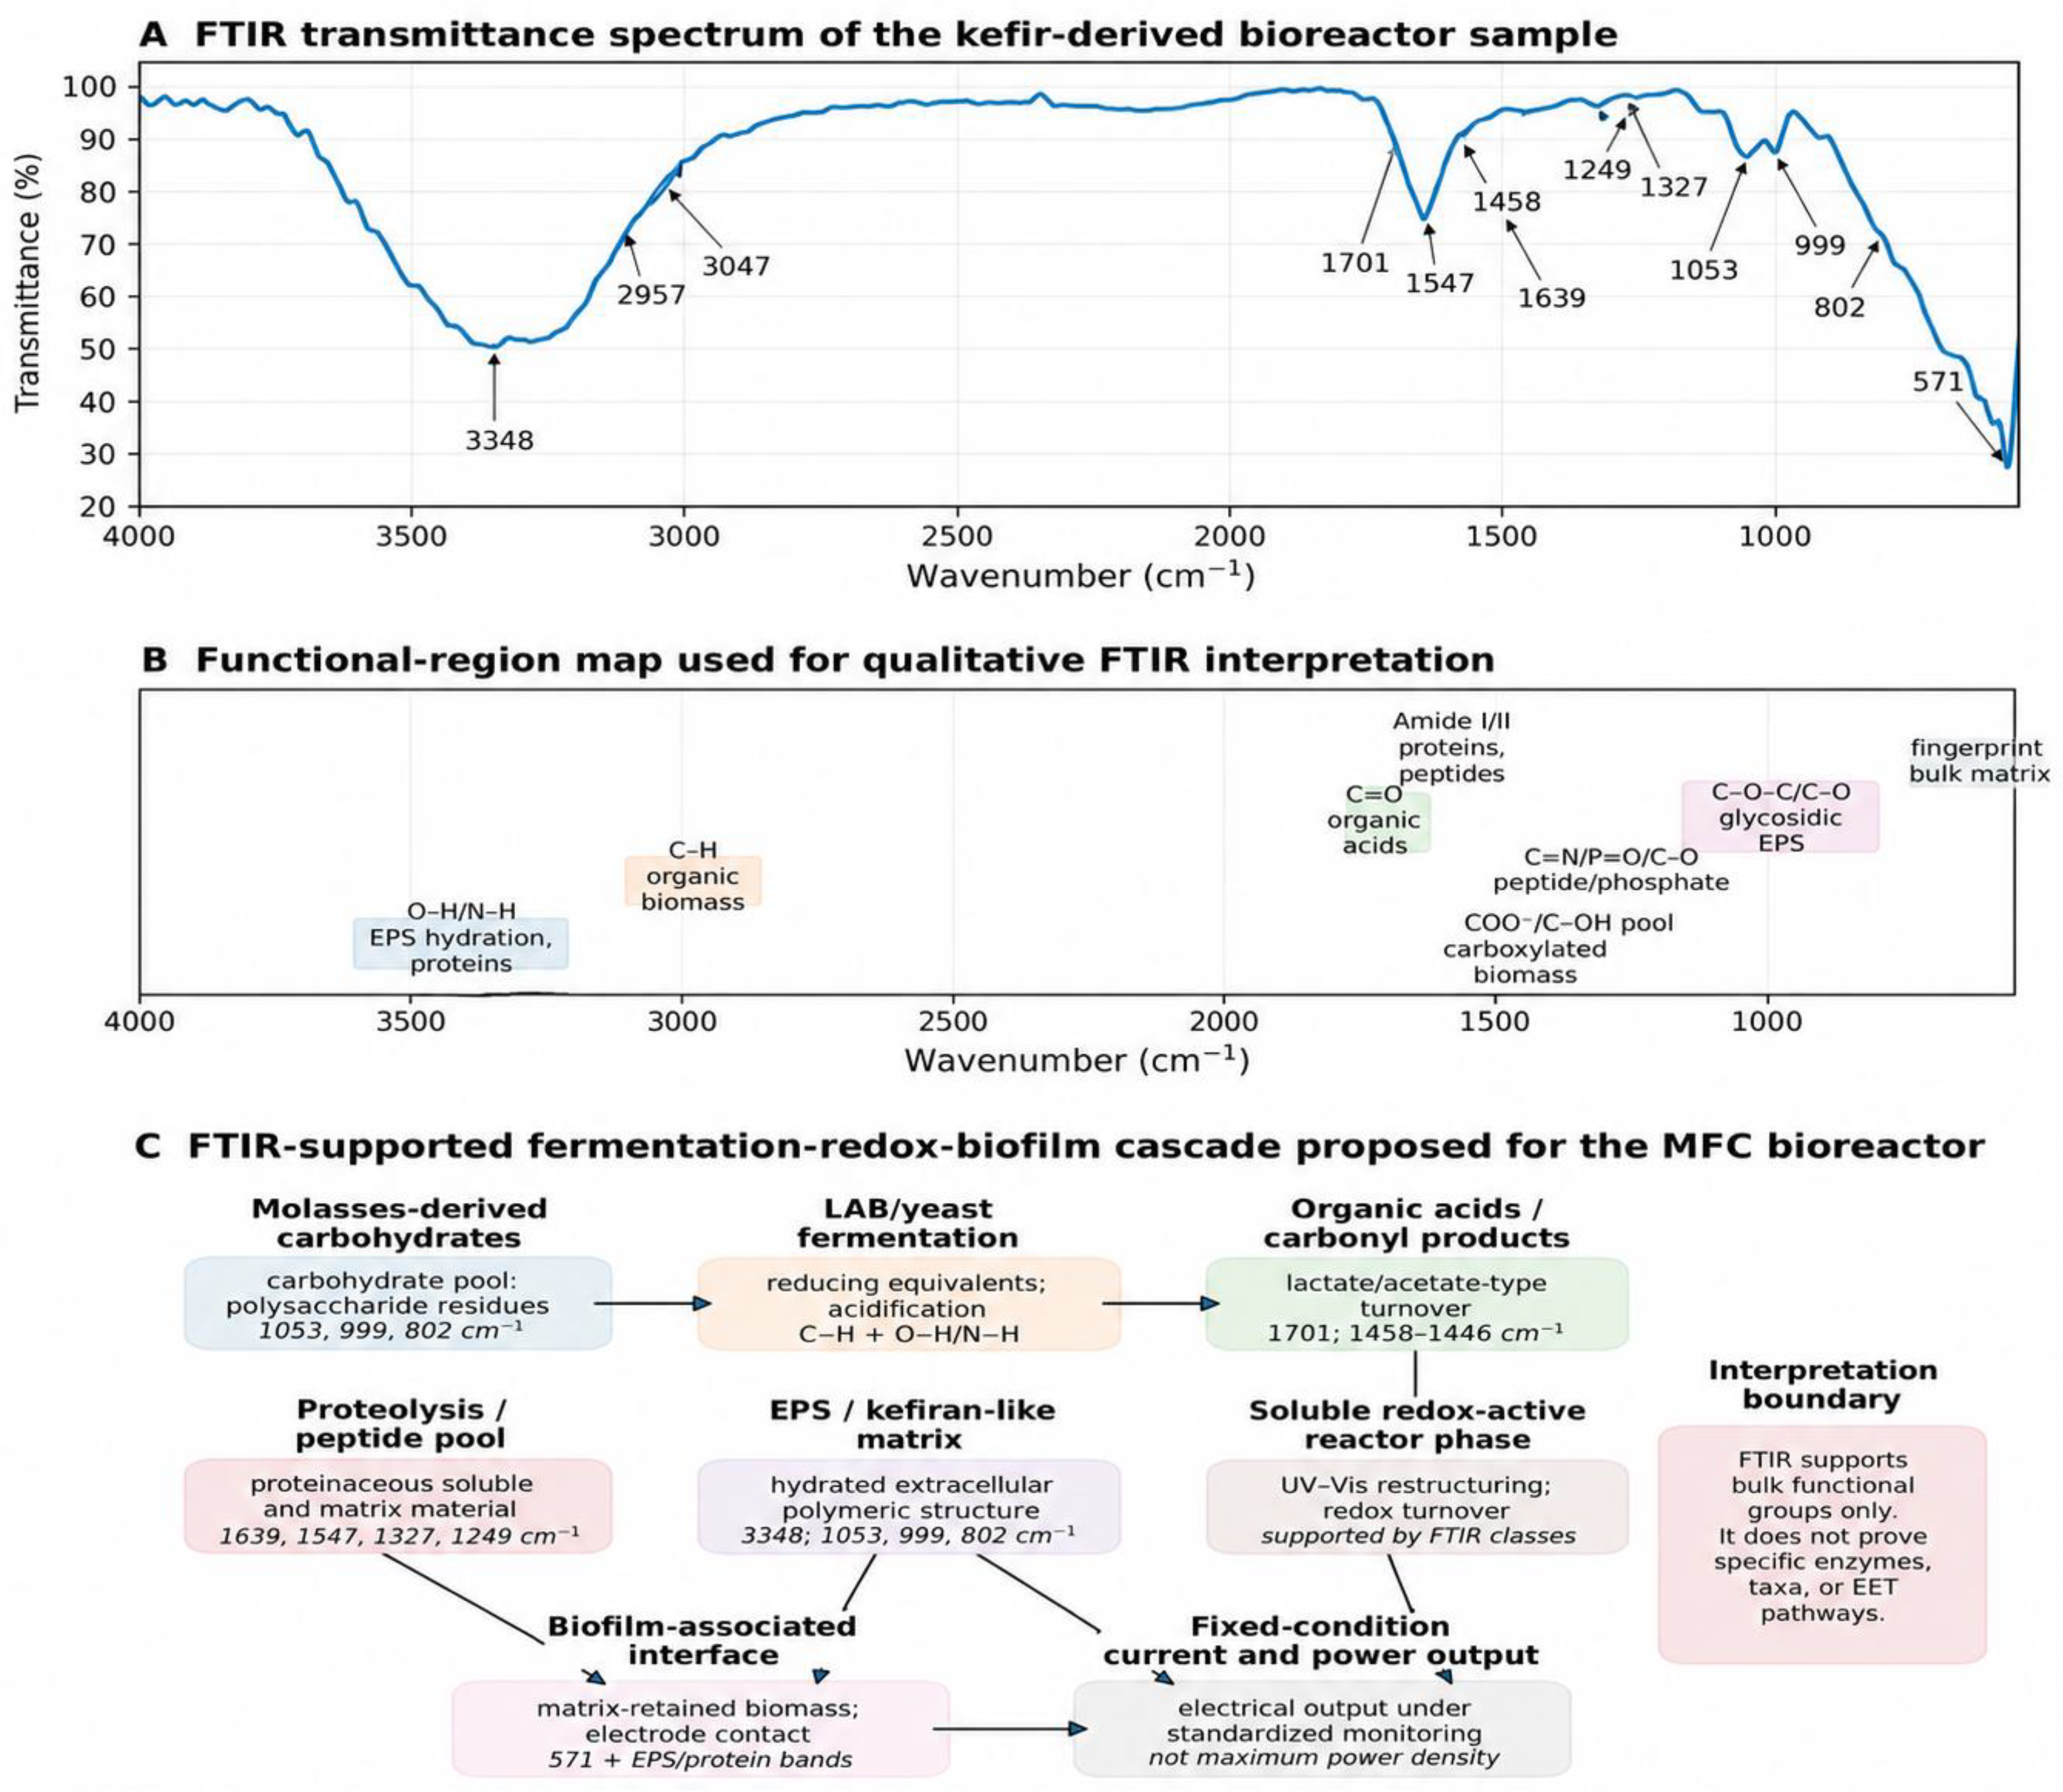
To complement the sequencing-based consortium interpretation, FTIR spectral features from the kefir-derived bioreactor sample were examined as bulk functional-group evidence. The spectrum showed a broad band at 3348 cm−1, assigned to O–H/N–H stretching, consistent with hydroxyl-rich polysaccharides, bound water, and proteinaceous or peptide-associated material. This feature supports the presence of hydrated extracellular matrix components and EPS-like structures in the kefir-derived reactor material.
Carbonyl- and carboxylate-associated regions were also observed. The band at 1701 cm−1 was assigned to C=O stretching, compatible with organic acids, esters, or carbonyl-rich fermentation products. Additional bands at 1458–1446 cm−1 were associated with CH2/CH3 bending and COO− vibrations, supporting the presence of biomass-associated organic material and carboxylated fermentation products. Together, these signals are consistent with a fermentation stage in which carbohydrate conversion generates organic-acid and carbonyl-containing intermediates.
Proteinaceous and peptide-rich signatures were represented by bands at 1639 and 1547 cm−1, corresponding to amide I and amide II regions, respectively. Additional bands at 1327 and 1249 cm−1 were assigned to C–N, amide III, P=O, and C–O contributions, supporting the presence of peptide-rich, phosphate-containing, or cellular biomass-associated material. These features align with the sequencing-based interpretation of a mixed consortium in which lactic-acid bacteria, yeasts, oxidative bacteria, and accessory taxa may contribute to proteolysis, biomass turnover, extracellular matrix formation, and soluble-phase restructuring.
The carbohydrate and EPS-related region was represented by bands at 1053, 999, and 802 cm−1, assigned to C–O–C, C–O, and glycosidic vibrations. These bands support the persistence of polysaccharide, sugar-residue, and kefiran-like matrix signatures. Therefore, the FTIR evidence supports a biochemical cascade from molasses-derived carbohydrates to fermentation products, peptides/proteins, EPS-like matrix material, and biofilm-associated extracellular structure (Table 8). This FTIR layer strengthens the interpretation that the reactor state was chemically structured even as current and fixed-condition apparent power declined. However, the assignments remain qualitative and should not be interpreted as direct identification of specific enzymes, metabolites, taxa, or extracellular electron-transfer pathways (Figure 8).

3.6. Predictive Model Testing, Inferential Diagnostics, and Descriptor-Level Interpretation

The final analytical layer tested whether current output could be predicted from the integrated semimechanistic reactor-state descriptor system while preserving interpretability under the fixed laboratory configuration. The hypotheses declared in Section 2.18 were evaluated using the predictive diagnostics, residual analyses, descriptor-stability tests, multivariate state analysis, and baseline comparison summarized in Figure 9 and Figure 10. This division was introduced to avoid overloading a single figure and to distinguish model performance diagnostics from biological and semimechanistic interpretation.
The integrated model showed strong agreement between predicted and measured current under grouped cross-validation by reactor identity. Predicted and measured current values were closely aligned, with R2 = 0.956, RMSE = 0.082 mA, MAE = 0.060 mA, an observed-versus-predicted slope of 1.009, Pearson’s r = 0.978, and a concordance correlation coefficient of 0.977 (Figure 9A). These metrics support H1 and indicate that the integrated descriptor system captured most of the structured current variation across reactor-specific validation partitions. Therefore, current output was not behaving as an isolated or weakly constrained endpoint; instead, it was strongly associated with the coordinated evolution of reactor-state descriptors.
Residual diagnostics provided a more nuanced interpretation of model behavior. The Q–Q plot showed departure from normality in the upper residual tail, and the Shapiro–Wilk test confirmed non-normal residual behavior (W = 0.914, p < 0.001; Figure 9B). However, the residual distribution remained centered close to zero, with a mean residual of 0.0014 mA and a median residual of −0.0086 mA. The Wilcoxon signed-rank test did not indicate a significant median residual shift (p = 0.155; Figure 9C), supporting the absence of systematic median bias. The residuals-versus-predicted profile showed state-dependent variance, and the Breusch–Pagan test indicated heteroscedasticity (χ2 = 93.33, p < 0.001; Figure 9D). These results partially support H2: the model was not residual-normal or fully homoscedastic, but the residuals remained centered and the predictive relationship was not dominated by systematic directional bias. Consequently, the model should be interpreted as a robust within-design predictive framework rather than as a residual-normal parametric regression model.
Descriptor stability and contribution were evaluated separately in Figure 10. The VIF profile showed values near 1.0 for the retained descriptor matrix and remained below the conservative threshold of 5 (Figure 10A), supporting H3 and indicating that the final predictor space was not dominated by problematic collinearity. This is relevant because the model intentionally combined descriptors derived from related physicochemical, optical, substrate-related, and electrochemical layers. The low VIF profile indicates that the retained model matrix preserved complementary information rather than relying on a single redundant predictor axis.
Permutation importance identified the UV–Vis soluble pool as the strongest incremental predictor of current output, followed by the temperature-weighted effective-transfer descriptor, the UV–Vis redox proxy, and redox-driving force (Figure 10B). The remaining descriptors, including substrate saturation, biofilm maturation, state index, solids loading, and electrolyte conductivity, showed lower incremental importance once the dominant soluble-phase and redox/effective-transfer descriptors were included. This ranking indicates that current predictability was organized primarily by the soluble UV-active extracellular pool and its redox/electrochemical context, rather than by residual substrate availability alone. Importantly, this does not imply that biofilm maturation was biologically irrelevant; rather, it indicates that, within the final predictive model, maturation contributed less incremental predictive gain after the soluble-phase and redox-linked descriptors had already encoded the dominant state information.
The PCA biplot further supported H4 by showing that the integrated descriptor space was structured as an operational reactor-state continuum rather than as an arbitrary point cloud (Figure 10C). The first two principal components explained 42.6% and 18.2% of the variance, respectively. Operational state labels separated along the descriptor axes, and the PERMANOVA result supported significant multivariate differentiation among states (pseudo-F = 203.35, p = 0.001). The PCA vectors indicated that UV–Vis soluble pool, redox-driving force, state index, electrolyte conductivity, maturation, and effective-transfer descriptors contributed to the organization of the occupied state space. Therefore, the reactor trajectory can be interpreted as a structured progression from early lag/substrate-rich conditions toward productive, competitive, and hyperproductive operational states.
Finally, the integrated model was compared with a reduced hybrid biofilm–redox/electrochemical reference trajectory (Figure 10D). The integrated model closely followed the daily measured current pattern, whereas the reduced hybrid baseline captured only a coarse tendency and failed to reproduce the full temporal structure of the response. The paired comparison of absolute error supported the advantage of the integrated model over the reduced baseline (Wilcoxon p < 0.001), with lower daily MAE for the integrated model than for the hybrid reference. This supports H5 and indicates that the full descriptor system provided additional explanatory value beyond a simplified theory-constrained approximation. However, because the hybrid curve was used only as an interpretive baseline and not as an independently trained predictive model, this comparison should be understood as evidence of added descriptor value within the present design, not as a universal benchmark across microbial fuel cell architectures.
Taken together, Figure 9 and Figure 10 support the central modeling conclusion of the study: current output in the kefir-driven salt-bridge microbial fuel cells was predictable from an integrated reactor-state representation under fixed laboratory conditions. The strongest predictive information was associated with soluble-phase UV–Vis restructuring and redox/effective-transfer descriptors, while multivariate ordination confirmed that the descriptor system encoded a coherent reactor-state continuum. These findings strengthen the interpretation that current generation was governed by coordinated reactor-state progression rather than by nominal anode category alone. Overall, the statistical evidence supported H1, H3, H4, and H5, and partially supported H2. The integrated descriptor system provided strong within-design current prediction, acceptable predictor stability, significant reactor-state organization, and lower error than the reduced hybrid baseline. H2 was only partially supported because residuals were centered near zero and showed no significant median bias, but they departed from normality and showed heteroscedasticity. Therefore, the model is best interpreted as a robust within-design current-prediction framework rather than as a residual-normal parametric model or a universal electrochemical performance predictor.

4. Discussion

This study shows that kefir-derived salt-bridge microbial fuel cells operated under fixed fed-batch laboratory conditions can be interpreted as time-dependent reactor-state systems. The dominant experimental pattern was not a simple material-ranking effect between graphite and graphene anodes, but a coordinated transition involving current decline, substrate depletion, sustained ultraviolet–visible soluble-phase restructuring, and endpoint surface colonization. Mean current decreased from 0.8985 mA at day 0 to 0.1133 mA at day 20, while residual glucose decreased from 5.3124 to 0.0127 g L−1 and the glucose-consumption fraction approached 0.9977. These values indicate that the main temporal transition was from a substrate-rich early state to a substrate-depleted late state [51,52,53].

4.1. Reactor-State Progression and Carbon Consumption

The temporal profiles support a phased interpretation of reactor behavior. The early interval was characterized by the highest electrical response, abundant residual glucose, and a rapidly changing biochemical environment, whereas the middle and late intervals showed progressive substrate depletion, decreasing current and voltage, and convergence toward a lower-output stabilized state. This pattern suggests that the decline in fixed-condition electrical output was primarily associated with carbon exhaustion and metabolic succession, not with instability in temperature or a catastrophic ORP shift. In mixed-culture bioelectrochemical systems, such transitions are expected because electrical generation emerges from the interaction between fermentative conversion, secondary metabolite turnover, and the gradual establishment of attached electroactive biomass [52,53,54,55].
The additional fixed-condition electrical-output descriptors strengthen this interpretation by showing that the reactors did not merely generate measurable current and voltage, but also produced quantifiable apparent power under standardized monitoring conditions. Apparent power declined from 0.8636 ± 0.8516 mW at day 0 to 0.0856 ± 0.0772 mW at day 20, matching the current decline and substrate-depletion trajectory. Cumulative charge and cumulative apparent energy further confirmed time-integrated electrical output, averaging 595.02 C and 456.69 J per reactor, respectively. These values support the use of the term microbial fuel cell for the evaluated system while maintaining the distinction between fixed-condition electrical-output descriptors and complete electrochemical power-performance characterization.
An important implication of this result is that reactor age and reactor state outweigh nominal material identity under the present configuration. The integrated descriptor framework showed that explanatory power was concentrated in maturation, substrate saturation, and soluble-phase optical/redox structure, whereas the retained graphite descriptor contributed little dynamic variation. Accordingly, the present dataset does not support interpreting performance predominantly through an anode-label narrative; instead, it favors a state-dependent interpretation in which electron-donor availability and biofilm development jointly regulate output [54,55,56].

4.2. UV–Vis Restructuring of the Soluble Phase and Redox Interpretation

The combined evolution of A260, A280, the A260/A280 ratio, and the UV–Vis-derived semimechanistic descriptors indicates that the soluble phase was not static but underwent continuous biochemical restructuring during operation. The ultraviolet–visible variables provided an additional layer of interpretation because they did not simply follow the electrical decline. A260 increased from 0.4992 to 0.7744, and A280 increased from 0.2579 to 0.7020, whereas the A260/A280 ratio decreased from 1.9142 to 1.1032. This pattern suggests that the soluble phase continued to restructure even after the major substrate signal had been consumed. However, these optical variables should be interpreted as operational proxies of soluble-phase composition and not as molecular identification of specific nucleic acids, proteins, mediators, or antioxidant compounds [57,58]. In that sense, the UV–Vis block was not merely descriptive; it captured a biologically meaningful dimension of reactor-state change. The FTIR layer complements this interpretation by providing bulk functional-group evidence for chemical classes that UV–Vis cannot resolve. Whereas A260, A280, and A260/A280 captured operational changes in the UV-responsive soluble fraction, FTIR supported the presence of hydroxyl-rich carbohydrates/EPS, proteinaceous and peptide-associated material, carbonyl-containing fermentation products, and glycosidic matrix structures. Therefore, the soluble-phase interpretation is strengthened by two complementary spectroscopic layers: UV–Vis as a time-resolved operational proxy and FTIR as a qualitative functional-group snapshot of the kefir-derived bioreactor material. The anode-configuration comparison should be interpreted cautiously. Graphene-anode reactors showed slightly higher mean current and voltage than graphite-anode reactors across the complete dataset, but the two anode groups differed in both material identity and macroscopic geometry. Consequently, the observed differences cannot be attributed exclusively to intrinsic material chemistry. The more defensible interpretation is that graphite and graphene represented two operational anode configurations embedded within the same salt-bridge fed-batch reactor architecture. This distinction is important because the strongest pattern in the dataset was the shared temporal reactor-state progression rather than a definitive material-only ranking.

4.3. Endpoint Biofilm Architecture and Interfacial Maturation

The SEM micrographs provide structural support for the maturation hypothesis inferred from the temporal and modeling analyses. The endpoint surfaces showed heterogeneous deposits, adhered particulate aggregates, coated fibers, and porous matrix-like regions, collectively indicating that the anode interface had transitioned toward a developed and spatially complex biofilm-associated structure. Such architectures are compatible with retained biomass, extracellular polymeric matrix accumulation, and localized microenvironments at the electrode surface.
This observation agrees with previous reports showing that structured conductive interfaces can favor biomass retention and stable electroactive colonization by increasing effective attachment area and supporting redox heterogeneity at the microscale [56,59,60]. At the same time, mature biofilms are not defined only by cell abundance but also by the accumulation of extracellular proteins, polysaccharides, and signaling-mediated matrix organization, all of which affect adhesion, diffusion, and electron-transfer behavior [61,62,63]. Therefore, the SEM evidence should be interpreted as morphological confirmation that interfacial maturation occurred, even though it does not by itself identify the exact extracellular electron-transfer route.

4.4. Endpoint Sequencing Context and Community Organization

The sequencing results reinforce the view that the kefir inoculum represented a functionally plural consortium rather than a single-purpose electrogenic culture. The retained dominance of lactic acid bacteria, together with the presence of acetic/oxidative taxa, yeasts, and additional opportunistic or environmentally versatile bacteria, supports the interpretation of the system as a metabolically layered community. In practical terms, this composition is consistent with a fermentation-to-bioelectrochemical cascade in which some members mainly transform carbohydrates, others reshape the soluble organic pool, and only a subset may participate more directly in anode-associated electroactivity [51,52,53,54,55].
This interpretation is important because it avoids an overstatement that the dataset cannot support. The sequencing panel provides ecological context, but it does not prove that the most abundant taxa were the dominant electron-transfer organisms at the electrode. Rather, it indicates that the inoculum contained the kinds of metabolic guilds capable of sustaining substrate breakdown, acetate-related turnover, matrix production, and interspecies exchange. Similar mixed-community organization has been reported in bioelectrochemical systems where electroactive performance depends on community-level complementarity rather than on a single taxon acting in isolation [54,60].
In response to the need for a clearer mechanism linking the microbial consortium to electrical output, the detected taxa are best interpreted as a cooperative fermentation–redox community rather than as isolated electrogenic species. Lactic-acid bacteria, including Lactococcus lactis, Lactobacillus helveticus, and Lactobacillus kefiranofaciens, likely contributed to carbohydrate conversion, acidification, peptide release, and extracellular matrix formation through glycolytic, proteolytic, lactate-producing, and EPS-associated metabolic systems. Saccharomyces cerevisiae may have supported sugar fermentation and the generation of reducing equivalents through glycolysis and NADH-linked fermentative metabolism, whereas Acetobacter and other oxidative bacteria may have contributed to secondary oxidation and redox turnover through alcohol dehydrogenase, aldehyde dehydrogenase, and membrane-associated redox systems. Additional bacterial groups, including Pseudomonas, Citrobacter, Acinetobacter, and Enterobacteriaceae-associated taxa, may have contributed to soluble redox-active metabolism or interspecies exchange through quinone/flavin-linked redox processes and dehydrogenase-associated reactions. This mechanism remains consortium-level and hypothesis-generating because enzyme activity, transcriptomic expression, proteomic profiles, and terminal anode-specific communities were not measured.
The FTIR functional-group profile provides additional chemical support for this consortium-level interpretation. The broad O–H/N–H band at 3348 cm−1, together with C–O–C/C–O and glycosidic bands at 1053, 999, and 802 cm−1, is consistent with hydroxyl-rich carbohydrates, polysaccharides, and EPS-like matrix material. These features align with the expected contribution of kefir-associated lactic-acid bacteria to carbohydrate transformation, acidification, and extracellular polymer formation. The amide-associated bands at 1639, 1547, 1327, and 1249 cm−1 support the presence of proteinaceous or peptide-rich extracellular material, consistent with proteolysis, microbial biomass, and extracellular matrix development. The carbonyl/carboxylate-related features around 1701 and 1458–1446 cm−1 are compatible with organic-acid and carboxylated fermentation products, linking sugar metabolism to lactate/acetate-type turnover. Therefore, the FTIR evidence supports a fermentation–redox–biofilm cascade in which carbohydrate-rich substrate conversion, peptide/protein release, EPS accumulation, organic-acid formation, and soluble-phase restructuring jointly shape the reactor state associated with current generation. However, these spectral assignments remain bulk functional-group evidence and should not be interpreted as direct proof of specific enzyme activity or taxon-specific electron transfer.

4.5. Predictive Significance of the Integrated Semimechanistic Descriptors

The predictive model demonstrates that the selected semimechanistic descriptors were not only biologically interpretable but also statistically informative. The strong agreement between predicted and measured current, the low prediction errors, the absence of systematic median residual bias, and the low VIF profile indicate that the retained descriptor matrix captured the dominant dimensions of reactor variability with limited redundancy. Descriptor-level interpretation further showed that the strongest incremental predictive information was associated with the UV–Vis soluble pool, the temperature-weighted effective-transfer descriptor, the UV–Vis redox proxy, and redox-driving force. This suggests that current output was governed primarily by soluble-phase restructuring and redox/electrochemical state organization rather than by residual substrate availability or nominal anode configuration alone.
The inclusion of apparent power, cumulative charge, and cumulative apparent energy also clarifies the electrical meaning of the predictive framework. Although current remained the main modeled response variable, the same voltage–current dataset demonstrated fixed-condition power output and time-integrated electrical generation. Therefore, the model should be interpreted as a reactor-state predictor of electrical-output behavior in a working MFC configuration, not as a replacement for polarization-derived power-density analysis.
From a methodological standpoint, this supports the use of hybrid pipelines that translate raw reactor measurements into state descriptors grounded in bioelectrochemical reasoning and then evaluate their predictive contribution through robust machine-learning workflows [40,41,42,43,44,45,46]. The poorer fit of the simplified baseline relative to the integrated semimechanistic model further indicates that the gain in explanatory capacity came specifically from encoding reactor state, not merely from smoothing the observed trajectory. Residual asymmetry at the highest predicted currents nevertheless suggests that the earliest high-output interval may still be influenced by fast variables not fully captured in the present descriptor set.

4.6. Mechanistic Synthesis of Reactor Maturation

Taken together, the results support a three-stage mechanistic interpretation. First, an early high-availability phase combined abundant fermentable substrate with rapid biochemical restructuring and comparatively high electrical output. Second, an intermediate consolidation phase was marked by continued soluble-phase transformation, increasing interfacial maturity, and a progressive decline in substrate saturation. Third, a late low-substrate phase retained a mature interface but operated under reduced energetic favorability, with lower current and a more depleted soluble electron-donor environment. The FTIR profile strengthens this three-stage interpretation because it shows functional groups compatible with the main biochemical layers expected in the cascade. Hydroxyl and glycosidic signals support carbohydrate and EPS persistence, amide bands support proteinaceous and peptide-rich matrix development, and carbonyl/carboxylate features support organic-acid turnover. Together with UV–Vis restructuring, SEM morphology, and baseline sequencing evidence, these FTIR signatures indicate that the late reactor state was not chemically inert; rather, it retained a structured extracellular matrix and metabolite pool even as current and apparent power declined.
This synthesis is consistent with the conceptual framework of electroactive biofilms as dynamic redox interfaces rather than passive surface deposits [57]. It is also compatible with electron-transfer theory and microbial electricity-generation models in which measurable current depends on both energetic driving force and the organization of extracellular pathways linking metabolism to the electrode [64,65]. In the present reactors, therefore, electrical output appears to have been regulated by the coupled evolution of carbon supply, soluble redox context, and biofilm/interfacial organization.

4.7. Practical Implications for Reactor Design and Optimization

The practical implication is that optimization of kefir-driven salt-bridge MFCs should focus less on nominal material comparisons in isolation and more on state-aware operation. The strongest intervention points suggested by the present data are the preservation of effective substrate availability, the control of transition windows before saturation collapse, and the maintenance of an interface favorable to stable biofilm retention. UV–Vis monitoring, especially when combined with simple electrochemical readouts, may offer a low-cost route for detecting when the system is moving from productive to depleted states.
Likewise, the SEM and modeling results together suggest that electrode design should aim to support biomass retention and structured colonization, but without assuming that surface material alone will dominate performance under all configurations [56,58,59]. In simple low-cost reactors such as the present salt-bridge system, the operational value may lie in integrating inexpensive monitoring proxies with biologically informed control logic rather than in relying exclusively on hardware substitution. The additional apparent-power and cumulative-output descriptors improve the practical relevance of the framework because they translate the monitored current and voltage responses into electrical-output terms directly relevant to MFC screening. In low-cost salt-bridge reactors, such descriptors can help identify whether a configuration produces sustained fixed-condition output before more resource-intensive assays, such as polarization, impedance, or coulombic-efficiency testing, are performed.
The sustainability relevance of this work lies in the use of a low-cost reactor architecture, a mixed microbial consortium, a molasses-based substrate, and inexpensive monitoring variables that can be integrated into a diagnostic framework. Rather than presenting the system as an optimized energy device, the results support its use as a screening platform for identifying reactor-state transitions under resource-limited laboratory conditions. This distinction is important because sustainable microbial fuel cell development requires scalable monitoring strategies as well as improved electrochemical performance.

4.8. Study Limitations and Future Work

This study provides evidence of current generation, fixed-condition apparent power output, cumulative charge, and cumulative apparent energy in laboratory-scale salt-bridge kefir-derived microbial fuel cells. However, it was not designed as a complete electrochemical power-performance characterization or scale-up validation. The experimental scope was restricted to fixed-condition electrical-output prediction and reactor-state interpretation under a laboratory-scale salt-bridge configuration. Accordingly, polarization curves, current–voltage/load-sweep assays, cyclic voltammetry, electrochemical impedance spectroscopy, chronoamperometry, coulombic-efficiency estimation, maximum power-density determination, and stack-level tests were not performed. Therefore, the reported power-related descriptors should be interpreted as fixed-condition apparent electrical-output metrics, not as optimized or maximum power-generation performance. Similarly, FTIR was used only as qualitative bulk functional-group evidence and not as compound-specific metabolomics, enzyme-activity measurement, or taxon-resolved mechanistic proof.
To address this limitation, future validation should include at least five complementary electrochemical and scale-up analyses: (i) polarization and current–voltage/load-sweep testing to determine maximum power density and internal-resistance behavior; (ii) cyclic voltammetry to interrogate redox-active extracellular processes and electrode-associated electron-transfer behavior; (iii) electrochemical impedance spectroscopy to separate ohmic, charge-transfer, and mass-transport contributions; (iv) chronoamperometry and coulombic-efficiency estimation to quantify temporal current stability and electron-recovery efficiency; and (v) stack-level or multi-cell validation to determine whether the reactor-state descriptors remain informative beyond isolated laboratory-scale cells. These assays should be combined with time-resolved microbial community profiling, electrode-surface quantification, and targeted characterization of soluble intermediates, matrix-associated proteins, and polysaccharides. Such extensions would convert the present predictive scaffold into a more complete electrochemical and mechanistic framework while preserving the practical advantage of low-cost reactor monitoring.

5. Conclusions

This study demonstrates that laboratory-scale salt-bridge kefir-driven microbial fuel cells can be interpreted as dynamic reactor-state systems under fixed fed-batch conditions. Across the 20-day operation, current output declined in parallel with substrate depletion, while UV–visible soluble-phase descriptors, redox context, and endpoint biofilm morphology indicated continued reactor-state restructuring.
The integrated semimechanistic descriptor framework improved interpretation by linking maturation, substrate accessibility, soluble-phase optical structure, FTIR-supported functional-group evidence, redox forcing, conductivity context, solids loading, and voltage-related behavior to current prediction. The random-forest model showed strong within-design predictive performance under grouped cross-validation, supporting the value of state-aware monitoring for low-cost microbial fuel cell screening.
These results support current generation, fixed-condition apparent power output, cumulative charge, and cumulative apparent energy in laboratory-scale salt-bridge kefir-derived microbial fuel cells. However, they should not be interpreted as complete electrochemical power-performance characterization because polarization, impedance, voltammetric, coulombic-efficiency, maximum power-density, and stack-level analyses were not performed. The main contribution is therefore a reproducible reactor-state framework for diagnosing, interpreting, and predicting fixed-condition electrical output in a kefir-driven MFC configuration.

Author Contributions

Conceptualization, S.V.-A., C.B.-S., G.V.-T. and M.Á.R.; methodology, S.V.-A., C.B.-S., M.V.-V., G.V.-T. and M.Á.R.; software, S.V.-A., C.B.-S. and M.V.-V.; validation, S.V.-A., C.B.-S. and M.Á.R.; formal analysis, S.V.-A., C.B.-S., M.V.-V. and M.Á.R.; investigation, S.V.-A., C.B.-S., G.V.-T., and M.Á.R.; resources, M.Á.R.; data curation, S.V.-A., C.B.-S., and M.V.-V.; writing—original draft preparation, S.V.-A. and M.V.-V.; writing—review and editing, S.V.-A., C.B.-S., M.V.-V., G.V.-T. and M.Á.R.; visualization, S.V.-A. and G.V.-T.; supervision, S.V.-A. and M.Á.R.; project administration, M.Á.R.; funding acquisition, C.B.-S. and M.Á.R. All authors have read and agreed to the published version of the manuscript.

Funding

This research received no external funding.

Institutional Review Board Statement

Not applicable.

Informed Consent Statement

Not applicable.

Data Availability Statement

The data supporting the findings of this study are available from the corresponding authors upon reasonable request.

Acknowledgments

The authors are grateful to the Universidad Estatal de Milagro (UNEMI) for supporting our publication.

Conflicts of Interest

The authors declare no conflicts of interest.

References

  1. Azizi, N.F.; Kumar, M.R.; Yeap, S.K.; Abdullah, J.O.; Khalid, M.; Omar, A.R.; Osman, M.A.; Syed Mortadza, S.A.; Alitheen, N.B. Kefir and Its Biological Activities. Foods 2021, 10, 1210. [Google Scholar] [CrossRef] [PubMed]
  2. Bourrie, B.C.T.; Willing, B.P.; Cotter, P.D. The Microbiota and Health Promoting Characteristics of the Fermented Beverage Kefir. Front. Microbiol. 2016, 7, 647. [Google Scholar] [CrossRef] [PubMed]
  3. Marsh, A.J.; O’Sullivan, O.; Hill, C.; Ross, R.P.; Cotter, P.D. Sequencing-Based Analysis of the Bacterial and Fungal Composition of Kefir Grains and Milks from Multiple Sources. PLoS ONE 2013, 8, e69371. [Google Scholar] [CrossRef] [PubMed]
  4. Walsh, A.M.; Crispie, F.; Kilcawley, K.; O’Sullivan, O.; O’Sullivan, M.G.; Claesson, M.J.; Cotter, P.D. Microbial Succession and Flavor Production in the Fermented Dairy Beverage Kefir. mSystems 2016, 1, e00052-16. [Google Scholar] [CrossRef] [PubMed]
  5. Fiorda, F.A.; de Melo Pereira, G.V.; Thomaz-Soccol, V.; Rakshit, S.K.; Pagnoncelli, M.G.B.; Vandenberghe, L.P.S.; Soccol, C.R. Microbiological, Biochemical, and Functional Aspects of Sugary Kefir Fermentation—A Review. Food Microbiol. 2017, 66, 86–95. [Google Scholar] [CrossRef] [PubMed]
  6. Maeda, H.; Zhu, X.; Suzuki, S.; Suzuki, K.; Kitamura, S. Structural Characterization and Biological Activities of an Exopolysaccharide Kefiran Produced by Lactobacillus kefiranofaciens WT-2BT. J. Agric. Food Chem. 2004, 52, 5533–5538. [Google Scholar] [CrossRef] [PubMed]
  7. Hamet, M.F.; Piermaria, J.A.; Abraham, A.G. Selection of EPS-Producing Lactobacillus Strains Isolated from Kefir Grains and Rheological Characterization of the Fermented Milks. LWT Food Sci. Technol. 2015, 63, 129–135. [Google Scholar] [CrossRef]
  8. Ebner, J.; Asci Arslan, A.; Fedorova, M.; Hoffmann, R.; Kücükçetin, A.; Pischetsrieder, M. Peptide Profiling of Bovine Kefir Reveals 236 Unique Peptides Released from Caseins during Its Production by Starter Culture or Kefir Grains. J. Proteom. 2015, 117, 41–57. [Google Scholar] [CrossRef] [PubMed]
  9. Huang, C.; Kok, J. Editing of the Proteolytic System of Lactococcus lactis Increases Its Bioactive Potential. Appl. Environ. Microbiol. 2020, 86, e01319-20. [Google Scholar] [CrossRef] [PubMed]
  10. Li, Y.; Hugenholtz, J.; Abee, T.; Molenaar, D. Glutathione Protects Lactococcus lactis against Oxidative Stress. Appl. Environ. Microbiol. 2003, 69, 5739–5745. [Google Scholar] [CrossRef] [PubMed]
  11. Logan, B.E. Exoelectrogenic Bacteria That Power Microbial Fuel Cells. Nat. Rev. Microbiol. 2009, 7, 375–381. [Google Scholar] [CrossRef] [PubMed]
  12. Lovley, D.R. Powering Microbes with Electricity: Direct Electron Transfer from Electrodes to Microbes. Environ. Microbiol. Rep. 2011, 3, 27–35. [Google Scholar] [CrossRef] [PubMed]
  13. Lovley, D.R. Electromicrobiology. Annu. Rev. Microbiol. 2012, 66, 391–409. [Google Scholar] [CrossRef] [PubMed]
  14. Martinez, C.M.; Alvarez, L.H. Application of Redox Mediators in Bioelectrochemical Systems. Biotechnol. Adv. 2018, 36, 1412–1423. [Google Scholar] [CrossRef] [PubMed]
  15. Moscoviz, R.; Toledo-Alarcón, J.; Trably, E.; Bernet, N. Electro-Fermentation: How To Drive Fermentation Using Electrochemical Systems. Trends Biotechnol. 2016, 34, 856–865. [Google Scholar] [CrossRef] [PubMed]
  16. Schievano, A.; Sciarria, T.P.; Vanbroekhoven, K.; De Wever, H.; Puig, S.; Andersen, S.J.; Rabaey, K.; Pant, D. Electro-Fermentation—Merging Electrochemistry with Fermentation in Industrial Applications. Trends Biotechnol. 2016, 34, 866–878. [Google Scholar] [CrossRef] [PubMed]
  17. Drendel, G.; Mathews, E.R.; Semenec, L.; Franks, A.E. Microbial Fuel Cells, Related Technologies, and Their Applications. Appl. Sci. 2018, 8, 2384. [Google Scholar] [CrossRef]
  18. Santoro, C.; Arbizzani, C.; Erable, B.; Ieropoulos, I. Microbial Fuel Cells: From Fundamentals to Applications. A review. J. Power Sources 2017, 356, 225–244. [Google Scholar] [CrossRef] [PubMed]
  19. Santoro, C.; Guilizzoni, M.; Correa Baena, J.P.; Pasaogullari, U.; Casalegno, A.; Li, B.; Babanova, S.; Artyushkova, K.; Atanassov, P. The Effects of Carbon Electrode Surface Properties on Bacteria Attachment and Start up Time of Microbial Fuel Cells. Carbon 2014, 67, 128–139. [Google Scholar] [CrossRef]
  20. Gao, X.; Qiu, S.; Lin, Z.; Xie, X.; Yin, W.; Lu, X. Carbon-Based Composites as Anodes for Microbial Fuel Cells: Recent Advances and Challenges. ChemPlusChem 2021, 86, 1322–1341. [Google Scholar] [CrossRef] [PubMed]
  21. Logan, B.E.; Hamelers, B.; Rozendal, R.; Schröder, U.; Keller, J.; Freguia, S.; Aelterman, P.; Verstraete, W.; Rabaey, K. Microbial Fuel Cells: Methodology and Technology. Environ. Sci. Technol. 2006, 40, 5181–5192. [Google Scholar] [CrossRef] [PubMed]
  22. Vishwanathan, A.S. Microbial fuel cells: A comprehensive review for beginners. 3 Biotech 2021, 11, 248. [Google Scholar] [CrossRef] [PubMed]
  23. Min, B.; Logan, B.E. Continuous electricity generation from domestic wastewater and organic substrates in a flat-plate microbial fuel cell. Environ. Sci. Technol. 2004, 38, 5809–5814. [Google Scholar] [CrossRef] [PubMed]
  24. Min, B.; Cheng, S.; Logan, B.E. Electricity generation using membrane and salt bridge microbial fuel cells. Water Res. 2005, 39, 1675–1686. [Google Scholar] [CrossRef] [PubMed]
  25. Sevda, S.; Sreekrishnan, T.R. Effect of salt concentration and mediators in salt bridge microbial fuel cell for electricity generation from synthetic wastewater. J. Environ. Sci. Health A 2012, 47, 878–886. [Google Scholar] [CrossRef] [PubMed]
  26. Pant, D.; Van Bogaert, G.; Diels, L.; Vanbroekhoven, K. A review of the substrates used in microbial fuel cells (MFCs) for sustainable energy production. Bioresour. Technol. 2010, 101, 1533–1543. [Google Scholar] [CrossRef] [PubMed]
  27. Pandey, P.; Shinde, V.N.; Deopurkar, R.L.; Kale, S.P.; Patil, S.A.; Pant, D. Recent advances in the use of different substrates in microbial fuel cells toward wastewater treatment and simultaneous energy recovery. Appl. Energy 2016, 168, 706–723. [Google Scholar] [CrossRef]
  28. Pant, D.; Singh, A.; Van Bogaert, G.; Olsen, S.I.; Nigam, P.S.; Diels, L.; Vanbroekhoven, K. Bioelectrochemical systems (BES) for sustainable energy production and product recovery from organic wastes and industrial wastewaters. RSC Adv. 2012, 2, 1248–1263. [Google Scholar] [CrossRef]
  29. Wang, H.; Park, J.-D.; Ren, Z.J. Practical energy harvesting for microbial fuel cells: A review. Environ. Sci. Technol. 2015, 49, 3267–3277. [Google Scholar] [CrossRef] [PubMed]
  30. Caporaso, J.G.; Lauber, C.L.; Walters, W.A.; Berg-Lyons, D.; Huntley, J.; Fierer, N.; Owens, S.M.; Betley, J.; Fraser, L.; Bauer, M.; et al. Ultra-high-throughput microbial community analysis on the Illumina HiSeq and MiSeq platforms. ISME J. 2012, 6, 1621–1624. [Google Scholar] [CrossRef] [PubMed]
  31. Klindworth, A.; Pruesse, E.; Schweer, T.; Peplies, J.; Quast, C.; Horn, M.; Glöckner, F.O. Evaluation of general 16S ribosomal RNA gene PCR primers for classical and next-generation sequencing-based diversity studies. Nucleic Acids Res. 2013, 41, e1. [Google Scholar] [CrossRef] [PubMed]
  32. Callahan, B.J.; McMurdie, P.J.; Rosen, M.J.; Han, A.W.; Johnson, A.J.A.; Holmes, S.P. DADA2: High-resolution sample inference from Illumina amplicon data. Nat. Methods 2016, 13, 581–583. [Google Scholar] [CrossRef] [PubMed]
  33. Bolyen, E.; Rideout, J.R.; Dillon, M.R.; Bokulich, N.A.; Abnet, C.C.; Al-Ghalith, G.A.; Alexander, H.; Alm, E.J.; Arumugam, M.; Asnicar, F.; et al. Reproducible, interactive, scalable and extensible microbiome data science using QIIME 2. Nat. Biotechnol. 2019, 37, 852–857. [Google Scholar] [CrossRef] [PubMed]
  34. Monod, J. The growth of bacterial cultures. Annu. Rev. Microbiol. 1949, 3, 371–394. [Google Scholar] [CrossRef]
  35. Picioreanu, C.; Head, I.M.; Katuri, K.P.; van Loosdrecht, M.C.M.; Scott, K. A computational model for biofilm-based microbial fuel cells. Water Res. 2007, 41, 2921–2940. [Google Scholar] [CrossRef] [PubMed]
  36. Pinto, R.P.; Srinivasan, B.; Manuel, M.-F.; Tartakovsky, B. A two-population bio-electrochemical model of a microbial fuel cell. Bioresour. Technol. 2010, 101, 5256–5265. [Google Scholar] [CrossRef] [PubMed]
  37. Hamelers, H.V.M.; Ter Heijne, A.; Stein, N.; Rozendal, R.A.; Buisman, C.J.N. Butler-Volmer-Monod model for describing bio-anode polarization curves. Bioresour. Technol. 2011, 102, 381–387. [Google Scholar] [CrossRef] [PubMed]
  38. Read, S.T.; Dutta, P.; Bond, P.L.; Keller, J.; Rabaey, K. Initial development and structure of biofilms on microbial fuel cell anodes. BMC Microbiol. 2010, 10, 98. [Google Scholar] [CrossRef] [PubMed]
  39. Roberts, J.; Power, A.; Chapman, J.; Chandra, S.; Cozzolino, D. The Use of UV-Vis Spectroscopy in Bioprocess and Fermentation Monitoring. Fermentation 2018, 4, 18. [Google Scholar] [CrossRef]
  40. Gadkari, S.; Fontmorin, J.-M.; Yu, E.; Sadhukhan, J. Influence of temperature and other system parameters on microbial fuel cell performance: Numerical and experimental investigation. Chem. Eng. J. 2020, 388, 124176. [Google Scholar] [CrossRef]
  41. Gadkari, S.; Shemfe, M.; Sadhukhan, J. Microbial fuel cells: A fast converging dynamic model for assessing system performance based on bioanode kinetics. Int. J. Hydrogen Energy 2019, 44, 15377–15386. [Google Scholar] [CrossRef]
  42. Gadkari, S.; Sadhukhan, J. A robust correlation based on dimensional analysis to characterize microbial fuel cells. Sci. Rep. 2020, 10, 8407. [Google Scholar] [CrossRef] [PubMed]
  43. Garg, A.; Vijayaraghavan, V.; Mahapatra, S.K.; Tai, K.; Wong, C.H. Performance evaluation of microbial fuel cell by artificial intelligence methods. Expert Syst. Appl. 2014, 41, 1389–1399. [Google Scholar] [CrossRef]
  44. Roberts, D.R.; Bahn, V.; Ciuti, S.; Boyce, M.S.; Elith, J.; Guillera-Arroita, G.; Hauenstein, S.; Lahoz-Monfort, J.J.; Schröder, B.; Thuiller, W.; et al. Cross-validation strategies for data with temporal, spatial, hierarchical, or phylogenetic structure. Ecography 2017, 40, 913–929. [Google Scholar] [CrossRef]
  45. O’Brien, R.M. A Caution Regarding Rules of Thumb for Variance Inflation Factors. Qual. Quant. 2007, 41, 673–690. [Google Scholar] [CrossRef]
  46. Breusch, T.S.; Pagan, A.R. A simple test for heteroscedasticity and random coefficient variation. Econometrica 1979, 47, 1287–1294. [Google Scholar] [CrossRef]
  47. Shapiro, S.S.; Wilk, M.B. An analysis of variance test for normality (complete samples). Biometrika 1965, 52, 591–611. [Google Scholar] [CrossRef]
  48. Lin, L.I.-K. A Concordance Correlation Coefficient to Evaluate Reproducibility. Biometrics 1989, 45, 255–268. [Google Scholar] [CrossRef]
  49. Wilcoxon, F. Individual Comparisons by Ranking Methods. Biom. Bull. 1945, 1, 80–83. [Google Scholar] [CrossRef]
  50. Anderson, M.J. A New Method for Non-Parametric Multivariate Analysis of Variance. Austral Ecol. 2001, 26, 32–46. [Google Scholar] [CrossRef]
  51. Prado, M.R.; Blandón, L.M.; Vandenberghe, L.P.S.; Rodrigues, C.; Castro, G.R.; Thomaz-Soccol, V.; Soccol, C.R. Milk Kefir: Composition, Microbial Cultures, Biological Activities, and Related Products. Front. Microbiol. 2015, 6, 1177. [Google Scholar] [CrossRef] [PubMed]
  52. Garofalo, C.; Osimani, A.; Milanović, V.; Aquilanti, L.; De Filippis, F.; Stellato, G.; Di Mauro, S.; Turchetti, B.; Buzzini, P.; Ercolini, D.; et al. Bacteria and Yeast Microbiota in Milk Kefir Grains from Different Italian Regions. Food Microbiol. 2015, 49, 123–133. [Google Scholar] [CrossRef] [PubMed]
  53. Blasche, S.; Kim, Y.; Mars, R.A.T.; Machado, D.; Maansson, M.; Kafkia, E.; Milanese, A.; Zeller, G.; Teusink, B.; Nielsen, J.; et al. Metabolic Cooperation and Spatiotemporal Niche Partitioning in a Kefir Microbial Community. Nat. Microbiol. 2021, 6, 196–208. [Google Scholar] [CrossRef] [PubMed]
  54. Pihlanto, A. Antioxidative Peptides Derived from Milk Proteins. Int. Dairy J. 2006, 16, 1306–1314. [Google Scholar] [CrossRef]
  55. Tonolo, F.; Fiorese, F.; Moretto, L.; Folda, A.; Scalcon, V.; Grinzato, A.; Ferro, S.; Arrigoni, G.; Bindoli, A.; Feller, E.; et al. Identification of New Peptides from Fermented Milk Showing Antioxidant Properties: Mechanism of Action. Antioxidants 2020, 9, 117. [Google Scholar] [CrossRef] [PubMed]
  56. Reinoso, M.Á.; Valle-Asan, S.; Huilcarema-Enríquez, K.; León-Plúas, E. Integrated Biocatalysis in Microbial Fuel Cells: Coupling Saccharomyces cerevisiae Fermentation and Acetobacter aceti Oxidation for Biomass Valorization. Energies 2026, 19, 1004. [Google Scholar] [CrossRef]
  57. Moscoviz, R.; Trably, E.; Bernet, N. Electro-Fermentation Triggering Population Selection in Mixed-Culture Glycerol Fermentation. Microb. Biotechnol. 2018, 11, 74–83. [Google Scholar] [CrossRef] [PubMed]
  58. Kracke, F.; Lai, B.; Yu, S.; Krömer, J.O. Balancing Cellular Redox Metabolism in Microbial Electrosynthesis and Electro Fermentation—A Chance for Metabolic Engineering. Metab. Eng. 2018, 45, 109–120. [Google Scholar] [CrossRef] [PubMed]
  59. Flemming, H.-C.; Wingender, J.; Szewzyk, U.; Steinberg, P.; Rice, S.A.; Kjelleberg, S. Biofilms: An Emergent Form of Bacterial Life. Nat. Rev. Microbiol. 2016, 14, 563–575. [Google Scholar] [CrossRef] [PubMed]
  60. Karthikeyan, R.; Sathish Kumar, K.; Murugesan, M.; Berchmans, S.; Yegnaraman, V. Bioelectrocatalysis of Acetobacter aceti and Gluconobacter roseus for Current Generation. Environ. Sci. Technol. 2009, 43, 8684–8689. [Google Scholar] [CrossRef] [PubMed]
  61. Islam, M.A.; Karim, A.; Mishra, P.; Dubowski, J.J.; Yousuf, A.; Sarmin, S.; Khan, M.M.R. Microbial Synergistic Interactions Enhanced Power Generation in Co-Culture Driven Microbial Fuel Cell. Sci. Total Environ. 2020, 738, 140138. [Google Scholar] [CrossRef] [PubMed]
  62. Ren, J.; Li, N.; Du, M.; Zhang, Y.; Hao, C.; Hu, R. Study on the Effect of Synergy Effect between the Mixed Cultures on the Power Generation of Microbial Fuel Cells. Bioengineered 2021, 12, 844–854. [Google Scholar] [CrossRef] [PubMed]
  63. Banerjee, A.; Calay, R.K.; Mustafa, M. Review on Material and Design of Anode for Microbial Fuel Cell. Energies 2022, 15, 2283. [Google Scholar] [CrossRef]
  64. Oyedeji, M.O.; Alharbi, A.; Aldhaifallah, M.; Rezk, H. Optimal Data-Driven Modelling of a Microbial Fuel Cell. Energies 2023, 16, 4740. [Google Scholar] [CrossRef]
  65. Dakal, T.C.; Singh, N.; Kaur, A.; Dhillon, P.K.; Bhatankar, J.; Meena, R.; Sharma, R.K.; Gadi, B.R.; Sahu, B.S.; Patel, A.; et al. New Horizons in Microbial Fuel Cell Technology: Applications, Challenges, and Prospects. Biotechnol. Biofuels Bioprod. 2025, 18, 79. [Google Scholar] [CrossRef] [PubMed]
Figure 1. Conceptual operational framework linking molasses-derived substrate conversion, kefir-consortium fermentation, soluble redox-active pool formation, and anodic current output in laboratory-scale salt-bridge microbial fuel cells. The diagram summarizes the operational cascade from substrate entry and hydrolysis to glycolytic/fermentative processing, lactate-, ethanol-, acetate-, organic-acid-, and gas-associated pathways, soluble reducing-equivalent/redox-active pool formation, and final anodic electron-sink/current-output response. Colors distinguish the main process domains: green indicates substrate entry, dark red/pink indicates central fermentation pathways, blue indicates fermentation by-products, orange indicates acetate/oxidative-taxa-associated routes, beige indicates the soluble redox-active pool, and brown indicates anodic current output. Solid arrows represent principal operational flow relationships, dashed orange arrows indicate hypothesized oxidative or interconversion routes, and circled minus symbols indicate negative or inhibitory redox-associated influences. The figure is intended as a conceptual and operational interpretation framework and should not be read as direct evidence of a specific extracellular electron-transfer pathway, individual enzyme activity, or taxon-specific mechanism.
Energies 19 03156 g001
Figure 2. Experimental reactor architecture and analytical workflow used for current-output prediction in laboratory-scale salt-bridge kefir-driven microbial fuel cells. (A) Double-chamber reactor configuration showing the oxygen-limited anodic chamber containing kefir inoculum, molasses substrate, and kefir-grain biomass; the aerated cathodic chamber containing the zinc cathode; the agar–NaCl salt bridge enabling ion/proton transport; and the external circuit used to record electrical output. Graphene plates and graphite rods were evaluated as alternative anode configurations in separate reactors, not sequentially within the same reactor. The anodic chamber received 10 mL molasses pulses every 48 h and was sampled daily with 5 mL anodic withdrawals. (B) Simplified analytical and modeling workflow from 33 reactors and daily monitoring from D0–D20 to measured-variable integration, semimechanistic descriptor construction, grouped cross-validation by reactor identity, and random-forest-based current prediction. Colors distinguish the anodic and cathodic compartments, ion/proton transport, measured-variable groups, descriptor families, reactor groups, and model outputs. Arrows indicate the operational flow from reactor setup and daily monitoring to descriptor construction, grouped validation, and current-output prediction.
Energies 19 03156 g002
Figure 3. Temporal evolution of measured experimental variables in laboratory-scale salt-bridge kefir-driven microbial fuel cells equipped with graphene and graphite anode configurations. Graphene-anode reactors are shown with solid lines and circular markers, whereas graphite-anode reactors are shown with dashed lines and square markers. Lines represent mean values across reactors, and shaded bands represent standard deviation. Panels show current (mA) (A), voltage (V) (B), oxidation–reduction potential (ORP, mV) (C), temperature (°C) (D), residual glucose concentration (g/L) (E), consumed glucose concentration (g/L) (F), glucose-consumption fraction (−) (G), electrical conductivity (EC, µS/cm) (H), total dissolved solids (TDS, ppm) (I), A260 (AU) (J), A280 (AU) (K), and A260/A280 ratio (−) (L). The two anode configurations are overlaid within each panel to compare their operational trajectories under the same fed-batch salt-bridge reactor conditions.
Energies 19 03156 g003
Figure 4. Fixed-condition apparent power output in laboratory-scale salt-bridge kefir-derived microbial fuel cells. Apparent power was calculated as P a p p = V × I using the daily voltage and current measurements obtained under standardized monitoring conditions. Lines represent mean values across independent reactors, and shaded bands represent standard deviation for each anode configuration. The inset summarizes time-integrated cumulative charge and cumulative apparent energy from days 0–20 using trapezoidal numerical integration. These descriptors support measurable fixed-condition electrical output in the evaluated MFCs, but they should not be interpreted as maximum power, power density, coulombic efficiency, or complete electrochemical power-performance characterization.
Energies 19 03156 g004
Figure 5. Temporal evolution of integrated reactor-state descriptors in laboratory-scale salt-bridge kefir-driven microbial fuel cells equipped with graphene and graphite anode configurations. Graphene-anode reactors are shown with solid lines and circular markers, whereas graphite-anode reactors are shown with dashed lines and square markers. Lines represent mean values across reactors, and shaded bands represent standard deviation. Panels show the biofilm maturation index (A), normalized substrate saturation (B), UV–Vis soluble-phase structure (C), UV–Vis redox proxy (D), effective redox driving force (E), electrolyte conductivity index (F), solids loading index (G), reversible-potential approximation (V) (H), and qualitative ET organization term (I). The two anode configurations are overlaid within each panel to compare their descriptor-level trajectories under identical fed-batch salt-bridge reactor conditions.
Energies 19 03156 g005
Figure 6. Endpoint scanning electron microscopy of the day-20 graphene anode from laboratory-scale salt-bridge kefir-driven microbial fuel cells. (A) High-magnification micrograph showing dense particulate deposits and matrix-like material distributed over an irregular graphene surface. (B) High-magnification view of an elongated surface feature with adherent particles and extracellular matrix-like deposits along the electrode interface. (C) High-magnification micrograph showing compact aggregates, surface coatings, and heterogeneous attached material consistent with endpoint biofilm-associated deposition. (D) Lower-magnification view showing a porous and reticulated surface architecture with cavities and interconnected regions coated by extracellular material. Samples were fixed in 2.5% glutaraldehyde, dehydrated through graded ethanol solutions from 30% to 100%, dried, sputter-coated with Au/Pd at approximately 10 nm, and imaged using a SIGMA 500 field-emission scanning electron microscope in secondary electron mode at 20 kV. Representative images were acquired from 350× to 10,000× magnification. The micrographs document attached biomass, extracellular matrix-like deposits, particulate adhesion, and heterogeneous surface organization, but they do not provide direct evidence of specific extracellular electron-transfer pathways.
Energies 19 03156 g006
Figure 7. Baseline sequencing context of the initial kefir inoculum used in salt-bridge microbial fuel cells. (A) Dominant taxa retained in the reduced taxonomic representation of the starting kefir-derived consortium. (B) Aggregated retained relative abundance of the corresponding functional guilds, grouping lactic-acid/fermentative taxa, acetic/oxidative taxa, yeast/alcoholic taxa, and opportunistic or other bacterial groups. The figure provides biological context for the inoculum introduced into the anodic chambers and should not be interpreted as evidence of terminal reactor-community assembly, anode-specific colonization, or taxon-specific extracellular electron-transfer activity.
Energies 19 03156 g007
Figure 8. FTIR functional-group analysis of the kefir-derived MFC bioreactor sample. (A) FTIR transmittance spectrum acquired from the kefir-derived bioreactor sample using ATR-FTIR. Main spectral features are annotated at 3348, 3047, 2997, 1701, 1639, 1547, 1458, 1446, 1327, 1249, 1053, 999, 802, and 571 cm−1. (B) Functional-region map used for qualitative interpretation of hydroxyl/protein, aliphatic, carbonyl, amide, carboxylate, phosphate, glycosidic, and fingerprint regions. (C) FTIR-supported fermentation–redox–biofilm cascade linking molasses-derived carbohydrates, LAB/yeast fermentation, organic-acid/carbonyl-product formation, proteolysis/peptide release, EPS/kefiran-like matrix development, soluble redox-active reactor-phase restructuring, biofilm-associated interface formation, and fixed-condition current and power output. Colors distinguish the main biochemical domains of the proposed cascade, including carbohydrate-derived inputs, fermentation products, proteinaceous/peptide pools, EPS-like matrix components, soluble redox-active phases, biofilm-associated structures, electrical-output interpretation, and interpretation boundaries. Arrows indicate the proposed operational progression among these biochemical and reactor-state domains. FTIR assignments are interpreted as qualitative bulk functional-group evidence and not as compound-specific, enzyme-specific, taxon-specific, or direct extracellular electron-transfer evidence.
Energies 19 03156 g008
Figure 9. Predictive performance and residual diagnostic structure of the integrated semimechanistic random-forest model for current output. (A) Predicted versus measured current under grouped cross-validation by reactor identity. The dashed orange line indicates the 1:1 agreement line, and the inset reports R2, RMSE, MAE, observed-versus-predicted slope, Pearson correlation, and concordance correlation coefficient. (B) Quantile–quantile plot of model residuals with Shapiro–Wilk residual-normality screening. The solid orange line represents the theoretical Q–Q reference line. (C) Residual histogram showing the residual location around zero and nonparametric residual-location testing. The dashed orange vertical line indicates zero residual. (D) Residuals versus predicted current with Breusch–Pagan heteroscedasticity screening. The dashed orange horizontal line indicates zero residual.
Energies 19 03156 g009
Figure 10. Descriptor-level interpretability, reactor-state organization, and reduced-baseline comparison of the integrated current-prediction framework. (A) Variance inflation factor profile of the retained model matrix after orthogonalization, showing acceptable collinearity behavior relative to the VIF = 5 threshold. (B) Permutation importance of the retained semimechanistic descriptors, expressed as mean reduction in predictive performance across repeated permutations. (C) PCA biplot of the integrated descriptor space with operational state labels overlaid and PERMANOVA-based multivariate state differentiation. Arrows indicate descriptor loading direction and relative contribution to the first two principal components. (D) Daily current trajectory comparing measured current, the integrated semimechanistic model, and the reduced hybrid biofilm–redox/electrochemical baseline. The reduced hybrid curve was used only as an interpretive reference and not as an independently optimized predictive model.
Energies 19 03156 g010
Table 1. Literature-supported evidence map underlying the conceptual operational framework shown in Figure 1.
Framework BlockProcess RepresentedOperational Evidence in This StudyInterpretation LevelSupporting References
Kefir consortiumMixed LAB–yeast–acetic fermentationBaseline sequencingContextual[1,2,3,4,5]
Extracellular matrixEPS, peptides, soluble-phase and matrix-associated restructuringA260, A280, A260/A280, FTIR functional-group profileProxy/bulk functional-group evidence, not compound-specific[6,7,8,9]
Redox balanceRedox buffering and fermentation resilienceORP, redox-driving descriptorOperational redox context[10]
Electron sinkAnode as electron acceptorCurrent under fixed conditionsCurrent-output response[11,12,13]
Mediated/indirect transferSoluble redox-active poolUV–visible descriptorsHypothesized/operational[14]
Electro-fermentationElectrode-modulated fermentationCoupled current–substrate–redox trendsConceptual interpretation[15,16]
Fermentation–matrix chemistryOrganic acids, proteins/peptides, polysaccharides, EPS-like matrixFTIR bands at 3348, 1701, 1639, 1547, 1458–1446, 1053, 999, and 802 cm−1Qualitative functional-group support[5,6,7,8,9]
Table 2. Technical design, operational configuration, and analytical scope of the laboratory-scale salt-bridge kefir-driven microbial fuel cells.
System ElementTechnical SpecificationStandardization/Role in the Study
Reactor architectureLaboratory-scale double-chamber microbial fuel cellCore experimental platform used for all units
Interchamber separatorSalt bridge; no polymer electrolyte membrane was usedIonic communication between anodic and cathodic chambers
Salt-bridge matrixElectrolyte-impregnated porous cellulosic matrixKept identical across all reactors
Salt-bridge electrolyte1.0 M NaCl immobilized in 4% (w/v) agarMaintained constant to avoid separator-related variability
Salt-bridge dimensions5.0 cm length × 1.2 cm diameterSame dimensions in all reactors
Salt-bridge placementPositioned between anodic and cathodic chambers; centered horizontally, flush with the inner chamber wallsFixed placement to preserve comparable ionic communication
Anodic chamber roleFermentation-driven, oxygen-limited bioelectrochemical compartmentChamber receiving the kefir-derived inoculum and molasses-based substrate
Initial anodic working volume35 mLSame initial anodic volume in all reactors
Initial anodic pH3.6Acidic starting condition for kefir-derived consortium activity
Cathodic chamber roleAerated oxidant-side compartmentStructurally constant cathodic side across all reactors
Cathodic working volume35 mL water catholyteSame cathodic volume in all reactors
Initial catholyte pH6.8Same initial cathodic pH in all reactors
Cathode materialZincFixed cathode material across all reactors
Cathode dimensions4.0 cm × 1.5 cm × 0.1 cmSame cathode geometry and immersion depth in all reactors
Cathode technical grade/supplierSigma-Aldrich, St. Louis, MO, USA; technical grade (≥99% purity)Reported to ensure reproducibility of the reactor configuration
Experimental factorAnode configurationOnly intentionally varied structural factor
Graphene anode configurationFlat porous graphene plateOperational anode configuration, not a material-only benchmark
Graphene projected area2 cm2Used for projected-area normalization
Graphene plate dimensions2.0 cm × 1.0 cm × 0.2 cmDefines the projected plate geometry used for reproducible anode configuration and projected-area normalization
Graphene supplier/gradeACS Material, Pasadena, CA, USA; Porous Graphene PlateReported to ensure reproducibility of the reactor configuration
Graphite anode configurationCylindrical graphite rodOperational anode configuration, not a material-only benchmark
Graphite exposed length2 cmUsed for geometric surface-area estimation
Graphite rod diameter0.6 cmRequired to compute lateral or total exposed area
Graphite supplier/gradeTokai Carbon, Minato-ku, Tokyo, Japan; high-density extruded graphiteReported to ensure reproducibility of the reactor configuration
Anode allocation16 graphite-anode reactors and 17 graphene-anode reactorsGraphite and graphene were used in separate reactors, not sequentially in the same reactor
Number of reactors33 independent reactorsExperimental replication at reactor level
Monitoring periodDay 0 to day 20Longitudinal reactor-state monitoring
Sampling frequencyDaily21 time points per reactor
Total observations693 reactor-day observations33 reactors × 21 time points
Fed-batch regimePulse-based substrate replenishmentControlled temporal substrate renewal
Daily analytical withdrawal5 mL anodic aliquot, not returned to the reactorRepeated monitoring of anodic reactor state
Substrate pulse10 mL freshly sterilized molasses adjusted to 12.5 °Brix every 48 hFed-batch substrate input
Main response variableCurrent output under fixed measurement conditionsTarget variable for reactor-state prediction
Additional electrical variableVoltage under fixed measurement conditionsUsed to describe fixed-condition electrical output
Main operational variablesOxidation–reduction potential, temperature, glucose-equivalent substrate variables, A260, A280, and A260/A280 ratioTime-resolved reactor-state descriptors
Analytical scopeCurrent prediction and reactor-state interpretation under fixed laboratory conditionsNot a complete electrochemical power-performance characterization
Table 3. Physicochemical & Electrical variables and measurement instrumentation.
VariableUnitInstrumentFrequency
ORPmVYieryi BLE-C600, ChinaDaily
Temperature°CYieryi BLE-C600, ChinaDaily
VoltageVProskit 1225, Prokit’s Industries Co., Ltd., New Taipei City, TaiwanDaily
Current(mA)Proskit 1225, Prokit’s Industries Co., Ltd., New Taipei City, TaiwanDaily
Residual soluble solids (°Bx-based proxy)°BxXindacheng refractometer, model COMINHKPR124469 (Xindacheng, Qingdao, China)Daily
Electrical conductivityµS/cmYieryi BLE-C600, ChinaDaily
Total dissolved solidsppmYieryi BLE-C600, ChinaDaily
Table 4. Predictive modeling workflow and validation settings.
ComponentSpecification
Response variableCurrent output (mA)
Predictor familyIntegrated semimechanistic reactor-state descriptors
AlgorithmRandom-forest regression
Grouping variableReactor identity
Validation strategyGrouped cross-validation
Leakage controlRepeated observations from the same reactor kept within the same fold
Main metricsR2, RMSE, MAE, observed-versus-predicted slope
DiagnosticsResidual histogram, Q–Q plot, residuals vs. predicted, VIF, permutation importance
ScopeWithin-design current prediction under fixed laboratory conditions
Table 5. Initial and final measured reactor-state variables in kefir-derived salt-bridge microbial fuel cells. Values are mean ± standard deviation. Graphene-anode reactors: n = 17. Graphite-anode reactors: n = 16.
VariableGraphene Day 0Graphene Day 20Graphite Day 0Graphite Day 20
Current (mA)1.1212 ± 1.06740.1200 ± 0.10550.6619 ± 0.42390.1062 ± 0.0769
Voltage (V)0.9141 ± 0.28930.7200 ± 0.22630.9981 ± 0.19580.6794 ± 0.1949
ORP (mV)138.47 ± 30.04151.06 ± 31.07141.00 ± 43.08150.38 ± 43.99
Temperature (°C)24.37 ± 0.2524.50 ± 0.2624.43 ± 0.1924.43 ± 0.30
Residual glucose-equivalent (g L−1)5.4759 ± 2.14640.0070 ± 0.01625.1387 ± 2.46520.0187 ± 0.0271
Consumed glucose-equivalent (g L−1)0.0000 ± 0.00005.4689 ± 2.14240.0000 ± 0.00005.1200 ± 2.4604
Glucose-consumption fraction0.0000 ± 0.00000.9989 ± 0.00280.0000 ± 0.00000.9964 ± 0.0057
EC (µS cm−1)405.41 ± 153.71535.47 ± 138.82369.94 ± 112.67600.50 ± 148.28
TDS (ppm)302.53 ± 91.20260.47 ± 71.58244.19 ± 91.90264.31 ± 73.49
A260 (AU)0.5326 ± 0.16160.7773 ± 0.04700.4637 ± 0.06460.7714 ± 0.0615
A280 (AU)0.2658 ± 0.03800.7049 ± 0.03870.2495 ± 0.01730.6989 ± 0.0455
A260/A2801.9696 ± 0.28641.1029 ± 0.03781.8554 ± 0.18781.1034 ± 0.0455
Note: Consumed glucose-equivalent and glucose-consumption fraction were calculated from reactor-specific day-0 glucose-equivalent values. The table summarizes endpoint dispersion only; full day-resolved dispersion remains represented by the standard-deviation bands in Figure 3.
Table 6. Fixed-condition electrical-output descriptors in kefir-derived salt-bridge microbial fuel cells. Values are mean ± standard deviation across independent reactors. Graphene-anode reactors: n = 17. Graphite-anode reactors: n = 16. Overall dataset: n = 33 reactors.
DescriptorGraphene-Anode ReactorsGraphite-Anode ReactorsOverall
Apparent power, day 0 (mW)1.0056 ± 1.05130.7127 ± 0.56660.8636 ± 0.8516
Apparent power, day 20 (mW)0.0940 ± 0.08560.0767 ± 0.06880.0856 ± 0.0772
Mean apparent power, days 0–20 (mW)0.2958 ± 0.23270.2515 ± 0.12120.2743 ± 0.1857
Observed peak apparent power under fixed conditions (mW)1.1426 ± 0.98700.8845 ± 0.47011.0174 ± 0.7796
Apparent power change from day 0 to day 20 (%)−90.66−89.24−90.09
Cumulative charge, days 0–20 (C)616.65 ± 414.73572.04 ± 243.83595.02 ± 338.20
Cumulative apparent energy, days 0–20 (J)489.21 ± 380.20422.14 ± 203.41456.69 ± 304.68
Note: Apparent power was calculated as P a p p = V × I , with current expressed in mA and voltage in V; therefore, apparent power is expressed in mW. Cumulative charge and cumulative apparent energy were estimated by trapezoidal integration over the 20-day monitoring period. These descriptors represent fixed-condition electrical output and should not be interpreted as maximum power, power density, coulombic efficiency, or optimized MFC performance.
Table 7. Consortium-level mechanisms supporting current output in kefir-derived salt-bridge microbial fuel cells.
Detected Taxon/GuildRelative Abundance/ContextRole in Current-Supporting MetabolismEnzymatic/Metabolic Systems Involved
Lactococcus lactis22.00%Carbohydrate fermentation, lactate production, redox balance, soluble metabolite generationGlycolytic enzymes, lactate dehydrogenase, NADH/NAD+ cycling
Lactobacillus helveticus/Lactobacillus kefiranofaciens9.19%/6.48%Acidification, peptide release, EPS/matrix contribution, biofilm-supporting extracellular structureProteolytic enzymes, glycosidases, lactate dehydrogenase, EPS-associated biosynthetic systems
Saccharomyces cerevisiae4.71%Sugar fermentation, reducing-equivalent generation, ethanol/organic metabolite productionGlycolysis, alcohol dehydrogenase, NADH-linked fermentation
Acetobacter9.52%Oxidative turnover of fermentation products and redox cycling in the mixed consortiumAlcohol dehydrogenase, aldehyde dehydrogenase, membrane-associated redox enzymes
Pseudomonas, Citrobacter, Enterobacteriaceae-associated taxaDominant/accessory bacterial groups detectedPotential contribution to soluble redox-active metabolism, secondary oxidation, and interspecies electron/metabolite exchangeQuinone/flavin-linked redox metabolism, dehydrogenases, cytochrome-associated pathways in related taxa
Mixed biofilm and extracellular matrixSupported by endpoint SEMBiomass retention, electrode-interface stabilization, diffusion microenvironments, extracellular polymeric matrixEPS-associated matrix formation, extracellular proteins and polysaccharides
Note: The listed mechanisms are plausible consortium-level interpretations. Enzyme activities, transcriptomics, proteomics, and terminal anode-community sequencing were not performed; therefore, these entries should not be interpreted as direct evidence that a specific enzyme or taxon controlled current generation.
Table 8. FTIR functional-group assignments supporting the proposed fermentation–redox–biofilm cascade.
FTIR Band/Region (cm−1)Assigned Functional GroupBiochemical InterpretationCascade Component Supported
3348O–H/N–H stretchingHydroxyl-rich polysaccharides, bound water, proteins/peptidesEPS hydration, kefiran-like matrix, peptide-rich extracellular phase
3047–2997Weak C–H stretchingOrganic biomass, cellular residues, aliphatic metabolitesMicrobial biomass and fermentation-derived organics
1701C=O stretchingOrganic acids, esters, carbonyl-rich fermentation productsLactate/acetate-linked fermentation products
1639Amide I/COO−/H–O–H bendingProteins, peptides, carboxylates, hydrated matrixProteolysis, extracellular proteins, redox-buffered soluble phase
1547Amide IIPeptide/protein-associated N–H and C–N vibrationsProteinaceous matrix and biomass-associated protein signatures
1458–1446CH2/CH3 bending/COO−Biomass, carboxylates, organic-acid residuesFermentation products and microbial cellular material
1327C–N/amide III/C–H deformationPeptides, amino sugars, nitrogen-containing organicsProteolytic and matrix-associated transformations
1249Amide III/P=O/C–OProteins, phospholipids, nucleic-acid or phosphate-containing biomassCellular biomass and extracellular protein/phosphate pool
1053C–O–C/C–O stretchingPolysaccharides, glycosidic bonds, EPSKefiran/EPS and residual carbohydrate matrix
999C–O/glycosidic vibrationsSugar residues and polysaccharide structuresCarbohydrate conversion and EPS-related signatures
802Saccharide ring/glycosidic vibrationPolysaccharide structural fingerprintEPS/kefiran-like matrix organization
571Low-frequency fingerprint regionBulk matrix/skeletal vibrations; non-specificStructural matrix evidence; not compound-specific
Note: FTIR assignments are qualitative and refer to broad functional-group regions. They support biochemical classes consistent with the proposed metabolic cascade, but they do not identify specific enzymes, metabolites, taxa, or extracellular electron-transfer pathways.
Disclaimer/Publisher’s Note: The statements, opinions and data contained in all publications are solely those of the individual author(s) and contributor(s) and not of MDPI and/or the editor(s). MDPI and/or the editor(s) disclaim responsibility for any injury to people or property resulting from any ideas, methods, instructions or products referred to in the content.