1. Introduction
With the proposal of the “dual carbon” goals and the growing global energy crisis, scaling up renewable energy generation has become essential for increasing the proportion of non-fossil energy consumption and promoting the national energy transition, which serves as a core prerequisite for achieving low-carbon power system operation [
1,
2,
3]. Against this background, extensive efforts have been devoted to source-load coordinated scheduling in active distribution networks. Existing studies have integrated energy storage (ES) and flexible loads into scheduling frameworks and developed multi-objective optimization strategies to comprehensively optimize operational economy, voltage profile, and power loss, providing a complete modeling paradigm for source–load coordination [
4]. From an overall source–grid–load perspective, further research has established economic dispatch models to quantify the synergistic effects of distributed power generation and flexible load response, verifying the significant value of coordinated regulation in improving system economic performance [
5]. With the rapid advancement of flexible load and ES technologies, research hotspots have further evolved toward integrated source–load–storage collaborative operation. In AC/DC hybrid distribution network scenarios, economic scheduling methods that coordinate flexible loads and ES have been proposed, and the results demonstrate that the joint participation of diverse flexible resources can effectively enhance system operational efficiency and relieve network operation constraints [
6]. Moreover, systematic investigations on distribution network optimal scheduling have clarified the capability of flexible loads in time-series power regulation and new-energy uncertainty mitigation, laying a solid theoretical foundation for future distribution network coordinated operation research [
7,
8].
In view of the inherent uncertainty characteristics of new-energy output and load demand, many studies introduce stochastic optimization and robust optimization theory into the source–load coordinated scheduling model. In the literature, a source–grid–load collaborative optimization operation model of an active distribution network considering the uncertainty of source and load is established, and the safety margin and operation reliability of the scheduling scheme are effectively improved by introducing uncertainty constraints [
9]. Existing related research shows that under the background of large-scale access to high-proportion distributed new energy, it is difficult to adapt the traditional deterministic scheduling model to the actual engineering operation requirements, and it is vital to fully consider and quantify the uncertainty characteristics of both sides of source and load under the framework of source–load coordinated scheduling. Nevertheless, existing uncertainty-oriented studies mostly focus on the feasibility of deterministic constraint improvement. They generally overlook the coupling characteristics of multiple uncertain factors and fail to achieve refined quantitative analysis of fluctuating source–load behaviors, indicating that traditional deterministic scheduling paradigms are increasingly inadequate for the practical operation of distribution networks with high-penetration distributed new energy. Therefore, it is indispensable to fully characterize and quantify the dual uncertainties of generation and load within a systematic source–load coordination framework.
In the field of distributed-resource hierarchical coordinated control, related research is gradually changing from the traditional centralized scheduling mode to the direction of distributed-resource coordinated control. Some scholars have introduced the super-node cooperative consensus algorithm to carry out in-depth research on source–load scheduling and distributed-power economic scheduling problems, which provides a new technical path for the coordinated operation of source and load in multi-area and multi-node scenarios [
10,
11]. Considering that there are significant timescale differences in the operation of distribution networks, the coordinated operation of multi-timescale sources and loads has gradually become a research hotspot in this field. The existing related research shows that the classified management and hierarchical coordination of fast-regulating resources and slow-regulating resources is the key means to improve the operation performance of active distribution networks.
With the continuous advancement of the “double carbon” goal, research on the coordinated operation of source and load has begun to integrate the low-carbon perspective and carbon emission constraints. Based on the characteristics of load carbon emissions, a source–load collaborative planning method for distribution networks is proposed, which provides a new research direction for the deep integration of source–load coordinated operation and low-carbon objectives [
12]. In addition, from the perspective of source–load path, a load carbon emission calculation method is proposed, which provides basic support for carbon constraint modeling in source–load collaborative optimization [
13]. This kind of research further expands the evaluation dimension of the coordinated operation of source and load and promotes its development in the direction of safety, economy and low-carbon objectives. In the scenario of distribution network operation recovery and structural adjustment, source–load coordination also plays an indispensable role. Some scholars have proposed a power supply recovery strategy for a multi-terminal flexible interconnected distribution network considering the coordination of transfer and reconstruction. The idea of source–load coordination is integrated into the whole process of fault recovery and operation reconstruction, which fully reflects the adaptability and expansibility of source–load coordination in complex operation scenarios [
14].
In terms of distributed new-energy grid-connected collaborative optimization, existing research mostly focuses on wind power and Photovoltaic (PV) access scenarios. Some scholars have proposed reactive power optimization management strategies for transmission and distribution networks connected to wind farms and have effectively improved the stability of system operation through optimization algorithms [
15,
16]. In addition, based on the optimal power flow method, the related problems of wind power participating in reactive power optimization are deeply explored, which provides solid mathematical modeling support for distributed new-energy grid-connected control [
17]. At the level of system-level collaborative optimization and engineering implementation, some studies focus on the design and application of multi-source collaborative scheduling systems. Some scholars have studied the optimal-scheduling problem of wind power integration from the perspective of transmission and distribution coordination and have further expanded the spatial scale of collaborative optimization [
18]. Some scholars have constructed a coordinated complementary optimization model for microgrid multi-energy systems, which provides a scientific evaluation method for the coordinated operation of multi-energy systems [
19]. However, current new-energy collaborative optimization research still has obvious limitations: most studies focus on single-type new-energy regulation characteristics and ignore the heterogeneous operational differences and complementary potential of diversified distributed resources. Moreover, few studies fully combine distribution network topological features with resource regulation performance, resulting in insufficient pertinence and accuracy of scheduling strategies for complex high-proportion new-energy grid-connection scenarios.
In the modeling of new-energy uncertainty and operational safety constraints, related research focuses on the impact of random power sources such as wind power and PV on the stable operation of the system. In view of the uncertainty of wind speed, some scholars have proposed an online evaluation method for the transient active support capacity of wind farms, which provides a quantitative basis for wind power to participate in system-support services [
20]. In addition, from the perspective of the coordination of new-energy stations and ES stations, a distributed collaborative optimization model considering uncertainty is constructed, which effectively improves the robustness of the system under complex operating conditions [
21]. With the continuous maturity of ES technology, the key role of ES in the coordinated regulation of distributed resources has become increasingly prominent. Some studies have focused on the problem of coordinated voltage regulation among distributed ES groups in distribution networks and have carried out research on ES location and capacity determination and cluster control strategies [
22]. Other scholars have verified the significant effect of a multi-level ES configuration on improving the level of new-energy consumption from the perspective of centralized and distributed battery ES collaborative planning [
23]. Some studies have also explored the regulation value of distributed ES in the process of stabilizing new-energy power fluctuations from the perspective of coordinated operation and optimal configuration of PV and ES [
24,
25].
In the field of collaborative optimization of electric vehicles and flexible loads, related research has gradually incorporated load-side flexible resources into a distributed-resource collaborative scheduling framework. Some scholars have proposed a multi-agent two-stage low-carbon optimization operation strategy considering the schedulable potential of electric vehicle (EV) clusters and have realized “source–load–storage” multi-agent collaborative scheduling [
26]. Another study starts from the idea of active convergence of distributed ES for EVs and explores a way to participate in the optimal scheduling of the distribution network, which provides a reference for the deep integration of the transportation system and energy network [
27]. In the research direction of virtual ES and virtual power plants, data-driven and robust optimization methods have become mainstream research hotspots. Some studies have proposed a cooperative control strategy for virtual ES devices, which can simultaneously achieve fast frequency support and energy regulation of the system [
28]. Some scholars have introduced the data-driven distributed robust optimization method into virtual power plant operation scheduling, taking into account the response characteristics of EVs and the carbon-trading constraint mechanism [
29]. Based on a dynamic virtual power plant architecture, the research systematically analyzes its robust operation potential in frequency-modulation auxiliary services and further broadens the research scope of distributed-resource aggregation optimization [
30]. Nevertheless, existing flexible load aggregation studies generally adopt simple superposition of power parameters when modeling massive flexible resources. They lack refined clustering criteria based on actual regulation characteristics and topological coupling relationships, which easily leads to distorted evaluation of aggregated adjustable capacity and cannot effectively solve the dimension-explosion problem caused by massive dispersed resources.
In summary, existing studies have yielded abundant achievements in source–load coordinated modeling, optimal scheduling strategies, distributed control, and multi-timescale collaborative operation of distribution networks, which provide a solid theoretical and technical foundation for flexible resource regulation and optimal grid operation. Nevertheless, three core scientific challenges remain unsolved in current research: first, most studies focus merely on single optimization objectives or individual resource types, lacking a unified evaluation and decision-making framework to quantify the comprehensive coordination capability of heterogeneous adjustable resources; second, the coupling and restrictive relationships among multiple regulation objectives in complex operating scenarios are mostly determined by empirical rules or fixed-weight coefficients, resulting in a lack of interpretable and adaptive decision-support mechanisms; and third, prevailing research ignores the inherent topological characteristics of distribution networks and adopts simplistic single-layer control architectures, which fail to achieve refined and unified quantitative evaluation of massive flexible resources. These fundamental defects severely limit the practical applicability and optimization performance of existing distributed-resource scheduling technologies. To fill the above research gaps, this paper targets the refined aggregation and hierarchical collaborative scheduling of large-scale heterogeneous flexible resources under complex grid scenarios. With the cloud–edge collaborative architecture as the technical framework, this paper integrates multi-type flexible resources via refined aggregation technologies and introduces multi-criteria decision-making theory to systematically evaluate the regulation potential of distribution network adjustable resources, aiming to address the dimension-explosion problem and inaccurate capacity evaluation dilemma of massive scattered resources.
Therefore, this paper proposes a cloud-side collaborative optimization scheduling strategy for a distribution network based on resource aggregation to solve these problems.
The main contributions of this paper are as follows:
- (1)
This paper constructs a unified control constraint model of distributed PV, ES, EV and flexible loads and establishes a multidimensional evaluation index system for regulatory potential from the aspects of technology, economy, reliability and environmental friendliness, which solves the problem that the characteristics of heterogeneous flexible resources are difficult to quantitatively describe.
- (2)
An improved K-means clustering aggregation method based on analytic hierarchy process weighting is proposed, which combines the distribution network topology to realize the accurate clustering of resources with similar regulation characteristics and establishes the adjustable capacity evaluation model of aggregated resources through voltage sensitivity linearization and the Conservation Voltage Reduction (CVR) coefficient, which effectively solves the problem of regulation dimension explosion caused by massive dispersed resources. This method is different from traditional distributed-resource aggregation which uses simple power superposition, ignoring the topology characteristics of the distribution network and the differences in resource regulation. It is easy for this method to cause distortion of the cluster adjustable capacity calculation, and it cannot cope with the dimension-explosion problem caused by massive distributed resources.
- (3)
A cloud–edge–end three-level collaborative regulation architecture is built and a two-level optimal scheduling model is constructed. Based on the multi-criteria decision-making theory, the regulation priority for various resources is defined and a hierarchical and orderly regulation scheme is formulated. The global optimization of peak shaving and valley filling and regional local voltage-security constraints are taken into account. At present, the mainstream cloud–edge collaborative scheduling model mostly adopts the cloud–edge double-layer architecture, and the division of hierarchical rights and responsibilities is relatively general. In view of the above architecture defects, this paper proposes a three-level hierarchical collaborative system: the cloud carries out global optimization of peak shaving and valley filling from the perspective of the whole network and combines the adjustable margin of each resource cluster to split the scheduling index; the edge layer is responsible for receiving and releasing regulatory instructions, and ensures a proper matching ratio of internal resources in the on-site control area; and the terminal unit performs power regulation accurately. With the help of the results of resource clustering and aggregation, the control tasks are disassembled step by step, which can effectively reduce the burden of centralized computing in the cloud, open up complementary channels of cross-regional resources, and build a coordinated scheduling system for active distribution networks with upper and lower linkage.
2. Distributed-Resource Aggregation Modeling Based on Improved K-Means Clustering
The distributed-resource aggregation model in this paper takes the feeder topology of the distribution network as the unit and aggregates in each unit after dividing the side cluster. The topological relationship clarifies the physical boundary and ensures that the aggregated power is related to the network power flow. If the scattered resources are directly regulated, it will result in severe dimensionality explosion of decision variables and hinder the effective quantification of regulatory potential. Because the initial clustering center of the traditional K-means algorithm is random, it is easy for it to fall into a local optimum and the clustering boundary is fuzzy. Therefore, the improved K-means algorithm based on index weight is introduced to optimize the initial center and give reasonable weight to the key indicators, so as to realize accurate clustering and aggregation of resources.
2.1. Distributed-Resource Adjustable Capacity Index Modeling
The adjustable capacity index of distributed resources in a distribution network is an important index to quantify the adjustment margin of distributed resources, which directly depicts the boundary for distributed resources participating in distribution network regulation. In the control scenario of active distribution networks, it is necessary to dynamically calculate the adjustable capacity based on the operating-state parameters of various distributed resources. Due to the differences in the physical characteristics and regulation mechanisms of distributed PV, ES and EV systems, the definition logic and calculation methods for their adjustable capacity are also different. The following will define the adjustable capacity index and the specific calculation method for the different types of distributed resources, respectively.
Distributed PV mostly works in a maximum power point tracking (mppt) control mode, and its active power regulation characteristics show that it only has downward adjustment space and cannot achieve active power increase. According to relevant regulations, under normal operating conditions, the change rate of distributed PV active power should not be higher than 10% per minute. Under the premise of meeting this technical constraint, this paper sets the downgradable capacity of the distributed PV unit to 10% of its current actual output, and the specific expression is shown in Equation (1).
The ES operation interval is mainly subject to the dual constraints of charge and discharge power limit and state of charge. In order to better meet the scheduling requirements under the control command, this paper considers the timescale of the control command to identify the state of the adjustable capacity of the ES unit. Firstly, the minimum up-regulation time and the minimum down-regulation time of the ES unit are calculated to reflect the time when the ES unit can maintain the regulation state under the maximum regulation capacity, and then the quantitative analysis of the regulation continuity and feasibility is realized:
In the formula, is the state of charge of the ES unit at time t, and represent the maximum and minimum state of charge allowed by the ES unit, respectively, and are the rated charging and discharging power of the ES unit, respectively, and are their charging and discharging efficiency coefficients, and is their rated capacity.
According to the cycle of resource aggregation and control instructions, the adjustable state of the ES unit is judged. By calculating the up-regulation capacity and down-regulation capacity of the ES unit output, it is clear that
is the active power injected by the ES unit into the power grid. The discharge is positive and the charge is negative, ensuring that the current output does not exceed the rated discharge power.
Differently from distributed PV and electrochemical ES resources, electric vehicles are typical flexible loads. Their participation in power grid regulation should be based on the primary principle of ensuring users’ travel needs. The technical adjustable capacity boundary should be focused on so as to increase user enthusiasm and the practical feasibility of users’ participation in regulation. In this paper, it is assumed that the electric vehicle charging pile has the bidirectional regulation ability of charging and discharging. Combined with the expected travel time of the user’s reservation and the corresponding target state of charge, the state of charge required for the EV in the next regulation period is calculated:
In the formula, is the rated charging power of the electric vehicle unit n; is the rated capacity of the electric vehicle unit n; and is its charging efficiency.
For the load-reduction scenario, firstly, according to the relationship between the actual battery power at time
t and the target state of charge
in the next control cycle, it is judged whether the user’s travel demand can be satisfied. If the battery power is higher than
at time
t, it indicates that the user’s electricity demand can be fully guaranteed. In the current control cycle the charging power can be reduced to zero, and even further power reduction can be achieved by discharge. If the battery power is lower than
at time
t, the vehicle needs to be charged to the target state of charge in the current cycle, or continuously charged according to the rated power to preferentially protect the user’s travel demand. Therefore, the lower boundary of EV power can be expressed as:
In the formula, is the state of charge of the nth electric vehicle at time t; and represent its charging efficiency and discharge efficiency; and is the deviation of the state of charge of the electric vehicle unit n at time t. When , it indicates that the current SOC is insufficient and the EV needs to be recharged. When indicates the current SOC excess, it can discharge or stop charging.
When the system needs the EV load to increase the power, its adjustment direction is consistent with the user’s charging demand. At this time, only the safe-operation constraint of the battery state of charge needs to be considered to ensure that the state of charge (SOC) at the beginning of the next control cycle does not exceed the upper limit threshold. Based on the above constraints, the upper limit of power regulation of EVs is:
Based on the above power boundary calculation model, combined with the real-time-measured charging power of the EV, the up-regulation capacity and down-regulation capacity of the nth EV at the current control moment can be quantitatively solved:
2.2. Distributed-Resource Aggregation Method Based on Improved K-Means
From the previous analysis, it can be seen that the premise of hierarchical control of distributed resources in an active distribution network is to cluster and process massive terminal resources. After the grouping is completed, the system takes each resource aggregate as the direct control object, first completes the aggregation and decomposition of the global control instructions on the cloud side, and then carries out the second-level instruction allocation within each side cluster, so as to effectively reduce the computational complexity and operation load of the overall control system of the active distribution network. In order to solve the problem that the traditional K-means algorithm randomly initializes the clustering center and can easily fall into the local optimum, this section uses the improved K-means algorithm to carry out the clustering and aggregation of distributed resources [
31]. Combined with the calculation results of the control performance indicators defined in the previous section, distributed-resource clustering is realized. The specific implementation steps of this method are as follows:
Step 1: Clustering index standardization. Clustering indicators need to be standardized. The clustering indexes are divided into two categories: positive and negative indexes. The larger the positive index value is, the better it is, and the smaller the negative index value is, the better it is. The standardization of the two types of indicators is as follows, where “+” and “−” represent the positive and negative indicators of standardization, respectively,
i is the
ith resource, and
j is the
jth indicator.
Step 2: Select the best number of clusters. In order to obtain the optimal number of resource clusters, this paper uses the contour coefficient method to evaluate the clustering effect. This method quantifies the cohesion and separation of each cluster by calculating the sample contour coefficient and then horizontally compares the average contour coefficient under different clustering numbers K to select the K value that makes the clustering performance optimal. The specific steps are as follows. Firstly, the average distance from the sample to other samples in the same cluster is calculated, which is called the intra-cluster dissimilarity of the sample, which reflects the degree of cohesion of the sample in the cluster. Secondly, the average distance between the sample and all samples in other clusters is calculated, which is called the dissimilarity between samples and clusters. Then, the contour coefficient
of the sample is calculated, and the value range is [−1, 1]. The closer to 1, the more reasonable the current clustering result of the sample is. Finally, the contour coefficients of all samples are averaged, and the overall contour coefficient L under the cluster number K is obtained. The K value corresponding to the maximum average contour coefficient is selected as the optimal number of clusters.
Step 3: Clustering center initialization. In K-means clustering, the selection of initial centers directly affects the convergence speed of the algorithm and the final clustering effect. In order to improve the stability of clustering and the rationality of clustering, this paper uses the improved K-means algorithm to initialize the clustering center. The algorithm dynamically adjusts the probability that different samples are selected as the clustering center and preferentially selects samples farther from the existing center as the new initial center, so that the initial center is more evenly distributed and more representative in the feature space, effectively avoiding the defect of sensitivity to the initial centers in the traditional K-means algorithm. The specific process is as follows: A sample is randomly selected from the sample set as the first clustering center, and the minimum Euclidean distance between all the remaining samples in the sample set and the currently selected clustering center is calculated. Based on the distance, the probability sampling is performed. The farther the distance is, the higher the probability that the sample is selected. The new clustering center is selected, and steps 2 and 3 are repeated until K clustering centers are selected.
Step 4: Calculate the weighted Euclidean distance matrix considering the index weight. On the basis of the improved K-means algorithm, in order to reflect the differential influence of different regulation performance indicators on the clustering results, this paper introduces the index weight obtained by the analytic hierarchy process and weights the traditional Euclidean distance. The weighted distance between the distributed unit sample and each cluster center is used to improve the sensitivity of the clustering results to the difference in regulation performance:
In the formula, represents the k-th cluster center; is the standardized value of sample on the jth index; is the weight of the jth index; and is the value of the kth cluster center on the jth index.
Step 5: Sample allocation and cluster-center update. Based on the calculation results of the weighted Euclidean distance matrix, the feature vector of each distributed unit sample is assigned to the cluster corresponding to the nearest cluster center to complete the sample clustering. After the sample clustering is completed, the clustering center of each cluster is updated:
Step 6: Determine the location of the cluster center and complete the aggregation. Repeat the process of step 4 and step 5 until the updated cluster-center set completely coincides with the cluster center of the previous iteration, determine the convergence of the algorithm, stop the iteration, and complete the clustering aggregation of distributed resources.
Based on the above methods, the effective clustering and aggregation of massive distributed resources can be realized: the dimension difference is eliminated by index standardization, the optimal number of clusters is determined by the contour coefficient method, the initial clustering center is optimized by the improved K-means algorithm, and the distance calculation criterion is corrected by AHP index weight. Finally, the accurate clustering of resources is realized by iterative update.
After completing the clustering of distributed resources, it is necessary to quantify the distributed-resource regulation characteristics dispersed in the cluster into the overall characteristics of the cluster through aggregation calculation and then derive the system-level aggregation regulation capacity of the active distribution network, so as to provide a quantitative basis for the subsequent collaborative regulation decision-making of the distribution network. In this section, based on the control performance indicators of distributed PV, ES and EV resources in each cluster, a cluster characteristic index aggregation model is constructed and the aggregate controllable capacity of each resource aggregate is calculated:
In the formula, and are the maximum up-regulated capacity and the maximum down-regulated capacity of the jth resource aggregate in the same topology cluster at time t, respectively.
2.3. Linearization Calculation Method of Voltage Sensitivity
Based on the cluster feature aggregation model, the adjustable capacity and regulation characteristics of each distributed-resource cluster can be obtained. Due to the coupling of active and reactive power in the active distribution network, the system-level aggregate regulation capacity is not a simple superposition of adjustable capacity: the active adjustable capacity in the same topology unit can be directly linearly superimposed, and the active capacity of different topology units is distributed by the distribution network control center according to the power flow characteristics and operating status.
In this paper, the aggregation modeling relies on the physical topology of the distribution network. In order to quantify the impact of power changes on voltage, the voltage sensitivity index is used to describe the coupling relationship between power regulation and voltage response in the active distribution network. Based on the Zbus power flow model and fixed point theory, a linearized analytical expression of power flow can be obtained. The node voltage vector is expressed as an analytical function of the node injection power vector:
On this basis, the voltage of each node is affected by the voltage of the balanced node and the injection power of the PQ node, which can be equivalent to the voltage source and the current source, respectively. After grounding the equivalent voltage source of the balance node, the equivalent current source corresponding to the injected power of the PQ node will dominate the change in the node voltage and its physical meaning is consistent with the voltage sensitivity of the PQ node type. Therefore, the corresponding node voltage sensitivity expression can be obtained according to the partial derivatives of V in Equation (16) with respect to active injection power
and reactive injection power
, respectively:
It should be noted that the voltage sensitivity matrix is essentially a scalar value. The above partial derivative relationship only gives the theoretical expression based on the linearized power flow model. However, in practice, it is necessary to further derive the analytical formula of the voltage sensitivity matrix, as shown below:
After obtaining the system topology parameters and power flow state, the active and reactive power–voltage sensitivity of each node can be calculated by formula and the dominant node can be identified accordingly. The dominant node is the core node with a high sensitivity to power balance and power flow distribution adjustment in the control area. The identification is obtained by calculating the sensitivity matrix and comparing the sensitivity amplitude of the node.
As the core of regional active power regulation, the dominant node can be used as the end-side cluster control node to undertake the regulation command. Through its own active power regulation, it can stabilize load peaks and valleys, optimize the local balance of power, reduce the complexity of regulation and communication burden, and achieve accurate control. Combined with the characteristics of the short control period of the distribution network, based on voltage sensitivity, the calculation formula of distributed-resource up-regulation and down-regulation aggregation regulation capacity is derived:
In the formula, and are the active power adjustment vector of distributed resources on each node, and are the down-regulated capacity and up-regulated capacity of distributed resources on node i and take 0 when the node has no access to distributed resources; and are the maximum adjustable values of the SVC compensation values of each node at the current time; is the CVR active power coefficient of node i at time t; and N is the active distribution network node set.
3. Cloud–Edge Coordinated Active Power Scheduling for Active Distribution Networks for Peak Shaving and Valley Filling
Under the framework of cloud–edge collaborative regulation, this paper designs an edge-side distributed regulation architecture, which adopts the regulation mode of multi-region clustering and intra-group master–slave coordination.
The active distribution network is divided into multiple independent control clusters. Each cluster is divided into a main cluster and several slave clusters with edge servers as the carrier, and independent local edge controllers are configured to realize the active power optimization decision of resources in the region. Each cluster can be regarded as an edge node, which can interact with neighboring clusters. The master–slave distributed control strategy is adopted within each cluster. The main cluster uses edge computing to complete the regional active power scheduling optimization, and the slave cluster responds according to the local state, which effectively improves the control efficiency and communication reliability.
3.1. Cloud–Edge Collaborative Function Positioning
The cloud side is the global control center of the active distribution network. It is responsible for formulating the global optimization objectives and macro-scheduling strategies for peak shaving and valley filling and controlling all resource nodes and reactive power compensation equipment covering the whole network. It receives the operation data uploaded by each side and sends control instructions to the side after global optimization calculation, so as to realize the overall optimization configuration of the whole network’s resources. As an information agent, the side main cluster completes data uploading and instruction issuing and supports the global cooperative control closed loop.
The edge side is the key hub for cloud-side instruction landing and end-side execution, responsible for regional resource monitoring, rapid response and local regulation. It transforms the cloud-side target into a local strategy, includes power flow sensitivity analysis to determine the priority of equipment action, and completes the regional active power optimization and voltage-security verification. When communication is interrupted, the consistency control can be implemented autonomously, and the running state can be fed back to the cloud side to assist with dynamic correction of the global strategy.
The end side is the underlying execution unit of cloud–edge coordination that is responsible for accurately executing side instructions and completing active power regulation, load response and feedback device status. It takes the leading node as the core to realize precise control from point to area and supports two response modes: the side instruction is executed in the conventional mode and rapid protection without the master station is realized by relying on the local measurement in the emergency mode. After fault recovery, the conventional mode is automatically cut back and the data is synchronized to ensure collaborative connection.
3.2. Cloud–Edge Collaborative Optimization Method for Active Distribution Network
As the global control center, the cloud is oriented to a 10 kV medium-voltage distribution network; the edge is the regional autonomous unit of cloud-edge cooperative control of the active distribution network, and an equivalent 0.4 kV low-voltage station area is divided from the 10 kV medium-voltage distribution network. Under the premise of strictly ensuring the safe and stable operation of the distribution network, it can effectively smooth load fluctuations, improve the level of new-energy consumption, and give full play to the regulation potential of flexible resource peak shaving and valley filling.
- (1)
Objective Function
The global optimization objective of the cloud side is to minimize the peak–valley difference in the whole network load, and the voltage offset penalty term is introduced to constrain the power supply safety. The objective function is:
In the formula, is the objective function on the cloud side; is the total active load power (kW) of the distribution network at time t; is the system reference power, and the industry standard value for 33-node distribution networks is 10 MW. is the cloud-side cost penalty weight, which is used to balance the peak shaving target and voltage security; is the regulation cost at time t of the k-th side region; and , and are the active power regulation values of ES, EVs and flexible load, respectively. The absolute value ensures that the cost calculation is independent of the regulation direction. The distributed PV output is determined by the light intensity, does not have the active regulation ability, and is not included in the regulation cost.
- (2)
Constraint Conditions
The cloud-side model needs to meet the following core constraints to ensure the feasibility and safety of peak-shaving and valley-filling scheduling. The power balance constraint of the whole network refers to the fact that the total active power output of the whole network needs to be equal to the sum of the total active load and the network loss at any time in the scheduling cycle to ensure the balance of power supply and demand of the system:
The node voltage constraint means that the voltage of all nodes in the whole network should be within the rated operating range to ensure power quality and equipment safety, and take 0.93~1.07 times the rated voltage:
The side resource regulation capability constraint refers to the fact that the regulation task allocated on the cloud side needs to not exceed the maximum resource regulation capability of each side region. The constraint is determined by the resource regulation capability boundary of side feedback:
The cloud–edge coordination constraint refers to the fact that the sum of the aggregation control tasks of each side area needs to match the peak load shifting demand power of the whole network to ensure the consistency of the global goal of the cloud side and the execution task of the edge side:
On the cloud side, the peak shaving and valley filling of the whole network is taken as the core optimization objective. After solving the total peak shaving instruction or total valley filling instruction of the whole distribution network system, the global control instruction is weighted and allocated to each side cluster according to the adjustable ability and adjustment cost reported by each side to realize the regional decomposition of the target. While undertaking the cloud-side instructions, the edge side completes the local resource scheduling according to the priorities of ES priority, distributed power supply, and flexible load replenishment. While the cloud-side instructions are accurately executed, the regional voltage-security constraints are met:
3.3. Edge Area Optimization Model
The edge side is the regional autonomous unit of the cloud-side coordinated control of the active distribution network. The equivalent 0.4 kV low-voltage station area divided from the 10 kV medium-voltage distribution network is used to undertake the cloud-side control instructions and complete the instruction area decomposition to realize the cloud-side instruction step by step. The side cluster is divided by the distribution network feeder as the physical topology boundary. The adjustable resources such as distributed PV, ES, flexible load and reactive power compensation equipment in the cluster are directly electrically connected with the feeder to form the same distribution network topology unit, which provides the physical basis for the side power flow calculation.
- (1)
Objective Function
As the execution unit of cloud-side instruction and the core of regional autonomy, the edge side takes the accurate tracking of cloud-side instruction as the core control target and takes into account the economy of the operation of the station area. In the control strategy, only active power scheduling is performed and voltage security is strictly satisfied by power flow calculation as a hard constraint to ensure that the safe-operation boundary of the distribution network is not broken while responding to the scheduling instructions. The objective function is
In the formula, is the value of the side objective function; is the active power control reference value issued by the cloud side to the kth side region at time t, that is, the target adjustment amount to be tracked on the side; is the control cost of time t in the side region; and is the side cost penalty weight, which is used to balance the peak shaving target and economy.
- (2)
Constraint Conditions
The cloud-side instruction tracking constraint means that the sum of the adjustment quantities of all adjustable resources in the region needs to strictly match the control reference values issued by the cloud side to ensure that the global peak-clipping and valley-filling targets are accurately landed in the region:
The regional voltage constraint means that the voltage of all nodes in the region needs to meet the requirements of safe operation. The expression is
The regional power balance constraint means that the active power output in the region at any time should be equal to the sum of regional load, resource regulation and regional network loss:
4. Case Study Analysis
4.1. Example Setting
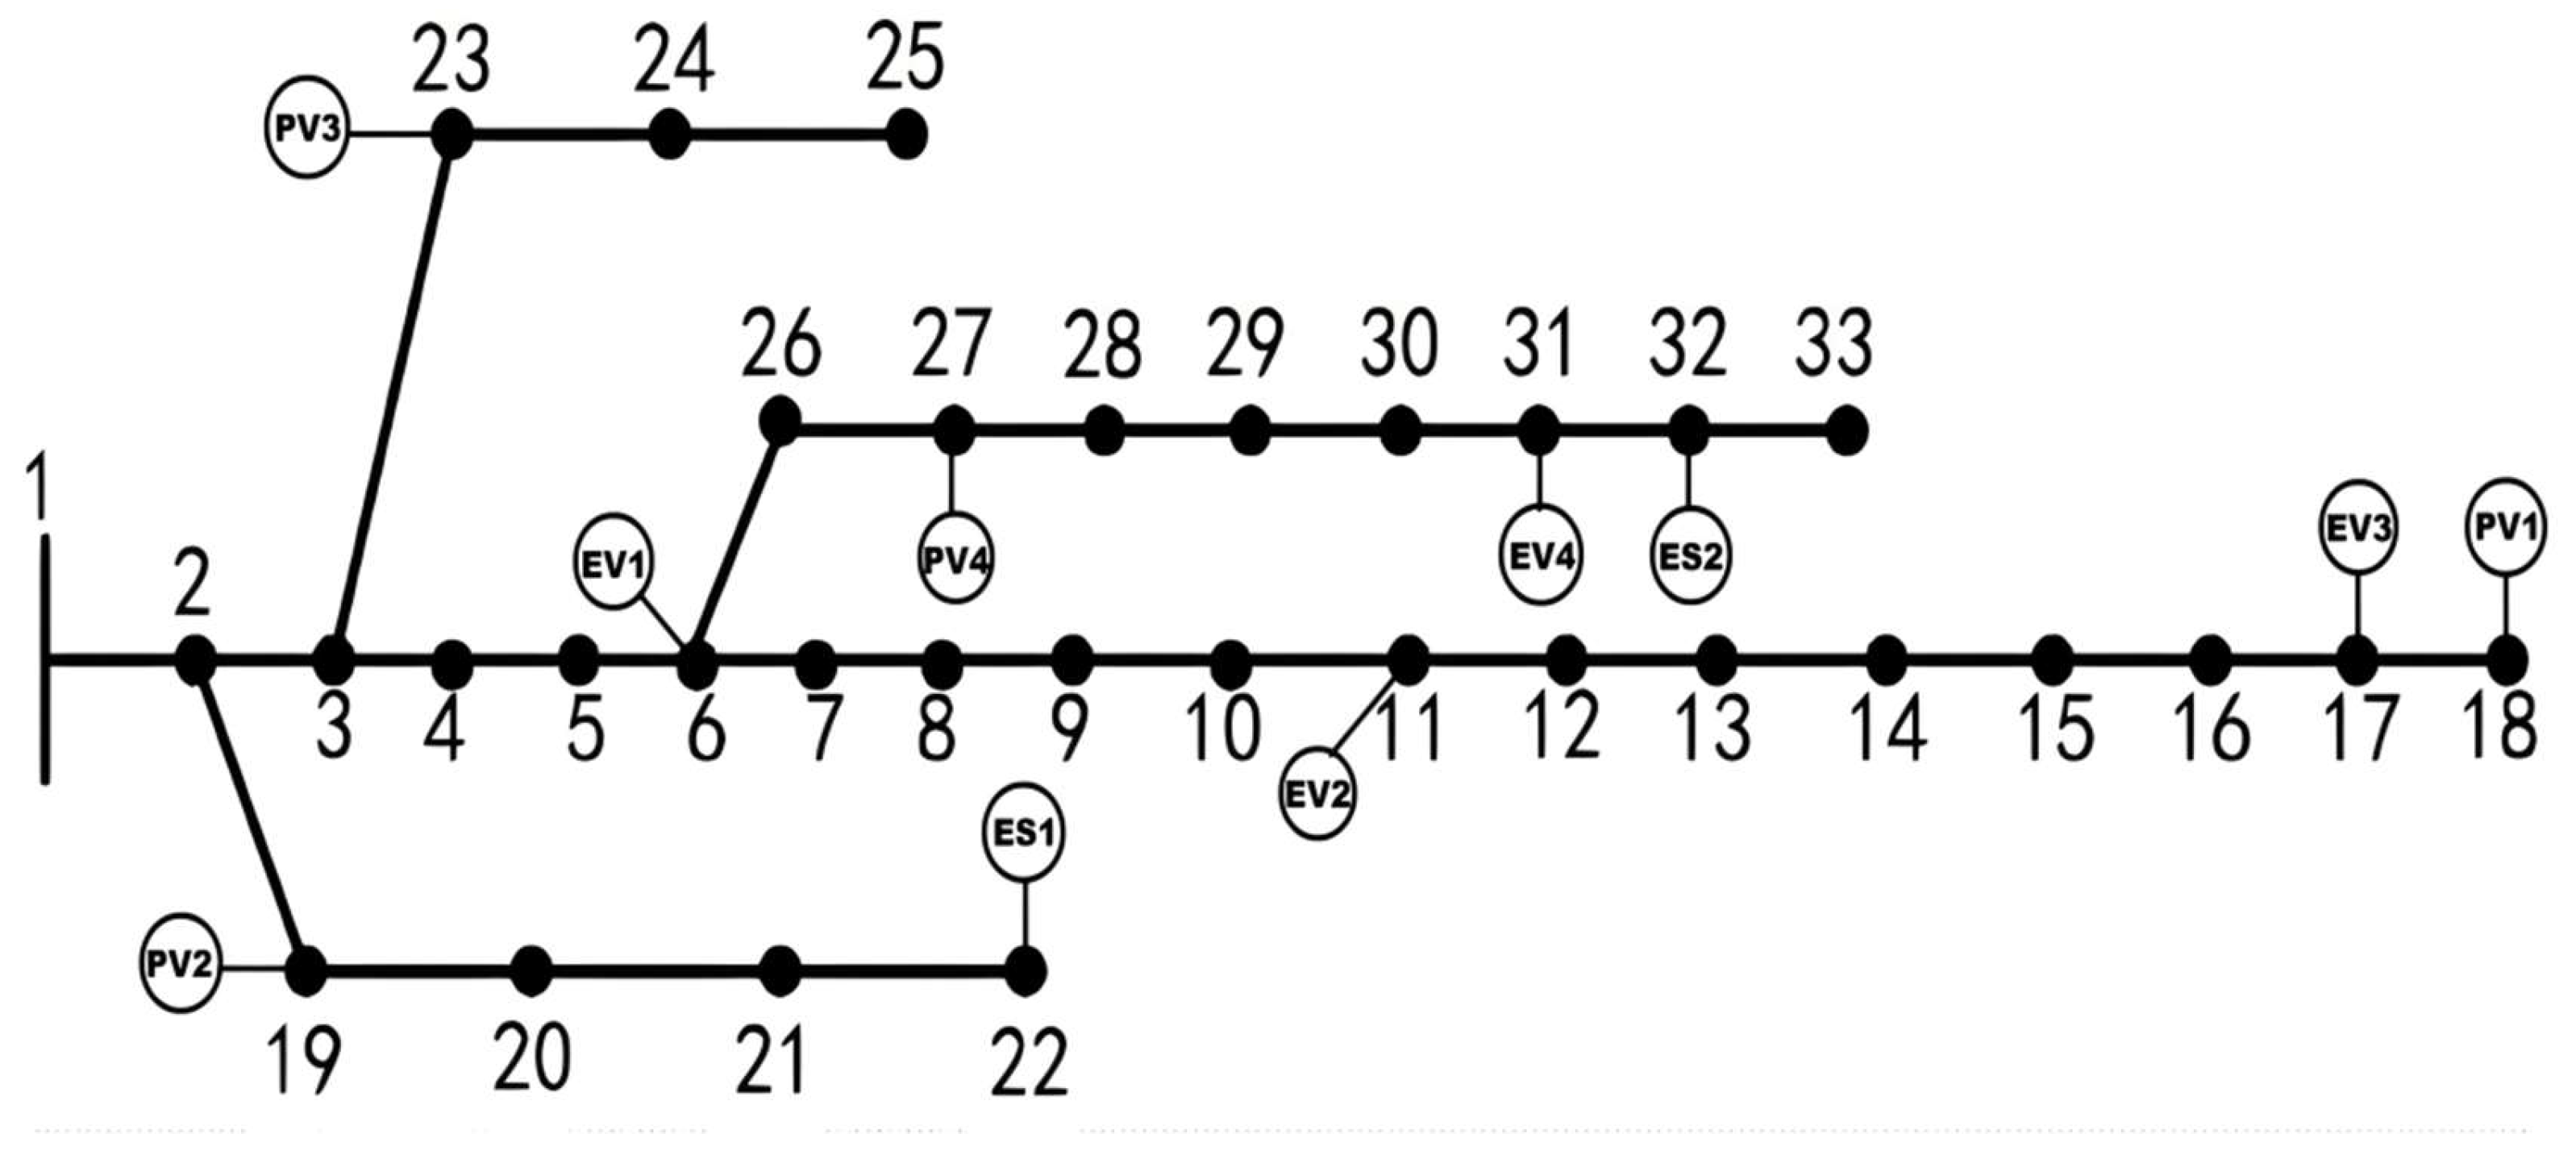
The example is based on the improved IEEE 33-node radial distribution network to carry out simulation verification. The system topology is shown in
Figure 1. The simulation platform is MATLAB R2022 b, YALMIP optimization toolbox(R20221117) and IBM ILOG CPLEX Optimization Studio 12.10 solver. The general basic parameter settings are as follows:
Grid topology and parameters: The reference capacity is 10 MVA, the reference voltage is 12.66 kV, and the resistance and reactance of each branch refer to the IEEE 33-node standard parameter set.
Distributed-resource access configuration: The system locations of distributed PV access are nodes 18, 19, 23 and 27, and the rated capacities are 0.3 MW, 0.5 MW, 1 MW and 0.5 MW, respectively. The system positions of ES access are nodes 22 and 32. The rated power and rated capacity of ES are 0.56 MW/2.25 MWh and 0.84 MW/3.32 MWh. The charge and discharge efficiency is 0.95, and the SOC range is [0.2, 0.8]. The access location of the EV charging station is node 6, 11, 17, 31. Each charging station covers 100 electric vehicles and the rated power of the charging pile in the charging station is 7 KW. In the IEEE 33-bus model, the flexible load accounts for 30%, and the distributed-resource allocation is shown in
Table 1.
The core basic parameters: The node voltage-security range is 0.93~1.07 p.u., the maximum transmission power of the line refers to the IEEE 33-node standard limit; the unit regulation cost of PV is 0.3 yuan/kWh, the ES is 0.5 yuan/kWh, and the EV is 0.8 yuan/kWh. The active power coefficient of CVR varies with the load characteristics of the node, so it is 0.8~1.2. The K-means clustering contour coefficient threshold is improved to 0.7, and the convergence accuracy of power flow calculation is p.u. The maximum number of iterations is 500. When the difference between two adjacent iterations of the objective function is less than the convergence accuracy, or the maximum number of iterations is reached, the iteration ends.
4.2. Analysis of Distributed-Resource Aggregation Characteristics
This section takes the adjustable load cluster, distributed PV cluster, ES cluster and EV cluster in the IEEE 33-node distribution network as the research objects. Firstly, the typical-day selection is completed based on the annual historical time-series data of PV and load, and then the distributed-resource aggregation characteristics simulation is carried out based on the typical-day basic data to verify the rationality of the proposed method in this chapter.
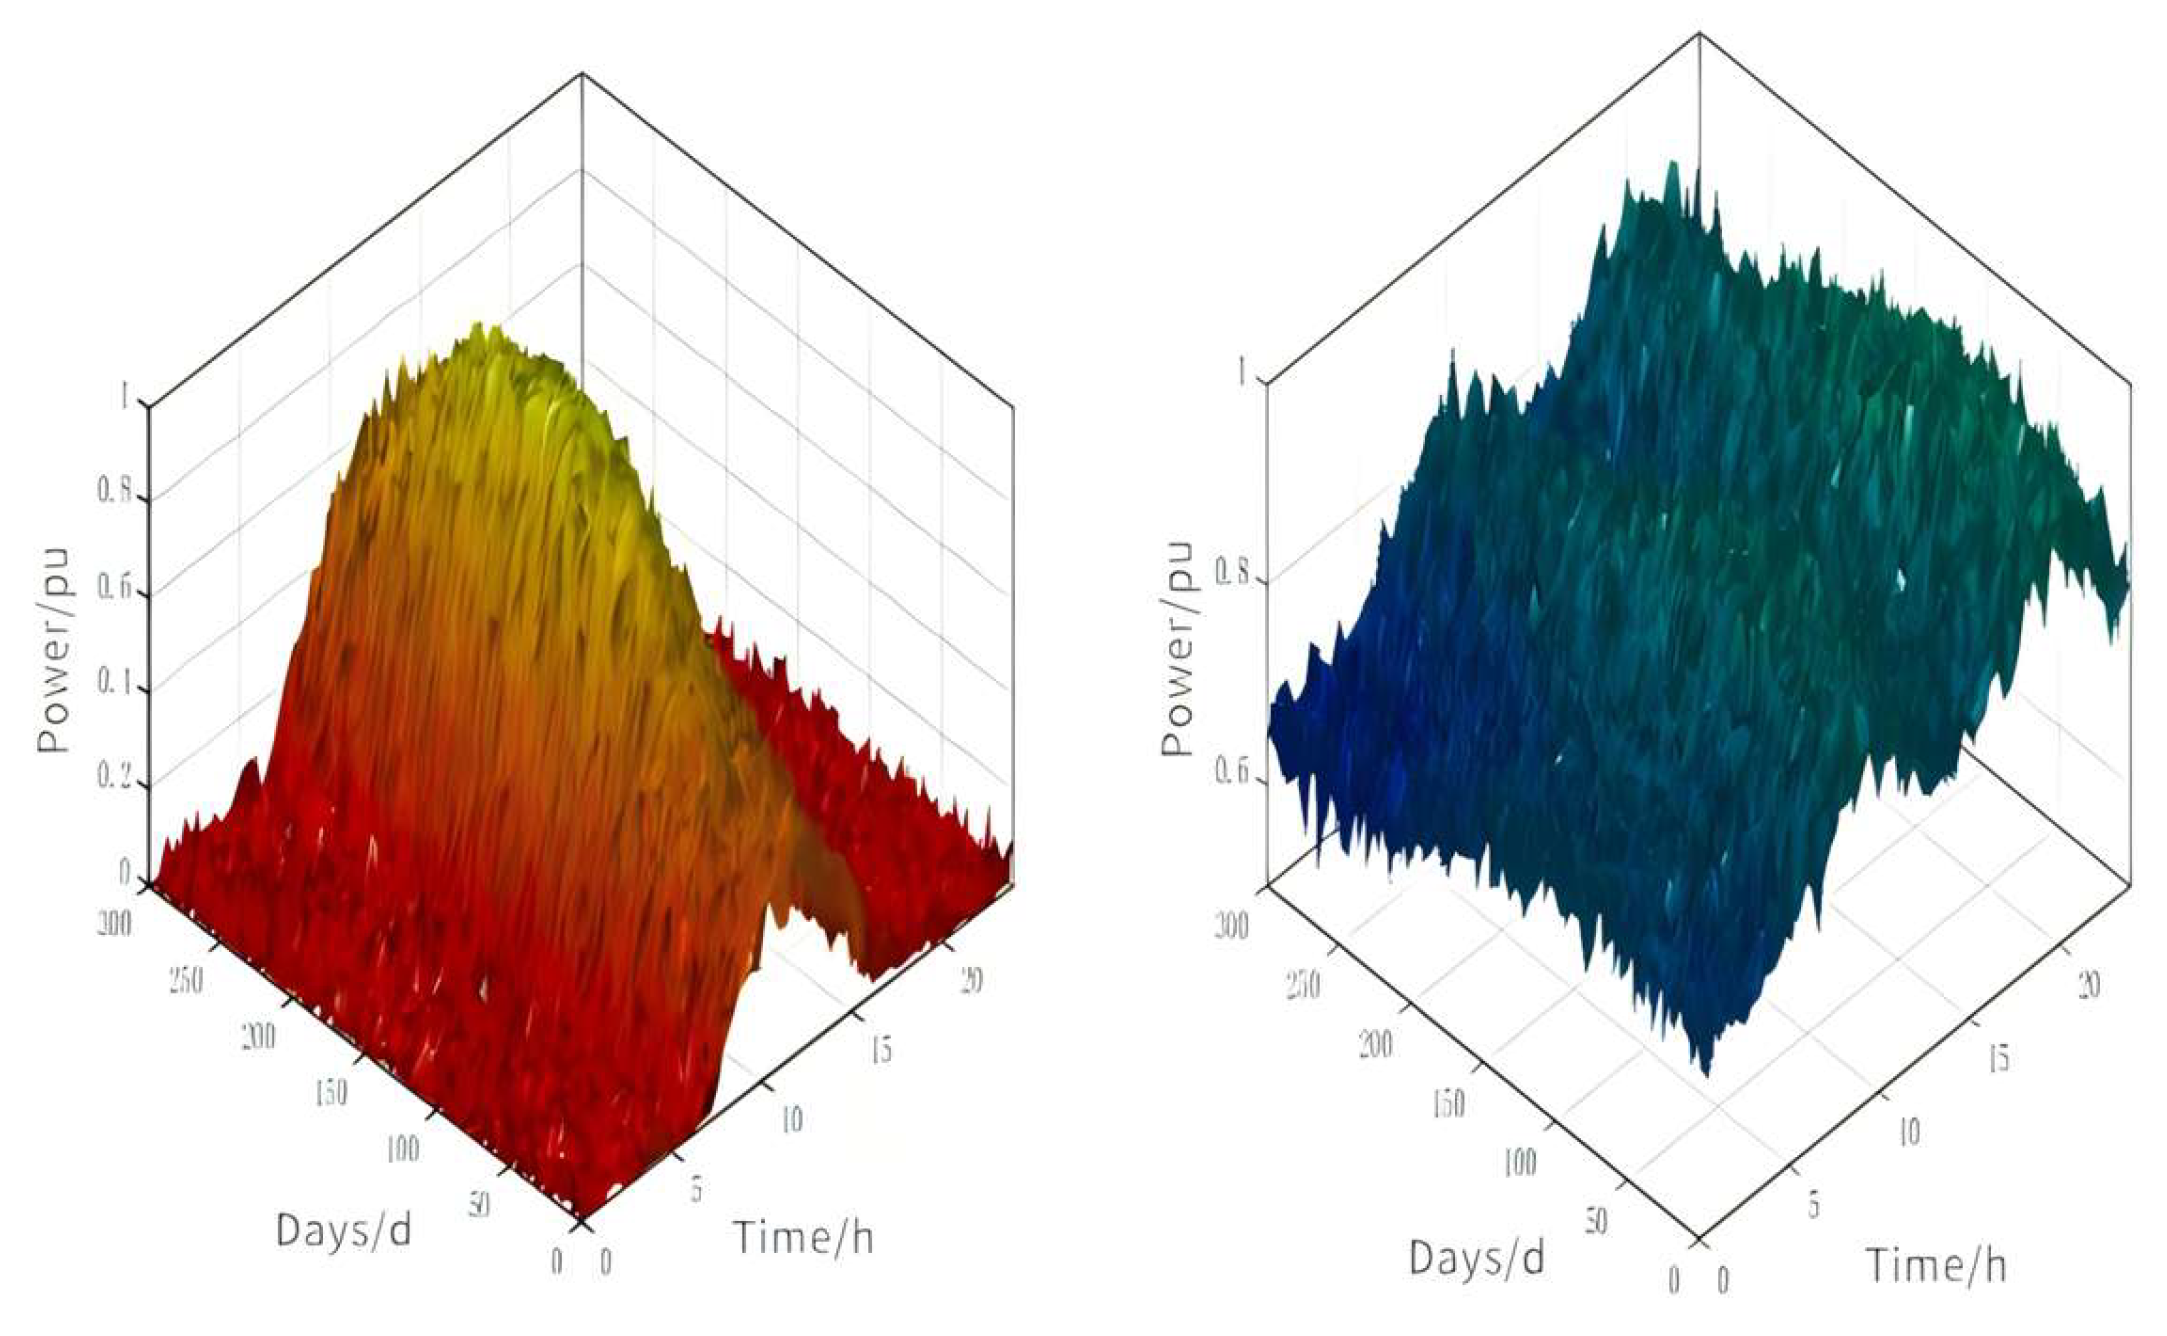
The annual historical time-series data of PV and load are shown in
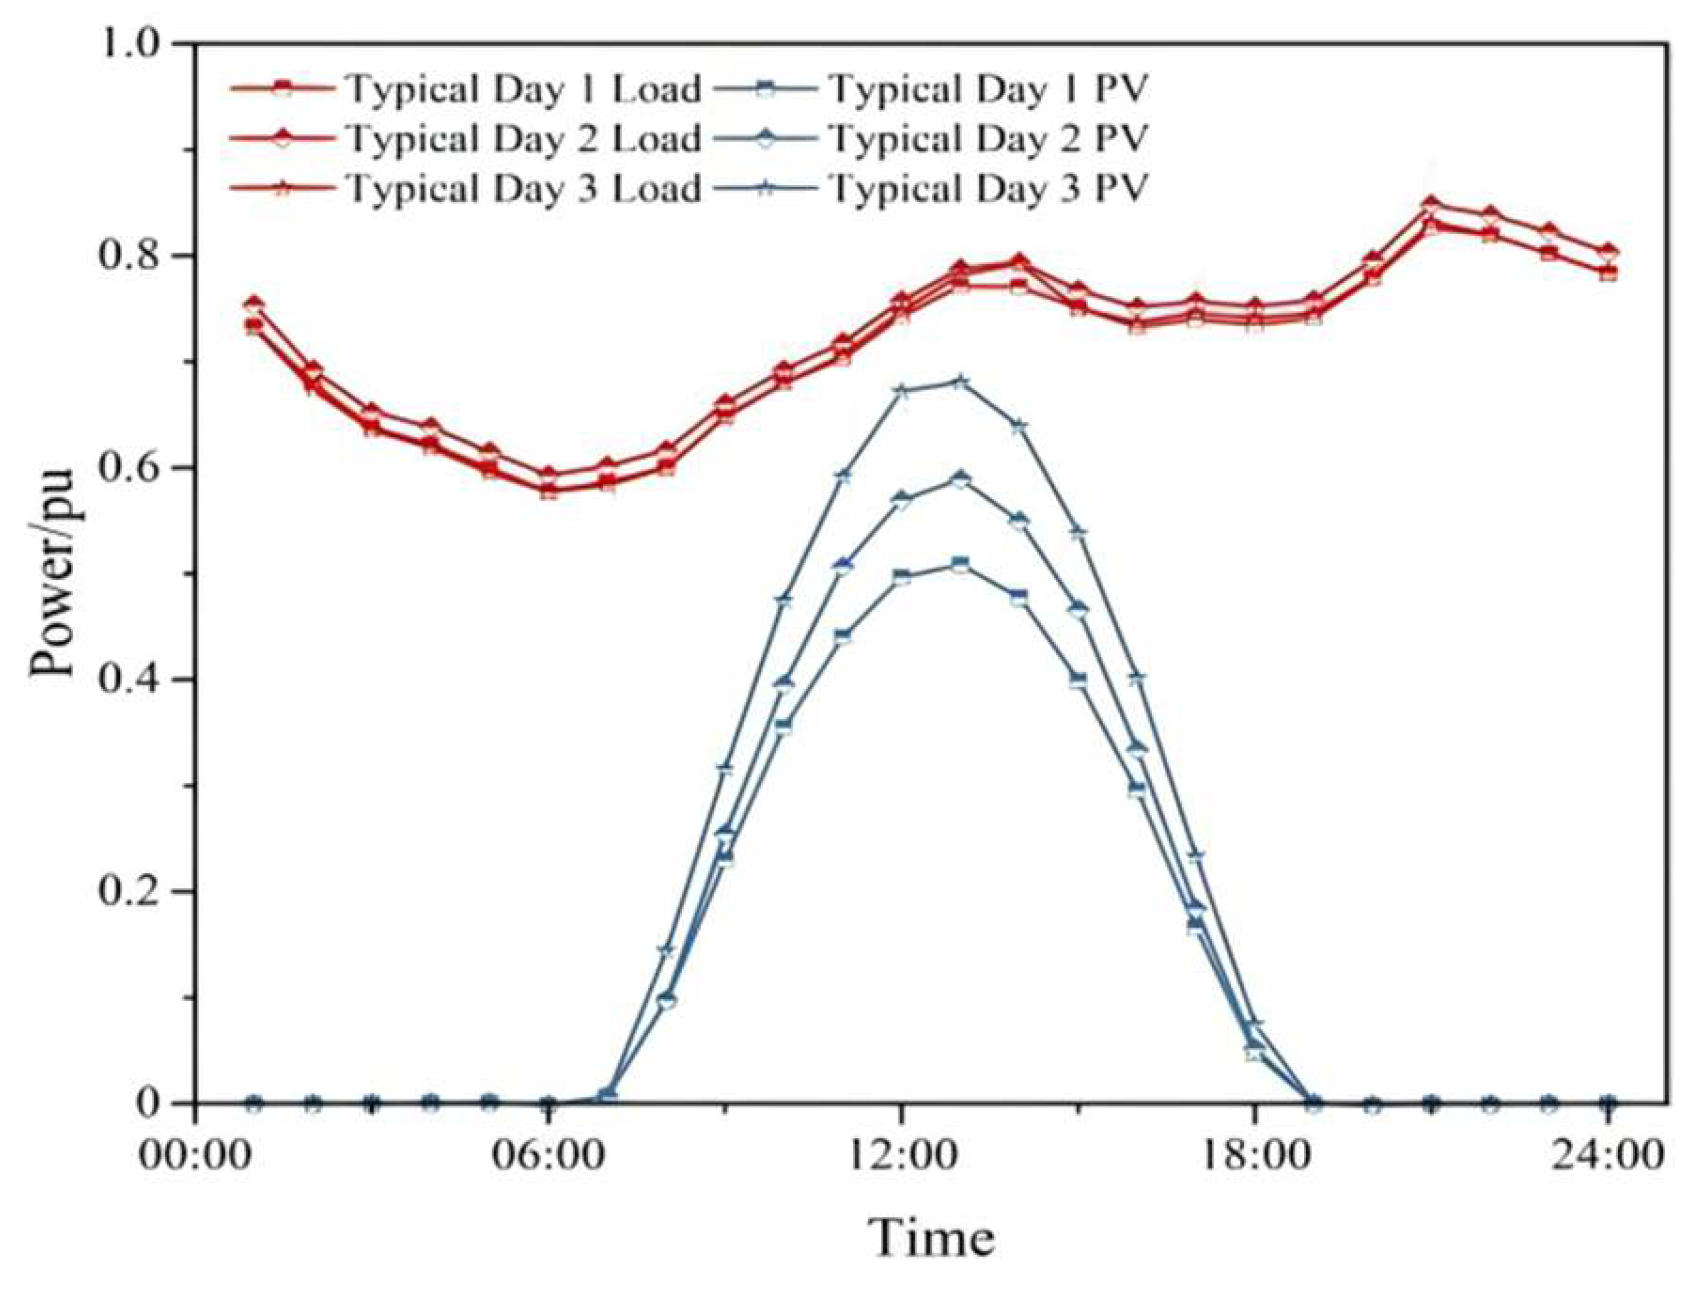
Figure 2. In order to more accurately reflect the seasonal fluctuation characteristics of annual power generation, this section selects three typical days as research samples, and the time-series variation characteristics of power generation and consumption are shown in
Figure 3. At the same time, based on the scene-reduction technology, the uncertainty of the production and consumption power in a typical day is generated. The number of random scenes corresponding to the three typical days is 32, 31 and 35, respectively, which can fully cover the fluctuation range of the production and consumption power in each season.
Under the support of the above typical daily basic data, the aggregation regulation characteristics of distributed flexible resources show a differentiation law: the aggregation power of the adjustable load cluster changes dynamically with the basic load of the system; the aggregated output characteristics of the distributed PV cluster are determined by its installed capacity and real-time lighting conditions. The ES cluster realizes peak shaving and valley filling through orderly charging and discharging; the EV cluster forms an adjustable capacity boundary based on the user’s travel law and the time-of-use electricity price signal. The aggregation operation characteristics and regulation rules of various resources are shown in
Figure 3,
Figure 4,
Figure 5,
Figure 6,
Figure 7 and
Figure 8, respectively:
In order to characterize the seasonal variation in annual PV and load power generation and consumption, this paper selects three typical days, and the comparison curve of power per unit value after cluster aggregation is shown in
Figure 3. The typical daily load curve shows a bimodal shape. The morning and evening are the peak periods of electricity consumption and the noon is the second peak. PV output shows a single peak shape, with the strongest output at noon and zero output at night.
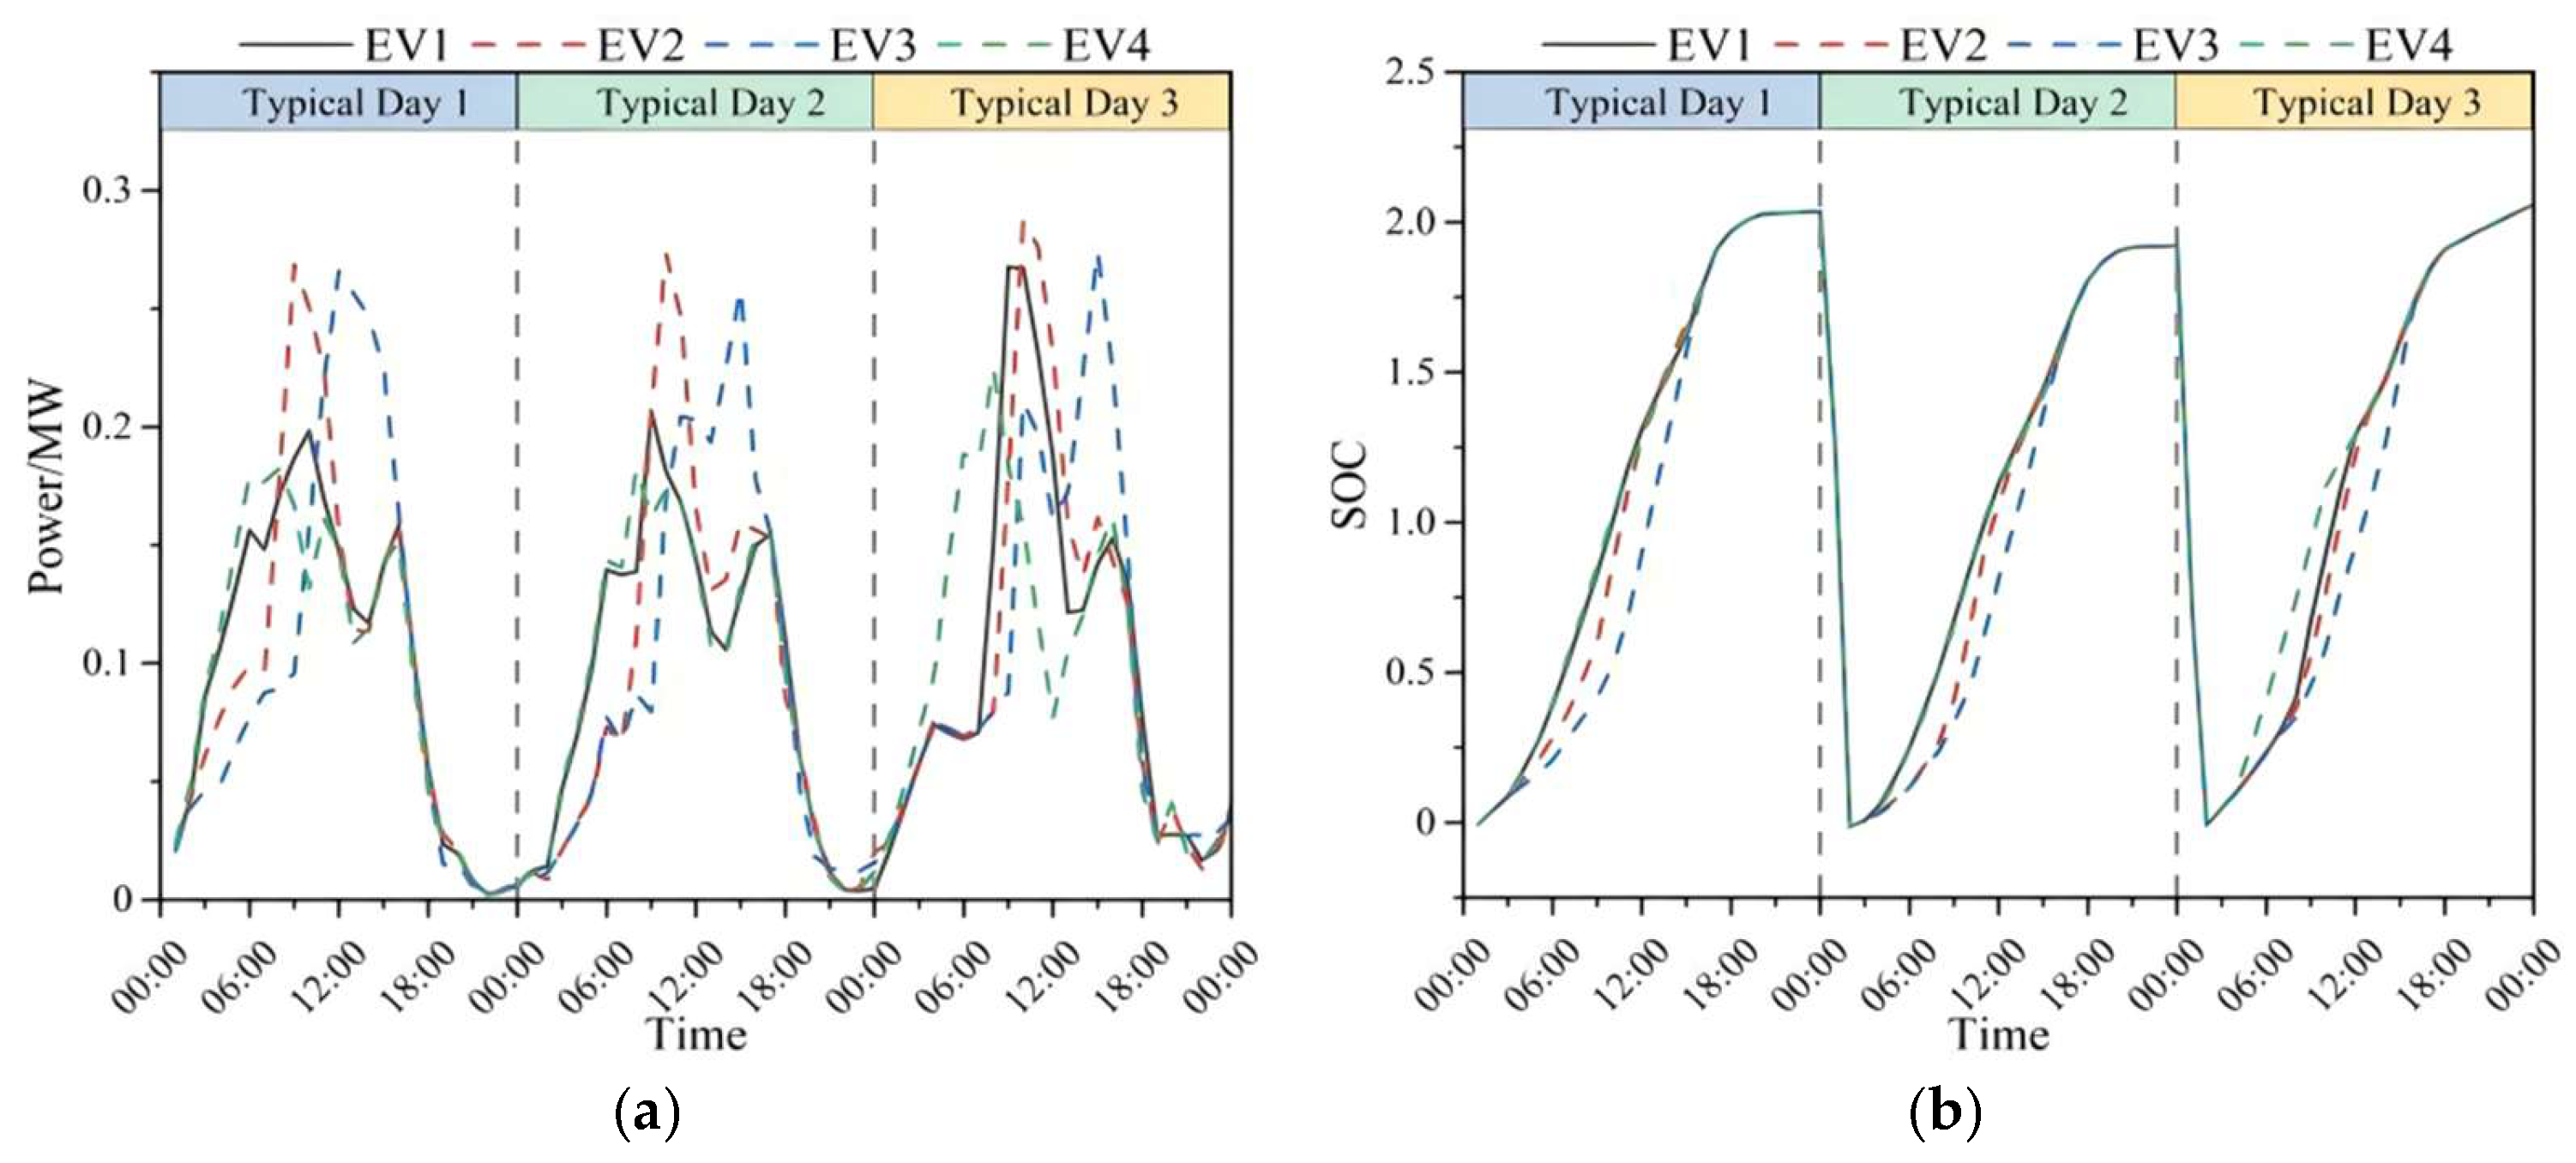
Figure 4 is the curve of the aggregate power and SOC of the four types of EV clusters in the ideal scenario. In the example, the proportion of 50% controllable vehicles is set to simulate the actual scheduling conditions. The charging power of the EV cluster is concentrated at 06:00–18:00 in the daytime, with a peak value of 0.2–0.25 MW, and the nighttime power tends to zero. Through orderly charging and discharging, the PV fluctuation can be suppressed and the level of new-energy consumption can be improved. The SOC variation characteristics of each cluster are different. Affected by the geographical location of the charging station and the power flow and voltage constraints of the feeder, it is necessary to dynamically optimize the charging and discharging timing to achieve the power flow balance of the distribution network and ensure the safe operation of the system.
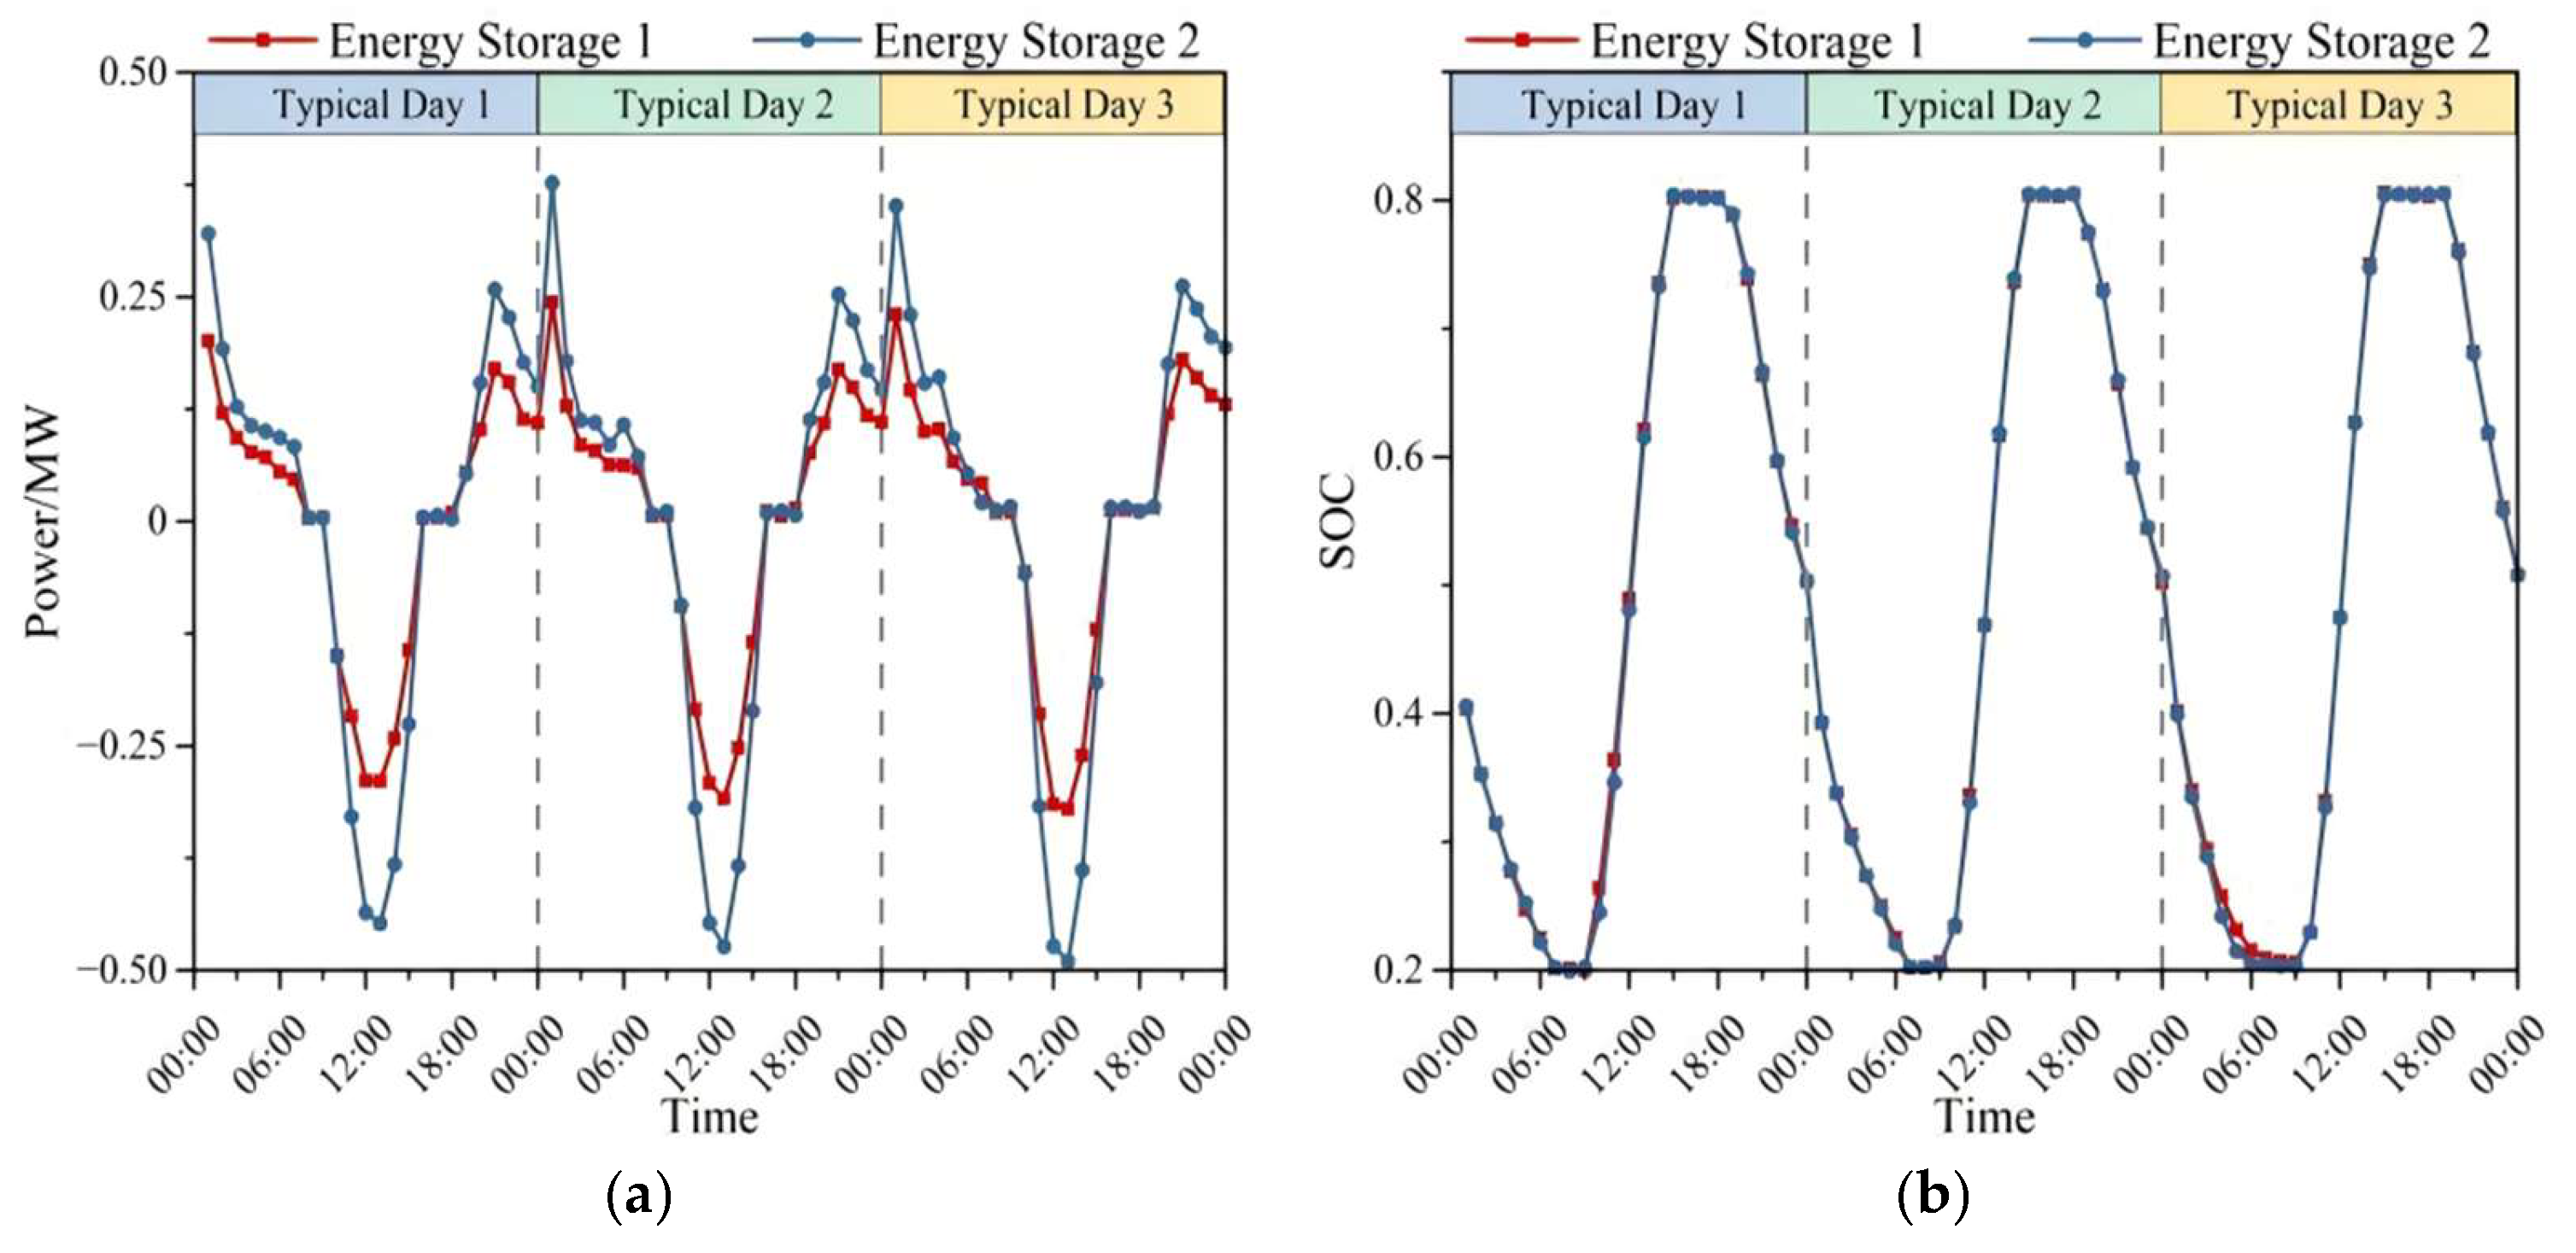
Figure 5 shows the active power and SOC change curves of the ES clusters at nodes 22 and 32 under the expected control scenario and stipulates that the discharge is positive and the charging is negative. Both ES systems adopt the strategy of charging during the high-incidence period of PV at noon and discharging during the peak load in the morning and evening to absorb the surplus PV output locally and stabilize the power fluctuation. The two groups of ES SOC change trends are basically the same, and the coordinated regulation rhythm matches well and is always maintained in the 0.2–0.8 safety interval. It can not only realize the peak load shifting of the distribution network, but also take into account the safety and service life of ES operation, which verifies the effectiveness of the ES cluster participating in the distribution network scheduling.
4.3. The Adjustable Capacity Boundary and Regulation Potential Evaluation of the Distributed-Resource Cluster
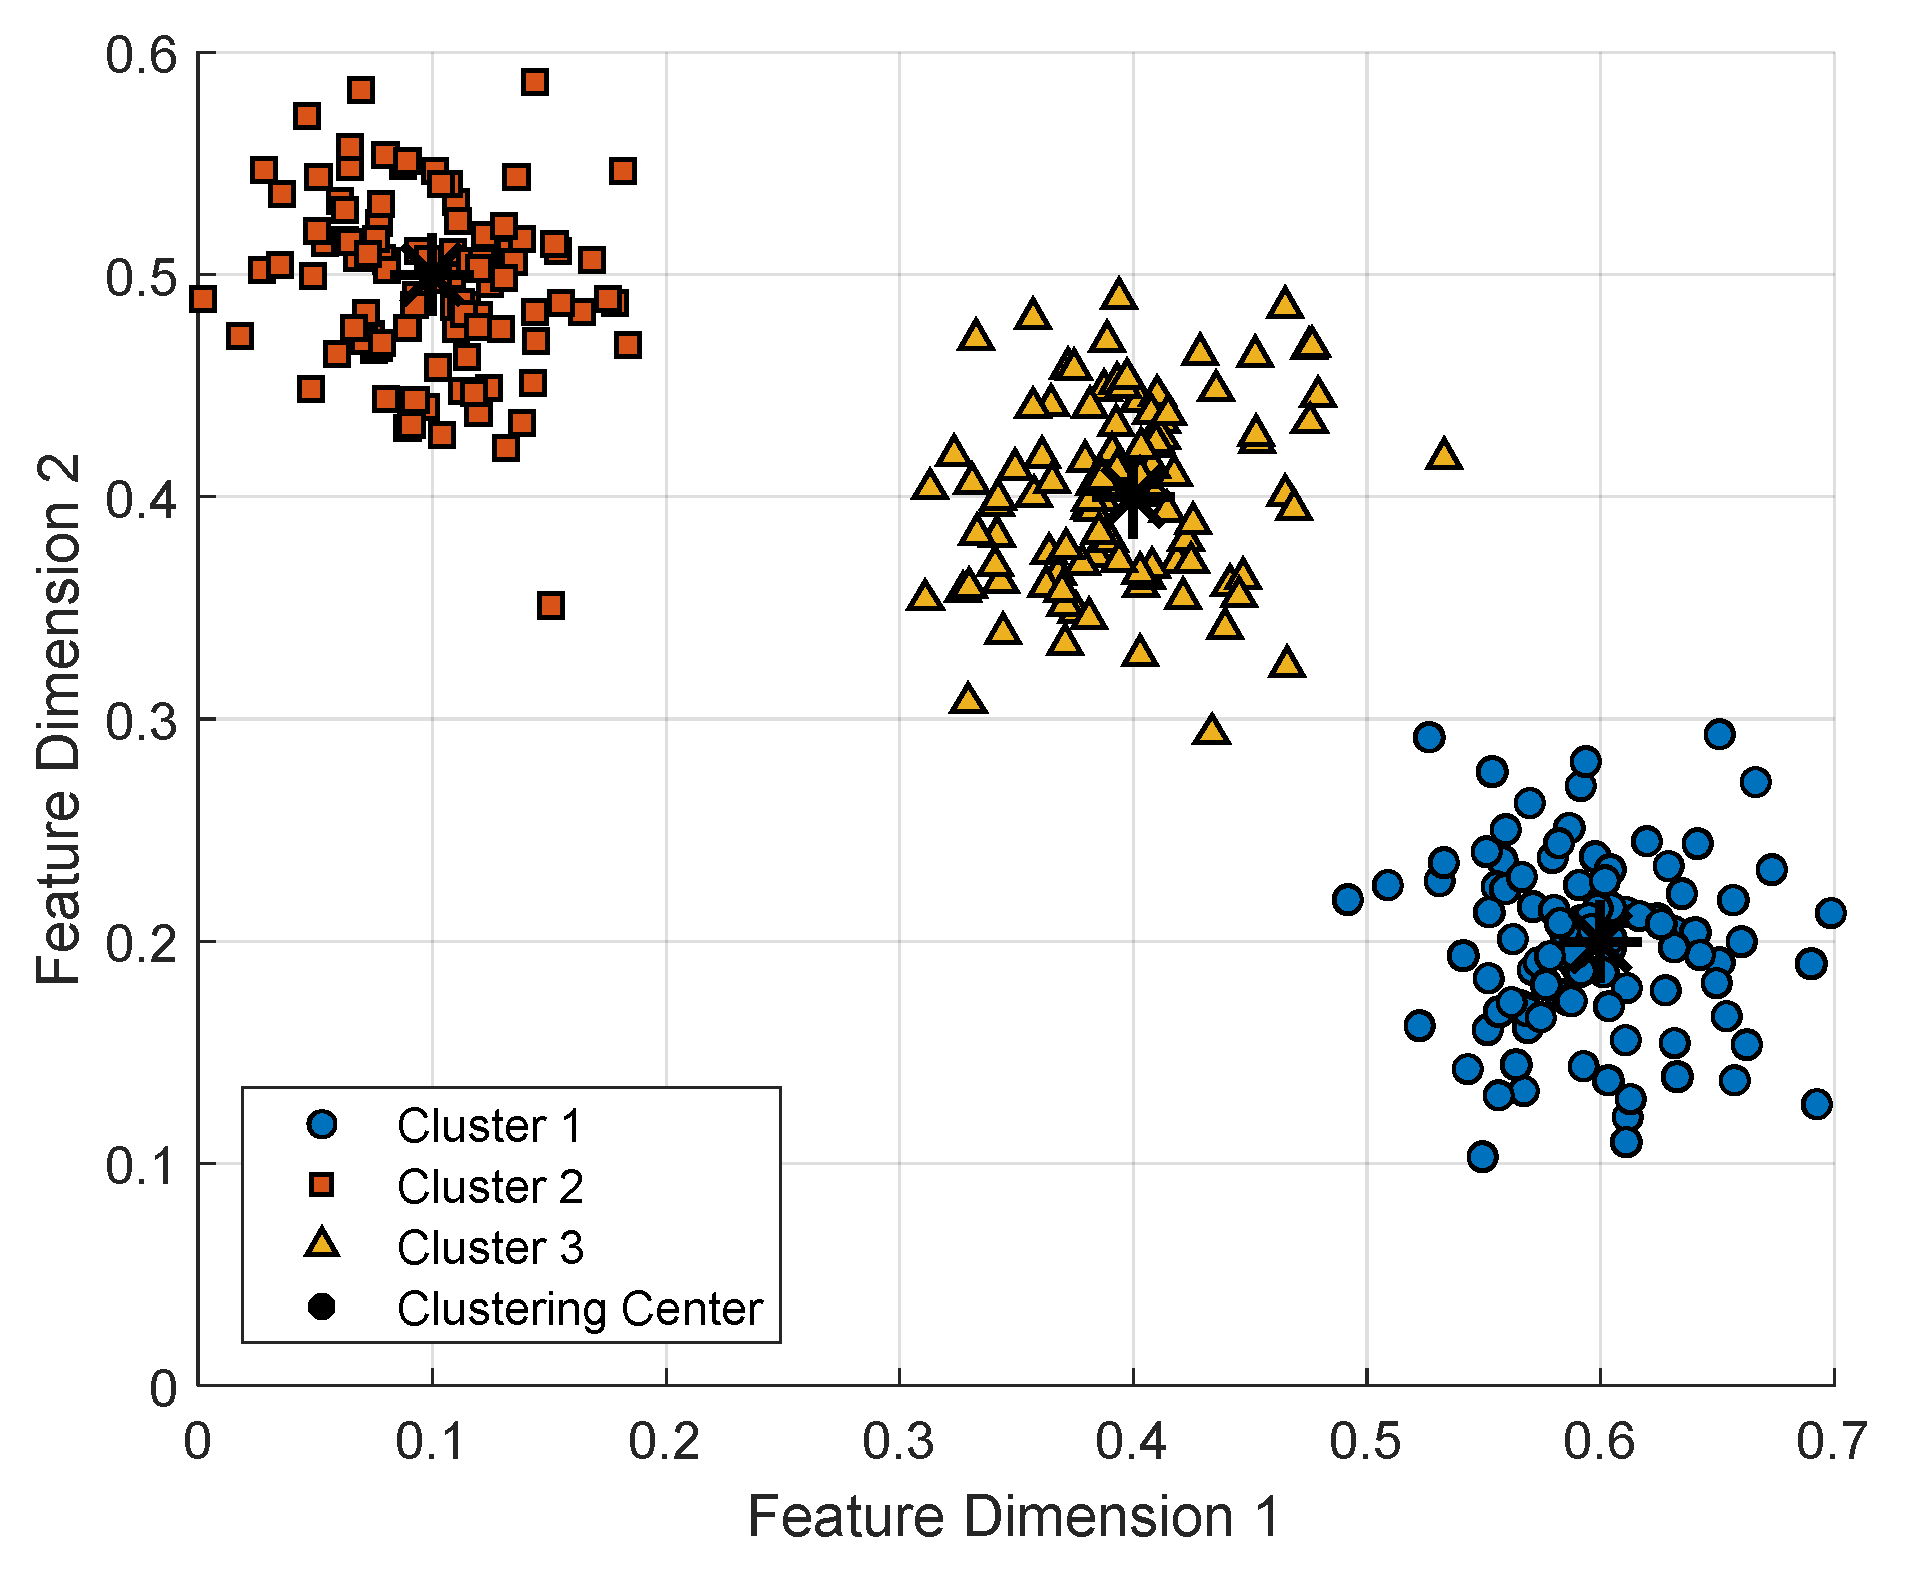
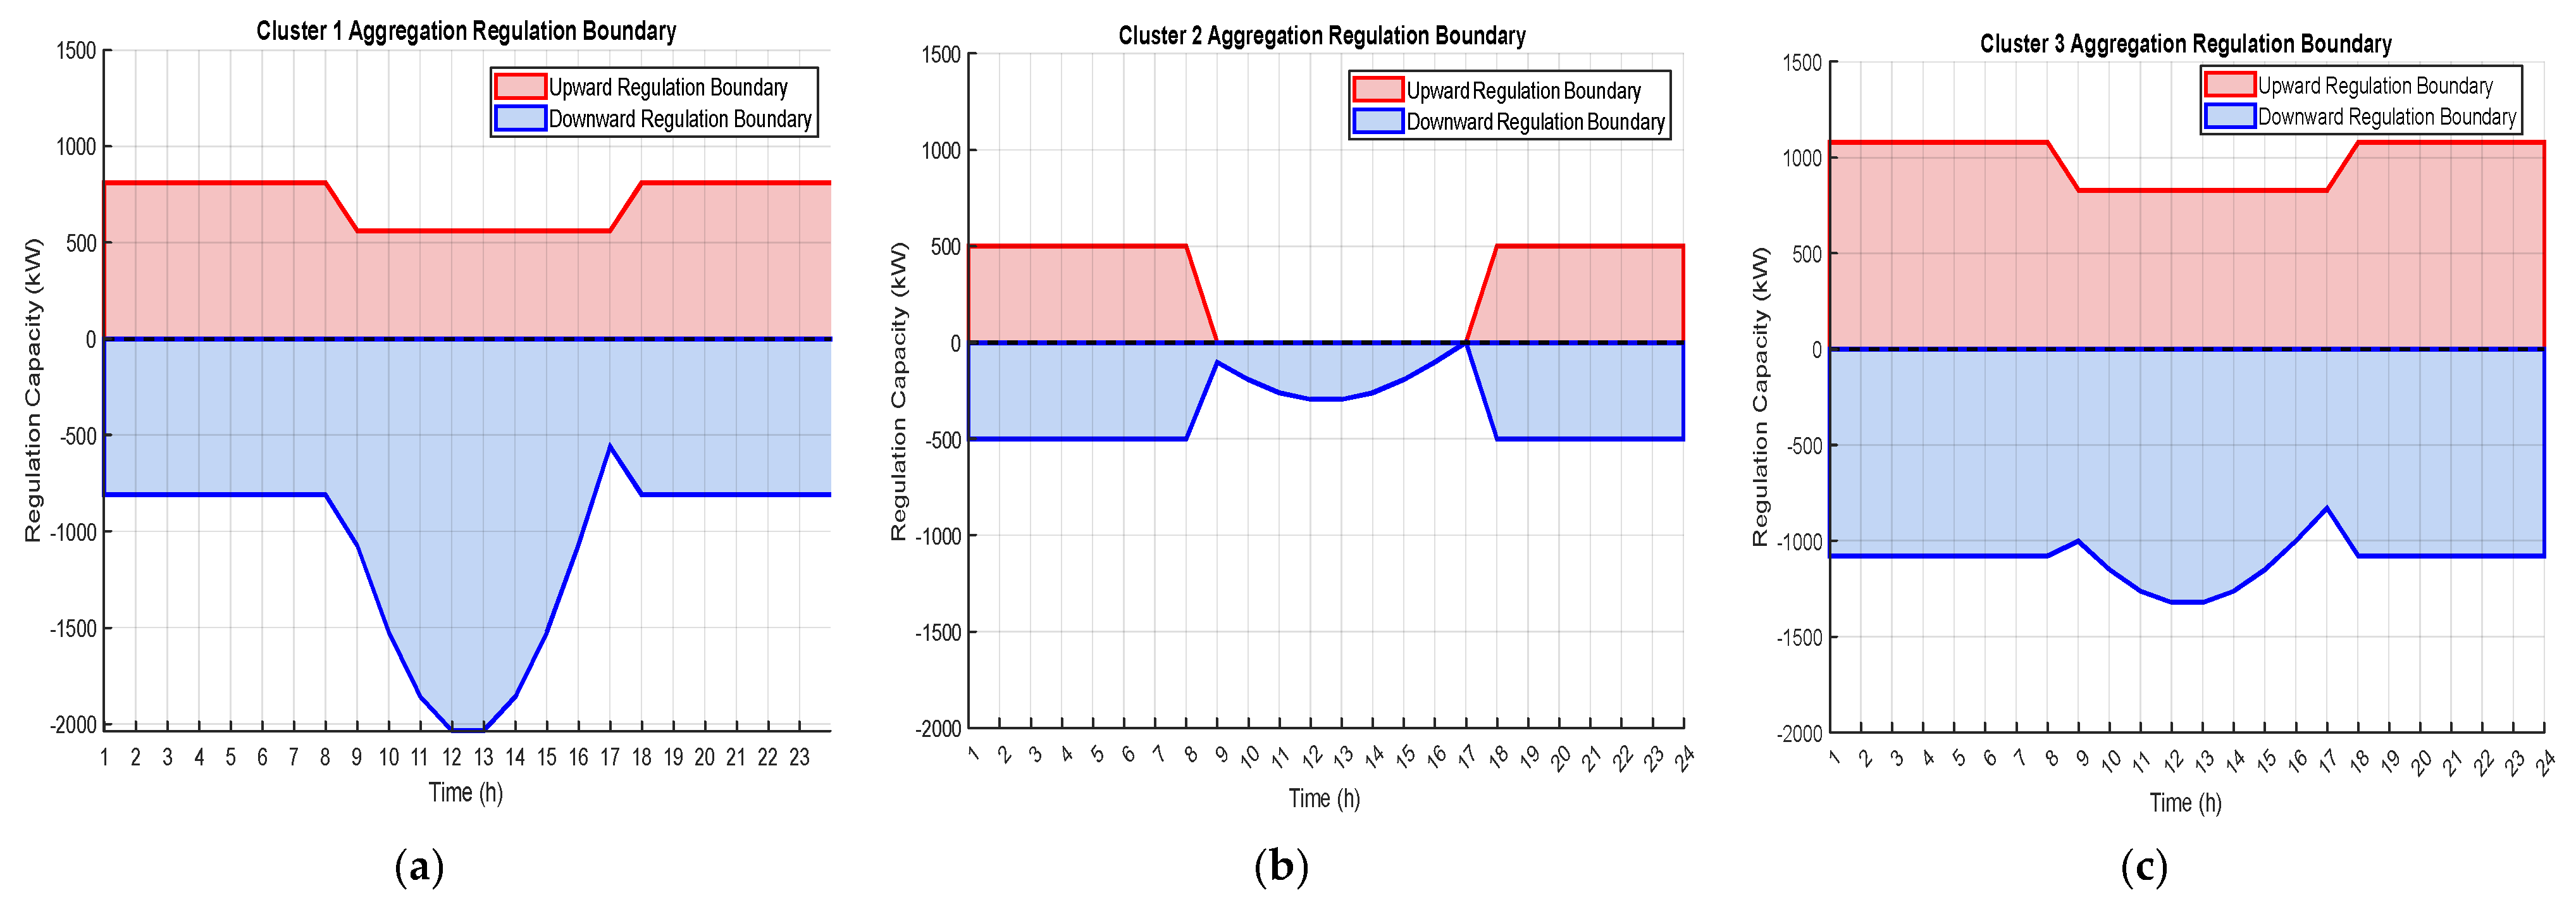
After completing the clustering of distributed-resources and the aggregation of control performance indicators, it is necessary to further quantitatively evaluate the control potential and adjustable boundary of each resource cluster, so as to provide a quantitative basis for the control decisions of the active distribution network. In this section, the effectiveness of the improved K-means algorithm and the rationality of the cluster division are verified by the two-dimensional feature clustering results, and the comprehensive regulation performance of the three distributed-resource clusters is compared and analyzed. Combined with the typical daily operation scenario, the aggregation adjustment boundary curve of each cluster is drawn, and its adjustable power interval is quantified to evaluate the regulation potential of different clusters. The division of three distributed-resource clusters is shown in
Table 2.
It can be seen from
Figure 6 that the three types of clusters have clear boundaries in the feature space, compact sample distribution, and no obvious cross-aliasing phenomenon, indicating that the improved K-means algorithm can effectively distinguish distributed-resource units with different regulatory performance characteristics. The clustering results have good discrimination and rationality, which can provide a reliable basis for subsequent cluster aggregation regulation and potential evaluation.
After verifying the rationality of clustering, the aggregation adjustment boundary curves of each cluster are drawn in combination with typical daily working conditions, and the adjustable power interval is quantified and the regulation potential is evaluated. The red and blue curves in the figure are the upper and lower capacity boundaries of the cluster, and the shadow area is the adjustable power range. The adjustable capacity time series of cluster 1 fluctuates significantly, and the peak capacity is reduced by more than 2000 kW from 11:00 to 14:00 at noon, which is suitable for large-scale PV consumption demand. The up-regulated capacity is stable at about 800 kW, which can provide power support continuously, and the overall regulation potential is strong. The adjustable range of cluster 2 changes gently, the peak value of up and down capacity is about 500 kW, and the time-series fluctuation is small. Affected by the resource characteristics dominated by the flexible load of electric vehicles, the regulation stability is good, suitable for daily load stabilization, moderate regulation potential and high stability. The adjustable change trend of cluster 3 is similar to that of cluster 1, but the fluctuation is more gentle. The peak values of down-regulated and up-regulated capacity at noon are about 1300 kW and 1100 kW, respectively, and the adjustable scale is in the middle. It can cooperate with other clusters to complete PV consumption and load regulation, and the regulation potential is balanced.
4.4. Cloud–Edge Collaborative Active Power Scheduling for Active Distribution Network for Peak Shaving and Valley Filling
The example in this section refers to the distribution network topology in
Figure 1, and the controllable resource type and topology access position remain unchanged. In order to fully verify the effectiveness of the proposed cloud–edge collaborative optimization method, on the basis of the original system, following the principle that the position of reactive power compensation equipment follows the disturbance position, a static var compensator (SVC) and a group switching capacitor bank are added. The flexible load in the system accounts for 30%, which can participate in peak shaving and valley filling and load transfer adjustment. The specific access nodes and parameters are shown in
Table 3.
The simulation simulates the operation status of the distribution network in 24 discrete time periods on a typical day. Each time period corresponds to 1 h. It is necessary to obtain the adjustable resources and network operation status data of each node at the initial time of each time period and determine the multi-resource collaborative control scheme through the corresponding control strategy. In order to illustrate the effectiveness of the cloud–edge cooperative control strategy proposed in this paper, the following three examples are set up, and the simulation results are compared and analyzed in different scenarios:
Case 1: Only the global optimization of the cloud side is the traditional centralized control architecture. The cloud-side control center uniformly collects the resources and network status data of all nodes in the whole network, does not divide the side cluster, only realizes the global active power optimization, and ignores the side autonomy characteristics.
Case 2: Autonomous optimization of only side areas, which is a completely decentralized control mode, does not set up a global coordination center on the cloud side. Each side area independently collects local node status data and only relies on local resources to complete peak shaving and valley filling. There is no global cross-regional coordination and resource coordination allocation. The division of the side cluster is shown in
Table 2.
Case 3: Cloud-edge collaborative optimization, that is, the method proposed in this chapter, constructs a collaborative framework of cloud-side global coordination, edge-side regional autonomy, and end-side precise execution. The cloud side is responsible for cross-regional active resource coordination and instruction allocation, and the edge side is responsible for local instruction execution and hard constraint verification, so as to achieve multi-objective coordination of peak load shifting, new-energy consumption and economy.
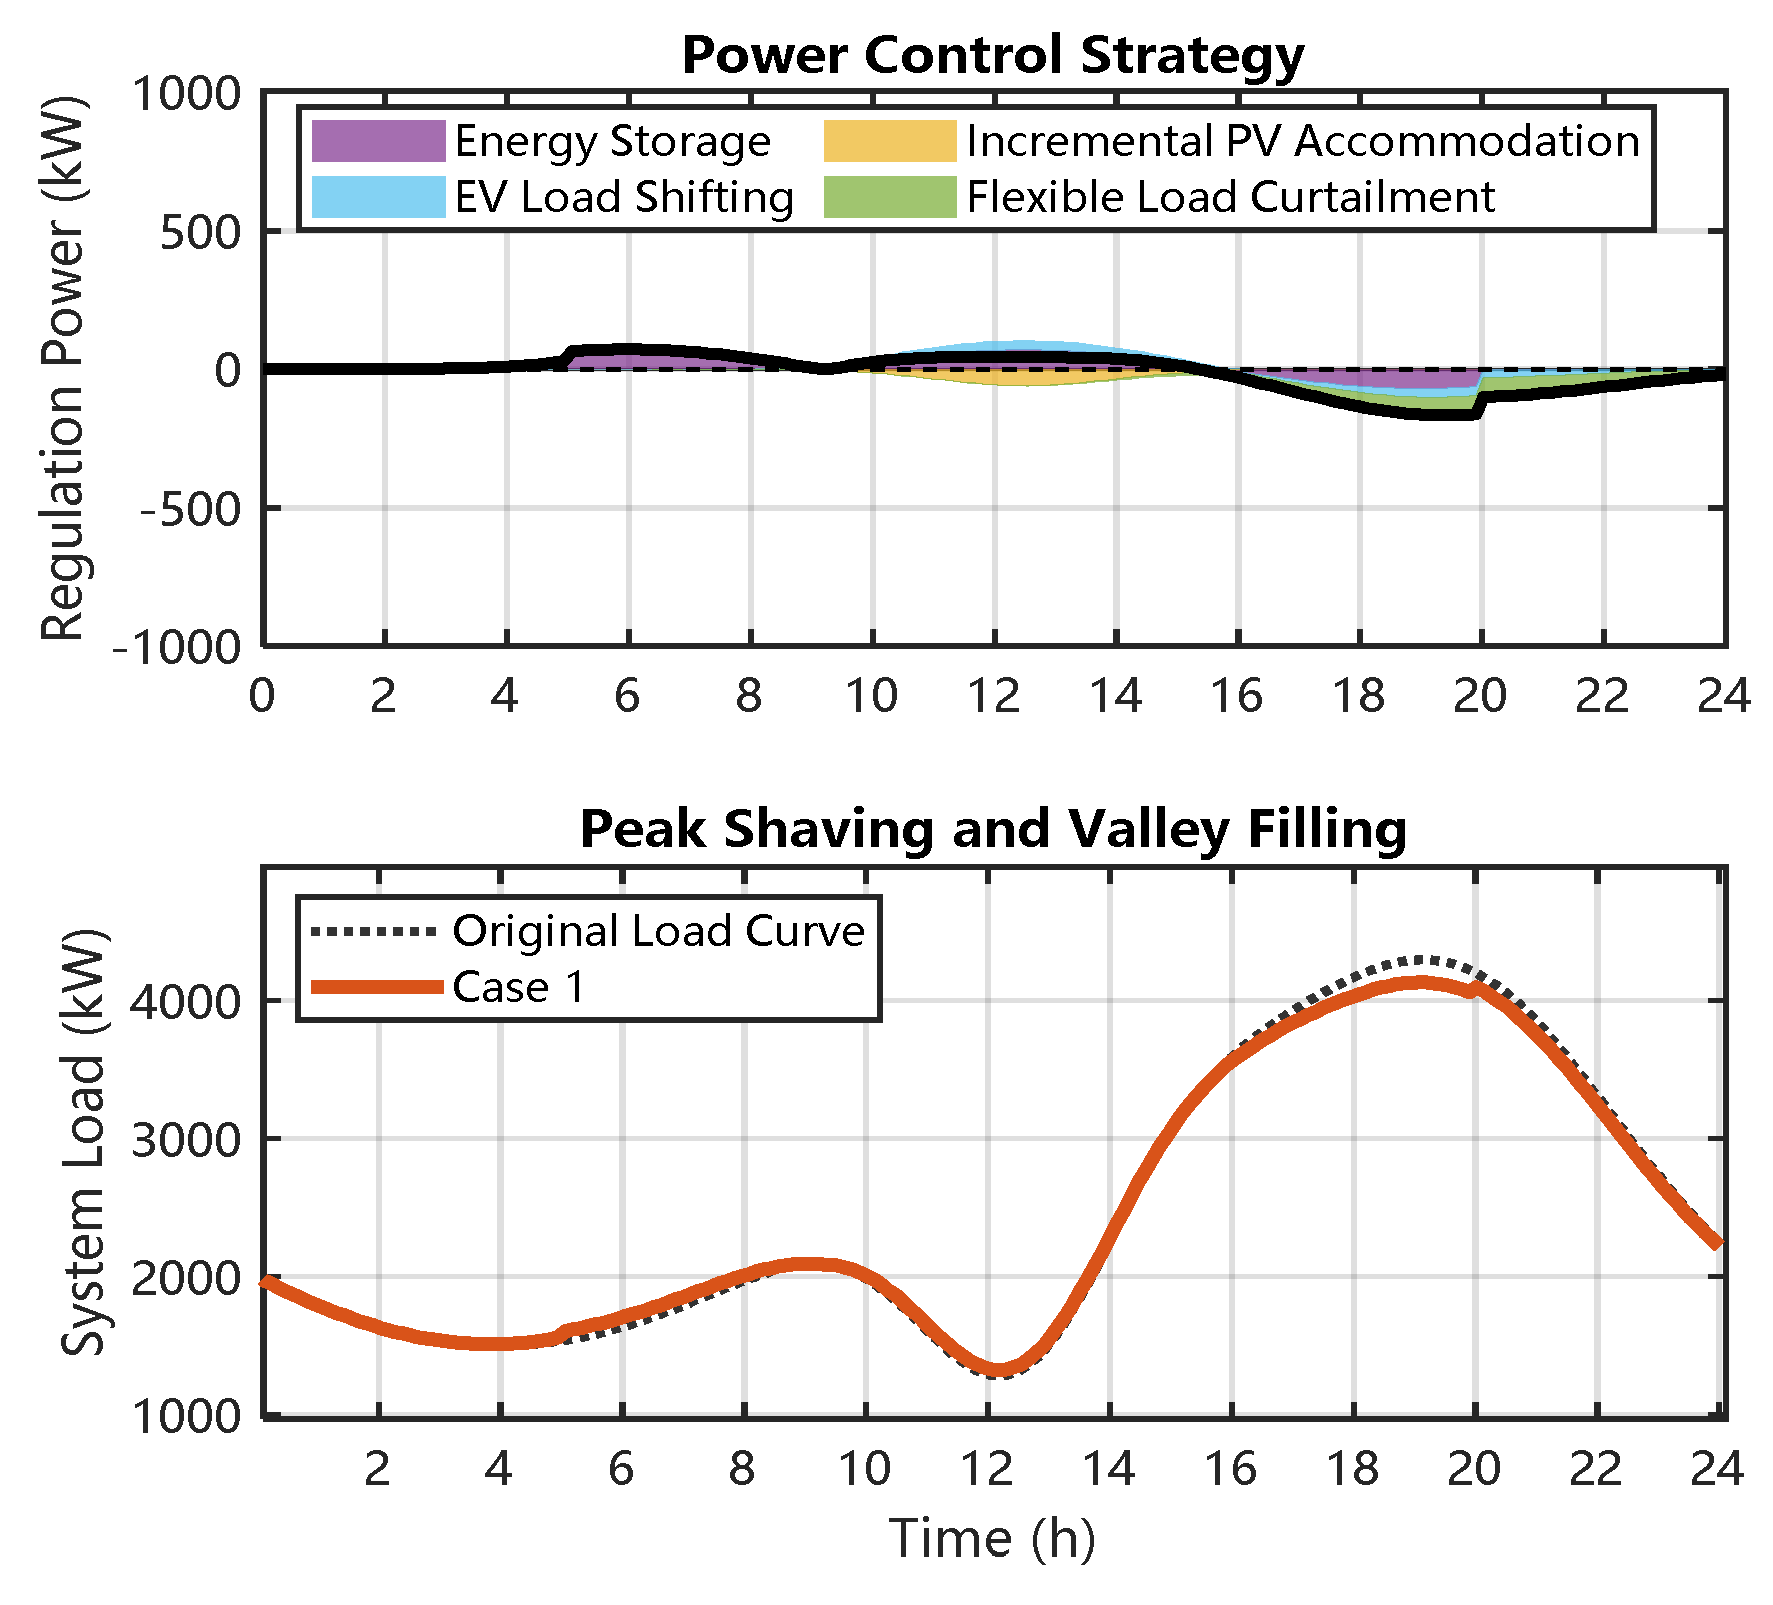
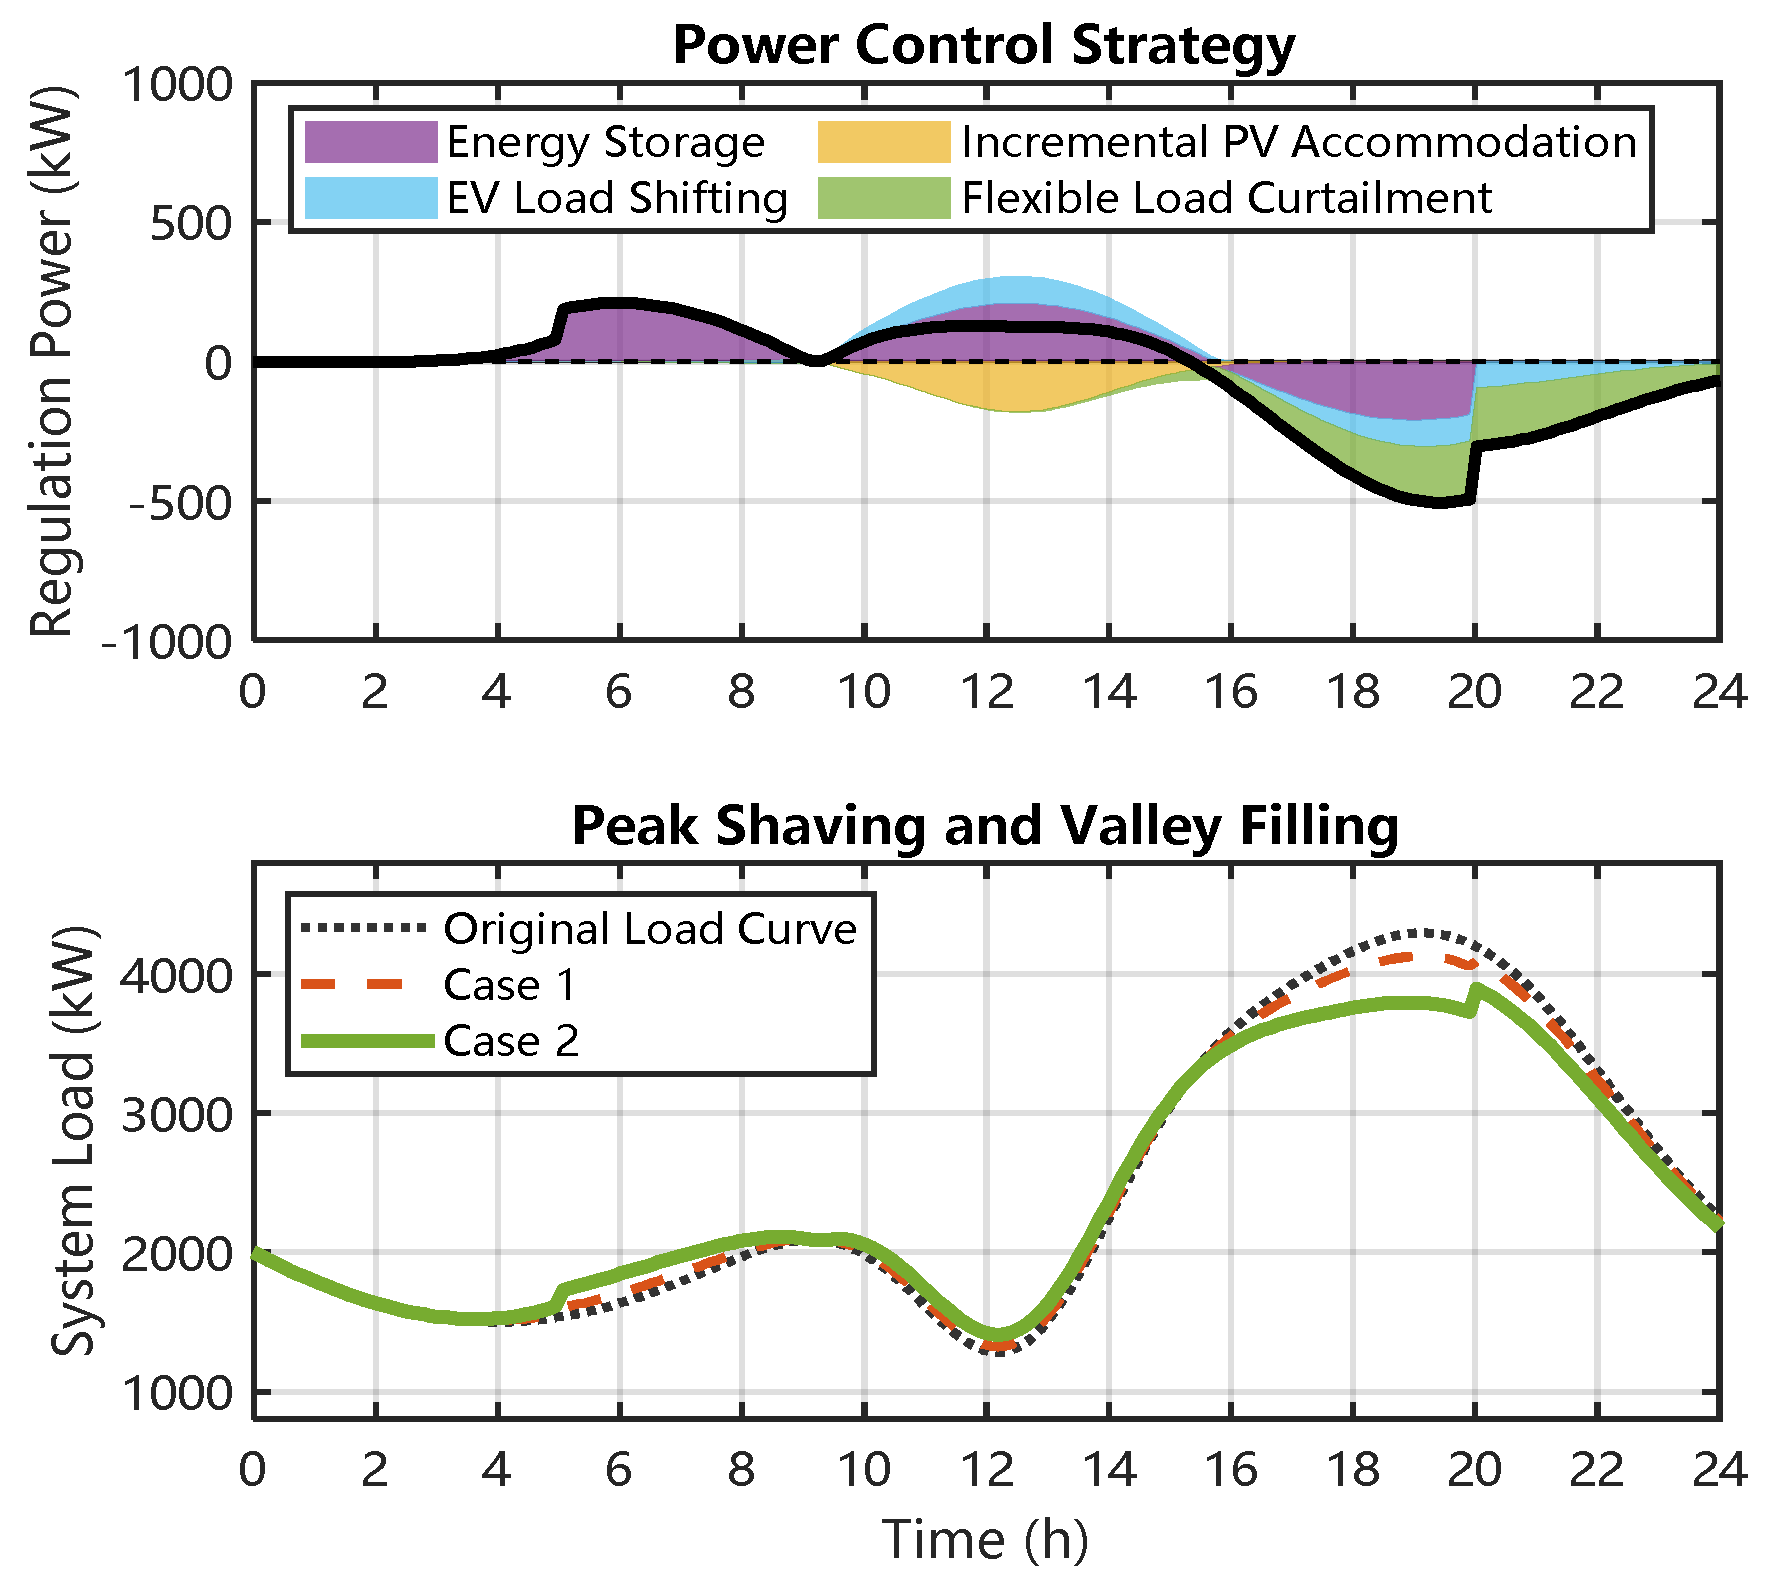
The peak–valley difference in system load in case 1 is reduced from 3015.39 kW in the original baseline to 2805.95 kW, and the peak–valley difference reduction rate is about 6.95%. Although cloud-side centralized optimization can achieve global resource allocation, it is limited by local topology constraints and lacks real-time feedback on the side, resulting in conservative scheduling strategies, insufficient cross-regional configuration of ES and PV output, and limited overall peak clipping depth.
It can be seen from
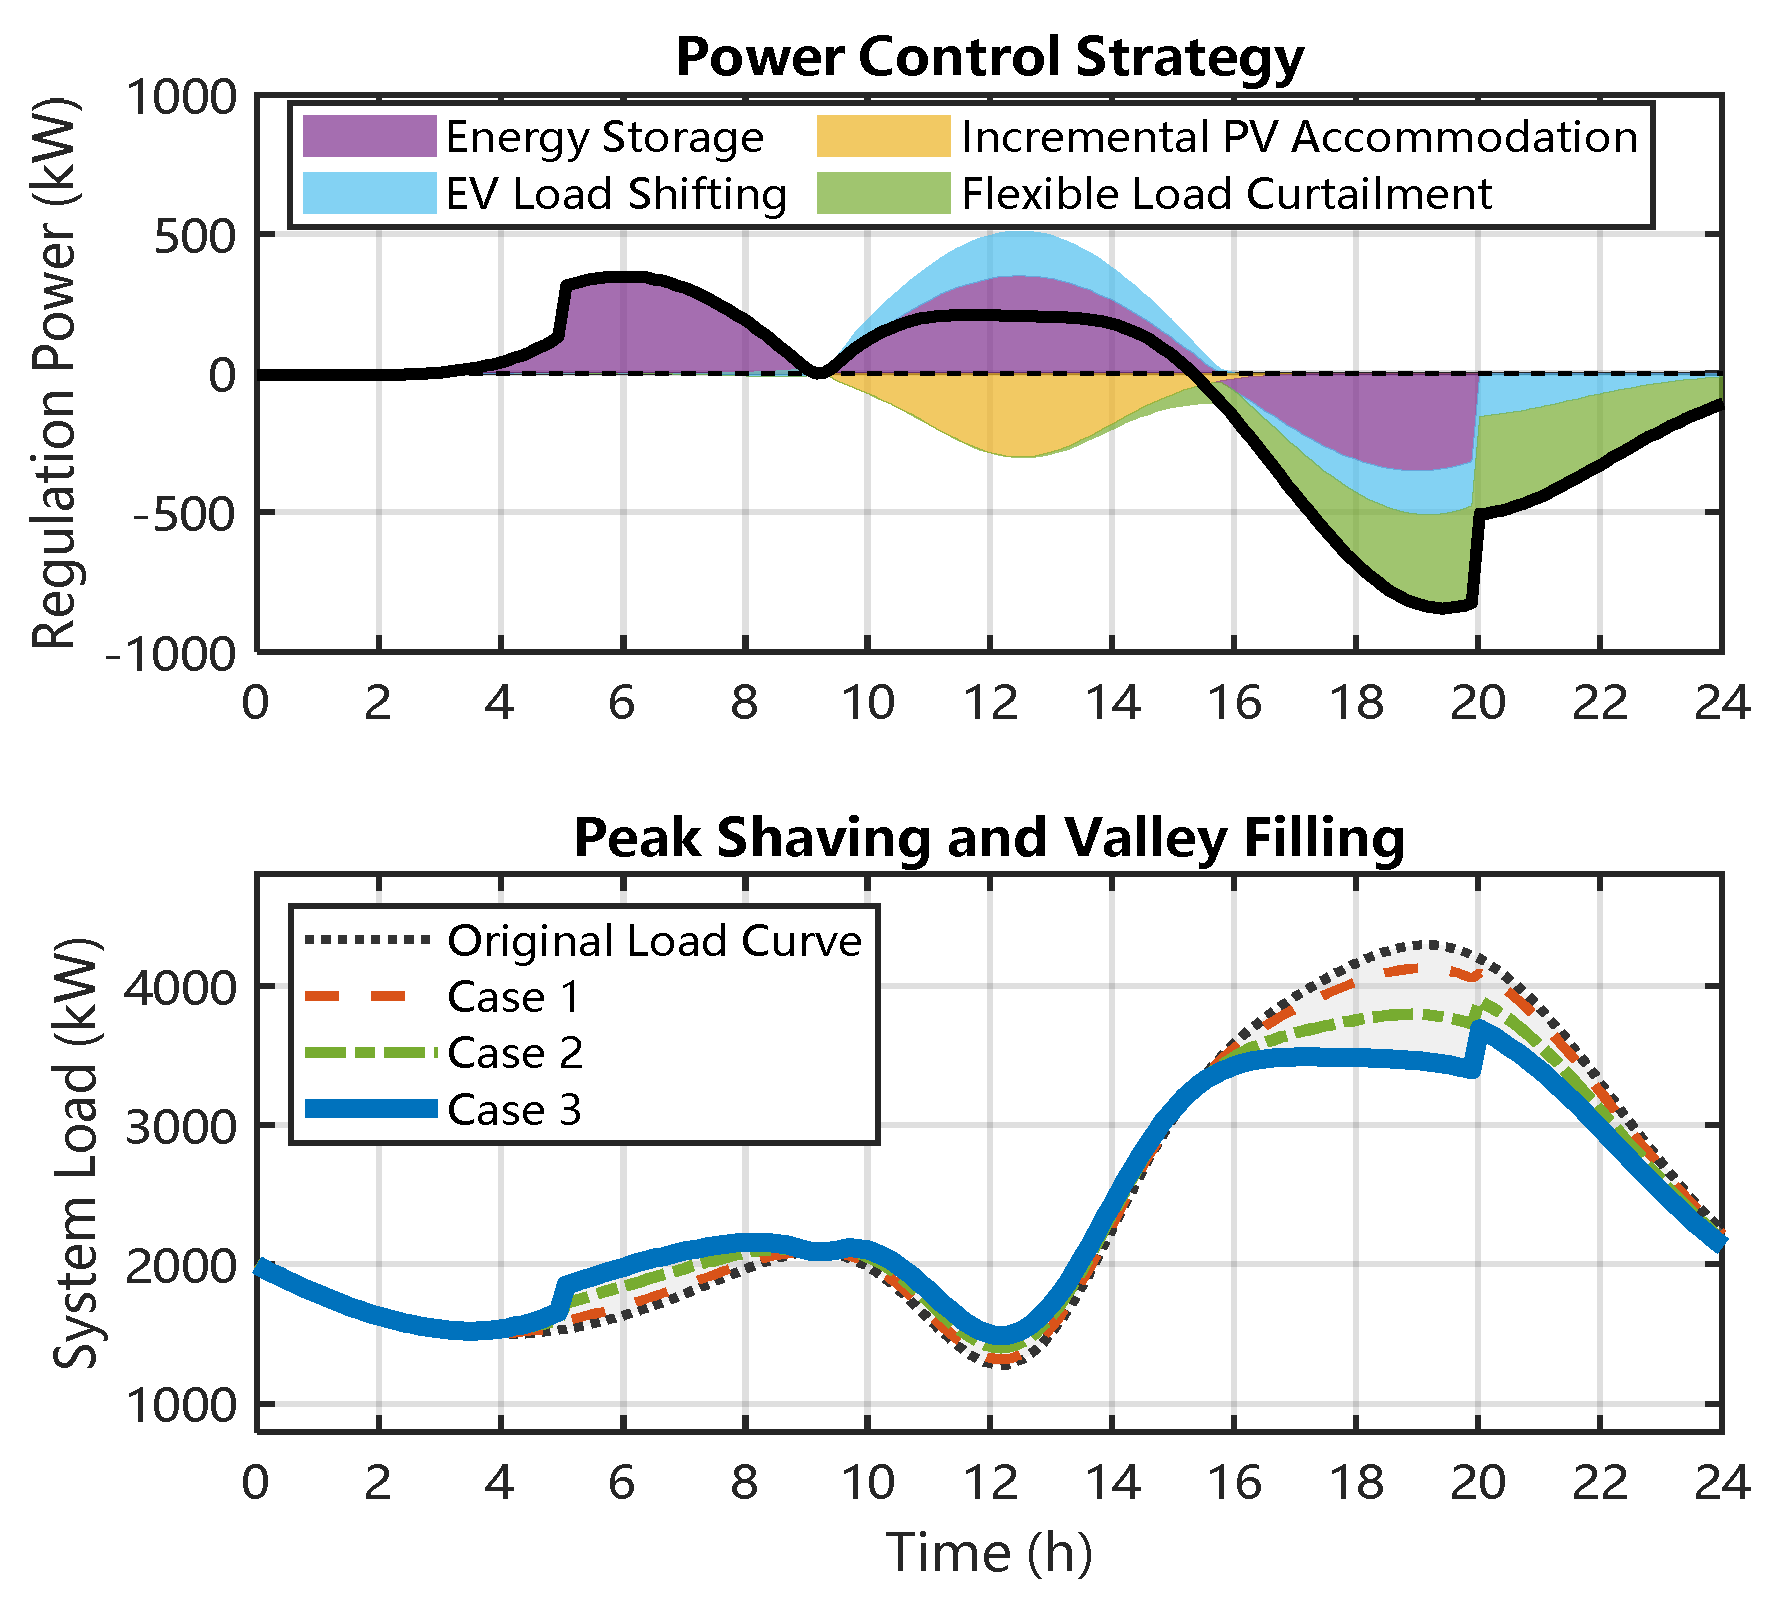
Figure 9 that the load peak–valley difference is reduced to 2381.90 kW, and the peak–valley difference reduction rate is increased to 21.01%. Each region independently uses local resources to participate in regulation and control, and the response speed is faster. However, due to the lack of global coordination, local light abandonment occurs during the period of PV power generation, and the peak clipping ability in the evening peak period is limited by the regional resource capacity, which cannot achieve the optimal matching of the whole network’s resources.
From
Figure 10, it can be seen that the peak–valley difference in load is further reduced to 1968.17 kW and the peak–valley difference reduction rate reaches about 34.74%. The effect of peak shaving and valley filling is the best in the three scenarios. The cloud side coordinates the resource allocation of the whole network, and the edge side executes flexibly according to the priority, which realizes the synergistic effect between the cloud side and the edge side: during the valley period, the surplus PV is removed by ES charging and EV load, and the load peak is suppressed by ES discharge and flexible load in the evening peak. This strategy ensures the full consumption of PV while achieving the goal of global peak shaving and valley filling and verifies the effectiveness of this method in the efficient utilization of resources.
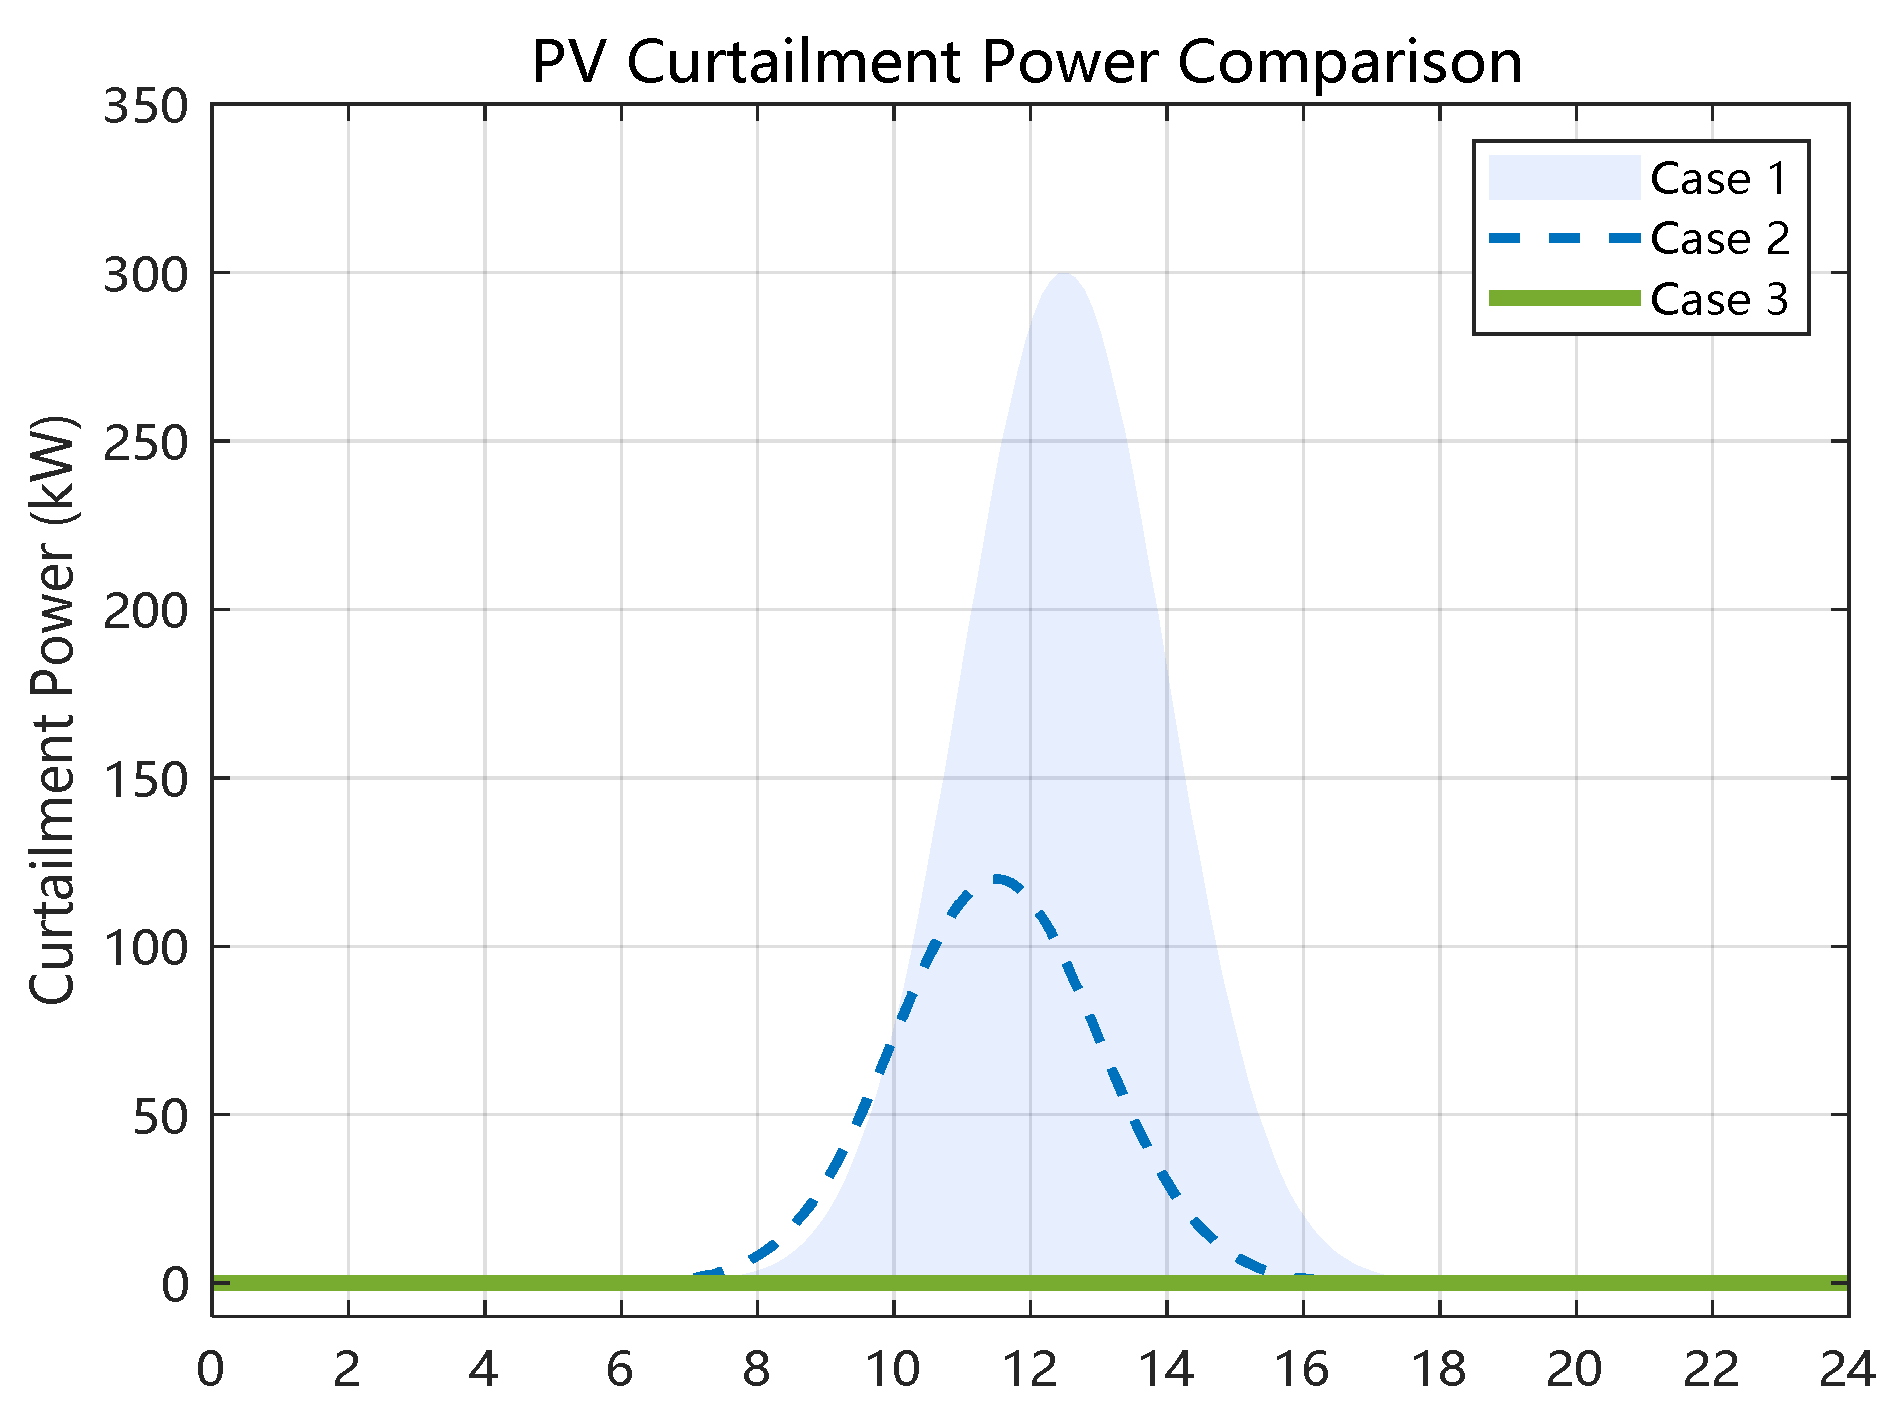
It can be seen from the
Figure 11 that case 1 has the largest PV curtailment power. Because the centralized optimization of the cloud side does not achieve cross-regional resource support, the PV output is limited by the local consumption capacity, resulting in a large number of PVs that cannot be effectively utilized. In case 2, there is local light abandonment. In the side autonomy mode, the PV in the region is only used for local peak shaving and valley filling. There is no cross-regional coordination, so the surplus PV cannot support the peak load area. In case 3, there is no PV curtailment. Through cross-regional resource complementarity, the cloud–edge collaboration accurately allocates the surplus PV during the trough period to the peak load area, realizes the full consumption of PV while completing the peak load shifting, and improves the economy and new-energy utilization rate.
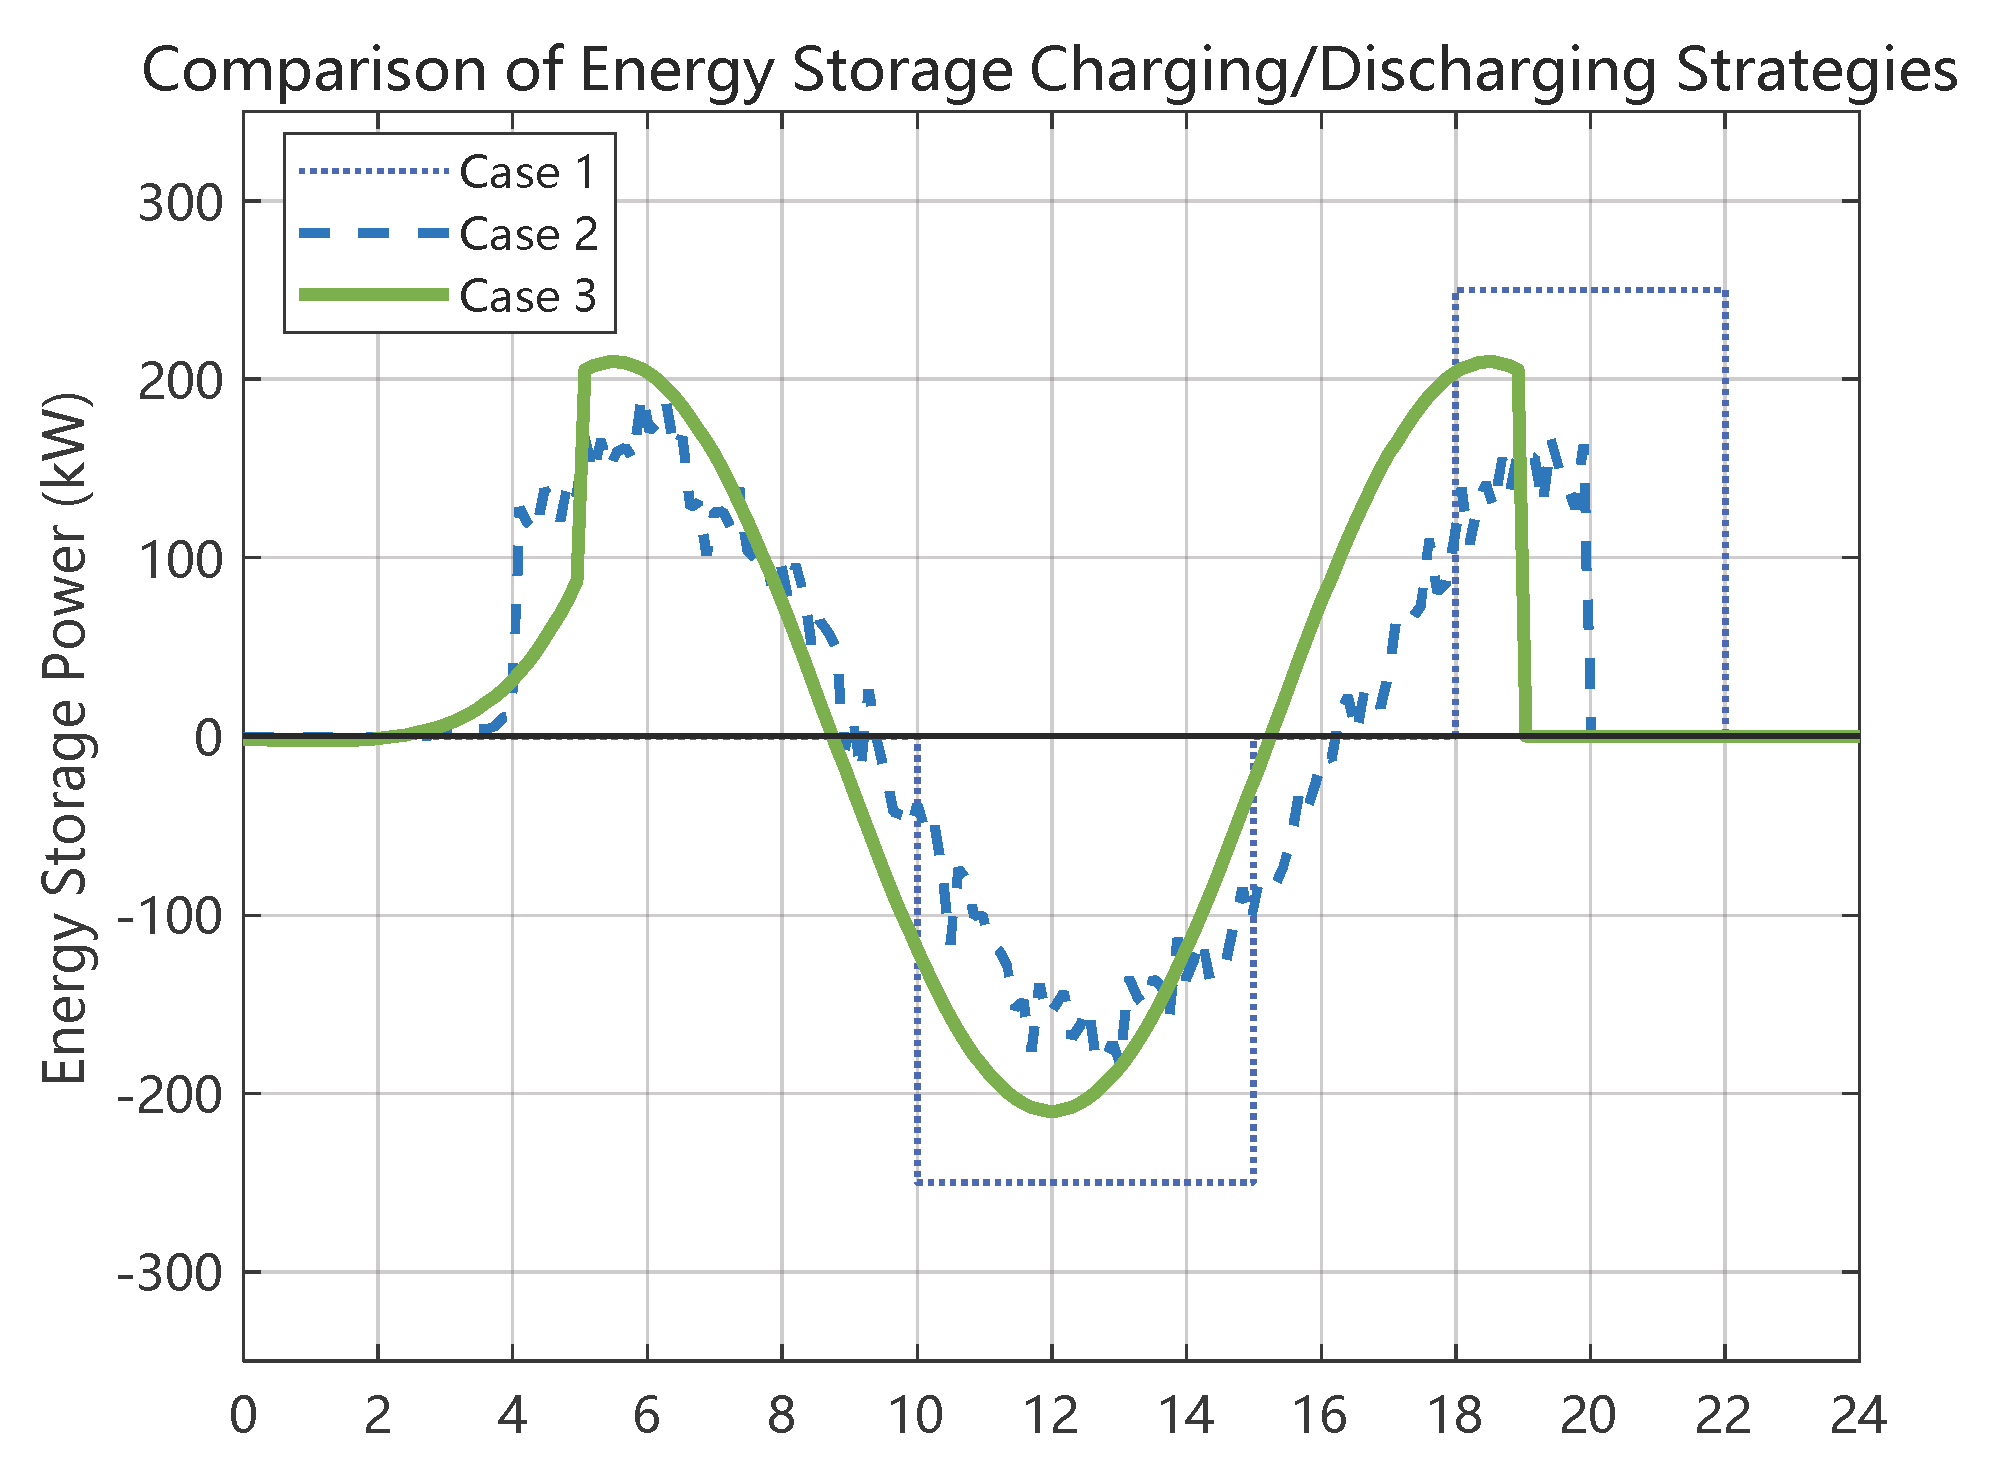
From the
Figure 12, it can be seen that the charging and discharging of ES in case 1 is relatively scattered and volatile and there is a lack of global planning for the charging and discharging time. In order to quickly achieve the peak-shaving goal, the centralized optimization on the cloud side gives priority to the flexible load with larger adjustment capacity, so the overall utilization rate of ES is low. The ES in case 2 only serves the regulation of the region, and the charging and discharging actions are relatively frequent but the regulation scale is small. Each region independently performs peak shaving and valley filling, and there is no global coordination. ES can only respond passively under the local power gap and cannot participate in cross-regional support, so the adjustment potential cannot be fully utilized. The charging and discharging strategy of ES in case 3 is more regular, charging in the low-load period to absorb the surplus new-energy power and discharging in the peak-load period to support the regional electricity demand. The cross-regional coordinated scheduling of ES is realized through the cloud side, and the edge side is flexibly called according to the local control priority, which improves the utilization efficiency of ES and is also conducive to optimizing the operation life of ES.
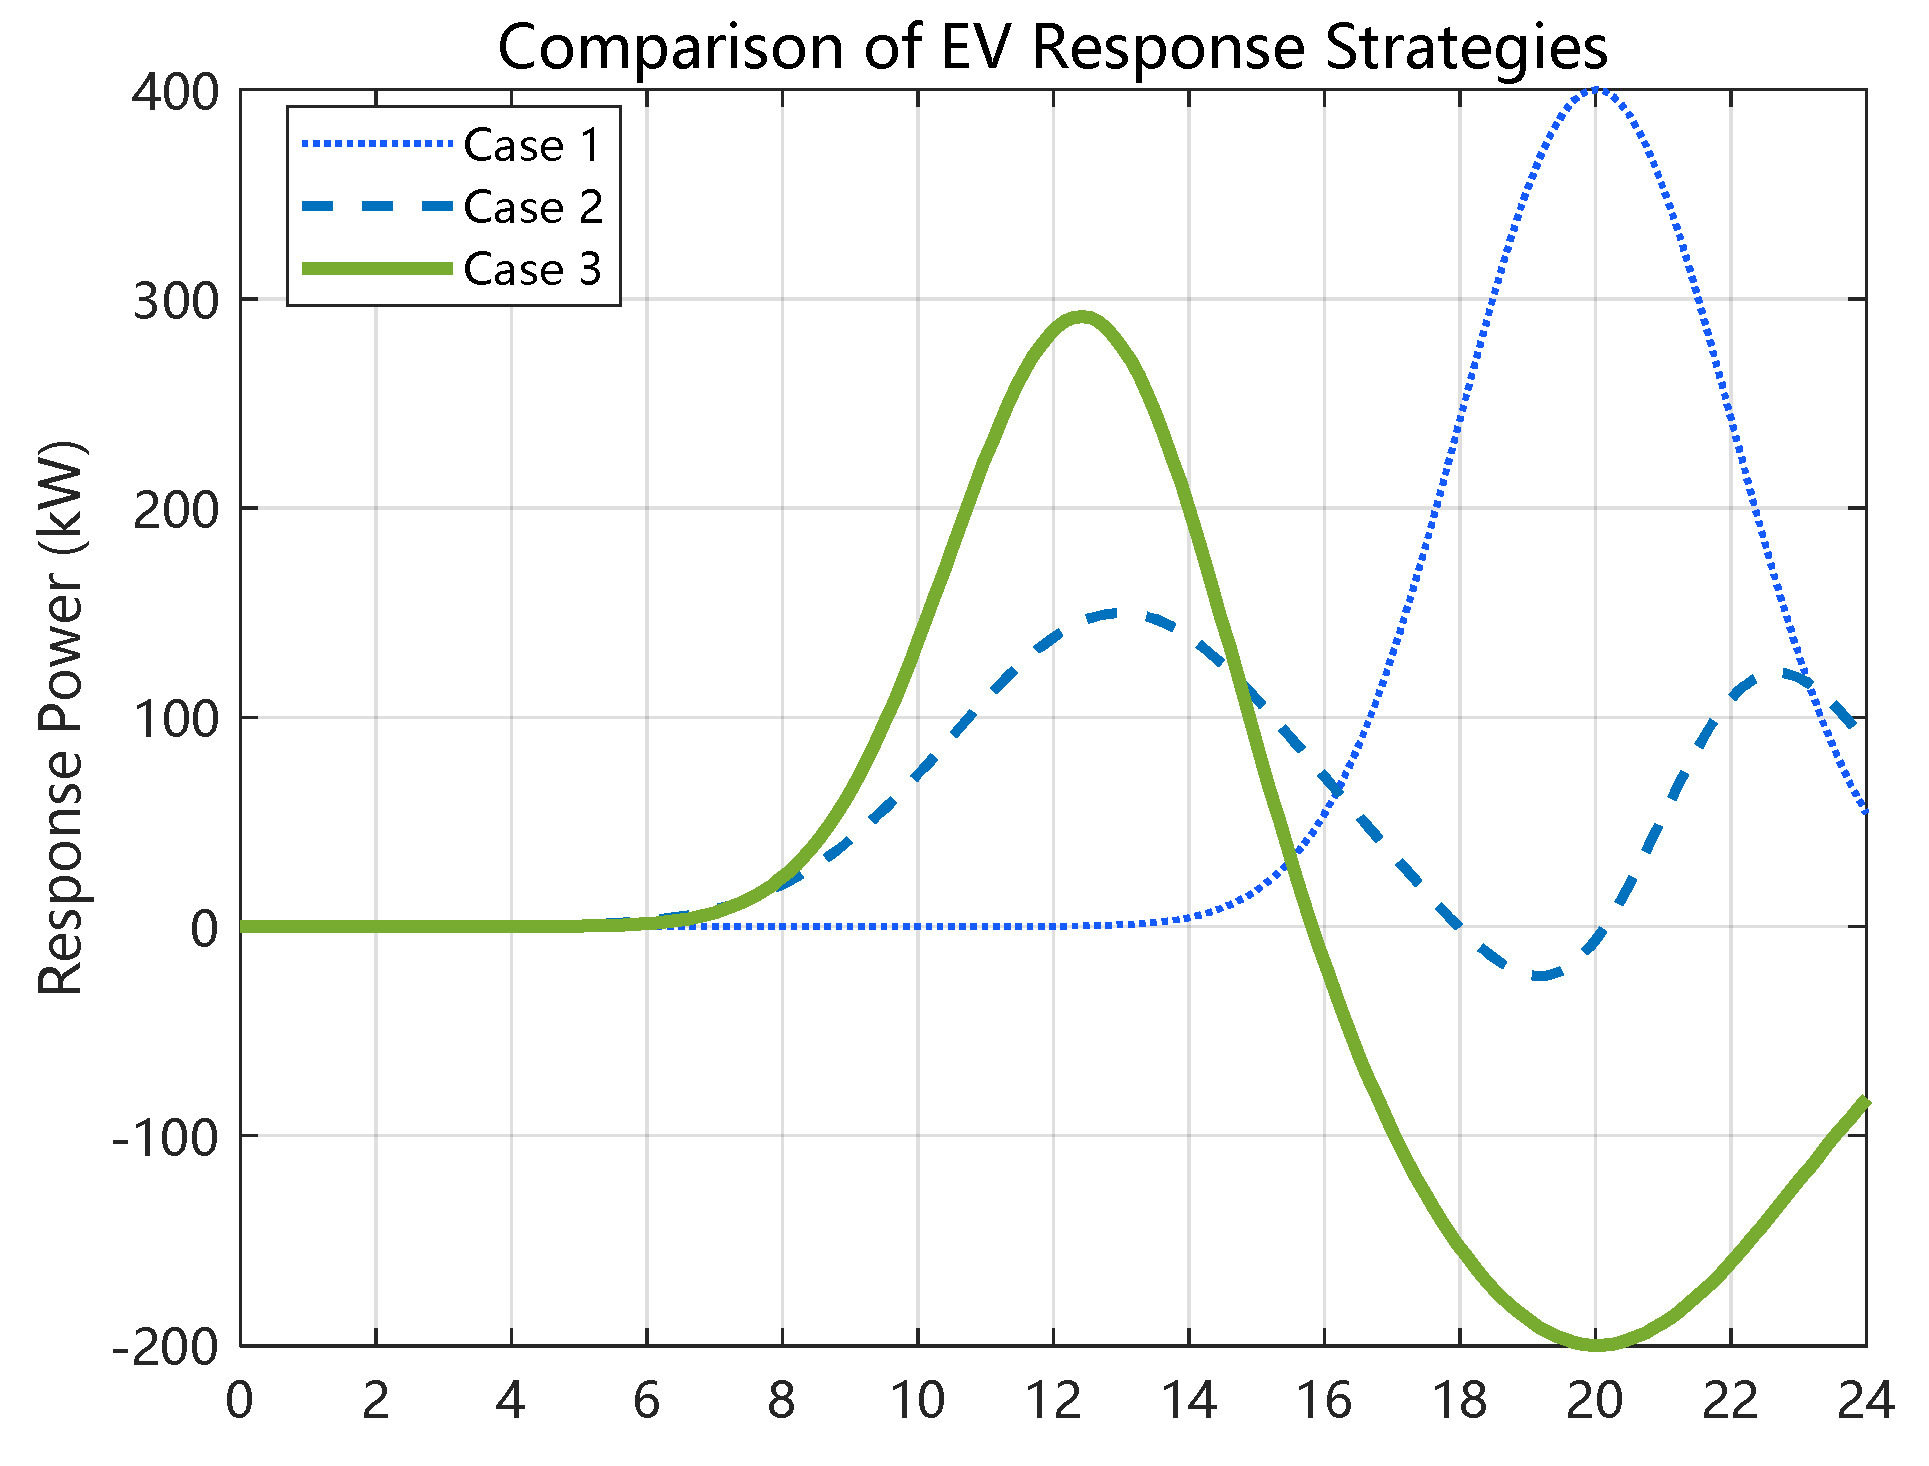
As illustrated in
Figure 13, three cases exhibit distinct EV response power characteristics. For case 1, EV clusters possess the largest single-period regulation power, but response output is fully concentrated on the evening load peak; the EVs maintain near-zero regulation power from 0:00 to 14:00 and hit a peak value of 400 kW at 20:00. This cloud-side centralized strategy prioritizes evening peak shaving and delivers strong short-term peak-clipping capacity, yet it suffers over single temporal scheduling without valley-filling participation, which limits overall peak–valley flattening performance and impairs user charging experience. For case 2, the overall EV response amplitude is the lowest, with a peak power of only 150 kW at 13:00. This mode adopts independent regional regulation lacking global coordination; EVs merely balance local short-term power demand and cannot support cross-regional resource complementation, leaving most regulation potential untapped and yielding weak peak–valley reduction effects. In case 3, EVs maintain moderate response power with optimal time matching and orderly full-cycle participation: they conduct valley charging from 6:00 to 12:00 with a charging peak of 290 kW and switch to peak-clipping discharging during evening rush hours, reaching a discharging power of −200 kW at 20:00 before steady power recovery from 20:00 to 24:00. Benefiting from cloud-layer global planning and priority-based edge-coordinated dispatch, the coordinated operation of EVs and stationary energy storage can effectively smooth the whole-day load peak–valley difference while fully guaranteeing EV users’ charging experience.
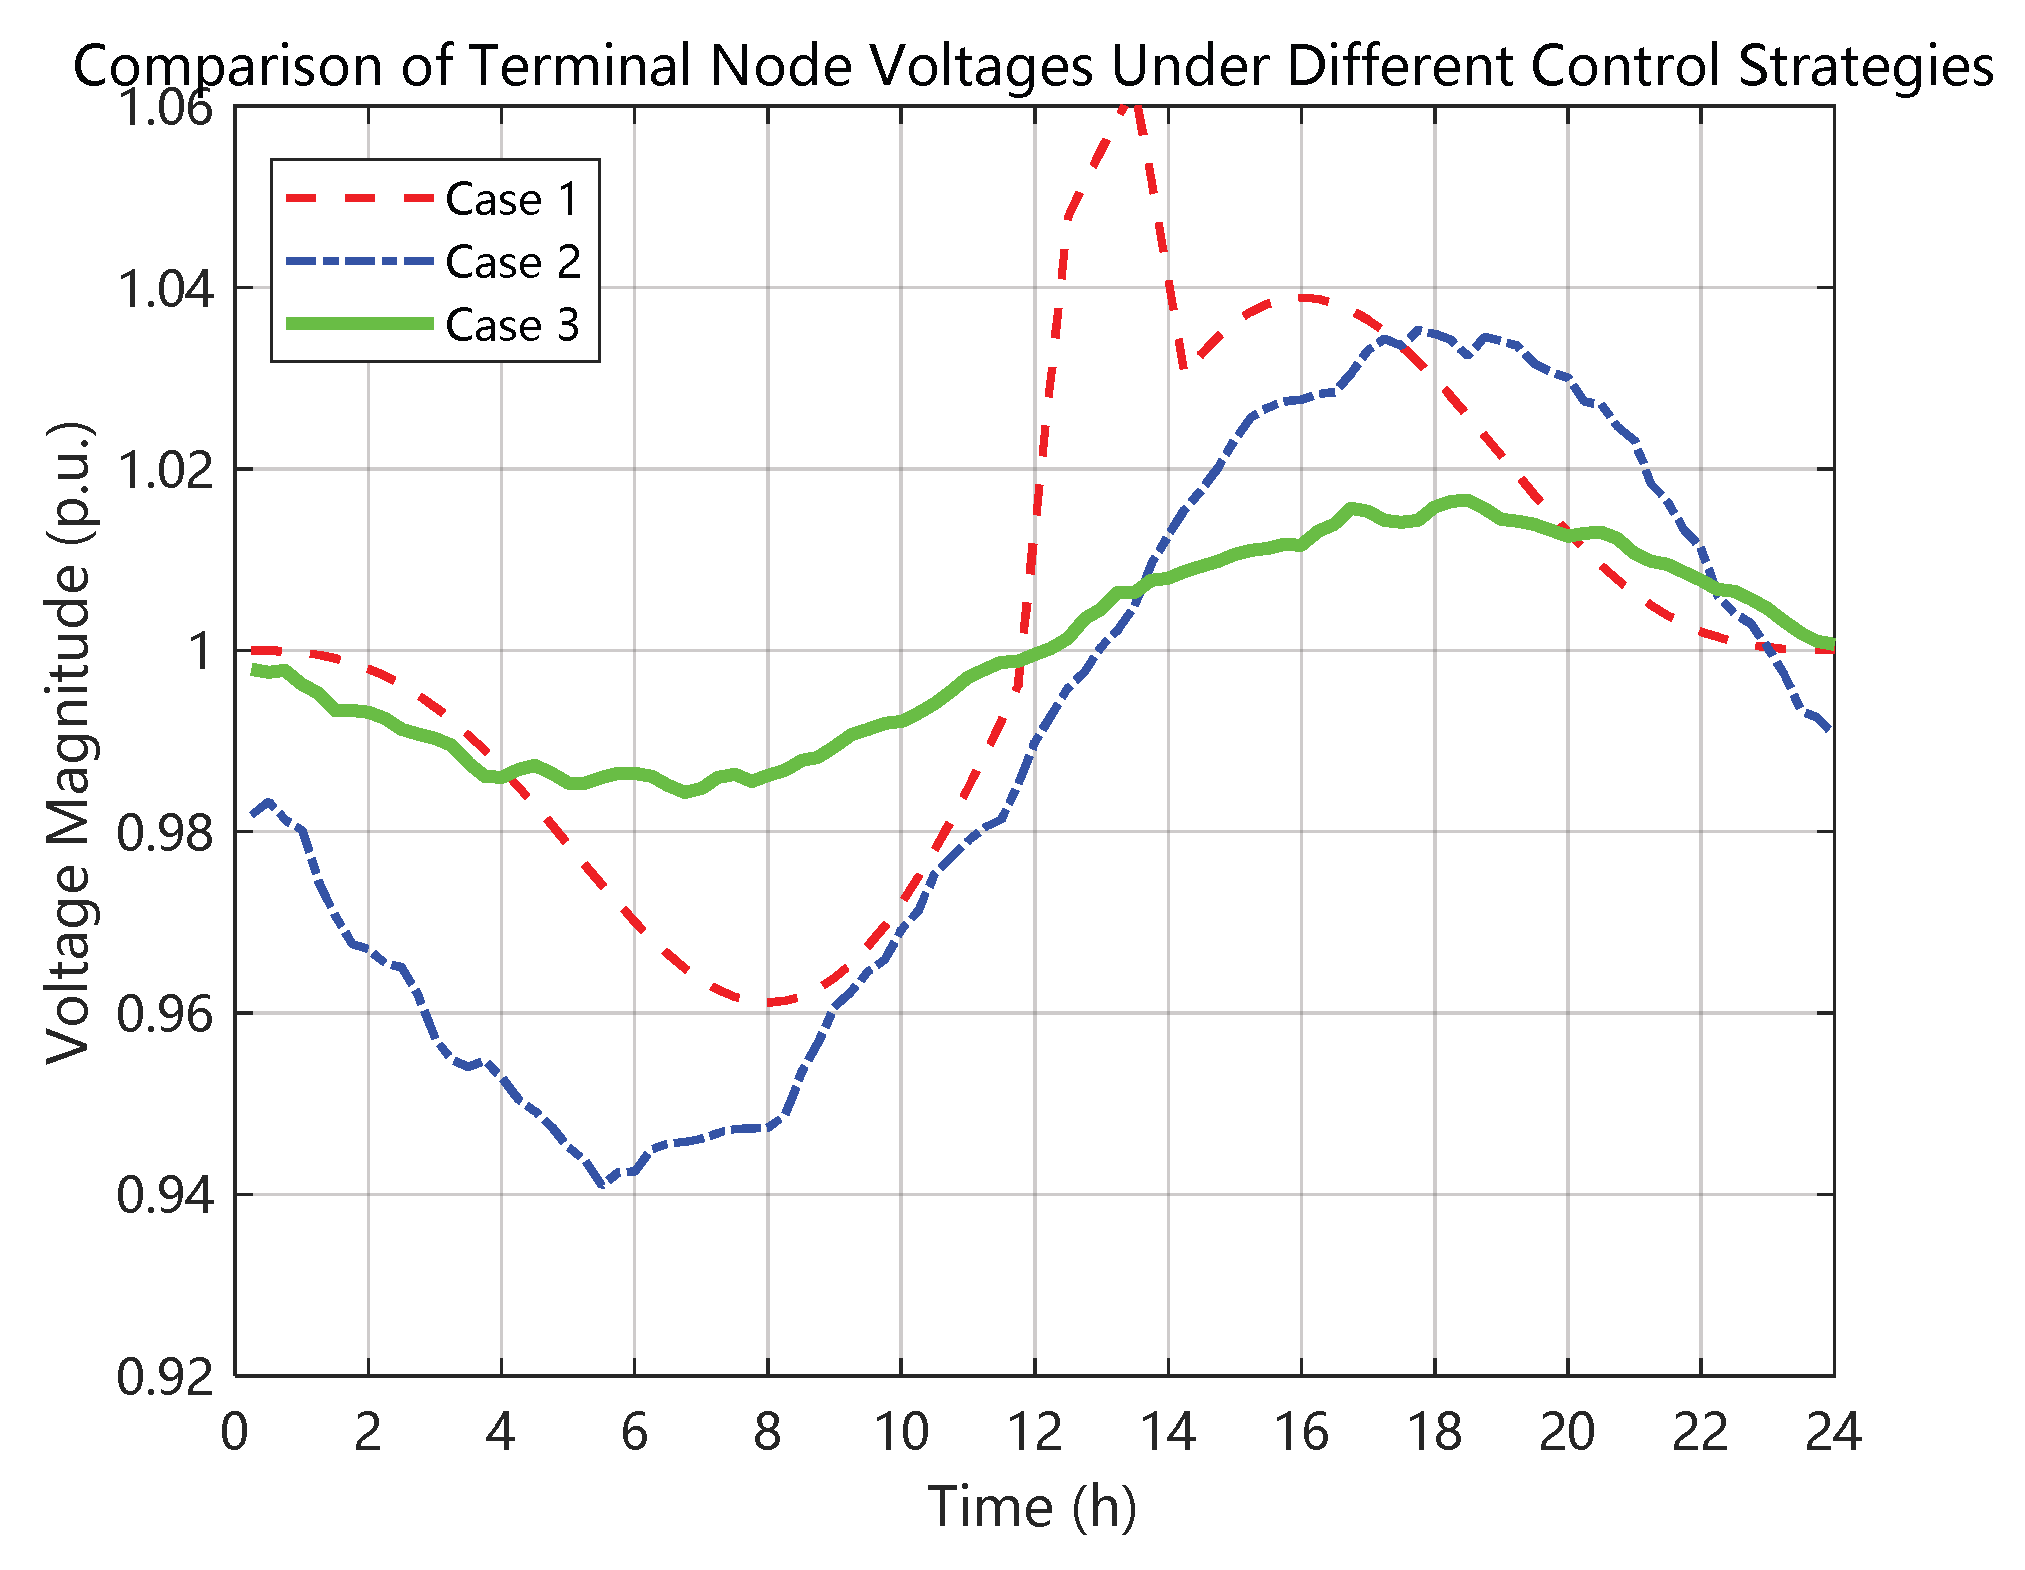
It can be seen from
Figure 14 that the terminal node voltage is maintained within the security constraint interval, and there is no voltage over-limit, which verifies the feasibility of different scheduling schemes. Under the premise of satisfying the voltage hard constraint, there are differences in the degree of voltage offset in different scenarios: the voltage offset amplitude of case 1 is the largest, and there is a significant uplift in the noon period, indicating that the response of the centralized active power dispatch to the local operating state is not fine enough, resulting in relatively significant voltage fluctuations. The voltage offset of case 2 is second, reflecting that the allocation of active resources in the regional autonomy mode is limited by the local capacity and the voltage deviation cannot be suppressed through cross-regional coordination. The voltage deviation of case 3 is the smallest, the curve is the most stable, and the whole process is maintained in the range of 0.98–1.02. This shows that the cloud-side collaborative active power scheduling strategy proposed in this paper can better match the operation characteristics of the distribution network while performing the peak-clipping and valley-filling tasks, effectively reduce the voltage deviation amplitude and improve the stability of voltage operation.
According to the comparison of simulation results under different cases, the core indicators of each scheme are graded and scored: the optimal index is recorded as 3 points, the medium is recorded as 2 points, and the worst is recorded as 1 point. The higher the score, the better the operation effect.
It can be seen from
Table 4 that case 1 has a total score of 8 points, case 2 has a total score of 10 points, and case 3 has a total score of 18 points. The cloud-side collaborative optimization strategy proposed in this paper achieves the highest scores in the seven dimensions of peak-clipping and valley-filling effect, PV consumption level, resource utilization rate, regulation economy, voltage stability, equipment operation life and system response speed, which is better than the comparison scheme.