Article

A Battery Management System Capable of Analyzing Abnormal Cell Trends

by
Chatchai Suddeepong
1,
Suphatchakan Nuchkum
1,
Natthapon Donjaroennon
2 and
Uthen Leeton
2,*
1
School of Mechatronic Engineering, Institute of Engineering, Suranaree University of Technology, Nakhon Ratchasima 30000, Thailand
2
School of Electrical Engineering, Institute of Engineering, Suranaree University of Technology, Nakhon Ratchasima 30000, Thailand
*
Author to whom correspondence should be addressed.
Energies 2026, 19(13), 3062; https://doi.org/10.3390/en19133062
Submission received: 27 April 2026 / Revised: 10 June 2026 / Accepted: 23 June 2026 / Published: 29 June 2026

Abstract

The operational safety and longevity of Lithium-ion Nickel Manganese Cobalt Oxide (NMC) battery packs depend on the early detection of gradual cell degradation rather than reactive fault protection. Conventional Battery Management Systems (BMS) predominantly rely on fixed threshold-based mechanisms, which are insufficient for identifying long-term abnormal trends at the individual cell level preceding failure. This studyproposes an intelligent IoT-based battery monitoring and visualization framework for trend-oriented abnormal behavior analysis in a 72 V, 20 cell NMC battery pack. A JK-BMS performs cell voltage acquisition, while an ESP32-S3 microcontroller operates as an IoT gateway, wirelessly collecting high-resolution cell level data via Bluetooth Low Energy (BLE). The data are transmitted to a Home Assistant platform, which provides centralized time-series visualization and comparative cell analytics. The primary contribution is a heuristic anomaly detection algorithm that evaluates temporal voltage trends of individual cells, with emphasis on instability within the critical operating range of 3.0–3.5 V. Unlike conventional threshold-based approaches, the proposed method detects repeated abnormal patterns over time. A frequency-based alert mechanism categorizes battery health into normal, warning, and critical states based on cumulative anomaly occurrences, enabling progressive degradation assessment. Experimental results demonstrate that the proposed framework effectively identifies early-stage degradation patterns that remain undetected by conventional BMS logic. The system supports predictive maintenance, enhances operational safety, and provides a scalable, cost-effective solution for advanced battery health monitoring in electric mobility and distributed energy storage applications.

1. Introduction

Lithium-ion battery packs used in electric vehicles (EVs), energy storage systems, and Internet of Things (IoT)-enabled applications rely heavily on the health and stability of individual cells. Although modern battery management systems (BMS) provide essential protection mechanisms, gradual degradation occurring within individual cells [1,2,3].
Conventional Battery Management Systems (BMS) primarily rely on fixed-threshold protection mechanisms such as overvoltage, undervoltage, overcurrent, and over temperature protection. While these approaches effectively prevent catastrophic failures, they inherently operate reactively and only respond after predefined safety limits have already been violated [4,5,6,7,8]. often remains undetected until significant imbalance, performance deterioration, or safety risks have already emerged. Degradation in a single cell can progressively propagate throughout the battery pack, resulting in accelerated aging, reduced capacity, increased thermal stress, and, in severe cases, thermal runaway [9,10,11,12,13]. Consequently, subtle indicators of early-stage degradation, including recurring voltage instability, abnormal cell divergence, and gradual changes in cell behavior, frequently remain undetected during normal operation.
While modern battery management systems (BMS) provide essential protection mechanisms, gradual degradation occurring within individual cells often remains undetected until significant imbalance or safety risks emerge. Recent research has focused on advanced machine-learning-based prognostic techniques for electric vehicle (EV) applications and battery energy storage systems (BESS) [14,15,16,17,18]. However, these high-overhead approaches often demand substantial computational resources, cloud infrastructures, or complex online parameter identification algorithms, making them difficult to deploy on low cost edge nodes [19,20,21].
Rather than proposing a completely novel analytical theory, this study builds upon existing internet-of-things (IoT) architectures to introduce a low-overhead, trend-oriented degradation-screening framework. To support long-term monitoring and analysis, the proposed framework integrates a JK-BMS measurement interface, an ESP32-S3 Bluetooth Low Energy (BLE) gateway [22,23,24,25,26,27], and a Home Assistant–based monitoring platform for data acquisition, storage, visualization, and analytical processing [28,29,30,31,32,33]. This architecture enables practical deployment on low-cost embedded hardware while preserving compatibility with existing BMS protection mechanisms [34,35,36,37,38,39].
The proposed framework fills a practical deployment gap by utilizing computationally inexpensive edge analytics to monitor individual cell voltage behaviors within the thermodynamically sensitive operating region (3.0 V–3.5 V), where subtle cell to cell variations are highly pronounced [40,41,42,43,44].
As illustrated in Figure 1, the proposed framework manages a battery pack consisting of twenty series-connected (20S) 18650 NMC cells. To reduce electrochemical stress and improve battery lifespan, the charging process is intentionally constrained to a maximum charging voltage of approximately 4.10 V per cell rather than operating continuously at the absolute maximum charging limit. During operation, the monitoring framework continuously evaluates cell voltage behavior within critical operating regions. When cell voltage approaches nonlinear operating conditions, the proposed system performs long-term trend observation and anomaly accumulation analysis to enable early stage degradation screening [45,46,47,48,49].
The main contributions of this study are summarized as follows:
A lightweight trend-oriented degradation-screening framework capable of identifying recurring abnormal battery behavior before conventional BMS protection thresholds are triggered.
A frequency-based anomaly accumulation strategy for evaluating degradation severity using temporal voltage behavior and inter-cell divergence.
An edge-deployable monitoring architecture integrating anomaly screening, visualization, and charging-voltage optimization without requiring machine learning models or cloud computation [50,51,52,53,54].
The remainder of this paper is organized as follows. Section 2 presents the system architecture. Section 3 describes the proposed anomaly-screening methodology and data acquisition process. Section 4 presents the experimental results and evaluation. Finally, Section 5 concludes the paper.
As illustrated in Figure 1, the proposed framework is designed for monitoring a battery pack consisting of twenty series-connected (20S) 18650 NMC cells [55,56,57,58,59]. To reduce electrochemical stress and extend battery lifespan, the charging process is intentionally constrained to a maximum charging voltage of 4.10 V per cell rather than continuously operating at the upper charging limit [60,61,62,63,64,65]. During operation, the battery pack undergoes repeated charge and discharge cycles while the monitoring framework continuously evaluates cell voltage behavior. As the average cell voltage approaches the nonlinear operating region (approximately 3.5 V), the proposed system performs continuous trend observation and anomaly accumulation analysis within this critical operating range, enabling long-term monitoring and early-stage degradation screening as shown in Figure 1.

2. System Architecture and Hardware Implementation

2.1. Overall System Architecture

To enable continuous and trend-oriented monitoring of battery degradation at the individual cell level, an Internet of Things (IoT)-based system architecture was designed and implemented for a 72 V battery pack composed of twenty NMC 18650 lithium-ion cells. The proposed system aims to enhance the functionality of conventional Battery Management Systems (BMS) by integrating Realtime sensing, embedded processing, wireless communication, and data visualization capabilities within a unified monitoring framework.
Unlike traditional BMS implementations that primarily focus on safety protection mechanisms such as overvoltage, undervoltage, overcurrent, and temperature protection the architecture proposed in this research extends the monitoring capability toward long term operational analysis and early anomaly detection. By continuously collecting cell level voltage data and transmitting it to a cloud-based monitoring platform, the system enables researchers and system operators to observe behavioral trends in battery performance, which may indicate degradation patterns or abnormal operating conditions.
The overall system architecture is organized into a four-layer hierarchical structure that separates the functions of sensing, processing, communication, and data analysis. This layered approach allows the system to maintain modularity, scalability, andflexibility, which are important for both experimental research environments and real world energy storage applications.
Based on the system description, a Data Flow Diagram (DFD) is constructed to illustrate the data communication process between the JK-BMS and the ESP32-S3 gateway. The diagram clearly depicts the end-to-end data transmission pathway, from battery data acquisition to final visualization on the Home Assistant dashboard, including data processing and communication stages.
As illustrated in Figure 2, the proposed system adopts layered architecture.
Illustrates the overall system architecture, which consists of four functional layers.
(1)
The battery and sensing layer;
(2)
The embedded processing layer;
(3)
The IoT communication layer;
(4)
The visualization and analytics layer;
(5)
The Architectural Rationale for Trend-Oriented Monitoring.
This hierarchical organization ensures modularity, scalability, and clear separation between measurement, control, communication, and high-level data interpretation.
1. Battery and Sensing Layer
The battery and sensing layer represents the physical energy storage subsystem and the associated measurement circuitry. In this research, the battery pack consists of twenty 18650 NMC lithium-ion cells connected in series, producing a nominal voltage of approximately 72 V. Each cell is individually monitored to ensure accurate measurement of cell level voltage variations.
Voltage sensing circuits are connected to each cell through dedicated measurement channels. These sensing circuits are responsible for acquiring real time voltage data while maintaining electrical isolation and minimizing noise measurement.
Accurate cell level monitoring is essential because small voltage differences between cells may indicate imbalanced charging conditions, capacity degradation, or potential safety risks.
The sensing board is designed to interface directly with the battery pack and the Battery Management System (BMS). The collected voltage signals are then transmitted to the embedded processing unit for further analysis and control.
2. Embedded Processing Layer
The embedded processing layer serves as the core control unit, enabling real time data acquisition, edge-level processing, and low-latency decision-making. By performing preliminary filtering, validation, and threshold monitoring locally, the system minimizes communication overhead while ensuring rapid response to abnormal operating conditions.
In this study, a microcontroller-based platform (ESP32) is used as the primary embedded processor. The embedded system performs several key tasks, including.
-
Collecting voltage measurements from each battery cell;
-
Performing basic filtering and data validation;
-
Monitoring threshold conditions such as overvoltage and undervoltage;
-
Controlling relays or switching devices when necessary;
-
Preparing data packets for transmission to the IoT network.
By implementing these functions locally at the embedded layer, the system reduces communication overhead and enables real time decision-making for safety protection and operational control.
3. IoT Communication Layer
The IoT communication layer enables the system to transmit monitoring data from the embedded processor to external servers or cloud-based platforms. This layer plays a critical role in enabling remote monitoring and long-term data collection.
In the proposed architecture, MQTT over Wi-Fi is employed to transmit time-series voltage data from the embedded processor to the monitoring server. The system operates with a configurable sampling interval (1–5 s), enabling high-resolution observation of transient voltage behavior and short-term instability.
The utilization of low-cost microcontrollers paired with lightweight messaging protocols like MQTT significantly minimizes data transmission latency and overhead inlocalized energy networks.
This connectivity allows the battery monitoring system to support.
-
Remote supervision of battery conditions;
-
Continuous logging of operational data;
-
Early detection of abnormal battery behavior;
-
Integration with broader energy management systems.
Furthermore, the use of IoT technology enables the system to be easily expanded to support large-scale battery installations or distributed energy storage systems.
4. Visualization and Analytics Layer
The visualization layer transforms raw measurement data into actionable insights by enabling trend analysis, anomaly frequency tracking, and cell-to-cell deviation comparison, thereby supporting informed decision-making for battery health management.
The visualization layer is implemented using the Home Assistant platform deployed on a Raspberry Pi 4 server. This layer functions as.
-
A centralized time-series data repository;
-
A dashboard-based visualization interface;
-
A rule based alert management system;
-
A comparative cell-to-cell analysis environment.
Unlike conventional monitoring systems that only display instantaneous values, the proposed dashboard emphasizes historical trend visualization, anomaly frequency tracking, and comparative deviation analysis among cells.
Through this layered architecture, the system transforms raw cell voltage measurements into interpretable degradation indicators, bridging the gap between protective BMS logic and predictive maintenance-oriented analytics.
This architectural separation enables early-stage degradation detection without interfering with the native protective functions of the BMS. As a result, the system remains fully compatible with existing hardware while significantly extending its capability toward predictive and condition-based maintenance.
5. Architectural Rationale for Trend–Oriented Monitoring
The architectural design directly supports the proposed heuristic anomaly detection strategy described in Section 3. By continuously streaming high-resolution cell level voltage data to a centralized analytics environment, the system enables:
-
Identification of repeated abnormal voltage fluctuations;
-
Detection of instability within the critical 3.0–3.5 V operating region;
-
Monitoring of long-term divergence between cells;
-
Frequency-based degradation severity classification.
This separation between measurement, communication, and analytics layers ensures that early-stage degradation can be identified without modifying the protective logic of the original BMS. Consequently, the system remains backward compatible with existing hardware while extending its diagnostic capability toward predictive maintenance applications as shown in Table 1.

2.2. Hardware Implementation and PCB Design

2.2.1. PCB Design Objectives

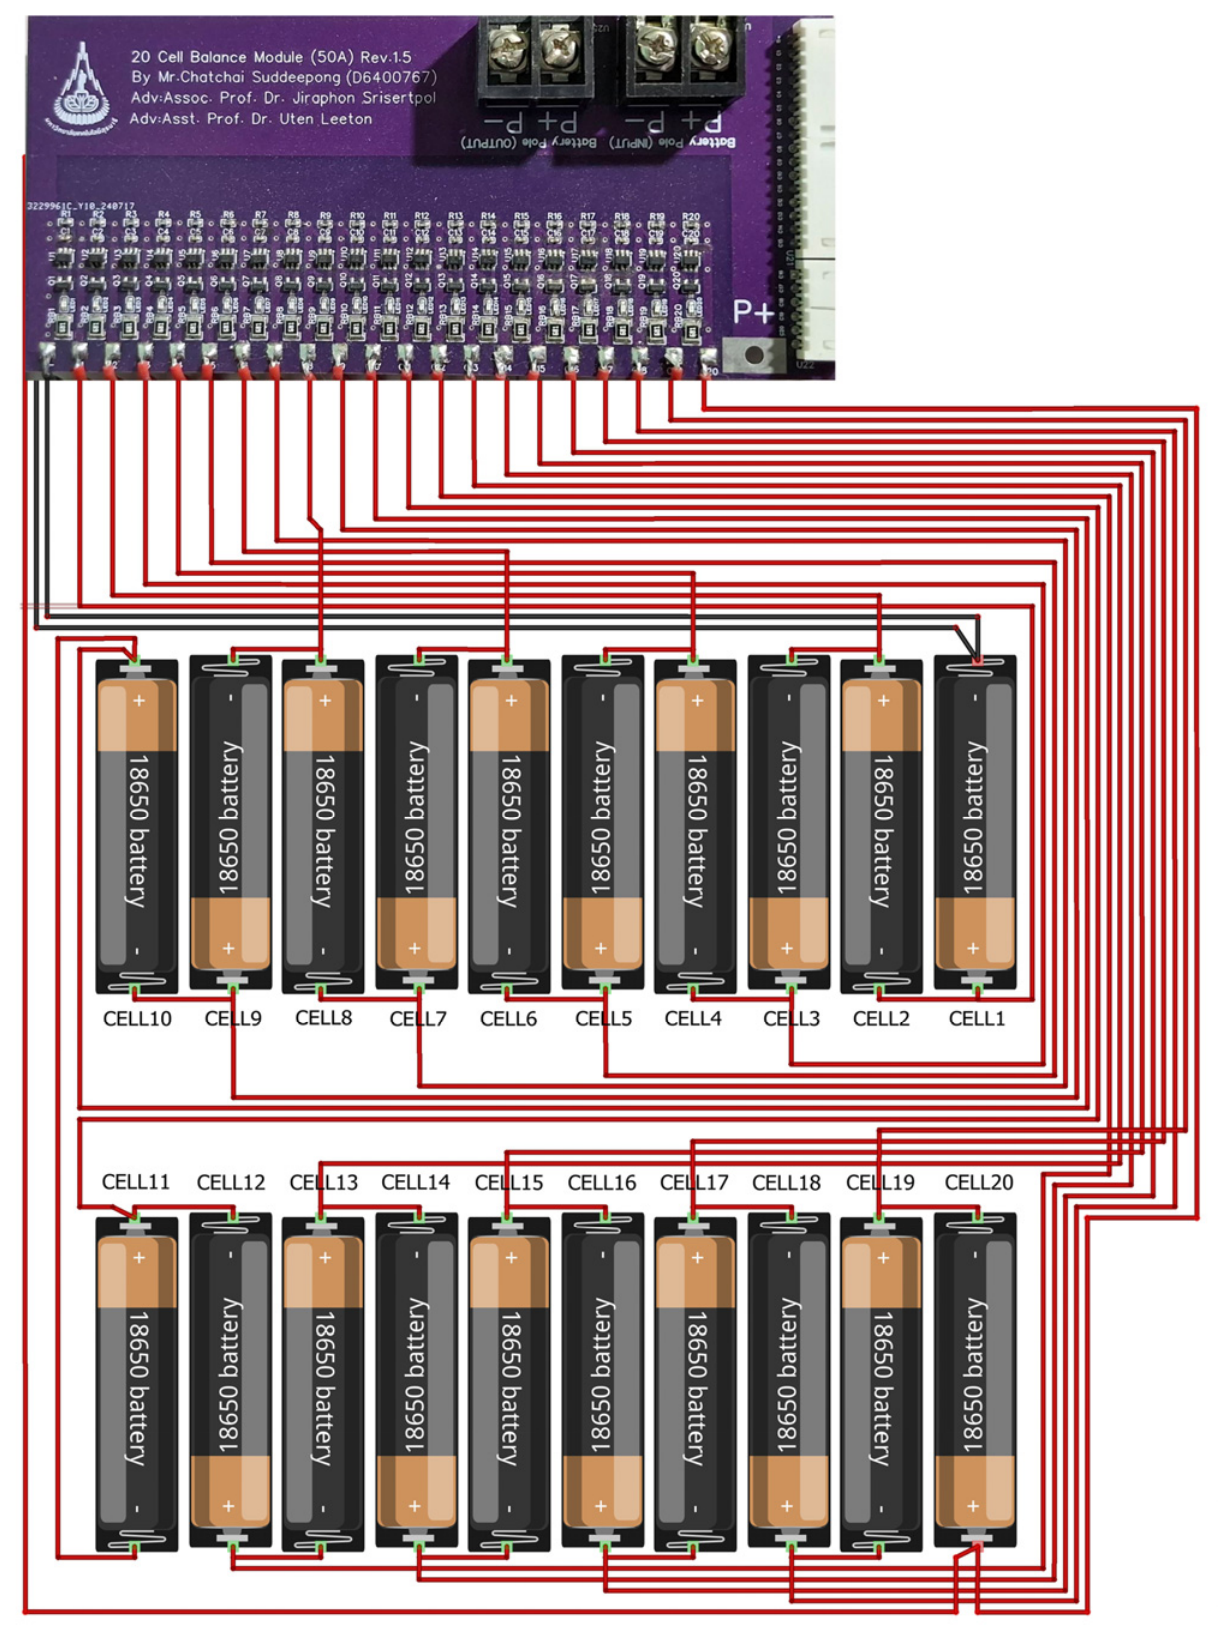
The hardware platform of the proposed monitoring system was implemented using a custom-designed printed circuit board (PCB). The PCB integrates ESP32-based embedded modules, power regulation circuits, communication interfaces, and peripheral connections into a compact and reliable platform suitable for experimental and long-term operation.
The primary objective of the PCB design was to ensure stable and continuous system performance for IoT-based battery monitoring. The design was guided by the following key objectives:
-
To provide stable and regulated power distribution for ESP32 microcontrollers and peripheral components;
-
To ensure reliable communication between the IoT gateway, control modules, and external monitoring systems;
-
To minimize electrical noise and signal interference in mixed analog–digital environments;
-
To simplify system integration and facilitate long-term experimental deployment.
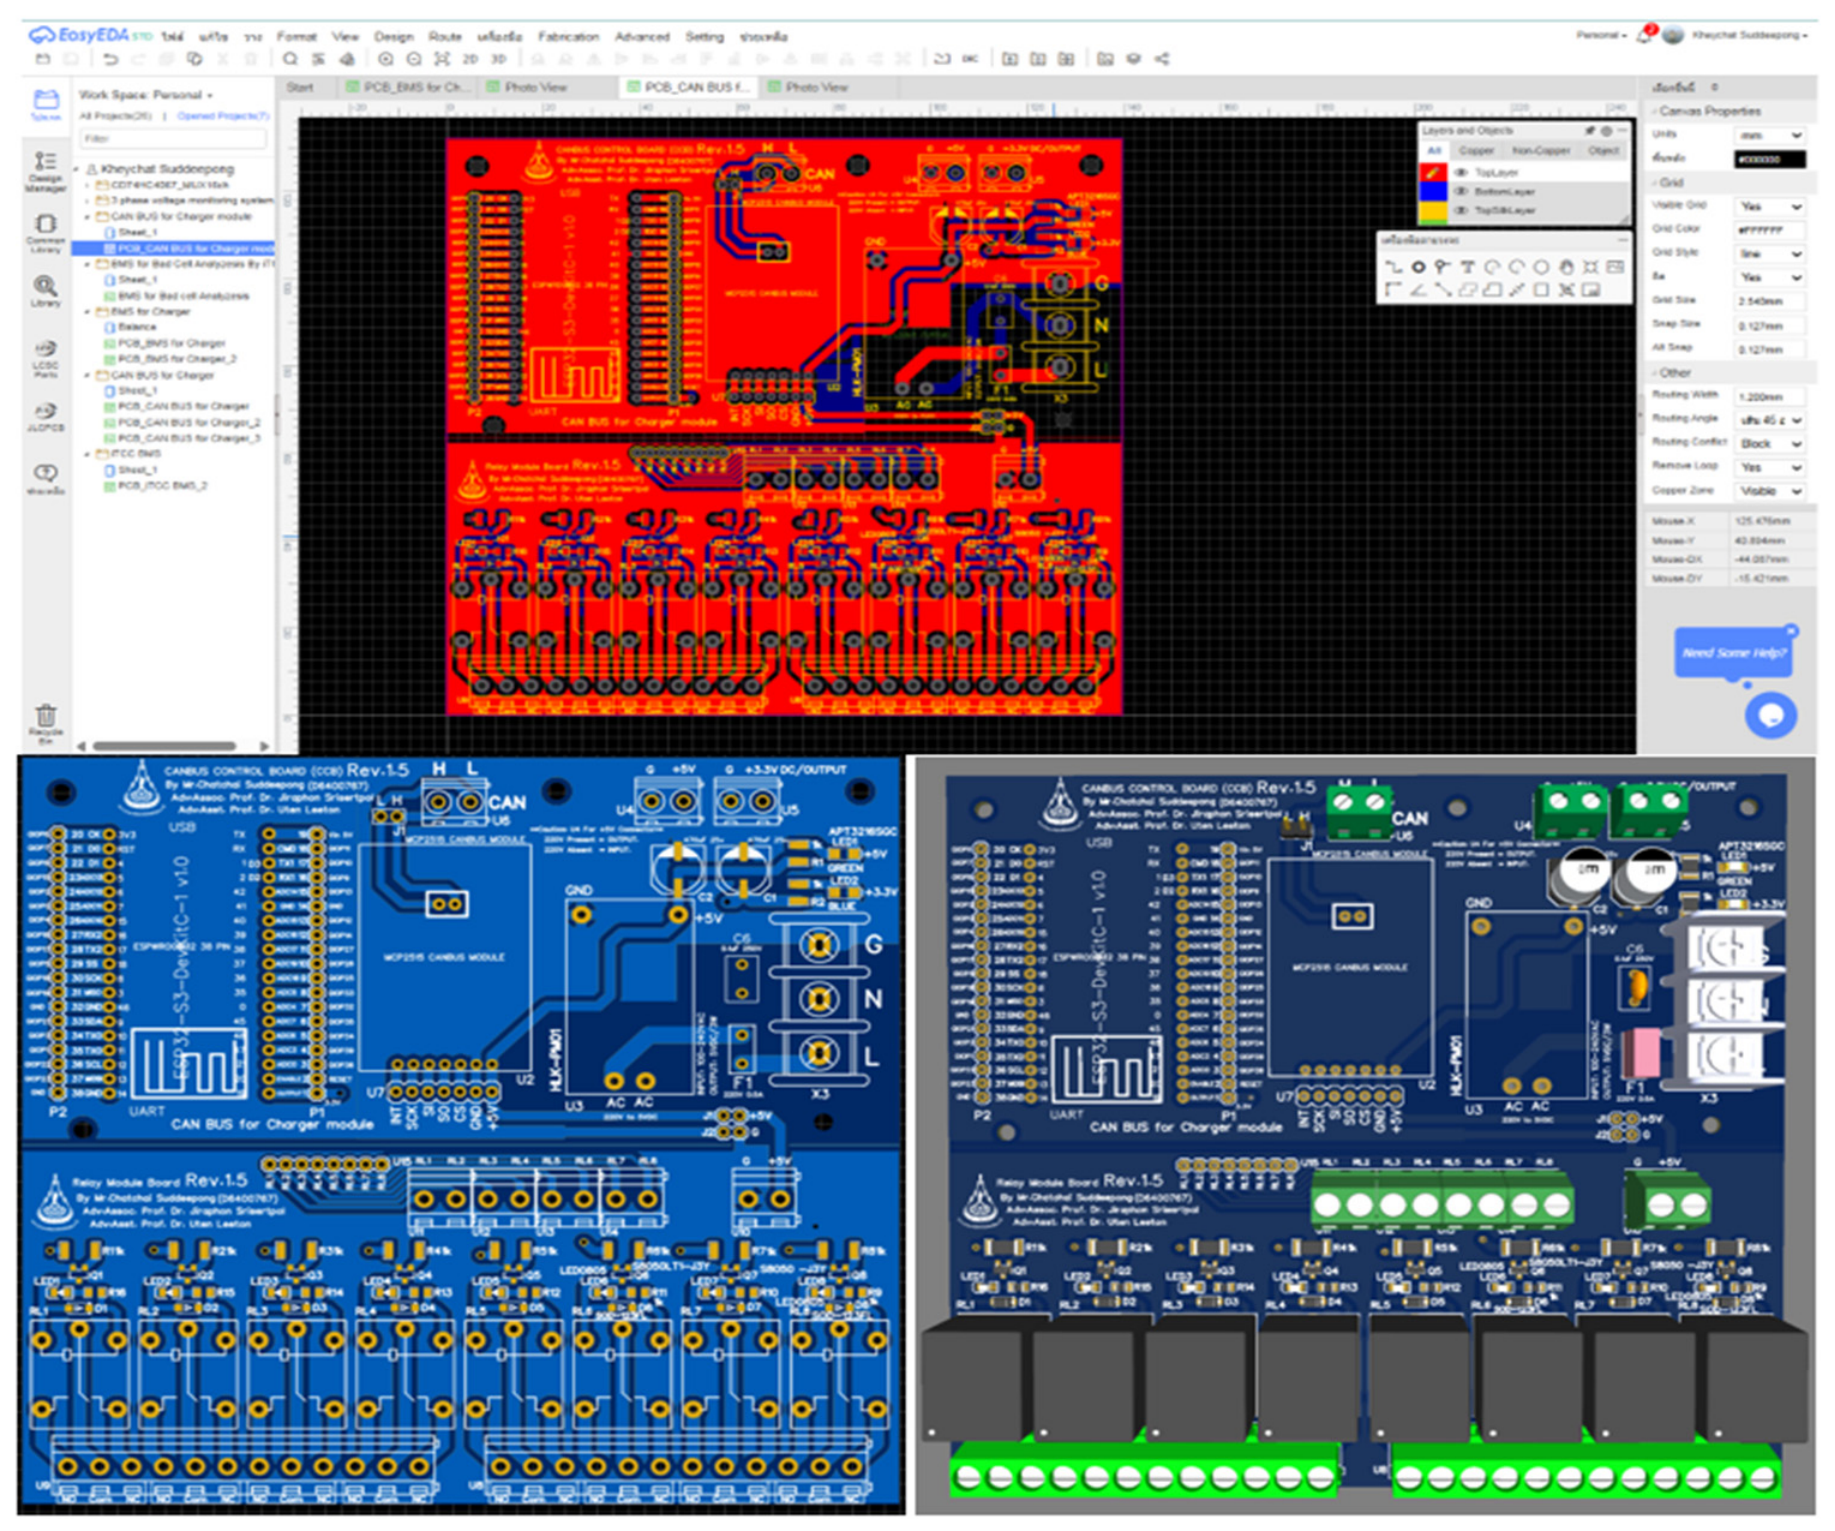
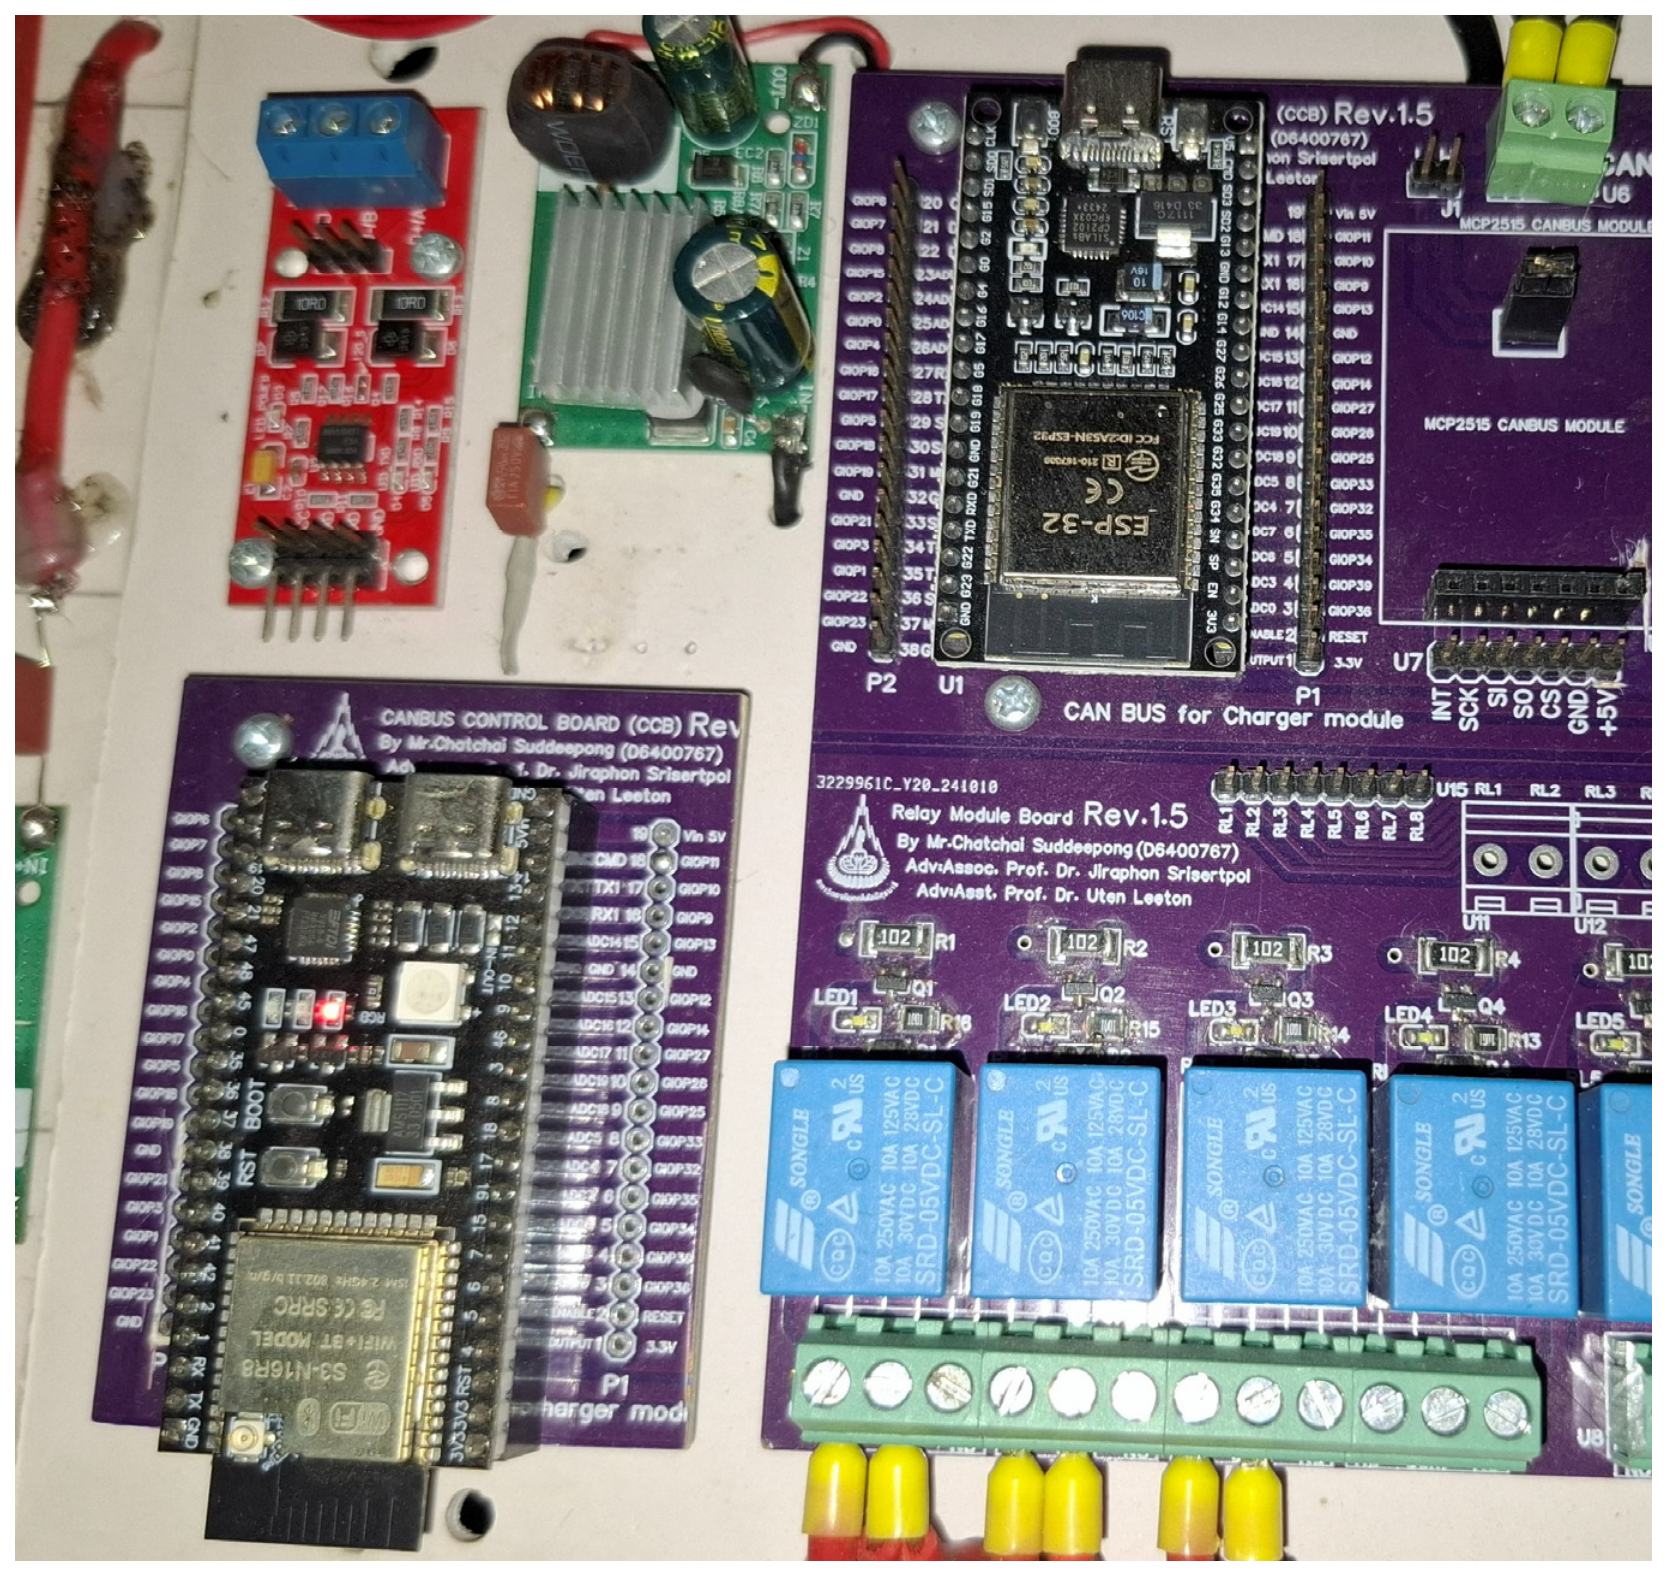
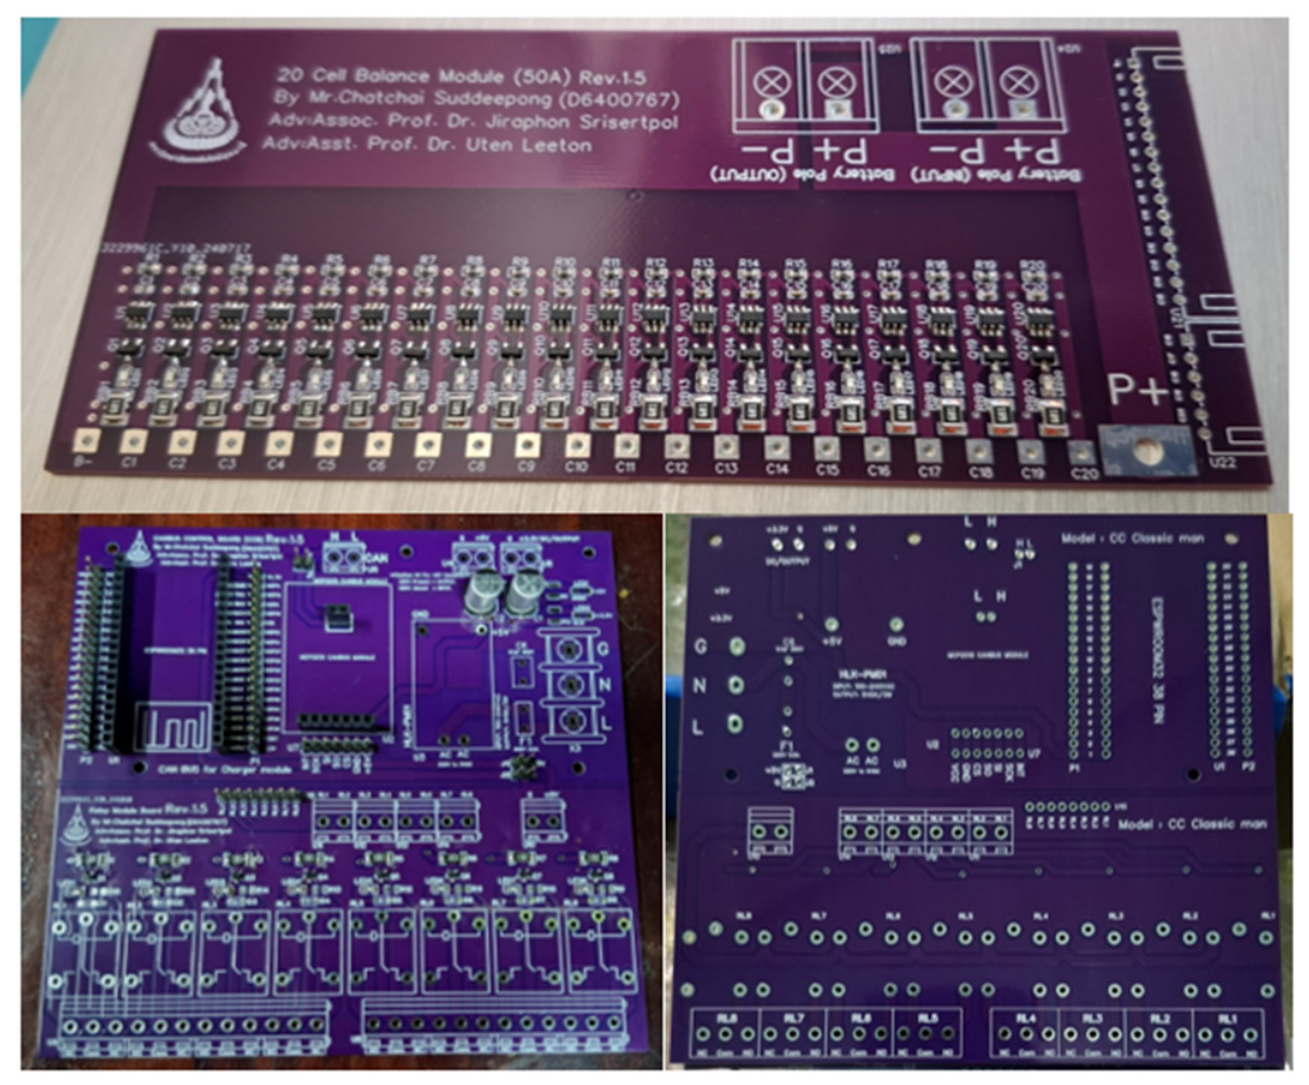
To meet these objectives, a modular PCB architecture was adopted, in which communication, control, and power management subsystems are physically separated into dedicated functional regions. This structural organization reduces signal interference, improves maintainability, and enables efficient fault isolation. As a result, the overall system reliability and scalability are significantly enhanced as shown in Figure 3.

2.2.2. Power Supply and Protection Circuit

The PCB incorporates a dedicated power regulation stage to convert the battery pack voltage into stable low-voltage supply rails required by the embedded electronics.
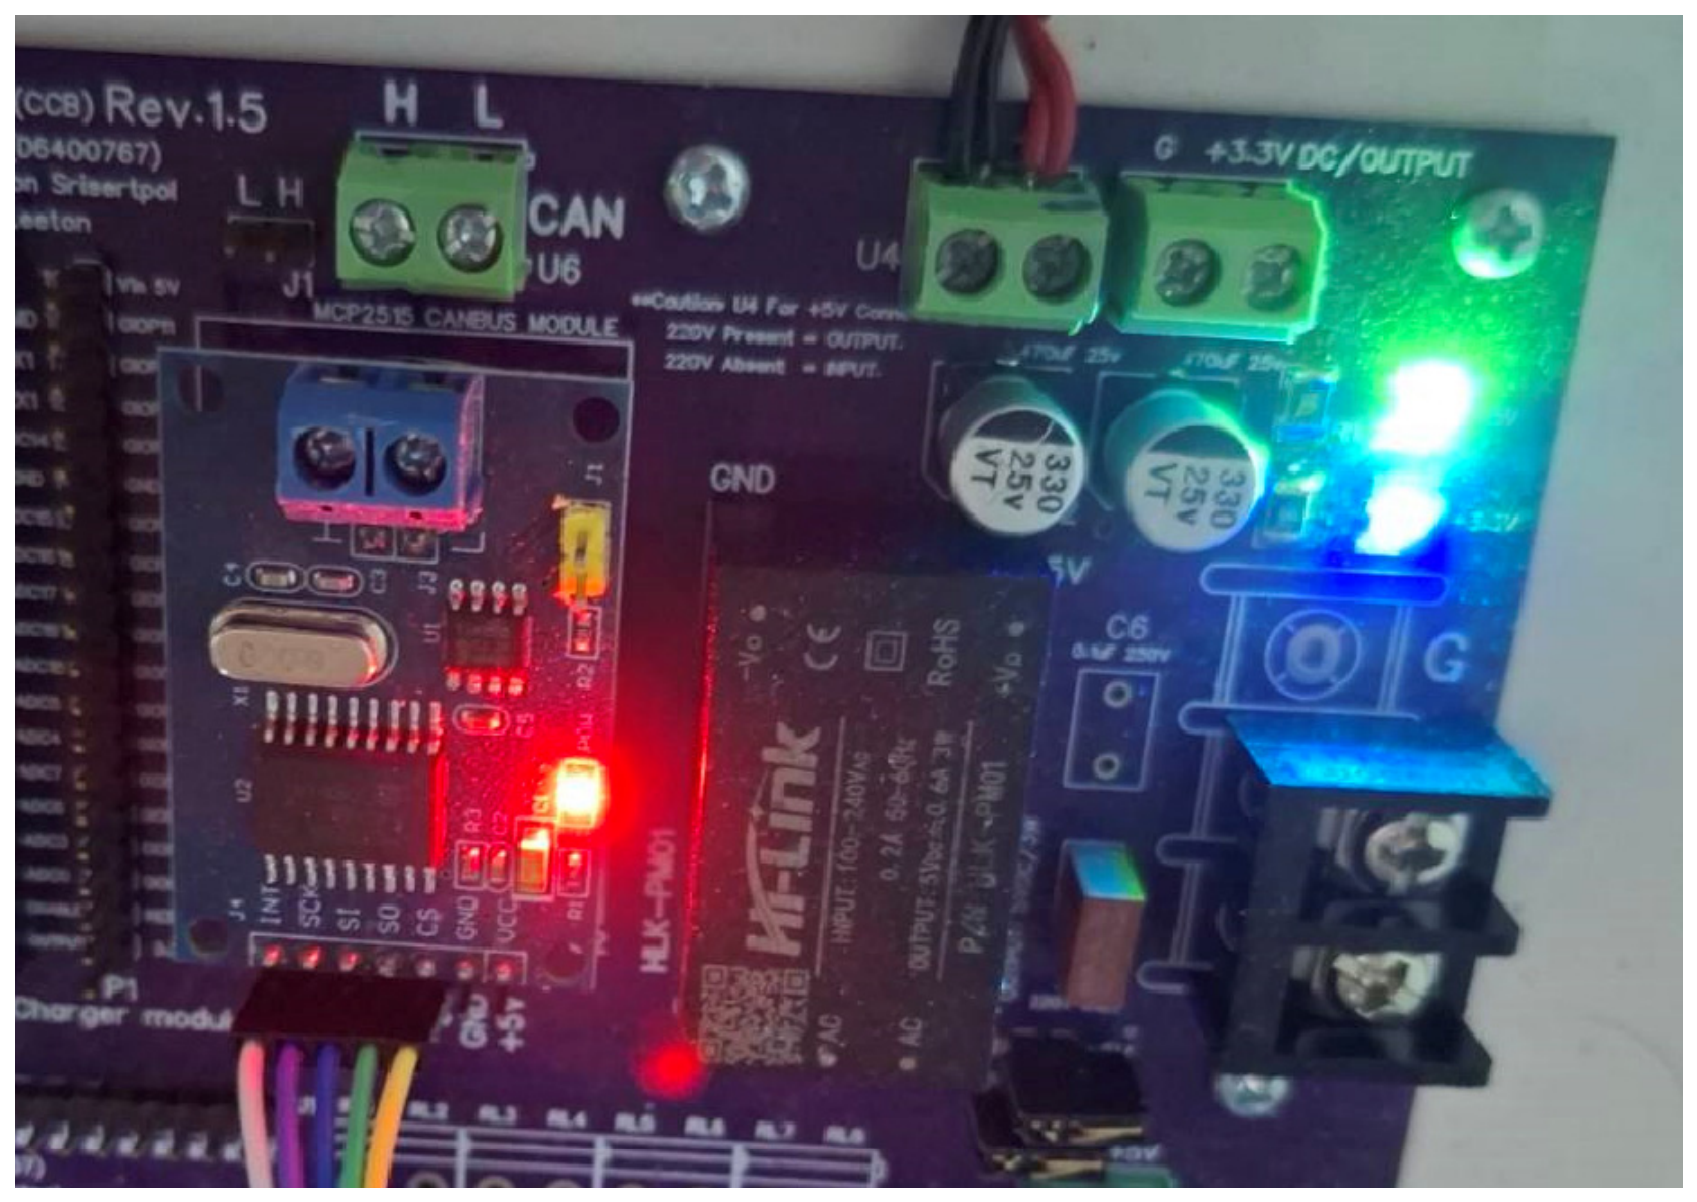
A high-efficiency DC–DC buck converter is used to step down the battery voltage to 5 V, which is further regulated to 3.3 V for the ESP32 modules and associated logic circuits. Additional filtering capacitors and transient suppression components were incorporated to mitigate voltage fluctuations and electromagnetic interference.
Furthermore, additional protection mechanisms were incorporated to enhance operational safety and hardware reliability. These protection elements include.
-
Reverse polarity protection to prevent damage caused by incorrect battery connections;
-
Fuse protection to safeguard the system from excessive current conditions;
-
Transient voltage suppression components to mitigate voltage spikes and electromagnetic interference.
Protection elements such as reverse polarity protection, fuse protection, and transient voltage suppression were also included to ensure safe operation during battery charge and discharge cycles.
The power conversion efficiency was approximately 96%, ensuring minimal energy loss during operation. as shown in Figure 4.

2.2.3. Embedded Module Integration

The proposed hardware platform integrates two independent ESP32-based embedded modules, each responsible for different functional tasks within the monitoring architecture:
-
ESP32-S3 IoT Gateway Module, responsible for BLE data acquisition and MQTT communication;
-
ESP32 Control Module, responsible for charge–discharge supervision and hardware control.
Both modules are connected through dedicated communication interfaces and share a common power supply domain while maintaining logical separation of tasks.
External interfaces provided on the PCB include:
-
Relay or MOSFET driver outputs for load or charging control;
-
UART debugging interface for firmware development and diagnostics;
-
Power input connectors for system power distribution;
-
Peripheral expansion headers for future sensing or control modules.
This hardware configuration allows flexible system expansion for future sensing or control functions.
The system incorporates dual ESP32 modules, consisting of an ESP32-S3 gateway for BLE data acquisition and MQTT communication, and an ESP32 control module for charge–discharge supervision and hardware control.
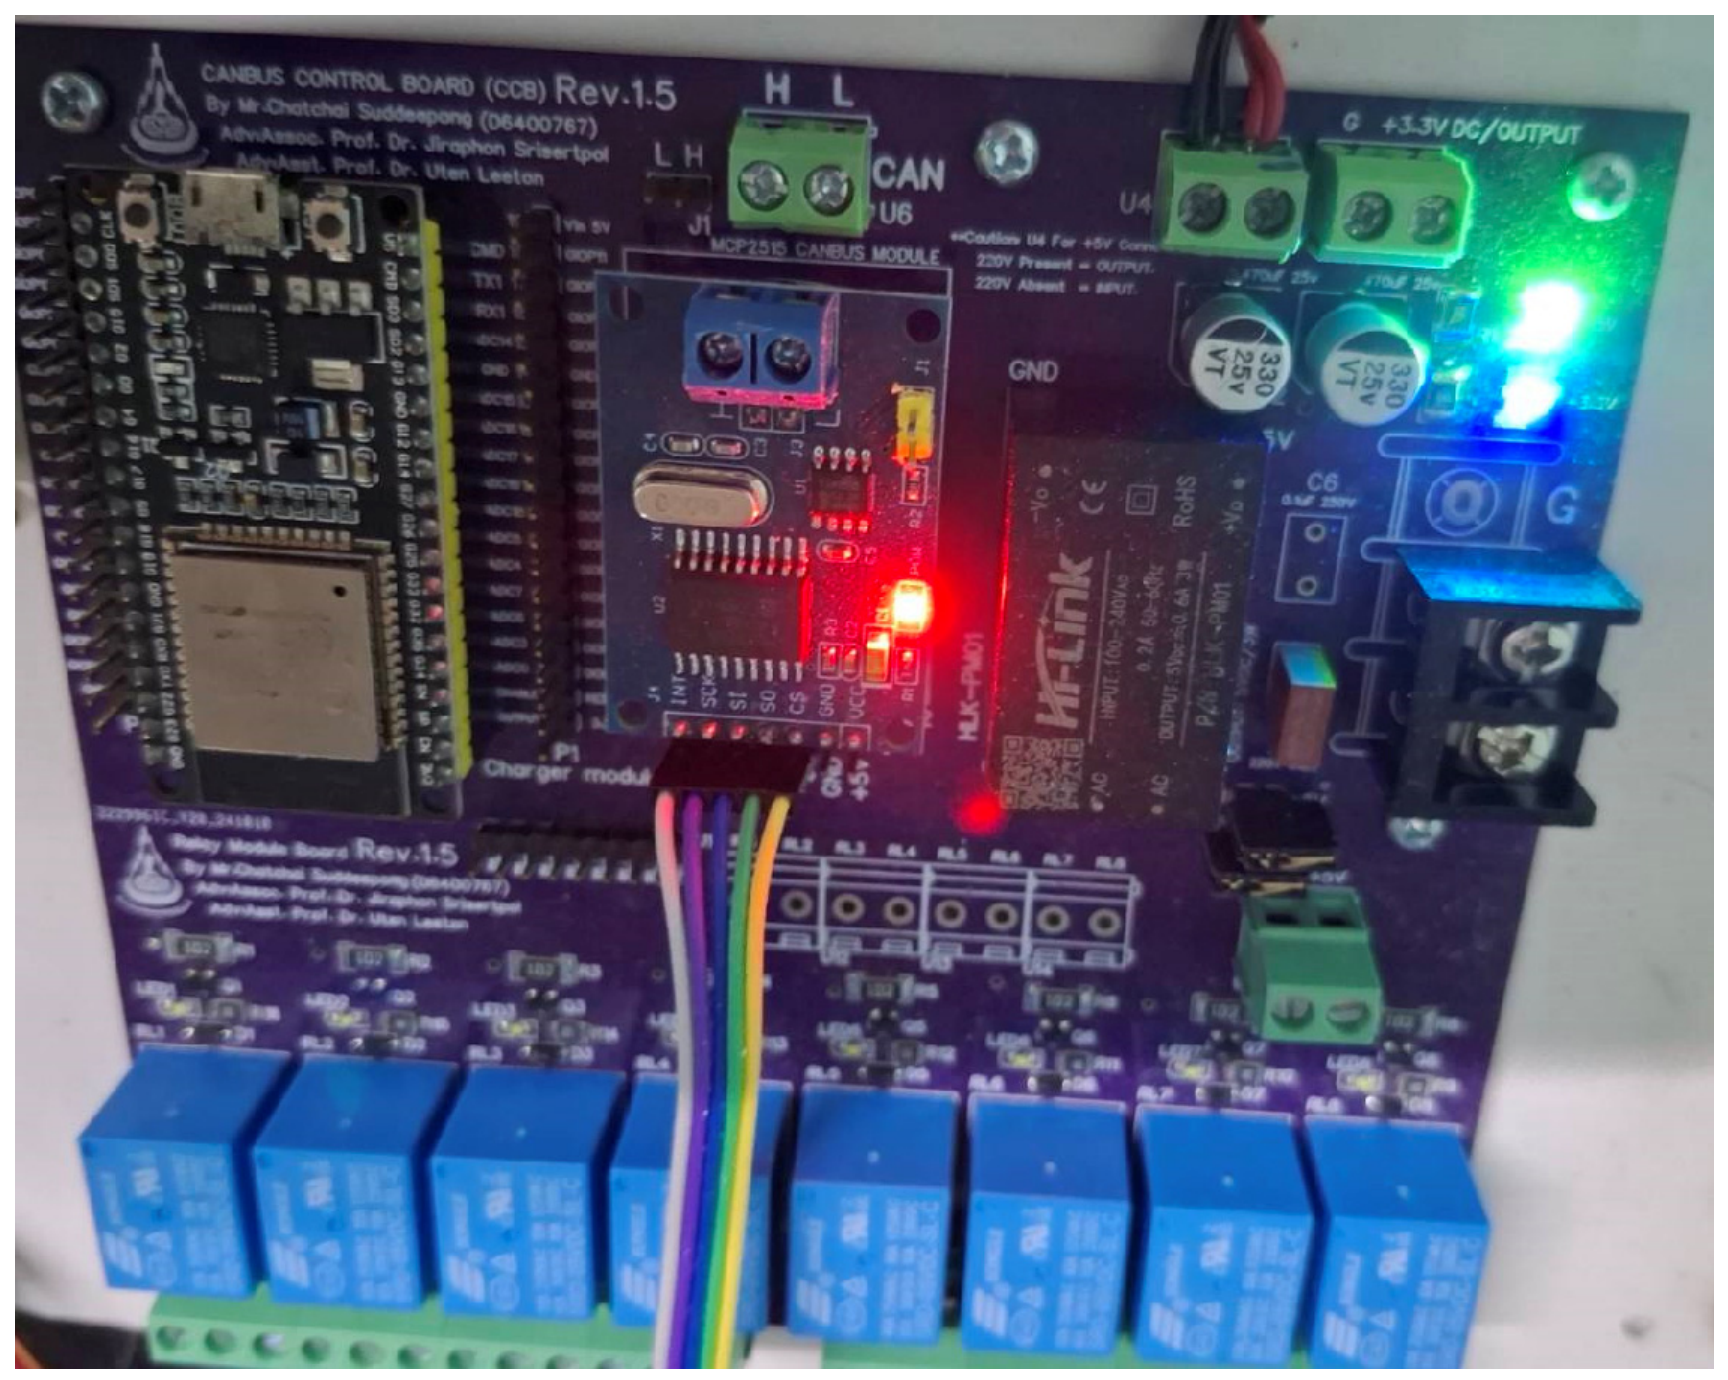
The control module enables both autonomous and user-defined operation, allowing the system to execute programmed control logic for relay or load management based on predefined conditions. External interfaces, including relay driver outputs, UART debugging ports, power input connectors, and expansion headers, provide flexibility for system integration and future functional extension as shown in Figure 5.

2.2.4. PCB Layout Considerations

Several PCB layout practices were applied to improve signal integrity and system reliability.
First, analog measurement traces were isolated from high-current switching paths to reduce noise coupling. Second, a ground plane was implemented to improve electromagnetic compatibility and minimize ground potential differences.
Additionally, communication lines such as UART and BLE antenna regions were carefully routed to avoid interference from power switching components.
The final PCB design provides a compact and robust hardware platform suitable for continuous IoT-based battery monitoring experiments.
The PCB was designed as a two-layer FR-4 board with standard copper thickness.
Special attention was also given to maintaining measurement stability during long-term operation and repeated charging–discharging cycles. Decoupling capacitors were positioned close to critical integrated circuits to suppress transient voltage fluctuations and improve local power stability. In addition, trace routing was optimized to minimize unnecessary loop areas and reduce susceptibility to electromagnetic interference generated by switching loads and communication modules. These design considerations help improve measurement consistency, reduce signal distortion in low-voltage sensing applications, and enhance the overall reliability of long-term battery degradation monitoring experiments as shown in Figure 6.

2.3. Server Infrastructure and Monitoring Platform

2.3.1. Raspberry Pi 4 Server Architecture

The monitoring server is implemented using a Raspberry Pi 4 single-board computer acting as a lightweight edge server for IoT data aggregation, storage, and visualization.
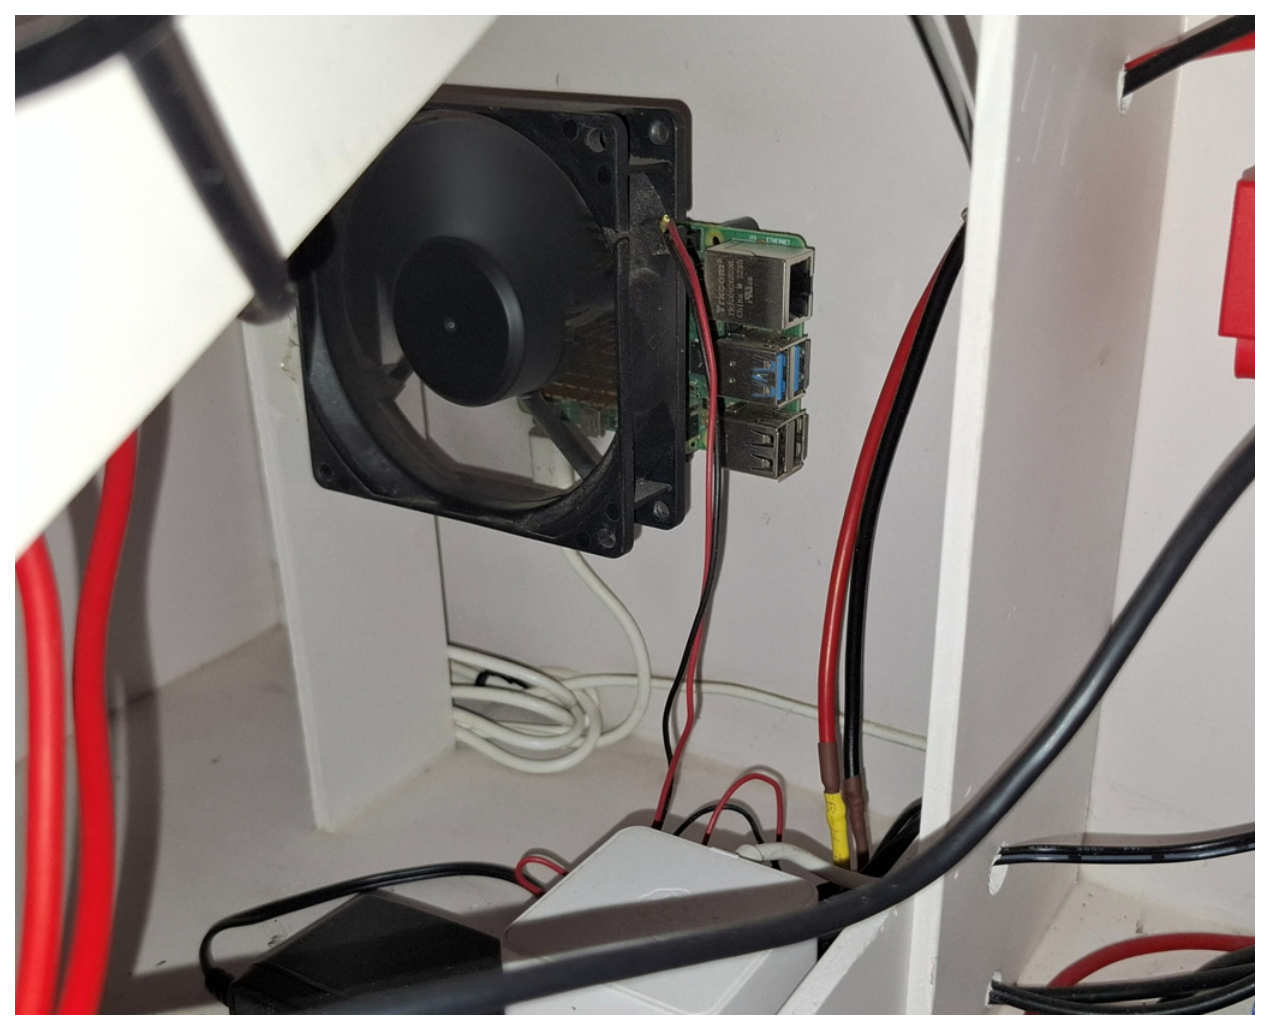
The Raspberry Pi operates continuously as the central node that receives MQTT messages from the ESP32 IoT gateway module through the local wireless network in Figure 7.
Compared to cloud-based solutions, the use of a local edge server provides several advantages:
  • Reduced latency in data processing enabling faster system response;
  • Improved system privacy and data ownership as monitoring remain within the local network;
  • Independence from external internet connectivity allowing offline system operation;
  • Lower operational cost compared to cloud infrastructure.
The system continuously receives MQTT data from the ESP32-S3 gateway via a local wireless network in Figure 7, enabling low-latency data acquisition and real time processing. It supports data aggregation, time-series storage, and visualization through the Home Assistant platform. The edge-based architecture improves reliability, ensures data privacy within the local network, reduces communication overhead, and enables scalable deployment for battery monitoring applications.

2.3.2. MQTT Broker and Data Flow

An MQTT broker running on the Raspberry Pi serves as the central communication hub for the monitoring system.
The ESP32-S3 gateway publishes cell voltage data to predefined MQTT topics, while the server subscribes to these topics and stores the incoming messages for further processing.
The publish–subscribe communication model enables asynchronous and scalable data exchange between embedded devices and monitoring services.
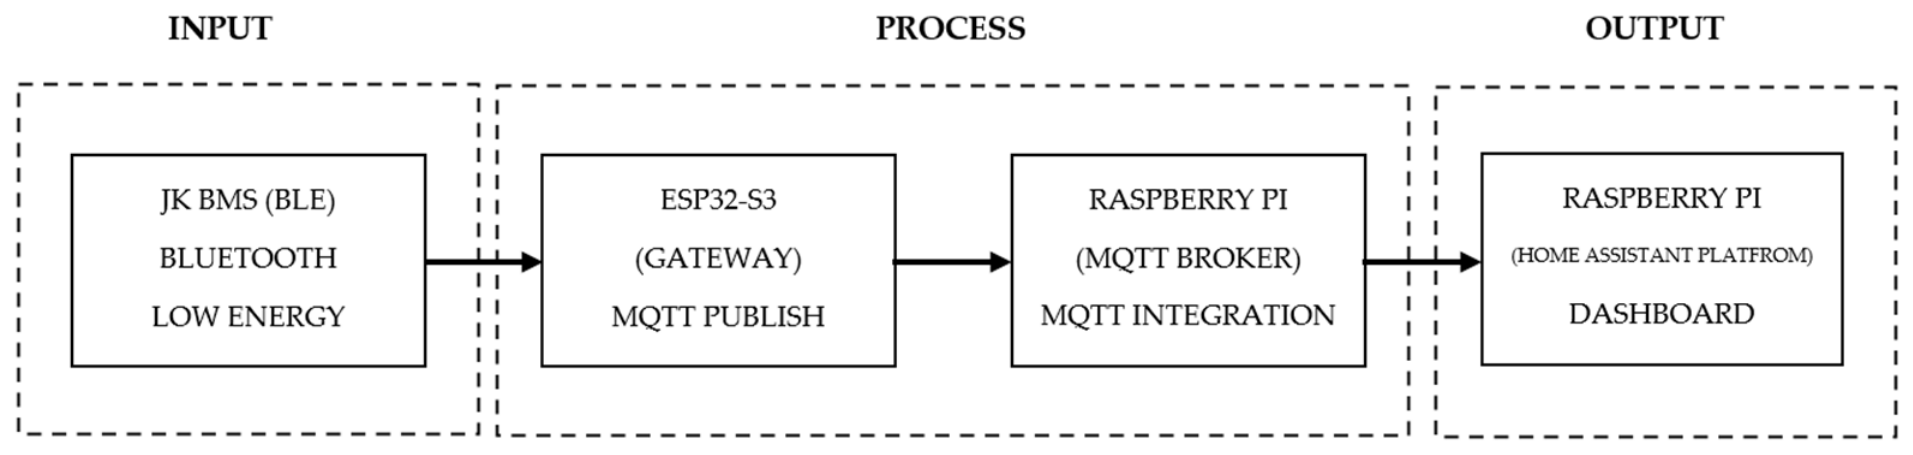
The overall data flow of the proposed IoT-based battery monitoring system can be summarized as illustrated in the block diagram shown in Figure 8. The architecture is organized into three functional stages: input, process, and output. In the input stage, battery operational data are transmitted from the JK-BMS via Bluetooth Low Energy (BLE). The process stage is handled by the ESP32-S3 gateway, which collects the data and publishes it using the MQTT protocol, while the Raspberry Pi operates as the MQTT broker and performs data integration. Finally, in the output stage, the processed information is delivered to the Home Assistant platform running on the Raspberry Pi server, providing a centralized dashboard for real time monitoring and visualization of battery system performance as shown in Figure 8.
The system is organized into three functional stages: input, process, and output. In the input stage, battery data are acquired from the JK-BMS via Bluetooth Low Energy (BLE). In the process stage, the ESP32-S3 gateway performs data acquisition and publishes measurements to the MQTT broker hosted on the Raspberry Pi, enabling asynchronous and scalable data exchange. In the output stage, the processed data are integrated into the Home Assistant platform, providing real time visualization and centralized monitoring through a dashboard interface.

2.3.3. Home Assistant Platform Integration

Home Assistant was deployed on the Raspberry Pi server as the primary monitoring and visualization platform.
The platform provides an integrated environment for:
-
Real time data visualization;
-
Historical trend analysis;
-
Event-based alert generation;
-
System status monitoring.
Cell voltage data received through MQTT are automatically recorded as time-series data and displayed on interactive dashboards for system observation and analysis.

2.3.4. Dashboard Visualization and Alert Mechanism

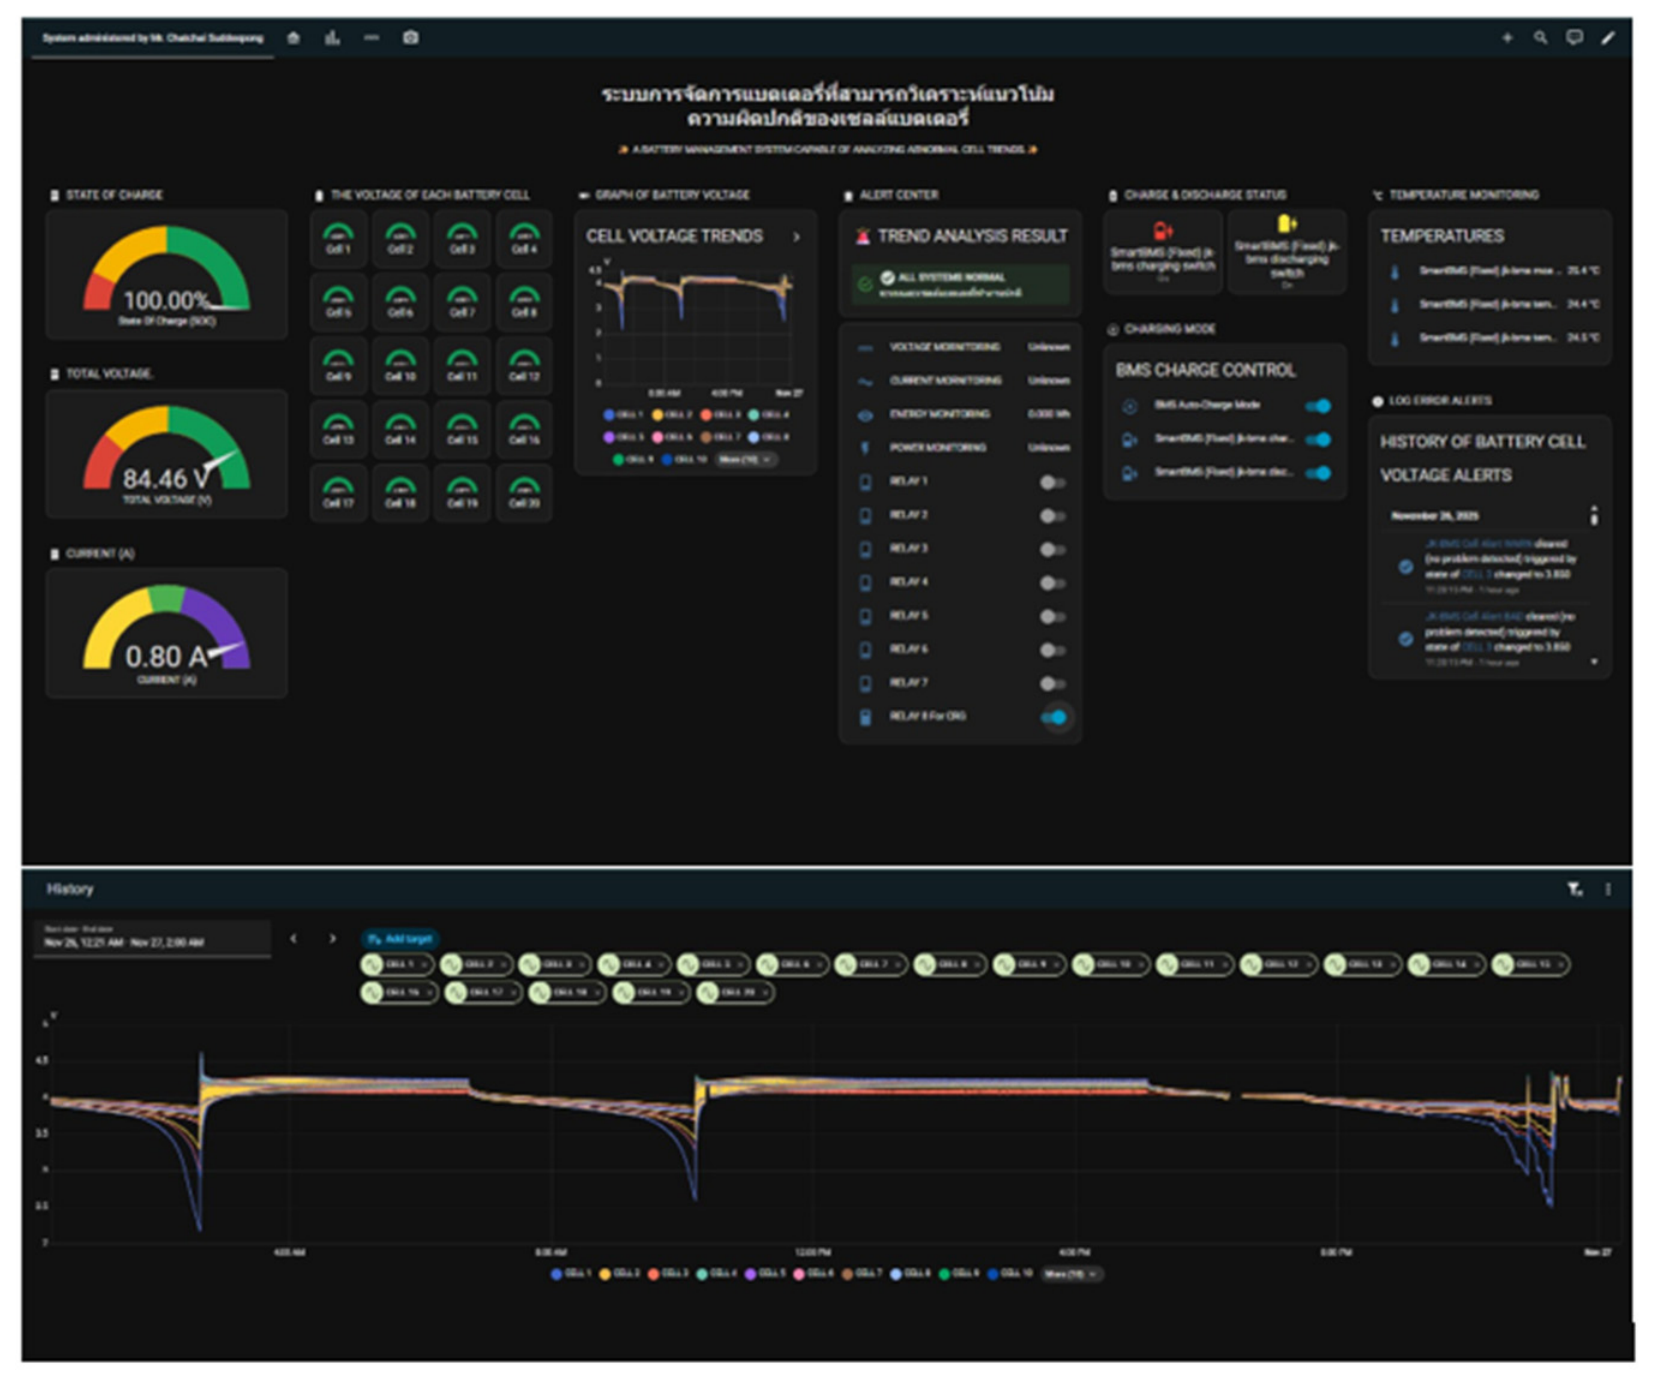
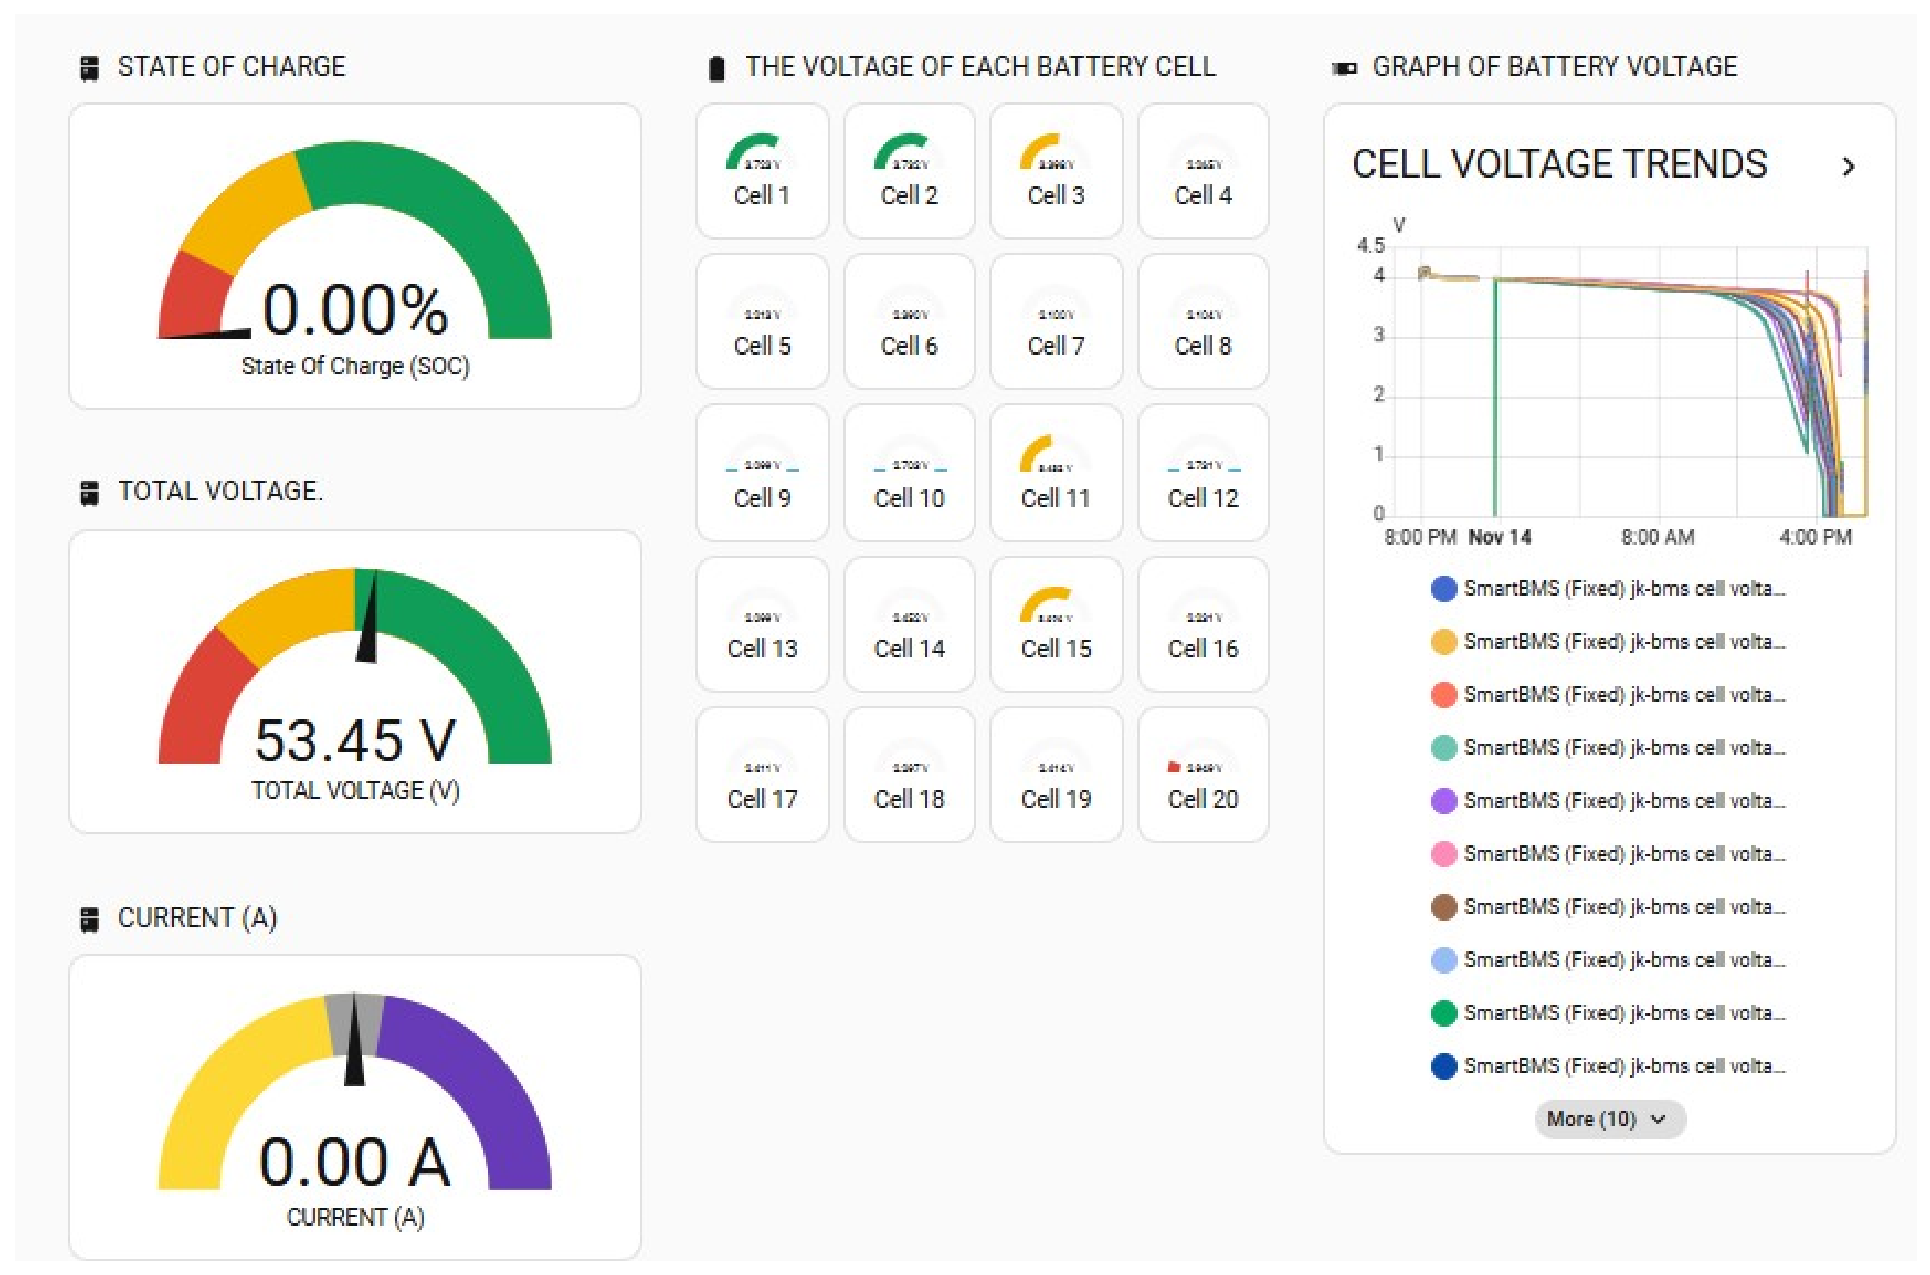
The visualization layer aggregates the continuous time-series data streamed via MQTT, converting raw voltage and resistance profiles into logical trend structures. This design yields real time state visualization and progressive degradation mapping across the multi-cell configuration as shown in Figure 9.
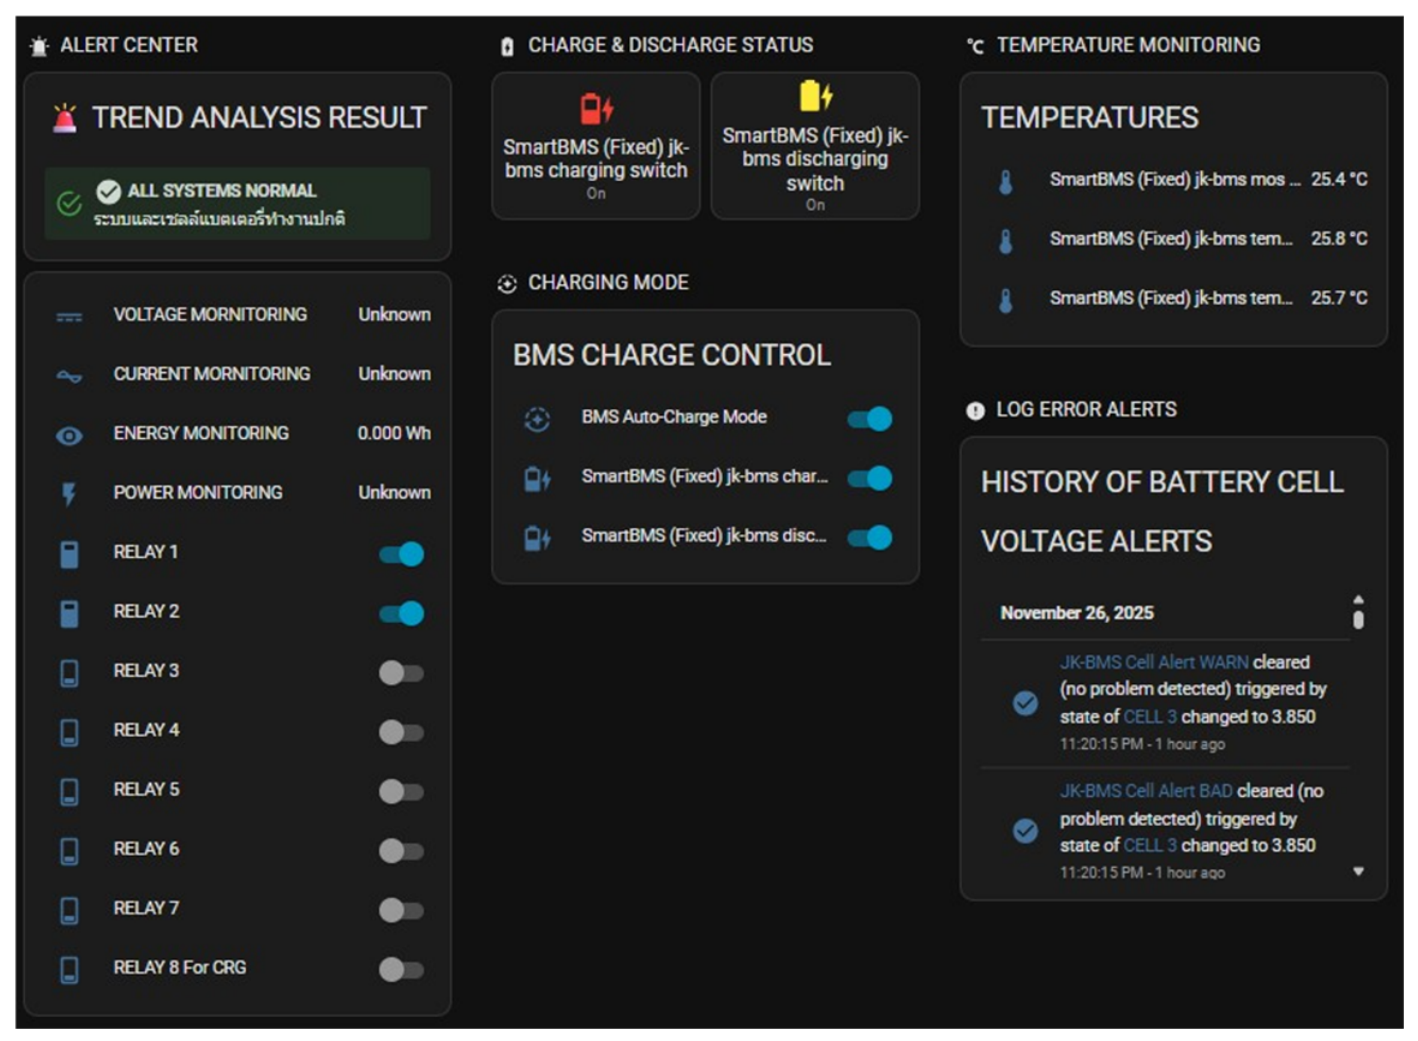
The interface displays real time cell voltage measurements, pack voltage, and historical trends for all battery cells. Anomaly indicators and rule based alerts are triggered when predefined voltage thresholds or instability patterns are detected, enabling early identification of abnormal battery behavior and supporting continuous system monitoring.
In addition, a rule based alert mechanism was implemented to detect abnormal voltage conditions and instability patterns. Alerts are automatically triggered when predefined thresholds are exceeded, such as excessive voltage deviation or unstable behavior within critical operating regions.
The acquired data are periodically collected by the ESP32-S3 gateway, timestamped, and transmitted to the monitoring server via the MQTT protocol with a sampling interval 1–5 s.
The data are stored as time-series records and made available for visualization and analytical processing.
Furthermore, IoT-based monitoring architectures have been increasingly adopted to support remote diagnostics and predictive maintenance in energy storage systems.
Continuous voltage monitoring plays a crucial role in battery health assessment, as voltage instability and cell-to-cell deviation are widely recognized as key indicators of degradation and internal resistance growth.

3. Methodology for Trend-Oriented Battery Monitoring

3.1. Theoretical Modeling Framework

To analyze the transient voltage response during charging, a standard first-order equivalent circuit model (ECM) is adopted as a theoretical baseline to interpret physical cell behaviors:
V ( t ) = V o c ( t ) + I ( t ) R i n t + 1 C e q I ( t ) d t
where I(t) represent the charging current, Voc(t) is the open-circuit voltage, Rint is the internal resistance, and Ceq models the dynamic polarization effects. It is important to clarify that this study does not execute high-overhead, real time online parameteridentification to compute these variables on the fly. Instead, this physics-based framework serves as an analytical guide to understand the voltage curves obtained from the embedded sensor suite of the JK-BMS. The instantaneous step voltage upon current injection validates the resistive drop (I(t) Rint), whereas the subsequent non-linear voltage evolution validates the dynamic capacitive charge accumulation ( 1 C e q I ( t ) d t ).

3.2. Experimental Validation of Theoretical Model

The purpose of this experiment was to validate the theoretical model presented in Equation (1), which describes the dynamic relationship between open-circuit voltage, internal resistance, and equivalent capacitance during battery charging.
V ( t ) = V o c ( t ) + I ( t ) R i n t + 1 C e q I ( t ) d t
The experimental platform consisted of:
-
A 72 V lithium-ion battery pack (20-series configuration);
-
JK BMS with built-in sensing capability;
-
ESP32 microcontroller;
-
Relay-based charging controller;
-
IoT remote monitoring platform (Home Assistant Platform).
Unlike conventional systems that require external sensing modules, this study utilizes the embedded sensors available within the JK BMS to directly acquire battery parameters in real time.
The JK BMS continuously provides:
-
Total battery voltage;
-
Charging/discharging current;
-
State of charge (SOC);
-
Individual cell voltage;
-
Individual cell internal resistance;
-
Battery temperature;
-
MOSFET temperature;
-
Charging status;
-
Discharging status.
These parameters were transmitted to the ESP32 controller and visualized through Home Assistant for real time experimental validation.
To validate the proposed battery charging model, experiments were conducted using a real-world lithium-ion battery charging platform integrated with an IoT based monitoring architecture.
To validate each component of the proposed model, real time battery data were collected using the embedded sensors within the JK BMS and continuously transmitted to the Home Assistant dashboard for real time visualization and analysis.
The acquired dataset included total battery voltage, charging current, individual cell voltages, internal resistance values, and charging state information, which were used to evaluate the accuracy of Equation (1) under actual charging conditions.
The experimental validation was divided into three main parts according to each term of the proposed model:
  • Validation of the resistive term I ( t ) R i n t , which examines the instantaneous voltage response caused by internal resistance during charging current injection;
  • Validation of the capacitive term 1 C e q I ( t ) d t , which analyzes the gradual voltage rise associated with dynamic charge accumulation during the CC-CV charging process;
  • Validation of the open-circuit voltage term V o c ( t ) , which investigates voltage stabilization behavior when the charging current approaches zero near full charge conditions.
The corresponding experimental results are presented and discussed in the following sections.
1. Validation of Internal Resistance Behavior
The internal resistance behavior was validated using real time resistancemeasurements obtained directly from the JK BMS.
Based on Equation (2):
R i n t = V I
the battery exhibited an immediate voltage increase when charging current was applied.
Experimental observations showed that:
-
Higher charging current caused faster voltage rise;
-
Cells with higher resistance experienced larger voltage fluctuations;
-
Abnormal resistance values indicated potential degradation;
-
Cell resistance 1–20;
-
Maximum cell resistance;
-
Total internal resistance.
These values were visualized in Home Assistant dashboards for trend analysis.
2. Validation of Equivalent Capacitance Behavior
The transient charging behavior was validated by observing voltage evolution over time during charging operations.
According to Equation (1):
V c ( t ) = 1 C e q I ( t ) d t
the battery voltage gradually increased after the initial resistive voltage jump.
Experimental results showed:
-
Rapid initial voltage increase;
-
Gradual voltage stabilization;
-
Smooth charge accumulation process;
-
Delayed voltage response during charging transitions.
This confirms the capacitor like behavior of lithium-ion batteries during charging.
3. Voltage vs Time Validation
Real time voltage data from JK BMS were recorded through Home Assistant.
The voltage profile showed:
-
Initial rapid increase;
-
Stable mid stage charging region;
-
Voltage saturation near full charge.
This behavior aligns with the proposed theoretical model.
4. Current vs. Time Validation
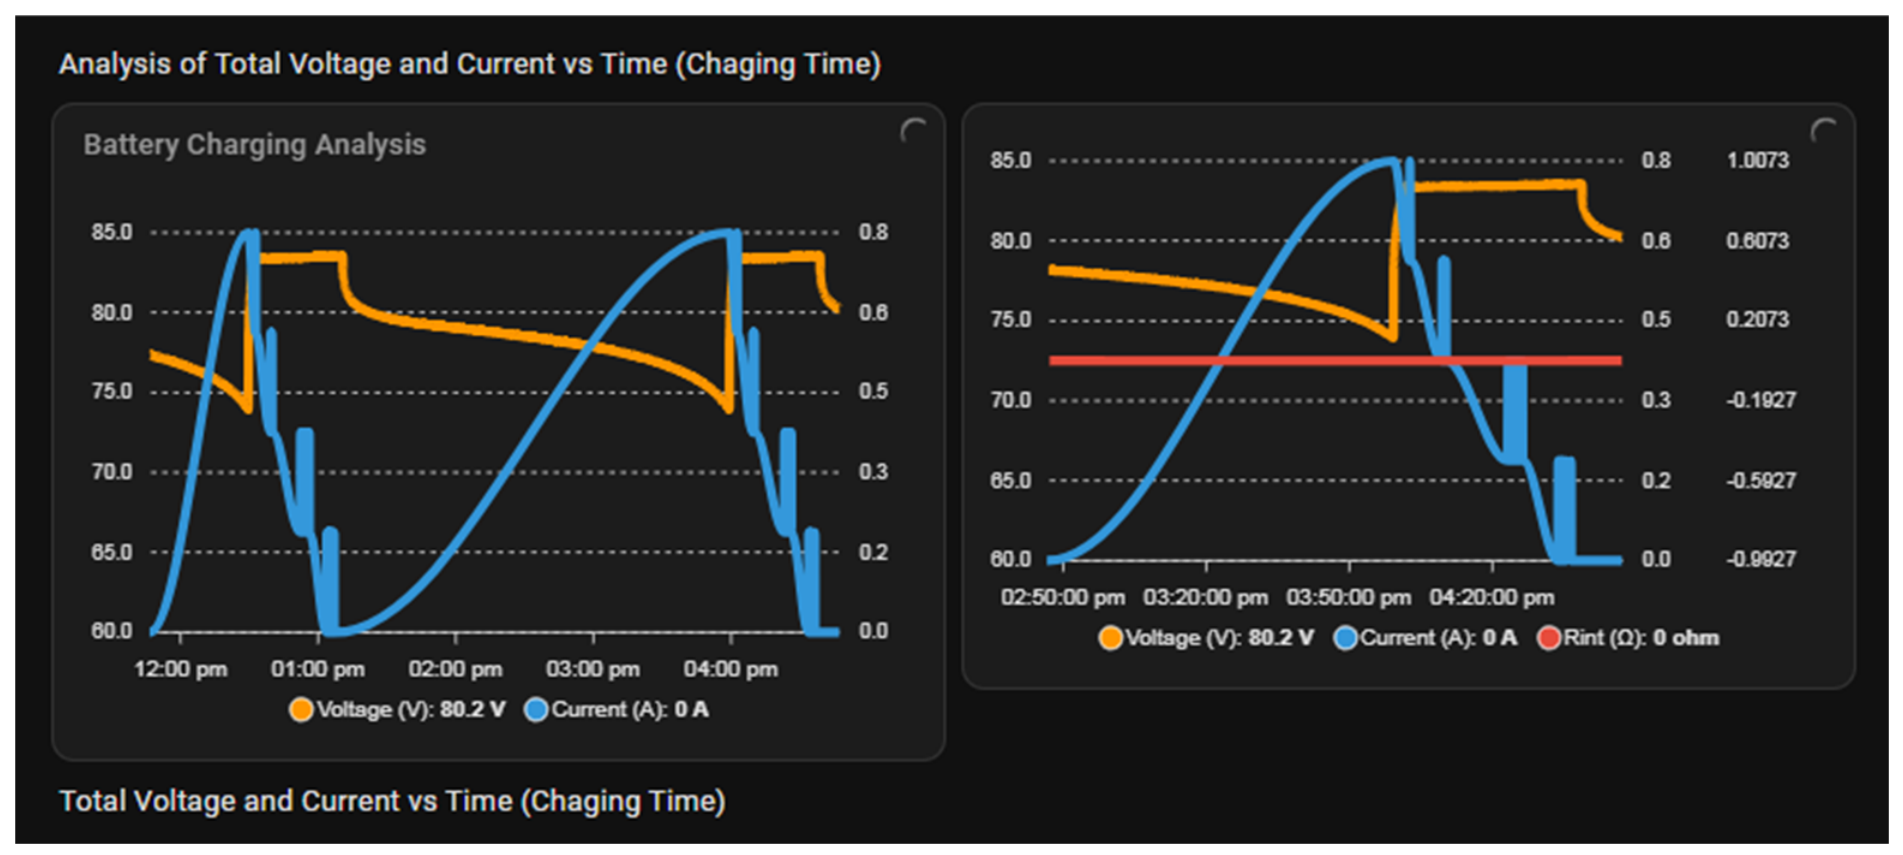
In Figure 10. Current measurements from JK BMS were used to validate charging behavior.
The experimental results confirmed:
-
Initial rapid increase;
-
Constant Current (CC) region;
-
Current remained nearly constant;
-
Constant voltage (CV) region;
-
Current gradually decreased as voltage reached its maximum threshold.
This validates the charging characteristics of the proposed system as clearly visualized in Figure 10.
The experimental results illustrate the dynamic charging behavior of the battery pack under real operating conditions. As shown in Figure 10, the charging process initially begins in the constant current (CC) region, where the charging current rapidly increases and remains relatively stable. During this period, the battery voltage gradually rises due to electrochemical charge accumulation, which validates the capacitive componentrepresented by 1 C e q I ( t ) d t in Equation (1).
A rapid voltage response can also be observed immediately after charging current injection, which corresponds to the resistive voltage component I ( t ) R i n t This instantaneous voltage rise occurs due to the internal resistance of the battery cells.
As the battery voltage approaches the upper charging threshold, the charging process transitions into the constant-voltage (CV) region. In this stage, the voltage remains relatively stable while the charging current gradually decreases toward zero, indicating that the battery is approaching full charge.
The repeated charging cycles shown in Figure 11. demonstrate the consistency of the proposed charging control algorithm and confirm that the theoretical model accurately represents real battery charging dynamics under practical operatingconditions.
5. Cell Resistance Validation
One important contribution of this study is real time monitoring of individual cell resistance.
The system continuously tracked:
-
Cell R1–Cell R20;
-
Maximum resistance cell;
-
Current remained nearly constant;
-
Total pack resistance.
Cells with abnormal resistance trends were identified as potential fault locations.
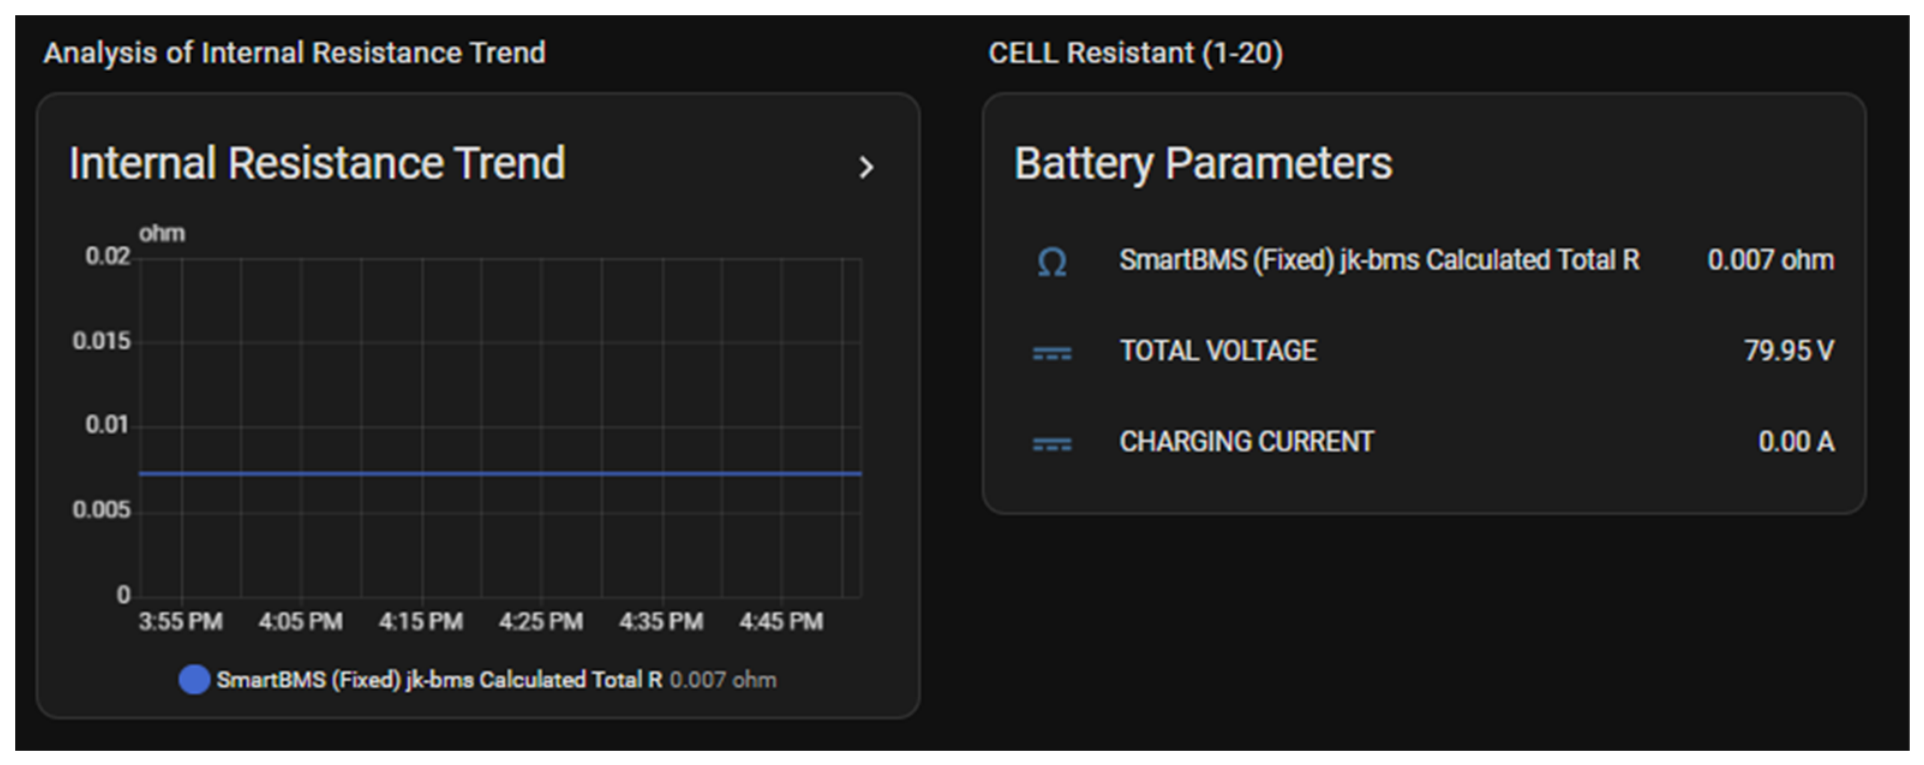
This improves predictive maintenance capability as clearly visualized in Figure 11.
The figure illustrates the real time internal resistance behavior of the battery pack during the experimental validation process. The proposed monitoring system continuously tracked the total internal resistance of the battery pack by aggregating individual cell resistance values obtained from the JK BMS.
As shown in the graph, the total internal resistance remained relatively stableat approximately 0.007 Ω throughout the observation period. This indicates that no significant resistance fluctuation occurred during the experiment.
At the same time, the battery terminal voltage remained at 79.95 V, while the charging current was recorded at approximately 0.00 A, indicating that the battery had reached a near steady-state charging condition.
The stable internal resistance trend suggests that:
-
No abnormal cell degradation occurred;
-
No severe thermal stress was present;
-
The battery pack maintained stable electrical characteristics.
These results validate the theoretical internal resistance model proposed in Equation (2), where resistance behavior plays an important role in voltage response and charging stability.
R i n t = V I
The experiment demonstrates that real time internal resistance monitoring can be effectively used for battery health assessment and predictive maintenance applications.
6. Cell Voltage Imbalance Validation Individual cell voltages were monitoredin real time.
The experiment detected:
-
Voltage imbalance.
-
Abnormal voltage deviation.
-
Balancing behavior.
This enables early fault diagnosis.
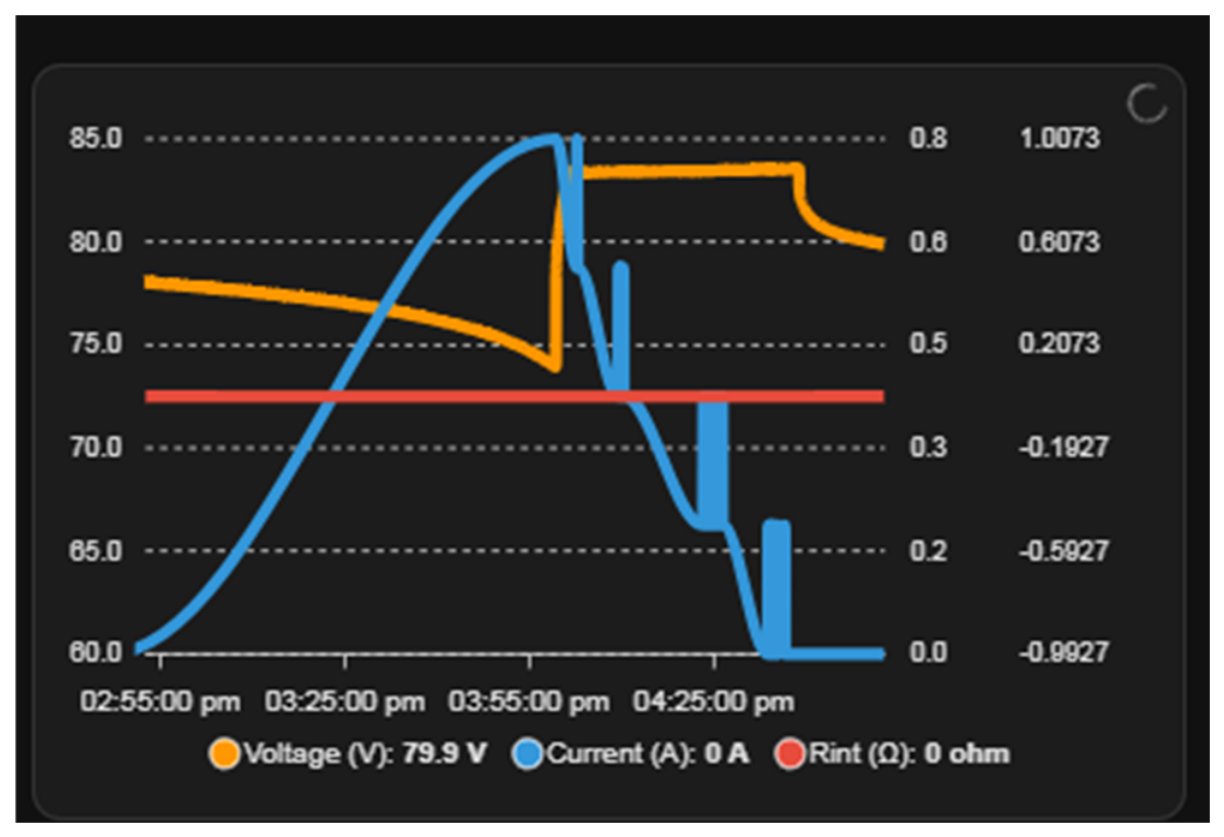
The experimental results as shown in Figure 12. demonstrate the dynamic charging characteristics of the proposed battery system. At the initial charging stage (02:55 PM–03:55 PM), the charging current gradually increased, as indicated by the blue curve, while the battery voltage continuously changed due to energy accumulation within the battery pack. This behavior validates the capacitive effect represented by C e q , where the voltage response changes gradually over time rather than instantaneously
At approximately 03:55 PM, the charging current reached its peak value, causing a sudden voltage transition. This phenomenon corresponds to the resistive behavior described by the I ( t ) R i n t term in the proposed model, where an immediate voltage response occurs due to internal resistance.
After reaching the peak charging condition, the current rapidly decreased, indicating the transition from constant-current (CC) mode to constant-voltage (CV) mode. During this stage, the battery voltage gradually stabilized as the charging process approached equilibrium.
The internal resistance curve (red line) remained relatively stable throughout the experiment, indicating that no severe degradation or abnormal resistance fluctuation occurred during this charging cycle.
These experimental results confirm the validity of the proposed theoretical battery model by demonstrating the interaction between resistive effects, capacitive behavior, and real time charging dynamics.
7. Thermal Validation Temperature sensors built into JK BMS were used to monitor:
-
Battery temperature;
-
MOSFET temperature.
High resistance cells were correlated with higher thermal stress during charging.
Following the validation of voltage response, charging current behavior, and internal resistance characteristics, thermal validation was performed to evaluate the temperature behavior of the battery system during real charging conditions.
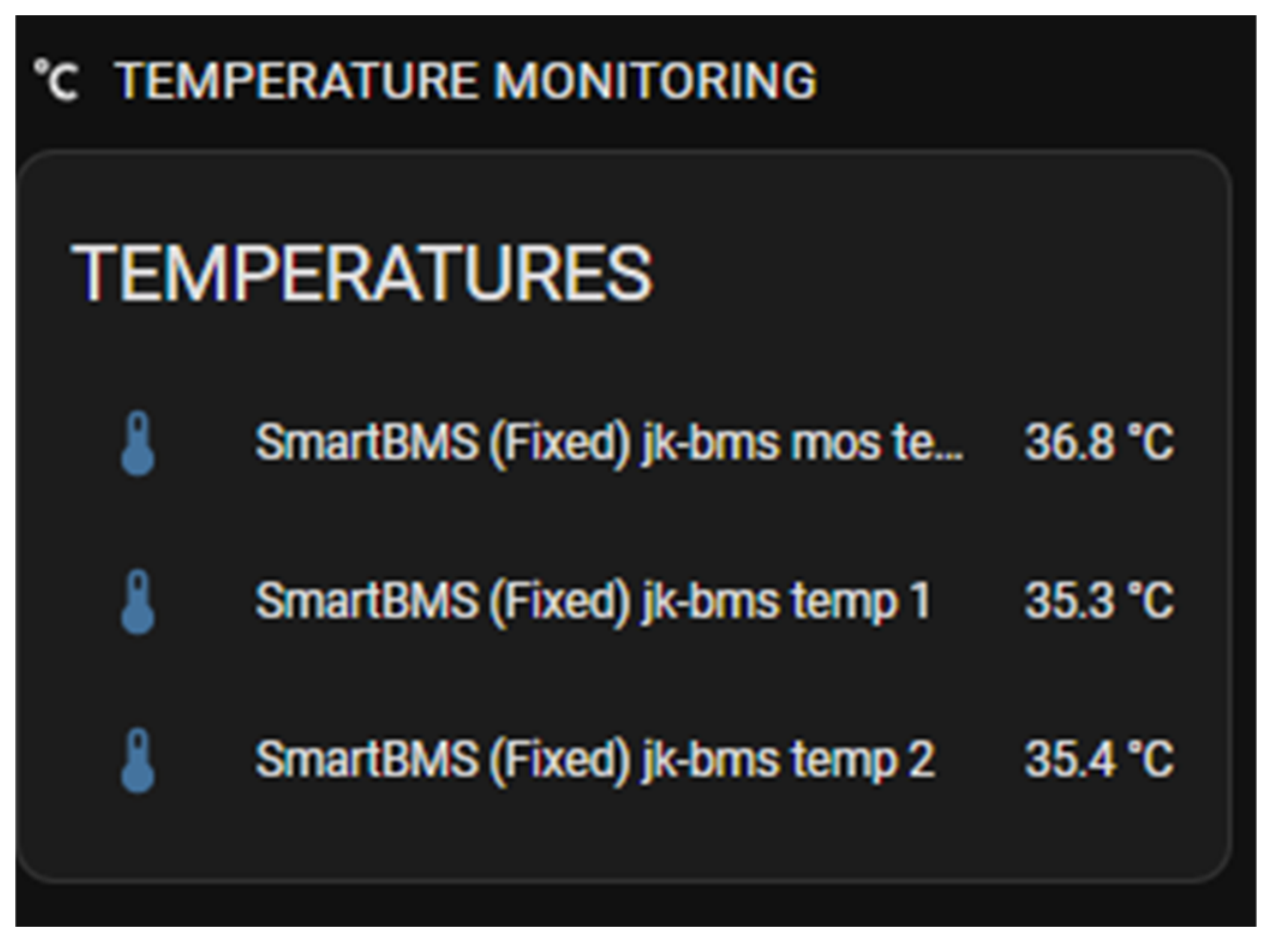
The embedded temperature sensors within the JK BMS continuously monitored battery temperature and MOSFET temperature throughout the charging process. The recorded temperatures were 35.3 °C and 35.4 °C for the battery temperature sensors, while the MOSFET temperature reached 36.8 °C. The experimental results indicate that the charging control algorithm maintained the battery pack with in a safe thermal operating range, with no evidence of excessive temperature rise or thermal runaway conditions as clearly visualized in Figure 13.
Furthermore, thermal observations support the previously discussed internal resistance analysis, where higher internal resistance can contribute to increased heat generation according to Joule heating principles P I 2 R . Despite variations in charging current and voltage transitions, the temperature remained relatively stable, demonstrating that the proposed charging strategy effectively mitigates thermal stress during battery operation.
These results confirm that the proposed IoT-based monitoring system can simultaneously perform electrical and thermal diagnostics, improving battery safety, reliability, and predictive maintenance capability.
8. Controller Validation The ESP32 charging controller successfully performed:
-
Automatic charging initiation;
-
Automatic charging termination;
-
Overvoltage protection;
-
Overdischarge protection.
The relay switching logic operated successfully under real charging and conditions Implemented hardware architecture of the entire system as shown in Figure 14.
The visualization layer aggregates the continuous time-series data streamed via MQTT, converting raw voltage and resistance profiles into logical trend structures. This design yields real time state visualization and progressive degradation mapping across the multi-cell configuration. During experimental testing, the controller continuously monitored real time battery voltage and current data obtained directly from the embedded JK BMS sensors. When the battery voltage dropped below the predefined threshold of 73.95 V, the controller automatically activated Relay 1 and enabled the charging switch to initiate the charging process.
During the charging period, the controller continuously evaluated battery voltage and charging current to ensure safe operation. Once the battery voltage reached 83.53 V and the charging current decreased below 0.21 A, the controller automatically terminated the charging process by disabling the charging switch and turning off the relay after the predefined delay period.
In addition, the controller successfully executed over-discharge protection by disabling battery discharge when the voltage dropped below 63 V and automatically restoring discharge operation when the voltage recovered above 65 V.
Emergency charging mode was also implemented as a backup mechanism to allow manual intervention when necessary.
The experimental results confirm that the proposed controller successfully performed autonomous charging management, relay switching control, and battery protection functions while maintaining safe and reliable battery operation under real-world conditions.
9. Experimental Summary
The experimental results validate the theoretical charging model using real world measurements collected directly from JK BMS embedded sensors.
The experimental results successfully validated the proposed theoretical charging model using real world measurements collected directly from the embedded sensors of the JK BMS.
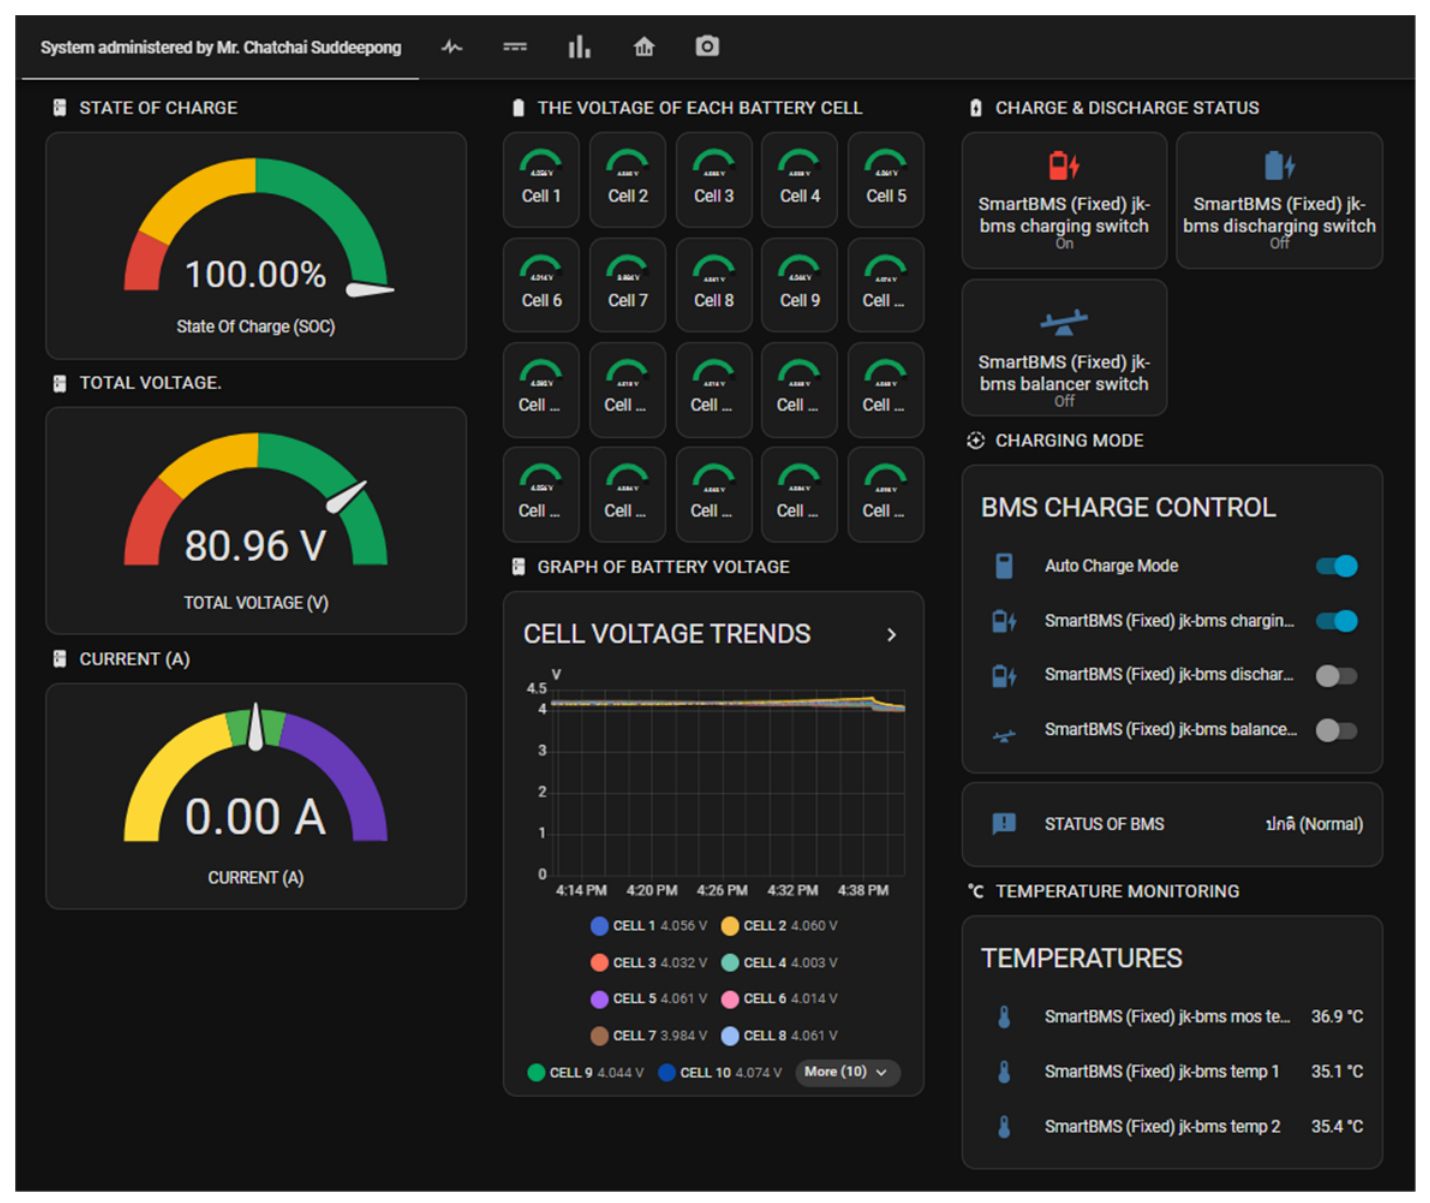
The developed dashboard provided real time visualization of all critical battery parameters, including total voltage, charging current, individual cell voltages, internal resistance values, temperature measurements, relay states, charging status, and fault detection indicators as shown in Figure 15.
The experimental results confirmed that the proposed system accurately captured the dynamic charging behavior described in Equation (1), including instantaneous resistive voltage response, gradual capacitive charging behavior, and voltage stabilization near full-charge conditions.
Furthermore, the system successfully identified abnormal cell voltage deviations, monitored internal resistance variations, detected thermal behavior, and validated the effectiveness of the automated charging controller under real operating conditions.
The integration of IoT based monitoring, real time visualization, theoretical modeling, and intelligent charging control demonstrates the practical applicability of the proposed system for battery diagnostics, predictive maintenance, and safe energy storage management.
Overall, the experimental validation confirms that the proposed framework provides a reliable and scalable solution for next-generation smart battery management systems.

3.3. Data Acquisition and System Operation

The proposed monitoring framework continuously acquires cell level voltage data from the battery pack through the JK-BMS interface. The JK-BMS performs internal sampling of individual cell voltages and provides measurements through a Bluetooth Low Energy (BLE) communication channel.
The proposed system adopts an IoT-based monitoring architecture that integrates embedded sensing, wireless communication, and centralized data analytics.
This pipeline enables continuous monitoring without interfering with the protective logic of the BMS.
The acquired data are then organized into a structured monitoring pipeline for storage, visualization, and further analytical processing.

3.4. Cell Voltage Trend Analysis

Unlike traditional battery monitoring systems that rely solely on instantaneous voltage thresholds, the proposed system emphasizes long term trend observation and inter cell comparison.
Three key characteristics of cell behavior are analyzed:
1. Voltage Stability
Voltage stability refers to the ability of a cell to maintain a consistent voltage level during steady operating conditions. Frequent oscillations in voltage may indicate internal resistance increase or chemical degradation.
2. Cell-to-Cell Deviation
Cells within a healthy battery pack typically exhibit similar voltage levels during operation. Significant divergence between cells may indicate imbalance or localized degradation.
The voltage deviation between cells is calculated as:
ΔV = Vmax − Vmin
where Vmax is the highest cell voltage.
Vmin is the lowest cell voltage.
Large deviation values indicate potential imbalance.
Continuous tracking of the divergence rate between the maximum and minimum cell voltages over extended cycles provides robust indicators of localized capacity fade.
3. Trend Drift
Trend drift refers to gradual divergence of a cell’s voltage behavior compared to other cells over time. Persistent drift may indicate aging or internal deterioration.
Based on the collected time-series data, cell voltage behavior is further analyzed to extract key degradation-related characteristics.

3.5. Heuristic Anomaly Detection Strategy

To maintain low computational overhead on resource-constrained edge gateways, a rule based heuristic screening strategy is formulated to isolate cell outliers. The proposed algorithm systematically evaluates voltage fluctuations and inter cell relationships based on the following mathematically defined operational thresholds:
Rule 1: Voltage Fluctuation Detection An anomaly is registered if a cell’s voltage exhibits rapid oscillations within a concise time window (T = 5 s), satisfying:
V t e m p = | V i ( t ) V i ( t 1 ) | > V t h r e s h
where Vthresh is strictly defined as 0.05 V based on standard sensory noise filtering, and the cumulative fluctuation frequency exceeds Fthresh = 3 occurrences per minute.
Rule 2: Inter-Cell Deviation Detection.
To catch localized cell divergence during steady-state phases, the inter-cell voltage deviation (∆V) is computed continuously:
∆V = Vmax − Vmin
A severe imbalance anomaly is triggered if ∆V exceeds a predefined safety margin, parameterized here between 0.1 V and 0.2 V depending on the charging state.
Rule 3: Critical Voltage Region Instability.
Cells are subjected to intensified screening when operating within the non-linear thermodynamic region:
If 3.0 V\le Vi(t)\le 3.5\text{V}\text{and Rule 1 is satisfied} Continuous tracking within this sensitive zone acts as a robust indicator of capacity fade and localized aging before conventional high-voltage hardware thresholds (e.g., 4.25 V) are breached.

3.6. Frequency-Based Degradation Classification

To estimate degradation severity, anomaly frequency is analyzed over extended time periods.
Cells are categorized into three degradation levels:
This classification provides a simple yet interpretable indicator of battery health status.
To estimate degradation severity, anomaly frequency is evaluated over a defined observation window.
Let Anomaly represent the number of detected anomalies within a time window T.
The degradation level is classified as follows:
-
Low frequency (Nanomaly < N1): Normal condition.
-
Medium frequency (N1 ≤ Nanomaly < N2): Early degradation.
-
High frequency (Nanomaly ≥ N2): Severe degradation.
This frequency-based classification provides a lightweight and interpretable alternative to complex model-based health estimation methods as shown in Figure 16.
The framework consists of data acquisition, preprocessing, feature extraction, heuristic anomaly detection, frequency-based classification, and visualization with alert generation.

3.7. Visualization and Alert Generation

The monitoring dashboard provides real time visualization of key battery parameters, including as shown in Figure 17.
-
Individual cell voltages;
-
Pack voltage;
-
Voltage deviation trends;
-
Anomaly indicators.
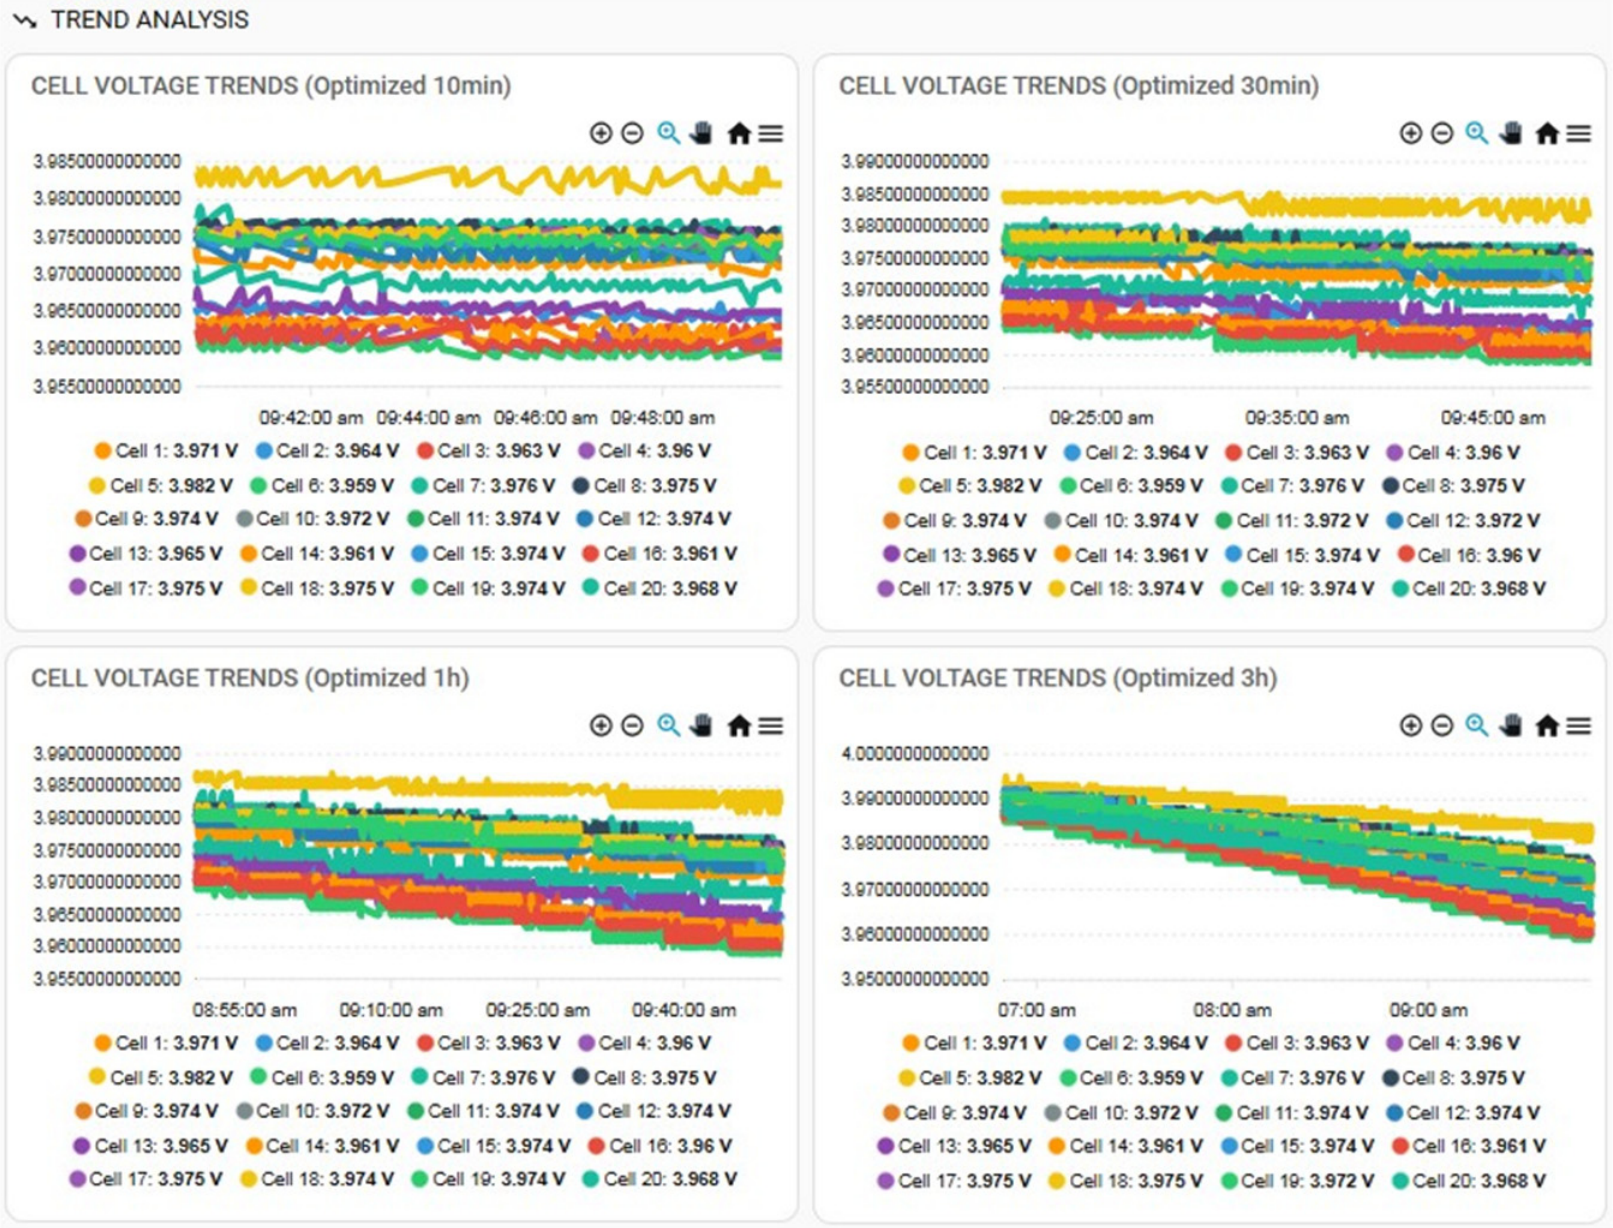
The dashboard presents cell level voltage measurements, pack voltage, and voltage deviation trends across the battery pack. Multiple temporal resolutions are provided to support both short-term and long-term analysis. Detected anomalies are highlighted within the visualization, and rule based alerts are triggered when predefined thresholds are violated. This integrated interface enables real time monitoring, enhances situational awareness, and supports proactive maintenance decisions.
The visualization module presents cell voltage data at multiple temporal resolutions, specifically at 1 min, 3 min, 1 h, and 3 h intervals. This multi scale representation enables high-resolution monitoring of short-term dynamics while preserving the ability to capture long-term voltage trends. By integrating both fine-grained and aggregated views, the system effectively supports detailed analysis of transient behaviors alongside comprehensive assessment of battery performance over extended periods.
Furthermore, this multi-resolution approach enhances the capability of the monitoring framework to simultaneously capture rapid voltage fluctuations and gradual degradation patterns. As a result, it significantly improves the robustness and reliability of anomaly detection, while strengthening the effectiveness of trend-oriented analysis for early-stage battery degradation identification.
This design also facilitates scalable data interpretation across different time horizons, making it suitable for both real time monitoring and long-term predictive maintenance applications.
Moreover, the proposed visualization architecture extends beyond conventional monitoring functions by establishing an integrated analytical environment for battery health assessment. Through continuous synchronization between real time measurements, anomaly detection mechanisms, and historical trend analysis, the framework enables early identification of abnormal voltage behavior at the cell level while reducing the dependence on manual inspection. The integration of multi-resolution visualization with automated alert generation improves system interpretability and enhancesoperational decision-making under dynamic charging conditions.
Therefore, the proposed approach contributes toward the development of intelligent battery monitoring infrastructures capable of supporting scalable deployment, predictive maintenance implementation, and long-term reliability enhancement in lithium ion energy storage systems.
An example of the implemented visualization and alert interface, along with the alert generation mechanism, is presented in Figure 18.
Alerts are automatically triggered when anomaly detection criteria are satisfied, such as excessive voltage deviation or unstable behavior within critical voltage regions. These alerts provide immediate notification to operators, enabling timely intervention and preventing potential system failure.
Automated alerts are triggered when predefined anomaly rules are violated. These alerts assist operators in identifying abnormal cells before critical failure occurs.
This visualization and alert mechanism enhance situational awareness and enables proactive maintenance decisions.
The integration of visualization and rule based alerting enables real time decision support and enhances system responsiveness to abnormal battery conditions.

4. Experimental Results

4.1. Experimental Setup

The proposed monitoring system was experimentally deployed using a 72 V NMC battery pack consisting of 20 series-connected cells. The hardware components used in the experiment include:
-
JK-BMS for cell voltage measurement;
-
ESP32-S3 gateway module;
-
ESP32 control module;
-
Raspberry Pi 4 monitoring server;
-
Home Assistant monitoring platform.
The system operated continuously during battery charging and discharging cycles to collect real time operational data.
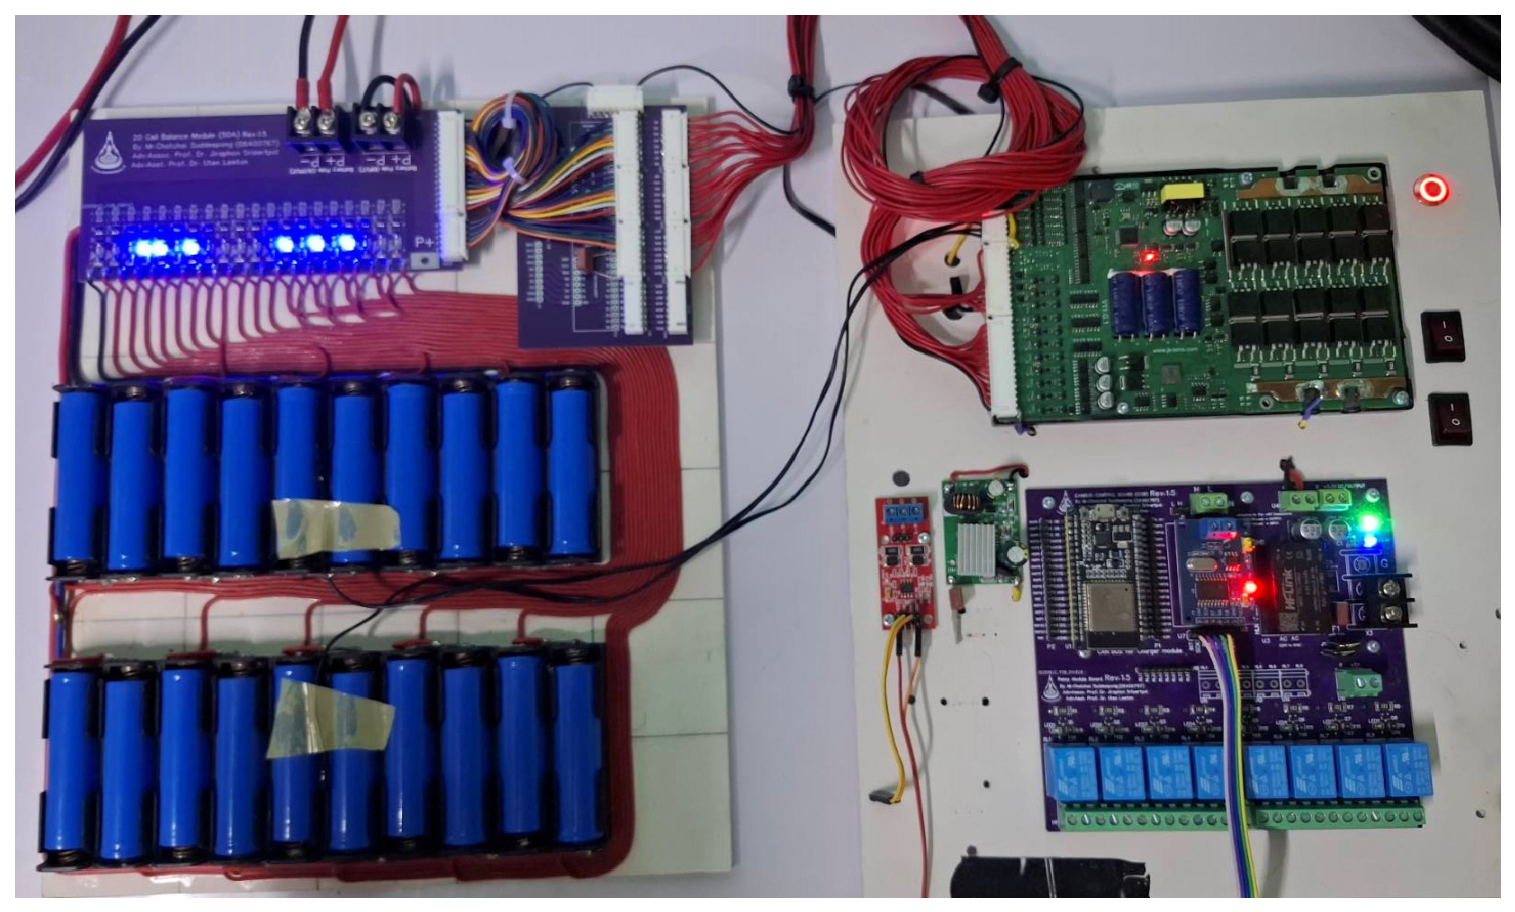
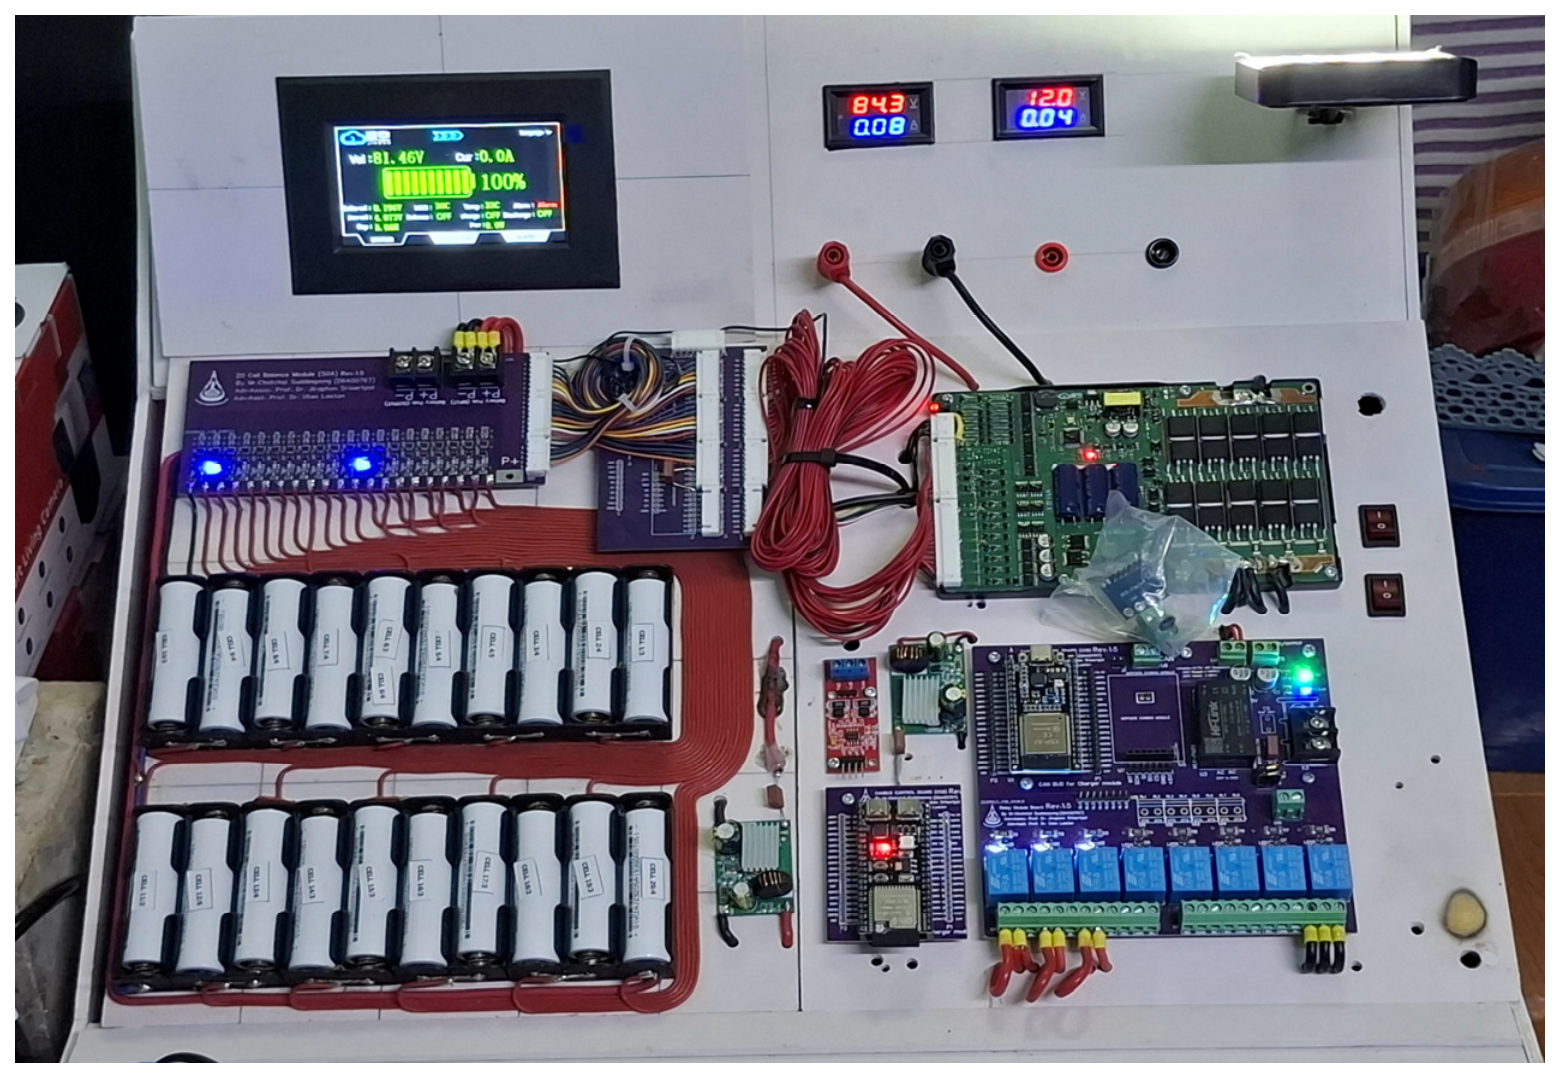
The comprehensive configuration of the experimental platform is illustrated in Figure 19.
The system consists of a 72 V NMC battery pack, JK-BMS for cell voltage measurement, ESP32-based modules for data acquisition and control, and a Raspberry Pi 4 server for data processing and visualization.

4.2. Real Time Cell Voltage Telemetry and Dashboard Visualization

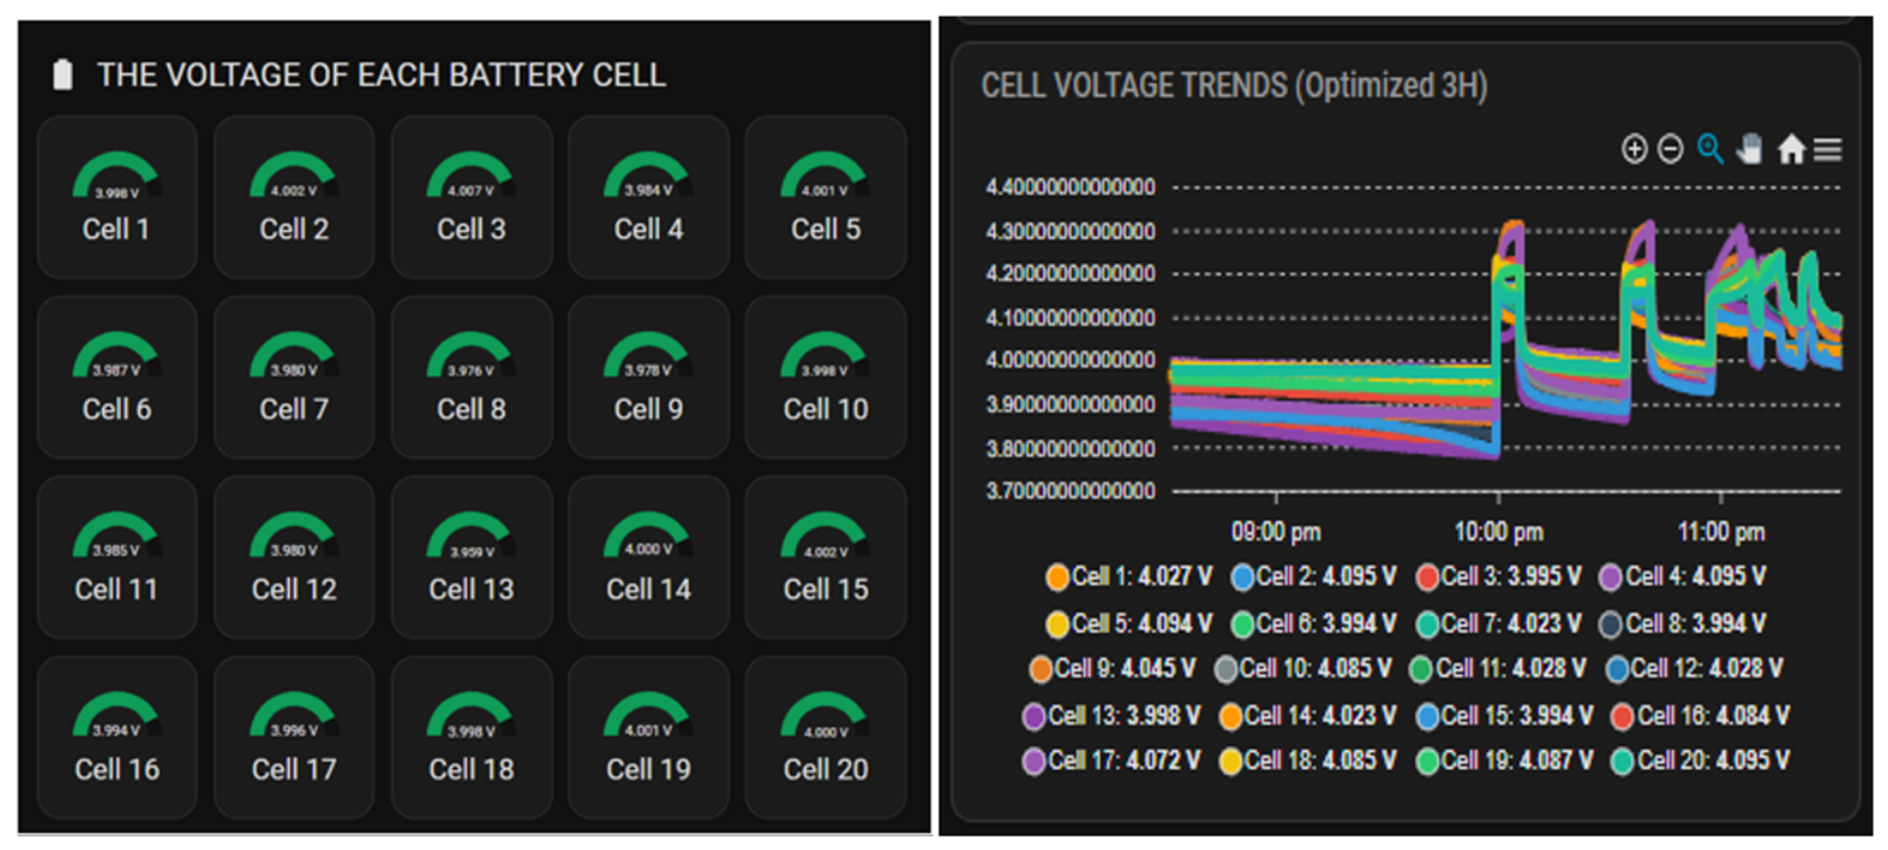
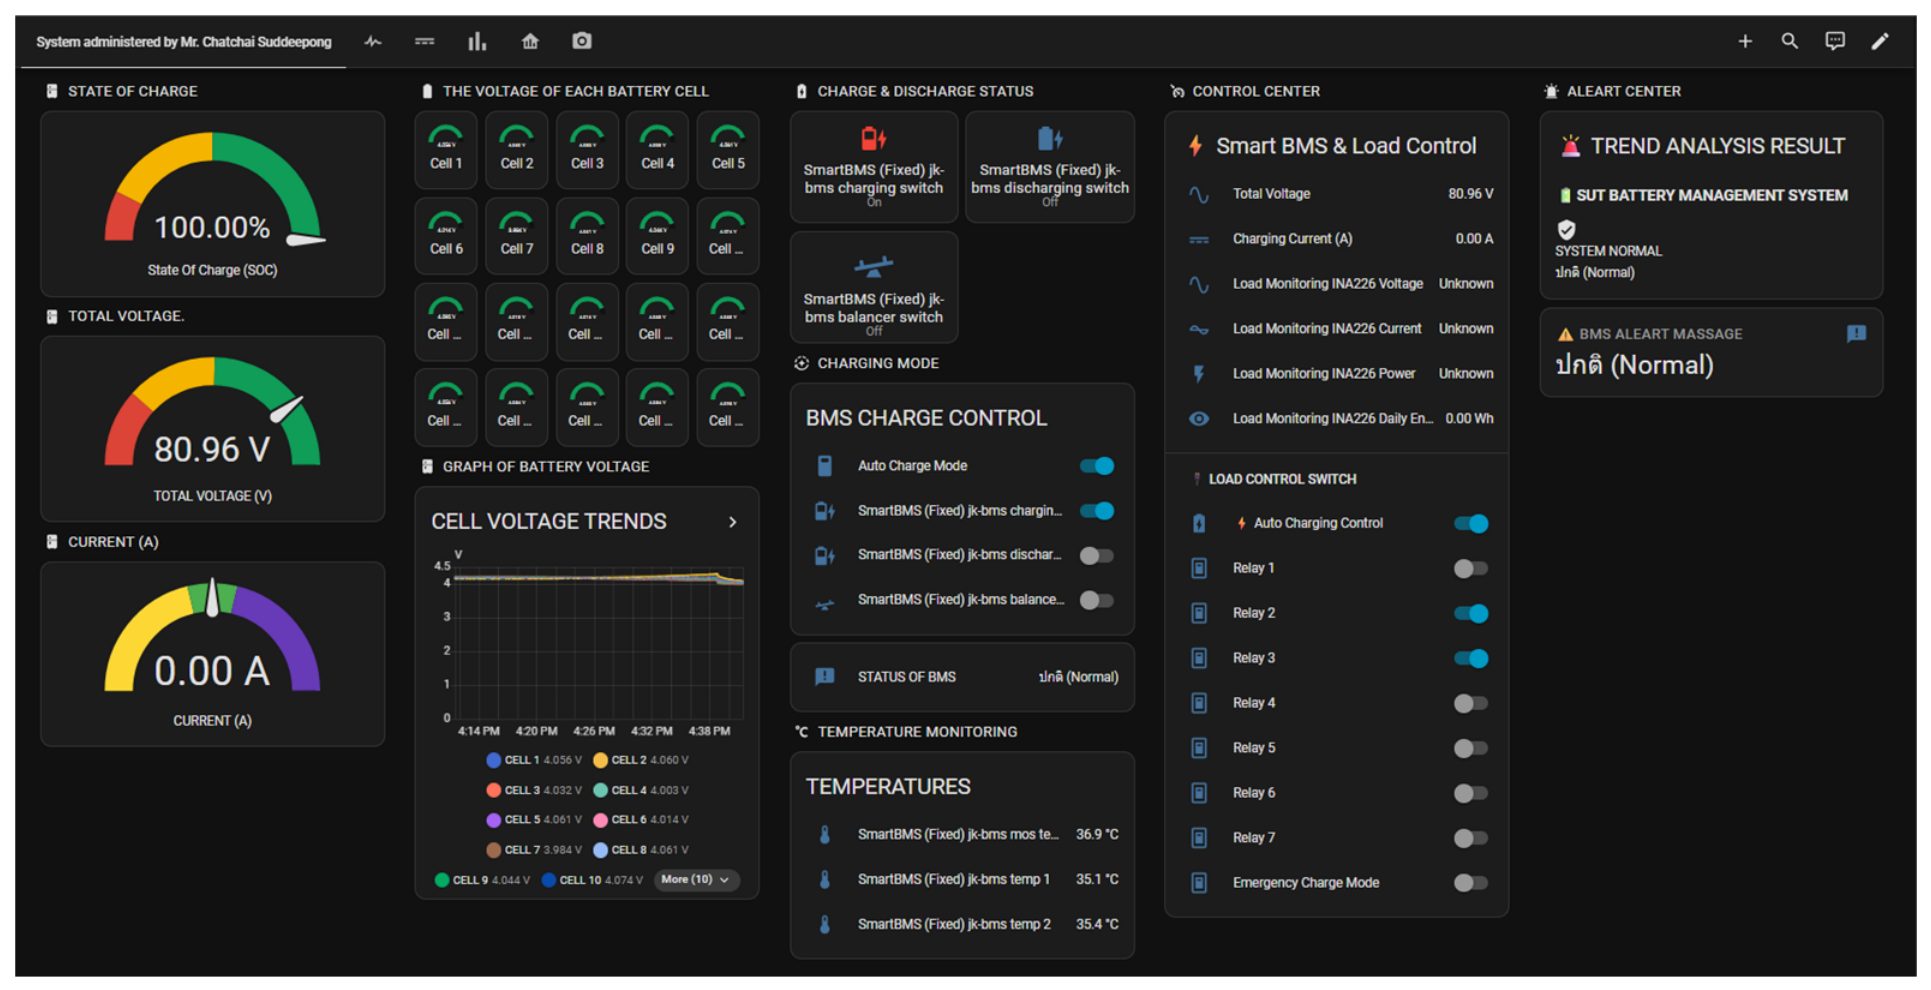
The implemented Home Assistant dashboard successfully demonstrated stable edge level visualization of continuous real time parameters for all twenty cells under dynamic operating conditions. the visual interface aggregates high-resolution voltage streams from the ESP32-S3 gateway, enabling operators to observe instantaneous cell statuses, localized voltage imbalances, and aggregate pack profiles simultaneously.
The colors indicate different system statuses: [Green] represents [normal operation], [Yellow/Orange] indicates [warnings or abnormal trends], and [Red] denotes [critical alerts or faults] as shown in Figure 20.

4.3. Quantitative Analysis of Cumulative Cell Anomalies and Degradation Mapping

To quantitatively screen early-stage degradation, the rule based heuristic anomaly algorithm evaluated continuous charge discharge cycles within the thermodynamically sensitive voltage window. Detected voltage fluctuations and divergence occurrences were systematically logged in the local database to evaluate operational severity.
The total cumulative anomaly event distribution and subsequent health status classifications for individual cell slots across the 72 V pack are summarized in Table 2.
As indicated in Table 2, the proposed screening framework evaluates individual cell health based on both continuous anomaly counts and rule based triggering algorithms. Cells under standard profiles, exhibiting minimal or localized transient fluctuations, generally maintained a Normal status. For instance, even though Cell 11 and Cell 14 registered 109 and 5 anomaly events respectively due to non-critical high-frequency sensory noise, their underlying electrochemical parameters stayed within secureoperational bounds, thus remaining categorized as Normal.
Conversely, specific cells were proactively flagged with a Warning status to indicate early-stage, minor electrochemical drift or internal resistance variation. Interestingly, Cells 3, 9, 10, 13, and 15 were assigned a Warning status despite zero or low anomaly event records, illustrating that the underlying algorithm accounts for subtle steady-state voltage divergence rather than raw event accumulation alone. Similarly, Cell 7 registered three anomaly events but stayed within the safety margins, preserving its normal status.
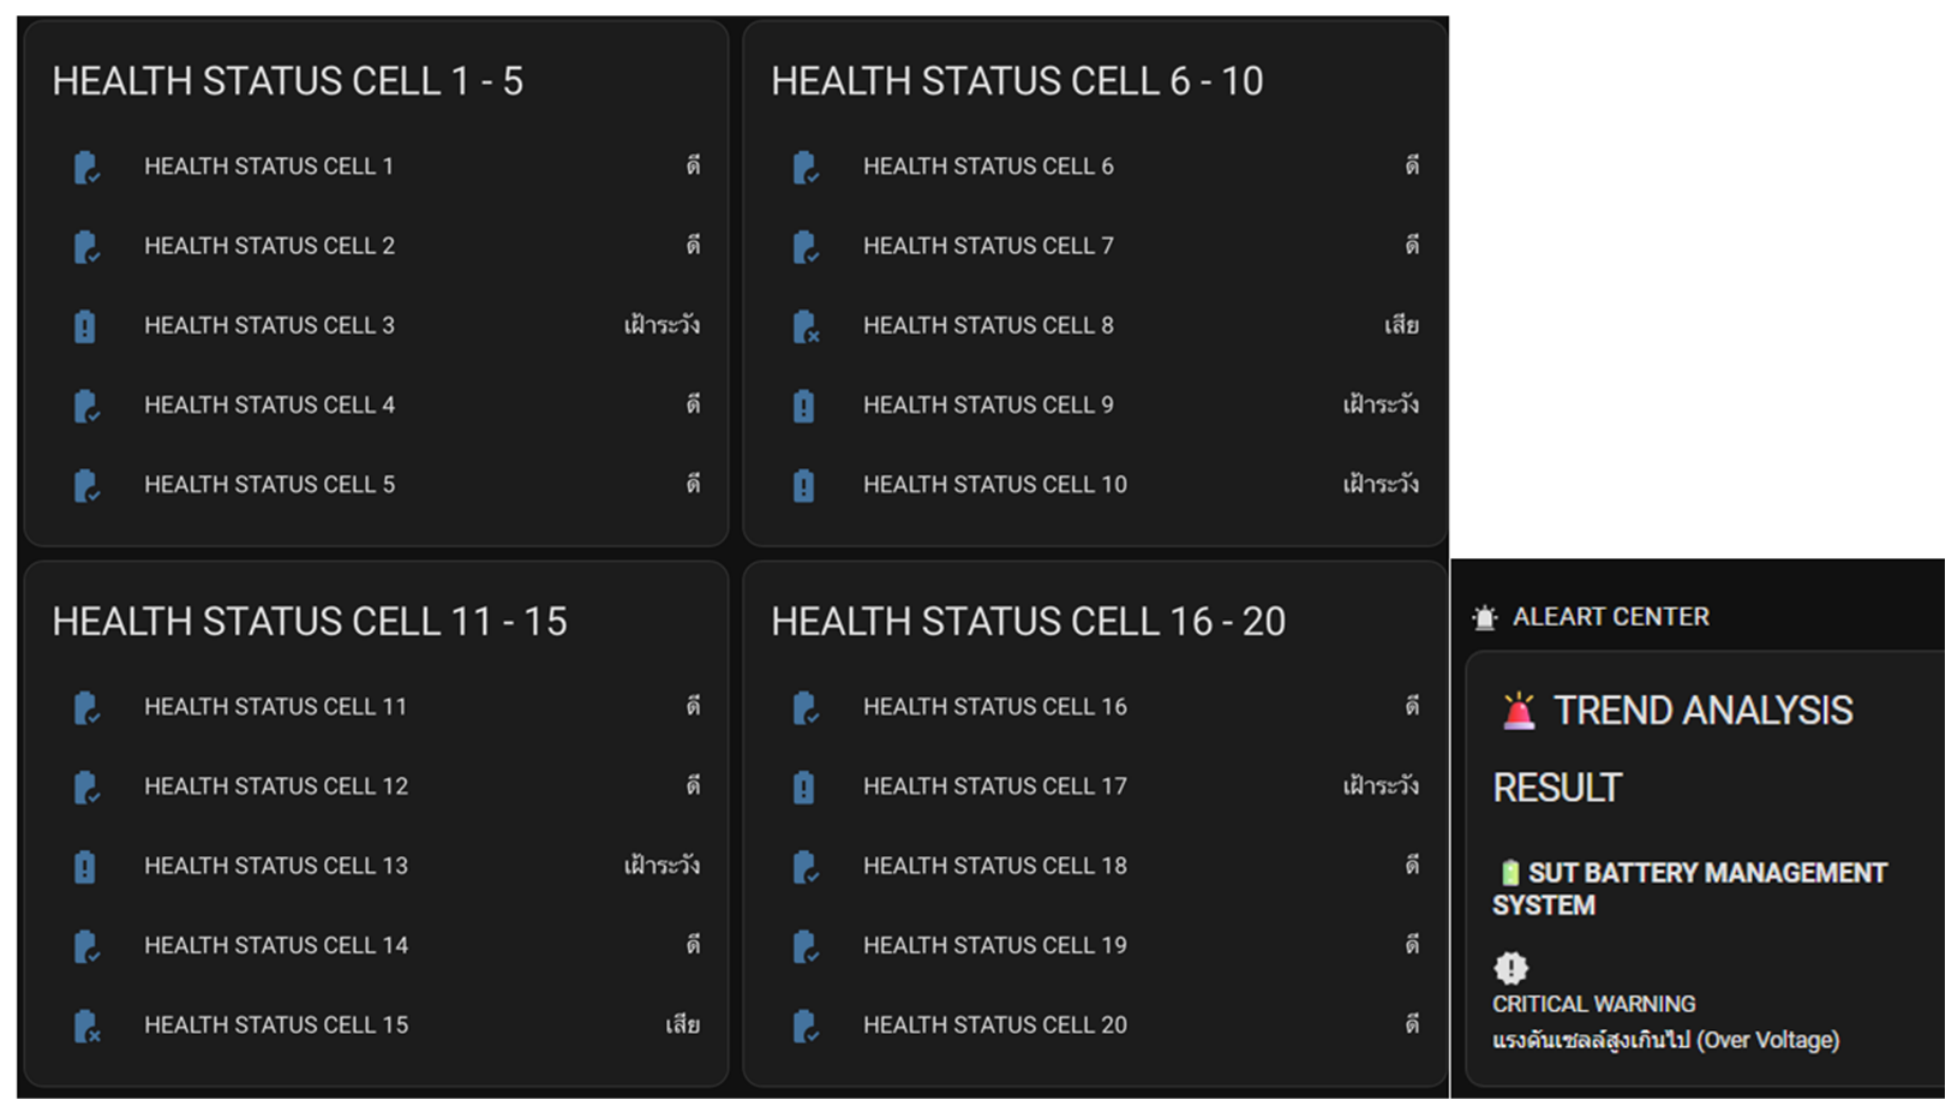
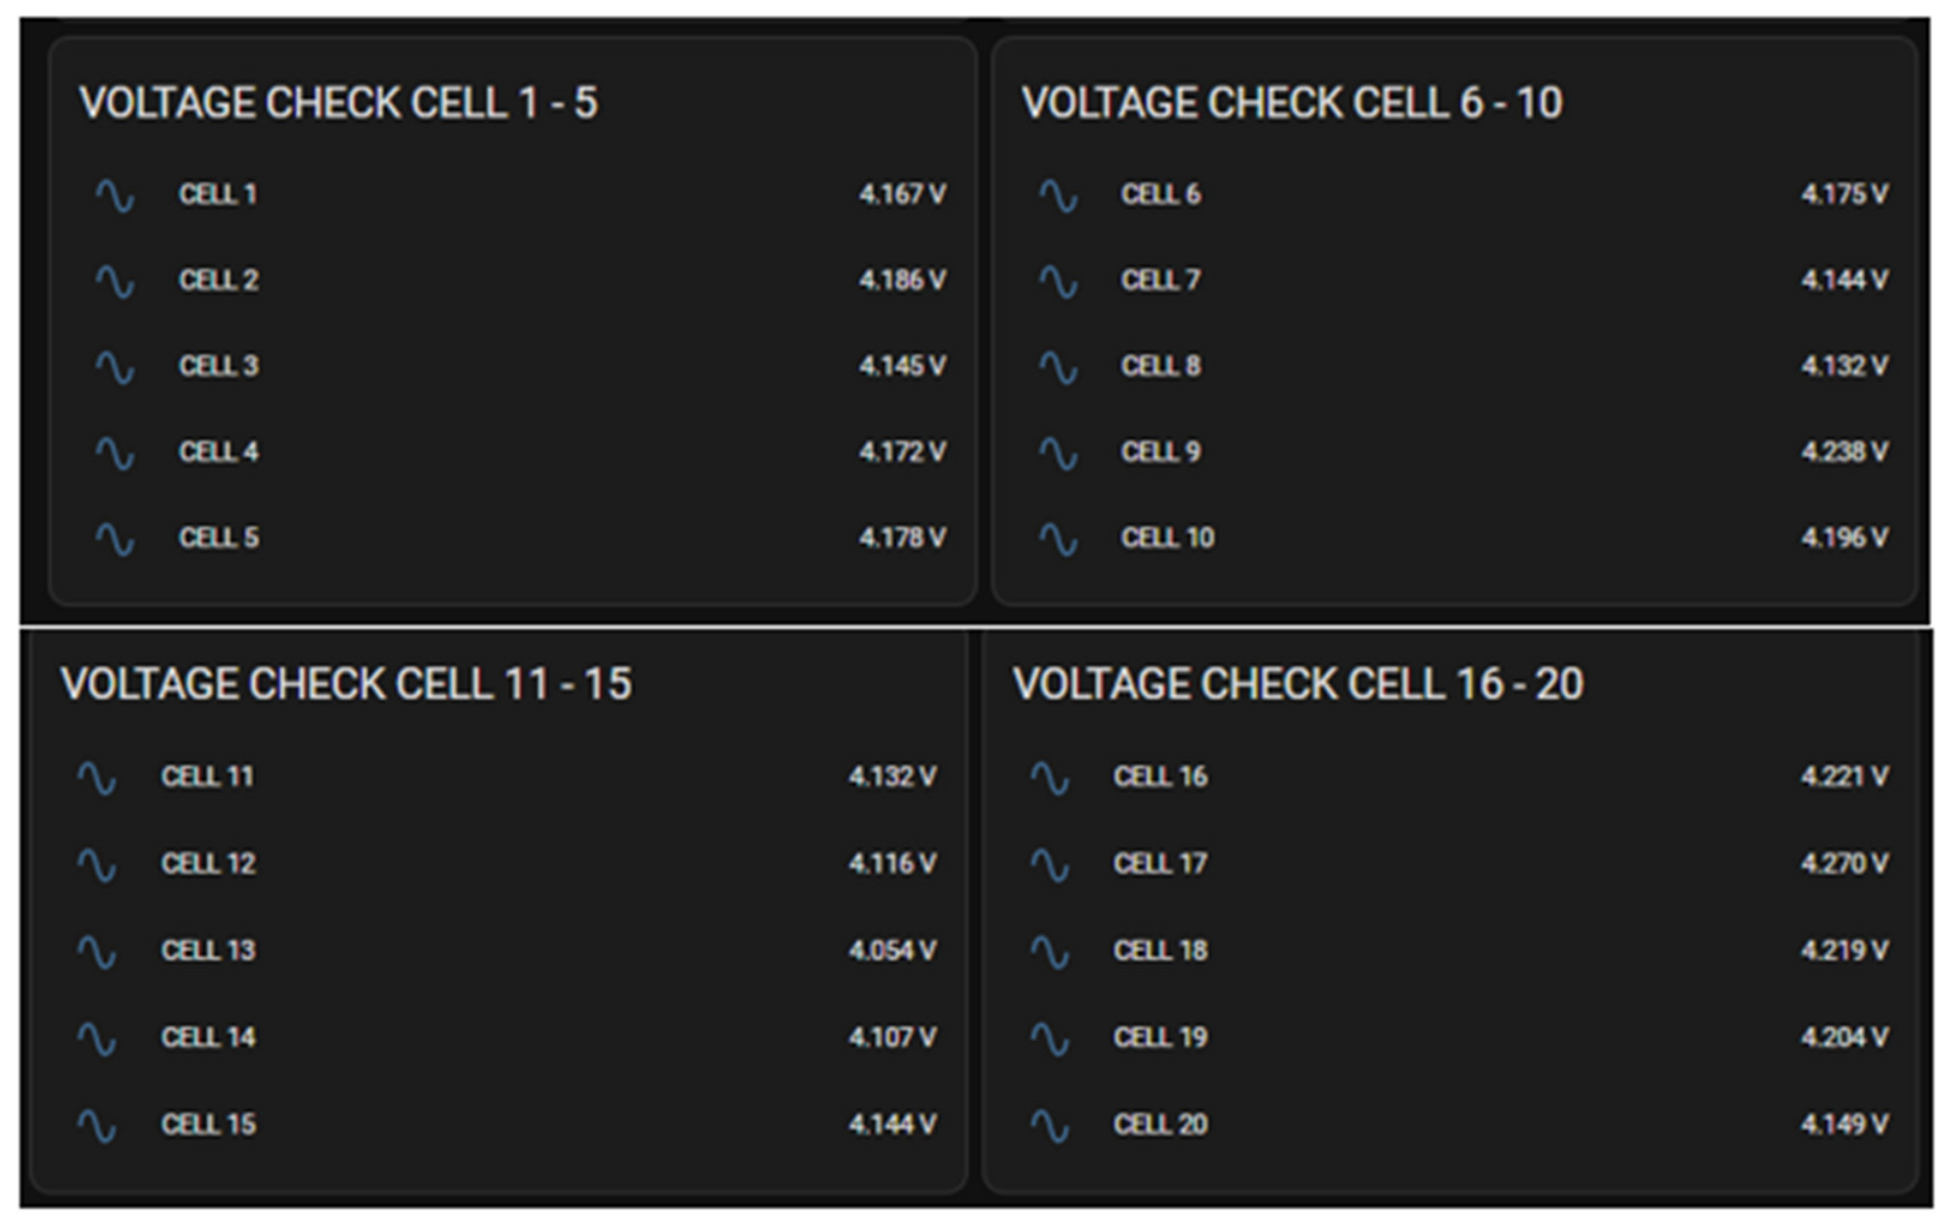
Crucially, Cell 8 and Cell 17 reached the severe boundary criteria, accumulating six anomaly events each and officially triggering an immediate Critical Alert on the user interface. These localized critical behaviors serve as explicit early-stage indicators for selective predictive maintenance before catastrophic pack imbalance occurs. Furthermore, upon physical replacement or maintenance of these degraded cells, a manual reset function integrated into the dashboard purges the historical error logs of that specific cell slot, thereby re-initializing the cumulative counter to zero for subsequent monitoring cycles. To present these analytical statuses intuitively to station operators, the edge computing gateway continuously synchronizes the processed cell health states with the front-end user interface. Figure 21 illustrates a real time operational snapshot of the localized monitoring dashboard generated during the evaluation cycle. Within this user interface, the health profiles are divided into four distinct monitoring groups (Cells 1–5, 6–10, 11–15, and 16–20) to ensure high standability.
The textual statuses on the dashboard dynamically mirror the algorithmic outputs; cells labeled as “ดี” signify a Normal operating condition, while those tagged with “เฝ้าระวัง” proactively flag a Warning state due to minor electrochemical drift. Crucially, cells that violate the safety threshold or exhibit persistent degradation are immediately designated as “เสีย”, triggering a high visibility Critical alert. This visual management layout allows maintenance personnel to pinpoint anomalous cells instantly without manually sorting through raw voltage data logs as shown in Figure 21.

4.4. Frequency-Based Anomaly Detection Results

The proposed monitoring and visualization system can effectively display critical data and alert the user under various conditions. First, a high-voltage cell alert is triggered when any cell voltage exceeds 4.15 V, indicating an overcharge risk. Second, a low-voltage cell alert occurs when any cell voltage drops below 3.00 V, signaling potential over discharging. Third, a high-temperature cell alert is activated if any cell temperature surpasses 45 °C to prevent thermal issues.
Finally, an abnormal cell voltage trend alert is generated when the system detects an unusual pattern or significant variance among the cell voltages, indicating premature degradation before a fixed threshold is breached.
The observed charging behavior indicates that excessive charging voltage not only increases the likelihood of overvoltage conditions but also amplifies voltage divergence and instability among individual cells. Although conventional BMS protectionmechanisms successfully prevent immediate safety hazards by disconnecting the charging process, these threshold-based responses provide limited information regarding the progression and recurrence of abnormal behavior over time. Therefore, evaluating anomaly frequency and accumulation patterns becomes essential for distinguishing isolated abnormal events from persistent degradation-related behavior. By comparing the anomaly characteristics observed under different charging conditions, the proposed framework enables a more comprehensive assessment of charging-induced stress and its influence on long-term battery stability.
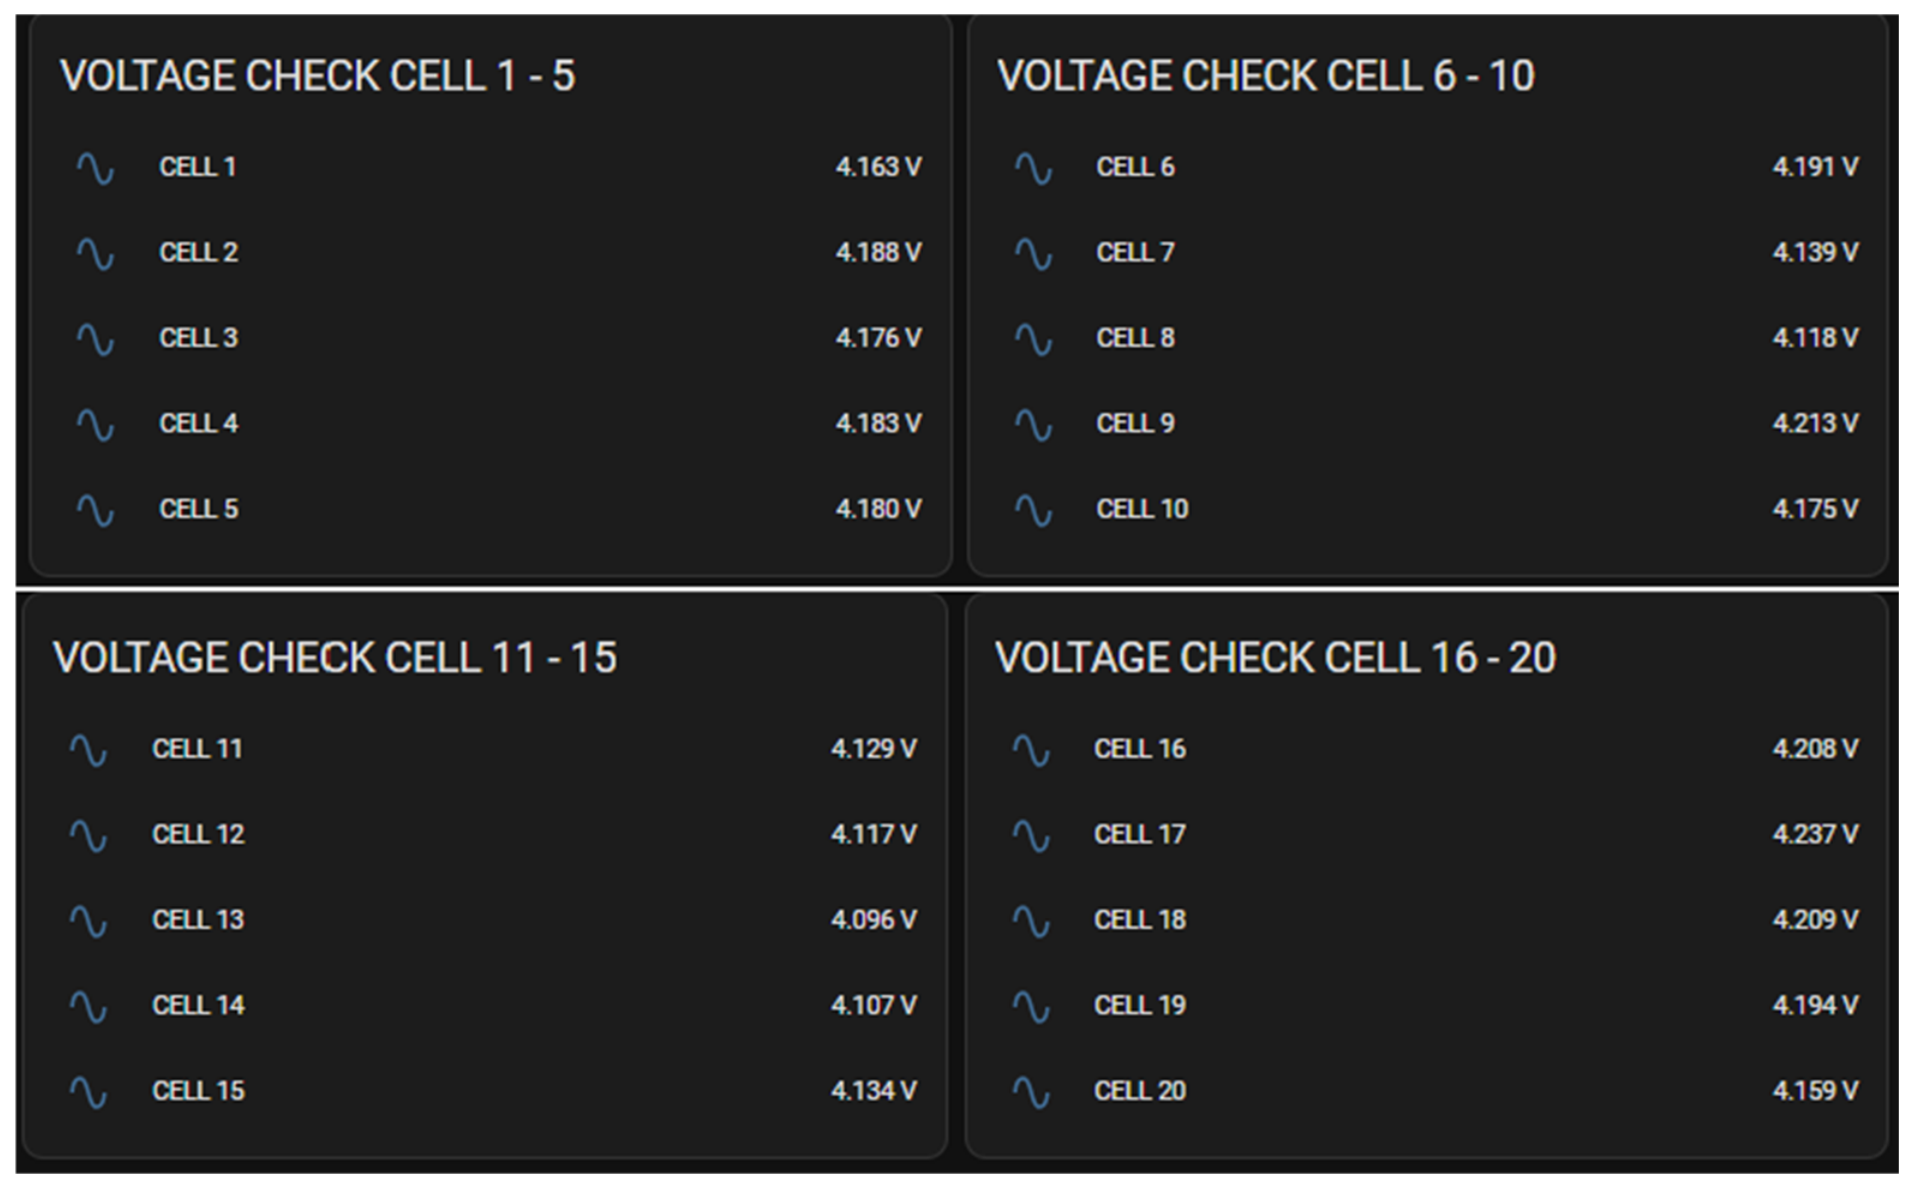
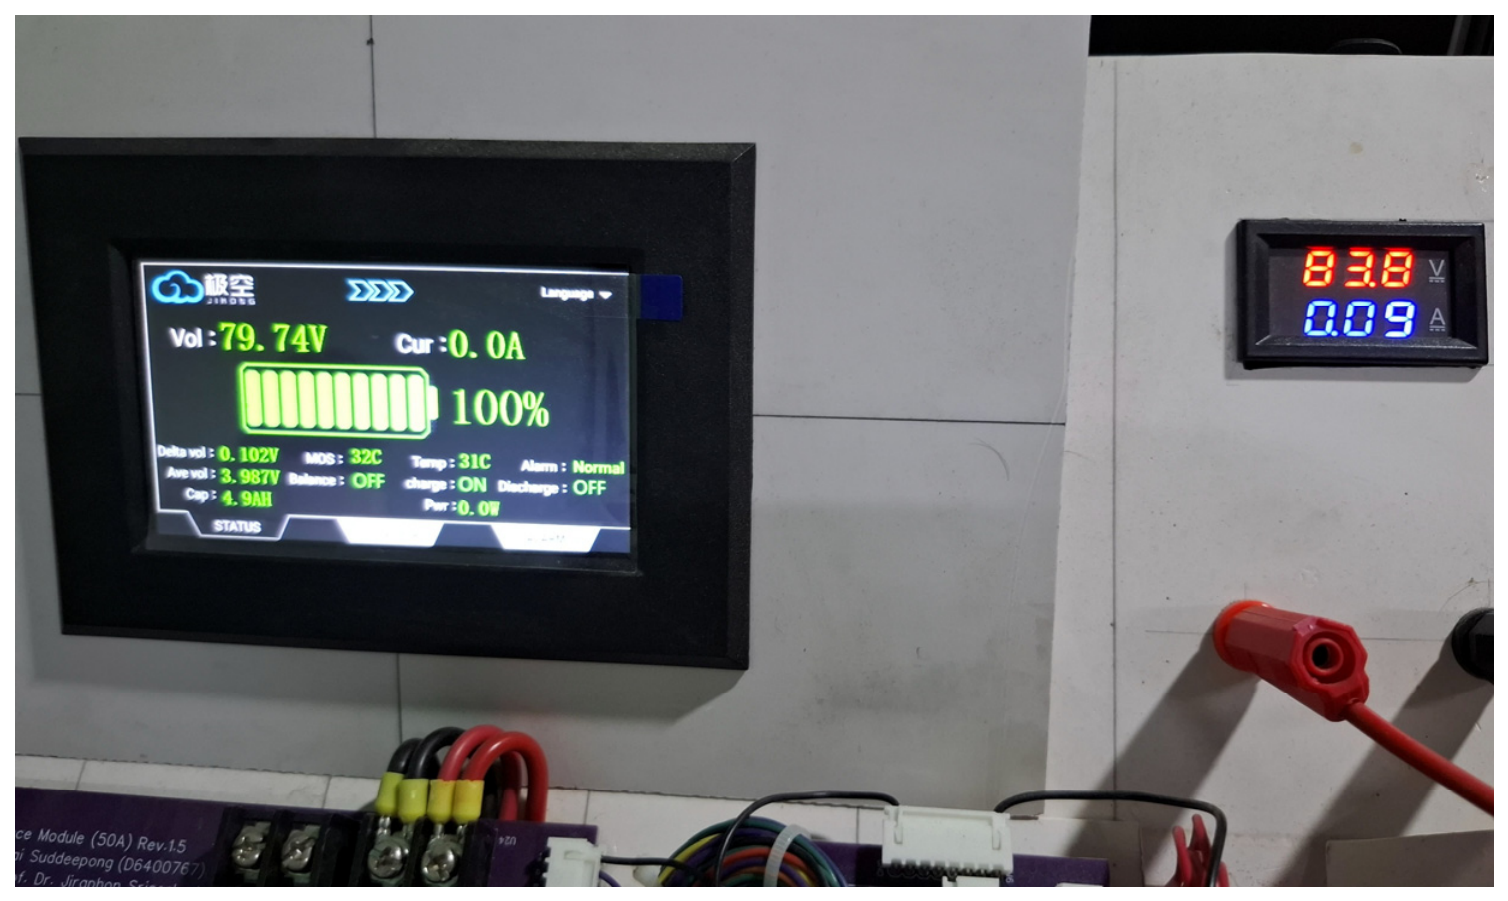
Therefore, charging at 84.8 V and charging at 83.8 V produced significantly different charging behaviors and battery responses. The comparative results obtained from both charging conditions are summarized in Figure 22.
In comparison, charging at 83.8 V, achieved by reducing the charging voltage by approximately 1 V from the original charging condition, produced significantly improved charging behavior. Under this reduced charging condition, individual cell voltages remained below the predefined overvoltage threshold of 4.25 V, thereby preventing excessive voltage stress on specific cells.
The reduced charging voltage also resulted in lower thermal generation during the charging process, indicating reduced electrochemical stress within the battery pack. Consequently, the frequency of system errors and protective events triggered by abnormal charging conditions was substantially reduced compared with the 84.8 V charging condition.
These observations suggest that even a relatively small reduction in charging voltage can significantly improve charging stability, reduce voltage divergence between cells, and minimize abnormal operating conditions. Furthermore, the results demonstrate that charging voltage optimization can effectively improve battery safety and reduce long-term degradation risks while maintaining stable battery operation.
Overall, the experimental results demonstrate that charging-voltage selection significantly influences battery behavior, anomaly occurrence, and long-term operating stability. The comparison between 84.8 V and 83.8 V charging conditions confirms that relatively small reductions in charging voltage can substantially reduce overvoltage events, thermal stress, abnormal cell behavior, and system protection triggers. These findings further support the proposed frequency-based anomaly accumulation framework, demonstrating its capability to identify charging-induced degradation patterns and provide practical guidance for improving battery safety and long term operational reliability. The detailed comparison results obtained under both charging conditions are illustrated in Figure 23.
The experimental results demonstrate that reducing the charging voltage byapproximately 1 V significantly improved charging stability and reduced abnormal battery behavior during repeated charging cycles. Compared with the 84.8 V charging condition, the reduced charging voltage resulted in lower cell stress, improved voltage consistency among cells, and fewer abnormal operating conditions.
The experimental observations further indicate that operation under the 83.8 V charging condition maintained individual cell voltages within a narrower operating range, typically between approximately 4.20–4.23 V, thereby reducing excessive voltage excursions near the upper charging boundary. As a result, the probability of triggering protection mechanisms decreased, while voltage imbalance during the constant voltage charging phase was reduced, leading to more uniform charging behavior across the battery pack.
To further evaluate the influence of charging voltage on degradation relatedbehavior, anomaly frequency accumulation was analyzed for each individual cell across the entire battery pack. The observed reduction in anomaly frequency under the optimized charging condition suggests that charging-voltage optimization can effectively mitigate repetitive abnormal operating patterns associated with early stage degradation mechanisms.
These findings demonstrate that relatively small adjustments in charging parameters can produce measurable improvements in system stability and battery reliability, highlighting the importance of adaptive charging strategies for long-term battery health management, predictive maintenance, and lifetime extension applications as shown in Figure 24.

4.5. Real Time Cell Voltage Monitoring

The monitoring dashboard successfully displayed real time voltage measurements for all 20 cells within the battery pack. The visualization interface allowed operators to observe:
-
Instantaneous voltage levels;
-
Pack voltage trends;
-
Voltage imbalance between cells.
This visualization significantly improves situational awareness compared with conventional BMS interfaces as shown in Figure 25.
The dashboard displays voltage profiles of all 20 cells, enabling real time monitoring of voltage variation and imbalance across the battery pack.

4.6. Detection of Voltage Instability

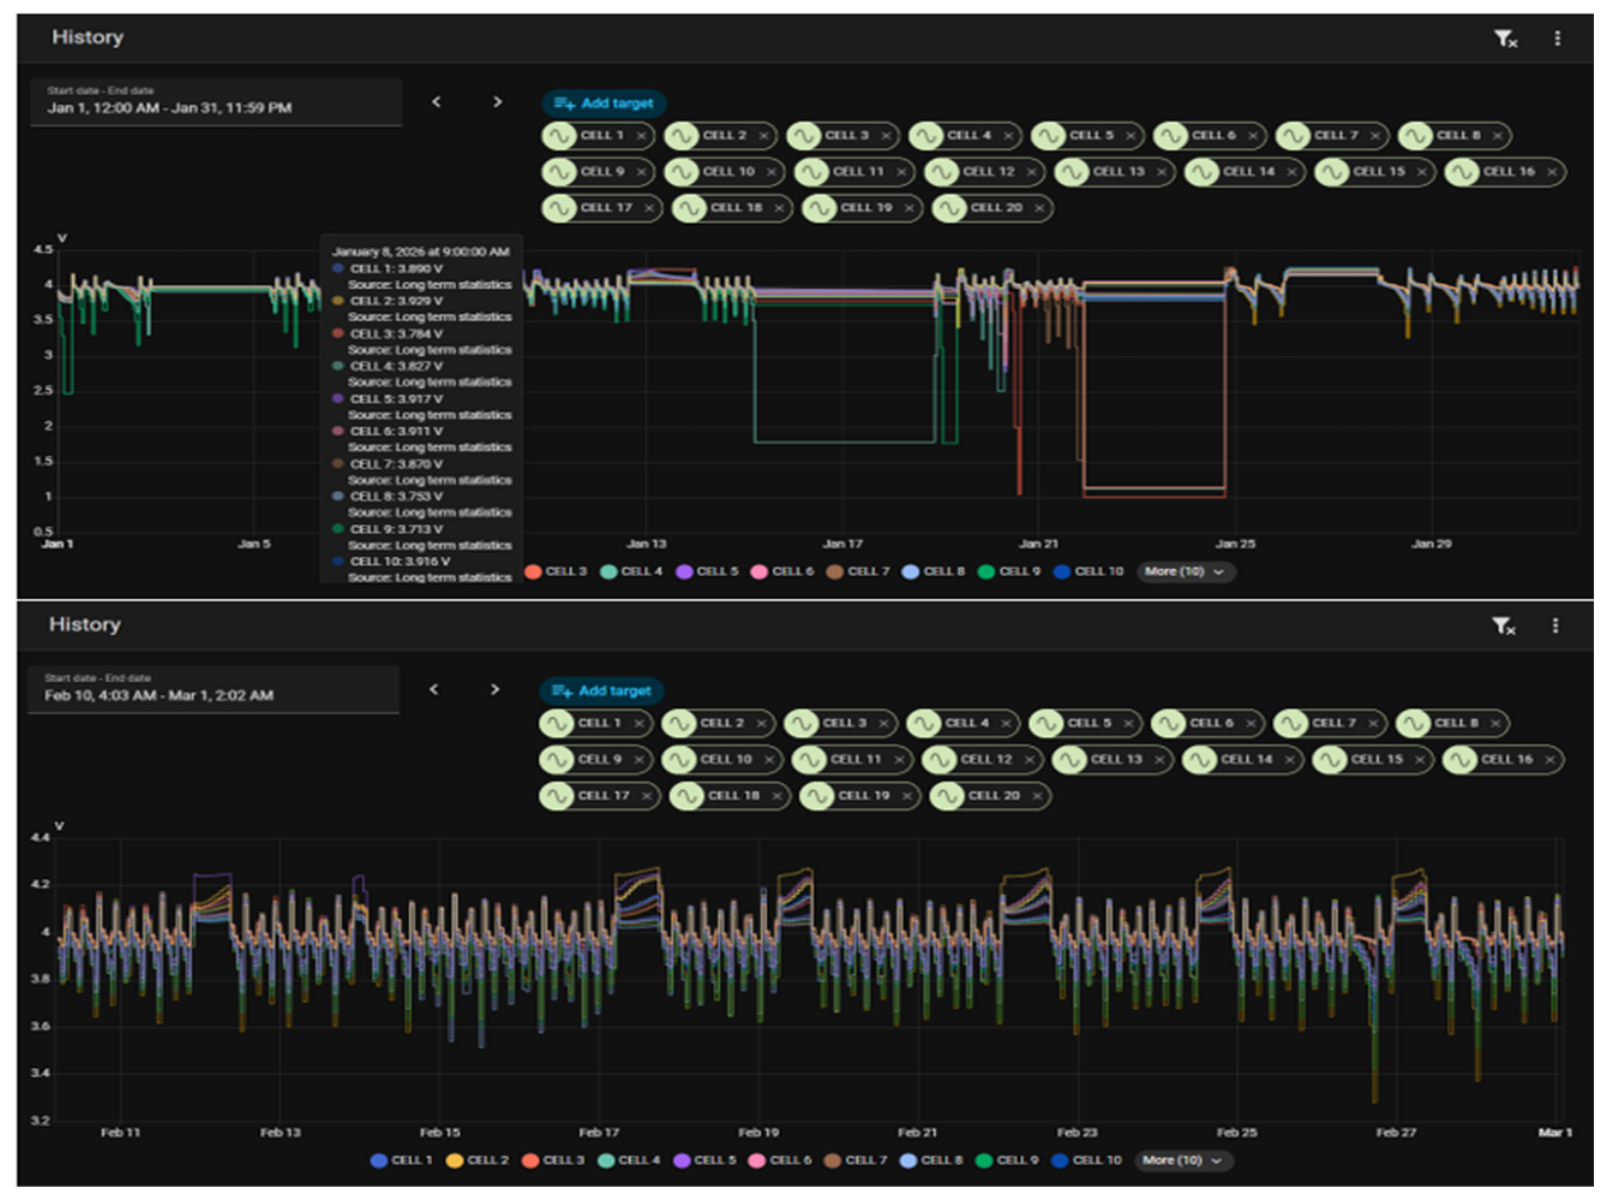
During experimental operation, several cells exhibited short term voltage oscillations.
The proposed monitoring system successfully detected these anomalies and recorded their occurrence frequency.
Cells exhibiting repeated fluctuations were flagged by the anomaly detectionalgorithm and highlighted within the monitoring dashboard.
These results demonstrate the effectiveness of the proposed heuristic method in identifying unstable cell behavior, as clearly visualized in Figure 26.
Short-term voltage oscillations are detected and highlighted, demonstrating theeffectiveness of the heuristic anomaly detection method in identifying unstable cell behavior.
The colors indicate different system statuses: (Green) represents (normal operation), (Yellow/Orange) indicates (warnings or abnormal trends), and (Red) denotes (critical alerts or faults).

4.7. Long-Term Trend Observation

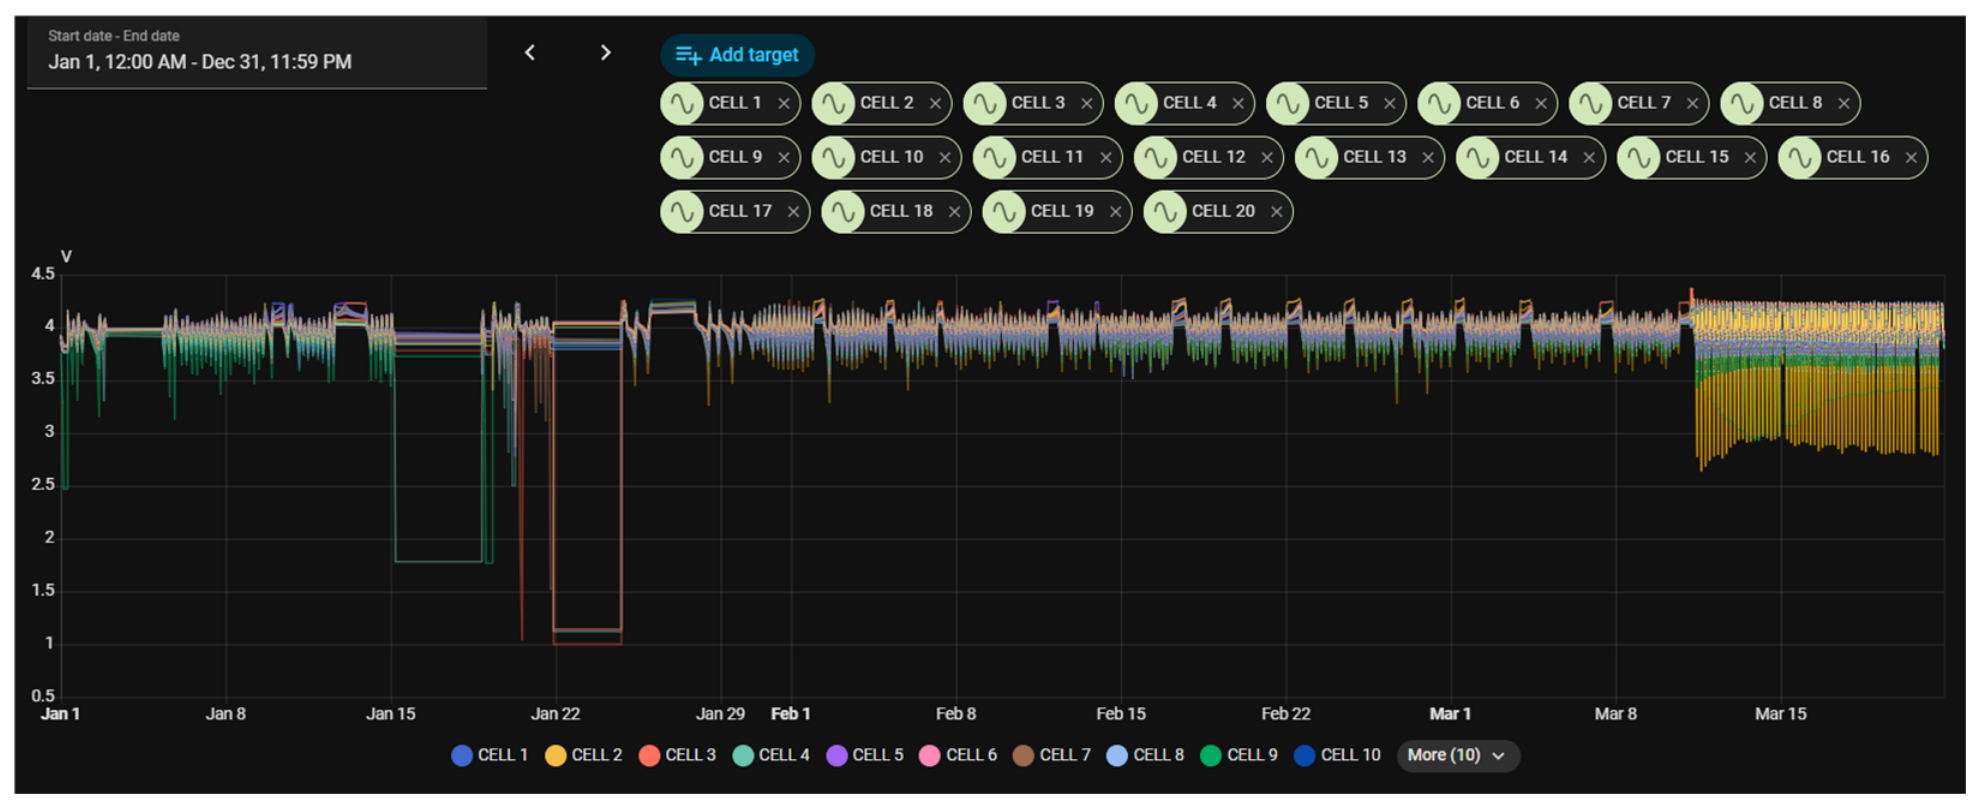
Continuous monitoring enabled the identification of long-term voltage divergence between cells.
Certain cells demonstrated gradual voltage deviation from the pack average, suggesting possible early-stage degradation.
The ability to visualize these trends provides valuable insight into battery health evolution.
The observed trend confirms the capability of the system to detect early-stage degradation.
During experimental operation, it was observed that both charging voltage and current have a significant impact on battery health and degradation behavior.
In the discharging condition, the battery exhibited stable operation with minimal thermal effects and negligible impact on cell degradation. However, during the charging process, thermal accumulation and overvoltage conditions were frequently observed, particularly under high charging current as shown in Figure 27.
Gradual voltage deviation among cells is observed over time, indicating early stage degradation and imbalance within the battery pack.
Experimental results indicate that excessive charging voltage and current accelerate battery degradation. Initially, the charging voltage was set to 84.8 V for the 72 V battery pack. This resulted in increased thermal stress and a higher frequency of anomaly detection. And To mitigate this issue, the charging voltage was reduced to 83.5 V. This adjustment significantly reduced abnormal behavior, including.
-
Decreased anomaly occurrence frequency;
-
Reduced thermal effects during charging;
-
Improved voltage stability across cells.
A maximum cell voltage deviation (ΔV) of approximately 0.15–0.18 V was observed under high charging conditions, indicating imbalance. After optimization, the deviation was reduced to below 0.1 V, suggesting improved cell uniformity as shown in Figure 28.
Reducing the charging voltage from 84.8 V to 83.5 V significantly decreases anomaly occurrence, reduces thermal stress, and improves voltage stability across cells.
The anomaly occurrence frequency was significantly reduced after voltage optimization, confirming the effectiveness of the proposed control strategy.
These results highlight the critical influence of charging conditions on batterydegradation and demonstrate the importance of proper voltage regulation.
Furthermore, it was observed that allowing cell voltage to drop below 3.5 V contributes to accelerated degradation. Therefore, maintaining the cell voltage above 3.5 V is critical for prolonging battery lifespan.

5. Discussion

The experimental results demonstrate that the proposed monitoring architecture offers significant advantages over conventional BMS frameworks. While traditional BMS implementations primarily focus on immediate safety protections such as overvoltage, undervoltage, and overcurrent limits they inherently lack the capability to provide detailed insights into gradual battery degradation. By contrast, the proposed system enables cell level historical trend analysis, allowing for the identification of abnormal patterns well before safety thresholds are triggered.
A key strength of this framework is the architectural separation between hardware monitoring and analytical processing. This decoupling allows the system to be integrated into existing BMS hardware without requiring extensive modifications, providing a cost-effective pathway toward predictive maintenance. Furthermore, while advanced monitoring frameworks in the recent literature increasingly incorporate clou based analytics and machine learning (ML), these approaches often demand substantial computational resources and large training datasets. Our heuristic, frequency–based method achieves effective anomaly detection with significantly lower computational overhead, making it highly suitable for resource-constrained IoT applications.
However, certain limitations should be acknowledged. The current anomaly detection relies on heuristic rules rather than complex statistical or AI-based models. While this ensures low-cost deployment, future research could incorporate lightweight machine learning algorithms to further enhance prediction accuracy and adapt to a wider variety of battery chemistries. Additionally, expanding the system to monitor thermal distribution alongside voltage trends could provide a more holistic view of battery health.

6. Conclusions

This study successfully demonstrates an interpretable, low-cost, and scalable IoT-based battery monitoring architecture for trend-oriented degradation screening. Rather than relying on complex machine learning or cloud-dependent computations, the system integrates a physical first-order modeling framework with a lightweight edge heuristic to isolate anomalous cells.
Experimental results validate that operating battery cells within highly sensitive low-voltage and high-voltage boundaries significantly influences long-term stability. Specifically, maintaining individual cell voltages above the non-linear threshold of 3.5 V prevents localized stress. Furthermore, optimizing the maximum charging pack threshold from 84.8 V down to 83.5 V successfully suppressed severe cell-to-cell voltage deviations from 0.18 V to below 0.1 V, eliminating overvoltage faults and reducing thermal accumulation [66,67,68,69,70]. The combination of multi-resolution dashboard visualization and frequency-based anomaly tracking provides a practical, edge-deployable methodology for predictive maintenance in electric mobility and decentralized energy storagenetworks.

Author Contributions

Conceptualization, C.S., S.N. and U.L.; Methodology, C.S., S.N. and U.L.; Software, C.S. and N.D.; Validation, C.S., S.N., N.D. and U.L.; Formal analysis, C.S., S.N. and U.L.; Investigation, C.S., S.N. and U.L.; Resources, C.S., N.D. and U.L.; Data curation, C.S. and S.N.; Writing—original draft, C.S.; Writing—review & editing, C.S., S.N., N.D. and U.L.; Visualization, C.S.; Supervision, S.N. and U.L.; Project administration, C.S., S.N. and U.L.; Funding acquisition, S.N. and U.L. All authors have read and agreed to the published version of the manuscript.

Funding

This research received no external funding.

Data Availability Statement

The data presented in this study are available within the article.

Conflicts of Interest

The authors declare no conflict of interest.

References

  1. Liu, G.; Deng, Z.; Xu, Y.; Lai, L.; Gong, G.; Tong, L.; Zhang, H.; Li, Y.; Gong, M.; Yan, M.; et al. Lithium-Ion Battery State of Health Estimation Based on CNN-LSTM-Attention-FVIM Algorithm and Fusion of Multiple Health Features. Appl. Sci. 2025, 15, 7555. [Google Scholar] [CrossRef]
  2. Xu, G. State-of-Charge Estimation Method for Lithium-Ion Batteries Based on Competitive SIR Model. Front. Energy Res. 2022, 10, 984107. [Google Scholar] [CrossRef]
  3. Ding, T.; von Jouanne, A.; Dong, L.; Fang, X.; Fang, T.; Rivas, P.; Yokochi, A. A Review of AI Applications in Lithium-Ion Batteries: From State-of-Health Estimations to Prognostics. Energies 2026, 19, 562. [Google Scholar] [CrossRef]
  4. Krishna, G.; Singh, R.; Gehlot, A.; Almogren, A.; Altameem, A.; Ur Rehman, A.; Hussen, S. Advanced battery management system enhancement using IoT and ML for predicting remaining useful life in Li-ion batteries. Sci. Rep. 2024, 14, 30394. [Google Scholar] [CrossRef] [PubMed]
  5. Karmakar, S.; Sengupta, S.; Pal, N.; Choudhary, Y.V.; Jana, A.; Kundu, S.K. Lithium-Ion Batteries in EVs: Comparative Analysis and BMS Innovations. In Proceedings of the 2025 8th International Conference on Electronics, Materials Engineering & Nano-Technology (IEMENTech), Kolkata, India, 31 January–2 February 2025; pp. 1–6. [Google Scholar] [CrossRef]
  6. Jafari, S.; Byun, Y.-C. Prediction of the Battery State Using the Digital Twin Framework Based on the Battery Management System. IEEE Access 2022, 10, 124685–124696. [Google Scholar] [CrossRef]
  7. Tuyen, N.T.; Vien, N.X.; Phuc, N.V.T.; Anh, D.N.; Tuan, M.A.; Khoi, N.M. Design and Implementation of Battery Management Systems (BMS) for Electric Vehicles (EVs). In Proceedings of the 2024 7th International Conference on Green Technology and Sustainable Development (GTSD), Ho Chi Minh City, Vietnam, 25–26 July 2024; pp. 253–258. [Google Scholar] [CrossRef]
  8. Madani, S.S.; Ziebert, C.; Vahdatkhah, P.; Sadrnezhaad, S.K. Recent Progress of Deep Learning Methods for Health Monitoring of Lithium-Ion Batteries. Batteries 2024, 10, 204. [Google Scholar] [CrossRef]
  9. Ding, T.; Xiang, D.; Sun, T.; Qi, Y.; Zhao, Z. AI-Driven Prognostics for State of Health Prediction in Li-ion Batteries: A Comprehensive Analysis with Validation. In Proceedings of the 2025 6th International Conference on Electrical Technology and Automatic Control (ICETAC), Nanjing, China, 20–22 June 2025; pp. 22–28. [Google Scholar] [CrossRef]
  10. Varatharaju, V.M.; Venkatesh Kumar, N.; Pandi, V.S.; D, S.; Kumar, C.S.; Suresh Kumar, K. Advanced Battery Management Systems (BMS) for Electric Vehicles: Ensuring Efficiency, Safety, and Longevity in Energy Storage. In Proceedings of the 2024 1st International Conference on Sustainability and Technological Advancements in Engineering Domain (SUSTAINED), Faridabad, India, 13–14 December 2024; pp. 1017–1022. [Google Scholar] [CrossRef]
  11. Menye, J.S.; Camara, M.-B.; Dakyo, B. Lithium Battery Degradation and Failure Mechanisms: A State-of-the-Art Review. Energies 2025, 18, 342. [Google Scholar] [CrossRef]
  12. Adarsh, A.; Sowmya, R. Advance battery management system for electric vehicle a comprehensive review. In Proceedings of the 2026 IEEE International Students’ Conference on Electrical, Electronics and Computer Science (SCEECS), Bhopal, India, 31 January–1 February 2026; pp. 1–14. [Google Scholar] [CrossRef]
  13. Kumar, G.K.N.; Thakur, A. Fire In Electric Vehicles: A Review. In Proceedings of the 2022 IEEE 1st Industrial Electronics Society Annual On-Line Conference (ONCON), Kharagpur, India, 9–11 December 2022; pp. 1–6. [Google Scholar] [CrossRef]
  14. Karthick, A.; Kilari, N.; Kaliappan, S.; Kavitha, P. Data-Driven GRU Model for Reliable SoC Prediction in EV Battery Systems. In Proceedings of the 2025 9th International Conference on Electronics, Communication and Aerospace Technology (ICECA), Coimbatore, India, 5–7 November 2025; pp. 283–286. [Google Scholar] [CrossRef]
  15. Lee, J.; Wang, L.; Jung, H.; Lim, B.; Kim, D.; Liu, J.; Lim, J. Deep Neural Network with Anomaly Detection for Single-Cycle Battery Lifetime Prediction. Batteries 2025, 11, 288. [Google Scholar] [CrossRef]
  16. Kumar, R.S.; Singh, A.R.; Narayana, P.L.; Chandrika, V.S.; Bajaj, M.; Zaitsev, I. Hybrid machine learning framework for predictive maintenance and anomaly detection in lithium-ion batteries using enhanced random forest. Sci. Rep. 2025, 15, 6243. [Google Scholar] [CrossRef] [PubMed]
  17. Zhou, L.; Garg, A.; Gao, L. A Temperature Control Framework for Battery Based on Digital Twin. In Proceedings of the 2025 8th International Conference on Energy, Electrical and Power Engineering (CEEPE), Wuxi, China, 25–27 April 2025; pp. 708–713. [Google Scholar] [CrossRef]
  18. Zangaruche, S.J.; Pakhare, R.D.; Gadekar, S.M.; Sangelia, S.D.; Allagi, S.B.; Sonwalkar, P.K. Edge AI-Driven Battery Management for Electric Vehicles: Models, Hardware, and Future Directions. In Proceedings of the 2025 Global Conference on Information Technology and Communication Networks (GITCON), Belagavi, India, 29–31 August 2025; pp. 1–6. [Google Scholar] [CrossRef]
  19. Pooyandeh, M.; Sohn, I. Smart Lithium-Ion Battery Monitoring in Electric Vehicles: An AI-Empowered Digital Twin Approach. Mathematics 2023, 11, 4865. [Google Scholar] [CrossRef]
  20. Eltamaly, A.M.; Almutairi, Z.; Al-Senaidi, S.H. Real-Time Self-Learning Digital Twin for Lithium-Ion Battery Energy Storage Systems in Smart Grids. Processes 2026, 14, 1864. [Google Scholar] [CrossRef]
  21. Li, D.; Nan, J.; Burke, A.F.; Zhao, J. Battery Prognostics and Health Management: AI and Big Data. World Electr. Veh. J. 2025, 16, 10. [Google Scholar] [CrossRef]
  22. Navidi, S.; Thelen, A.; Li, T.; Hu, C. Physics-Informed Machine Learning for Battery Degradation Diagnostics: A Comparison of State-of-the-Art Methods. Energy Storage Mater. 2024, 68, 103343. [Google Scholar] [CrossRef]
  23. Xu, H.; Zhao, F.; Guo, Y. State of Charge Estimation for Lithium-Ion Batteries: An Online Method Combining Deep Neural Network and Adaptive Kalman Filter. Processes 2025, 13, 3559. [Google Scholar] [CrossRef]
  24. Wijikumar, P.; Ray, B.; Hassan, J.; Emami, K.; Balachandran, V. A Generative Adversarial Network and Feed-Forward Neural Network Approach to Predict Health of Electric Vehicle Lithium-Ion Batteries in Extreme Temperature. IEEE Access 2025, 13, 196594–196612. [Google Scholar] [CrossRef]
  25. Khattach, O.; Moussaoui, O.; Hassine, M. End-to-End Architecture for Real time IoT Analytics and Predictive Maintenance Using Stream Processing and ML Pipelines. Sensors 2025, 25, 2945. [Google Scholar] [CrossRef] [PubMed]
  26. Liu, J.; Qin, Y.; Dai, W.; Yuen, C. A Lightweight Transfer Learning-Based State-of-Health Monitoring With Application to Lithium-Ion Batteries in Autonomous Air Vehicles. IEEE Trans. Ind. Inform. 2026, 22, 1738–1749. [Google Scholar] [CrossRef]
  27. Sundar, R.; Babu, M.S.; Saranya, S.; Latha, J.; Muthukrishnan, A.; Jayanthi, S. Integration of IoT with Smart Battery Management Systems (BMS) in Electric Vehicles (EVs): A Cloud-Connected Framework for Ongoing Battery Health Monitoring and Optimization. In Proceedings of the 2026 International Conference on Data Science, Agents and Artificial Intelligence (ICDSAAI), Chennai, India, 28–29 March 2026; pp. 1–6. [Google Scholar] [CrossRef]
  28. Sun, C.; Guo, K.; Xu, Z.; Ma, J.; Hu, D. Design and Development of Modbus/MQTT Gateway for Industrial IoT Cloud Applications Using Raspberry Pi. In Proceedings of the 2019 Chinese Automation Congress (CAC), Hangzhou, China, 22–24 November 2019; pp. 2267–2271. [Google Scholar] [CrossRef]
  29. Srinivasulu, T.; Naseer Hussain, P.; Venkatesh, M.; Mohammed Nasir, S.; Sasi Priyanka, T. Battery Monitoring System for Lithium-Ion Batteries Using IoT. J. Electron. Autom. Eng. 2025, 4, 111–119. [Google Scholar] [CrossRef]
  30. Suman, S.; Adhikari, M.S.; Payal, M. EV Battery Management System using IoT. In Proceedings of the 2023 International Conference on Smart Devices (ICSD), Dehradun, India, 2–3 May 2024; pp. 1–5. [Google Scholar] [CrossRef]
  31. Grigorescu, S.D.; Seritan, G.; Enache, B.A.; Adochiei, F.C. Open Source Architecture for Iot Based SCADA System for Smart Home. Sci. Bull. Electr. Eng. Fac. 2020, 20, 33–36. [Google Scholar] [CrossRef]
  32. Rincon Vija, F.A.; Cregut, S.; Papadopoulos, G.Z.; Montavont, N. Enabling Robust Wireless Communication for BMS on Electric Vehicles. In Proceedings of the 2021 IEEE 46th Conference on Local Computer Networks (LCN), Edmonton, AB, Canada, 4–7 October 2021; pp. 423–426. [Google Scholar] [CrossRef]
  33. Pérez-González, A.; Villa-Salazar, A.F.; Gomez-Miranda, I.N.; Velásquez-Gómez, J.D.; Romero-Maya, A.F.; Jaramillo-Duque, Á. An IoV-Based Real time Telemetry and Monitoring System for Electric Racing Vehicles: Design, Implementation, and Field Validation. Vehicles 2025, 7, 128. [Google Scholar] [CrossRef]
  34. Cao, Z.; Gao, W.; Fu, Y.; Mi, C. Wireless Battery Management Systems: Innovations, Challenges, and Future Perspectives. Energies 2024, 17, 3277. [Google Scholar] [CrossRef]
  35. Na, S.-J.; Sim, J.-U.; Kim, B.-J.; Kwon, D.-H.; Cho, I.-H. Design of Bluetooth Communication-Based Wireless Battery Management System for Electric Vehicles. IEEE Access 2024, 12, 185946–185957. [Google Scholar] [CrossRef]
  36. Samanta, A.; Sharma, M.; Locke, W.; Williamson, S. Cloud-Enhanced Battery Management System Architecture for Real time Data Visualization, Decision Making, and Long-Term Storage. IEEE J. Emerg. Sel. Top. Ind. Electron. 2025, 6, 1700–1711. [Google Scholar] [CrossRef]
  37. Ungurean, I. Integrating Fieldbus and Data-Centric Middleware: An STM32 Modbus Master Gateway for DDS-Based IIoT Systems. Technologies 2025, 13, 526. [Google Scholar] [CrossRef]
  38. Rani, R.U.; Divya, G.; Swarupa, M.L.; Navaneetha, K. IoT Based Battery Monitoring System for Electric Vehicle using ESP32. In Proceedings of the 2023 Second International Conference On Smart Technologies For Smart Nation (SmartTechCon), Singapore, 18–19 August 2023; pp. 1491–1503. [Google Scholar] [CrossRef]
  39. Christakis, I.; Orfanos, V.A.; Chalkiadakis, P.; Rimpas, D. Real time Monitoring of a Lithium-Ion Battery Module to Enhance Safe Operation and Lifespan. Eng. Proc. 2024, 82, 66. [Google Scholar] [CrossRef]
  40. Liu, Z.; Wang, Y.; He, J. Knowledge-Enhanced Time Series Anomaly Detection for Lithium Battery Cell Screening. Processes 2026, 14, 371. [Google Scholar] [CrossRef]
  41. Yu, J.; Guo, Y.; Zhang, W. Anomaly Detection for Charging Voltage Profiles in Battery Cells in an Energy Storage Station Based on Robust Principal Component Analysis. Appl. Sci. 2024, 14, 7552. [Google Scholar] [CrossRef]
  42. Lin, K.; Chen, Y.; Liu, Y.; Zhang, B. Reliability Prediction of Battery Management System for Electric Vehicles Based on Accelerated Degradation Test: A Semi-Parametric Approach. IEEE Trans. Veh. Technol. 2020, 69, 12694–12704. [Google Scholar] [CrossRef]
  43. Mon, A.A.; Swe, W. State-of-Charge Evaluation for Real time Monitoring and Evaluation of Lithium-Ion Battery Performance. Indones. J. Comput. Sci. 2024, 13, 1948–1959. [Google Scholar] [CrossRef]
  44. Chen, D.; Zhao, Q.; Zheng, Y.; Xu, Y.Y.; Chen, Y.; Ni, J.; Zhao, Y. Recent Progress in Lithium-Ion Battery Safety Monitoring Based on Fiber Bragg Grating Sensors. Sensors 2023, 23, 5609. [Google Scholar] [CrossRef] [PubMed]
  45. Wang, Y.; Zhou, G.; Wang, Y. Outlier Detection of Abnormal Cells in a Lithium-Ion Battery System Using a KNN-Based Multi-Feature Framework. In Proceedings of the 2025 3rd International Conference on Power, Grid and Energy Storage, Chengdu, China, 22–24 August 2025; pp. 552–556. [Google Scholar] [CrossRef]
  46. He, Z.; Duan, L.; Huang, W.; Zhang, C. Towards Real Time Anomaly Detection of Lithium-Ion Battery Voltage: A Novel Online Framework for Electric Vehicles. J. Phys. Conf. Ser. 2026, 3214, 012049. [Google Scholar] [CrossRef]
  47. Karmakar, S.; Bohre, A.K.; Bera, T.K. Recent Advancements in Cell Balancing Techniques of BMS for EVs: A Critical Review. IEEE Trans. Ind. Appl. 2025, 61, 3468–3484. [Google Scholar] [CrossRef]
  48. Duan, Y.; Ye, W.; Zhang, Q.; Wang, Z.; Lu, J. Decoupling Analysis of Parameter Inconsistency in Lithium-Ion Battery Packs to Guide Balancing System Design. Energies 2025, 18, 3439. [Google Scholar] [CrossRef]
  49. Dalvi, S.; Thale, S. Design of DSP Controlled Passive Cell Balancing Network based Battery Management System for EV Application. In Proceedings of the 2020 IEEE India Council International Subsections Conference (INDISCON), Visakhapatnam, India, 3–4 October 2020; pp. 84–89. [Google Scholar] [CrossRef]
  50. S M, S.; Reddy, S.; Kishore, Y.K. Modeling and Simulation Analysis of Cell Voltage Balancing Techniques for Lithium-Ion EV Battery. In Proceedings of the 2024 Third International Conference on Distributed Computing and Electrical Circuits and Electronics (ICDCECE), Ballari, India, 26–27 April 2024; pp. 1–6. [Google Scholar] [CrossRef]
  51. Tarle, N.; Kulkarni, R.; Desale, N.; Pawar, V. Design of a Battery Management System for Formula Student Electric Race Vehicle. In Proceedings of the 2019 5th International Conference on Computing, Communication, Control and Automation (ICCUBEA), Pune, India, 19–21 September 2019; pp. 1–6. [Google Scholar] [CrossRef]
  52. Donsaroenjun, N.; Nanthaban, S.; Sudtinam, C.; Sitin, B. Design and Experimental Validation of a Programmable Delta Charger Selection System for Electric Vehicles with CANopen and Modbus RTU Communication. Energies 2026, 19, 1310. [Google Scholar] [CrossRef]
  53. Han, S.-H.; Jeong, M.-G.; Yang, S.-K.; Lee, H.-B. Performance Test for EV Quick Charger. In Proceedings of the 2012 IEEE Vehicle Power and Propulsion Conference, Seoul, Republic of Korea, 9–12 October 2012; pp. 1516–1519. [Google Scholar] [CrossRef]
  54. Chaurasiya, S.; Singh, B. An Adaptive EV Charger Based Reconfigurable Bidirectional Isolated DC-DC Converter with Wide Voltage Range of Operation. In Proceedings of the 2022 IEEE/AIAA Transportation Electrification Conference and Electric Aircraft Technologies Symposium (ITEC+EATS), Anaheim, CA, USA, 15–17 June 2022; pp. 1301–1306. [Google Scholar] [CrossRef]
  55. Jiang, L.; Zhang, Y.; Li, T.; Diao, X.; Zhang, J. Analysis on Charging Safety and Optimization of Electric Vehicles. In Proceedings of the 2020 IEEE 6th International Conference on Computer and Communications (ICCC), Chengdu, China, 11–14 December 2020; pp. 2382–2385. [Google Scholar] [CrossRef]
  56. Rasheed, M.; Hassan, R.; Kamel, M.; Wang, H.; Zane, R.; Tong, S.; Smith, K. Active Reconditioning of Retired Lithium-Ion Battery Packs From Electric Vehicles for Second-Life Applications. IEEE J. Emerg. Sel. Top. Power Electron. 2024, 12, 388–404. [Google Scholar] [CrossRef]
  57. Riza; Margowadi, Y.; Aji, P.; Priyasta, D.; Rijanto, E.; Priandana, E.R.; Yusivar, F.; Nurdiana, E. A Design of Smart Charging Architecture for Battery Electric Vehicles. In Proceedings of the 2023 IEEE PES Innovative Smart Grid Technologies Europe (ISGT EUROPE), Grenoble, France, 23–26 October 2023; pp. 1–5. [Google Scholar] [CrossRef]
  58. Flack, C.; Ucer, E.; Smith, C.P.; Kisacikoglu, M. Controller Hardware-in-the-loop (C-HIL) Testing of Decentralized EV-Grid Integration. In Proceedings of the 2022 IEEE Power & Energy Society General Meeting (PESGM), Denver, CO, USA, 17–21 July 2022; pp. 1–5. [Google Scholar] [CrossRef]
  59. Khekert, E.V.; Malozyomov, B.V.; Klyuev, R.V.; Martyushev, N.V.; Konyukhov, V.Y.; Kukartsev, V.V.; Antamoshkin, O.A.; Remezov, I.S. Battery Charging Simulation of a Passenger Electric Vehicle from a Traction Voltage Inverter with an Integrated Charger. World Electr. Veh. J. 2025, 16, 391. [Google Scholar] [CrossRef]
  60. Kumar, N.R.; Jeeva, S.; Soban, M.A.; Aravintha Sriram, B.; Tharunkumaar, K.; Gokul, D. EV BMS with Charge Monitor and Fire Detection. In Proceedings of the 2024 10th International Conference on Electrical Energy Systems (ICEES), Chennai, India, 22–24 August 2024; pp. 1–5. [Google Scholar] [CrossRef]
  61. Tamilselvi, S.; Jansi, S.; Janani, M.; Thirumurugan, S.P. Automatic Charging E-Vehicle Using Electrical Generator. In Proceedings of the 2025 8th International Conference on Circuit, Power & Computing Technologies (ICCPCT), Kollam, India, 7–8 August 2025; pp. 1550–1556. [Google Scholar] [CrossRef]
  62. Wang, Y.; Liu, Y. Electronic control system design and test of pure electric vehicle battery management system. In Proceedings of the 2011 Second International Conference on Mechanic Automation and Control Engineering, Hohhot, China, 15–17 July 2011; pp. 1289–1292. [Google Scholar] [CrossRef]
  63. Yarra, M.K.; Krishna, T.V.; Siva Gangadhar, G.; Sandeep, L.; Naga Venkata Balakrishna, G.; Prakash, C.S. Design and Implementation of Self-Charging BMS for Electric Vehicle Applications. In Proceedings of the 2023 2nd International Conference for Innovation in Technology (INOCON), Bangalore, India, 3–5 March 2023; pp. 1–6. [Google Scholar] [CrossRef]
  64. Repalle, N.B.; Reddy, S.R.B.; Varshney, R.; Morampudi, R.; Shravani, C.; Ajmeera, R.S.T. Adaptive BMS Architecture for EV Safety: Integrating Overvoltage Detection and Fire Suppression. In Proceedings of the 2026 IEEE International Conference on Intelligent Systems, Smart and Green Technologies (ICISSGT), Visakhapatnam, India, 6–7 February 2026; pp. 1–6. [Google Scholar] [CrossRef]
  65. Khan, H.I.; Singh, H.; Tiwari, A.K.; Konwar, A.P.; Pati, A.K.; G P, S. Design of Battery Management System for Electric Vehicle by Using LTC6804 and STM32F4. In Proceedings of the 2025 International Conference on Information, Implementation, and Innovation in Technology (I2ITCON), Pune, India, 4–5 July 2025; pp. 1–6. [Google Scholar] [CrossRef]
  66. Dar, A.R.; Haque, A.; Khan, M.A.; Kurukuru, V.S.B.; Mehfuz, S. On-Board Chargers for Electric Vehicles: A Comprehensive Performance and Efficiency Review. Energies 2024, 17, 4534. [Google Scholar] [CrossRef]
  67. Lou, Y.; Ramyar, A.; Cui, X.; Siegel, J.; Stefanopoulou, A.; Avestruz, A.-T. A Robust System Monitoring and Control for Battery Energy Storage Systems in Electric Vehicle Charging. In Proceedings of the 2023 IEEE Transportation Electrification Conference & Expo (ITEC), Detroit, MI, USA, 21–23 June 2023; pp. 1–6. [Google Scholar] [CrossRef]
  68. Sabo, A.; Diyari, M.J.; Ogbodick, I.; Saddam, Y.O.; Mordi, M.; Pele, P.; Osaluwe, K. A Review on Power Electronics Technologies and Applications for EV Battery Charging Systems. In Proceedings of the 2022 International Conference on Green Energy, Computing and Sustainable Technology (GECOST), Miri Sarawak, Malaysia, 26–28 October 2022; pp. 112–117. [Google Scholar] [CrossRef]
  69. Devi, A.N.; Kakkar, S.; Imam Yusuf, N. Analysis and Simulation of Charging/Discharging of Lithium-Ion Battery in Electric Vehicles. In Proceedings of the 2024 IEEE Third International Conference on Power Electronics, Intelligent Control and Energy Systems (ICPEICES), Delhi, India, 26–28 April 2024; pp. 37–41. [Google Scholar] [CrossRef]
  70. P., K.; Karthikeyan, R.; Praanesh, J.; Karthik Raja, R. Smart Wireless EV Charging Station Using Raspberry Pi and Web-Based Monitoring. In Proceedings of the 2025 International Conference on Multi-Agent Systems for Collaborative Intelligence (ICMSCI), Erode, India, 20–22 January 2025; pp. 738–747. [Google Scholar] [CrossRef]
Figure 1. Schematic of the cell level monitoring framework featuring a 4.10 V threshold detection and visual status indicators for individual Li-ion cells.
Energies 19 03062 g001
Figure 2. Overall system architecture consisting of four functional layers: the battery and sensing layer, embedded processing layer, IoT communication layer, and visualization and analytics layer, enabling modular design, scalable deployment, and clear separation of measurement, control, communication, and data analysis functions.
Energies 19 03062 g002
Figure 3. Overview of the proposed PCB hardware platform. The system enables fully wireless data acquisition from the JK-BMS via Bluetooth and supports remote firmware updates, eliminating the need for extensive signal wiring. The PCB also integrates eight relay-controlled outputs for managing battery chargers and electrical loads.
Energies 19 03062 g003
Figure 4. Power regulation and protection circuit. A high-efficiency DC–DC buck converter is used to generate regulated 5 V and 3.3 V supply rails for the embedded system. Filtering and transient suppression components reduce noise and voltage fluctuations, while protection elements such as reverse polarity protection, fuse protection, and TVS devices ensure safe operation. The system achieves an overall power conversion efficiency of approximately 96%.
Energies 19 03062 g004
Figure 5. Hardware integration of ESP32-based modules and external interfaces.
Energies 19 03062 g005
Figure 6. PCB layout showing top and bottom layers with separation between analog and high-current regions. A two-layer FR-4 design with a ground plane is employed to improve electromagnetic compatibility and reduce noise coupling. Critical signal and communication traces are carefully routed to avoid interference, enhancing signal integrity and overall system reliability.
Energies 19 03062 g006
Figure 7. Raspberry Pi 4 edge server for IoT-based battery monitoring and edge analytics.
Energies 19 03062 g007
Figure 8. Data flow architecture of the proposed IoT-based battery monitoring system using an MQTT publish–subscribe model.
Energies 19 03062 g008
Figure 9. Dashboard visualization and alert mechanism implemented in Home Assistant.
Energies 19 03062 g009
Figure 10. Experimental analysis of total voltage and current behavior during battery charging.
Energies 19 03062 g010
Figure 11. Experimental validation of internal resistance behavior using real time battery monitoring.
Energies 19 03062 g011
Figure 12. Experimental validation of voltage, current, and internal resistance behavior during battery charging.
Energies 19 03062 g012
Figure 13. Experimental thermal monitoring results during battery charging operation.
Energies 19 03062 g013
Figure 14. Implemented hardware architecture of the entire system.
Energies 19 03062 g014
Figure 15. Real time visualization of battery parameters on the dashboard.
Energies 19 03062 g015
Figure 16. Methodological workflow for trend-oriented battery monitoring and anomaly detection.
Energies 19 03062 g016
Figure 17. Real time dashboard visualization and anomaly detection interface implemented in Home Assistant.
Energies 19 03062 g017
Figure 18. Example of rule based alert generation for abnormal battery conditions.
Energies 19 03062 g018
Figure 19. Experimental setup of the proposed IoT-based battery monitoring system.
Energies 19 03062 g019
Figure 20. Real time visual telemetry and interactive monitoring interface implemented on the Home Assistant dashboard.
Energies 19 03062 g020
Figure 21. Anomaly detection results during cell monitoring cycles, illustrating the logged individual cell data utilized for analytical processing and degradation alerts.
Energies 19 03062 g021
Figure 22. Charging at 84.8 V caused certain cell voltages to exceed 4.270 V, resulting in Cell 17. overvoltage conditions that triggered system errors and protective responses within the BMS.
Energies 19 03062 g022
Figure 23. Charging at 83.8 V maintained cell voltages between approximately 4.20–4.23 V, resulting in stable charging behavior without triggering overvoltage protection.
Energies 19 03062 g023
Figure 24. The battery was successfully charged at an applied voltage of 83.8 V with no system faults detected.
Energies 19 03062 g024
Figure 25. Real time visualization of cell voltage and pack voltage during system operation.
Energies 19 03062 g025
Figure 26. Detection of voltage instability and anomaly events.
Energies 19 03062 g026
Figure 27. Long term voltage trend and cel l to cell divergence analysis.
Energies 19 03062 g027
Figure 28. Comparison of battery behavior before and after charging voltage optimization.
Energies 19 03062 g028
Table 1. Summary of the proposed system architecture.
LayerFunctionTechnology
SensingVoltage MeasurementJK-BMS
EmbeddedProcessingESP32
CommunicationData TransferMQTT
VisualizationMonitoringHome Assistant Platform
Table 2. Anomaly accumulation summary and health status mapping for the 20S NMC battery pack.
CellAnomaly EventsStatusCellAnomaly EventsStatus
Cell 10NormalCell 11109Normal
Cell 20NormalCell 121Normal
Cell 30WarningCell 130Warning
Cell 40NormalCell 145Normal
Cell 50NormalCell 150Warning
Cell 60NormalCell 160Normal
Cell 73NormalCell 176Critical (Alert)
Cell 86Critical (Alert)Cell 180Normal
Cell 90WarningCell 190Normal
Cell 100WarningCell 200Normal
Disclaimer/Publisher’s Note: The statements, opinions and data contained in all publications are solely those of the individual author(s) and contributor(s) and not of MDPI and/or the editor(s). MDPI and/or the editor(s) disclaim responsibility for any injury to people or property resulting from any ideas, methods, instructions or products referred to in the content.