Article

Quantifying Dynamic Evolution of Preferential Flow Paths in Displacement Units of Ultra-High Water-Cut Reservoirs


1
College of Petroleum Engineering, China University of Petroleum, Beijing 102249, China
2
National Key Laboratory of Petroleum Resources and Engineering, China University of Petroleum, Beijing 102249, China
3
PetroChina Dagang Oilfield Company, Tianjin 300280, China
*
Authors to whom correspondence should be addressed.
Energies 2026, 19(13), 3056; https://doi.org/10.3390/en19133056
Submission received: 23 May 2026 / Revised: 23 June 2026 / Accepted: 25 June 2026 / Published: 28 June 2026

Abstract

Preferential flow paths and ineffective water circulation are difficult to quantify in ultra-high water-cut reservoirs because long-term waterflooding intensifies dynamic heterogeneity and oil–water flow interactions. This study develops a displacement unit (DU)-scale method that integrates dynamic liquid-volume splitting, saturation tracking, and techno-economic water-cut evaluation while considering time-varying reservoir properties. The method was applied to a typical ultra-high water-cut block in the Daqing Oilfield to characterize the temporal evolution of preferential flow paths. A total of 902 DUs were delineated from streamline envelopes, and validation with production profile data from representative wells showed an accuracy exceeding 82%. Under an oil price of 60 USD/bbl, the proposed economic water-cut criterion identified 368 economically strong preferential-flow DUs, accounting for 40.79% of all DUs. Two indicators, the water-cut profit–loss margin (Δfw) and oil displacement efficiency (Ed), were then used to establish a Δfw-Ed classification matrix. The DUs were divided into four types: economically ineffective strong-channeling units, channeling units with remaining potential, mature stable production units, and homogeneous units. The results support differentiated control measures, such as channel plugging, profile control, cyclic waterflooding, and fluid-rate optimization, for improving waterflood management in mature reservoirs.

1. Introduction

As conventional hydrocarbon production becomes increasingly challenging, ultra-high water-cut reservoirs have become critical for sustaining oil production in China [1]. The 2023 Statistical Yearbook of the National Energy Administration indicates that these reservoirs account for almost 65% of total onshore crude oil and natural gas production [2]. In major basins, such as the Bohai Bay and Songliao basins, the average water cut of typical fields generally exceeds 85%. The Gudong field in Shengli has even reached an advanced stage of development, with a water cut of 93.5% [3]. At the ultra-high water-cut stage, preferential flow areas exhibit pronounced dynamic variations in oil–water two-phase flow. In contrast, traditional waterflooding techniques face severe challenges due to the development of preferential flow paths. According to the Society of Petroleum Engineers’ standard terminology [4], preferential flow is associated with nonuniform displacement dominated by high-permeability streaks. In practice, injected water preferentially migrates along these paths, leading to ineffective water circulation and reduced oil recovery, with an annual decline of 0.5% to 0.8% in incremental oil recovery. In Bohai Bay Basin, tracer tests indicate that preferential flow paths occupy 28.6% of the reservoir pore volume, with strong preferential flow paths in some areas accounting for 41.2% of the well-pattern-controlled area [5]. However, existing monitoring approaches, such as the analysis of production history and well-test interpretation, are constrained by difficulties in upscaling from discrete well data to the reservoir scale, challenging the reconstruction of three-dimensional preferential flow fields under multilayer combined production conditions [6,7]. This limitation hampers the quantitative characterization of the distribution of preferential flow paths and underscores the urgent need for effective control technologies grounded in multiscale flow characterization.
Within the theoretical framework of ultra-high water-cut reservoir development, recent studies have increasingly addressed remaining-oil characterization, preferential-flow-path identification, injector–producer connectivity analysis, flow-performance evaluation, and dynamic monitoring of waterflood performance. These research topics are closely associated with several unresolved challenges in mature waterflooded reservoirs. From a geological perspective, strong reservoir heterogeneity and pronounced interlayer contradictions lead to substantial differences in displacement degree among layers and flow units. From a development perspective, long-term waterflooding promotes the growth of preferential flow paths, aggravates ineffective water circulation, and results in highly dispersed remaining-oil distributions. From a methodological perspective, many existing evaluation methods still rely on static permeability or fixed reservoir-property assumptions and therefore cannot fully capture the permeability evolution induced by long-term water scouring. From an economic perspective, oil price, liquid-handling cost, and well operating cost are rarely incorporated into preferential-flow-path evaluation, which limits the field applicability of existing identification and control criteria. In response to the geological, development, and methodological challenges described above, previous investigations have mainly focused on three related aspects: the dynamic evolution mechanism of preferential flow fields, intelligent characterization techniques, and targeted control strategies for preferential flow paths. Chen et al. developed a quantitative model of preferential flow paths based on time-varying conductivity coefficients [8] and revealed the evolution pattern of the viscous fingering index when the water cut exceeded 85%. Yin et al. proposed a convolutional neural network-based method for identifying high-permeability channels, achieved an identification accuracy of 89.5%, and applied dynamic calibration of the channeling coefficient to thick oil-layer units in the Daqing Oilfield [9]. Li clarified the threshold effect of permeability contrast on the development of preferential flow paths through systematic core-displacement experiments [10]. Qi et al. employed flow-field reconstruction to visualize pore-scale fluid migration within preferential-flow regions, and microfluidic experiments further confirmed that the remaining-oil saturation in these regions was 18–23% higher than that in the surrounding matrix [11]. To improve flow-field characterization and control, Li et al. developed an unsupervised clustering algorithm based on flow-field data, which improved the efficiency of dynamic flow-field reconstruction by a factor of three and reduced the reliance on static parameters [12]. Chai et al. reported that streamline-based optimization of well-pattern design reduced the preferential-flow area by 21.3% [13]. Collectively, these advances indicate a transition from experience-driven development toward an integrated paradigm that combines data- and model-driven approaches for ultra-high water-cut reservoirs.
Research methods for the quantitative characterization of preferential flow paths in ultra-high water-cut reservoirs have gradually evolved from qualitative descriptions to quantitative analyses. Fluid-dynamic modeling, numerical and laboratory physical simulations, and machine learning have provided important tools for the quantitative characterization of preferential flow paths [14,15,16]. Fluid-dynamic models, typically based on Darcy or non-Darcy flow laws, integrate porosity, permeability, fluid viscosity, and pressure gradients to describe flow behavior. Although these models are effective for analyzing fluid–rock interactions under relatively steady conditions, their application in large and geologically complex reservoirs is often constrained by high computational costs and sensitivity to parameter uncertainties [17]. Numerical simulations can dynamically predict the spatial distribution of preferential flow paths by constructing three-dimensional reservoir models that incorporate petrophysical properties and multiphase flow dynamics. However, although numerical simulations can flexibly characterize reservoir heterogeneity and complex seepage behavior, they remain subject to a high computational burden and strong parameter dependence [18,19,20,21]. Core-scale waterflooding experiments provide direct observations of flow behavior under controlled conditions; however, scale effects and deviations from in situ reservoir conditions may restrict their representativeness.
Machine learning methods exploit large datasets to extract features related to preferential flow paths and support prediction and identification. Despite their scalability, these methods remain sensitive to data quality and representativeness, and their interpretability and generalizability may be limited by model complexity and potential training-data bias [22,23,24,25,26,27]. Beyond these methodological limitations, long-term waterflooding induces complex flow-field evolution and reservoir-property variations, resulting in a highly dispersed distribution of remaining oil. Consequently, many studies have focused on flow characterization at discrete time points rather than systematically tracking time-varying processes [28]. In addition, existing methods are often applied at the well, layer, or reservoir scale, whereas quantitative investigations on the dynamic evolution of preferential flow paths within displacement units (DUs) remain limited. Moreover, an integrated techno-economic optimization framework has yet to be established; fluctuations in oil prices and operating costs are not fully incorporated into existing evaluation indicators, thereby reducing the economic relevance of mitigation strategies [29,30]. These research gaps indicate that preferential-flow-path characterization requires a refined quantitative framework that integrates dynamic and static data, production-performance tracking, and techno-economic evaluation.
To address these issues, this study integrates production and testing data, fluid dynamics analysis, reservoir engineering theory, and techno-economic evaluation. This integration facilitates the development of a quantitative method for characterizing preferential flow paths within DUs while accounting for the time-varying effects of reservoir parameters. This paper is organized as follows: Section 2 defines the concept of the DU and analyzes the time-varying characteristics of reservoir properties using core experimental data during long-term waterflooding. Section 3 develops a dynamic splitting model for allocating the produced liquid among the DUs, along with a saturation-tracking model. These results form the basis of a techno-economic evaluation method for ineffective water circulation, establishing a quantitative characterization system for preferential flow paths. Section 4 applies the proposed method to a typical block in the Daqing Oilfield to quantify the distribution of preferential flow paths at the displacement unit scale and introduces a classification decision matrix to derive differentiated development and control strategies. Finally, Section 5 and Section 6 summarize the main conclusions of this study.

2. DUs and Time-Varying Reservoir Properties

During the ultra-high water-cut stage, the reservoir flow system becomes progressively more heterogeneous, leading to a highly dispersed distribution of the remaining oil. The injected fluids tend to migrate along preferential flow paths associated with high-permeability streaks and natural fractures, resulting in premature water breakthroughs in the producing wells. The development of strong preferential flow paths reduces displacement sweep efficiency and aggravates ineffective water circulation. Conventional flow models, which are often constrained in modeling time-varying parameters, struggle to capture the dynamic growth of preferential flow paths and the underlying mechanisms of flow-field reconstruction. Therefore, dynamic flow-field simulation at the scale of DUs has become essential for elucidating nonlinear flow behavior in ultra-high water-cut mature reservoirs and supporting the optimization of differentiated development and control strategies.

2.1. Definition of DUs

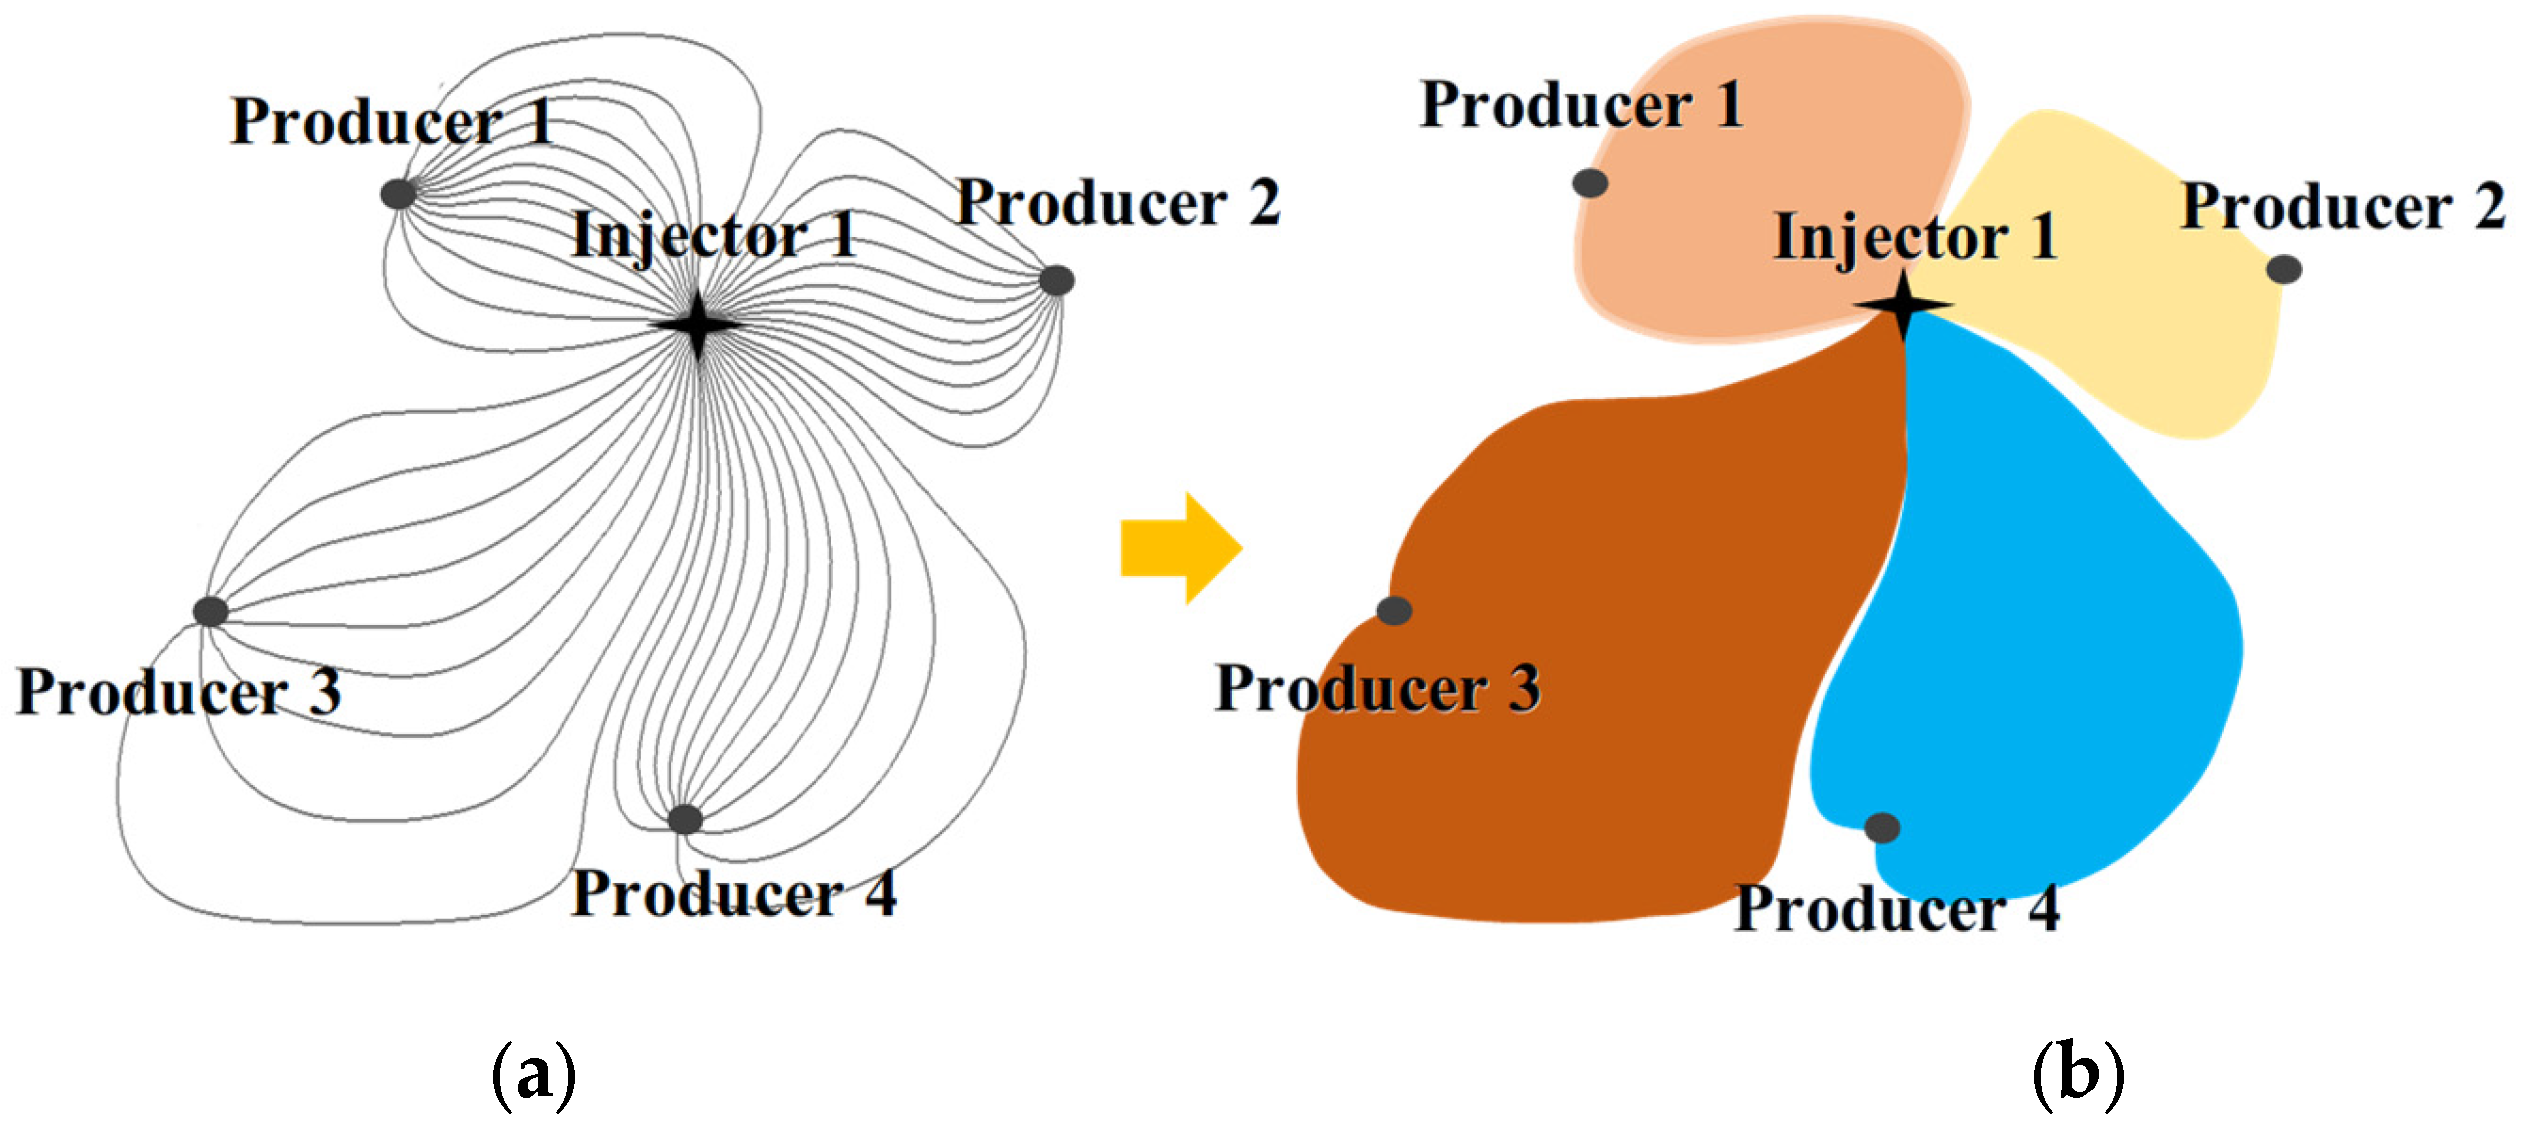
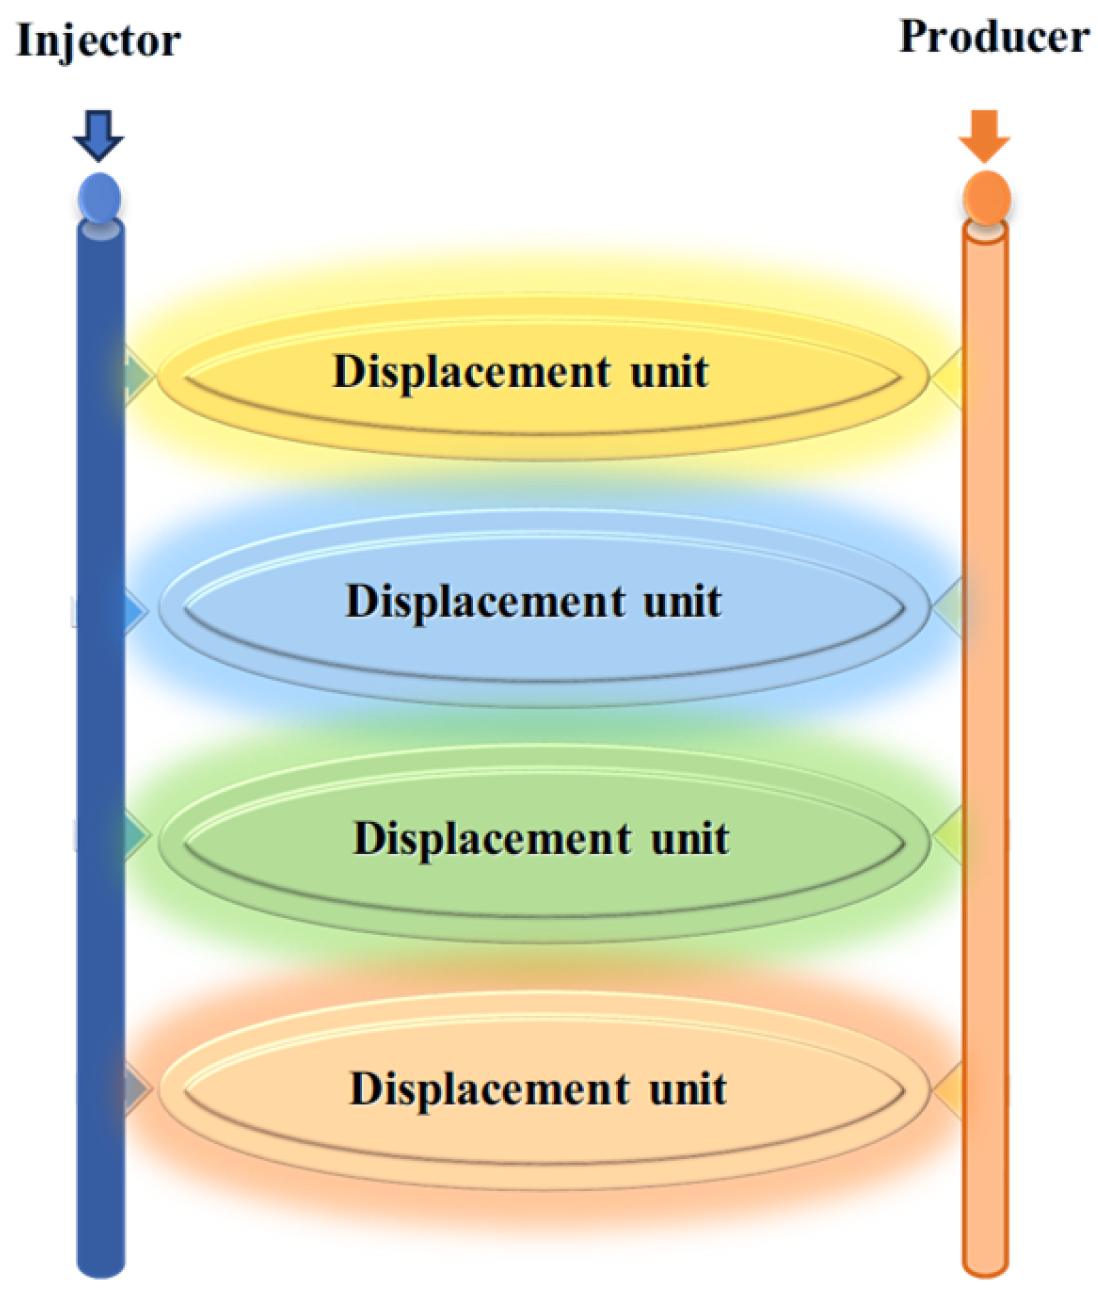
To enable rapid layer-by-layer interwell evaluation of waterflooding efficiency in complex multilayer reservoirs and to accurately identify and optimize injected water flow paths, this study adopted the concept of DUs. Following Si et al., a DU is defined as “the reservoir volume enclosed by streamlines connecting a point source and a point sink” [31]. Within each layer, the effective injector–producer domain is where oil–water flow and mass exchange occurs. Figure 1 and Figure 2 illustrate the areal and vertical distributions of the DUs in the injector–producer system, respectively. Once the well pattern is established and the injector–producer relationships are determined, the waterflooding displacement system of a reservoir can be regarded as a composite of all the DUs.

2.2. Streamline Tracing for DUs

The actual trajectories of the reservoir fluids can be represented by the streamline envelope connecting the injector and producer wells. Using this boundary envelope, the effective flow domain of each injector–producer pair can be explicitly delineated as a DU, thereby avoiding the imprecise estimations and simplified assumptions inherent to traditional models. In addition, streamline simulations can capture the real-time dynamic characteristics of fluid flow during reservoir development, particularly the reorganization of flow patterns induced by adjustments in water injection rates, oil production rates, or well-pattern layouts.
Streamline simulation, grounded in hydrodynamics and flow theory, numerically computes streamlines in porous media to provide a precise dynamic flow analysis for reservoir development [32,33]. Its fundamental principle is to describe the actual fluid flow paths in reservoirs by tracking the trajectories of fluid particles [34]. The orientation and density of streamlines provide an intuitive depiction of internal flow regimes, which are strongly controlled by reservoir attributes such as permeability, porosity, and pressure field [35]. To simulate the dynamic behavior of reservoir fluids, streamline simulations typically couple Darcy’s law, the continuity equation, and streamline tracking algorithms.
In this study, streamline tracing was implemented using the Pollock streamline tracking method, a widely used Lagrangian algorithm, which is summarized as follows:
(1)
Particle initialization: Multiple initial positions are defined within the reservoir model as starting points for fluid particles. These positions are assigned to different grids or unit points based on the reservoir’s geological characteristics.
(2)
Fluid particle tracking: The trajectories of the fluid particles were determined by solving the velocity field and governing equations. These trajectories are influenced by the pressure distribution, permeability, and porosity, allowing accurate tracing and visualization of the flow paths.
(3)
Fluid velocity: The flow characteristics of a reservoir determine the velocity field, which changes over time under varying reservoir conditions. By solving for the velocity field, the instantaneous velocity and movement trajectory of the fluid particles at each time step can be obtained.
(4)
Particle position update: The positions of the fluid particles were iteratively updated according to the calculated velocity field. Through successive time steps, the particle trajectories were constantly updated, and the complete flow paths of the fluids within the reservoir were depicted.
(5)
Termination condition setting: Streamline tracking requires predefined termination criteria, such as particles reaching reservoir boundaries or exceeding a specified step size or simulation time. Upon satisfying these criteria, particle tracking is terminated.
(6)
Data collection and analysis: The trajectories of all the tracked particles were collected and processed to evaluate the fluid behavior and flow characteristics along different paths. The results were visualized using flow diagrams, flow patterns, and spatial flow distributions.
The field application in this study employed the commercial reservoir simulator tNavigator to solve the three-dimensional pressure and velocity fields. Streamline tracing was subsequently performed in the post-processing stage using the computed velocity vector field and the Pollock streamline tracking algorithm. Within each grid cell, streamlines were integrated across cells, assuming linear variation in the velocity components, until they reached the production wells or model boundaries. This process constructs streamlined envelopes between the injection and production wells, which are used to spatially divide and determine the boundaries of the DUs. Compared to conventional grid-based numerical formulations (e.g., finite difference, finite element, and finite volume), the Pollock-based streamline tracing method can more effectively simulate fluid flow in severely heterogeneous reservoirs with strong permeability contrast and time-varying operating conditions. It offers an intuitive visualization of interwell flow paths and supports streamline-based optimization while maintaining high computational efficiency.

2.3. Time-Varying Flow in DUs

During waterflooding of ultra-high water-cut mature reservoirs, reservoir properties can exhibit pronounced time-varying behavior [36]. The permeability interval distributions of the cores before and after waterflooding were compared using core-scale waterflooding experiments on 28 core samples from the Daqing Oilfield. The impact of injection water scouring on permeability was further evaluated, and the associated permeability evolution trend was characterized, thereby elucidating the time-varying reservoir phenomena observed during late-stage waterflooding.
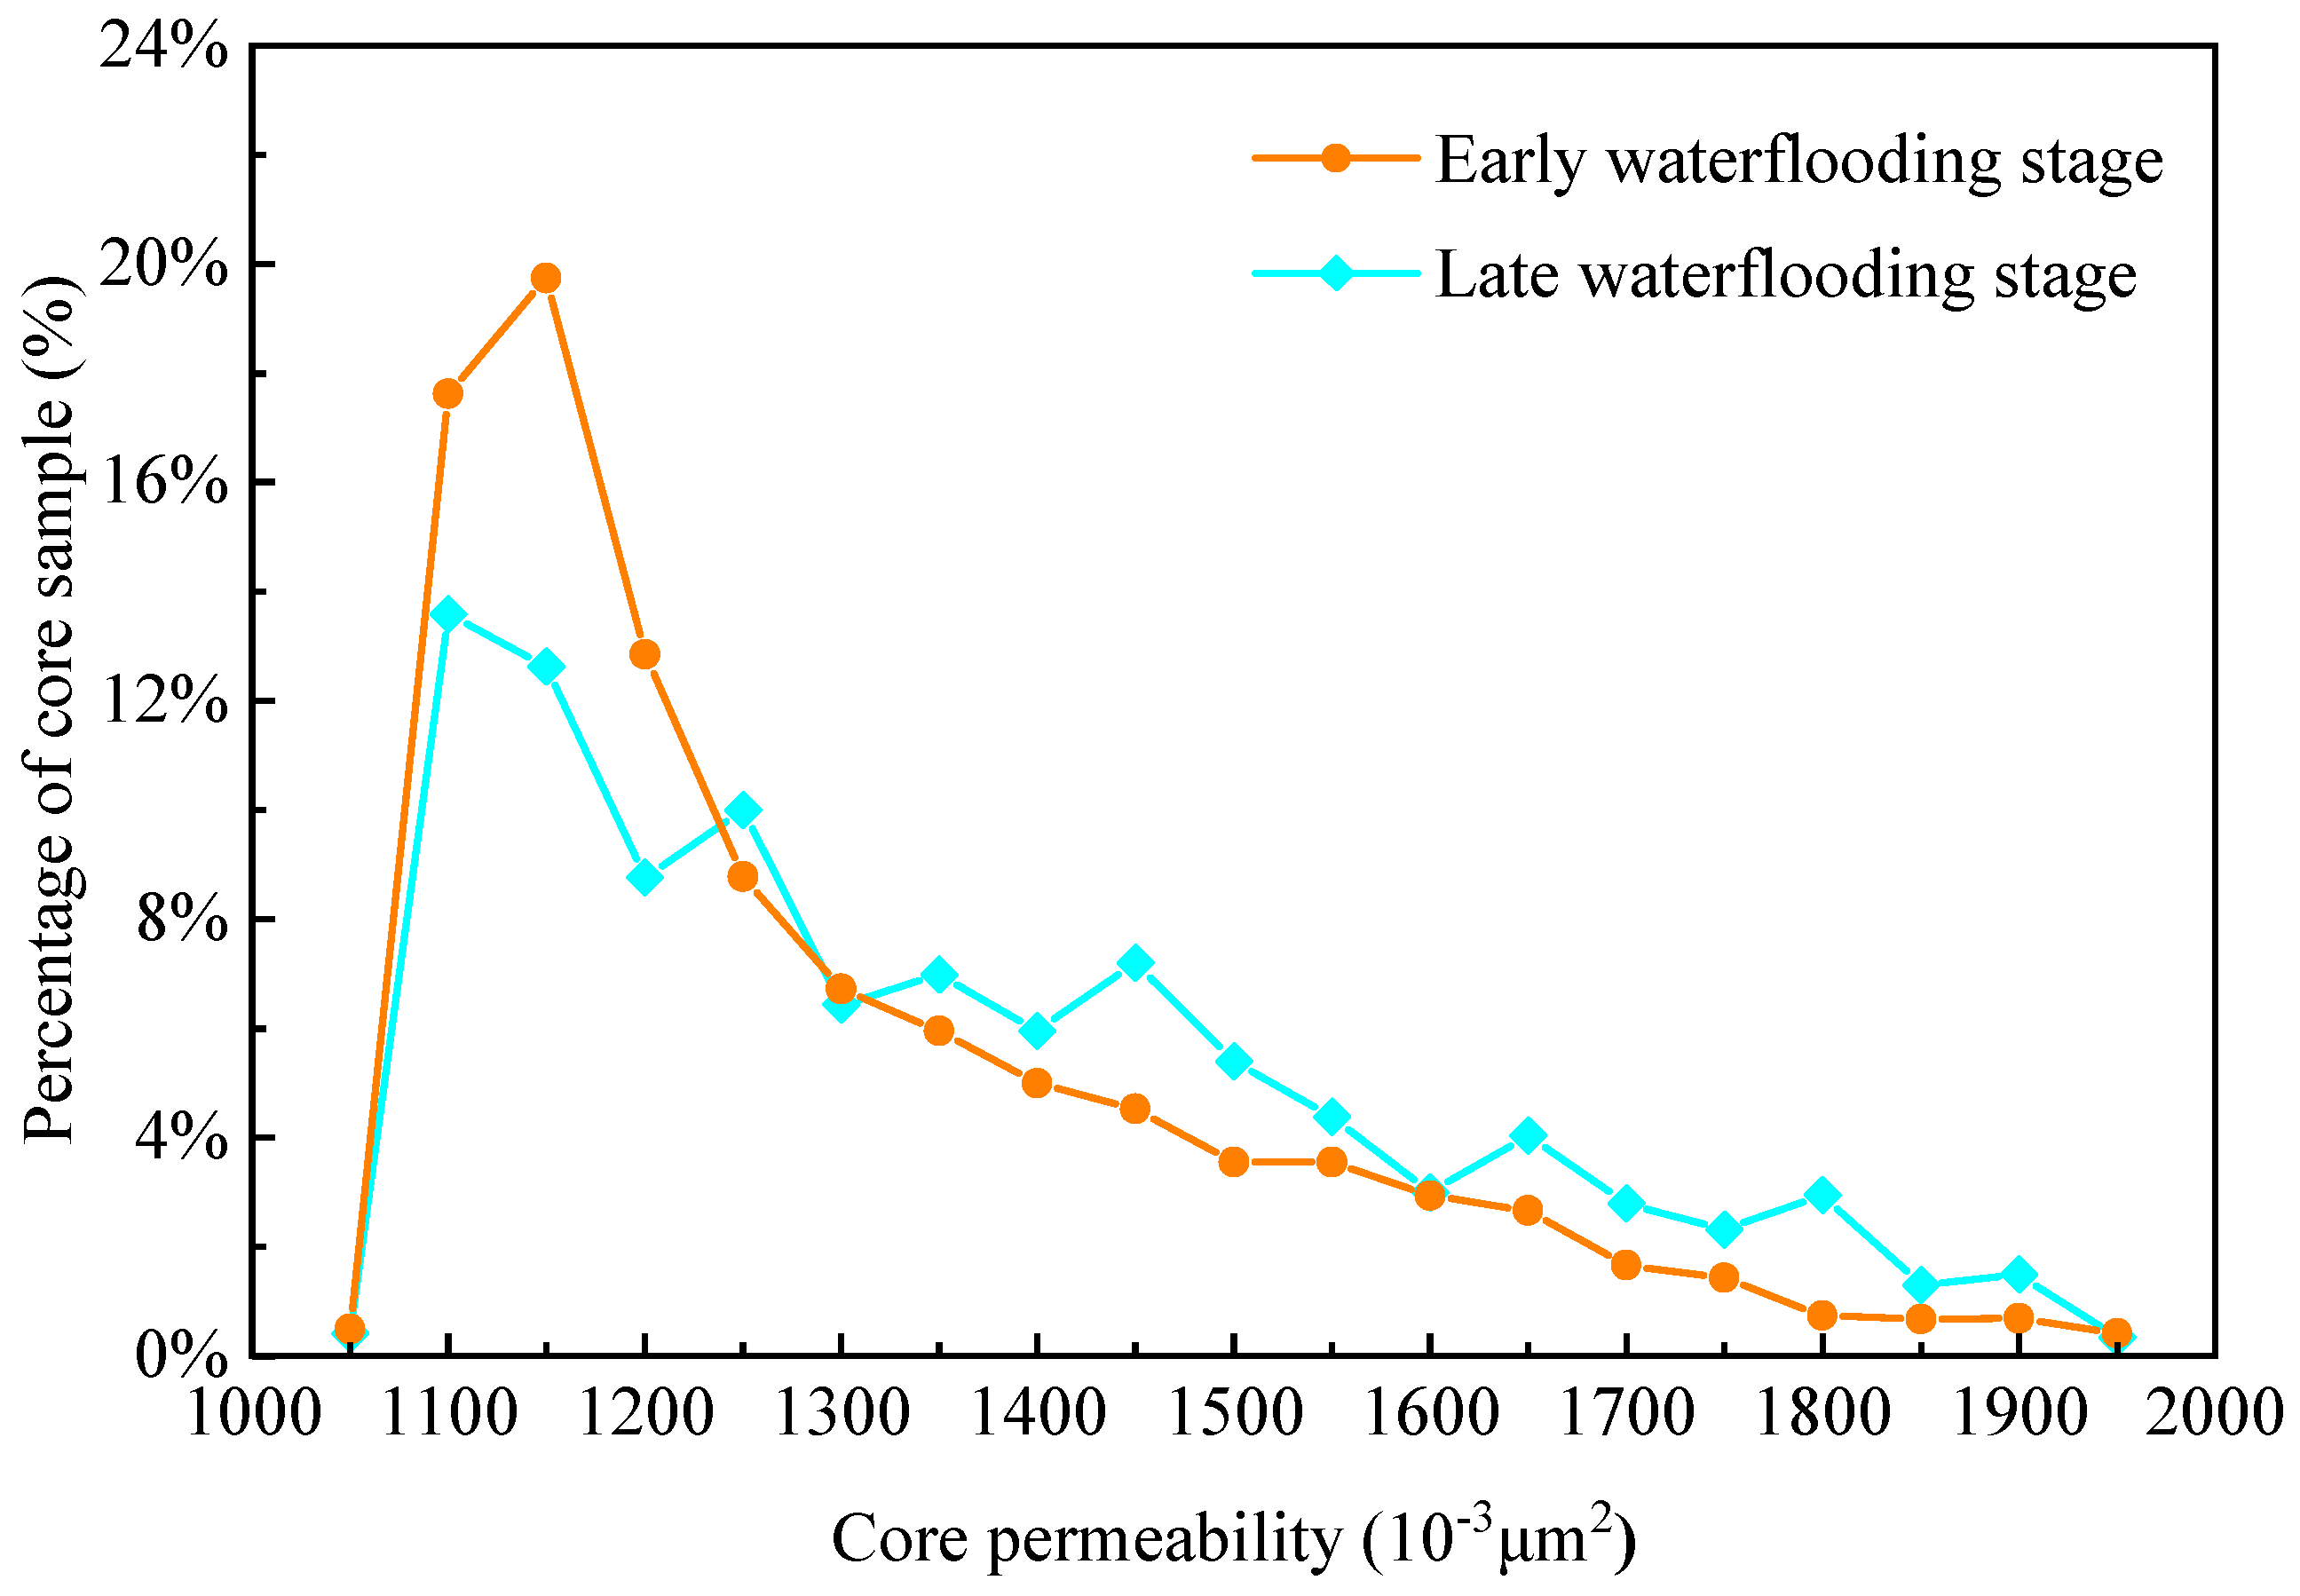
Based on the statistical results of the core waterflooding experiments, the permeability evolution in the high-permeability layer was quantified by comparing the permeability-interval distributions of the cores before and after waterflooding. As illustrated in Figure 3, waterflooding markedly increases the fraction of cores with permeability exceeding 1250 × 10−3 μm2, shifting the overall permeability distribution toward higher values. Consequently, the proportion of cores classified as high-permeability increased by 12.2% following the waterflooding process.
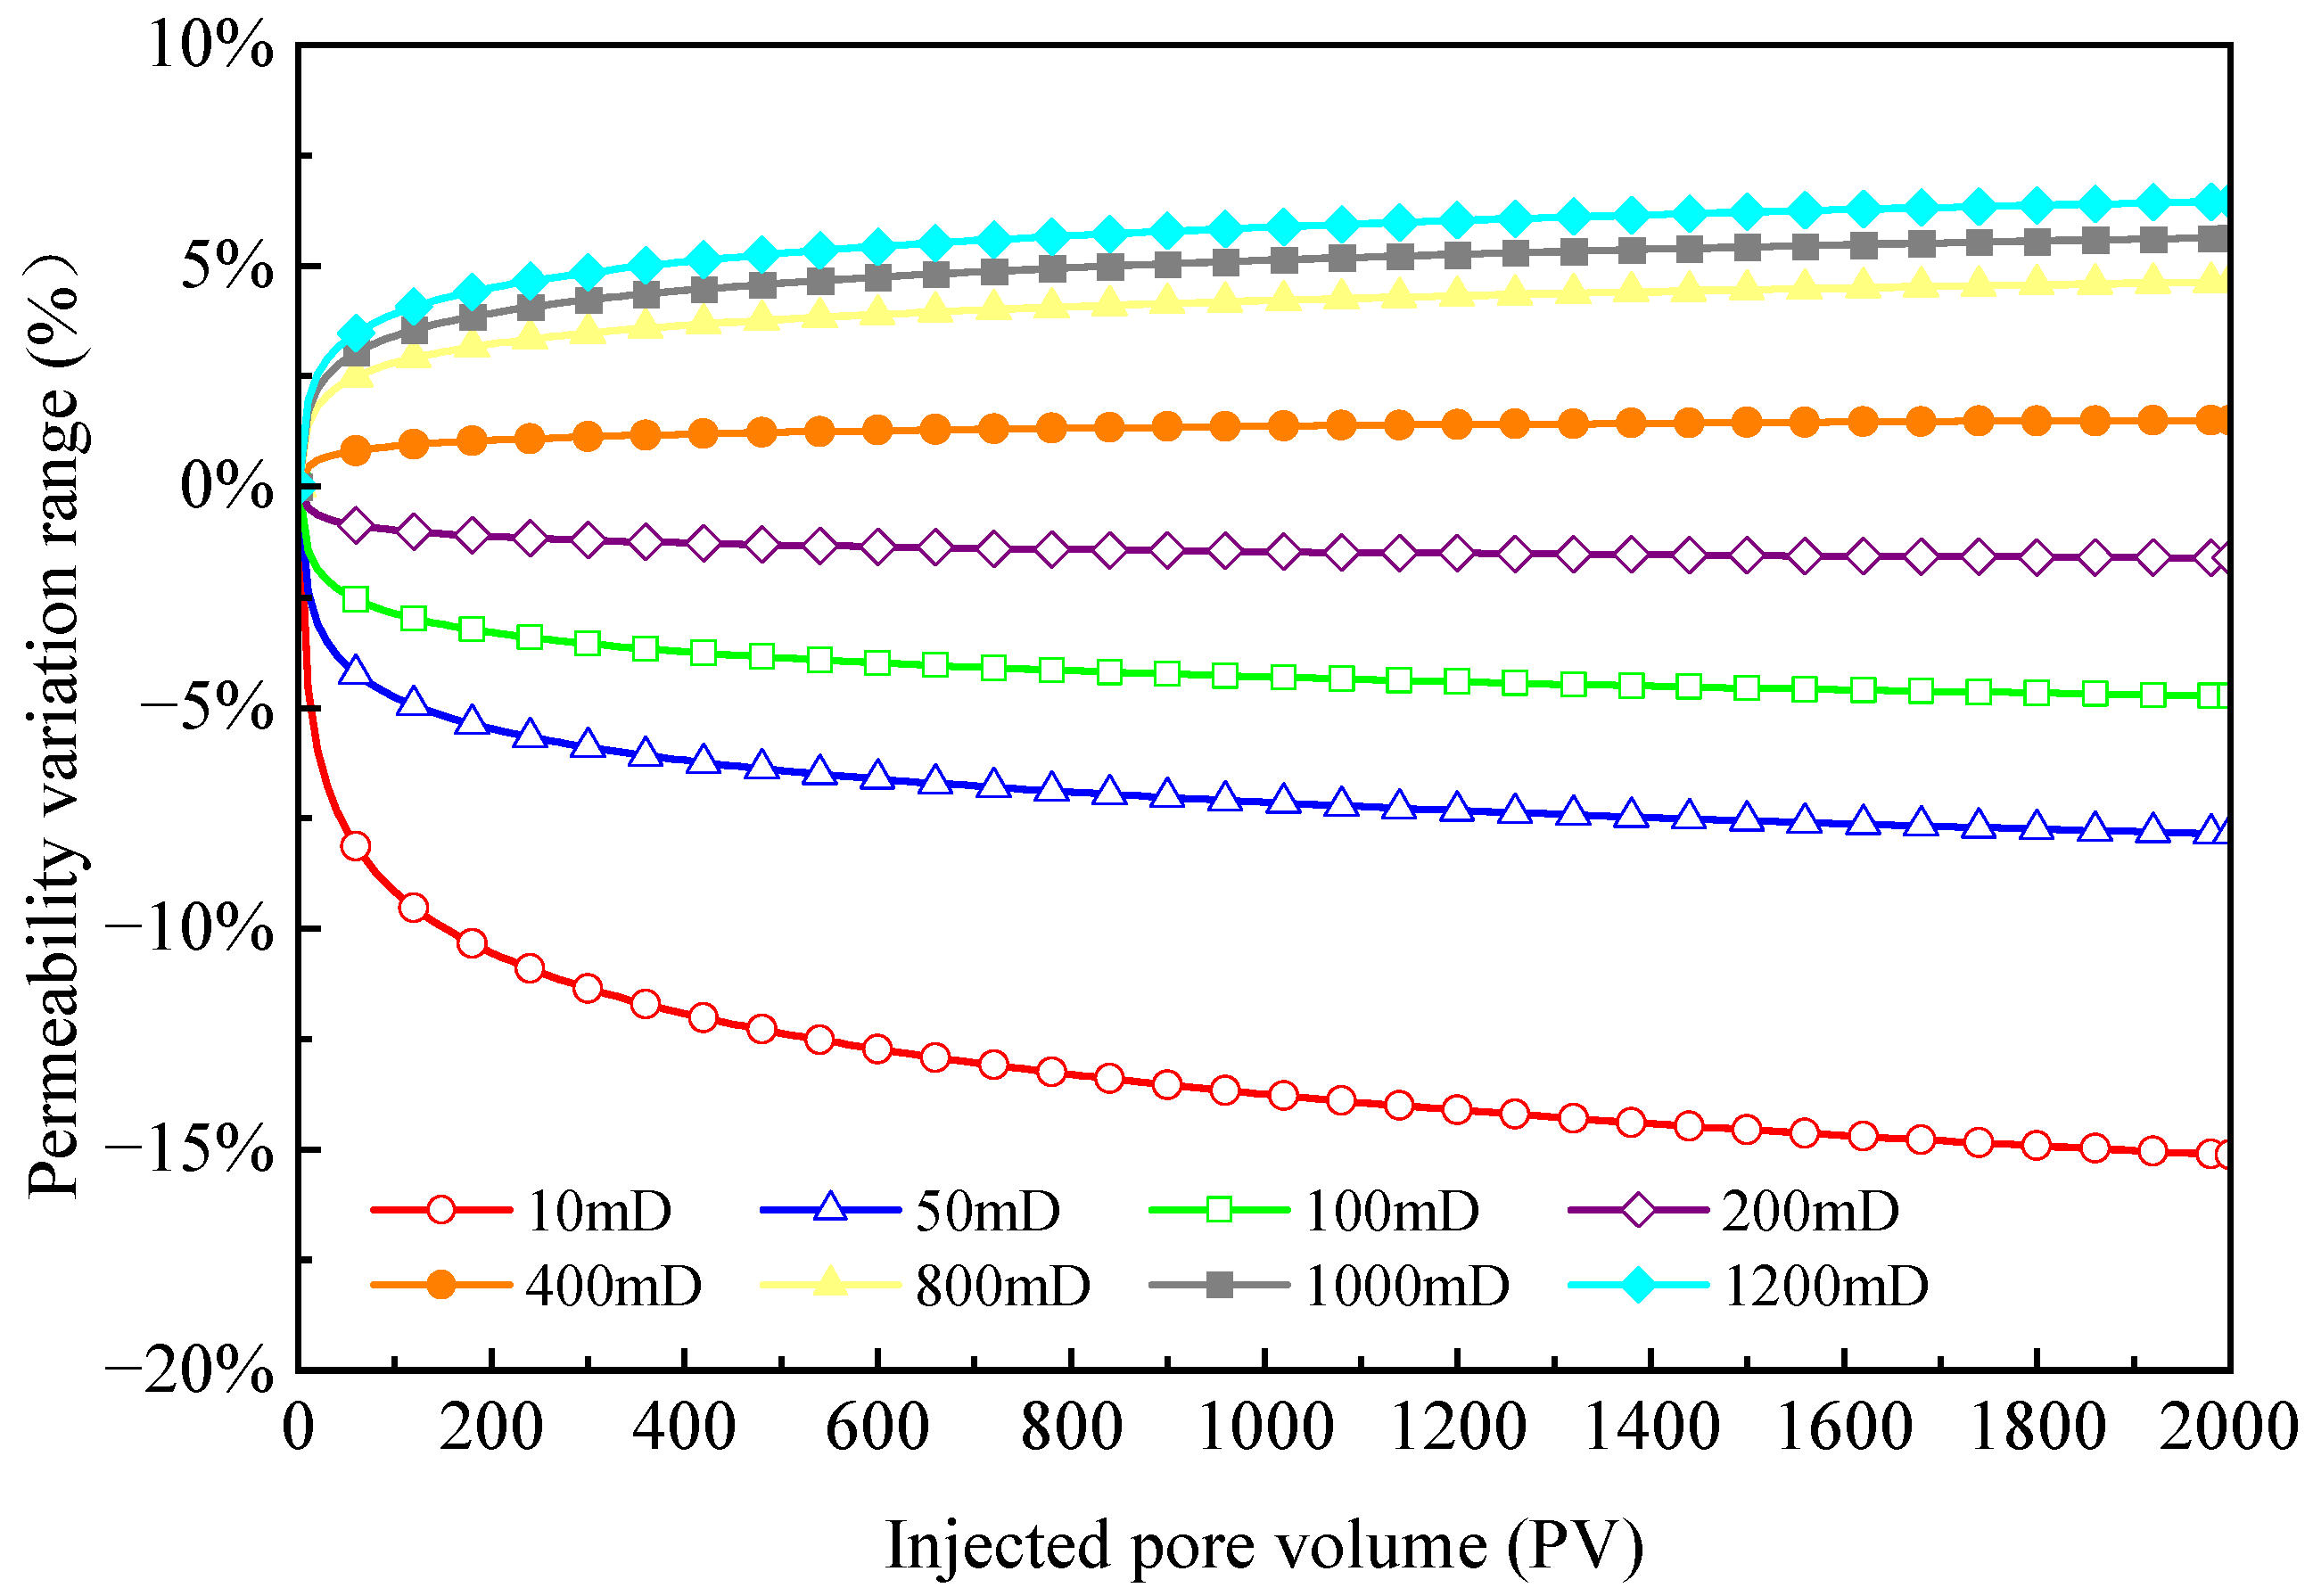
The effect of flooding intensity on permeability evolution is strictly governed by the initial permeability of the cores. Figure 4 illustrates the long-term core-scale waterflooding experiments conducted across a range of injected pore volumes (PVs). For cores with initial permeability higher than 350 × 10−3 μm2 (equivalent to 350 mD), increasing flooding intensity results in a logarithmic increase in permeability variation. In contrast, for cores with initial permeability below 350 × 10−3 μm2, permeability decreases with increasing flooding intensity, and the reduction becomes more pronounced as initial permeability decreases. These contrasting trends indicate that flooding intensity alters flow behavior across layers with different permeability contrasts and drives the time-varying evolution of reservoir physical parameters during waterflooding. By leveraging this time-varying law, changes in the effective displacement area can be identified more efficiently, thereby improving the quantitative characterization and optimization of the DUs, including more accurate dynamic splitting of the DUs’ liquid volume.
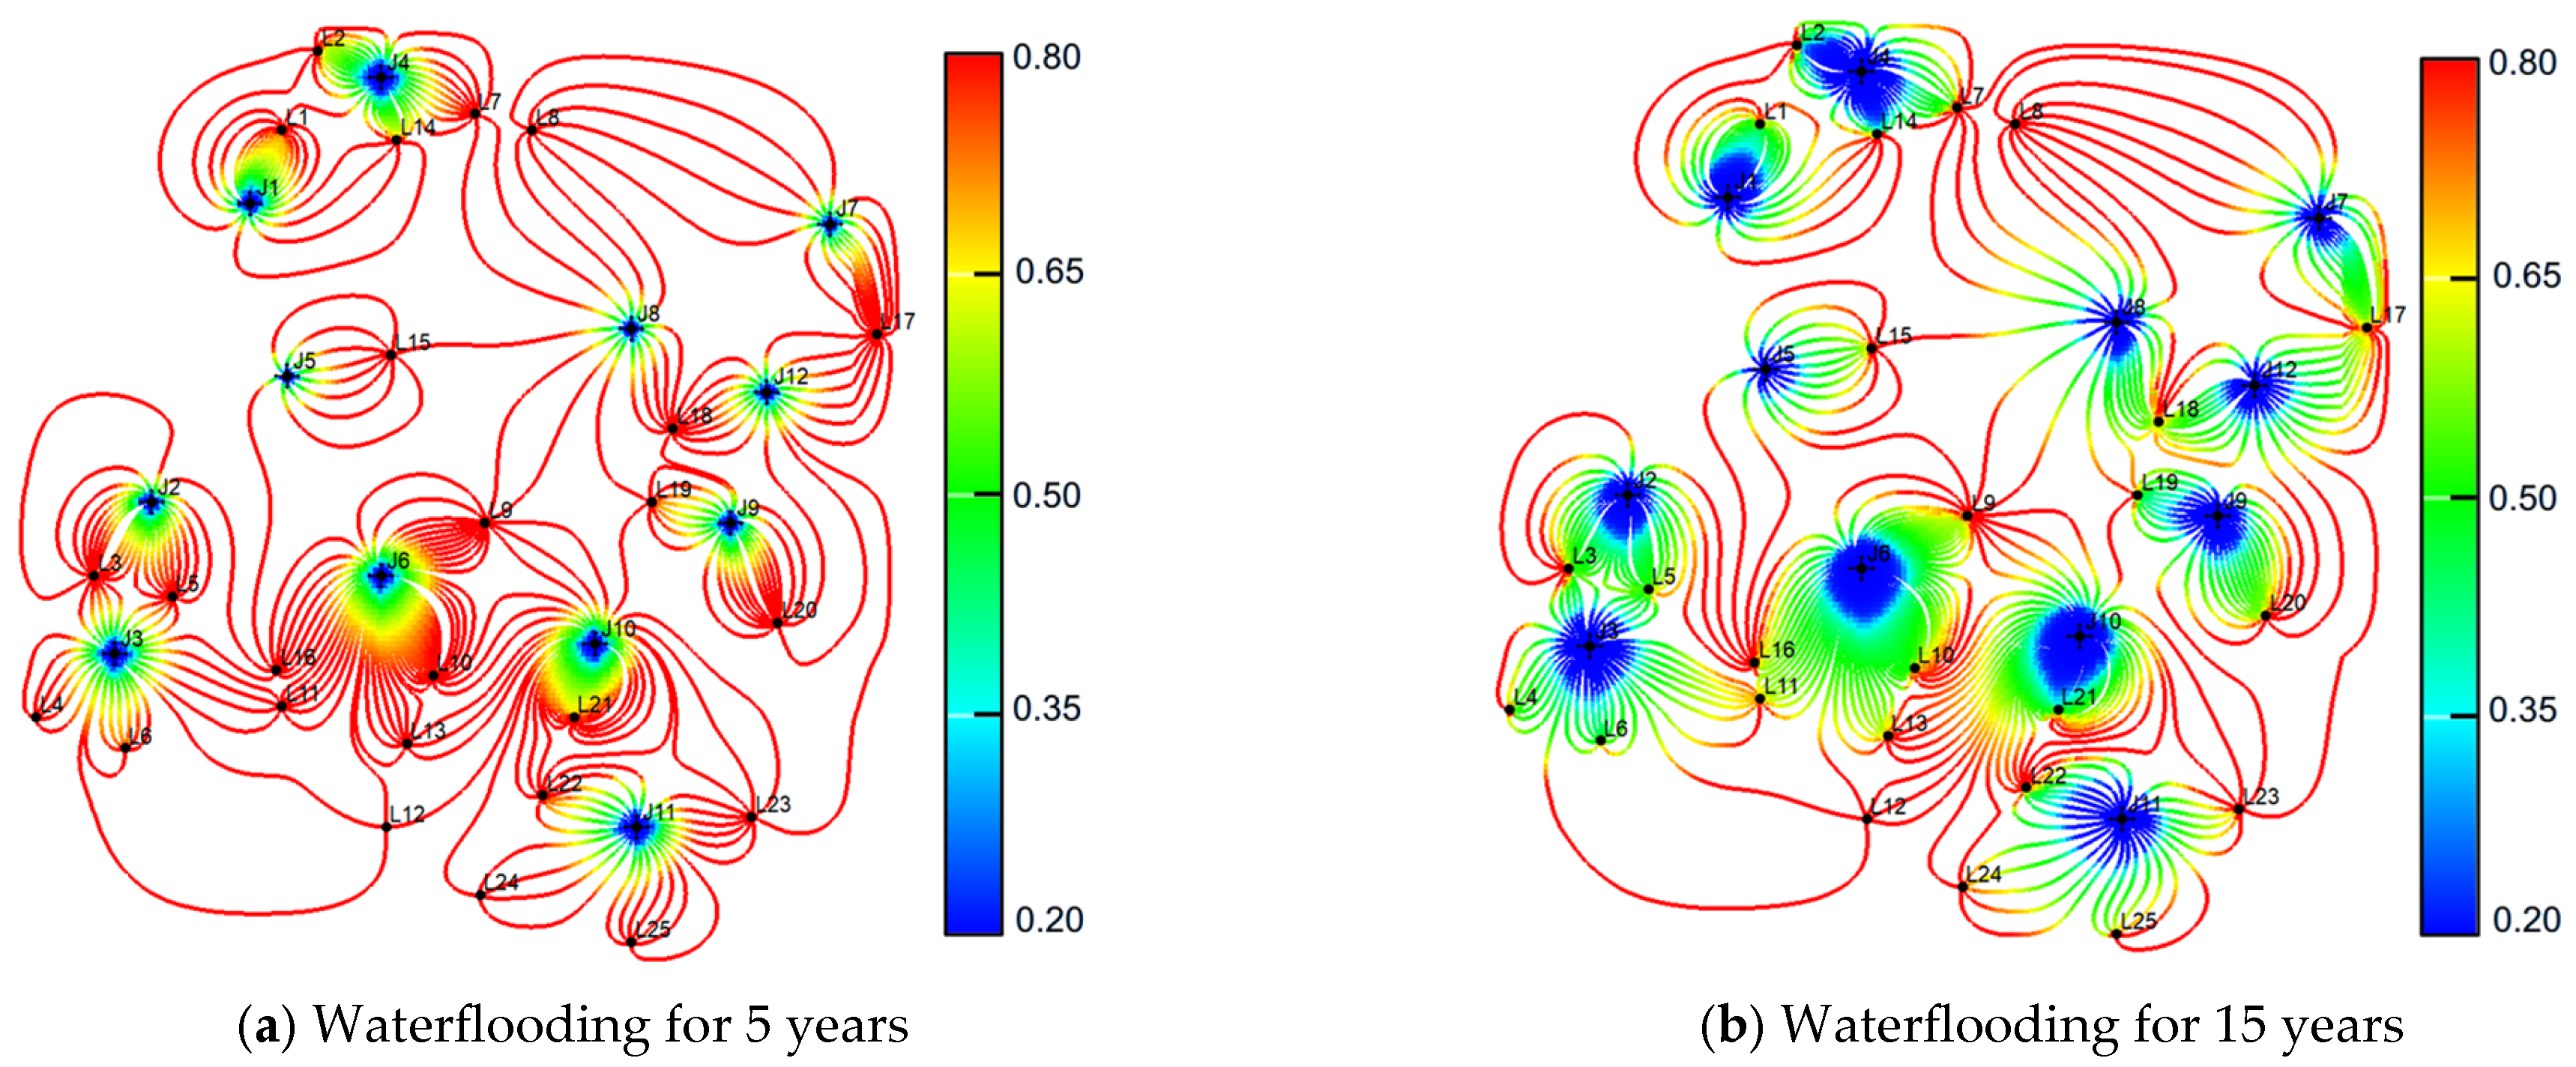
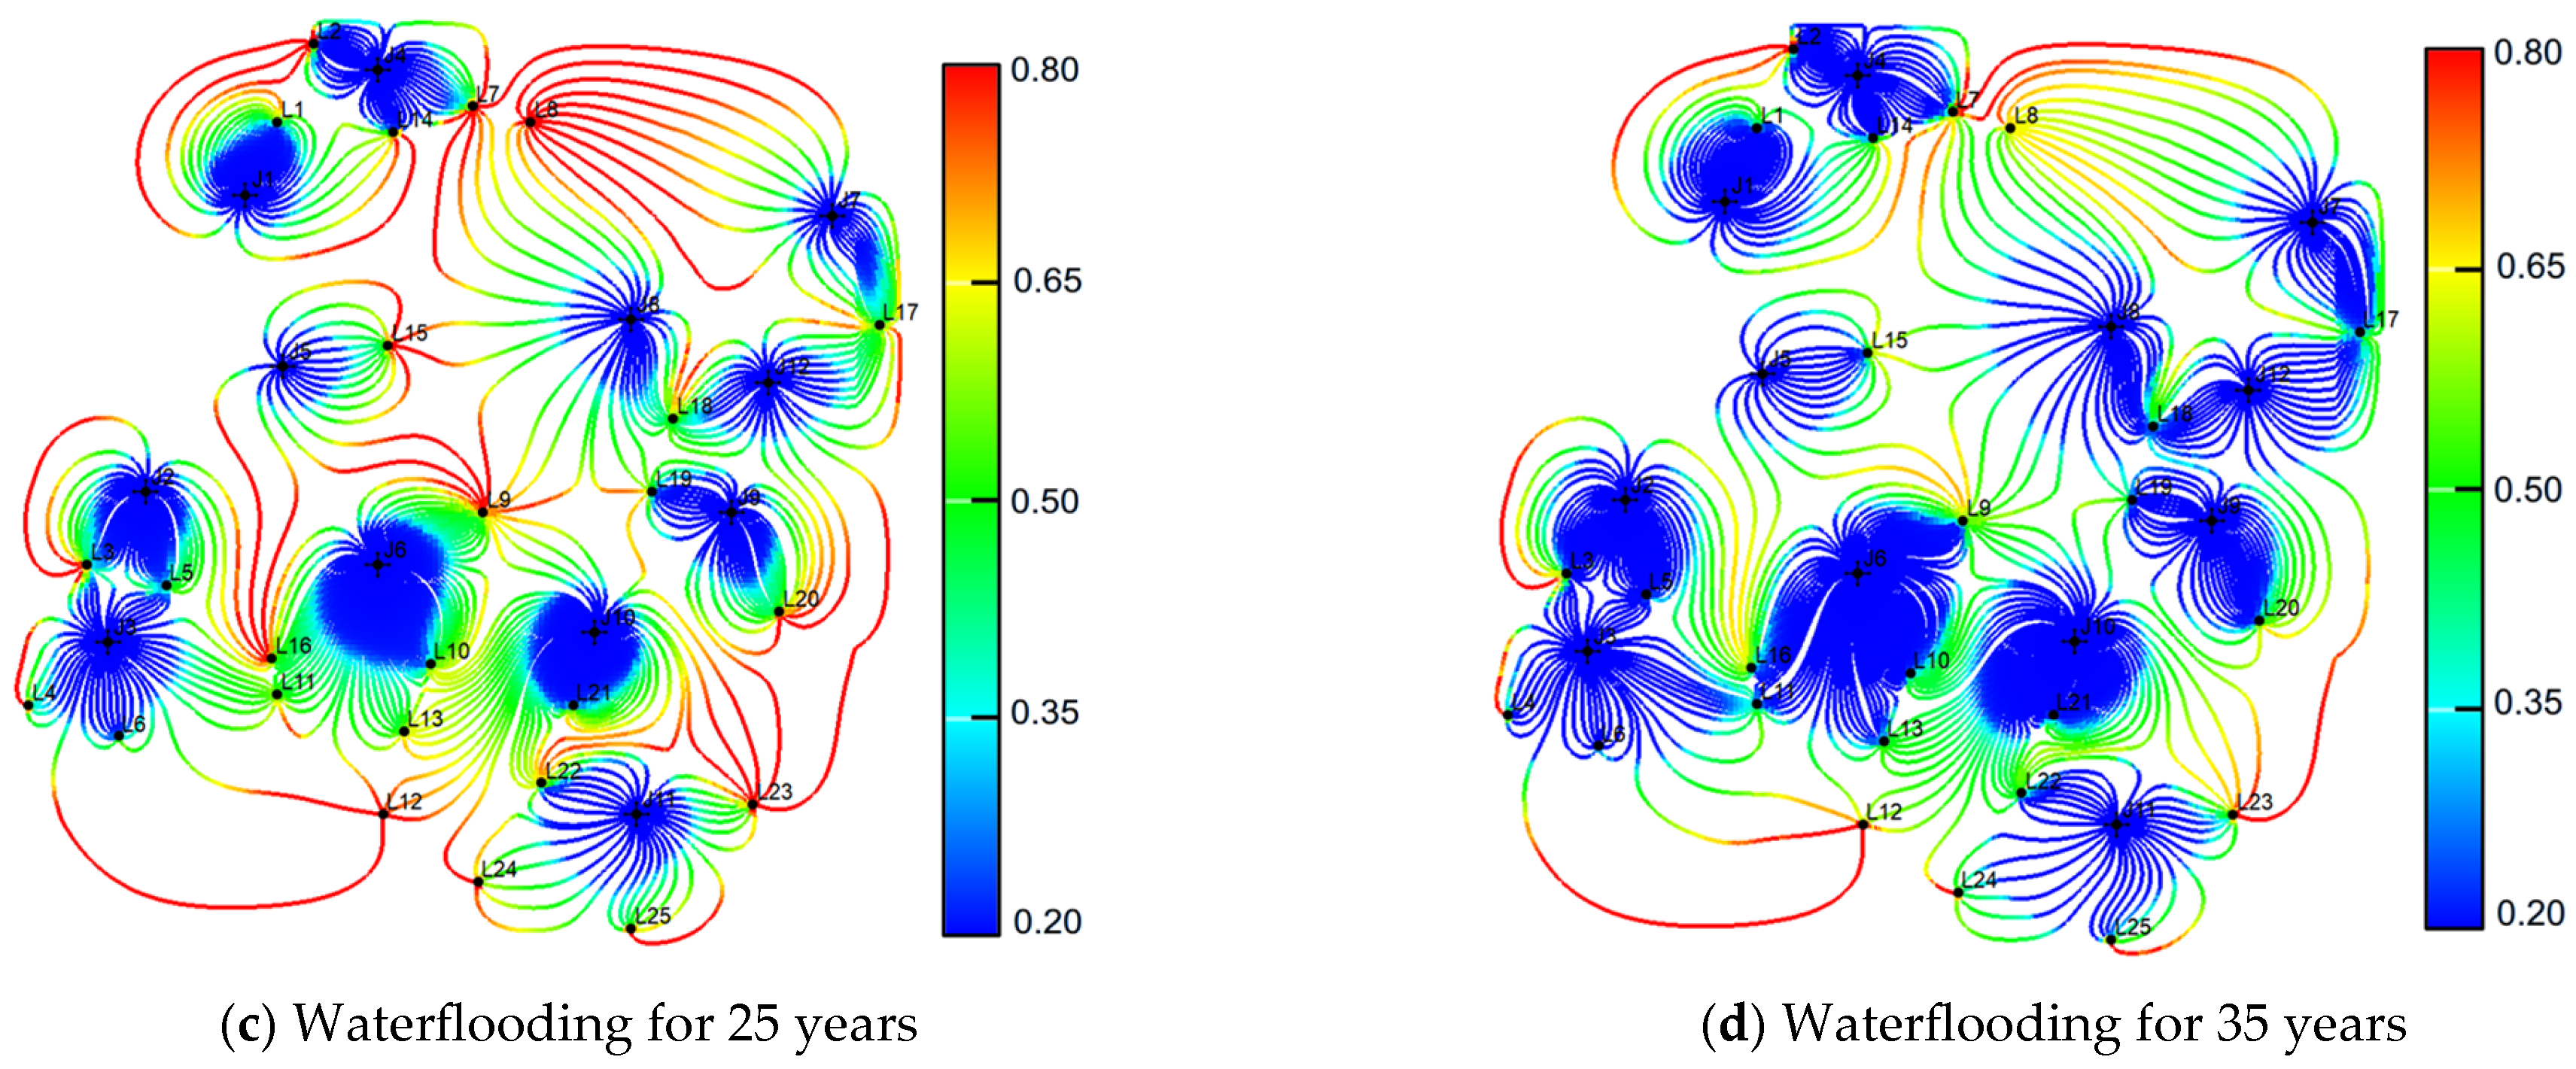
The streamline envelope of a DU is governed by the coupled effects of reservoir heterogeneity and formation energy during displacement, and evolves dynamically as development proceeds. To investigate the evolution patterns of DUs, a heterogeneous numerical simulation model was constructed using representative petrophysical parameters from the Daqing Oilfield. As shown in Figure 5, the evolution of a typical DU can be categorized into four stages: (1) Commissioning to the pre-waterflooding stage (Figure 5a), where fluid migration is dominated by the natural energy of the formation, and the DU flow zone remains relatively limited. (2) From the initial waterflooding to the water-breakthrough stage (Figure 5b), the injected water flows from the injector toward the producer, and the influence range of the DU expands progressively as the pressure transmission continues. (3) In the continuous water injection stage (Figure 5c), the spatial distribution of the DUs tends to stabilize, and a continuous interwell water-flow connection is established, typically along the preferential flow paths. (4) In the intensified water-inundation stage (Figure 5d), under the ultra-high water-cut stage, the streamline patterns in the high-water-cut and high water–oil-ratio zones changed markedly, and new preferential flow paths gradually developed within the DU, reflecting ongoing flow-field reconstruction.

3. Quantifying Preferential Flow Paths in DUs

Owing to differences in the interlayer petrophysical properties, the degree of reservoir utilization varies markedly among layers during oilfield development, and this interlayer interference is particularly pronounced in multilayer commingled reservoirs. Therefore, to mitigate interlayer interference and effectively implement development measures, such as separated water injection and reservoir-layer reorganization, it is essential to accurately characterize the production performance and remaining-oil distribution of each layer. As a key subdivided unit in the reservoir injection–production system, the DU provides the basis for layered dynamic analysis, evaluation of preferential flow paths, and investigation of the distribution of remaining oil. Accordingly, establishing an accurate quantitative characterization method for seepage within DUs is crucial for the efficient development of multilayer complex reservoirs.

3.1. Dynamic Splitting of Liquid Volume

In multilayer reservoirs, the delineation of injection–production relationships must fully consider the interlayer fluid-pressure equilibrium and flow-coupling effects. Using multilayer coupling models, the pressure distribution characteristics of injectors across layers can be analyzed, thereby enabling the estimation of the flow contribution from each layer. Traditional allocation methods primarily utilize permeability and thickness as governing parameters. However, in highly heterogeneous reservoirs, differences in interlayer permeability tend to induce distinct waterflooding paths, complicating the accurate characterization fluid flow behavior. Traditional allocation approaches include methods based on dynamic surveillance data, net pay thickness, and coefficient-based allocation factors (e.g., the permeability–thickness product, kh, or productivity indices). Generally, these techniques perform well in relatively homogeneous sandstone reservoirs with short perforation intervals and a limited number of production zones.
In this study, dynamic splitting was used to estimate the flow resistance parameters and distribution coefficients at the displacement unit scale. The method is based on injection–production balance and utilizes field-observed injector–producer connectivity. By incorporating time-varying reservoir properties, it allocates cumulative production and injection volumes to the DUs, thereby improving the accuracy of liquid-volume allocation.
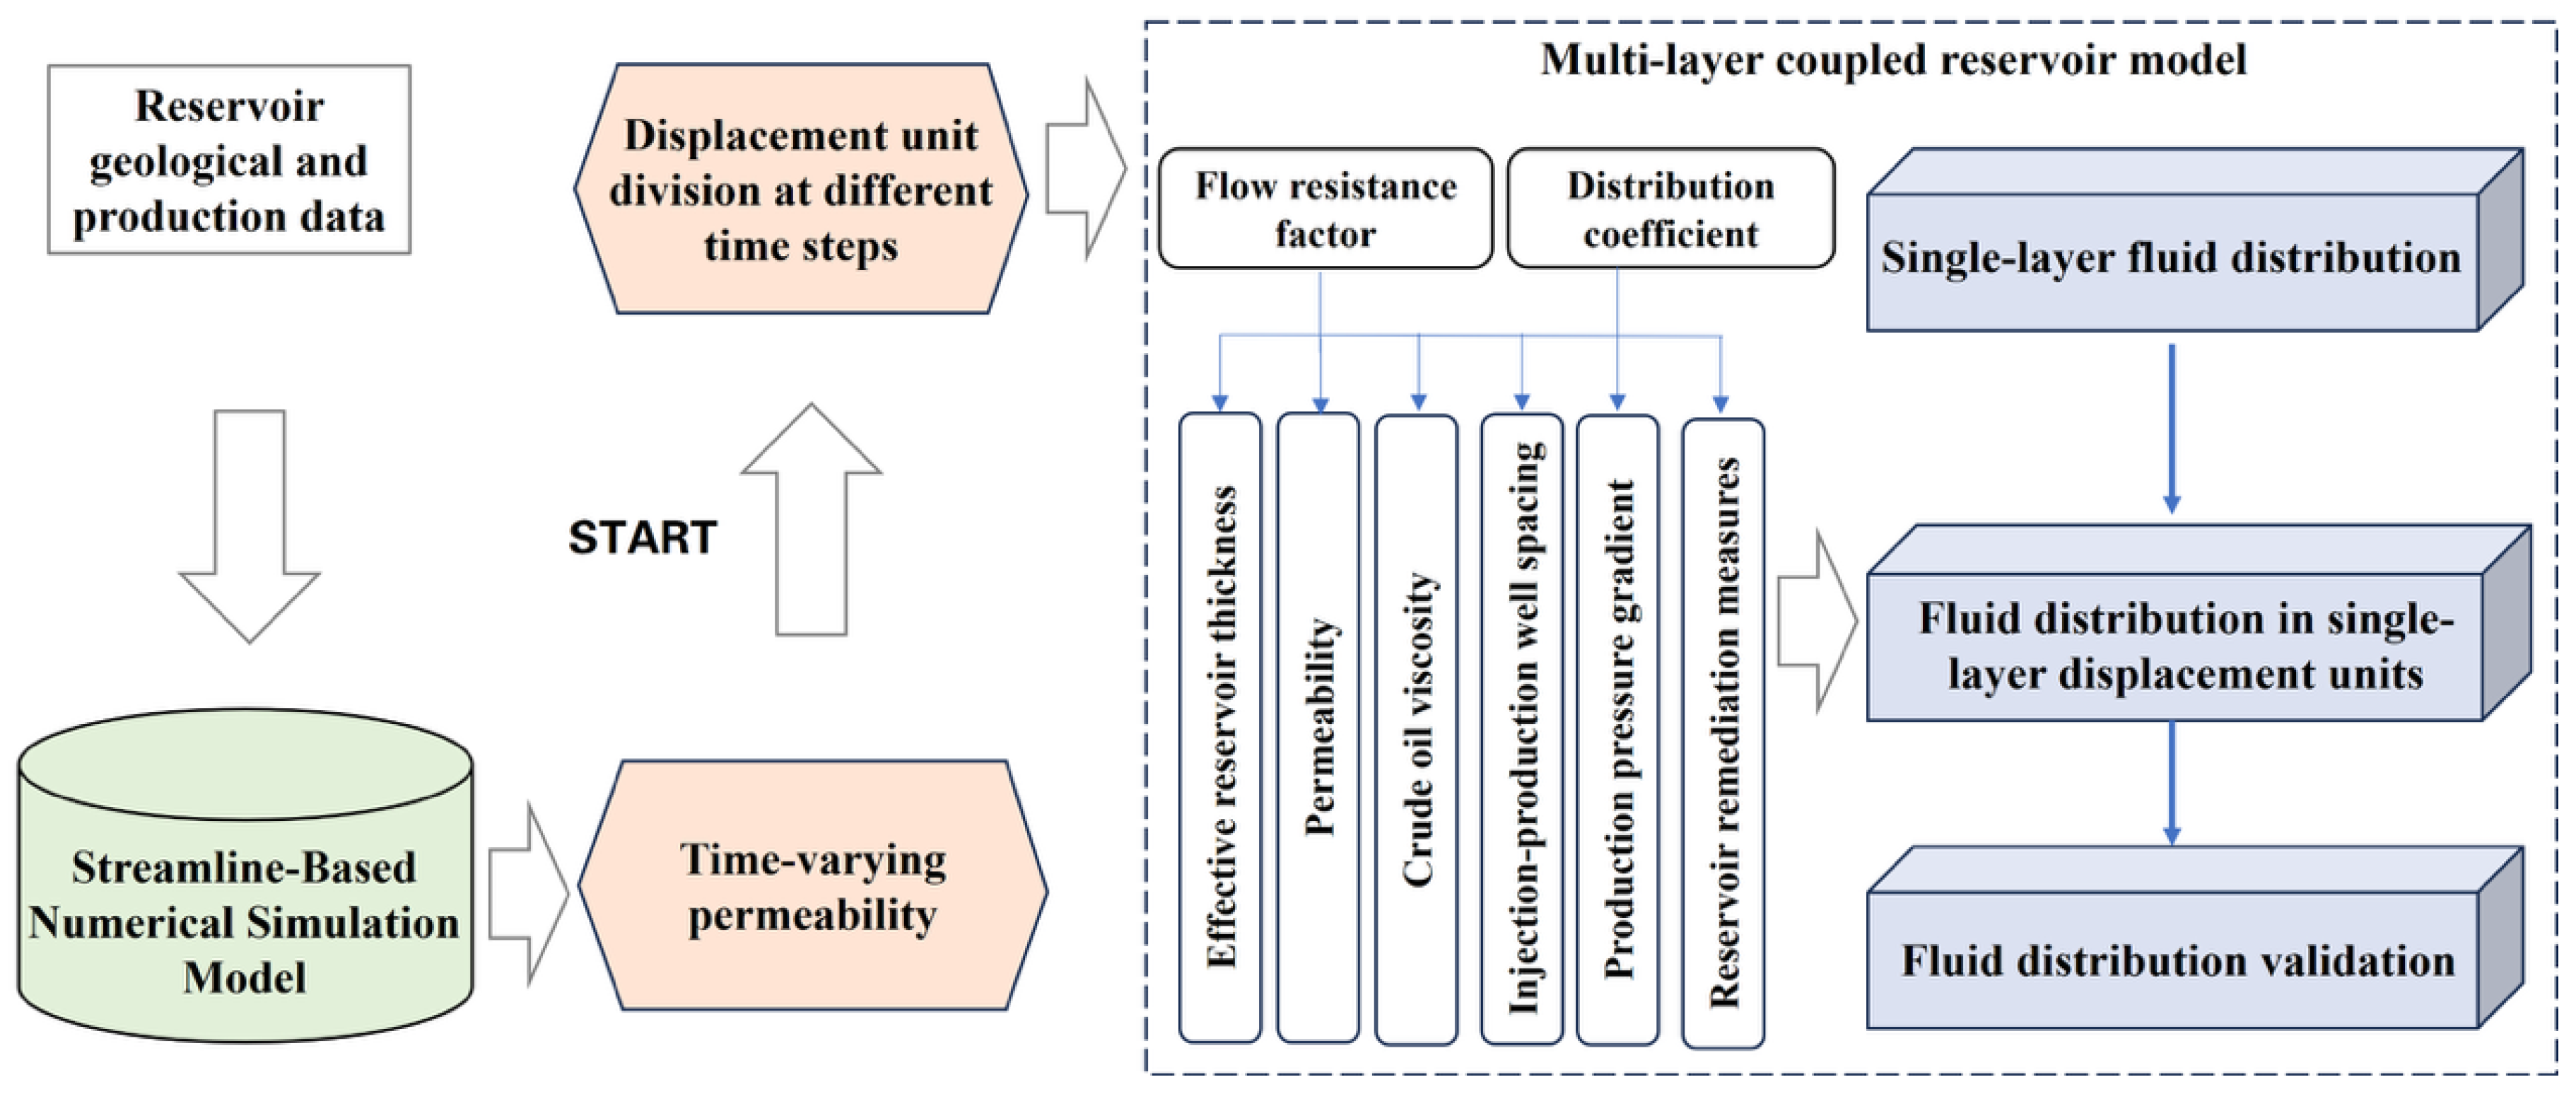
In the dynamic liquid-volume splitting procedure, the permeability term used in the flow resistance coefficient was treated as a time-dependent effective permeability rather than a fixed static parameter. For each DU, the initial interwell permeability was assigned from geological interpretation and field-calibrated reservoir properties. During calculation, the effective permeability was updated at the same time interval as the available production and injection records. In the present field application, monthly production and injection records were used; therefore, the effective permeability was updated once per month. Within each calculation interval, permeability was assumed to remain constant, whereas its temporal variation was represented by stepwise updating between adjacent time steps. The permeability evolution observed in the core waterflooding experiments was not directly substituted into the interwell calculation. Instead, it was used as a physical correction trend according to the initial permeability level and cumulative flooding intensity of each DU. The corrected DU-scale permeability was then introduced into the flow resistance coefficient, after which the corresponding vertical and areal splitting coefficients were recalculated. This implementation links the core-scale permeability evolution with DU-scale liquid-volume allocation while maintaining consistency with the temporal resolution of field data and ensuring reproducibility in practical applications. The solution procedure is described in Figure 6.
Dynamic splitting is well-suited for complex waterflooded sandstone reservoirs with pronounced heterogeneity, long perforated intervals, and multiple producing layers. This enables the accurate calculation of the fluid volumes allocated to the DUs over various time points. The basic solution steps are as follows:
(a) Splitting of layered water-injection volumes in multilayer waterflooded reservoirs:
Assuming that the fluid is an incompressible single-phase Newtonian fluid and neglecting gravity effects, the calculation is based on the injector–producer balance principle, as shown in the following equation:
Q w = N w k = 1 Q w k Q o = N o k = 1 Q o k Q w = Q o
where Qw and Qo are the water injection and oil production volumes (m3), respectively; Qwk and Qok are the injection and production volumes for the k-th layer (m3); k is the sublayer index; and N is the total number of sublayers.
For injectors with available injection profile data, the water injection rate for each sublayer can be directly determined from the measured profile. For injectors lacking injection profile data, the flow resistance coefficient of each sublayer in the direction of the surrounding production wells can be calculated by considering the injector as the center, based on the hydrodynamic similarity theory:
R k j = μ L j M k j H k j K k j
where Rkj is the flow resistance coefficient for the k-th layer of the injector in the direction of producer j (dimensionless); μ is the oil viscosity (mPa·s); Lj is the distance from injector to producer j (m); Mkj is the correction factor for the k-th layer in the direction of producer j (dimensionless); Hkj is the net pay thickness of the k-th layer in the direction producer j (m); and Kkj is the effective permeability of the k-th layer between the injector and producer j (10−3 μm2).
The value of M in the formula is determined based on the effectiveness of the applied stimulation measures. For instance, field statistics indicate that production can double shortly after fracturing, in which case, Mkj = 2. For unstimulated layers, Mkj was taken as 1, whereas for damaged or blocked layers, Mkj was set to a value close to 0. Considering both the permeability–thickness products of each injection layer and the flow resistance coefficients for each surrounding producer, and assuming that the injector penetrates n layers, the vertical allocation coefficient for the k-th injector layer can be expressed as follows:
C k = M k H k K k / m j = 1 R k j / m n k = 1 M k H k K k / m j = 1 R k j / m
By considering the reservoir conditions of each sublayer in oil and water wells, including reservoir thickness (H), permeability (K), and crude oil viscosity (μ), as well as development conditions such as injection–production well spacing (L), production pressure differential (ΔP), and stimulation treatment (M), the daily water injection rate at the wellhead can be allocated to each sublayer, thereby obtaining the layered water injection rate of the injector:
Q w k = Q w C k
where Ck is the vertical splitting coefficient for the k-th injector layer; Mk is the correction factor for the k-th sublayer (dimensionless); Hk is the net pay thickness of the k-th sublayer (m); Kk is the effective permeability of the k-th sublayer (10−3 μm2); m is the number of producers nearby the injector; and Qwk is the allocated water-injection volume for the k-th layer of the injector (m3).
(b) Areal liquid-volume splitting within a single-layer DU:
When multiple producers communicate with the same injector within a single layer, the splitting coefficient for the injected volume toward each producer is determined by the oil–water two-phase flow resistance between the injector and producer, as well as the bottomhole pressures of the producers. Assuming that m producers surround a given injector in the k-th sublayer, with oil–water two-phase flow resistance coefficients denoted as R1, R2, …, Rm, the volume split from injector i in layer k to producer j is given by
α i j k = Δ P i j k R i j k m j = 1 Δ P i j k / R i j k
Q i j k = Q w k a i j k
where αijk is the areal splitting coefficient from injector i to producer j in the k-th layer (dimensionless); ΔPijk is the pressure drop between injector i and producer j in the k-th layer (MPa); Rijk is the flow resistance coefficient between injector i and producer j in the k-th layer (dimensionless); and Qijk is the split volume from injector i to producer j in the k-th layer (m3).
(c) Verification of liquid-volume splitting results in DUs:
The split volume of injected water for a producer within a given layer is calculated by summing the water-injection volumes split from all the surrounding injectors to the producer. Assuming w injectors surround the producer in the k-th layer, the layered liquid volume for the k-th layer of the producer can be expressed as
Q o w k = w j = 1 Q i j k
The calculated layered liquid volume is corrected based on the actual measured liquid volume. The layered liquid volume of the producer, obtained after splitting, is compared and verified against the original liquid production profile monitored on-site, thereby ensuring the method’s accuracy and reliability.

3.2. Saturation Tracking Calculation

In traditional waterflooding reservoir models, the relationship between the relative permeability of the oil and water phases and saturation is commonly assumed to be linear. However, the actual flow behavior indicates that this relationship becomes increasingly complex and deviates from standard models in mature reservoirs. In the later stages of waterflooding, especially under high-water-cut conditions, the flow characteristics and oil saturation exhibit pronounced nonlinear behaviors. To resolve this, the φ-function theory provides a more accurate framework for describing the nonlinear relationship between relative permeability and oil saturation during waterflooding [37]. By introducing this function, the time-varying evolution of water saturation under long-term waterflooding can be quantitatively characterized.
According to the Buckley–Leverett theory (neglecting gravity and capillary forces, and assuming constant fluid viscosity and incompressibility), the partial differential equation describing the evolution of the saturation front at position x and its variation over time (t) can be expressed as follows:
d x d t = Q ϕ A f w S W
φ S W = f w S w = f w S W
x x 0 = φ S W ϕ A 0 t Q d t
φ S W = ϕ A x x 0 W i ( t )
where x0 is the initial position of the injector (m); ϕ is the porosity (dimensionless); A is the reservoir cross-sectional area (m2); φ(Sw) is the derivative of the water fractional flow function (fw) with respect to water saturation (Sw) (dimensionless).
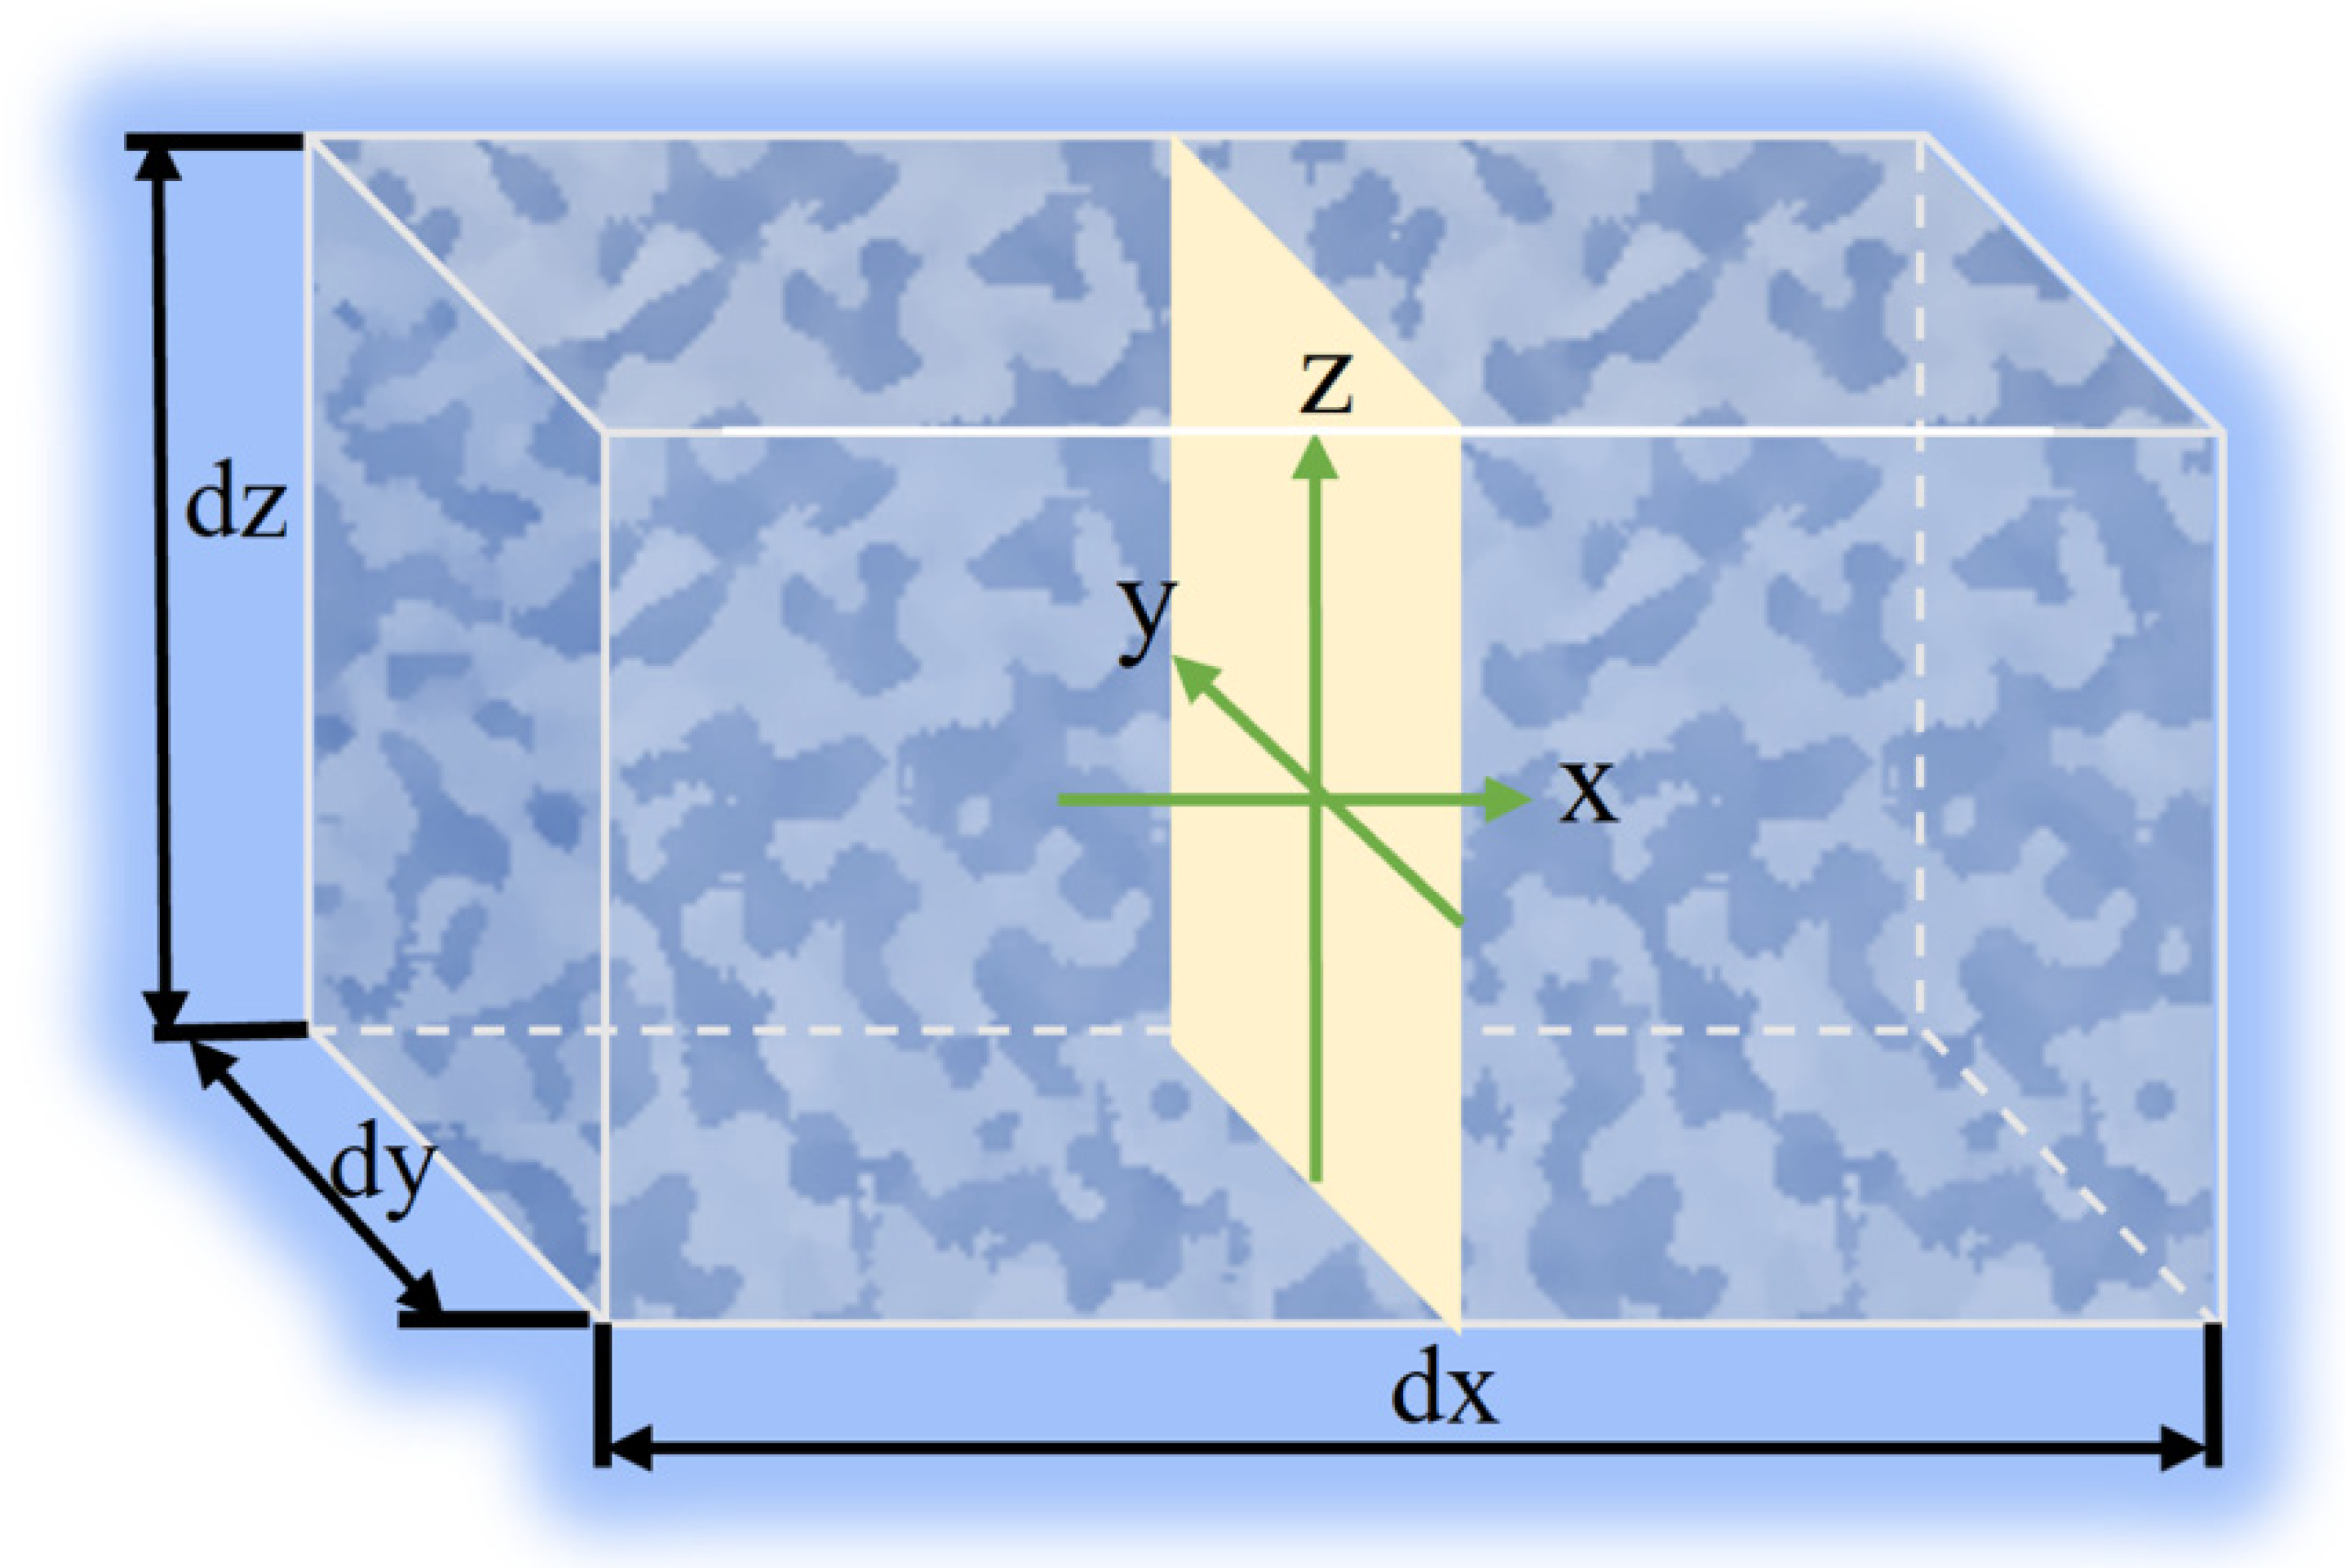
In three-dimensional space, as illustrated in Figure 7, for a given time t and the corresponding cumulative injection volume Wi(t), the water saturation Sw at location (x,y,z) within the reservoir is defined as
φ x S w = φ x 1 S w 1 + ϕ A x x 2 x 1 W i t
φ y S w = φ y 1 S w 1 + ϕ A y y 2 y 1 W i t
φ z S w = φ z 1 S w 1 + ϕ A z z 2 z 1 W i t
where φx1, φy1, and φz1 represent the upstream φ-function in the x, y, and z directions, respectively. The φ-function at point (x,y,z) can be approximated by taking the arithmetic average of the three directional values:
φ S w = 1 3 φ x + φ y + φ z
Relative permeability curves are crucial in reservoir engineering for characterizing the oil–water two-phase flow capacity as a function of saturation, particularly in mature reservoirs under ultra-high water-cut conditions. Although these curves are traditionally determined through laboratory core flooding experiments, empirical models offer a robust alternative for approximation. To capture the nonlinear behavior of these flow relationships, normalized relative permeability correlations can be derived by dimensionally normalizing the experimental data [38].
k r o = k r o e n d S o S o i 1 S o r S w i n o
k r w = k r w e n d S w S w i 1 S o r S w i n w
The relationship between the water cut (fw) and water saturation (Sw) can be derived directly from the relative permeability curves:
f w S w = k r w / μ w k r o / μ o + k r w / μ w
φ S W = f S w = f S w f 2 S w n o 1 S w S o r + n w S w S w i
where k r o e n d is the oil-phase relative permeability at residual water saturation (dimensionless); k r w e n d is the endpoint relative permeability to water at remaining-oil saturation (dimensionless); kro is the relative permeability to oil (dimensionless); krw is the relative permeability to water (dimensionless); Sw is the water saturation (fractional); Swi is the initial water saturation (fractional); Sor is the remaining-oil saturation (fractional); no is the oil-phase permeability index (dimensionless); nw is the water-phase permeability index (dimensionless); μw is the water viscosity (mPa·s); μo is the oil viscosity (mPa·s).
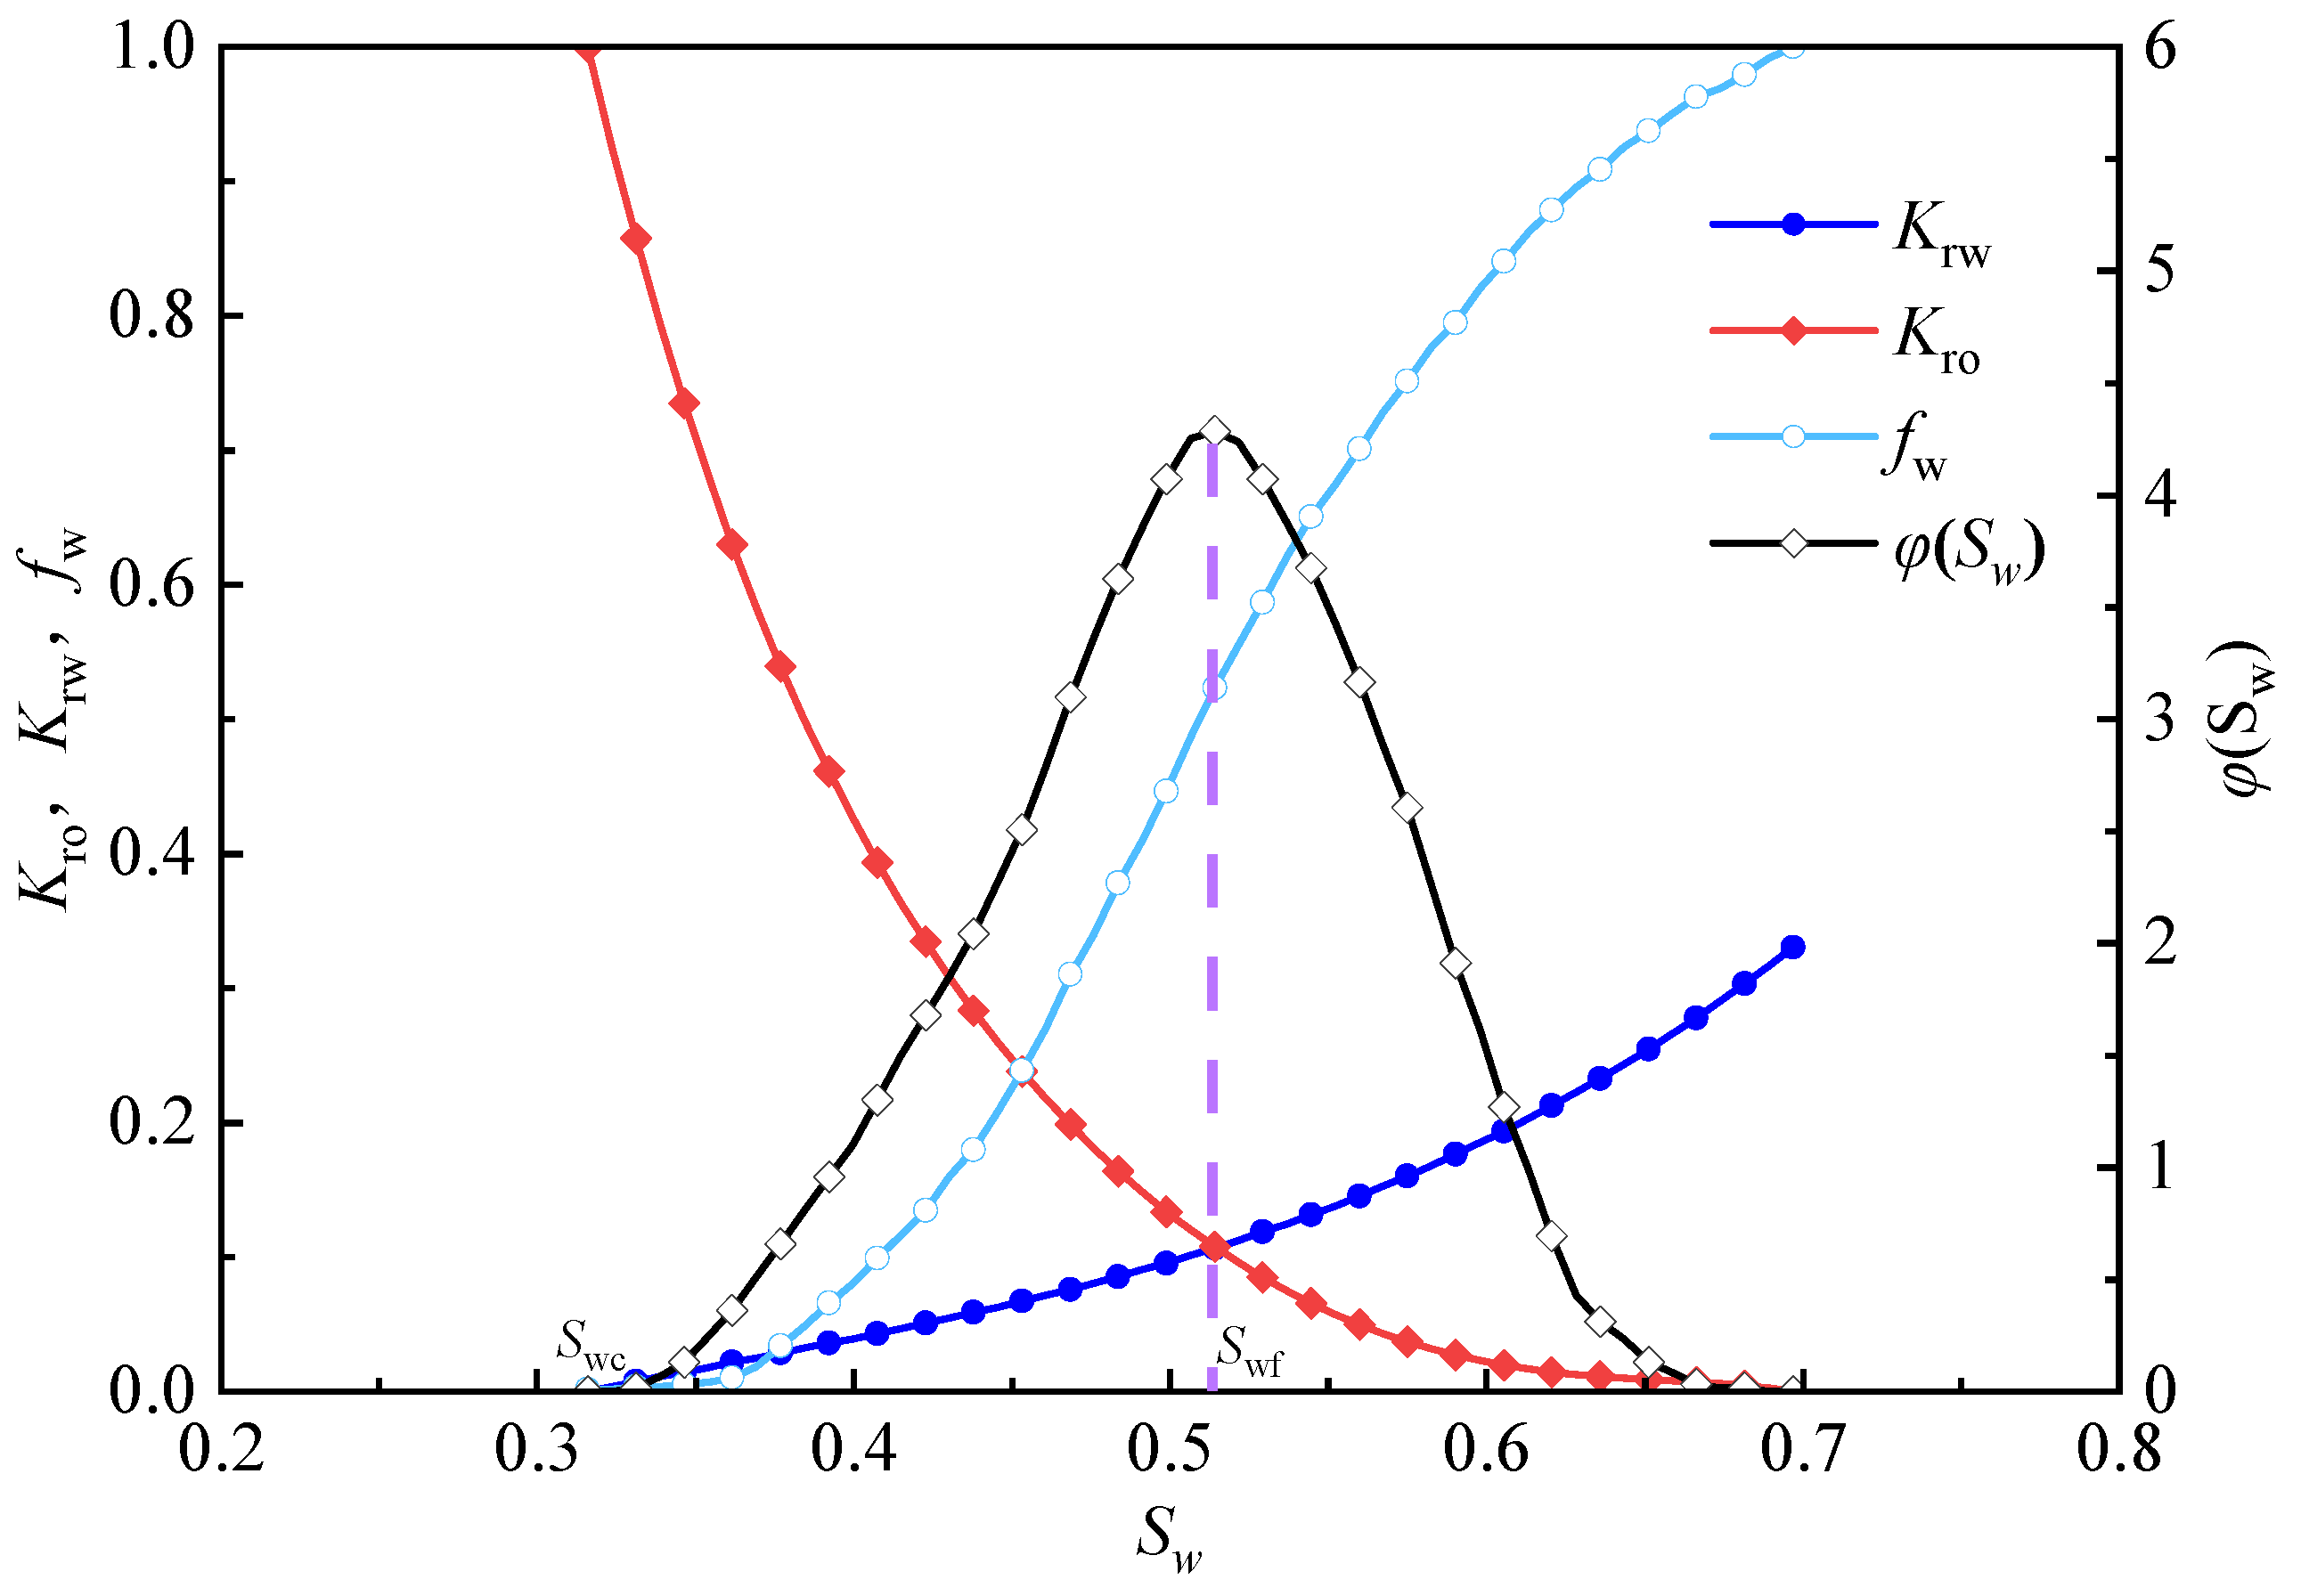
Utilizing the oil–water relative permeability curves obtained from reservoir experiments, the relationships among water saturation (Sw), water cut (fw), and φ(Sw) can be further derived, as shown in Figure 8. In practical reservoir development, water saturation increases at a specific location, contingent upon the arrival of the oil–water front. Prior to this arrival, Sw remains equal to the irreducible water saturation (Swi), regardless of variations in fluid flux. Under these conditions, the calculated φ(Sw) value theoretically exceeds its corresponding value at the displacement front. Therefore, incorporating this physical limitation, a more accurate expression for calculating oil saturation using the φ(Sw) function can be derived as follows:
S o = 1 φ 1 S w , φ S w φ S wf 1 S wc , φ S w > φ S wf
where φ−1(Sw) is the inverse function of φ(Sw). The water saturation at any point in the reservoir can be determined from the calculated φ-function and the variation curve of the φ-function shown in Figure 8, after which the corresponding water cut can be further obtained.

3.3. Techno-Economic Evaluation of Strong Preferential Flow Paths

In studies on ultra-high water-cut reservoirs in China, conventional methods generally use a water cut of 98% as the criterion for identifying the formation of strong, dominant seepage channels. However, this criterion does not adequately account for economic factors and, therefore, cannot effectively reflect the actual extent of ineffective water circulation [39,40]. To address this limitation, an economic water-cut limit was introduced in this study. The economic water-cut limit is used here as an operating-level break-even screening criterion rather than a full project-level investment model. It evaluates whether the current DU production remains economically viable under given oil price, liquid-handling cost, and daily operating cost. Intervention-specific costs and post-treatment cash-flow indicators are therefore not included in the present formulation, but are considered in the subsequent discussion of field decision making. This is defined as the maximum water cut at which the production of a single well or oilfield can remain at the break-even point under specific technical and economic conditions. This method provides a new basis for determining whether ineffective water circulation exists between the injection and production wells during the ultra-high water-cut stage. Crude oil production costs, which are the primary determinants of these economic limitations, comprise both fixed and variable expenses. By accounting for fluctuating oil prices, liquid processing costs, and operating expenditures, a comprehensive model is proposed to determine the economic water-cut limit for both individual wells and DUs. Integrating these parameters based on the principle of input–output balance, the expression for the economic water-cut limit is derived as follows:
Q o V o = Q T V T + V w
The relationship between daily liquid production, daily oil production, and water cut for a single well can be expressed as
Q o = Q T × ( 1 f W )
Substituting Equations (21) and (22) yields the economic water-cut limit (fw) as follows:
f w = 1 Q T V T + V w Q T V o
The reservoir injector–producer system is conceptualized as multiple DUs. By discretizing the system into n units, the liquid production of each unit can be determined using the dynamic splitting method. Because the specific operating cost for an individual DU is unknown, it is approximated using the field-wide average of well operating expenditures. Accordingly, the economic water-cut limit (fw) of a DU can be expressed as
f w i = 1 Q i j k V T + V w n Q i j k V o
where Qo is the daily oil production per well (t/d); QT is the daily liquid production per well (t/d); Vo is the crude oil price (¥/t); VT is the liquid-handling cost per ton of produced fluid (¥/t); Vw is the daily operating cost per well (¥/(well·d)); n is the number of DUs (dimensionless); fw is the economic water-cut limit per well (%); and fwi is the economic water-cut limit for DUs (%).

4. Case Study

4.1. Reservoir Overview

The proposed method was applied to a typical case in the Daqing Oilfield to verify its reliability and applicability. The target area, located in the northern Lamadian Block, is a medium-to-high-permeability reservoir in the ultra-high water-cut development stage. This region, known as Northeast Field II within the Daqing Placentric line, features stable fluid contacts and a unified hydrodynamic system. Key reservoir parameters include a gas–oil contact at about −770 m and an oil–water contact at −1050 m, resulting in an oil column of ~280 m and a gas column of ~90 m. The irreducible water saturation was 23.5%, and the initial oil saturation was 76.5%. The development began in 1974 and targeted four main water-flooding intervals. As of December 2020, the cumulative injection–production ratio was 1.0, with an annual natural decline rate of 8.06% and an overall decline rate of 2.89%. The field currently has a water–oil ratio of nearly 40 and significant waterflooding in the main net pay zones. As this multilayer system advances to the ultra-high water-cut stage, the remaining-oil distribution becomes highly fragmented, posing significant challenges for future enhanced recovery efforts.
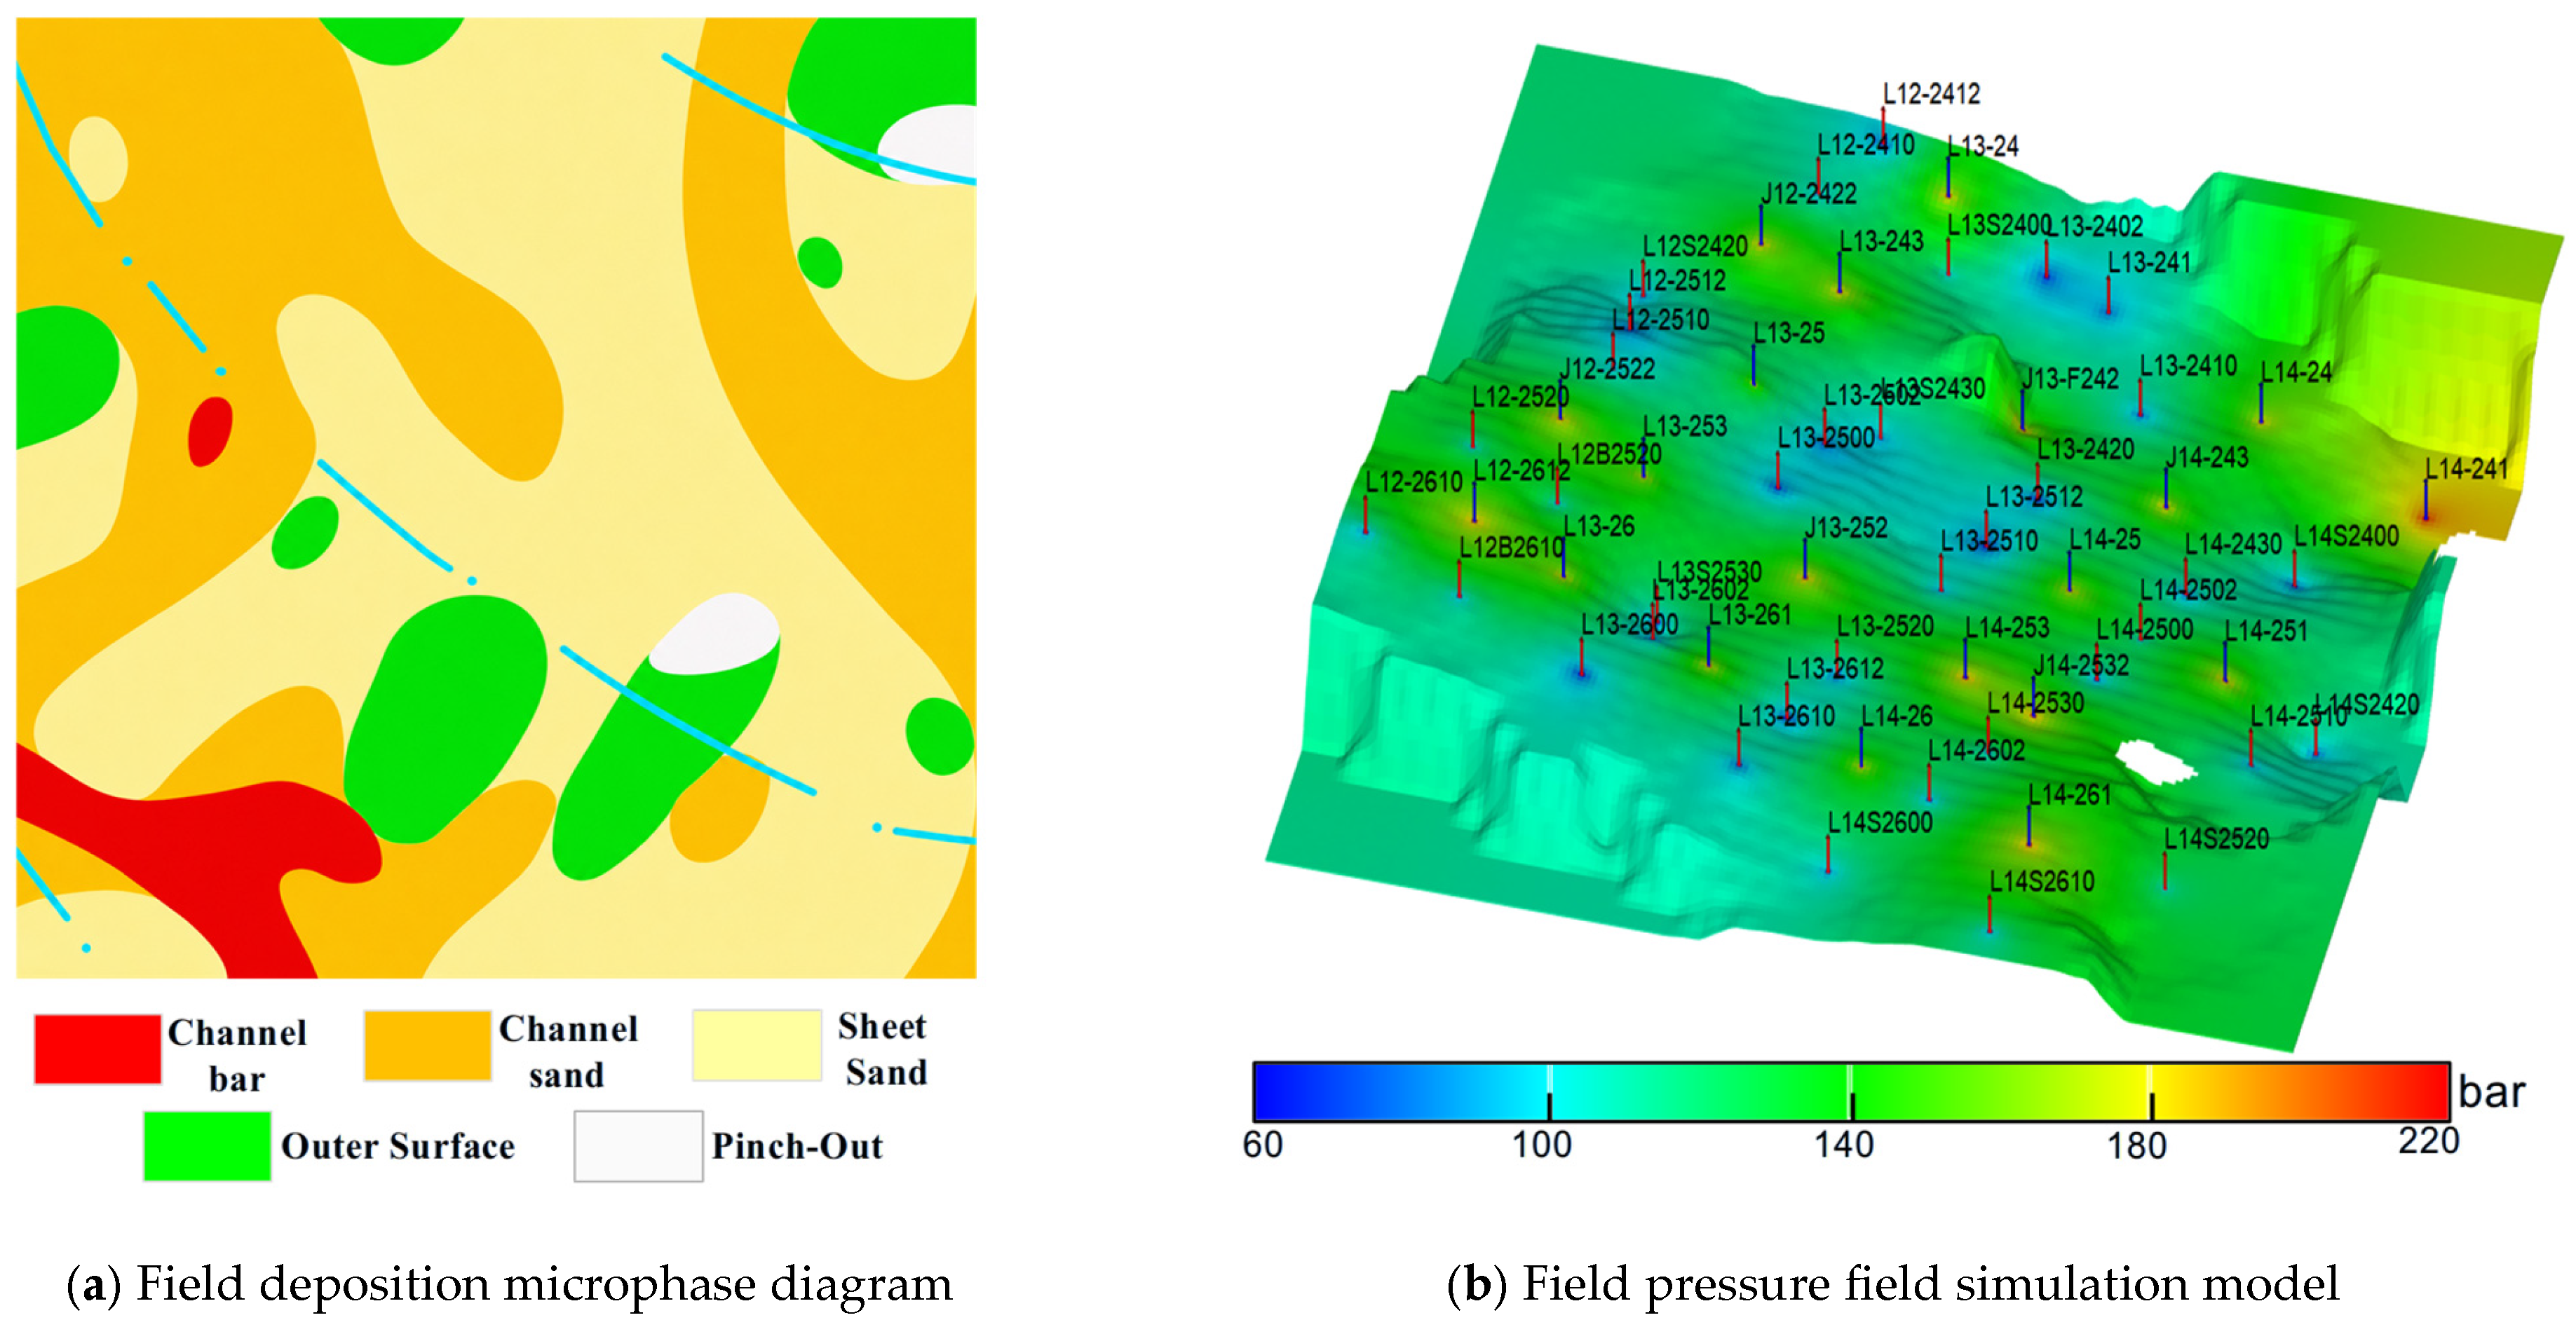
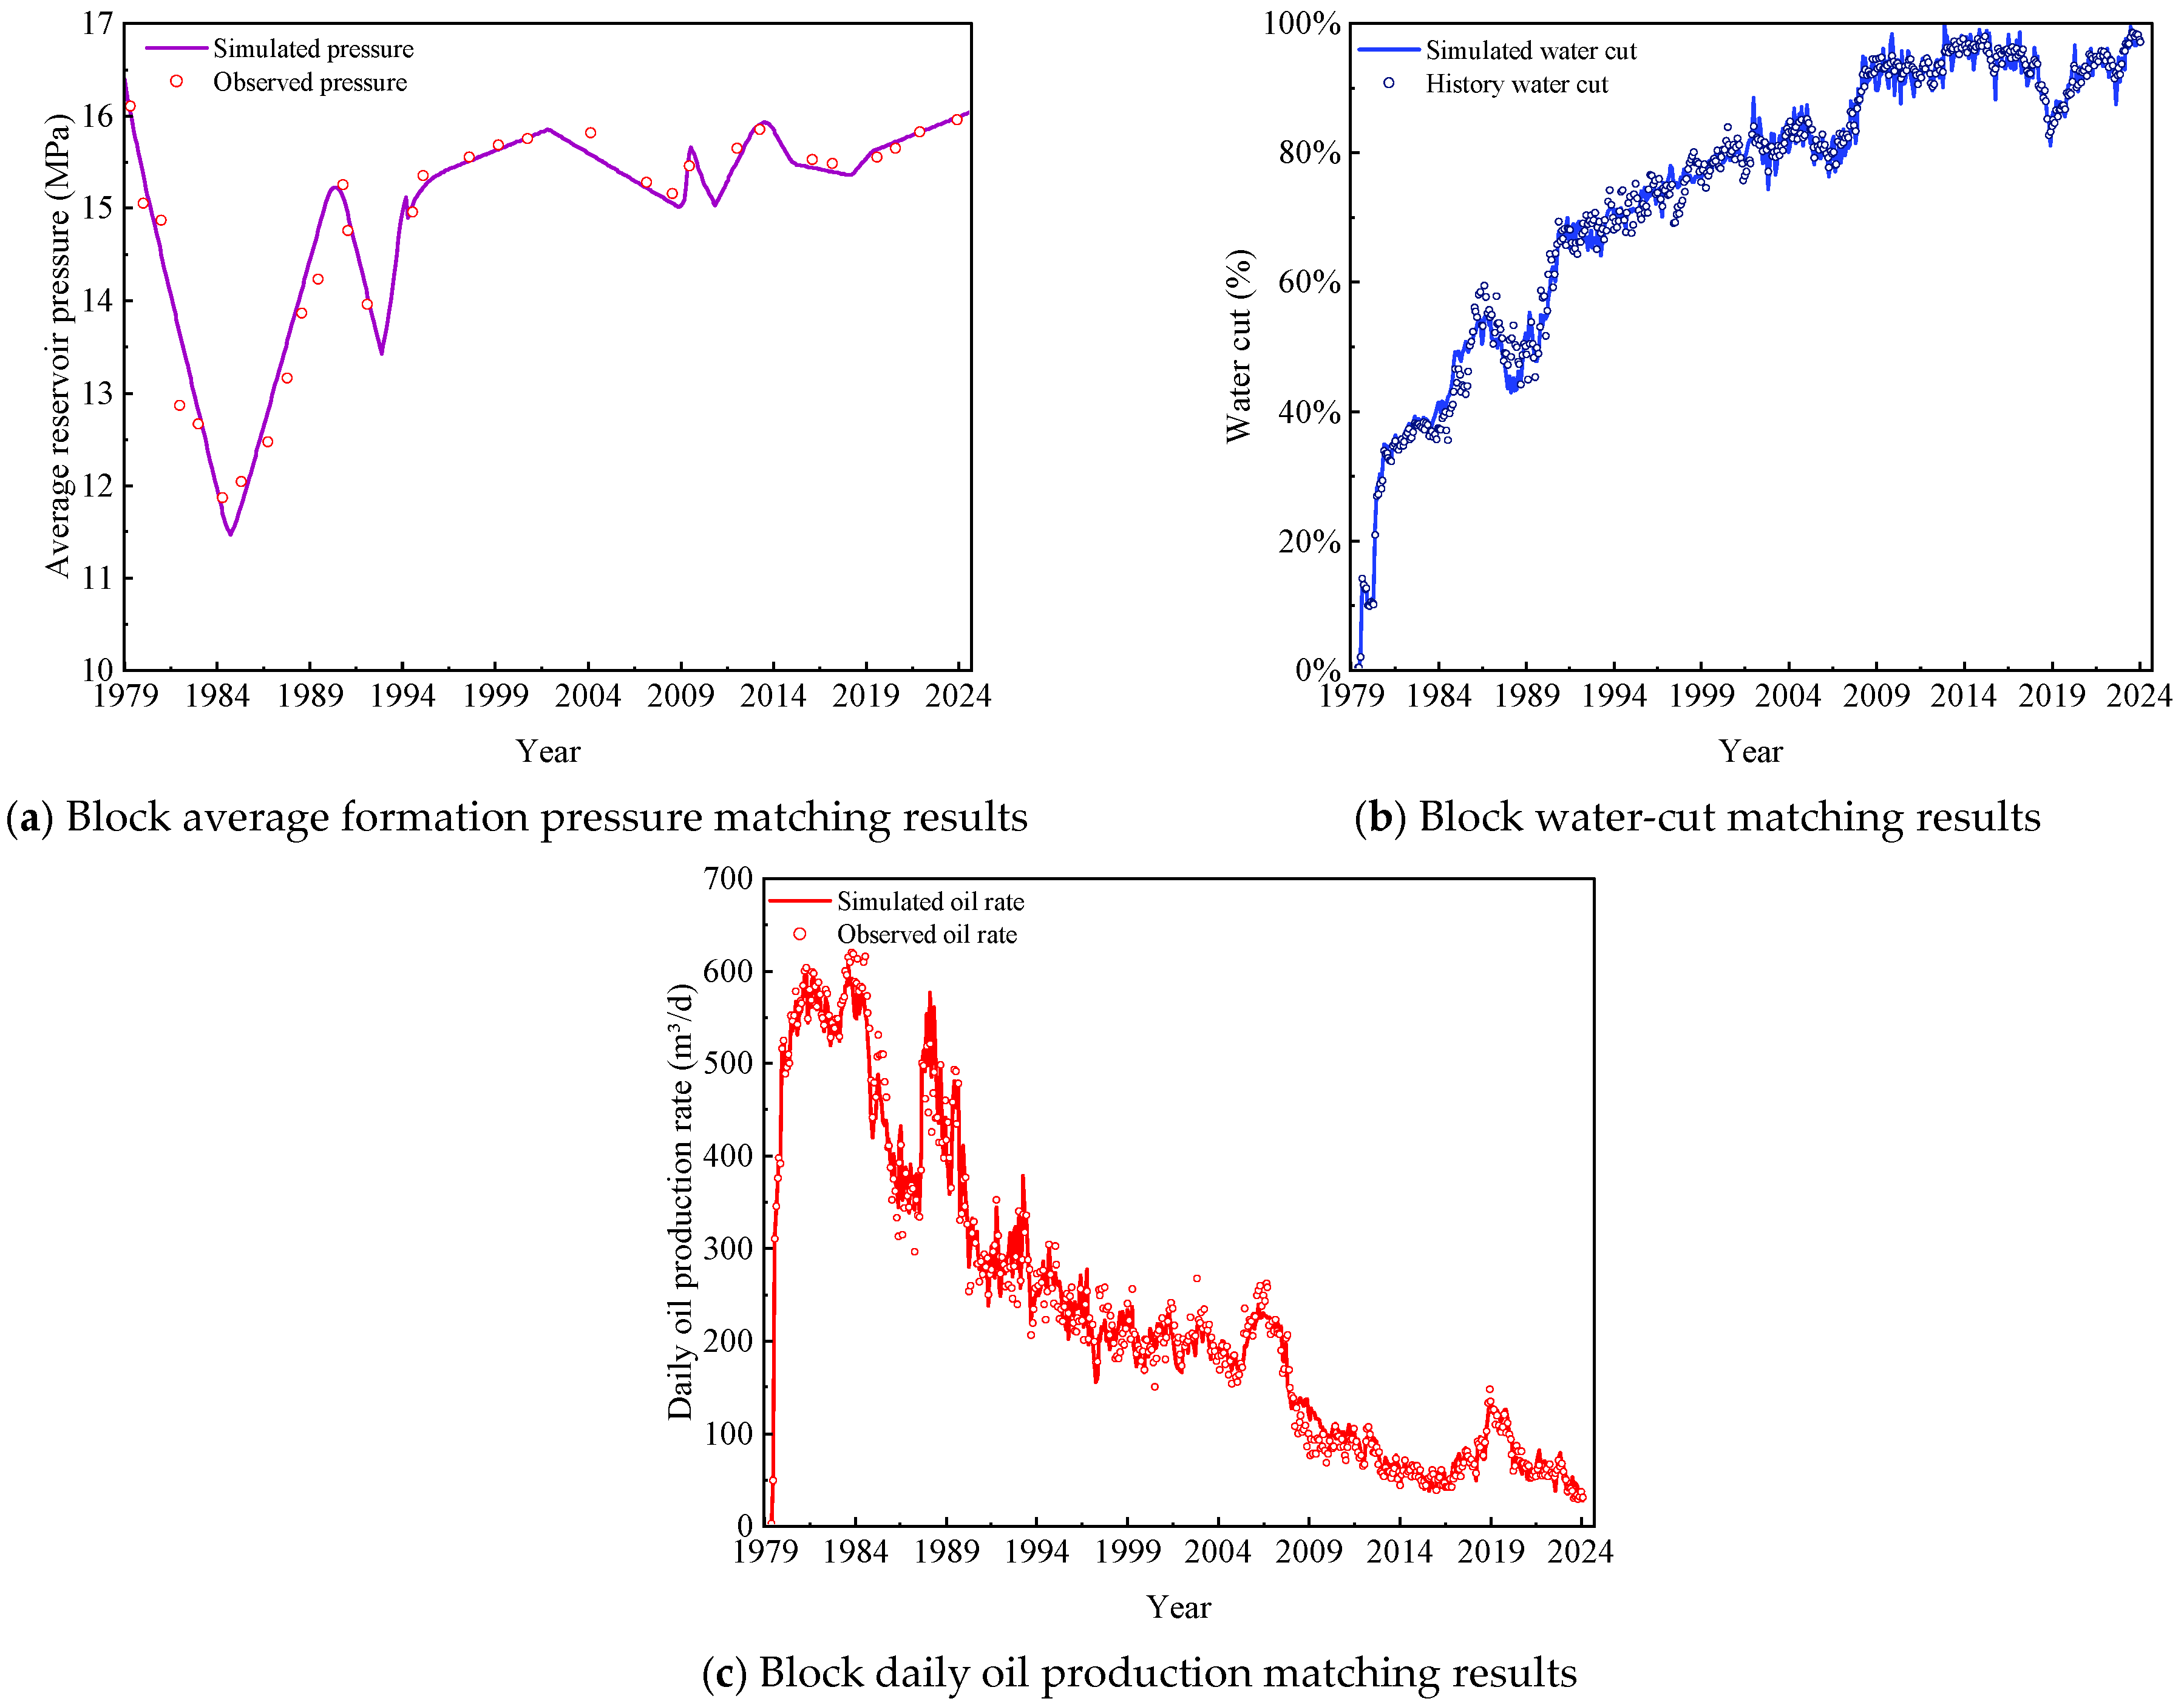
To quantitatively characterize the distribution of ineffective flow paths in the DUs of the target block, this study combined geological data, sedimentary facies maps, production history, and pressure monitoring data to build a fine-scale three-dimensional numerical simulation model (Figure 9). For the simulation, core experimental data on relative permeability were normalized to create standardized oil–water relative permeability curves, which describe the two-phase flow behavior at the reservoir scale. To ensure the accuracy of the subsequent velocity field extraction, streamline tracking, and displacement unit identification, we performed history matching using 45 years of production data. The adopted history-matching strategy was “global-to-local and pressure-before-water cut”, iteratively correcting key parameters, including permeability, net-to-gross ratio, and relative permeability endpoints, subject to geological constraints. Figure 10 illustrates the history-matching results for the key indicators, including average reservoir pressure, water cut, and oil production rate. The history-matching error for formation pressure was less than 5%, and the overall water-cut matching accuracy was 92%. This demonstrates that the history-matched numerical model effectively captured the dynamic evolution of the flow and pressure fields in the target waterflood reservoir.
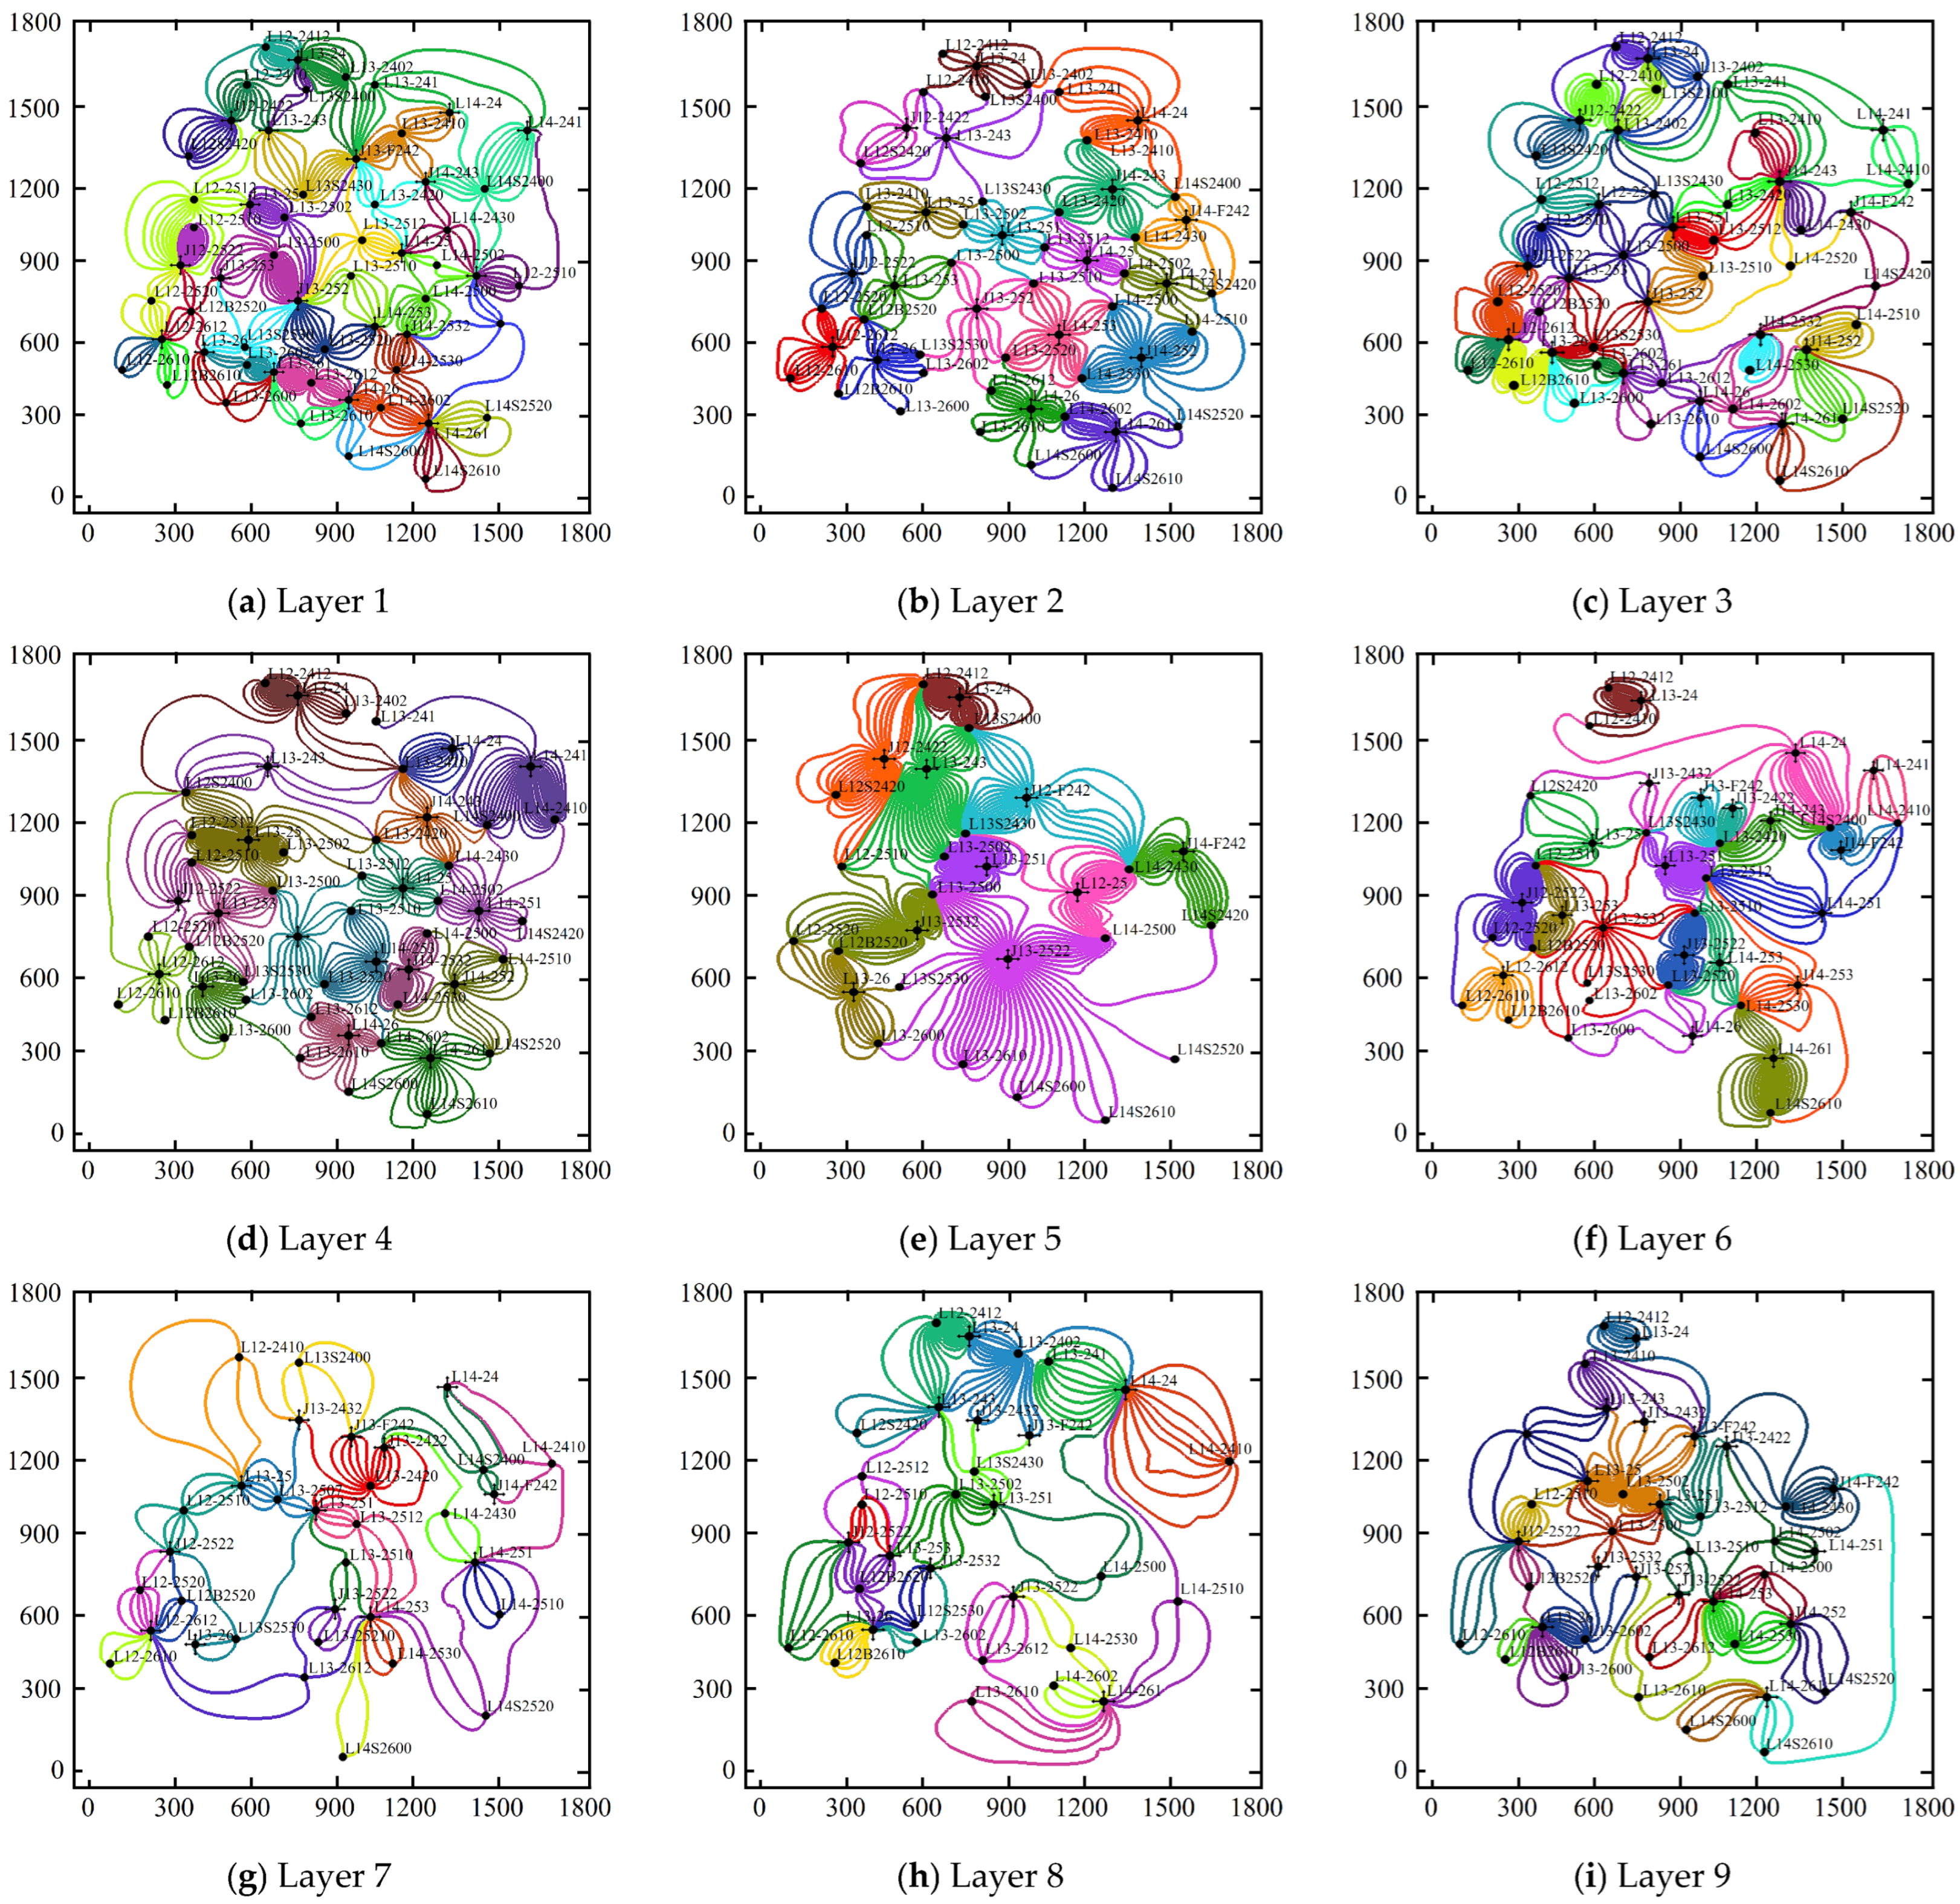
Using the history-matched reservoir numerical simulation model, DU identification was performed across 65 injectors and producers and 36 sublayers within the target block, employing the previously mentioned characterization method (Figure 11). The results show that the streamlines in the DUs of the main producing layers are densely distributed, with clearly defined injection–production relationships. In total, 902 DUs were delineated based on the streamline envelopes of the active well patterns. These results provide a reliable baseline dataset for the subsequent quantitative characterization of the preferential flow paths.

4.2. Reliability Validation

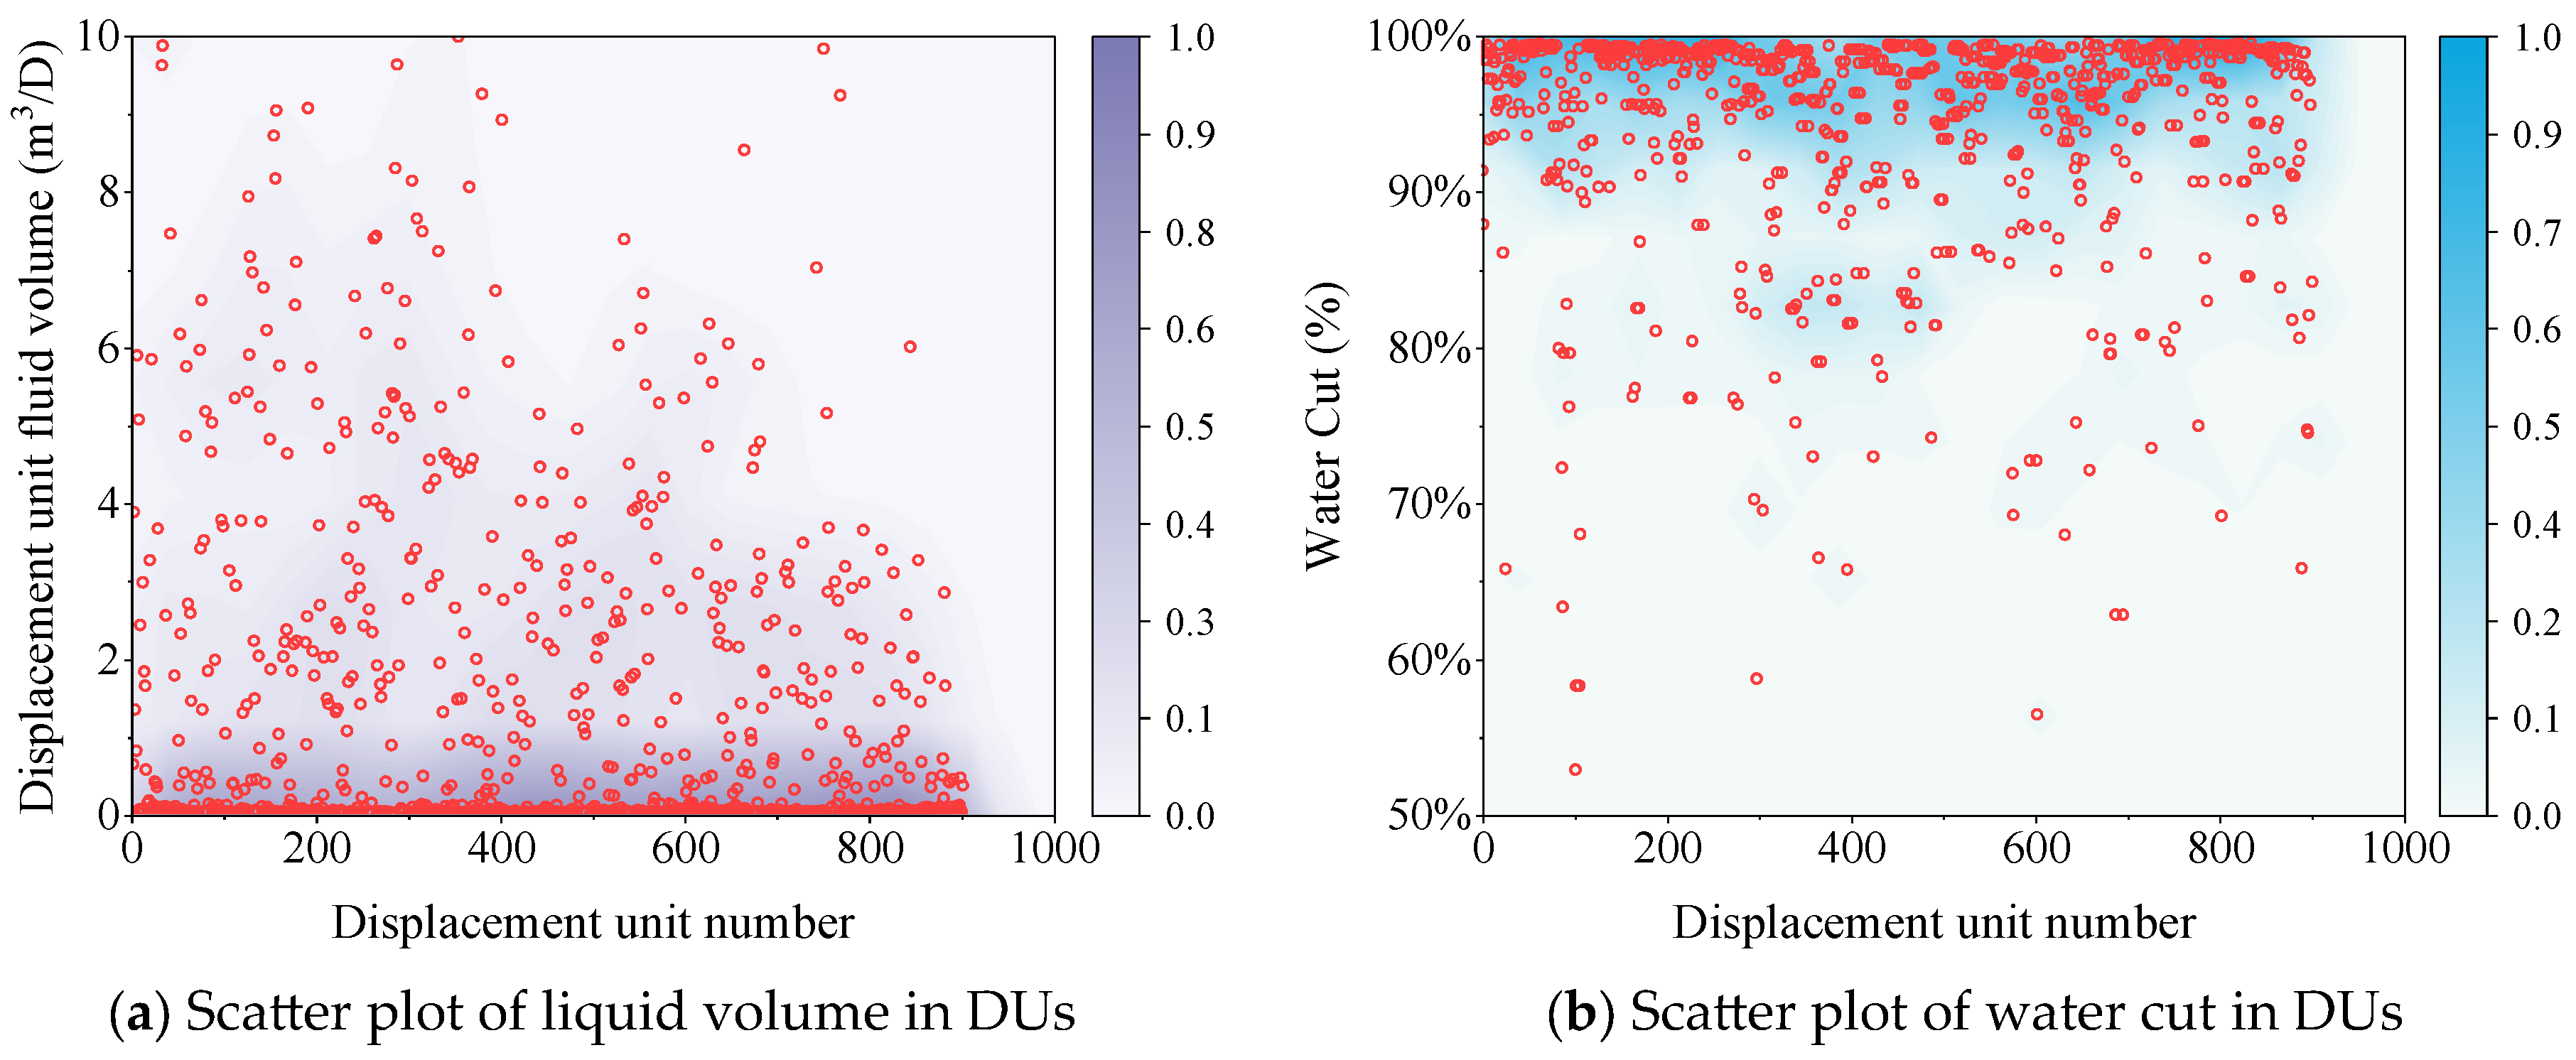
A quantitative characterization method for DUs was applied to analyze 902 units in the current development stage of Northeast Field II. Figure 12a shows the scatter density distribution of liquid production volumes across the DUs, while Figure 12b shows the distribution of water cuts. The results demonstrate that approximately 84% of the DUs exhibited water cuts above 90%, thereby indicating extensive preferential flow paths and widespread ineffective water circulation within the reservoir. The red data points represent the 902 DUs, and the background color indicates the normalized density distribution, with darker shades indicating higher data density.
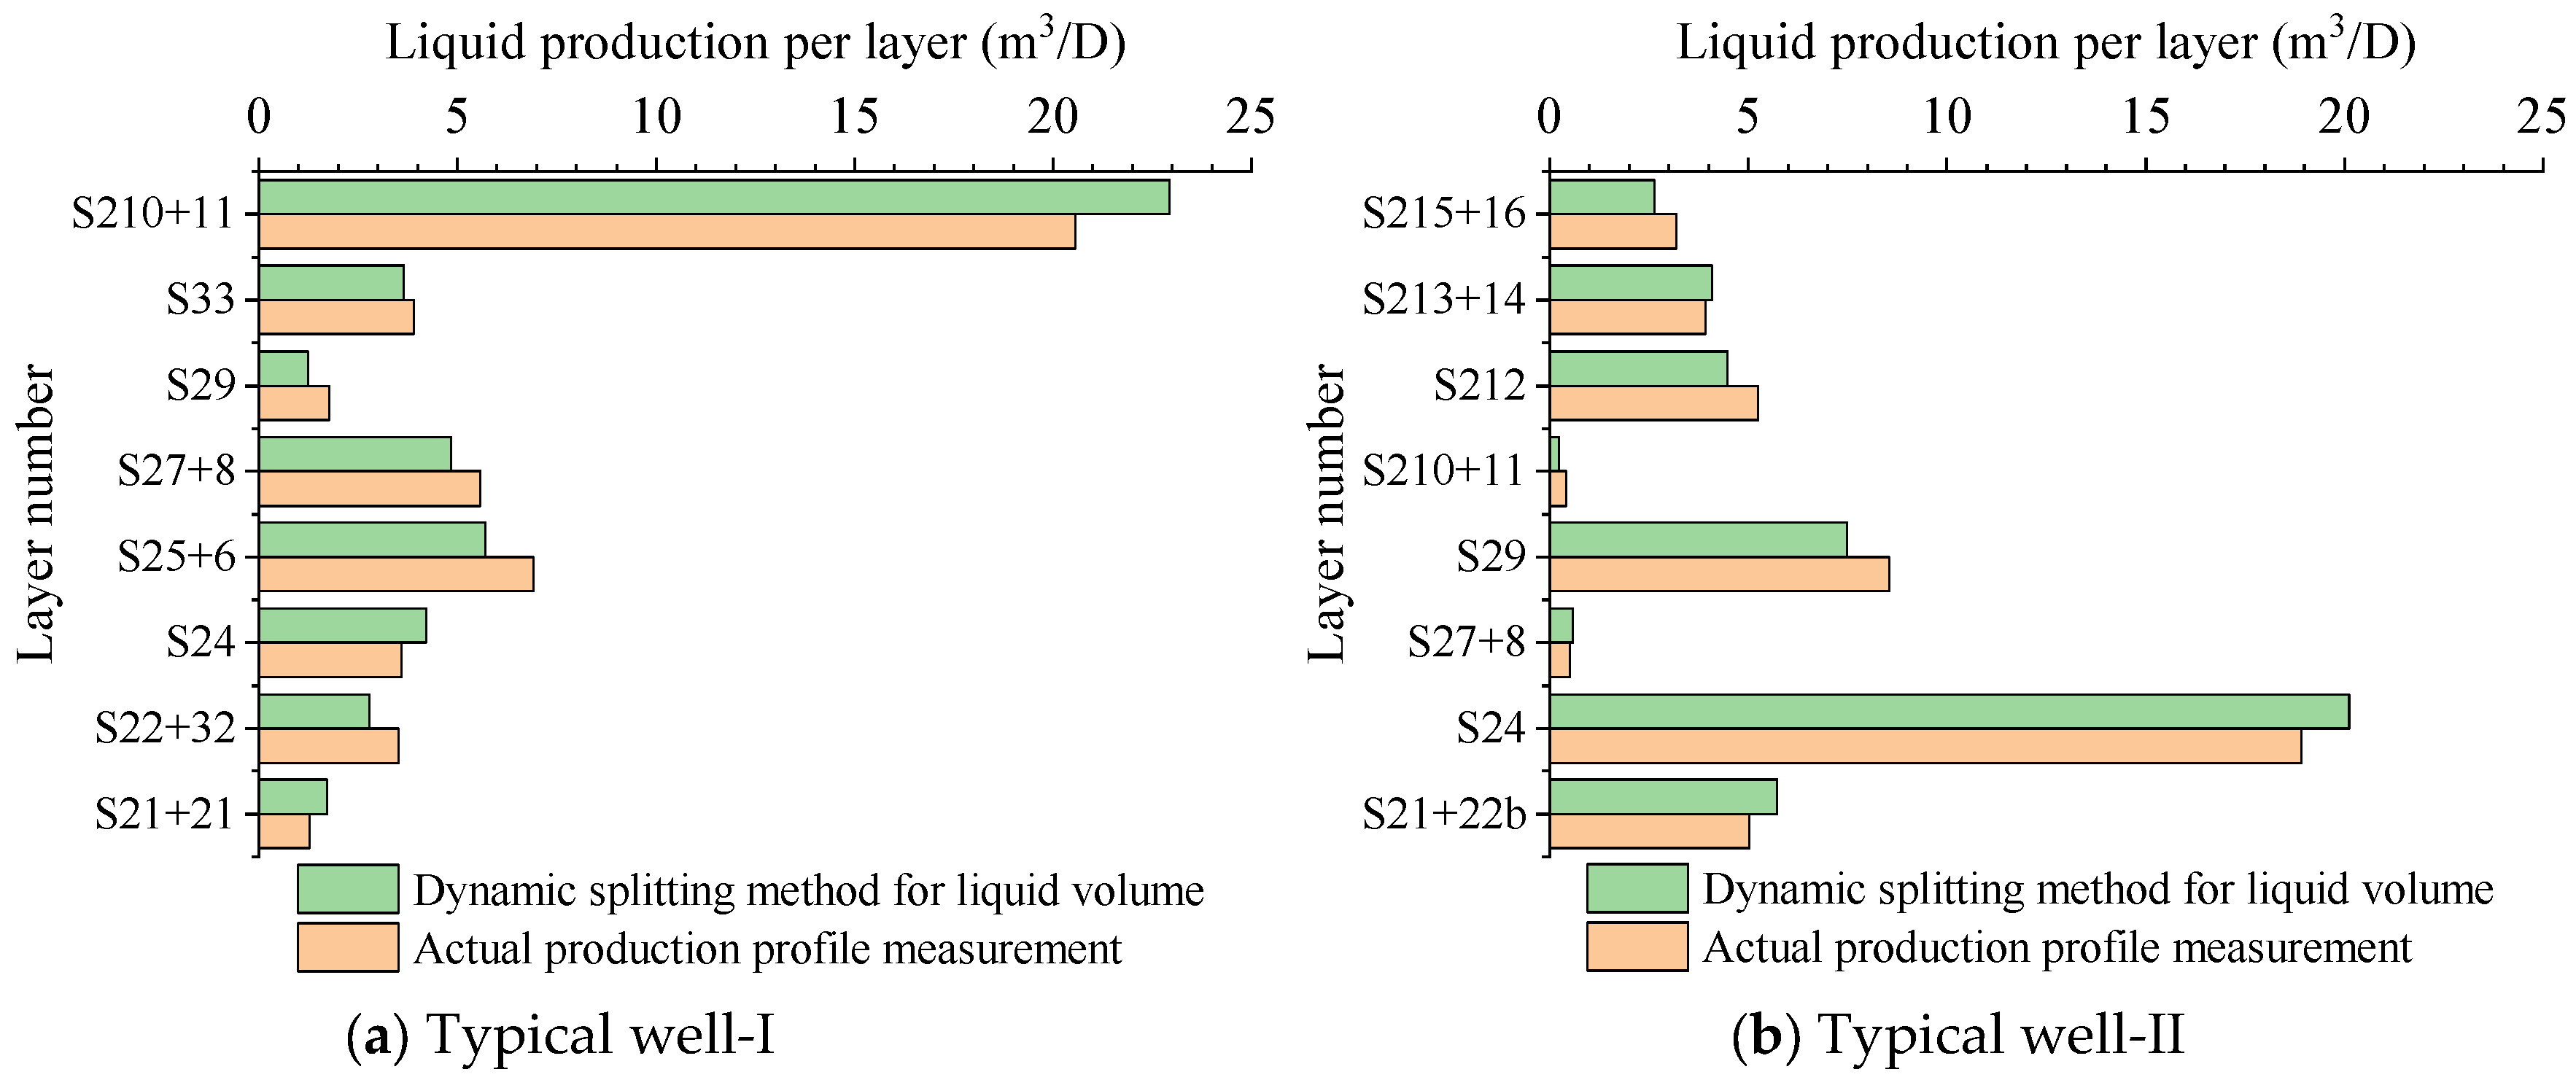
The reliability of the proposed DU-scale characterization method was evaluated by comparing the calculated layered liquid production volumes with field-measured production profile data. In this validation, “accuracy” was defined as the proportion of layer-level samples for which the relative deviation between calculated and measured layered liquid production volumes was within the ±20% tolerance. This tolerance was adopted to account for production profile logging uncertainty and strong interlayer interference under multilayer commingled production. Eight representative producing wells with complete layered production profile measurements from the current ultra-high water-cut stage were selected from the 65-well injection–production system in Northeast Field II. Although production profile logging was not available for every well, the selected wells were chosen to represent the main well-pattern positions, water-cut ranges, interlayer heterogeneity conditions, and preferential-flow-path development states in the target block. After excluding layers with zero or negligible liquid contribution, 56 layer-level validation samples were obtained. The production profile data were not used to redefine DU boundaries but served as an independent post-calculation check. For each validation well, the liquid volumes allocated to the connected DUs were aggregated by layer and compared with the measured profiles. Based on the ±20% criterion, more than 82% of the 56 samples satisfied the acceptance requirement. Figure 13 presents two representative wells selected from the eight-well validation dataset for illustration. The remaining mismatches were mainly related to interlayer interference, local stimulation or plugging effects, and production profile uncertainty, with no clear systematic overestimation or underestimation trend.

4.3. Classification and Control Strategy

A more detailed economic evaluation was conducted to improve the field applicability of the economic water-cut limit method. Economic factors, including oil prices, liquid-handling costs, and operating costs, were analyzed to assess their impact on production’s economic viability. By incorporating the actual development costs for the Daqing Oilfield (Table 1), the economic evaluation method outlined in Section 3.3 was applied to identify strongly preferred flow paths among the 902 DUs.
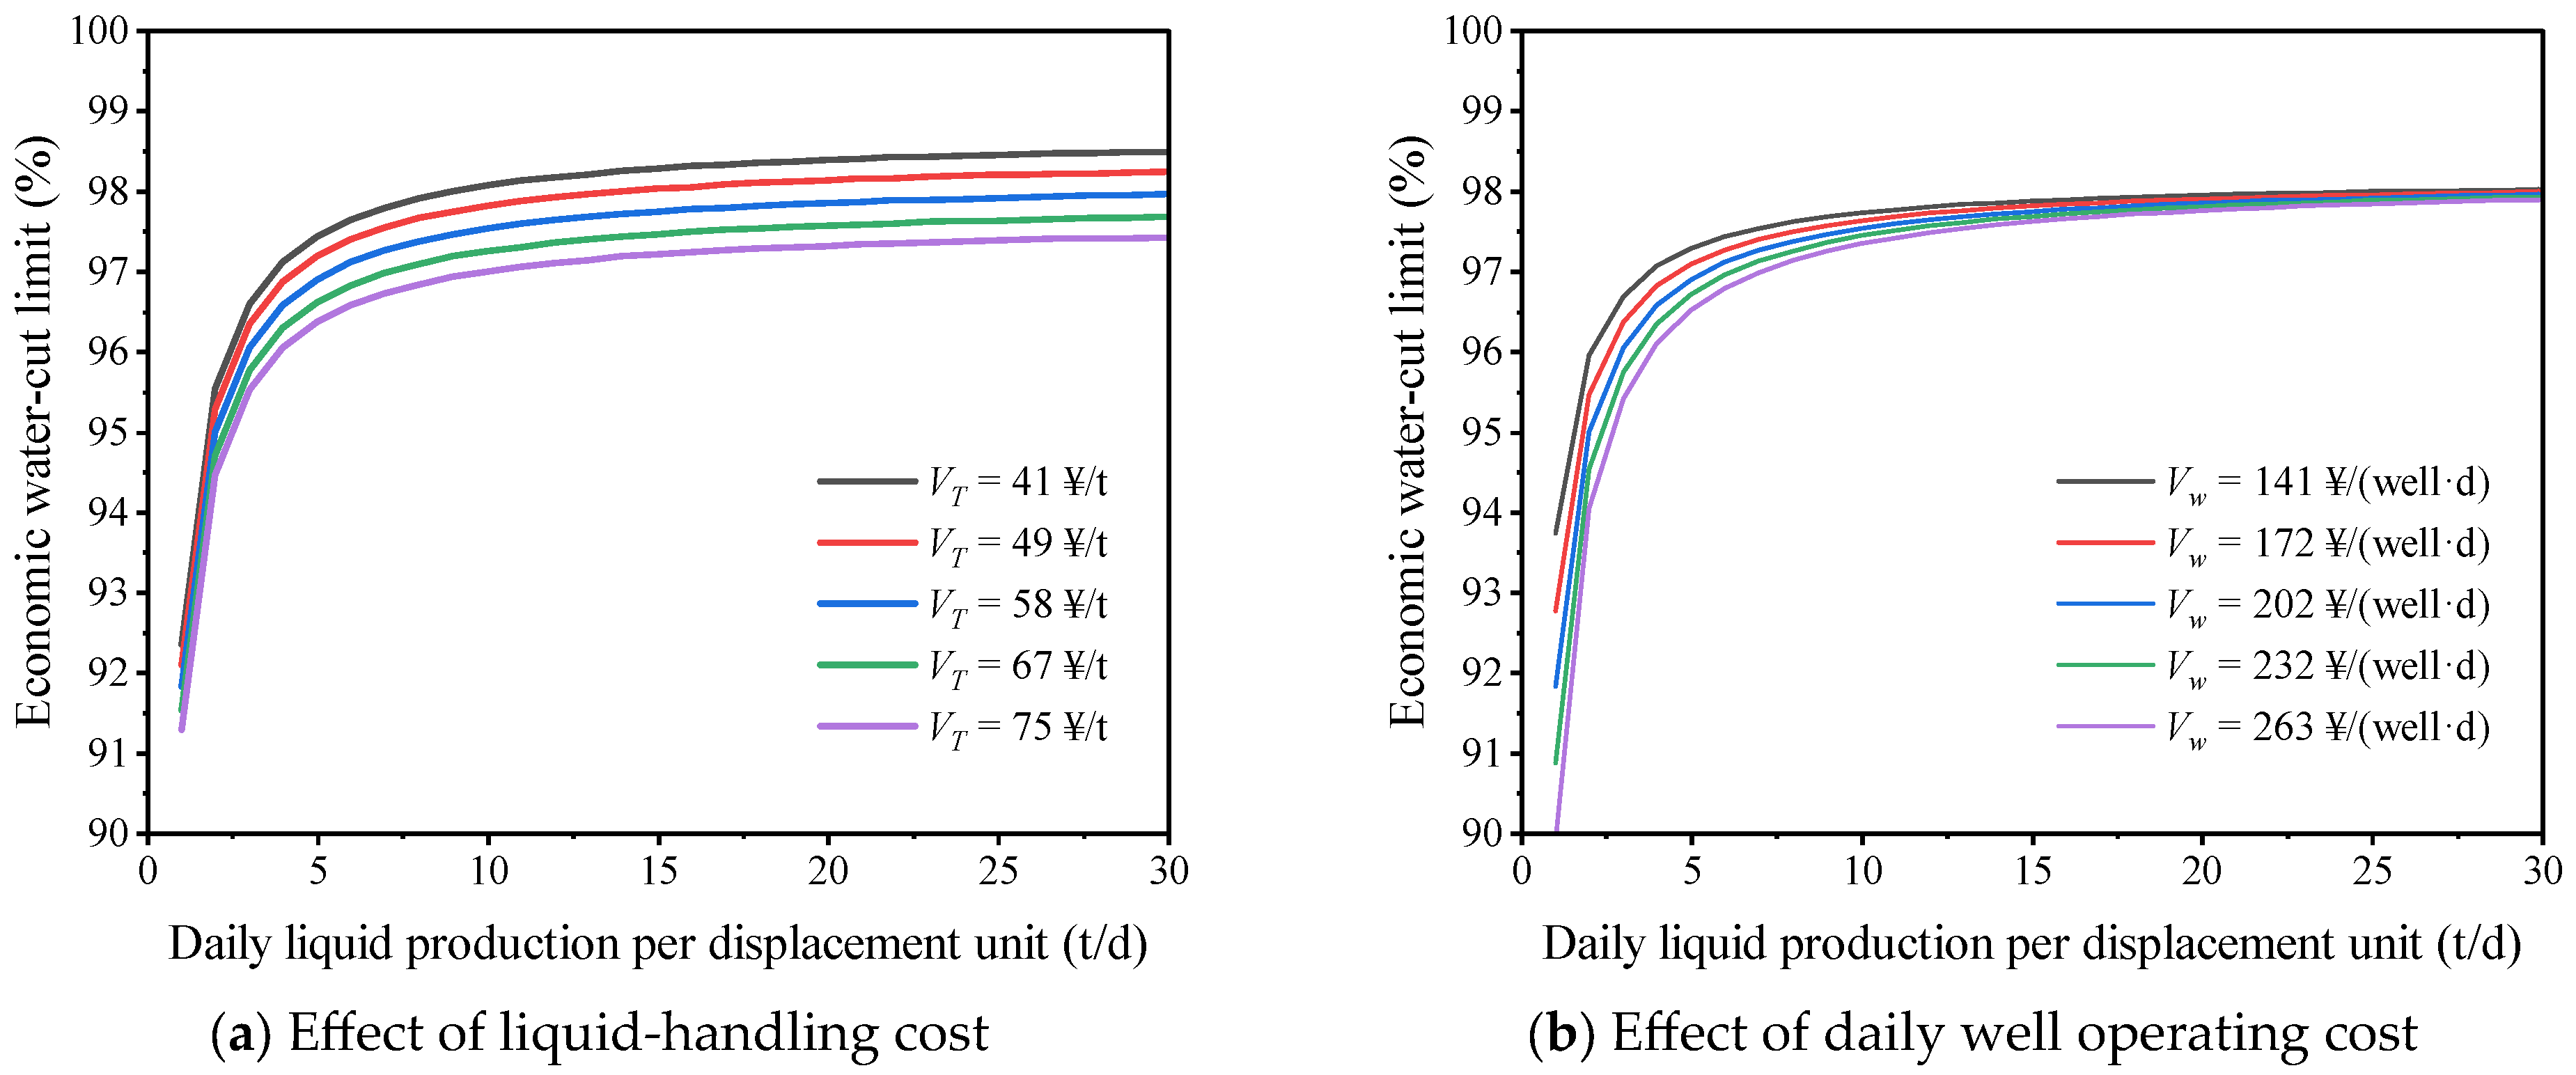
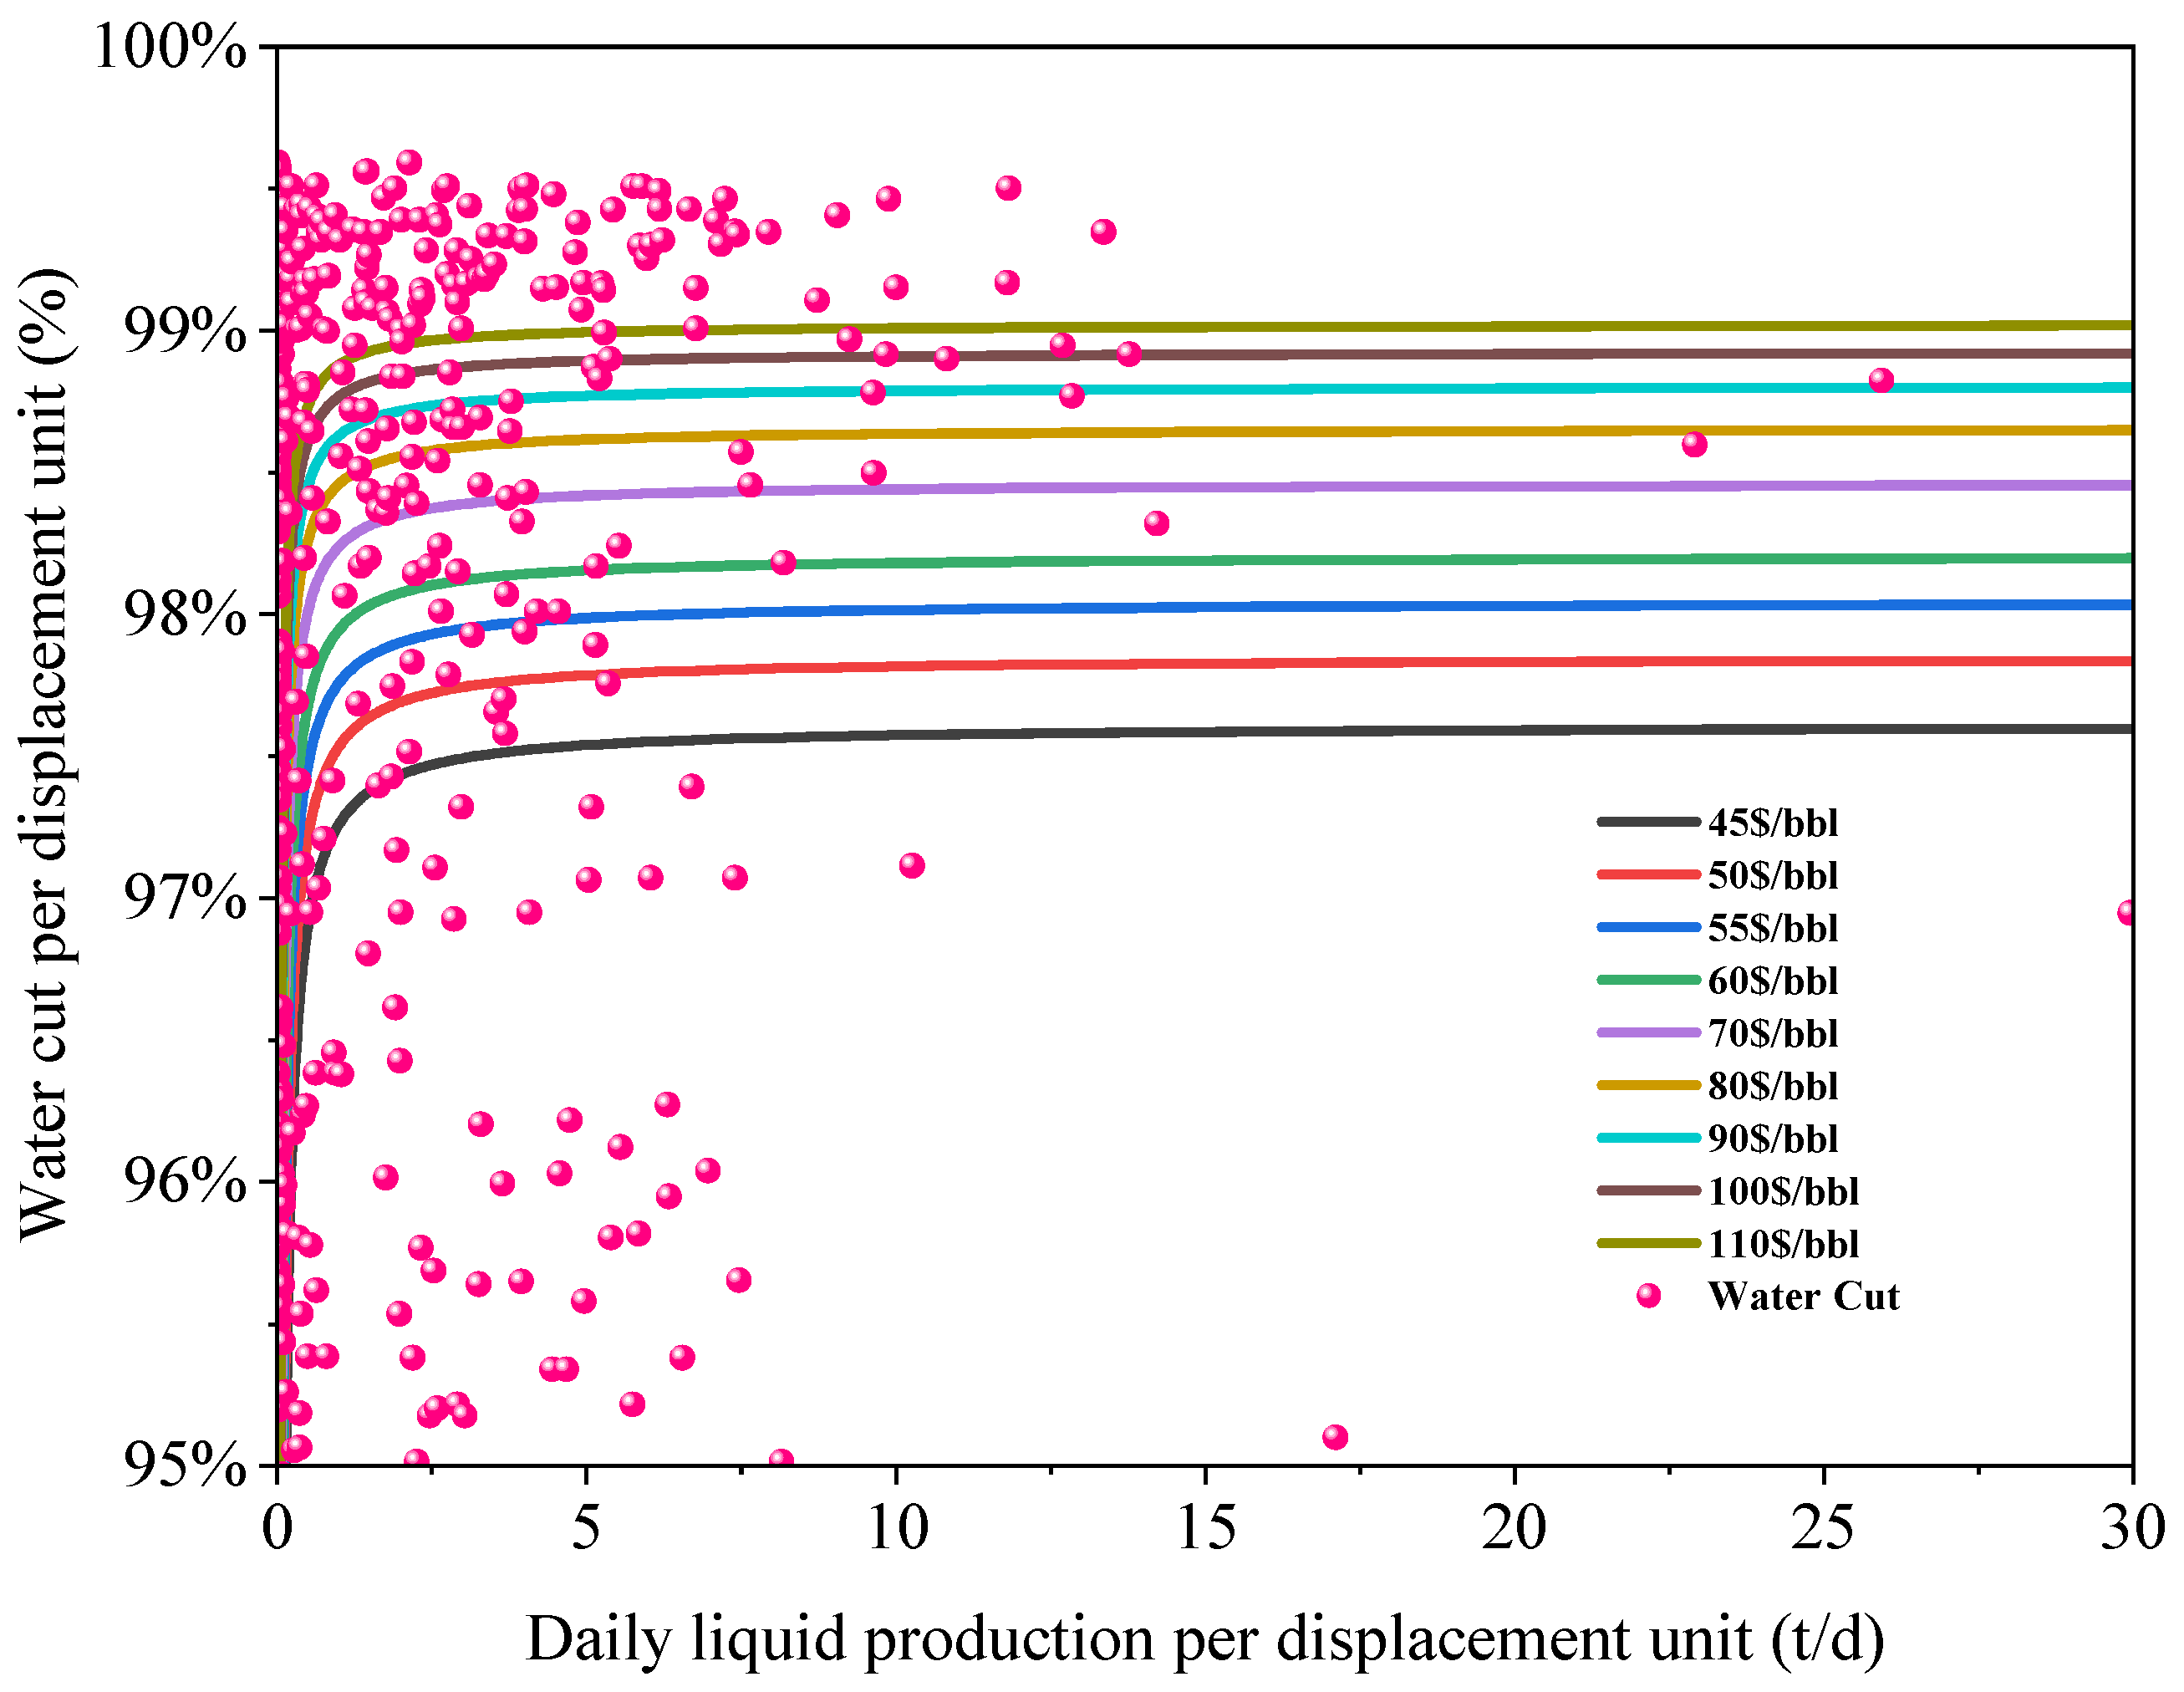
To evaluate the sensitivity of the DU-scale economic water-cut limit (fwi) to cost fluctuations, a one-factor-at-a-time sensitivity analysis was conducted at a baseline oil price of 60 USD/bbl. The liquid-handling cost (VT) was varied from 41 to 75 ¥/t while the daily well operating cost (Vw) was fixed at 202 ¥/(well·d). Conversely, (Vw) was varied from 141 to 263 ¥/(well·d) while VT was maintained at 58 ¥/t.
As illustrated in Figure 14, increases in either VT or Vw lower fwi, although their sensitivity patterns differ markedly. With Vw fixed at 202 ¥/(well·d), increasing VT from 41 to 75 ¥/t reduced fwi from 92.33% to 91.25% at a DU liquid production rate of 1 t/d and from 98.49% to 97.42% at 30 t/d. This corresponds to an almost constant reduction of 1.07–1.08 percentage points throughout the examined liquid production range, indicating that VT exerts a persistent influence on the economic water-cut limit regardless of DU liquid production rate. In contrast, with VT fixed at 58 ¥/t, increasing Vw from 141 to 263 ¥/(well·d) reduced fwi from 93.72% to 89.86% at 1 t/d, whereas the reduction was only from 98.02% to 97.89% at 30 t/d. Thus, Vw has a pronounced effect on low-liquid-rate DUs but becomes progressively less influential as liquid production increases because the fixed daily operating cost is distributed over a larger liquid volume. Overall, VT produces a more persistent effect on fwi across the full liquid production range, whereas the influence of Vw is concentrated primarily in low-liquid-rate DUs. Because these cost-induced changes in fwi can alter the classification of DUs close to the economic limit, cost fluctuations should be explicitly considered when applying the economic water-cut limit method.
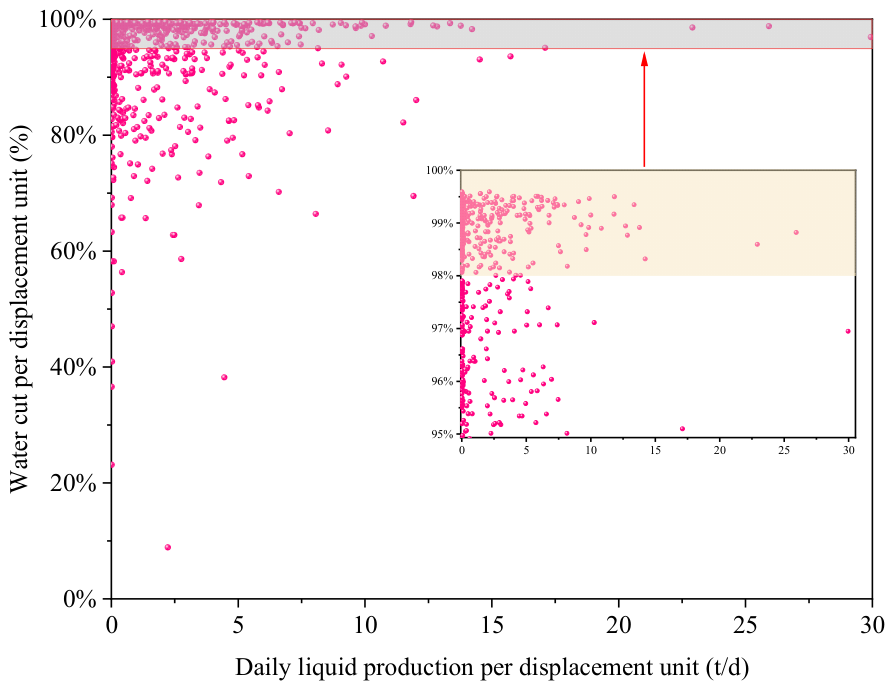
According to the conventional preferential-flow-path threshold in Daqing Oilfield (water cut of 98%), 47.78% of the DUs currently exhibit strong preferential flow paths (Figure 15). To assess the distribution of these paths more accurately, the economic water-cut limit method, which considers economic factors under varying oil prices, was applied to redefine the distribution of the DUs dominated by a strong preferential flow (Figure 16). The results show that, when economic factors are considered, the number of such units changes dynamically, with the economic water-cut threshold increasing as oil prices rise.
Analysis of Figure 15 and Figure 16 reveals significant differences between the conventional 98% water-cut method and the proposed economic water-cut limit method, in both preferential-flow-path identification and field applicability. The 98% water-cut method does not account for oil price fluctuations, liquid-handling costs, or well operating expenditures, thereby delaying the identification of preferential flow paths. Consequently, some high-water-cut DUs that remain economically viable are classified as ineffective. In contrast, the proposed method, which carefully incorporates economic factors, provides a more accurate identification of preferential flow paths. Under low oil prices or high operational costs, the economic water-cut threshold decreases, enabling earlier identification of economically unviable strong preferential flow paths. Conversely, in high-oil-price scenarios, this threshold is increased, thereby reducing the risk of misclassifying economically valuable high-water-cut DUs as ineffective. Additionally, this criterion effectively differentiates “physically ineffective” from “economically ineffective” paths, providing a solid quantitative basis for profile control, water shutoff, fluid-rate optimization, and injection–production restructuring in field operations.
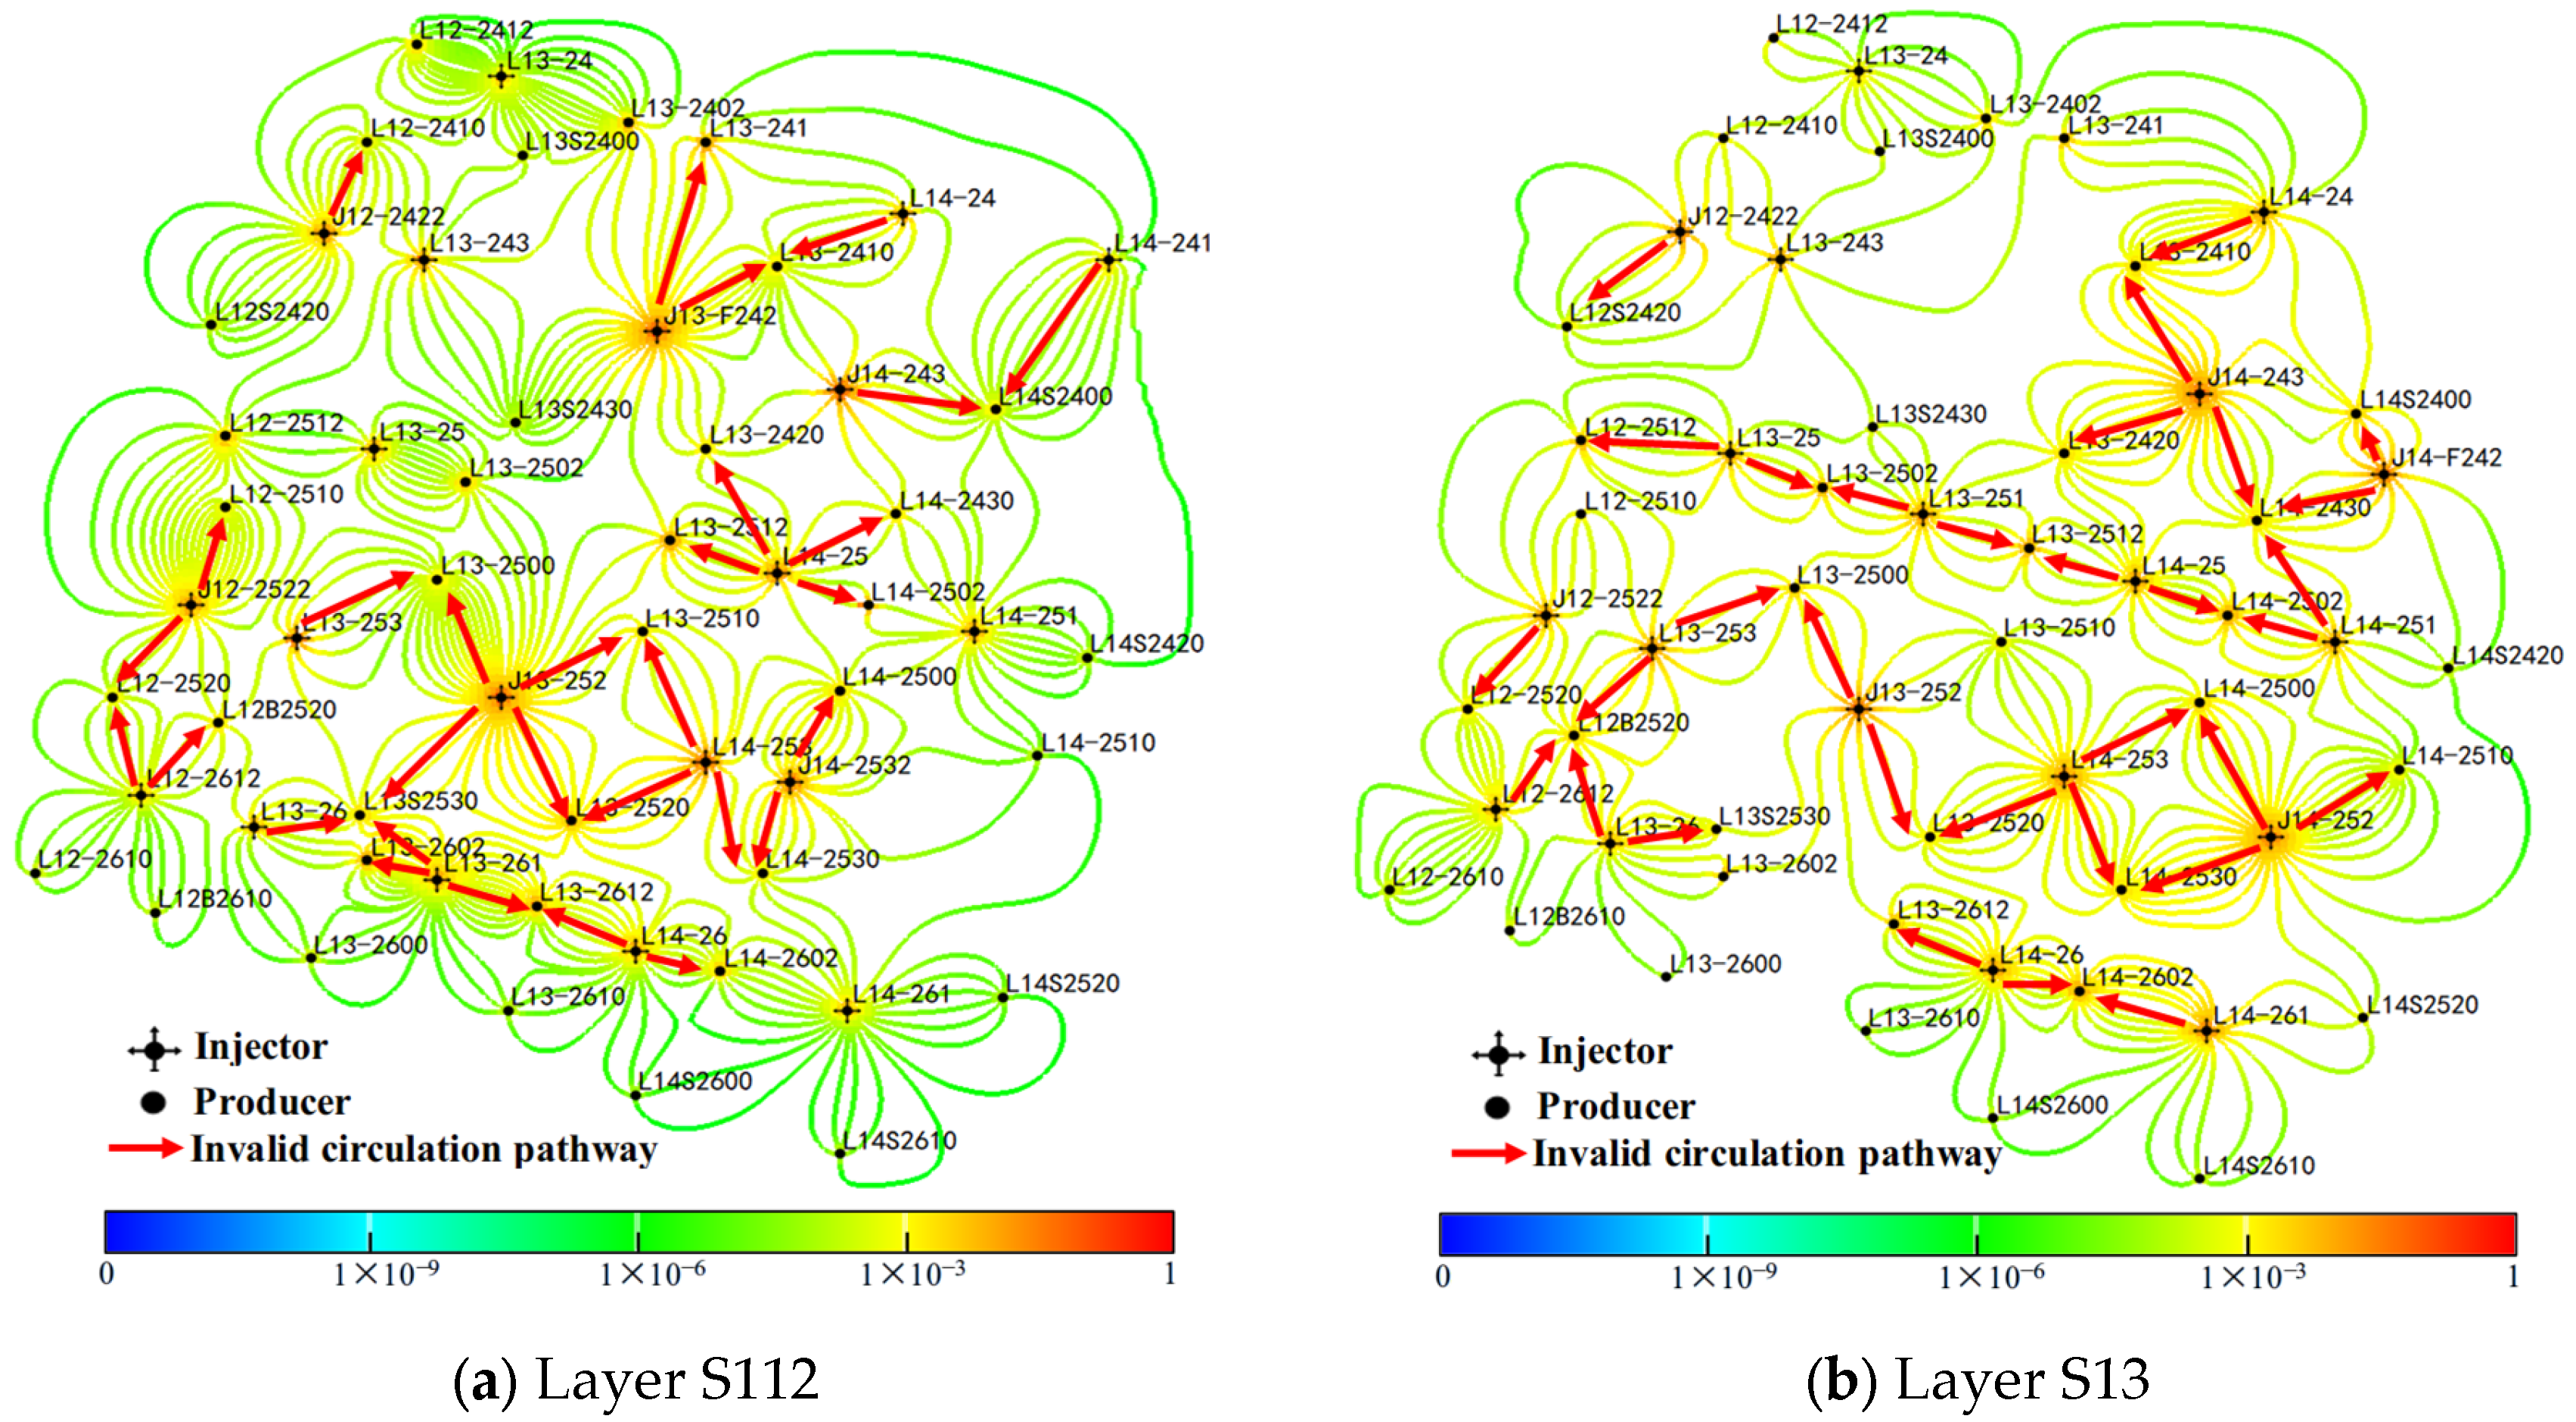
At an oil price of 60 USD/bbl, a total of 368 DUs, dominated by strong preferential flow, were obtained, accounting for 40.79% of the total units. The spatial distributions of these strong preferential flow pathways within primary pay zones S112 and S13 are presented in Figure 17. This identification provides a crucial basis for late-stage reservoir management. It enables targeted interventions, such as profile control, water shutoff, fluid-rate optimization, and injection–production restructuring, thereby further enhancing recovery in ultra-high water-cut reservoirs.
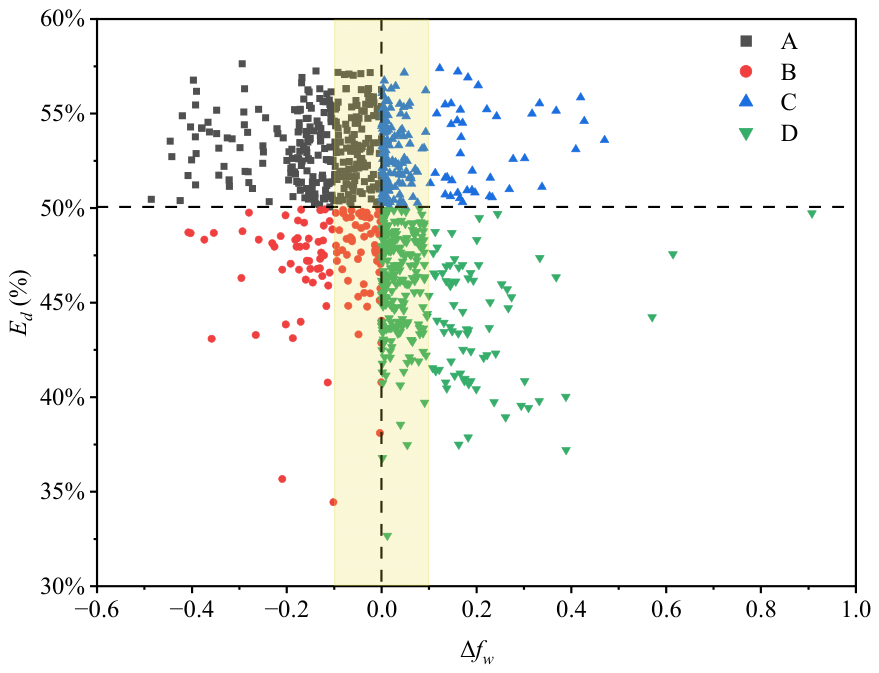
To further enhance the field applicability of the proposed method, two key indicators were defined: the water-cut profit–loss margin (Δfw) and oil displacement efficiency (Ed). By integrating the economic water-cut limit and factors such as oil price, liquid-handling costs, and well operating expenditures, these indicators were used to construct a classification decision matrix for preferential flow paths in DUs. The water-cut profit–loss margin (Δfw) represents the economic margin of water cut for a DU and is defined as follows:
Δ f w = f w i V o f w
where fwi(Vo) denotes the economic water-cut limit of a DU under different oil price scenarios, while fw represents the actual water cut of the DU. When Δfw < 0, the DU has entered the ineffective water-cycling stage, denoting a strong preferential flow path.
The oil displacement efficiency (Ed) is used to evaluate the extent of waterflooding and the remaining recoverable oil potential within the DU, and is calculated as follows:
E d = S o i S o r S o i
where Soi represents the initial oil saturation and Sor denotes the current residual oil saturation.
In this study, Ed = 50% was selected as a field-specific engineering threshold for the target waterflooded reservoir. This value reflects the long-term development experience of Northeast Field II: DUs with Ed ≥ 50% generally represent relatively mature swept regions, whereas those with Ed < 50% indicate insufficient displacement and greater remaining-oil potential. Therefore, the threshold was used to distinguish DUs with relatively high displacement efficiency from those requiring further sweep improvement. This value should not be regarded as a universal cutoff; rather, it should be adjusted according to reservoir heterogeneity, development stage, and waterflooding performance when the method is applied to other reservoirs.
Based on the water-cut profit–loss margin (Δfw) and oil displacement efficiency (Ed), the 902 DUs were classified into four distinct categories: economically ineffective strong preferential flow units, channeling units with high remaining potential, mature stable production units, and homogeneous DUs. The classification criteria are summarized in Table 2. This evaluation framework not only identifies economically ineffective, strongly preferential flow paths but also captures variations across DUs in displacement efficiency and remaining recoverable oil potential. Consequently, it provides a solid quantitative basis for developing differentiated late-stage reservoir management strategies.
Figure 18 illustrates the distribution of the techno-economic classification matrix for the preferential flow paths across 902 DUs at a baseline oil price of 60 USD/bbl. The yellow-shaded area represents the dynamic migration of the break-even point across the oil price range of 45–110 USD/bbl, highlighting the sensitivity of the economic limits of the preferential flow paths to external factors, including crude oil prices, well operating expenditures, and liquid-handling costs. Statistical analysis showed that Type D (homogeneous DUs) accounted for the largest proportion (33.7%), forming the primary foundation for stable production in the block. Types A (economically ineffective strong-channeling units) and Type B (channeling units with high remaining potential) made up 28.37% and 12.42%, respectively, highlighting the prevalence of severe channeling and ineffective water circulation within the block. Type C (mature stable production units) accounted for 25.51%, indicating that flow-field heterogeneity remains a primary constraint on development efficiency. Given the variations in flow characteristics and economic thresholds among DU types, differentiated control strategies must be implemented under the combined constraints imposed by technical and economic indicators. Targeted interventions should prioritize Type A and Type B units to reduce preferential flow and improve sweep efficiency. Recommended measures include profile control, water shutoff, cyclic waterflooding, and pressure system optimization. For Type C and D units, which exhibit superior displacement performance, production stability should be maintained through adjustments to water injection and fluid-rate optimization.
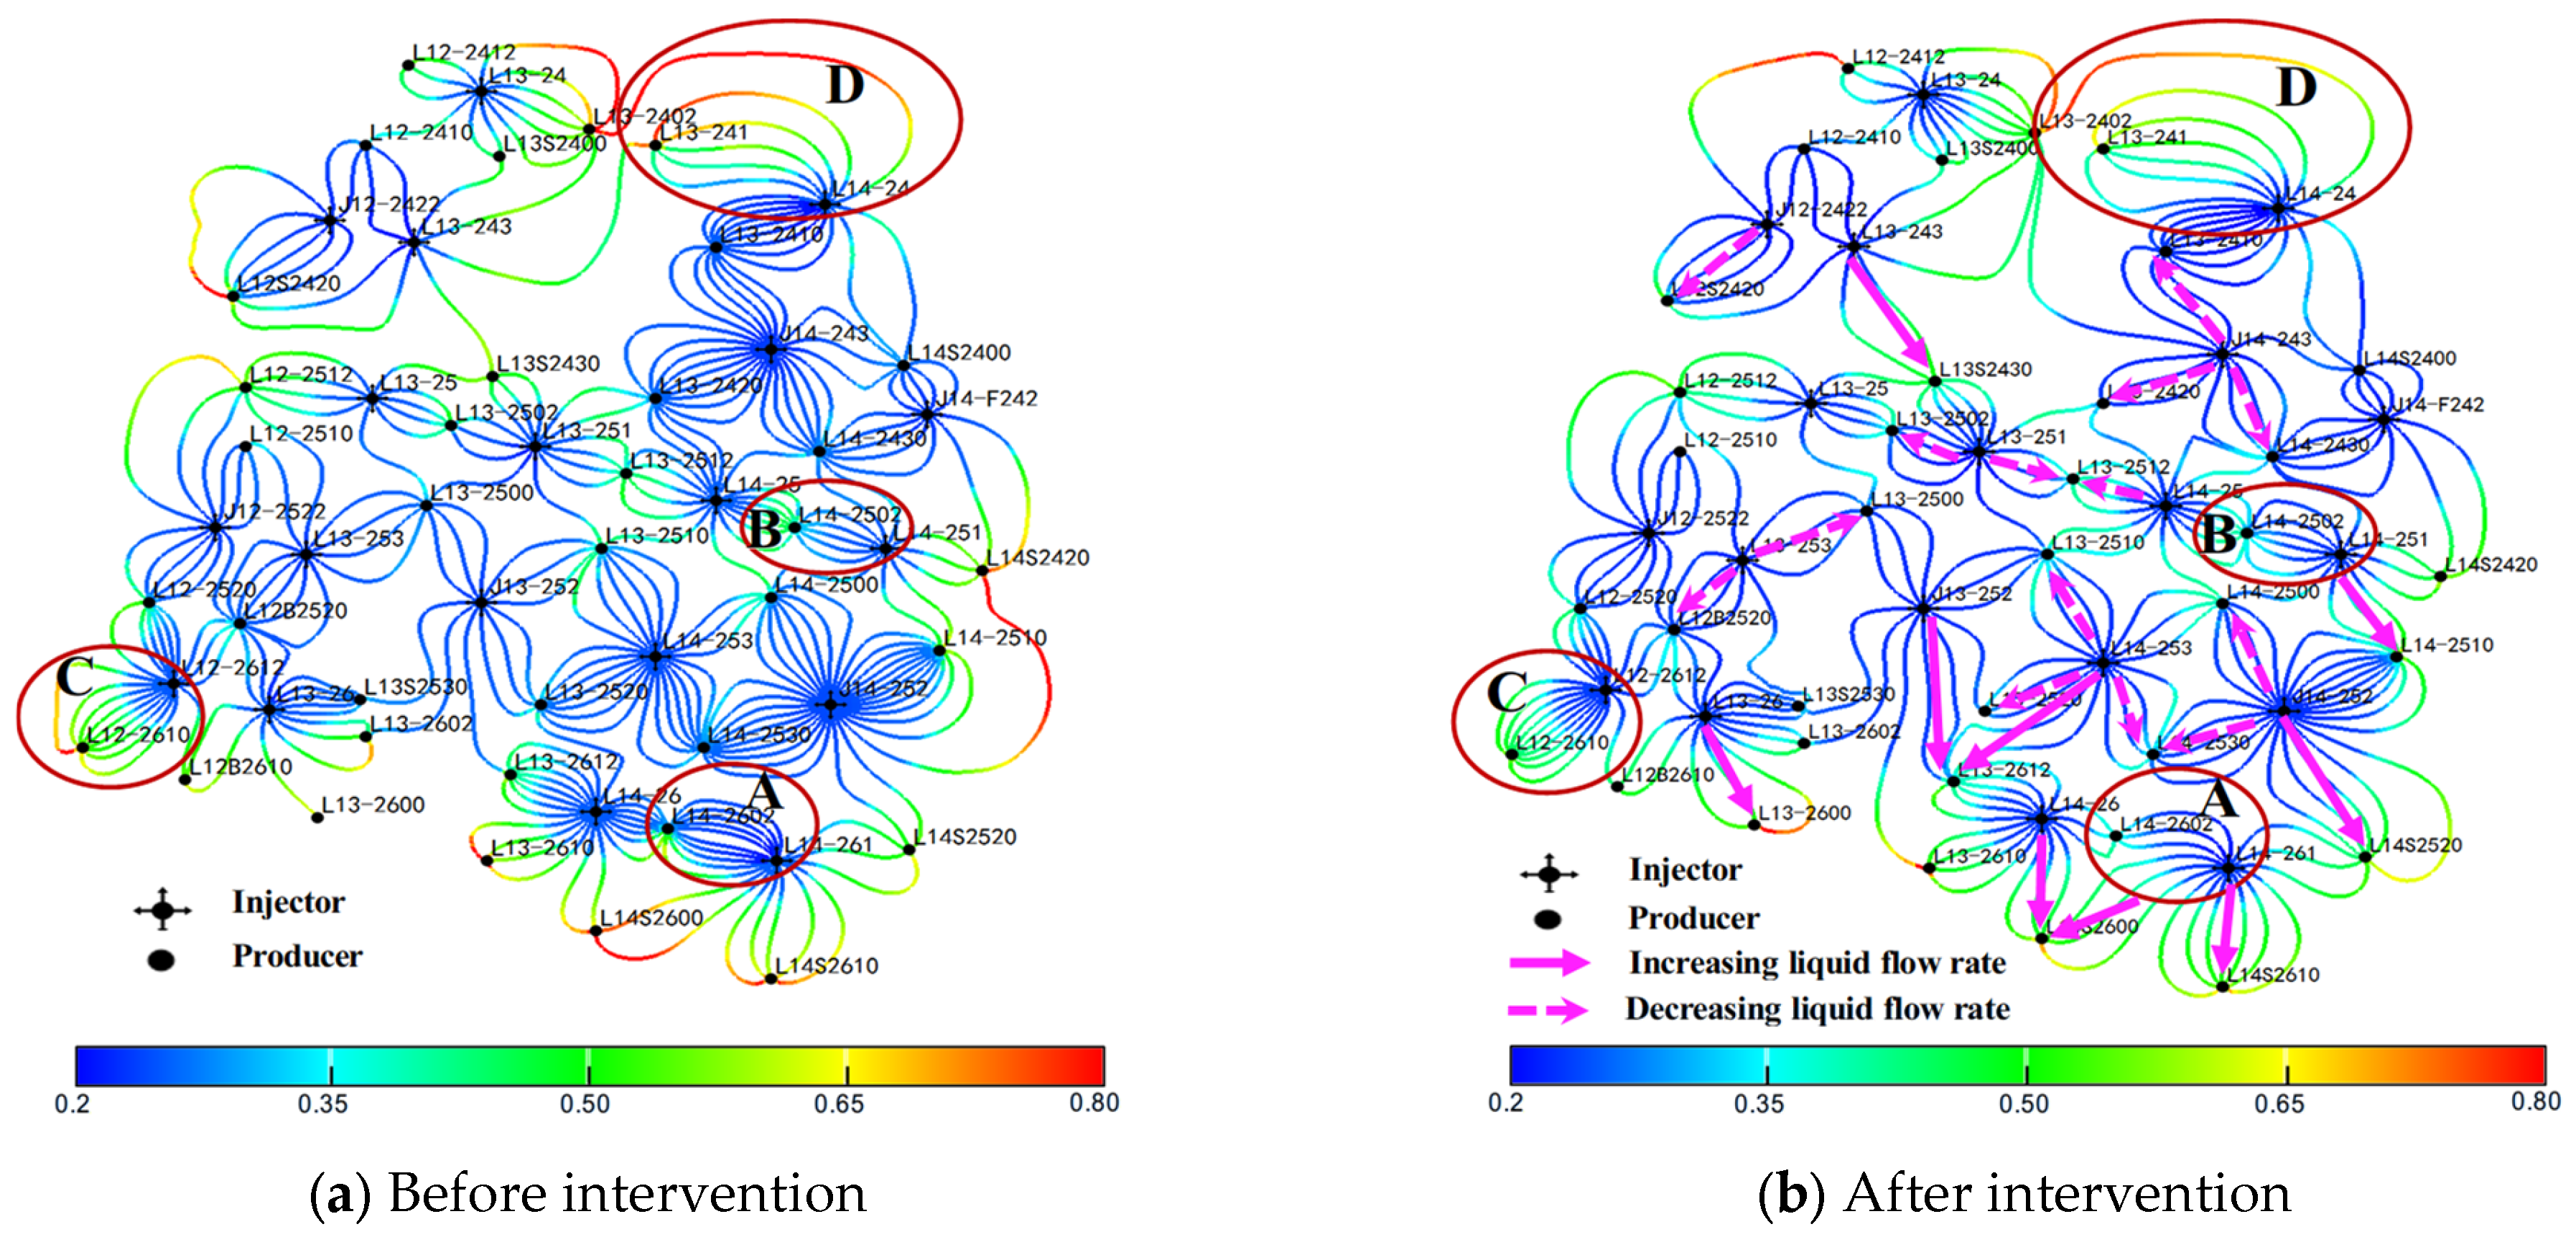
Based on the aforementioned differentiated control strategies, four representative DU types within the primary pay zones of the target reservoir were selected for management. The distributions of the preferential flow paths before and after the intervention are presented in Figure 19. The analysis reveals that following differentiated control, the fluid flux in units dominated by strong preferential channels is significantly reduced. In contrast, the flow in adjacent poorly swept regions increases. This demonstrates that differentiated interventions effectively suppress the development of economically ineffective strong-channeling units and redistribute fluids to underutilized reservoir volumes.
Further statistical comparisons of the water-cut profit–loss margin (Δfw) and oil displacement efficiency (Ed) before and after control were conducted for the four DU types. Specifically, for Type A units, Δfw at 60 USD/bbl was −0.05, and Ed was 56% prior to the intervention, confirming their status as economically ineffective strong-channeling units. After preferential-flow-path plugging and flow-field reconstruction, the water injection volume decreased by 35%, effectively mitigating the strength of the preferential channels. Type B units initially showed Δfw = −0.02 and Ed = 42%, indicating significant remaining potential. Following profile control interventions, the water cut decreased by 3.5 percentage points, and Ed increased from 42% to 47%. For Type C and Type D units, where the flow field remained relatively stable and economically favorable, low-intensity measures such as cyclic waterflooding and moderate fluid-rate optimization are recommended. High-intensity interventions are deemed unnecessary, as these units already exhibit favorable displacement performance.

5. Discussion

The proposed DU-scale framework involves uncertainties associated with reservoir-property evolution, flow-performance parameters, economic inputs, and DU delineation. The sensitivities of oil price, liquid-handling cost (VT), and operating cost (Vw) are quantitatively evaluated in Section 4.3, showing that these parameters mainly affect the economic water-cut limit and the Δfw-based classification of DUs near the break-even boundary. The time-varying permeability law influences the flow resistance coefficient and the subsequent vertical and areal liquid-volume splitting. A stronger permeability increase in initially high-permeability DUs would enhance preferential allocation along dominant flow paths, whereas weaker time variation would result in a more dispersed liquid allocation. Uncertainty in relative permeability endpoints affects water-saturation tracking and Ed, particularly for DUs close to the displacement efficiency threshold. The injection–production pressure difference introduces uncertainty into areal allocation, especially where several producers compete for the same injector or where pressure contrasts among flow paths are small. DU boundary uncertainty mainly arises from streamline tracing and pressure-field interpretation and is expected to affect marginal or weakly connected DUs more strongly than high-flux-dominant channels. Therefore, the most sensitive results are likely to occur for DUs near the economic or displacement efficiency classification thresholds, and these units should be prioritized for additional production profile verification, tracer testing, or adaptive field adjustment.
Compared with conventional methods such as streamline simulation, kh allocation, production profile allocation, tracer diagnosis, machine learning channel identification, and economic-limit water-cut evaluation, the proposed framework provides an integrated DU-scale workflow rather than a single-purpose diagnostic tool. Existing methods are useful for flow-path visualization, rapid allocation, field-profile calibration, interwell connectivity diagnosis, data-driven screening, or economic evaluation; however, they generally emphasize only one aspect of preferential-flow-path characterization. In contrast, this study combines dynamic liquid-volume splitting, water-saturation tracking, time-varying permeability correction, and economic water-cut evaluation within DUs. The framework therefore links the physical evolution of preferential flow paths with their economic effectiveness and supports actionable decision making for differentiated reservoir management. It is most applicable to mature continental sandstone reservoirs with ultra-high water cut, strong interlayer heterogeneity, multilayer commingled production, and sufficient dynamic production data. For fractured reservoirs, highly irregular development patterns, or data-limited blocks, the classification boundaries and control strategies should be further calibrated using site-specific evidence. A concise comparison of the proposed method with commonly used approaches is provided in Table 3.
Intervention cost may further modify the priority of preferential-flow-path control. Although the economic water-cut limit identifies DUs with operating-level losses, the final implementation of gel plugging, water shutoff, profile control, or injection–production adjustment should also consider treatment cost, expected incremental oil recovery, saved liquid-handling cost, and response duration. Therefore, project-level indicators such as net present value, internal rate of return, and payback period are more suitable for ranking alternative interventions after candidate DUs have been screened. Because complete intervention-cost and post-treatment production-response data are not available for all DUs in this study, the present method is positioned as a techno-economic screening tool rather than a full investment-decision model.

6. Conclusions

This study proposes a quantitative method for characterizing preferential flow paths within the DUs of ultra-high water-cut reservoirs, systematically revealing their formation mechanisms and dynamic evolution. The main conclusions are summarized as follows:
(1)
A method for quantifying the preferential flow paths in DUs was developed by integrating the dynamic splitting of produced and injected volumes, water-saturation tracking, and economic water–cut evaluation. This approach accounts for the time-varying effects of the reservoir parameters, and a comparison of the production and injection profiles from representative wells confirms its accuracy.
(2)
The application to a typical block demonstrated strong field applicability, achieving successful quantitative characterization of injector–producing units with high identification precision. The recognition accuracy of DU volume characterization exceeded 82%, and the economic water-cut method identified 368 economically strong preferential flow units within the study area.
(3)
Under the constraint of the economic water-cut limit, the two key indicators, water-cut profit–loss margin (Δfw) and oil displacement efficiency (Ed), were defined to construct a classification decision matrix for displacement unit flow paths. Using this matrix, the 902 DUs in the study area were classified into four types: Type A (economically ineffective, strong-channeling units), Type B (channeling units with high remaining potential), Type C (mature, stable production units), and Type D (homogeneous DUs). Type A and Type B units account for 28.37% and 12.42%, respectively, highlighting the prevalence of ineffective water circulation in the block.
(4)
The differentiated management of the four DU types within the primary pay zones results in a more balanced sweep performance. For Type A units, Δfw at 60 USD/bbl was −0.05, and Ed was 56% before control; following channel plugging and flow-field reconstruction, the water injection volume decreased by 35%, effectively mitigating preferential flow paths. Type B units initially exhibited Δfw = −0.02 and Ed = 42%; after profile control interventions, the water cut decreased by 3.5 percentage points, and Ed increased from 42% to 47%. For Type C and Type D units, which exhibited relatively stable flow fields and favorable economic performance, low-intensity measures such as cyclic waterflooding and moderate fluid-rate optimization are recommended; high-intensity interventions are deemed unnecessary.
(5)
An integrated framework combining dynamic splitting, water-saturation tracking, and economic water-cut evaluation was established for the unified analysis of DU preferential flow paths. By introducing the Δfw-Ed classification decision matrix, techno-economic identification of preferential flow paths was achieved, providing a strong reference for similar ultra-high water-cut reservoirs.

Author Contributions

Conceptualization, M.Z. and D.W.; methodology, M.Z. and K.S.; software, M.Z.; validation, M.Z., K.S. and Z.J.; formal analysis, M.Z.; investigation, M.Z., K.S. and Z.J.; resources, D.W. and Z.J.; data curation, M.Z. and K.S.; writing—original draft preparation, M.Z.; writing—review and editing, D.W., K.S. and Z.J.; visualization, M.Z.; supervision, D.W.; project administration, D.W.; funding acquisition, D.W. All authors have read and agreed to the published version of the manuscript.

Funding

This research was funded by the National Natural Science Foundation of China, grant numbers U22B6005 and 52174043; the National Science and Technology Major Project, grant number 2025ZD1406102; the Natural Science Foundation of Beijing Municipality, grant number 3242019; and the CNPC Innovation Foundation, grant number 2022DQ02-0208. The APC was funded by the National Science and Technology Major Project (grant number 2025ZD1406102).

Data Availability Statement

The data presented in this study are available on request from the corresponding author. The data are not publicly available due to confidentiality restrictions related to oilfield production and reservoir data.

Conflicts of Interest

Author Z.J. was employed by PetroChina Dagang Oilfield Company during the conduct of this study. All authors declare that the research was conducted in the absence of any commercial or financial relationships that could be construed as potential conflicts of interest.

References

  1. Du, Q.J.; Zheng, H.-Y.; Hou, J.; Liu, Y.-G.; Sun, J.-F.; Zhao, D. Influence of pore structure heterogeneity on channeling channels during hot water flooding in heavy oil reservoir based on CT scanning. Pet. Sci. 2024, 21, 2407–2419. [Google Scholar] [CrossRef]
  2. Rui, Z.; Zhang, Q.; Zhang, F.; Xia, Q.; Lu, R.; Cao, W.; Meng, S. A deep-learning-based LSTM approach for multiphase rate transient analysis in tight and ultratight reservoir. J. Energy Resour. Technol. Part B Subsurf. Energy Carbon Capture 2025, 1, 031004. [Google Scholar] [CrossRef]
  3. Zhao, W.; Wang, J.; Liu, H. Evolution law of dominant flow channel and enhanced oil recovery measures for water flooding in reservoirs with partially sealed faults. ACS Omega 2023, 8, 22912–22921. [Google Scholar] [CrossRef] [PubMed]
  4. Li, S.; Yang, S.; Jin, L.; Shen, B.; Qian, K.; Yu, J. Investigation on pore structure, fluid mobility and water huff-n-puff oil recovery of tight volcanic oil reservoir. J. Pet. Sci. Eng. 2022, 215, 110651. [Google Scholar] [CrossRef]
  5. Wei, C.; Li, Z.; Yang, J.; Liu, S.; Gao, Y. A comprehensive performance evaluation methodology for miscible gas flooding: A case study in a giant carbonate reservoir in Middle East. J. Pet. Sci. Eng. 2022, 215, 110668. [Google Scholar] [CrossRef]
  6. Wei, C.; Huang, R.; Ding, M.; Yang, J.; Xiong, L. Characterization of saturation and pressure distribution based on deep learning for a typical carbonate reservoir in the Middle East. J. Pet. Sci. Eng. 2022, 213, 110442. [Google Scholar] [CrossRef]
  7. Yin, X.; Guo, J.H.; Sun, L.; Wei, L.-Y.; Wang, Y.-Q.; Wang, Z.-G.; Wang, H.-T. Quantification of ineffective water circulation in thick reservoir based on machine learning. In Proceedings of the International Field Exploration and Development Conference, Qingdao, China, 20–22 October 2021; Springer Nature: Singapore, 2021; pp. 5196–5204. [Google Scholar]
  8. Chen, C.; Zhang, W.; Yue, B.; Liu, B. A new method for quantitative description of dominant channels in high water-cut stage. Improv. Oil Gas Recovery 2023, 7. [Google Scholar] [CrossRef]
  9. Li, H. Study on the limit of ineffective cycle control in Lamadian Oilfield in the late period of ultra-high water cut. E3S Web Conf. 2024, 528, 01007. [Google Scholar] [CrossRef]
  10. Qi, G.; Meng, L. Study on evaluation and reconstruction of reservoir seepage field in high water cut stage based on analysis of seepage characteristics. J. Pet. Explor. Prod. Technol. 2019, 9, 417–426. [Google Scholar]
  11. Bojer, A.K.; Ahmed, M.E.; Bekalo, D.J.; Debelee, T.G.; Al-Quraishi, A.; Deche, A. Analysis of land use/land cover change (LULCC) and debris flow risks in Adama district, Ethiopia, aided by numerical simulation and deep learning-based remote sensing. Stoch. Environ. Res. Risk Assess. 2023, 37, 4893–4910. [Google Scholar] [CrossRef]
  12. Li, W.; Yang, J. Research and application of low efficiency and invalid circulation field quantitative identification method. In Proceedings of the International Field Exploration and Development Conference, Qingdao, China, 20–22 October 2021; Springer Nature: Singapore, 2021; pp. 3045–3053. [Google Scholar]
  13. Menke, H.P.; Maes, J.; Geiger, S. Upscaling the porosity–permeability relationship of a microporous carbonate for Darcy-scale flow with machine learning. Sci. Rep. 2021, 11, 2625. [Google Scholar] [CrossRef] [PubMed]
  14. Chai, X.; Tian, L.; Dong, P.; Wang, C.; Peng, L.; Wang, H. Study on recovery factor and interlayer interference mechanism of multilayer co-production in tight gas reservoir with high heterogeneity and multi-pressure systems. J. Pet. Sci. Eng. 2022, 210, 109699. [Google Scholar] [CrossRef]
  15. Viswanathan, H.S.; Ajo-Franklin, J.; Birkholzer, J.T.; Carey, J.W.; Guglielmi, Y.; Hyman, J.D.; Karra, S.; Pyrak-Nolte, L.J.; Rajaram, H.; Srinivasan, G.; et al. From fluid flow to coupled processes in fractured rock: Recent advances and new frontiers. Rev. Geophys. 2022, 60, e2021RG000744. [Google Scholar] [CrossRef]
  16. Liu, C. Research on deep profile control technology of water flooding in Lamadian Oilfield. IOP Conf. Ser. Earth Environ. Sci. 2019, 384, 012134. [Google Scholar] [CrossRef]
  17. Ma, K.; Li, A.; Guo, S.; Pang, J.; Xue, Y.; Zhou, Z. Techniques for improving the water-flooding of oil fields during the high water-cut stage. Oil Gas Sci. Technol. Rev. IFP Energ. Nouv. 2019, 74, 69. [Google Scholar] [CrossRef]
  18. Yan, K.; Han, P.; Xie, K.; Meng, L.; Cao, W.; Cao, R.; Zhang, T.; Li, X.; Li, S. Identification and characterization of dominant seepage channels in oil reservoirs after polymer flooding based on streamline numerical simulation. Alex. Eng. J. 2024, 106, 704–720. [Google Scholar] [CrossRef]
  19. Song, K.; Wang, D.; Yang, E.; Wu, X.; Dong, C.; Sun, P. A novel method to identify preferential flow paths by considering the time-varying effect of petrophysical parameters in ultra-high water-cut reservoirs. Geoenergy Sci. Eng. 2024, 241, 213172. [Google Scholar] [CrossRef]
  20. Xu, L.; Yao, X.; Yan, S.; Wen, Z.; Xue, J. Fine characterization of nonmain oil layer distributions in complex fault block oilfield and its development model. Geofluids 2024, 2024, 2183265. [Google Scholar] [CrossRef]
  21. Wang, S.C.; Zhang, N.; Tang, Z.H.; Zou, X.-F.; Sun, Q.; Liu, W. Time-dependent model for two-phase flow in ultra-high water-cut reservoirs: Time-varying permeability and relative permeability. Pet. Sci. 2024, 21, 2536–2553. [Google Scholar] [CrossRef]
  22. Kazem, M.H.; Hussein, M.A.; Adnan, M.S.; Alfarge, D.; Mansour, I.J. The performance of streamline simulation technique to mimic the waterflooding management process in oil reservoirs. Fuel 2023, 348, 128556. [Google Scholar] [CrossRef]
  23. Aliyev, A.; Zivar, D.; Pourafshary, P. Investigation of replacing tracer flooding analysis by capacitance resistance model to estimate interwell connectivity. Petroleum 2023, 9, 61–71. [Google Scholar] [CrossRef]
  24. Li, S.; Feng, Q.; Zhang, X.; Yu, C.; Huang, Y. A new water flooding characteristic curve at ultra-high water cut stage. J. Pet. Explor. Prod. Technol. 2023, 13, 101–110. [Google Scholar]
  25. Meng, L.; Ju, B. Experimental study of water displacement rates on remaining oil distribution and oil recovery in 2D pore network model. Energies 2022, 15, 1501. [Google Scholar] [CrossRef]
  26. Yu, H.; Wang, Y.; Zhang, L.; Zhang, Q.; Guo, Z.; Wang, B.; Sun, T. Remaining oil distribution characteristics in an oil reservoir with ultra-high water-cut. Energy Geosci. 2024, 5, 100116. [Google Scholar] [CrossRef]
  27. Tang, B.; Ren, K.; Lu, H.; Li, C.; Geng, C.; Wei, L.; Chai, Z.; Wu, S. Study on residual oil distribution law during the depletion production and water flooding stages in the fault-karst carbonate reservoirs. Processes 2023, 11, 2147. [Google Scholar] [CrossRef]
  28. Liu, C.; Zhou, W.; Jiang, J.; Shang, F.; He, H.; Wang, S. Remaining oil distribution and development strategy for offshore unconsolidated sandstone reservoir at ultrahigh water-cut stage. Geofluids 2022, 2022, 6856298. [Google Scholar] [CrossRef]
  29. Cao, R.; Jia, Z.; Cheng, L.; Wang, Z.; Ye, T.; Rui, Z. Using high-intensity water flooding relative permeability curve for predicting mature oilfield performance after long-term water flooding in order to realize sustainable development. J. Pet. Sci. Eng. 2022, 215, 110629. [Google Scholar] [CrossRef]
  30. Si, R.; Shi, C.F.; Wang, Y.S.; Shi, W.W.; Qian, Q.H.; Wu, T. Classification and evaluation method of water flooded reservoir producing performance based on displacement units. Pet. Geol. Oilfield Dev. Daqing 2023, 42, 73–82. [Google Scholar]
  31. Feng, Q.H.; Li, S.-S.; Zhang, X.-M.; Gao, X.-F.; Ni, J.-H. Well production optimization using streamline features-based objective function and Bayesian adaptive direct search algorithm. Pet. Sci. 2022, 19, 2879–2894. [Google Scholar] [CrossRef]
  32. Arihara, N. Reservoir simulation technology by streamline-based methods. J. Jpn. Pet. Inst. 2005, 48, 325–335. [Google Scholar] [CrossRef]
  33. Maschio, C.; Schiozer, D.J. Assisted history matching using streamline simulation. Pet. Sci. Technol. 2005, 23, 761–774. [Google Scholar] [CrossRef]
  34. Huang, W.; Di Donato, G.; Blunt, M.J. Comparison of streamline-based and grid-based dual porosity simulation. J. Pet. Sci. Eng. 2004, 43, 129–137. [Google Scholar] [CrossRef]
  35. Denney, D. Use of streamline simulation in reservoir management. J. Pet. Technol. 2001, 53, 82–83. [Google Scholar] [CrossRef]
  36. Cui, C.Z.; Xu, J.-P.; Wang, D.-P.; Liu, Z.-H.; Huang, Y.-S.; Geng, Z.-L. Layer regrouping for water-flooded commingled reservoirs at a high water-cut stage. Pet. Sci. 2016, 13, 272–279. [Google Scholar] [CrossRef][Green Version]
  37. Song, K.P.; Wu, Y.S.; Ji, B.Y. A φ-function method for estimating distribution of residual oil saturation in water drive reservoir. Acta Pet. Sin. 2006, 27, 91. [Google Scholar]
  38. Lai, F.P.; Li, Z.-P.; Wei, H.-X.; Zhang, W. Characterization of the generalized permeability jail in tight reservoirs by analyzing relative-permeability curves and numerical simulation. Pet. Sci. 2023, 20, 2939–2950. [Google Scholar] [CrossRef]
  39. Cui, C.; Xu, J.; Wang, D.; Yang, Y.; Liu, Z.; Huang, Y. A new water flooding characteristic curve at ultra-high water cut stage. Acta Pet. Sin. 2015, 36, 1267. [Google Scholar]
  40. Wang, Y.S.; Shi, C.F.; Wang, J.Q. New equations for characterizing water flooding in ultra-high water-cut oilfields. Oil Gas Geol. 2020, 41, 1282–1287. [Google Scholar]
Figure 1. Areal diagram of DUs. (a) Envelope lines of DUs; (b) spatial coverage of DUs.
Energies 19 03056 g001
Figure 2. Diagram of DUs in multilayer reservoirs.
Energies 19 03056 g002
Figure 3. Permeability distribution shift of high–permeability cores.
Energies 19 03056 g003
Figure 4. Amplitude of permeability variation after high-multiple waterflooding.
Energies 19 03056 g004
Figure 5. Dynamic evolution of oil saturation in DUs.
Energies 19 03056 g005aEnergies 19 03056 g005b
Figure 6. Flow chart for dynamic liquid-volume splitting in DUs.
Energies 19 03056 g006
Figure 7. 3D flow model of oil–water two-phase DUs.
Energies 19 03056 g007
Figure 8. Functional relationship between the φ-function and water saturation (Sw).
Energies 19 03056 g008
Figure 9. Numerical flow simulation model of Northeast Field II.
Energies 19 03056 g009
Figure 10. Block history and simulation matching results.
Energies 19 03056 g010
Figure 11. Zonation of flow in the DUs of the main reservoir layer.
Energies 19 03056 g011
Figure 12. Calculated liquid production and water-cut distributions of DUs.
Energies 19 03056 g012
Figure 13. Comparison of layered liquid production volumes from the dynamic splitting model with actual measured production profiles.
Energies 19 03056 g013
Figure 14. Cost-parameter sensitivity of the economic water-cut limit at an oil price of 60 USD/bbl.
Energies 19 03056 g014
Figure 15. Identification of strong preferential flow units using 98% water-cut criterion.
Energies 19 03056 g015
Figure 16. Identification of strong preferential flow units using the techno-economic method.
Energies 19 03056 g016
Figure 17. Distribution of preferential flow paths in main layers S112 and S13.
Energies 19 03056 g017
Figure 18. Techno-economic classification matrix for DUs and identification of preferential flow paths.
Energies 19 03056 g018
Figure 19. Instantaneous streamline distribution in DUs before and after intervention. A–D denote four typical DU types, and the red circles indicate the selected representative units.
Energies 19 03056 g019
Table 1. Development cost parameter summary for Northeast Field II.
ParameterUnitValue
Total active wellsWells65
Total well operating costs¥ × 10413,130
Average daily well opening cost per well¥/(well·d)202
Base cost per ton of liquid¥/t58
Table 2. Classification and boundary conditions for DU control measures.
DU TypeBoundary ConditionsPhysical Characteristics
AΔfw < 0, Ed ≥ 50%Economically ineffective strong-channeling units
BΔfw < 0, Ed < 50%Channeling units with high remaining potential
CΔfw ≥ 0, Ed ≥ 50%Mature stable production units
DΔfw ≥ 0, Ed < 50%Homogeneous DUs
Table 3. Comparison of preferential-flow-path identification methods in waterflooded reservoirs.
MethodMain BasisMain AdvantageMain Limitation
Streamline simulationPressure field and streamline tracingVisualizes interwell connectivityModel-dependent; no direct economic evaluation
kh-based allocationPermeability–thickness productSimple and easy to implementStatic; cannot capture channel evolution
Production profile allocationLayered production/injection profilesDirect field constraintLimited areal resolution
Tracer diagnosisTracer breakthrough responseDirect evidence of connectivityCostly and discontinuous
Machine learning identificationGeological and dynamic datasetsEfficient nonlinear recognitionRequires labels; limited interpretability
Economic-limit water-cut methodBreak-even water-cut evaluationIdentifies economic ineffectivenessNo DU-scale flow allocation
Proposed methodDU dynamic splitting, saturation tracking, and economic evaluationLinks flow evolution with economic effectivenessRequires sufficient dynamic data
Disclaimer/Publisher’s Note: The statements, opinions and data contained in all publications are solely those of the individual author(s) and contributor(s) and not of MDPI and/or the editor(s). MDPI and/or the editor(s) disclaim responsibility for any injury to people or property resulting from any ideas, methods, instructions or products referred to in the content.