Article

Determinants of Industrial CO2 Emissions in the GCC: The Role of Energy Efficiency, Electricity Consumption, and Economic Factors

by
Jawaher Binsuwadan
*,
Dhay Alshughaythiri
,
Raghad Albaqami
and
Moneera Abunayyan
Department of Economics, College of Business Administration, Princess Nourah bint Abdulrahman University, P.O. Box 84428, Riyadh 11671, Saudi Arabia
*
Author to whom correspondence should be addressed.
Energies 2026, 19(13), 3034; https://doi.org/10.3390/en19133034
Submission received: 6 June 2026 / Revised: 24 June 2026 / Accepted: 25 June 2026 / Published: 27 June 2026
(This article belongs to the Special Issue Energy Transition and Economic Growth)

Abstract

Devoting attention to the mechanisms of enhancing energy efficiency through the transition to clean energy sources plays a vital and active role in moving forward towards environmental sustainability in the industrial economy. Industrial CO2 emissions across the Gulf Cooperation Council (GCC) remain persistently high despite growing regional commitments to clean energy transition and sustainability. This study examines the key determinants of industrial CO2 emissions in all six GCC member states over the period 2004–2022, focusing on energy efficiency, electricity consumption, oil use, trade openness, and economic growth. The analysis employs advanced panel econometric techniques, including cross-sectional dependence tests, second-generation unit root tests, and panel autoregressive distributed lag estimators, to identify both short-run and long-run relationships among the variables. The results reveal that in the short run, energy intensity is the sole statistically significant driver of industrial emissions. In the long run, energy intensity continues to increase emissions, while trade openness significantly reduces them. Neither oil consumption nor industrial electricity use exerts a significant positive long-run effect on emissions, pointing to a gradual decoupling driven by improving industrial energy efficiency and cleaner electricity generation. These findings suggest an emerging decoupling between industrial activity and carbon emissions in the GCC, driven by improvements in energy efficiency. For GCC economies pursuing economic diversification and net-zero targets, reducing industrial energy intensity and expanding low-carbon energy sources remain critical pathways toward sustainable industrial development.

1. Introduction

Industrial growth and rising energy demand have created serious environmental challenges that stand in the way of achieving the Sustainable Development Goals (SDGs), especially SDG 7 on clean energy and SDG 13 on climate action [1,2]. One of the biggest challenges of our time is climate change, caused by human greenhouse gas emissions. Beyond temperature increases, it threatens ecosystems, food security, and sustainable development [3]. Climate change, caused mainly by human-made greenhouse gas emissions, is one of the defining challenges of our time. Its effects reach far beyond rising temperatures, threatening ecosystems, food security, and long-term development [1,4]. The industrial sector is widely recognised as one of the largest sources of CO2 emissions from burning fossil fuels, and reducing these emissions is central to reaching net-zero targets [5,6]. This shift requires energy production and consumption transformation, cleaner technologies, low-carbon energy sources, and energy efficiency improvements [7]. Reliable environmental data and sound development indicators are essential tools for designing policies that actually work [8,9]. As living standards improve in both developed and developing countries, the demand for industrial goods and energy grows alongside them [10,11].
A large body of research has shown that the relationship between energy use, economic growth, and environmental quality is complex and often non-linear. Most studies agree that industrialisation tend to increase carbon intensity, especially early in economic development [10,12]. The Environmental Kuznets Curve (EKC) hypothesis offers a useful theoretical starting point here. It suggests that pollution tends to rise as economies grow but eventually falls once incomes reach a certain level and cleaner practices are adopted [13].
Over the past few decades, global energy markets have been significantly influenced by various factors, including geopolitical tensions, technological advancements, and the surge in energy demand that followed the COVID-19 pandemic [14]. Electricity consumption, in particular, has become a growing source of industrial CO2 emissions in many regions, largely because power generation still depends heavily on fossil fuels. The Gulf Cooperation Council (GCC)—made up of Bahrain, Kuwait, Oman, Qatar, Saudi Arabia, and the United Arab Emirates (UAE)—is a region where these pressures are especially visible. GCC governments have made energy efficiency a key policy goal, recognising that continued economic growth cannot come at the cost of environmental sustainability [15,16]. Understanding the link between energy use and CO2 emissions in the GCC is crucial due to its unique economic characteristics, including reliance on hydrocarbon revenues, subsidised energy prices, and energy-intensive industrial sectors [15,17].
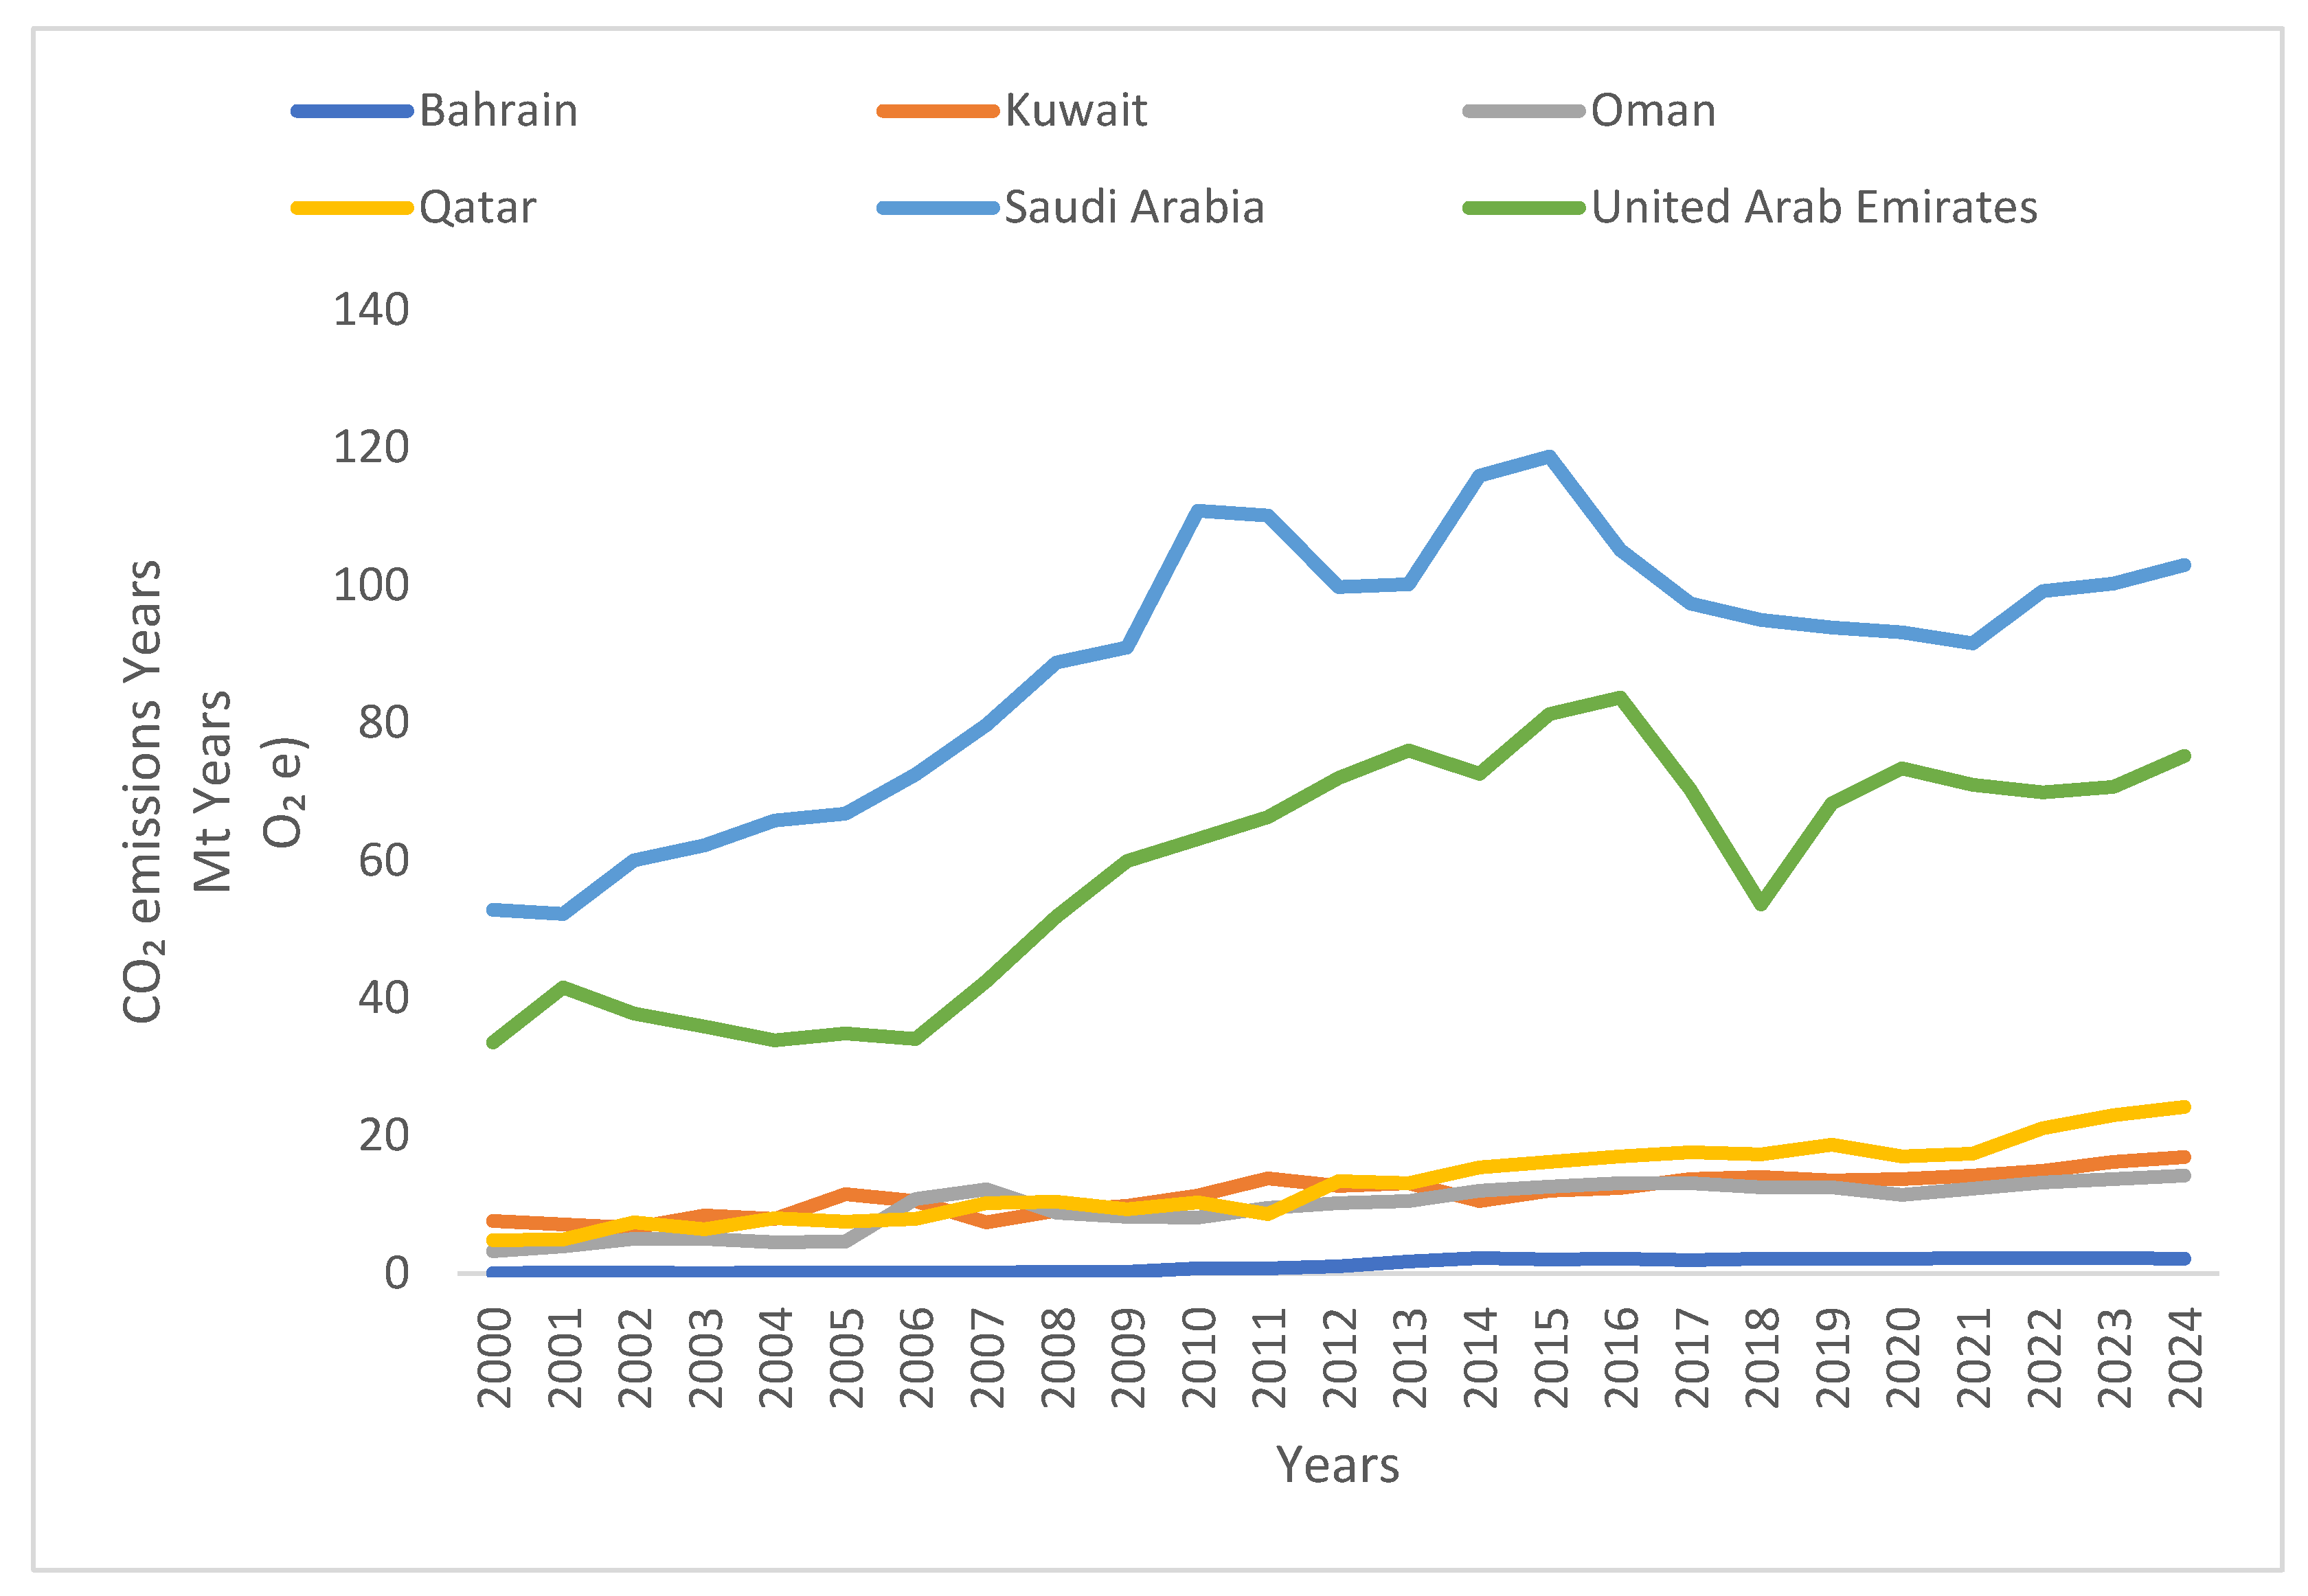
Figure 1 shows how industrial CO2 emissions have changed across GCC countries between 2000 and 2024. The differences between countries are striking. Saudi Arabia recorded the highest level of industrial CO2 emissions throughout the period, reflecting the dominant role of its industrial sector and large-scale manufacturing activities. The United Arab Emirates ranked second, exhibiting a generally upward trend despite some fluctuations in recent years. In contrast, Bahrain, Kuwait, Oman, and Qatar reported considerably lower emission levels, although most countries experienced a gradual increase over time. Taken together, the electricity and industrial consumption data point to a clear and urgent need for evidence-based strategies to reduce carbon emissions across the region [18,19].
As illustrated in Figure 1, GCC policymakers must achieve a balance between environmental objectives and the transition away from fossil fuels to meet the growing demand for energy [10,18]. This paper directly addresses that challenge by examining what drives industrial CO2 emissions across the GCC, with a particular focus on energy efficiency, electricity consumption, and key economic factors. As the world’s largest oil exporter, Saudi Arabia’s hydrocarbon sector plays an outsized role in shaping its emission profile, making it an important and instructive case for this kind of analysis [20]. By examining the GCC as a whole, this paper aims to offer practical insights into how the region can move toward a more sustainable energy and environmental future.
This study makes four contributions to the existing literature. First, it provides a detailed empirical analysis of how industrial energy consumption affects CO2 emissions across all six GCC countries, building on and extending earlier country-specific work [20,21]. This regional panel approach generates evidence that is more representative of the GCC as a whole and allows the identification of common drivers of industrial emissions that may not be observable in single-country studies. Second, it assesses the environmental performance of energy-intensive industries using a comprehensive dataset covering nearly two decades, which allows for a clearer picture of both short-term changes and long-term trends [10,19]. Third, it includes various economic variables, such as GDP, trade openness, and energy intensity, to provide a complete picture of GCC industrial emissions [18,22]. Fourth, it uses advanced panel econometric methods like cross-sectional dependence tests, second-generation unit root tests, and Autoregressive Distributed Lag (ARDL) cointegration estimators. These methods account for country differences and produce reliable, policy-relevant results.
The rest of the paper is structured as follows. Section 2 reviews the relevant theoretical and empirical literature. Section 3 describes the data and the econometric model used. Section 4 presents and discusses the main results. Section 5 concludes with policy recommendations and suggestions for future research.

2. Literature Review

The steady rise in CO2 emissions has pushed environmental sustainability to the top of the global policy agenda. The environmental costs of industrial and economic activity are well-documented, but they remain difficult to manage because of how deeply energy use is woven into the fabric of modern economies. In the GCC, this challenge is particularly acute. There is growing evidence that a wide range of industrial activities from petrochemicals and aluminium smelting to transport and construction is contributing significantly to the region’s carbon emissions. To design effective policies, it is crucial to understand the factors driving these emissions and how they interact. This section reviews the literature on the main causes of industrial CO2 emissions in the GCC. It discusses economic growth, oil consumption, electricity usage, and trade openness, then identifies gaps this paper will fill.

2.1. Industrial CO2 Emissions, Economic Growth, and Energy Consumption

The connection between industrial activity, economic growth, and environmental quality has become one of the most studied topics in environmental economics. The evidence is fairly consistent: energy consumption particularly from fossil fuels is closely linked to rising CO2 emissions in both developed and developing countries [23,24]. Economies like Saudi Arabia, which rely heavily on fossil fuels to power their industries, tend to see emissions rise in step with energy use and industrial output [20]. This pattern has been confirmed across many different regions and economic systems, reinforcing the idea that energy use is one of the most consistent drivers of environmental degradation, regardless of geography [25,26]. An interesting natural experiment came during the COVID-19 pandemic, when a sharp decline in industrial activity and energy demand led to some of the largest annual reductions in global CO2 emissions seen since 2000, a clear reminder of just how directly energy consumption and emissions are connected [27]. A recent comparative study covering Arab and European countries between 1990 and 2023 further explored this relationship, finding that the link between industrial production and emissions varies meaningfully depending on the size and structure of a country’s manufacturing sector [28].
That same study found that European Union countries showed a two-way causal relationship between industrial activity and CO2 emissions, while Arab countries displayed different dynamics, shaped in part by the scale of their heavy industries. Heavy industry is responsible for more than 70% of CO2 emissions around the world [29]. Research from ASEAN-5 countries adds another layer to this picture: for every 1% increase in industry’s share of GDP, CO2 emissions tend to rise by around 0.77%, though this effect is weaker in countries with strong environmental governance [30]. Much of the theoretical work in this area has focused on testing the EKC hypothesis, the idea that pollution first rises as economies grow and then falls once income levels reach a certain point. Studies using the ARDL approach have found support for this pattern: early-stage growth tends to increase emissions, but more advanced economies eventually reach a turning point where further growth is associated with environmental improvement [30]. Similar threshold effects have been found in developing economies using dynamic panel methods [31], and in Pakistan specifically, the turning point was estimated at $2500 in per capita GDP [32]. Taken together, these studies suggest that the relationship between growth and emissions is not fixed as it depends heavily on the sector, the stage of development, and the strength of environmental policy [33].
Recent review studies have further emphasised the importance of industrial decarbonisation through improvements in energy and resource efficiency, technological innovation, and supportive policy frameworks. Kim et al. [34] highlight the role of efficiency improvements and sociotechnical transitions in reducing industrial emissions, while Diesing et al. [35] identify multiple pathways for deep emission reductions in energy-intensive industries. These studies reinforce the importance of examining factors that influence industrial carbon intensity and emissions in energy-dependent economies such as the GCC.
H1. 
Energy consumption and economic growth are positively and significantly correlated with industrial CO2 emissions in the long run.

2.2. Oil Consumption Impact on Industrial CO2 Emissions

Oil is the dominant energy source across the GCC, and its role in shaping CO2 emissions is difficult to overstate. Research consistently shows a strong positive relationship between oil consumption and emission levels in regions where oil constitutesa large share of the energy mix [36,37]. In Saudi Arabia, oil-driven industrial activity has been identified as the single largest contributor to the country’s carbon footprint [20]. The link between oil and emissions is not just direct, changes in oil prices can also have indirect effects. When oil prices fall, energy-intensive industries tend to expand, pushing emissions higher. When prices rise, the opposite can occur, sometimes encouraging a shift toward more efficient or alternative energy sources. Studies on oil-exporting economies have shown that this asymmetric relationship between oil price movements and emissions is an important but often overlooked dimension of the energy–environment nexus [38,39]. It is crucial to understand this dynamic in the GCC, where oil revenues support government budgets and industrial subsidies. This understanding is essential for creating emission-reduction policies that maintain economic stability.
H2. 
Industrial CO2 emissions will be positively impacted by the oil consumption intensity of the industrial sector.

2.3. Electricity Consumption and Industrial CO2 Emissions

While emissions research has primarily focused on oil, researchers are increasingly recognising electricity consumption as a significant and distinct driver of industrial CO2 emissions. This is especially true in the GCC, where most electricity is still generated from fossil fuels, meaning that higher electricity demand translates almost directly into higher emissions [19]. Research shows that the efficiency with which electricity is used in industrial processes has a direct bearing on how many emissions are produced, more efficient electricity use generally means lower emissions per unit of output [40]. A study from Ghana offers a useful illustration, electricity consumption was found to be one of the strongest predictors of industrial emissions. This phenomenon is particularly evident in sectors that are heavily exposed to international trade and produce a wide range of goods across different sub-sectors of the economy.
Despite these findings, the specific role of electricity consumption in driving industrial emissions in Saudi Arabia has not been studied as thoroughly as overall energy use [18,36]. Evidence from other middle-income countries suggests that sectoral electricity consumption is likely to be one of the most important long-term drivers of environmental damage, making it a critical variable to include in any serious analysis of the GCC’s emission trajectory [41].
As the GCC’s industrial sector continues to expand, electricity consumption is expected to account for a growing share of its CO2 emissions. Isolating the specific contribution of electricity requires careful econometric analysis. Techniques such as ARDL and VECM are well suited to this task, as they can capture both short-run dynamics and long-run relationships between electricity use and emissions within the broader context of the country’s energy transition.
H3. 
There is a significant positive relationship between industrial electricity consumption and the level of industrial CO2 emissions.

2.4. Trade Openness and Industrial CO2 Emissions

The role of international trade in shaping a country’s emission profile is a subject of ongoing debate. The Pollution Haven hypothesis suggests that trade openness can increase emissions by attracting dirty industries to countries with weaker environmental regulations [42]. The Pollution Halo hypothesis, on the other hand, argues that trade can reduce emissions by enabling the transfer of cleaner technologies and higher environmental standards from advanced to developing economies [43]. In practice, the outcome depends heavily on the regulatory environment. Trade integration gives domestic industries access to greener technologies and international best practices in contexts with strong regulations [44]. Empirical evidence from China found a trade openness elasticity of −0.18 for GCC emissions, suggesting that greater trade integration has been associated with lower emissions, likely through technology transfer and efficiency gains [45]. At the same time, rapid urbanisation has worked in the opposite direction, with an elasticity of 0.31, as the energy demands of new infrastructure and expanding industrial services push emissions higher [46].
Research using quantile regression methods adds further nuance, showing that the relationship between trade and emissions varies depending on a country’s income level and where it sits in the distribution of emitters. This means that policy responses need to be tailored to a country’s specific stage of industrial development rather than applied uniformly. The GCC must determine whether trade openness reduces industrial emissions through technology transfer and efficiency gains or increases them due to industrial activity. This study addresses this crucial policy issue.
H4. 
Trade openness has a significant impact on industrial CO2 emissions, which can be a mitigating factor.

2.5. Research Gap

Despite the large volume of research on the energy-emissions nexus, several important gaps remain. First, most existing studies focus on total energy consumption or on oil specifically, leaving the role of electricity as a distinct and independent driver of industrial emissions largely unexplored [18,36]. Second, while regional studies of the GCC offer useful broad insights, there is a noticeable shortage of country-level econometric analyses that reflect the specific energy structures and industrial consumption patterns of individual GCC member states [47]. Third, many earlier studies rely on general economic models that do not capture sector-specific dynamics, such as the interplay between urbanisation, trade openness, and industrial energy intensity.
Crucially, very few studies have applied second-generation econometric techniques that account for cross-sectional dependence and structural breaks, which are particularly important when working with industrial-level panel data. The economic disruptions caused by the COVID-19 pandemic have also not yet been fully integrated into a comprehensive long-run analysis of industrial emission patterns in the GCC. This study seeks to fill these gaps by providing a customised econometric analysis. This analysis connects the goals of industrial diversification with the environment commitments of the region and offers new and practical insights for both researchers and policymakers.

3. Data and Methodology

3.1. Data

This study investigates the key factors that drive industrial CO2 emissions across the six GCC countries: Bahrain, Kuwait, Oman, Qatar, Saudi Arabia, and the United Arab Emirates. The analysis draws on a set of economic and energy-related variables that the existing literature consistently identifies as important determinants of industrial emissions. Specifically, the study focuses on how industrial electricity consumption, energy intensity, and broader macroeconomic conditions shape the level of CO2 emissions produced by the industrial sector. Based on the evidence reviewed, three factors stand out as primary drivers: electricity consumption in industry, the amount of energy used per unit of economic output, and key economic variables that influence overall energy demand. Industrial carbon emissions (CO2) serve as the dependent variable. The main explanatory variables are electricity consumption in industry (ECI), oil consumption (OIL), and energy use per GDP (EGDP) as a measure of energy intensity. GDP per capita (GDP) and trade openness (TRADE) are included as control variables to account for the broader macroeconomic environment and to isolate the effects of the main variables of interest.
The dataset covers the period from 2004 to 2022, which represents the longest available window for which complete and consistent data exist across all six countries. All data are drawn from two internationally recognised sources: the International Energy Agency (IEA) and the World Bank’s World Development Indicators (WDI). Together, these databases provide reliable, comparable time-series data on industrial energy use, environmental performance, and socioeconomic indicators for the entire GCC region. Although industrial electricity consumption and oil consumption are related in GCC economies, they represent distinct channels through which energy use may influence industrial CO2 emissions. Industrial electricity consumption captures the demand for electricity within industrial activities, while oil consumption reflects direct fossil fuel use. To ensure that the inclusion of both variables does not introduce multicollinearity, a Variance Inflation Factor (VIF) test was performed. The results in Table 1 shows a mean VIF of 2.72, while the highest individual VIF is 5.18, indicating that multicollinearity is not sufficiently severe to affect the reliability of the estimated coefficients.
The study tests four hypotheses that were developed based on the theoretical and empirical literature reviewed in Section 2. These hypotheses examine the relationships between energy consumption, economic growth, electricity use, and industrial CO2 emissions, as summarised in Table 2.
Table 2 classifies the drivers of industrial emissions into two broad categories: energy sources (oil and electricity consumption) and economic indicators (economic growth and trade openness). Together, these four hypotheses form the analytical foundation of the study and guide the model specification and estimation strategy presented in the sections that follow. Panel data techniques are used to test each of these relationships over the 2004–2022 period. Table 3 provides a full description of all dependent, independent, and control variables, including their definitions and data sources.

3.2. Methodology

The study uses a panel data analysis, which is well-suited because it captures both differences across countries and changes over time within each country [48,49]. The dependent variable is industrial CO2 emissions, and the main explanatory variables are electricity consumption in industry, oil consumption, and energy use. GDP per capita and trade openness are included as control variables. Before estimating the main relationships, the study addresses a common challenge in panel data analysis—the fact that GCC countries are closely linked economically and may be affected by common shocks. To account for this, cross-sectional dependence tests are applied first [50]. Since cross-sectional dependence is found to be present, second-generation panel unit root tests, specifically the Cross-sectionally Augmented Panel unit root (CIPS) and Cross-sectionally Augmented Dickey–Fuller (CADF) tests are conducted. They are used to examine whether the variables are stationary [51]. These tests are more reliable than conventional unit root tests when countries share common trends or are influenced by the same external factors.
Because the variables are found to be integrated at different orders, the panel ARDL approach is used to estimate both the short-run and long-run relationships between the variables [52]. This method is particularly flexible as it can handle variables that are stationary at different levels, making it well suited to the mixed-order integration found in this dataset. To confirm whether a stable long-run relationship exists between the variables, the Westerlund panel cointegration test is applied [53]. Finally, the Dumitrescu–Hurlin causality test is used to determine the direction of causality between the variables—that is, whether changes in energy use and economic activity drive emissions, or whether the relationship runs in the other direction [54]. The core econometric model estimated in this paper takes the following form:
CO2it = f (ECIit, OILit, EGDPit, GDPit, Tradeit)
In this equation, the subscript ( i ) denotes the individual GCC country and ( t ) denotes the time period. All variables are expressed in natural logarithms to allow for a straightforward interpretation of the estimated coefficients as elasticities. Descriptive statistics for all variables are reported in Table 4, and the ARDL bounds testing approach is used to formally test for the existence of long-run relationships [52]. Table 3 presents summary statistics for all six variables across the full sample of 114 observations, covering all six GCC countries over the 2004–2022 period. The statistics provide an initial picture of the distribution, central tendency, and variability of each variable.
Table 5 reports the pairwise correlations between all variables. Most correlation coefficients fall below ±0.80, which suggests that multicollinearity is not a serious concern and that the variables can be included together in the regression model without distorting the estimates.
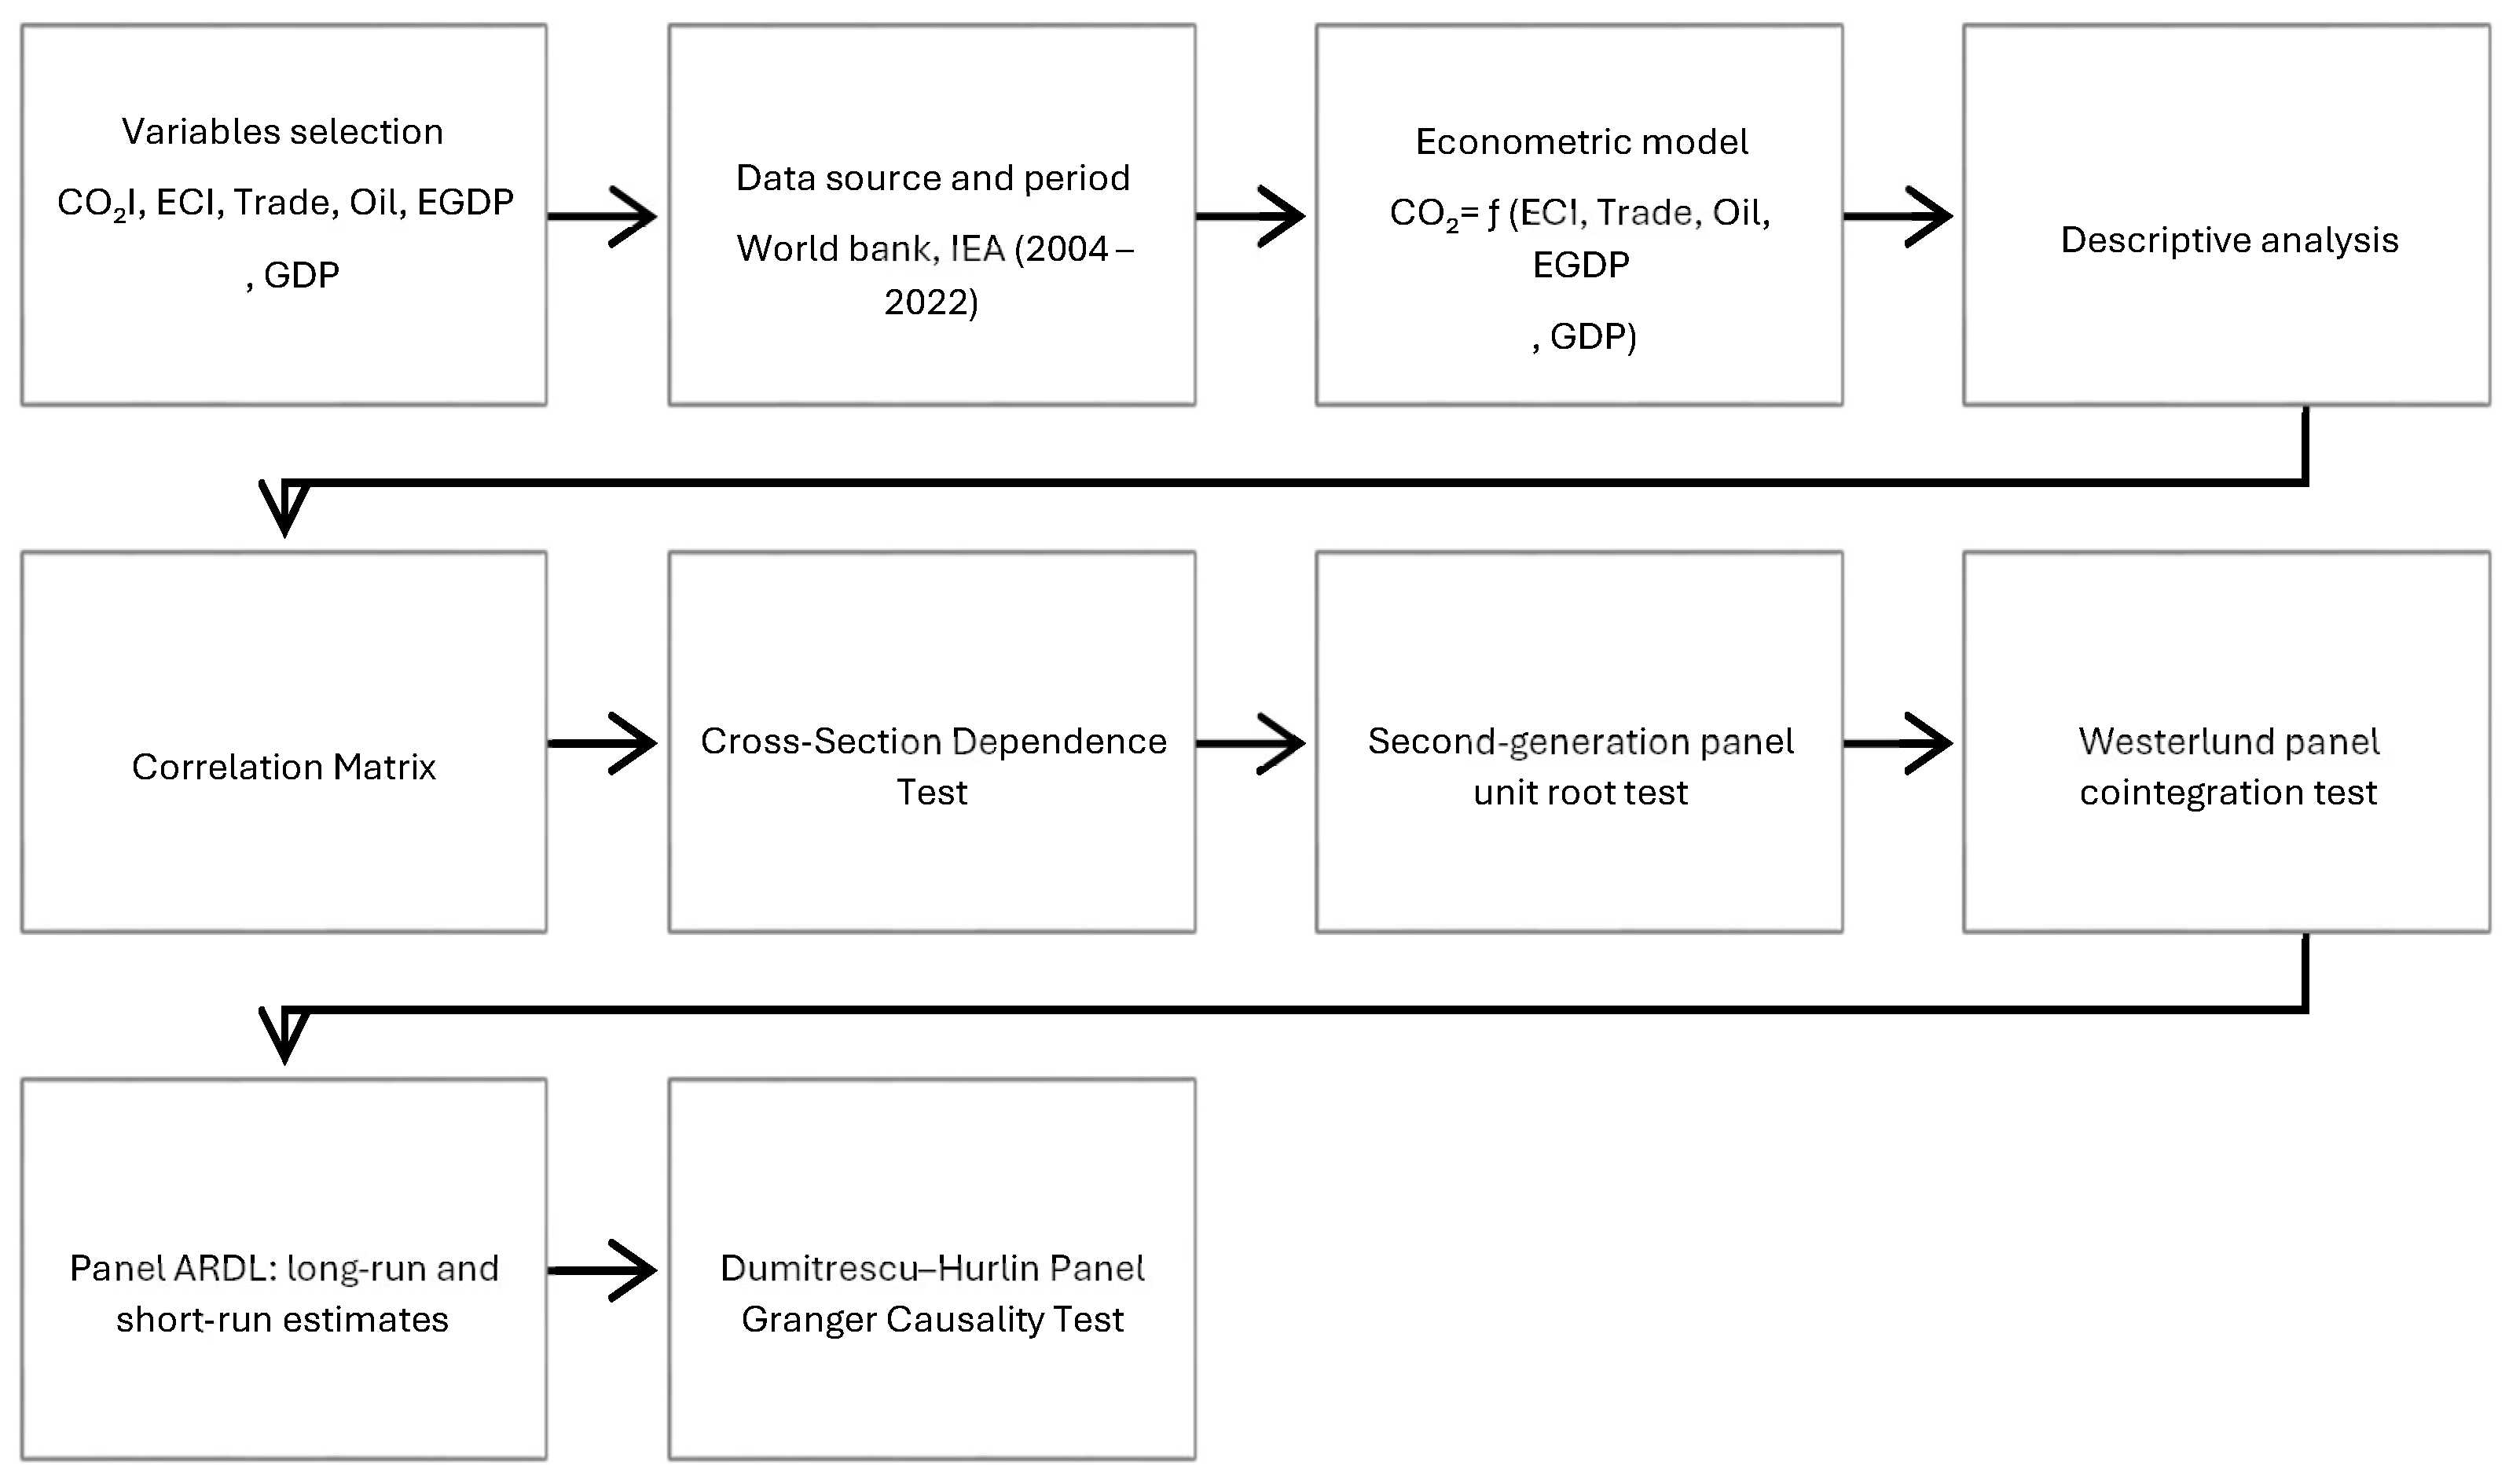
Figure 2 provides a visual summary of the step-by-step econometric procedure followed in this paper, from data preparation and diagnostic testing through to model estimation and causality analysis.

4. Results and Discussion

4.1. Results

Table 6 presents the results of the cross-sectional dependence test. The significant p-values confirm that cross-sectional dependence is present across most variables in the panel. In simple terms, this means that the GCC countries do not behave independently of one another, and shocks or trends in one country tend to be reflected in others as well. This is not surprising given the region’s shared economic structure, coordinated energy policies, and common exposure to global oil price movements. Because of this dependence, using standard first-generation unit root tests would produce unreliable results. The analysis therefore moves to second-generation unit root tests, which are specifically designed to handle cross-sectionally dependent panels.
Table 7 reports the results of the second-generation panel unit root tests, using both the CIPS and CADF methods. The results show that some variables are stationary at level—that is, they do not have a unit root in their original form (I (0)), while others only become stationary after first differencing (I (1)). This mixed order of integration is an important finding because it confirms that the panel ARDL model is the most appropriate estimation approach for this dataset. Unlike methods that require all variables to be integrated at the same order, the ARDL framework can accommodate this mix without compromising the reliability of the estimates.
Table 8 presents the results of the Westerlund panel cointegration test, which examines whether the variables share a stable long-run equilibrium relationship. The p-values for all test statistics are not statistically significant, indicating that the test does not provide strong evidence of cointegration. Nevertheless, the panel ARDL framework remains suitable for analysing both short-run and long-run dynamics, particularly when the estimated error correction term is negative and statistically significant. Therefore, the long-run results should be interpreted with appropriate caution and viewed as evidence of long-run adjustment patterns rather than definitive proof of cointegration.
Table 9 presents the short-run and long-run estimates from the panel ARDL model. The error correction term is negative and statistically significant, which is an important result. It confirms that when the system is pushed away from its long-run equilibrium, for example, by a sudden change in energy prices or policy, it will gradually return to that equilibrium over time. This gives confidence that the long-run relationships estimated by the model are stable and meaningful. In the short run, energy intensity and oil consumption have a statistically significant effect on industrial CO2 emissions. In the long run, both trade openness and energy intensity emerge as statistically significant drivers of industrial CO2 emissions.
Table 10 reports the results of the Dumitrescu–Hurlin panel Granger causality test, which examines the direction of the relationships between variables. The results reveal several important patterns. First, there is a unidirectional causal relationship running from electricity consumption in industry to CO2 emissions, meaning that changes in industrial electricity use are a leading indicator of emission changes, but not the other way around. Second, no causal relationship is found between trade openness and CO2 emissions in either direction. Third, CO2 emissions are found to cause changes in oil consumption and overall energy use, suggesting that rising emission levels may be prompting adjustments in energy behaviour. Finally, a bidirectional causal relationship exists between GDP per capita and CO2 emissions, meaning that economic growth and industrial emissions are mutually reinforcing over time.
As a robustness check, the panel ARDL model was re-estimated after excluding the COVID-19 period (2020–2022), and the corresponding results are reported in Appendix A. The robustness analysis indicates that excluding the pandemic period changes the statistical significance of some long-run coefficients, particularly those associated with oil consumption and industrial electricity use, suggesting that these relationships may be sensitive to major external shocks. Nevertheless, the error-correction term remains negative and highly statistically significant, confirming the continued presence of a stable adjustment mechanism toward the long-run equilibrium. Overall, the robustness check highlights the importance of accounting for structural disruptions when interpreting long-run industrial CO2 emission dynamics in the GCC.

4.2. Discussion

The results paint a nuanced picture of what drives industrial CO2 emissions in the GCC. Energy-related and economic factors both play a role, but their effects differ considerably depending on the time horizon. One of the more striking findings concerns oil consumption. Despite oil being the dominant energy source in the region, its relationship with industrial CO2 emissions in the long run is negative and statistically insignificant, this is a counterintuitive result. However, because the coefficient is not statistically significant, no definitive long-run relationship can be established between oil consumption and industrial CO2 emissions. Nevertheless, the negative sign may be consistent with ongoing improvements in industrial energy efficiency and sustainability initiatives across GCC countries, although this interpretation should be treated with caution [55].
The causality results add another layer to this finding. The Dumitrescu–Hurlin test shows that CO2 emissions cause changes in oil consumption. This suggests that growing environmental awareness and tightening emission-related policies are beginning to influence how much oil GCC industries consume, rather than oil consumption simply driving up emissions as it has historically. A similar pattern emerges for electricity consumption in industry, which also shows a negative and statistically insignificant long-run coefficient. Therefore, no robust evidence of a long-run effect can be inferred. However, the negative sign may be broadly consistent with recent investments in renewable energy and improvements in electricity generation efficiency across GCC countries, although this interpretation remains speculative and is not directly tested in the present study [56,57].
In contrast to oil and electricity, energy intensity measured as energy use per unit of GDP has a positive and statistically significant effect on industrial CO2 emissions in both the short and long run. This is the most consistent finding in the analysis and carries a clear policy message. GCC economies that use more energy per unit of economic output produce more industrial emissions. Reducing energy intensity by improving industrial processes, upgrading equipment, and adopting more efficient technologies is therefore one of the most direct and effective levers available to policymakers. This is important for seeking to reduce the region’s industrial carbon footprint [58]. Trade openness also emerges as a significant long-run driver of lower emissions. This supports the Pollution Halo hypothesis discussed in the literature review. Greater integration into international trade appears to facilitate the adoption of cleaner technologies and more efficient industrial practices in the GCC. This is consistent with the region’s broader push to diversify its economy and reduce its reliance on fossil fuels [59].
The robustness analysis further suggests that some long-run relationships, particularly those associated with oil consumption and industrial electricity use, may be sensitive to major external shocks such as the COVID-19 pandemic. This highlights the importance of accounting for structural disruptions when interpreting long-run industrial CO2 emission dynamics in the GCC.
The bidirectional causality between GDP per capita and CO2 emissions is also noteworthy. This confirms the close interconnection between economic growth and industrial emissions in the GCC context. As growth tends to push emissions up, higher emission levels may in turn signal the kind of heavy industrial activity that drives economic expansion. This two-way relationship underscores the core challenge facing GCC policymakers, how to sustain economic growth and industrial diversification while simultaneously meeting their environmental commitments. The absence of a causal link between trade and emissions despite trade’s significant long-run coefficient in the ARDL model suggests that trade contributes to emission reductions over time. The effect unfolds gradually and may not be immediately visible in year-to-year fluctuations [60]. Taken together, these findings point to a region that is in transition energy efficiency is improving, cleaner electricity is gaining ground, and trade is helping to transfer greener technologies. However, energy intensity remains stubbornly high, and the link between growth and emissions has yet to be fully broken.

5. Conclusions

This paper set out to examine what drives industrial CO2 emissions in the GCC region, with a particular focus on the roles of energy efficiency, electricity consumption, oil use, and key economic factors. Using panel data covering all six GCC member states over the period 2004–2022, the analysis combined advanced econometric techniques, including cross-sectional dependence tests, second-generation unit root tests, panel ARDL estimation, and Granger causality testing. This helps to produce a comprehensive and methodologically robust picture of the emission–energy nexus in the region. The findings are particularly relevant in the context of the GCC’s ambitious sustainability agendas, including Saudi Arabia’s Vision 2030 and the UAE’s Net Zero by 2050 Strategic Initiative, both of which place energy transition and industrial decarbonisation at their core.
The results provide several important insights. In the long run, neither oil consumption nor industrial electricity use exerts a statistically significant effect on CO2 emissions. Therefore, no robust long-run relationship can be established between these variables and industrial emissions within the estimated model. In contrast, energy intensity remains a significant and persistent driver of industrial emissions, while trade openness contributes to emission reductions over time. Trade openness emerges as a long-run driver of lower emissions, supporting the idea that greater integration into global markets helps the region access and adopt cleaner technologies and more sustainable industrial practices. At the same time, energy intensity remains a significant and persistent driver of industrial emissions in both the short and long run. This is the clearest signal in the data that GCC economies reduce how much energy they consume relative to what they produce, industrial emissions will remain high. The bidirectional relationship between GDP per capita and CO2 emissions further underlines the challenge and breaking that link will require deliberate and sustained policy effort.
These findings carry clear implications for policymakers across the GCC. The most urgent priority is reducing energy intensity in the industrial sector. This means investing in energy-efficient technologies, upgrading industrial infrastructure, and setting clear efficiency standards for energy-intensive industries such as petrochemicals, aluminium, and cement. At the same time, governments should continue to expand renewable energy capacity and accelerate the shift toward cleaner electricity generation, building on the progress already made in countries like Saudi Arabia and the UAE. To engage the private sector, policymakers should explore various incentives, such as carbon pricing mechanisms, tax relief for green investments, and subsidies for adopting clean technologies. Embracing industry tools, such as smart energy management systems and AI-driven process optimisation, can also play an important role in helping industrial firms reduce their energy footprint without sacrificing productivity.
This study has several limitations that are worth acknowledging. The most notable is the unavailability of detailed micro-level data for certain industrial variables—for example, the precise share of renewable energy used within individual manufacturing plants or firm-level energy efficiency metrics. This reflects a broader data availability challenge across the GCC, where industrial statistics at the sub-sector level are not always publicly reported in a consistent or comparable form. The study addresses this issue by using well-established proxy indicators sourced from the IEA and World Bank, which are widely used in the literature and provide a reliable basis for the analysis. Future research would benefit from incorporating more granular data as they become available, which would allow for a more precise assessment of emission drivers at the firm and subsector level. While the panel ARDL approach mitigates potential simultaneity concerns through the inclusion of lagged variables and dynamic adjustment mechanisms, the possibility of residual endogeneity arising from omitted variables or reverse causality cannot be entirely ruled out. Therefore, the findings should be interpreted as evidence of long-run and short-run associations rather than definitive causal effects. Future studies may employ instrumental variable or system GMM techniques to further address potential endogeneity concerns. Several directions for future research emerge from this study. First, incorporating additional variables, such as public awareness of energy conservation, specific environmental taxes, or the role of green finance. This could provide a richer understanding of what shapes industrial emission trajectories in the GCC. Second, extending the analytical framework to a broader set of countries, particularly other energy-exporting economies in the Middle East, Africa, or Central Asia. This would allow for meaningful cross-regional comparisons and help identify whether the patterns found here are specific to the GCC or more widely applicable. Third, the growing role of artificial intelligence and digitalisation in managing industrial energy demand is an emerging area that deserves dedicated empirical attention. As GCC economies transition to more diversified and sustainable growth models, researchers and policymakers must understand how digital technologies, energy consumption, and emissions interact.


Author Contributions

Conceptualization, J.B., D.A., R.A. and M.A.; methodology, J.B.; software, J.B.; validation, J.B., D.A., R.A. and M.A.; formal analysis, J.B.; investigation, J.B., D.A., R.A. and M.A.; resources, J.B.; writing—original draft preparation, J.B., D.A., R.A. and M.A.; writing—review and editing, J.B., D.A., R.A. and M.A.; funding acquisition, J.B. All authors have read and agreed to the published version of the manuscript.

Funding

This research was funded by the Princess Nourah bint Abdulrahman University Researchers Supporting Project number (PNURSP2026R540), Princess Nourah bint Ab-dulrahman University, Riyadh, Saudi Arabia.

Institutional Review Board Statement

Not applicable.

Data Availability Statement

The data that support the findings of this study are openly available to the public.

Acknowledgments

The authors extend their appreciation to the Princess Nourah bint Abdulrahman University Researchers Supporting Project number (PNURSP2026R540), Princess Nourah bint Abdulrahman University, Riyadh, Saudi Arabia.

Conflicts of Interest

The authors declare no conflicts of interest.

Appendix A

Table A1. Robustness check excluding the COVID-19 period (2020–2022).
VariablesCoefficientp-Value
Short-Run Equation
COINTEQ01−1.4528460.000
Δ Ln ECI−0.58869530.352
Δ Ln Trade−0.44494320.575
Δ Ln Oil0.95057290.285
Δ Ln EGDP0.61468600.286
Δ Ln GDP−3.9586710.035
Long-Run Equation
Ln ECI−0.15970930.526
Ln Trade−0.16829110.643
Ln Oil0.30117740.341
Ln EGDP0.22814240.284
Ln GDP−1.3731480.076

References

  1. IPCC. Climate Change 2021: The Physical Science Basis; Cambridge University Press: Cambridge, UK, 2021. [Google Scholar]
  2. UNEP. Emissions Gap Report 2022; United Nations Environment Programme: Nairobi, Kenya, 2022. [Google Scholar]
  3. OECD. CO2 Emissions from Fuel Combustion 2019; OECD Publishing: Paris, France, 2019. [Google Scholar]
  4. Friedlingstein, P.; Jones, M.W.; O’Sullivan, M.; Andrew, R.M.; Bakker, D.C.; Hauck, J.; Le Quéré, C.; Peters, G.P.; Peters, W.; Pongratz, J. Global carbon budget 2021. Earth Syst. Sci. Data 2022, 14, 1917–2005. [Google Scholar] [CrossRef]
  5. International Energy Agency (IEA). World Energy Outlook 2024; IEA: Paris, France, 2024. [Google Scholar]
  6. International Energy Agency (IEA). CO2 Emissions in 2023; IEA: Paris, France, 2023. [Google Scholar]
  7. IRENA. World Energy Transitions Outlook 2022; International Renewable Energy Agency: Abu Dhabi, United Arab Emirates, 2022. [Google Scholar]
  8. World Bank. World Development Indicators 2022; World Bank: Washington, DC, USA, 2022. [Google Scholar]
  9. BP. Statistical Review of World Energy 2023; BP: London, UK, 2023. [Google Scholar]
  10. Apergis, N.; Payne, J.E. Energy consumption and economic growth: Evidence from the Commonwealth of Independent States. Energy Econ. 2009, 31, 641–647. [Google Scholar] [CrossRef]
  11. Munir, Q.; Lean, H.H.; Smyth, R. CO2 emissions, energy consumption and economic growth in the ASEAN-5 countries: A cross-sectional dependence approach. Energy Econ. 2020, 85, 104571. [Google Scholar] [CrossRef]
  12. Shahbaz, M.; Khan, S.; Tahir, M.I. The dynamic links between energy consumption, economic growth, financial development and trade in China: Fresh evidence from multivariate framework analysis. Energy Econ. 2013, 40, 8–21. [Google Scholar] [CrossRef]
  13. Dinda, S. Environmental Kuznets curve hypothesis: A survey. Ecol. Econ. 2004, 49, 431–455. [Google Scholar] [CrossRef]
  14. International Energy Agency (IEA). Electricity Market Report-July 2022; IEA: Paris, France, 2022. [Google Scholar]
  15. Bekhet, H.A.; Matar, A.; Yasmin, T. CO2 emissions, energy consumption, economic growth, and financial development in GCC countries: Dynamic simultaneous equation models. Renew. Sustain. Energy Rev. 2017, 70, 117–132. [Google Scholar] [CrossRef]
  16. Alarenan, S.; Gasim, A.A.; Hunt, L.C.; Muhsen, A.R. Measuring underlying energy efficiency in the GCC countries using a newly constructed dataset. Energy Transit. 2019, 3, 31–44. [Google Scholar] [CrossRef]
  17. Qader, M.R. Electricity consumption and GHG emissions in GCC countries. Energies 2009, 2, 1201–1213. [Google Scholar] [CrossRef]
  18. Androniceanu, A.; Georgescu, I. The impact of CO2 emissions and energy consumption on economic growth: A panel data analysis. Energies 2023, 16, 1342. [Google Scholar] [CrossRef]
  19. Ahmed, T.Z.Y.; Ahmed, M.E.; Ahmed, Q.A.; Mohamed, A.A. A review of electricity consumption and CO2 emissions in Gulf Cooperation Council households and proposed scenarios for its reduction. Arab Gulf J. Sci. Res. 2024, 42, 1882–1899. [Google Scholar] [CrossRef]
  20. Alajmi, R.G. Energy consumption and carbon emissions: An empirical study of Saudi Arabia. Sustainability 2024, 16, 5496. [Google Scholar] [CrossRef]
  21. Mezghani, I.; Haddad, H.B. Energy consumption and economic growth: An empirical study of the electricity consumption in Saudi Arabia. Renew. Sustain. Energy Rev. 2017, 75, 145–156. [Google Scholar] [CrossRef]
  22. Chaabouni, I.; Abid, I. Key drivers of energy consumption in the gulf cooperation council countries: A panel analysis. Eng. Technol. Appl. Sci. Res. 2025, 15, 21627–21632. [Google Scholar] [CrossRef]
  23. Awais, M.; Akram, S.; Safdar, H. Exploring the Relationship between CO2 Emission, Economic Growth, and Energy Consumption at Aggregate Level: A Panel Data Analysis. J. Econ. Impact 2024, 6, 218–225. [Google Scholar] [CrossRef]
  24. Shahbaz, M.; Balsalobre, D.; Shahzad, S.J.H. The influencing factors of CO2 emissions and the role of biomass energy consumption: Statistical experience from G-7 countries. Environ. Model. Assess. 2019, 24, 143–161. [Google Scholar]
  25. Li, J.; Irfan, M.; Samad, S.; Ali, B.; Zhang, Y.; Badulescu, D.; Badulescu, A. The relationship between energy consumption, CO2 emissions, economic growth, and health indicators. Int. J. Environ. Res. Public Health 2023, 20, 2325. [Google Scholar] [CrossRef] [PubMed]
  26. Inal, V.; Addi, H.M.; Çakmak, E.E.; Torusdağ, M.; Çalışkan, M. The nexus between renewable energy, CO2 emissions, and economic growth: Empirical evidence from African oil-producing countries. Energy Rep. 2022, 8, 1634–1643. [Google Scholar] [CrossRef]
  27. Smith, L.V.; Tarui, N.; Yamagatax, T. Assessing the Impact of COVID-19 on Global Fossil Fuel Consumption and CO2 Emissions. ISER Discussion Paper. 2020. Available online: https://www.sciencedirect.com/science/article/pii/S014098832100075X?via%3Dihub (accessed on 15 March 2026).
  28. Aye, G.C.; Edoja, P.E. Effect of economic growth on CO2 emission in developing countries: Evidence from a dynamic panel threshold model. Cogent Econ. Financ. 2017, 5, 1379239. [Google Scholar] [CrossRef]
  29. Hassan, F.A. Industrial Production and Carbon Emissions: A Comparative Analysis of Selected Arab and European Countries (1990–2023). J. Econ. Stud. 2025, 17, 259–272. [Google Scholar] [CrossRef]
  30. Diartho, H.C. Dynamics of carbon emissions and green economy in ASEAN-4: Analysis of causality and government commitments. Int. J. Energy Econ. Policy 2025, 15, 71–82. [Google Scholar] [CrossRef]
  31. Mahmood, N.; Wang, Z.; Hassan, S.T. Renewable energy, economic growth, human capital, and CO2 emission: An empirical analysis. Environ. Sci. Pollut. Res. 2019, 26, 20619–20630. [Google Scholar] [CrossRef]
  32. Khan, M.K.; Khan, M.I.; Rehan, M. The relationship between energy consumption, economic growth and carbon dioxide emissions in Pakistan. Financ. Innov. 2020, 6, 1. [Google Scholar] [CrossRef]
  33. Hasson, A.; Masih, M. Energy Consumption, Trade Openness, Economic Growth, Carbon Dioxide Emissions and Electricity Consumption: Evidence from South Africa Based on ARDL. 2017. Available online: https://mpra.ub.uni-muenchen.de/79424/1/MPRA_paper_79424.pdf (accessed on 15 March 2026).
  34. Kim, J.; Sovacool, B.K.; Bazilian, M.; Griffiths, S.; Yang, M. Energy, material, and resource efficiency for industrial decarbonization: A systematic review of sociotechnical systems, technological innovations, and policy options. Energy Res. Soc. Sci. 2024, 112, 103521. [Google Scholar] [CrossRef]
  35. Diesing, P.; Lopez, G.; Blechinger, P.; Breyer, C. From knowledge gaps to technological maturity: A comparative review of pathways to deep emission reduction for energy-intensive industries. Renew. Sustain. Energy Rev. 2025, 208, 115023. [Google Scholar] [CrossRef]
  36. Aslam, B.; Hu, J.; Ali, S.; AlGarni, T.; Abdullah, M. Malaysia’s economic growth, consumption of oil, industry and CO2 emissions: Evidence from the ARDL model. Int. J. Environ. Sci. Technol. 2022, 19, 3189–3200. [Google Scholar]
  37. Nandnaba, S.; Hailemariam, A.; Gupta, R.; Sheng, X. Oil consumption and growth: Is there a threshold effect of greenhouse gases emissions. Innov. Green Dev. 2025, 4, 100240. [Google Scholar] [CrossRef]
  38. Agbanike, T.F.; Nwani, C.; Uwazie, U.I.; Anochiwa, L.I.; Onoja, T.-G.C.; Ogbonnaya, I.O. Oil price, energy consumption and carbon dioxide (CO2) emissions: Insight into sustainability challenges in Venezuela. Lat. Am. Econ. Rev. 2019, 28, 8. [Google Scholar] [CrossRef]
  39. Mukhtarov, S.; Azizov, M.; Kartal, M.T.; Eynalov, H. Catalyzing green transformation: Mitigating oil price impact on CO2 emissions in Saudi Arabia via renewable energy transition. Environ. Econ. Policy Stud. 2026, 28, 95–117. [Google Scholar]
  40. Abokyi, E.; Appiah-Konadu, P.; Tangato, K.F.; Abokyi, F. Electricity consumption and carbon dioxide emissions: The role of trade openness and manufacturing sub-sector output in Ghana. Energy Clim. Change 2021, 2, 100026. [Google Scholar] [CrossRef]
  41. Sohag, K.; Al Mamun, M.; Uddin, G.S.; Ahmed, A.M. Sectoral output, energy use, and CO2 emission in middle-income countries. Environ. Sci. Pollut. Res. 2017, 24, 9754–9764. [Google Scholar] [CrossRef]
  42. Bashir, M.F. Discovering the evolution of Pollution Haven Hypothesis: A literature review and future research agenda. Environ. Sci. Pollut. Res. 2022, 29, 48210–48232. [Google Scholar] [CrossRef]
  43. Kılavuz, E.; Doğan, İ. Economic growth, openness, industry and CO2 modelling: Are regulatory policies important in Turkish economies? Int. J. Low-Carbon Technol. 2021, 16, 476–487. [Google Scholar] [CrossRef]
  44. Hdom, H.A.; Fuinhas, J.A. Energy production and trade openness: Assessing economic growth, CO2 emissions and the applicability of the cointegration analysis. Energy Strategy Rev. 2020, 30, 100488. [Google Scholar] [CrossRef]
  45. Amin, A.; Ameer, W.; Yousaf, H.; Akbar, M. Financial development, institutional quality, and the influence of various environmental factors on carbon dioxide emissions: Exploring the nexus in China. Front. Environ. Sci. 2022, 9, 838714. [Google Scholar] [CrossRef]
  46. Sharif, A.; Kocak, S.; Khan, H.H.A.; Uzuner, G.; Tiwari, S. Demystifying the links between green technology innovation, economic growth, and environmental tax in ASEAN-6 countries: The dynamic role of green energy and green investment. Gondwana Res. 2023, 115, 98–106. [Google Scholar] [CrossRef]
  47. Binsuwadan, J.; Yousif, G.; Abdulrahim, H.; Alofaysan, H. The role of the circular economy in fostering sustainable economic growth in the GCC. Sustainability 2023, 15, 15926. [Google Scholar] [CrossRef]
  48. Baltagi, B.H. Econometric Analysis of Panel Data; John Wiley: Hoboken, NJ, USA, 2008. [Google Scholar]
  49. Wooldridge, J.M. Econometric Analysis of Cross Section and Panel Data; MIT Press: Cambridge, MA, USA, 2010. [Google Scholar]
  50. Pesaran, M.H. General diagnostic tests for cross-sectional dependence in panels. Empir. Econ. 2021, 60, 13–50. [Google Scholar]
  51. Pesaran, M.H. A simple panel unit root test in the presence of cross-section dependence. J. Appl. Econom. 2007, 22, 265–312. [Google Scholar] [CrossRef]
  52. Pesaran, M.H.; Shin, Y.; Smith, R.J. Bounds testing approaches to the analysis of level relationships. J. Appl. Econom. 2001, 16, 289–326. [Google Scholar] [CrossRef]
  53. Westerlund, J. Testing for error correction in panel data. Oxf. Bull. Econ. Stat. 2007, 69, 709–748. [Google Scholar] [CrossRef]
  54. Dumitrescu, E.-I.; Hurlin, C. Testing for Granger non-causality in heterogeneous panels. Econ. Model. 2012, 29, 1450–1460. [Google Scholar] [CrossRef]
  55. Amran, Y.A.; Amran, Y.M.; Alyousef, R.; Alabduljabbar, H. Renewable and sustainable energy production in Saudi Arabia according to Saudi Vision 2030; Current status and future prospects. J. Clean. Prod. 2020, 247, 119602. [Google Scholar] [CrossRef]
  56. Charfeddine, L.; Kahia, M. Impact of renewable energy consumption and financial development on CO2 emissions and economic growth in the MENA region: A panel vector autoregressive (PVAR) analysis. Renew. Energy 2019, 139, 198–213. [Google Scholar] [CrossRef]
  57. Almasri, R.A.; Narayan, S. A recent review of energy efficiency and renewable energy in the Gulf Cooperation Council (GCC) region. Int. J. Green Energy 2021, 18, 1441–1468. [Google Scholar] [CrossRef]
  58. Azubuike, N.C.; Ikiensikimama, S.S.; Osokogwu, U. Modelling the impact of total energy consumption on economic growth and carbon emissions in sub-saharan africa. Energy Strategy Rev. 2025, 61, 101840. [Google Scholar] [CrossRef]
  59. Shahbaz, M.; Nasreen, S.; Ahmed, K.; Hammoudeh, S. Trade openness–carbon emissions nexus: The importance of turning points of trade openness for country panels. Energy Econ. 2017, 61, 221–232. [Google Scholar] [CrossRef]
  60. Bekhet, H.A.; Othman, N.S. Impact of urbanization growth on Malaysia CO2 emissions: Evidence from the dynamic relationship. J. Clean. Prod. 2017, 154, 374–388. [Google Scholar] [CrossRef]
Figure 1. Industrial CO2 emissions trends in GCC countries (2000–2024). Data source: International Energy Agency (IEA).
Energies 19 03034 g001
Figure 2. Flowchart of methodologies applied.
Energies 19 03034 g002
Table 1. Variance Inflation Factor results.
VariableVIF1/VIF
Ln Oil5.180.193198
Ln EGDP2.930.341184
Ln ECI2.860.349792
Ln Trade1.410.708242
ln GDP1.210.826495
Mean VIF2.72
Table 2. Paper Hypotheses.
Hypothesis NumberHypothesis
H1Energy consumption and economic growth are positively and significantly correlated with industrial CO2 emissions.
H2Oil consumption is strongly correlated with Industrial CO2 emissions.
H3There is a significant positive correlation between industrial electricity consumption and the level of industrial CO2 emissions.
H4Trade openness has a significant impact on industrial CO2 emissions, which can be a mitigating factor through the transfer of technology.
Table 3. Description of Variables.
VariableVariable CharacteristicsDescription of the VariableData PeriodData Source
CO2 Emissions by Industry (CO2)Environmental sustainabilityCarbon dioxide emissions generated by industrial activitiesAnnual 2004–2022IEA
Electricity Consumption in Industry (ECI) Energy managementElectricity consumption within the industrial sectorAnnual 2004–2022IEA
Oil Consumption (OIL)Energy consumptionOil consumption is measured as the amount of oil used in the economyAnnual 2004–2022IEA
Energy Use per GDP (EGDP)Energy efficiencyEnergy use relative to each unit of GDP (kg of oil equivalent per constant GDP unit)Annual 2004–2022WDI
GDP per Capita (GDP) Economic development Gross domestic product per capita measured in constant 2015 US dollars, representing the average income per person.Annual 2004–2022WDI
TradeEconomic opennessTrade as a percentage of GDPAnnual 2004–2022WDI
Table 4. Descriptive analysis.
VariableObsMeanMedianStd. Dev.SkewnessKurtosisMinMax
Ln CO21142.459572.496211.5233−0.856213.72054−1.987774.65945
Ln ECI11410.4747610.639970.92673−0.872444.314217.6591712.03759
Ln Trade1144.661604.571680.312570.106192.663293.861425.27233
Ln Oil11412.2575612.073251.162440.466682.3887410.3057814.53518
Ln EGDP1144.990904.973260.19420.167012.640664.482695.41133
Ln GDP11410.36610.160850.44098030.587861.978869.7837911.30969
Table 5. Correlation Matrix.
Ln CO2Ln ECILn TradeLn OilLn EGDPLn GDP
Ln CO21.0000
Ln ECI0.33741.0000
Ln Trade−0.34860.01621.0000
Ln Oil0.88400.5886−0.39321.0000
Ln EGDP−0.72340.00600.2503−0.61081.0000
Ln GDP0.18470.02360.1687−0.0330−0.21951.0000
Source: Author calculations.
Table 6. Cross-Section Dependence Test
VariableCD-Testp-Value
Ln CO212.1460.000
Ln ECI14.9710.000
Ln Trade4.2380.000
Ln Oil16.1070.000
Ln EGDP−2.020.043
Ln GDP−1.0380.299
Source: Author calculations.
Table 7. Second-generation panel unit root test.
VariablesI (0)I (1)
CIPSCADFCIPSCADF
Ln CO2−3.068 ***−3.680 ***−3.941 ***−5.351 ***
Ln ECI−1.874−0.319−3.915 ***−2.141 **
Ln Trade−1.5440.034−3.637 ***−3.198 ***
Ln Oil−2.357 **−1.823 **−4.118 ***−4.975 ***
Ln EGDP−3.097 ***−3.251 ***−3.919 ***−3.636 ***
Ln GDP−0.736−1.377−2.933 ***−2.697 **
Note: *** p < 0.01, ** p < 0.05. Source: Author calculations.
Table 8. Westerlund panel cointegration test.
StatisticValueZ-Valuep-Value
Gt−2.5301.2910.902
Ga−5.3263.7051.000
Pt−4.0592.7760.997
Pa−2.8033.4971.000
Source: Author calculations.
Table 9. Panel ARDL: long-run and short-run estimates.
VariablesCoefficientp-Value
Short-Run Equation
COINTEQ01−0.93900220.000
Δ Ln ECI−0.47073380.451
Δ Ln Trade−0.41150020.460
Δ Ln Oil−0.48887930.055
Δ Ln EGDP0.82464820.027
Δ Ln GDP1.3028130.573
Long-Run Equation
Ln ECI−0.24459870.458
Ln Trade−0.18513120.040
Ln Oil−0.27737130.548
Ln EGDP0.43958820.028
Ln GDP0.75762780.536
Source: Author calculations.
Table 10. Dumitrescu–Hurlin Panel Granger Causality Test.
Null HypothesisW-Stat.Zbar-Stat.p-ValueDirection of CausalityDecision
Ln ECI does not Granger-cause ln CO22.25302.17020.0300Ln ECI → ln CO2Unidirectional
Ln CO2 does not Granger-cause ln ECI1.03840.06650.9470Causality
Ln Trade does not Granger-cause ln CO21.57120.98940.3225No causalityNo causality
ln CO2 does not Granger-cause ln Trade1.53580.92800.3534
Ln Oil does not Granger-cause ln CO21.79011.36850.1711Ln CO2 → ln OilUnidirectional
Ln CO2 does not Granger-cause ln Oil5.00816.94220.0000Causality
Ln EGDP does not Granger-cause ln CO20.8481−0.26310.7925Ln CO2 → ln EGDP Unidirectional
ln CO2 does not Granger-cause ln EGDP3.02873.51380.0004Causality
Ln GDP does not Granger-cause ln CO22.28622.22770.0259Ln GDP ↔ ln CO2Bidirectional
Ln CO2 does not Granger-cause ln GDP4.29145.70090.0000Causality
Source: Author calculations.
Disclaimer/Publisher’s Note: The statements, opinions and data contained in all publications are solely those of the individual author(s) and contributor(s) and not of MDPI and/or the editor(s). MDPI and/or the editor(s) disclaim responsibility for any injury to people or property resulting from any ideas, methods, instructions or products referred to in the content.