Article

Floating Photovoltaic-Powered Green Hydrogen for Decarbonization of the Energy-Consuming Sectors in the United Kingdom

1
Renewable Energy, Electric and Electronic Engineering, Faculty of Environment, Science and Economy, University of Exeter, Penryn TR10 9FE, UK
2
Department of Engineering, Faculty of Environment, Science, and Economy (ESE), University of Exeter, Exeter EX4 4QF, UK
*
Author to whom correspondence should be addressed.
Energies 2026, 19(12), 2931; https://doi.org/10.3390/en19122931
Submission received: 14 April 2026 / Revised: 15 June 2026 / Accepted: 18 June 2026 / Published: 21 June 2026
(This article belongs to the Special Issue Current Advances in Fuel Cell and Batteries)

Abstract

This study evaluates the potential of integrating floating photovoltaic (FPV) systems with green hydrogen production on UK reservoirs to support decarbonization across electricity, heating, and transport sectors. PVsyst was used to simulate annual electricity generation for monofacial and bifacial systems at Killington reservoir and Drift reservoir, while HOMER Pro was used to model hydrogen production via electrolysis and its potential applications. Results indicate that maximum FPV deployment could generate approximately 61 GWh/year at Killington and 20 GWh/year at Drift. Surplus electricity during peak production enables PEM electrolysis, producing up to 869,149 kg/year and 185,277 kg/year of hydrogen for the bifacial systems, respectively. This hydrogen could alternatively deliver up to 9.216 GWh/year and 1.977 GWh/year of electricity or 26.071 GWh/year and 5.558 GWh/year of heat, or support approximately 1,225,808 km/year and 454,550 km/year of hydrogen-powered transport. Additional co-location benefits include significant reductions in reservoir evaporation, estimated at 1.96 million m3/year for Killington and 452,037 m3/year for Drift. Overall, the findings demonstrate that hydrogen integrated FPV systems represent a promising system configuration under idealized deployment conditions, with location-specific modeling providing a UK-specific multi-sector assessment of the low-carbon potential of reservoir-based energy systems. The hydrogen use cases presented are alternative applications of the total hydrogen produced and are not intended to occur simultaneously.

1. Introduction

Global warming, primarily driven by fossil fuel combustion, necessitates a rapid shift to renewable energy (RE) to achieve low greenhouse gas emissions and climate resilience aligned with the Paris Agreement and UN Sustainable Development Goals. While RE technologies like solar, wind, geothermal, and tidal power offer a cleaner alternative to conventional generation, they typically demand more land or sea area per unit of energy than fossil fuels or nuclear power. Photovoltaic (PV) systems, which harness abundant solar energy, are a comprehensive solution, but their significant land footprint poses a major hurdle, especially for land-scarce nations. Even with increased PV module efficiency, the challenge of limited space for land-based PV (LPV) remains. To address this constraint, floating PV (FPV) systems, which utilize water bodies for panel installation, have emerged as a highly promising and increasingly adopted alternative. Beyond conserving valuable land, FPV offers additional advantages, including enhanced efficiency from the water’s cooling effect on the panels, reduced evaporation from covered water bodies, and improved water quality by inhibiting algae growth.
FPV systems are solar energy systems consisting of an array of PV modules that are installed on water bodies, as opposed to the traditional terrestrial-based systems, using a moored floatation system [1,2]. Japan pioneered the initial FPV developments, with two Japanese companies, Mitsui Engineering & Shipbuilding Co., Ltd. and Mitsui Zosen KK, filing the first patent for FPV [3]. The prototype was deployed in 2007 by the Institute of Advanced Industrial Science and Technology (AIST) in Japan, with a capacity of 20 kW. The USA then launched the first commercial deployment of FPV in 2008 with a 175 kW site in California [4]. FPV systems generate electricity by converting solar radiation into direct electrical current (DC), with utility-scale inland FPV deployments primarily using first-generation monocrystalline silicon PV modules due to their superior energy conversion rate and commercial availability [5]. While lighter and more flexible second-generation thin-film FPV, such as amorphous silicon (a-Si), provides benefits for offshore applications, they generally offer lower efficiencies [6]. Currently, arrays are typically fixed-tilt in a position that maximizes their solar gain [2,7], though single-axis or dual-axis tracking can improve system generation by up to 30% [8]. This increases system complexity, potentially leading to higher capital and operational costs [9]. Various floating structure designs are commercially available to provide buoyancy and stability, and are generally built using High-Density Polyethylene (HDPE) due to its durability and resistance to UV and corrosion [10]. FPV systems benefit from improved efficiencies over terrestrial PV systems due to the negative temperature coefficient of silicon PV cells. For modern mono-silicon PV, a decrease in efficiency of between 0.25 and 0.45% will occur for every 1 °C increase in the module’s temperature over its specified reference temperature, typically 25 degrees Celsius [11]. FPV benefits from passive cooling due to water’s higher thermal conductivity than air. C.J. et al. [3] reviewed systems that experienced temperature reductions of 2% to 14.5% compared to terrestrial-based systems, resulting in improved energy efficiencies of 0.6% to 35%. Land scarcity is a growing global issue. With increasing populations and food demands, the use of land is critical. Terrestrial PV requires approximately 2000 ha/TWh of electricity generated [12], substantially more than nuclear (7.1 ha/TWh) or natural gas (410 ha/TWh), placing significant pressure on land-scarce nations such as the UK. FPV provides a renewable energy solution that mitigates conflicts with agricultural and urban developments.
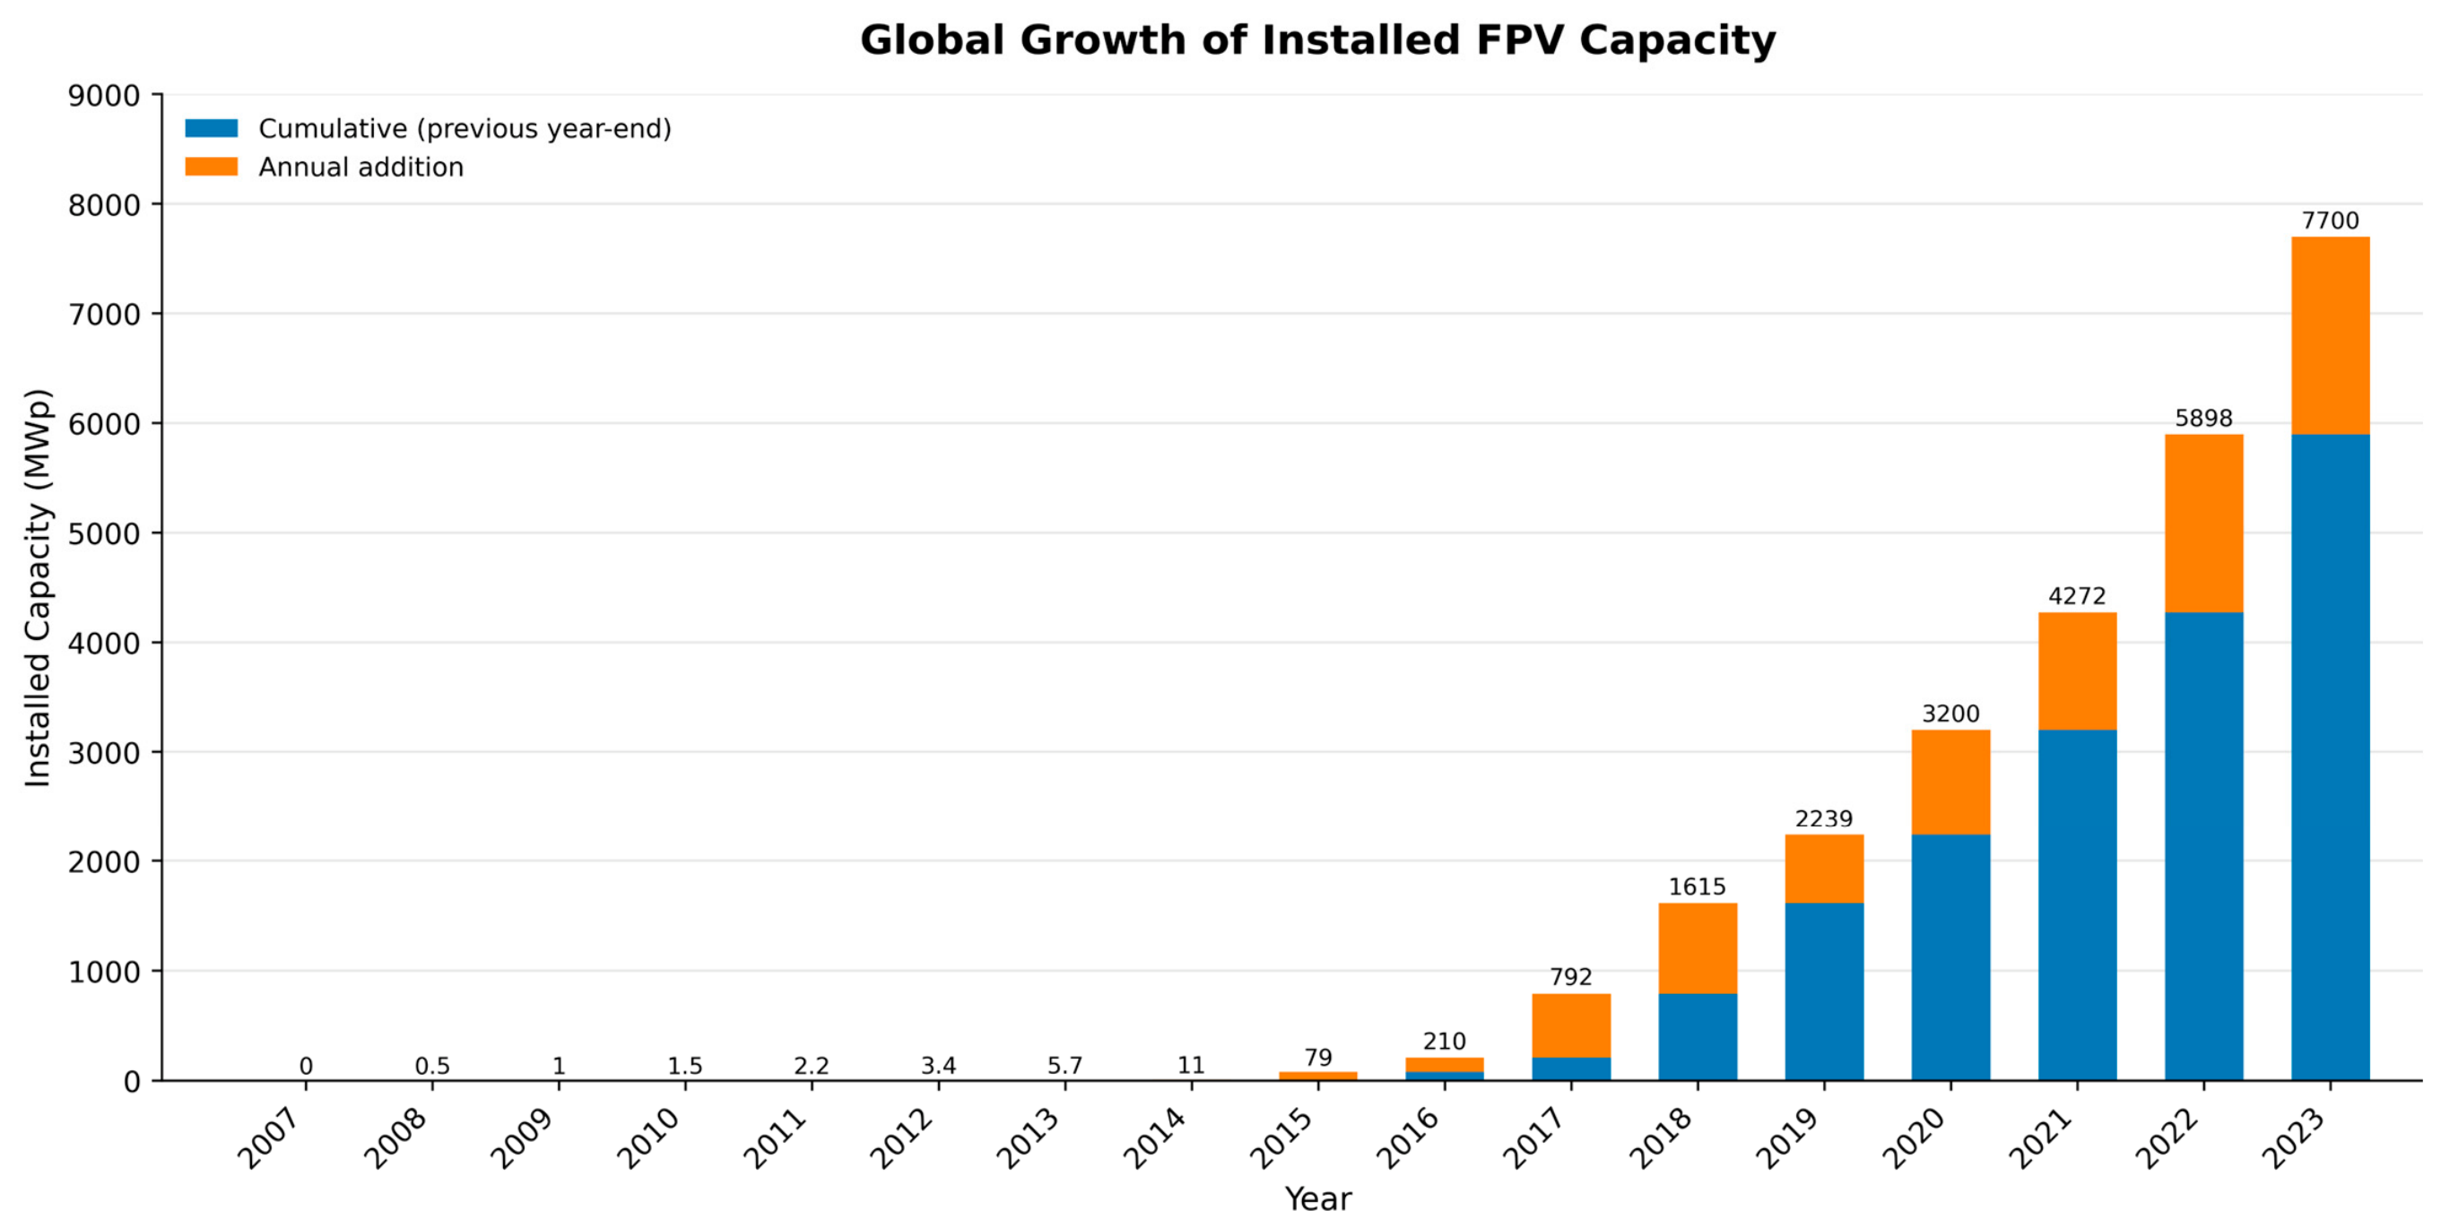
An additional benefit of FPV deployment is the potential reduction in evaporation losses. Currently, over 99% of people in the UK have access to fresh, safe drinking water [13]. However, due to the impacts of global warming and a growing population, the UK Government and the Environment Agency have stated that current water supplies will not be sufficient, estimating that by 2050, an extra 5 billion liters of water per day will be required [14]. As the UK becomes more water-stressed, it is essential to minimize losses and maintain resources. FPV can reduce evaporation losses by covering the water surface and thereby minimizing the exchange area, with research on lakes in India showing that even surface coverage of just 5% FPV can lead to reductions in evaporation losses [15]. Globally, the deployment of FPV plants has grown rapidly in the last 10 years from 79 MWp in 2015 to around 7.7 GWp in 2023 [16] as demonstrated in Figure 1. This growth has occurred predominantly in Asia, where land scarcity and supportive policies have accelerated utility-scale FPV adoption. Table 1 provides an overview of some of the largest recent developments in FPV.
Hydrogen is an energy vector derived from the most abundant element in the universe and is used widely in industrial processes, predominantly in oil refining and ammonia production, as it is light, storable, and emits no direct pollutants or greenhouse gases [29]. Hydrogen has the potential to make a significant contribution to the clean energy transition, though increased uptake is needed across transport, buildings, and power generation [30]. Hydrogen can be used within fuel cells to generate electricity through an electrochemical reaction with oxygen, with water as the only by-product and no greenhouse gas emissions at the point of use [31]. Unlike conventional fossil fuels, hydrogen yields zero tailpipe emissions during use. It also differs fundamentally from intermittent renewable sources such as solar and wind because it acts as a dispatchable chemical energy carrier, offering high gravimetric energy density and long-duration storage capability [32]. Proton exchange membrane (PEM) fuel cells are often paired with renewable electricity generation, as they offer high power density and fast response times [33]. While hydrogen has been identified as a key factor in the low-carbon energy transition, its environmental impact and carbon intensity are heavily dependent on its production method. Hydrogen can be produced through various methods categorized by color: green hydrogen is produced through the electrolysis of water using renewable electricity and has the lowest impact, emitting only oxygen; gray hydrogen is produced from steam methane reforming or coal gasification from fossil fuels, which emits carbon dioxide; and blue hydrogen is produced by the same method as gray hydrogen but employs carbon capture technology [34].
The integration of FPV systems with hydrogen has been identified as a promising solution to both address the space demands and intermittent generation issues of traditional solar generation [35]. Previous studies have investigated the technical and economic potential of FPV–hydrogen systems using various modeling tools and deployment scenarios; a review of published and up-to-date research is presented in Table 2.

1.1. UK Context

The UK faces an urgent climate threat from carbon emissions, driving the government’s legally binding commitment to net-zero greenhouse gas emissions by 2050 [46]. Transport remains the largest energy-consuming sector, accounting for 42% of total final energy consumption in 2024, with the domestic sector the second-largest [47], while natural gas continues to dominate electricity generation, and solar contributes only around 4.8% [48]. To close this gap, the UK plans to boost solar capacity from 15.8 GW to 70 GW by 2035 [49], requiring substantial land in a country where over 60% of land is used for agriculture and solar development is restricted to agricultural land graded 3b or below [49]. Meanwhile, the average household consumes around 2700 kWh annually [50], and with total electricity consumption at 320.7 TWh in 2022 [51], the scale of the generation challenge is clear.
Meeting this target will require a significant expansion of renewable electricity generation and a rapid increase in green hydrogen production for energy storage and the decarbonization of hard-to-electrify sectors. While integrated energy systems are increasingly prioritized in the UK, the UK has not yet followed the global trend of rapid growth; there is currently only one utility-scale plant in operation, the 6.3 MWp Queen Elizabeth II (QE II) system on a wastewater plant in Surrey. In terms of hydrogen, the UK Government has put together a Hydrogen Strategy that details the role hydrogen will play in the future of energy generation, estimating that to achieve net zero by 2050, between 250 and 460 TWh of hydrogen energy will be needed, contributing 20–30% of final energy consumption [52]. The UK currently produces around 70,000 tons of hydrogen per annum, 96% of which is gray hydrogen. For hydrogen to deliver the benefits discussed, it must be produced through low-carbon pathways. Subsequently, a target has been set to develop at least 5 GW of low-carbon hydrogen production capacity by 2030 [52].
Although the UK Government’s proposed ban on new gas boilers has been withdrawn [53], domestic heating remains responsible for a substantial share of the UK’s greenhouse gas emissions and its decarbonization is essential to achieving net zero by 2050 [54]. Hydrogen can be combusted in hydrogen-compatible boilers to provide domestic space and water heating. Hydrogen-only systems are technically feasible but would require substantial infrastructure upgrades for widespread deployment across the UK [55]. Trials have also explored blending hydrogen directly into the mains gas supply [56].
To support the zero-emission vehicle transition, the UK Government plans to end the sale of new petrol and diesel cars by 2035 [57]. While battery electric vehicles are currently more commercially mature, this ban is also expected to increase demand for hydrogen-powered cars. They operate using a fuel cell, which can be used in a standalone system or an electric hybrid. There are currently only two hydrogen-powered car models commercially available in the UK, the Toyota Mirai and the Hyundai Nexo, due to high costs of hydrogen and limited fueling infrastructure, with just six fueling stations currently active in the UK [58,59].
In the UK, one of the most densely populated countries in Europe [60], land is a valuable resource for agriculture, housing, and biodiversity conservation. As the UK moves towards net zero [1], the deployment of PV on pre-existing infrastructure, such as reservoirs, offers a viable pathway for expanding solar capacity without compromising valuable land resources.
Recognizing these land constraints, in June 2025, the UK Department for Energy Security and Net Zero (DESNZ) published the Solar Roadmap [61]: United Kingdom Powered by Solar, which explicitly recognizes floating photovoltaic (FPV) as an emerging technology with the potential to expand renewable energy generation while reducing pressure on land resources. The report highlights that FPV systems can support behind-the-meter energy solutions, reduce grid reliance, and contribute to the decarbonization of energy-intensive sectors. Importantly, it also identifies FPV as a viable option for co-location with electrolyzer, enabling hydrogen production from renewable electricity. To support deployment, the roadmap introduces targeted policy actions, including Action 53, which considers enhanced support for FPV within the Contracts for Difference (CfD) scheme, and Action 54, which explores the use of planning mechanisms to accelerate FPV development. Despite these opportunities, the report acknowledges that FPV remains a nascent sector facing cost and regulatory challenges, highlighting the need for further policy and market support to enable large-scale deployment [61].
Building on this policy direction, significant upscaling of the coupling between renewable electricity generation and hydrogen production is required. This integration can help balance the intermittent nature of renewable energy, whereby surplus electricity during periods of excess generation is used to produce hydrogen, which can later be reconverted to electricity when renewable generation is insufficient to meet demand. FPV systems offer a promising solution, enabling large-scale solar deployment on existing water infrastructure while reducing land-use conflicts and evaporation losses [62]. When coupled with green hydrogen production via electrolysis, FPV can provide a flexible, low-carbon energy system [63]. This study therefore investigates the technical feasibility of utility-scale FPV deployment on two UK reservoirs, assessing their potential to meet domestic electricity demand directly and to produce green hydrogen for electricity, heating, and transport. Sites were modeled using PVsyst and HOMER Pro to simulate energy generation, hydrogen integration, and system performance under local conditions.
To further contextualize this approach, recent UK-focused FPV research reinforces the relevance of this study while also highlighting the limited scope of existing assessments. Experimental investigations under temperate UK conditions consistently demonstrate that bifacial FPV systems outperform monofacial configurations in terms of power output, efficiency, thermal behavior, and levelized cost of electricity (LCOE), confirming the importance of module selection in optimizing system performance [64,65]. At a broader system level, modeling studies indicate that FPV performance in the UK can be significantly enhanced through design optimization, particularly through single-axis and azimuthal tracking, which can increase annual energy production by up to 26.9% while reducing LCOE across multiple locations [62]. Beyond electrical performance, UK reservoir-based analyses highlight additional environmental co-benefits, demonstrating that FPV deployment can mitigate climate change impacts by reducing thermal stratification, limiting phytoplankton growth, and improving overall water quality under future climate scenarios [66]. Furthermore, the wider FPV literature emphasizes the importance of system reliability, structural integrity, and environmental interactions, particularly for large-scale or offshore applications, identifying key challenges such as mooring design, biofouling, and long-term durability that must be addressed for scalable deployment [67]. However, despite these advances, existing UK studies remain largely fragmented, focusing on individual aspects such as electrical performance, thermal behavior, tracking optimization, or environmental impacts in isolation, with limited integration across the wider energy system. In particular, these studies rarely consider the integration of FPV systems within a broader multi-sector energy framework.
Despite this progress, while previous studies have demonstrated the technical and economic feasibility of integrated FPV–hydrogen systems, published UK-specific assessments remain limited. This study addresses this gap by providing a UK-specific perspective through the evaluation of two reservoirs under contrasting site-specific climatic and locational conditions. It applies an integrated modeling approach to assess how FPV generation can support three distinct energy pathways: electricity supply via hydrogen reconversion, domestic heating, and low-carbon transport. This enables a broader multi-sector technical assessment of the potential role of green hydrogen in the UK’s decarbonization strategy.
However, practical FPV–hydrogen deployment also requires appropriate control strategies to manage renewable intermittency, load variation, electrolyzer operation, and grid interaction. Wang et al. [68] proposed a flexible on-grid/off-grid control framework for electric–hydrogen AC–DC microgrids integrating PV, battery storage, electrolyzers, hydrogen tanks, and fuel cells, demonstrating improved stability during different operating modes and grid-transition events. Similarly, Majumdar et al. [69] reviewed control-oriented PEM electrolyzer models and highlighted the importance of electrochemical, thermal, and degradation-aware control strategies under transient renewable operation. Therefore, this study focuses on system-level feasibility, while recognizing that detailed control design is essential for real-world implementation.

1.2. Aims and Objectives

This study aims to conduct a technical assessment of the potential of FPV systems deployed in UK reservoirs integrated with green hydrogen production, to contribute to renewable energy generation and decarbonization strategies. The specific objectives of this study are to:
  • Identify two suitable UK reservoir sites for utility-scale FPV deployment;
  • Evaluate the annual energy generation potential of monofacial and bifacial FPV systems using PVsyst under a maximum build-out scenario;
  • Assess the potential of surplus FPV-generated electricity to support green hydrogen production through PEM electrolysis;
  • Evaluate the potential of the generated hydrogen to support domestic electricity supply, heating, and transport as alternative end-use scenarios;
  • Quantify water savings associated with reduced evaporation due to FPV surface coverage.

2. Methodology

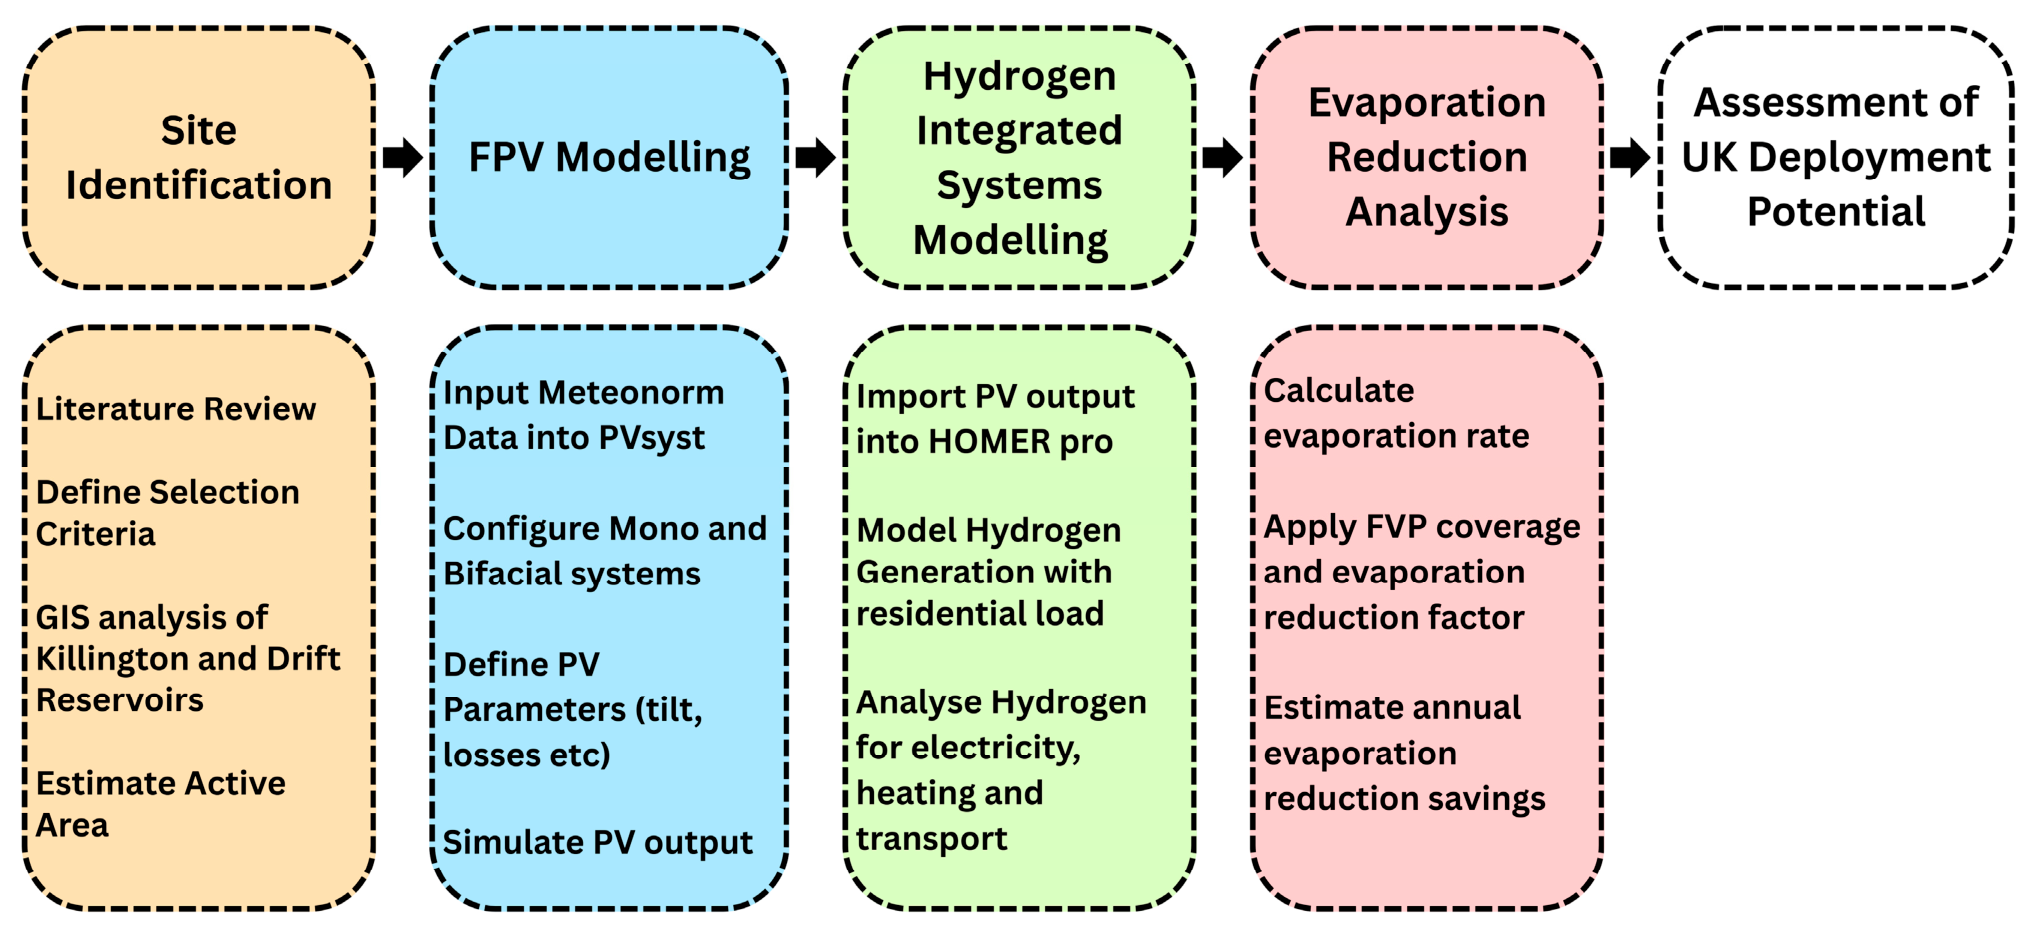
Figure 2 presents an overview of the methodology followed in this study.

2.1. Site Identification

2.1.1. Selection Process

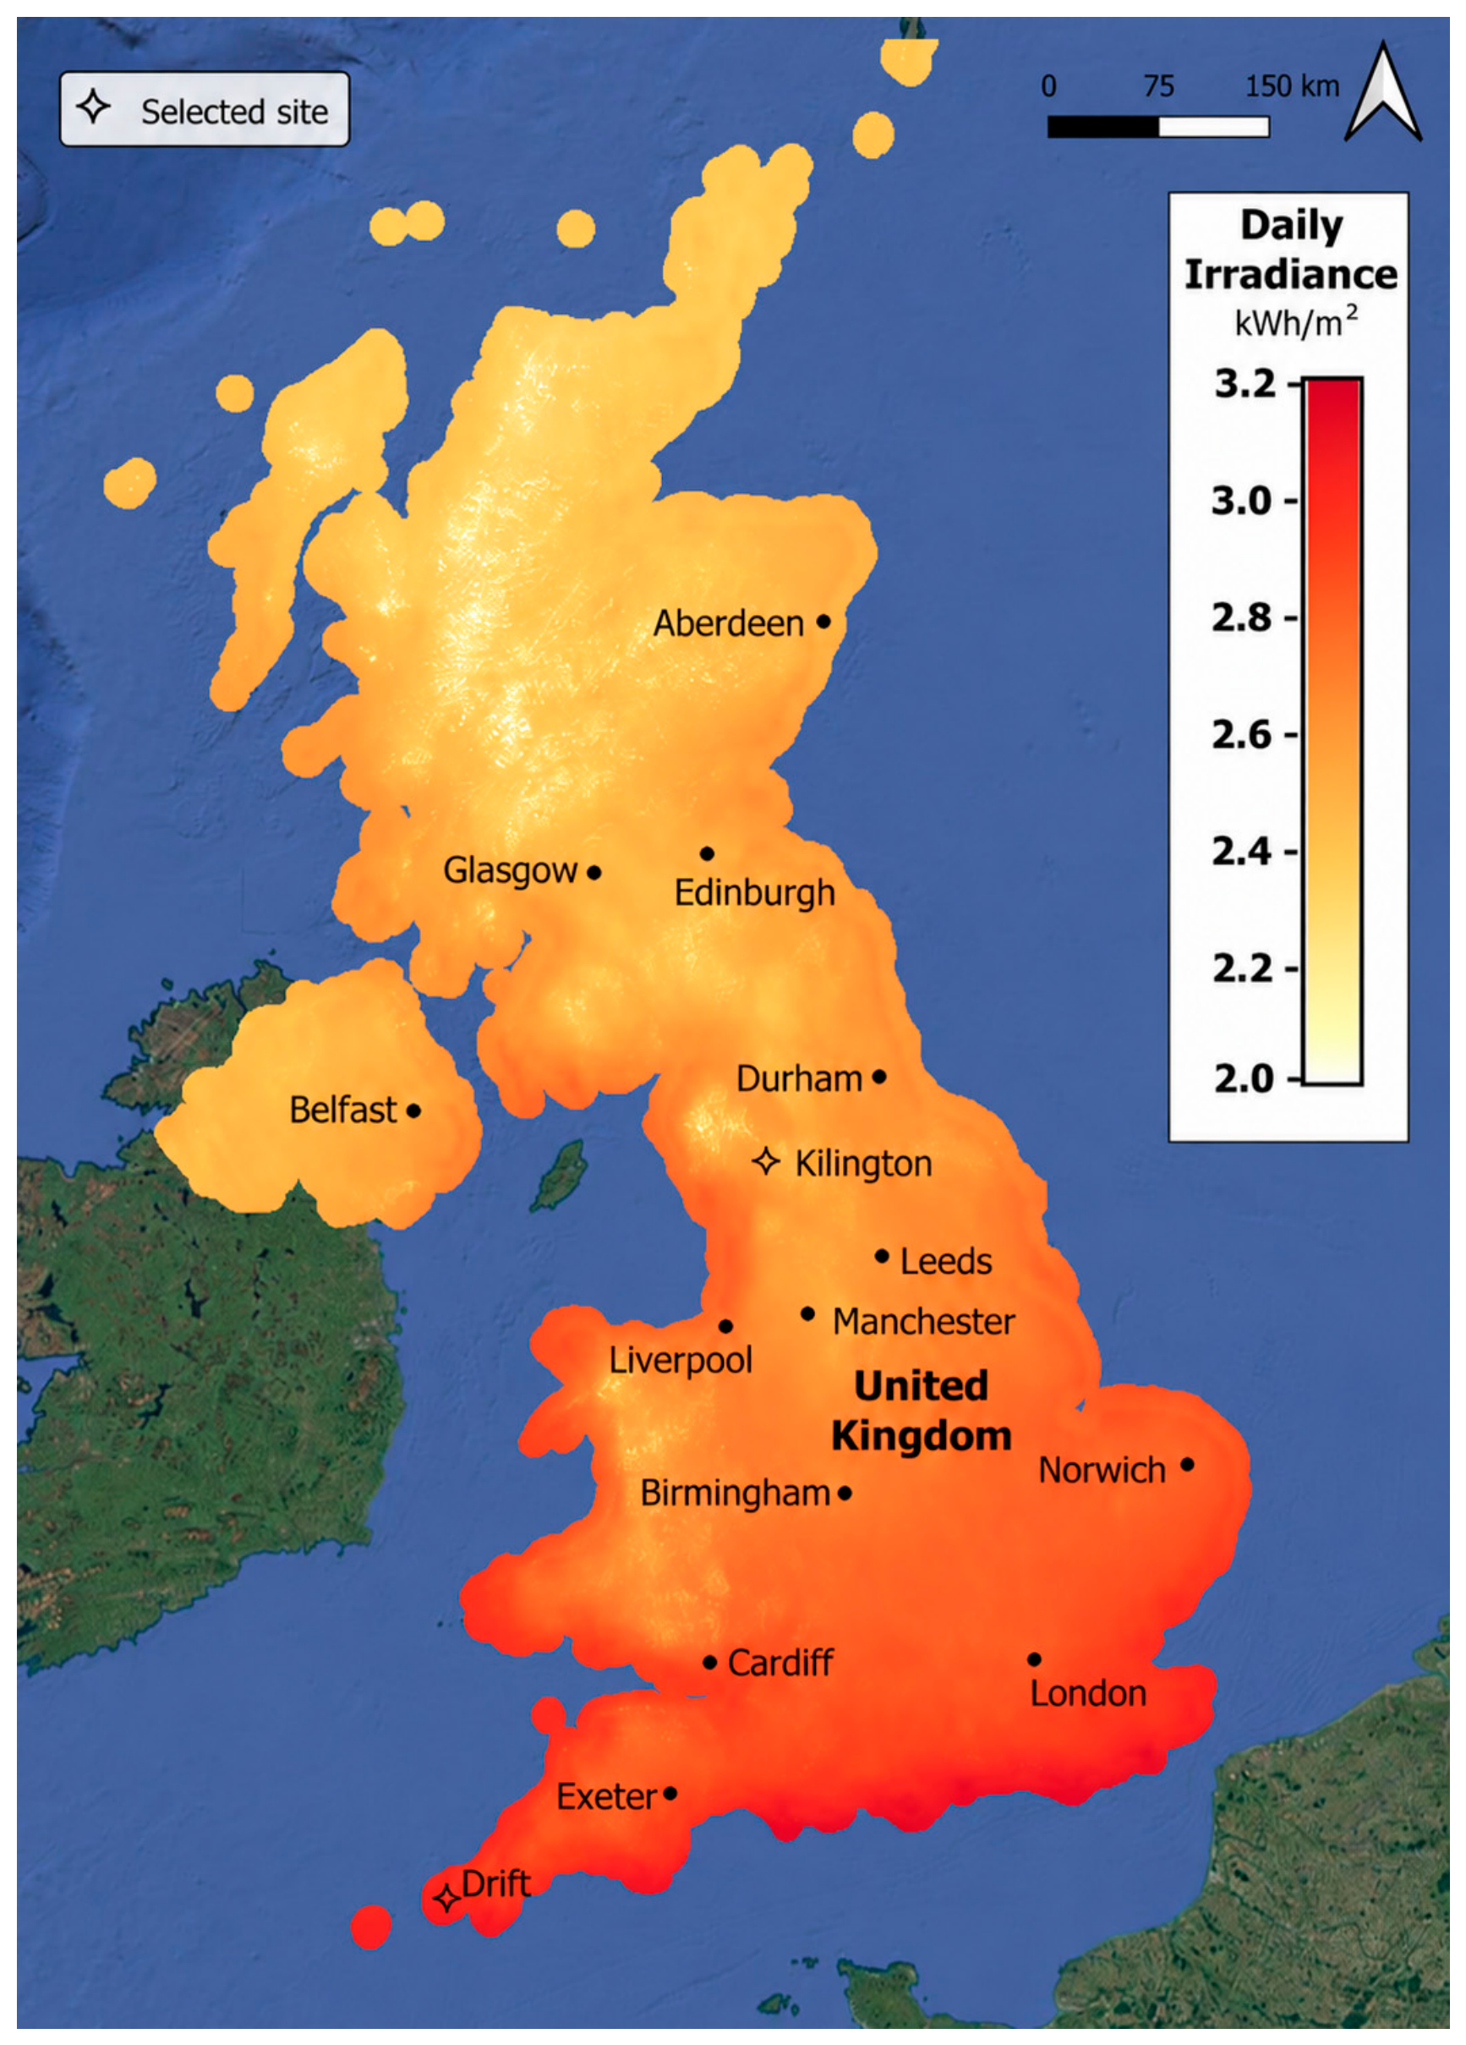
To allow for comparison and provide a more comprehensive insight into the potential of FPV in the UK, two areas with varying climatic conditions were selected: the Northwest and Southwest of England, representing low and high irradiance areas respectively. This selection was based on long-term global irradiance data from the World Bank and SolarGis [70], presented in Figure 3.
Man-made lakes and reservoirs were exclusively considered for analysis, aligning with global trends in current deployment for inland FPV [8,71]. Man-made water bodies have been identified as having greater FPV deployment potential due to reduced ecological impact over deployment on natural bodies of water [72,73].
The UK Center for Ecology and Hydrology Lakes Portal database/software was used to identify 22 potential sites in the Northwest and 10 in the Southwest [74]. Further site factors must be considered for FPV deployment as detailed by Woolway et al. 2024 [1], with key considerations for this study being:
  • Distance from population area: Only sites that were less than 10 km from a population center were considered. A population center was defined as an area with more than 1000 residents. [1]
  • Protected areas: FPV should not be developed in protected areas; data was acquired from Natural England geospatial databases and applied as polygons in QGIS [75]. Waterbodies which intersected with sites of special scientific interest (SSSI), protected habitats, Areas of Outstanding Natural Beauty (AONB) and National Parks were excluded from consideration.
  • Water body geometry was considered regarding surface area and water depth; a mean annual surface area was obtained from the UK Centre for Ecology and Hydrology. A preference was given to water bodies with a larger surface area as this allows for increased FPV deployment and increased electrical generation potential. A required minimum water depth of 2 m was considered [2].

2.1.2. Northwest and Southwest Location

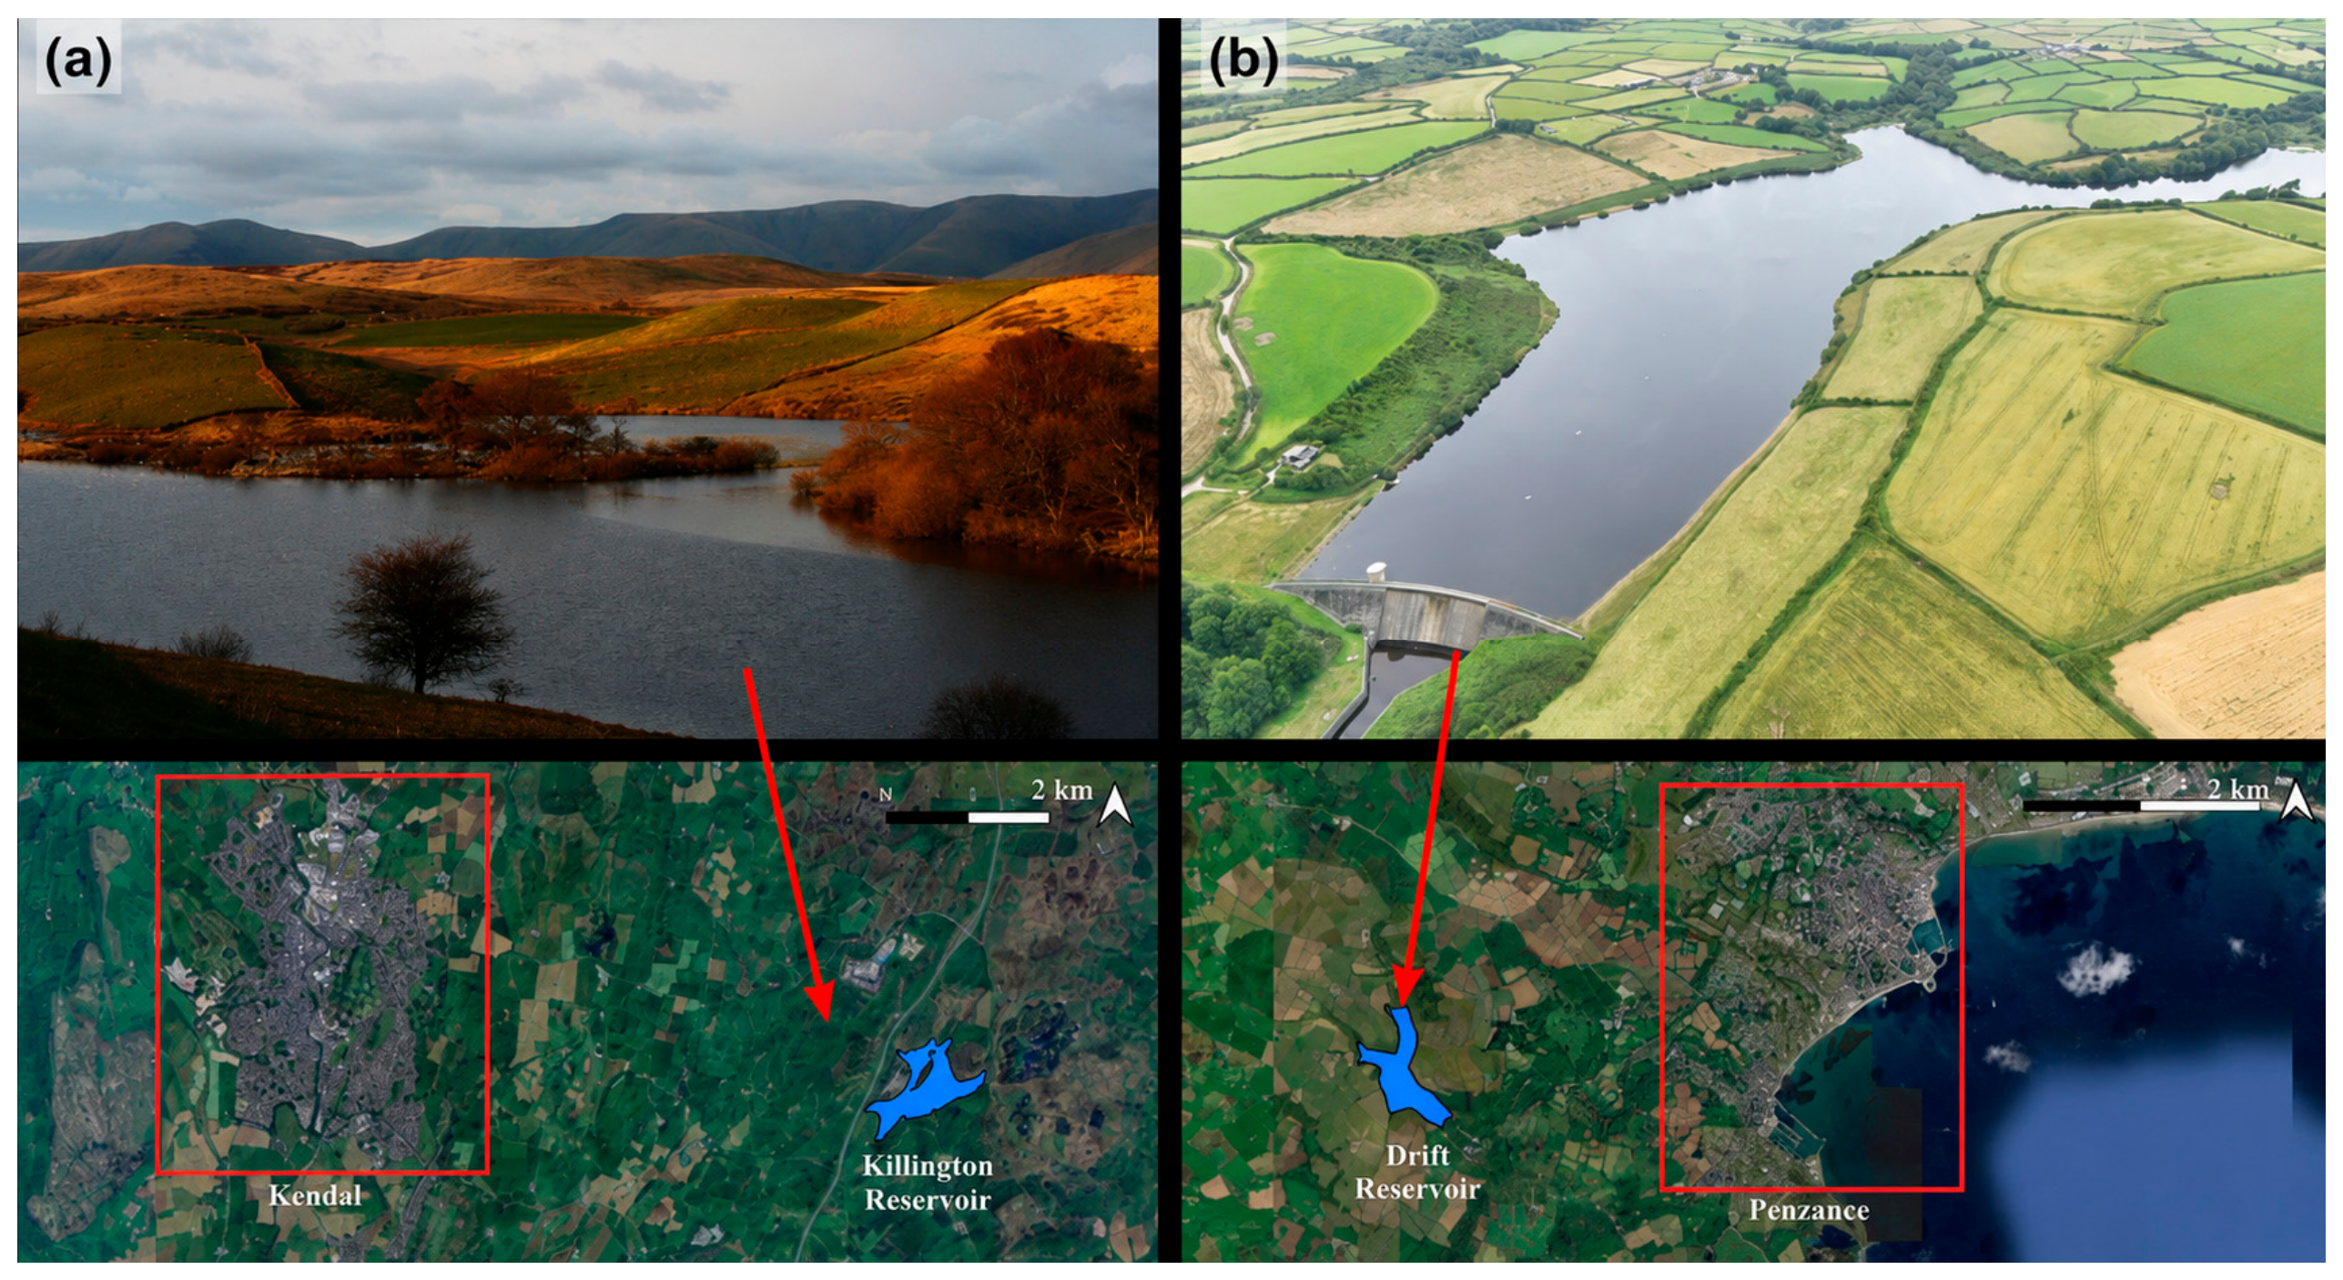
The Northwest site identified for analysis was Killington reservoir in Cumbria, an artificial water body created in 1891 to supply the local Lancaster-Kendal canal [76], pictured in Figure 4 [77]. This was the largest waterbody which met the criteria for analysis; a detailed site specification is available in Table 3.
The Southwest site selected for analysis was Drift reservoir located in Cornwall, an artificial body of water built through flooding an existing village in the early 1960s to provide water to Penzance [79] which is now a popular area for birdwatching and trout fishing [79]. The reservoir is now a popular area for birdwatching and trout fishing [80]. Its geographical location is shown in Figure 4b, with full details presented in Table 3.
Table 3 presents the key physical, geographical, and planning attributes relevant to FPV deployment for both sites; all data was acquired from the UK Centre for Ecology and Hydrology [74] unless otherwise referenced.
Table 3. Detailed parameters of Killington and Drift reservoirs.
ParameterKillington Reservoir
(Northwest)
Drift Reservoir
(Southwest)
Ref.
RegionCumbriaCornwall
Coordinates54.2946, −2.596150.108, −5.591
Waterbody IDGB31229430GB30846547[81,82]
Location IDID SD59109109ID SW43392931
Surface Area64 ha25 ha
Mean Depth5.2 m5.1 m
Elevation203 m85 m
Nearest Populus AreaKendal (7 km)Penzance (3 km)[83]
Local Population
(per the 2021 Census)
30,00013,000[84]
Protected DesignationsNone—located closely to the Lake District National ParkDrinking Water Protected Area[85,86]
Ecological NotesClose to local nature reserveTrout Farm; Adjacent Wetland and Birdwatching Site
AccessDirect Access to M6 Motorway400 m from A30
Hydro morphological designationHeavily Modified Body of WaterHeavily Modified Body of Water[81]
Mean Global Horizontal Irradiance865 kWh/m21118 kWh/m2

2.1.3. Energy Demand

The energy demand for each of the identified local populous areas, Kendal and Penzance as highlighted in red in Figure 4, was estimated using 2021 population census data to identify the number of domestic dwellings in the area [87,88]. The Office for National Statistics (ONS) sub-national electricity consumption data for the average energy consumption per household for each county was used to create a five-year mean value from 2019 to 2023 [89]. Results are presented in Table 4.

2.2. FPV Modeling

This study analyzed the estimated annual electrical production yield of two utility-scale UK FPV systems, considering both monofacial and bifacial commercial monocrystalline silicon fixed-tilt PV panels. The simulation was conducted using PVsyst (version 6.86; PVsyst SA, Satigny, Switzerland), software that is supported by the DNV rules and standards for FPV development and is widely used in the existing literature, as demonstrated in Table 2 [90]. However, the software is primarily designed for land-based analysis, so certain assumptions have been made to simulate FPV, as detailed in the following sections.
The baseline analysis considered a maximum build-out scenario to estimate the theoretical technical potential of each reservoir. This scenario was not intended to represent an immediately deployable configuration, but rather to establish an upper-bound estimate of the FPV resource potential at each site [87]. To improve the policy relevance of the analysis, additional partial deployment scenarios representing 10%, 25%, and 50% surface coverage were also estimated. These scenarios suggest that practical FPV deployment may be restricted by local planning, ecological protection, reservoir operations, visual amenity, or stakeholder considerations.
As identified in Section 2.1. The total available surface areas for the Killington and Drift reservoirs were estimated at 0.64 km2 and 0.25 km2, respectively. A 50 m buffer was applied to the perimeter of the waterbodies using QGIS LTR software (version 3.34.11, Prizren; QGIS.ORG Association, Laax, Switzerland) in line with large-scale FPV deployments studied by the National Renewable Energy Laboratory (NREL) [88], to mitigate ecological impacts by maintaining shoreline access, allowing for maintenance routes, and accounting for irregularities in the perimeter’s shape [72]. This resulted in a total area of 0.53 km2 and 0.14 km2 available for all FPV infrastructure, including the distance between modules and access routes.
The area available specifically for the PV panels, or active area, was defined using the footprint-to-active-area ratio of the UK’s current largest FPV deployment, the Queen Elizabeth II FPV plant. With a total footprint of 57,000 m2 the Hydrelio Classic floating system developed by Ciel & Terre International SAS (Sainghin-en-Mélantois, France), and an active-area of 37,500 m2 of PV modules [91], the plant has an active area ratio of 0.657 [36,92]. Assuming the same active ratio, total active PV areas of 0.375 km2 and 0.0896 km2 were estimated for the Killington and Drift reservoirs, respectively.
Meteorological data for both sites were obtained from the Meteonorm [93] database integrated within PVsyst software, which provides Typical Meteorological Year (TMY) datasets based on long-term measurements and statistical interpolation of key parameters, including global horizontal irradiance (GHI), ambient temperature, and wind speed.

2.2.1. PV Systems Details

Monocrystalline silicon panels were selected as they are the industry standard for utility-scale FPV deployments, with proven commercial viability and high levels of efficiency [2,7]. The modules selected for this study were both manufactured by Wuxi Suntech Power Co., Ltd. (Wuxi, China):, a monofacial panel (STP570S-C72/Vmh) and a bifacial panel (STP565S-C72/Pmh+) [91] as detailed in Table 5. The inverter model used in the FPV system configuration was SG3125HV-MV, manufactured by Sungrow Power Supply Co., Ltd. (Hefei, China), as detailed in Table 6. Coming from the same manufacturer and range, the bifacial panels have similar electrical and physical specifications to the monofacial panels, allowing for accurate analysis of the bifaciality gain factor. All specifications were derived from the manufacturers’ datasheets. The levelized cost of electricity (LCOE) was calculated in PVsyst based on known PV module costs, with total system costs estimated using a 33% module cost fraction derived from NREL FPV system cost data [94].
This study models a fixed-tilt FPV structure, as this configuration remains dominant in large-scale utility FPV deployments [95]. A tilt angle of 15° was selected to balance generation performance, self-cleaning benefits, wind loading, and panel spacing. Although PVsyst identified higher optimal fixed-tilt angles of 43° for Killington and 39° for Drift based on site conditions, previous guidance for FPV systems recommends limiting tilt angles to approximately 15° to reduce wind loading and structural stress [9,96]. Lower tilt angles may also enhance thermal benefits by maintaining closer proximity to the water surface [97]. To optimize annual generation, the modules were oriented due south with an azimuth of 0°. An overview of the monofacial systems is presented in Table 6, detailing inverter choice and setup.

2.2.2. PVsyst Thermal Modeling

PVsyst calculates module temperature using the Faiman model, Equation (1), which accounts for both irradiance and cooling effects [98].
T c   = T a + G P O A × α × 1 η U c + U v × W S
where T a = ambient air temperature, G P O A = plane-of-array irradiance, α = absorption coefficient, η = module efficiency, W S = windspeed, and U c ,   U v   = thermal loss factors for constant and wind-dependent heat loss. For this study, a U-value of 29 W/m2·K was used. This value represents the improved convective cooling of a typical pontoon-based FPV over terrestrial-based PV due to heat transfer from the surrounding air and water [99].
PVsyst’s bifacial 2D modeling tool was activated using the unlimited shed methodology, which assumes uniform repeating rows and calculates rear-side irradiance based on geometry, tilt, height, pitch, and albedo. The tilt angle was reduced to 12, and the pitch was increased to 6 m to allow for more rear-side solar gains. The selected panels had a bifaciality factor of 0.70, with the only major difference from the monofacial panels being the potential rear-side gain. As both waterbodies were enclosed, an albedo of 0.2 was used; this did not consider seasonal variation due to a lack of site-specific data [100].

2.2.3. Detailed Losses

Ohmic losses or wiring losses were considered at 1.5% in line with recommendations from the World Bank [96]. The cabling distance to an identified suitable injection point was estimated using QGIS at 320 m for Killington and 500 m for Drift.
For freshwater FPV deployments in temperate climates, soiling losses are generally expected to be low due to reduced dust exposure and frequent natural cleaning from rainfall. Studies on photovoltaic systems in Europe report annual soiling losses as low as ~1% under effective rainfall conditions, increasing to several percent depending on site-specific factors [101]. Additionally, rainfall has been shown to significantly mitigate soiling accumulation over time [2]. While FPV-specific long-term datasets remain limited and soiling behavior is highly site-dependent, an annual loss range of 1–3% is considered a reasonable assumption for modeling in humid freshwater environments.
Although the sites will benefit from some self-cleaning at a 15 ° tilt angle, both sites are in areas with high recorded bird populations, which could lead to significant soiling [102,103]. The upper end of the range was therefore assumed, and the soiling factor was set to 3%.
As the UK grid system has very minimal downtime and claims a reliability rate of 99.9999%, it is not considered in the availability analysis [104]. System unavailability was set at 2% based on practical deployment of utility-scale PV and simulation-suggested values [96].
Far shading losses due to the terrain of both sites were modeled in PVsyst using location-specific horizon profiles generated from PVGIS data [105]. Near-shading losses were not explicitly modeled due to sufficient module spacing and the application of a 50 m buffer around the reservoir perimeters, which mitigated shading losses from shoreline vegetation or built structures.

2.3. Energy Supply System Modeling

2.3.1. HOMER Modeling Software

For this study, energy systems modeling was conducted using HOMER Pro, HOMER, Hybrid Optimization of Multiple Energy Resources, which is a simulation platform developed by the U.S National Renewable Energy Laboratory, and, as demonstrated in Table 2, is widely used in the literature to model the performance and operation of hybrid energy systems. HOMER Pro was selected due to its ability to optimize component sizes within systems, consider custom time-series inputs for site-specific PV electrical generation, simulate residential load profiles, and model the dynamic interactions and losses between system components [106].

2.3.2. Load Profile

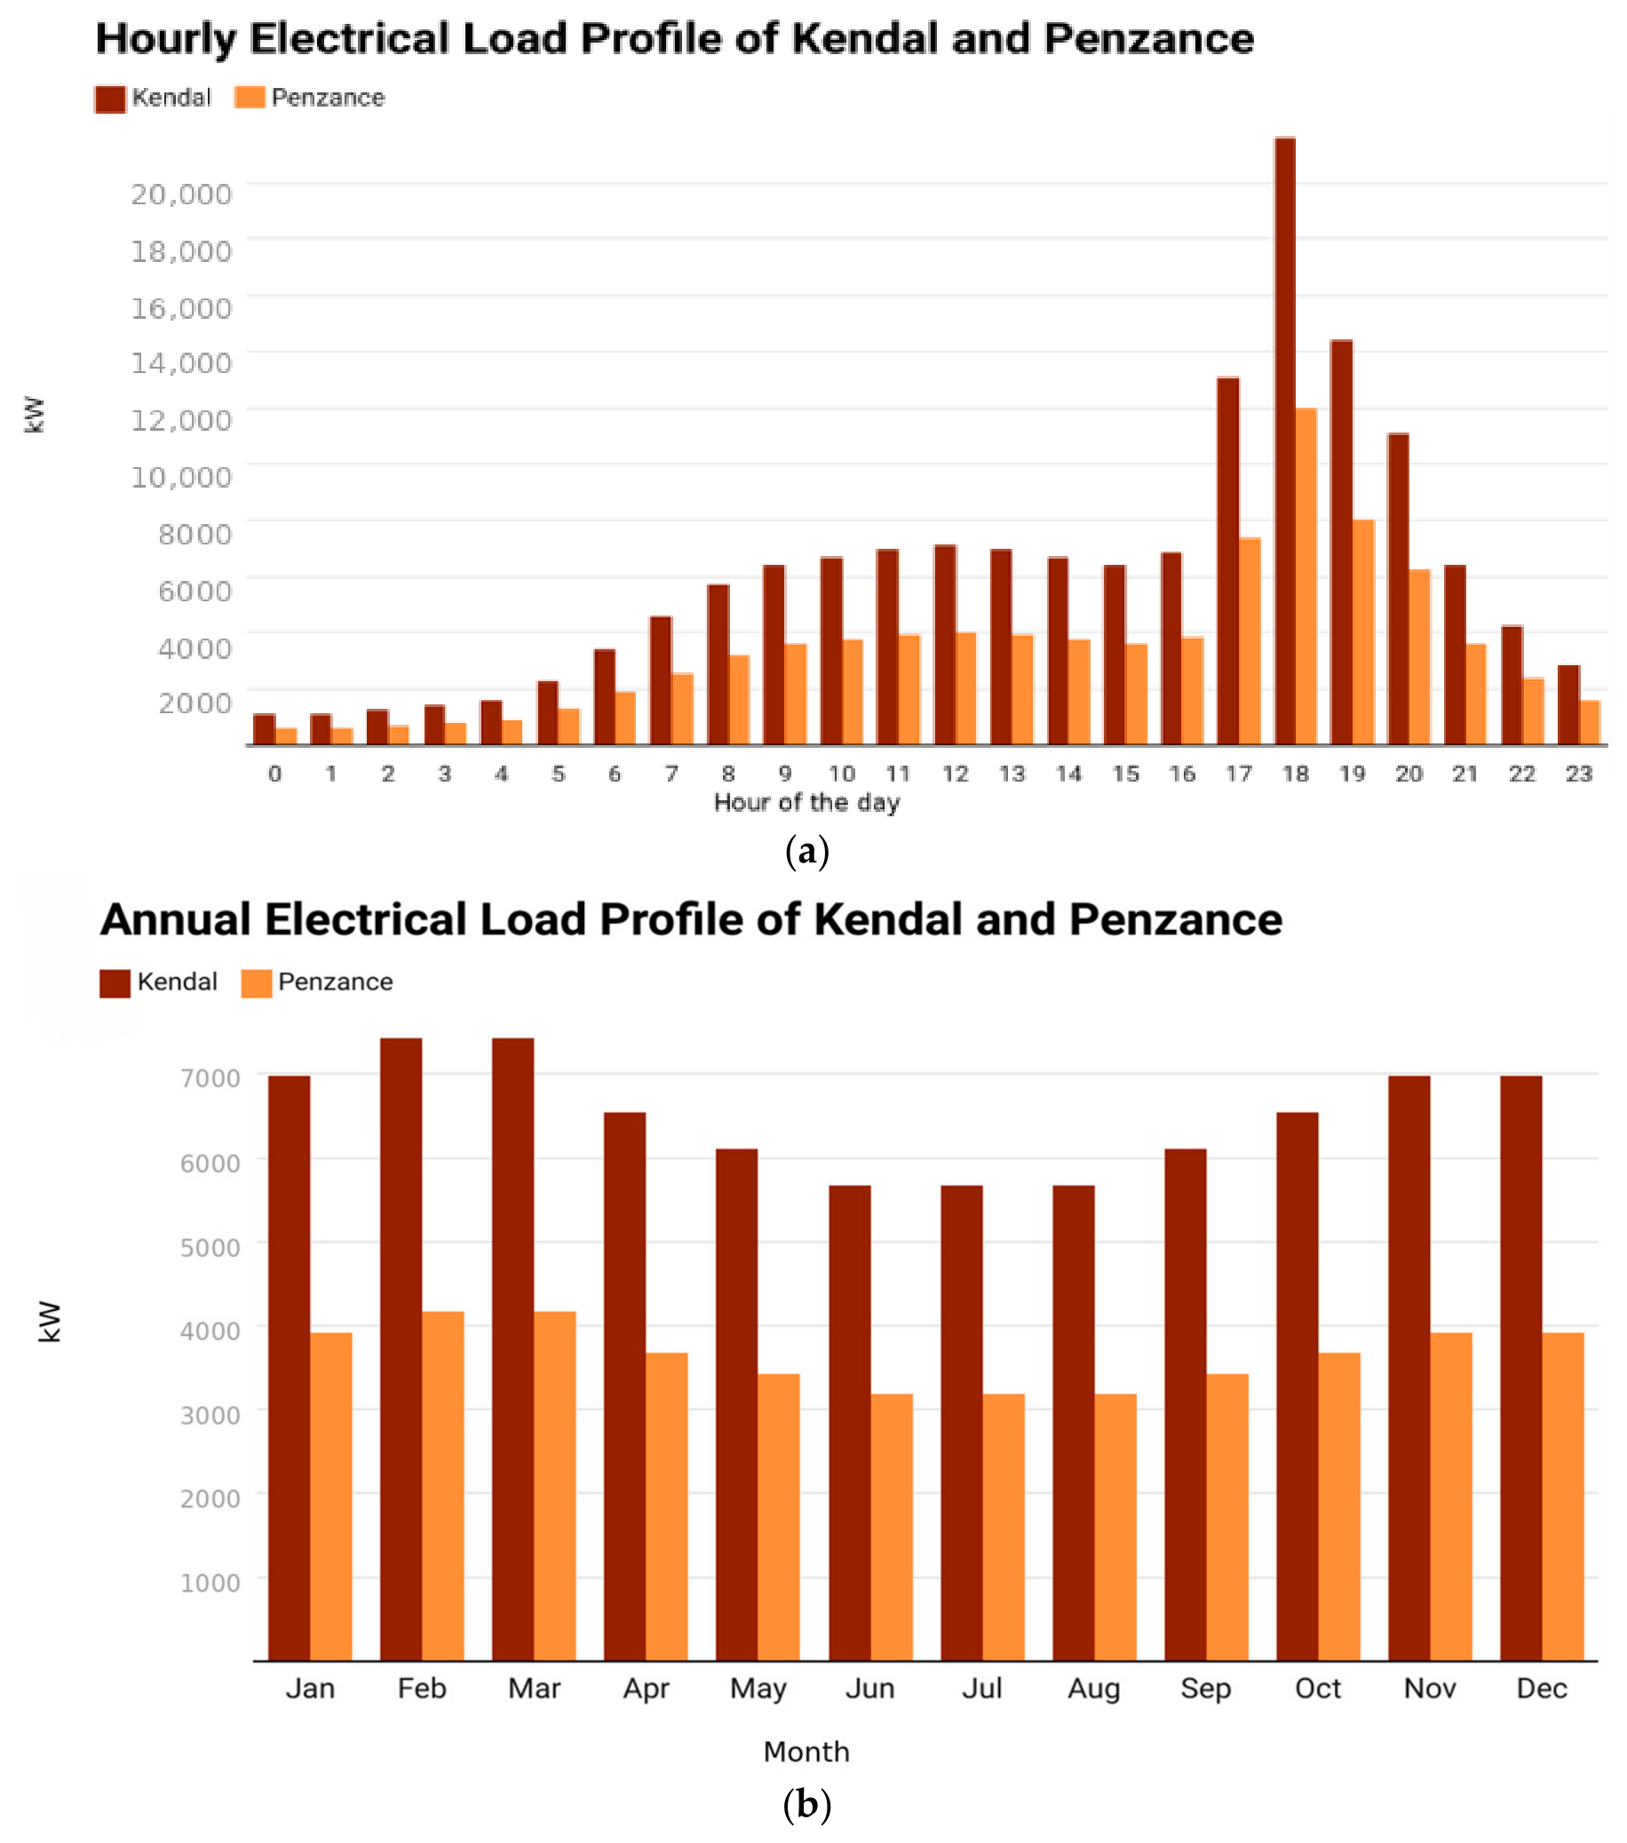
The annual energy demand of a populous area local to each FPV site was estimated in Section 2.1.3. A residential load profile from the HOMER Pro software library (version 3.14.2) was applied to simulate daily variations in demand and seasonal distribution, as shown in Figure 5, allowing the temporal matching between FPV generation and residential demand to be evaluated.
The residential load profile applied in HOMER Pro was drawn from the software’s built-in library and scaled to ONS sub-national electricity consumption statistics, ensuring that annual demand totals are representative of each community. The modeled profile exhibits a winter-to-summer demand ratio of approximately 1.2, calculated by dividing average modeled demand across the winter months by average demand across the summer months. To assess whether this seasonal structure was reasonable for the selected UK communities, it was compared with UK Elexon domestic profile classes. Elexon Profile Class 1 [107], representing domestic unrestricted consumers, provides the half-hourly settlement load shape for standard domestic electricity users; using the same winter-to-summer calculation gives a ratio of approximately 0.9, indicating relatively limited winter electricity uplift for mainly non-electric-heating households. In contrast, electrically heated or off-gas-grid homes are expected to display stronger winter electricity demand. DESNZ sub-national statistics show that off-gas-grid housing is more prevalent in the South West than the North West, with regional shares of approximately 24% and 10%, respectively, although local rural communities may differ from these regional averages [108]. A mixed-community profile, combining standard domestic demand with a proportion of households with greater winter electricity sensitivity, including off-gas-grid and electrically heated properties, therefore gives indicative winter-to-summer ratios of approximately 1.1–1.2 for Kendal and Penzance, consistent with the modeled HOMER profile. Residual uncertainty in the intra-annual and intra-day distribution of demand is acknowledged, particularly regarding winter peak intensity, morning shoulder demand, and overnight baseload. However, this uncertainty does not affect annual electricity demand totals, total FPV generation, hydrogen production volumes, or the heating and transport pathway results, which are derived from annual energy balances rather than the precise hourly load shape.

2.3.3. Direct Supply Modeling

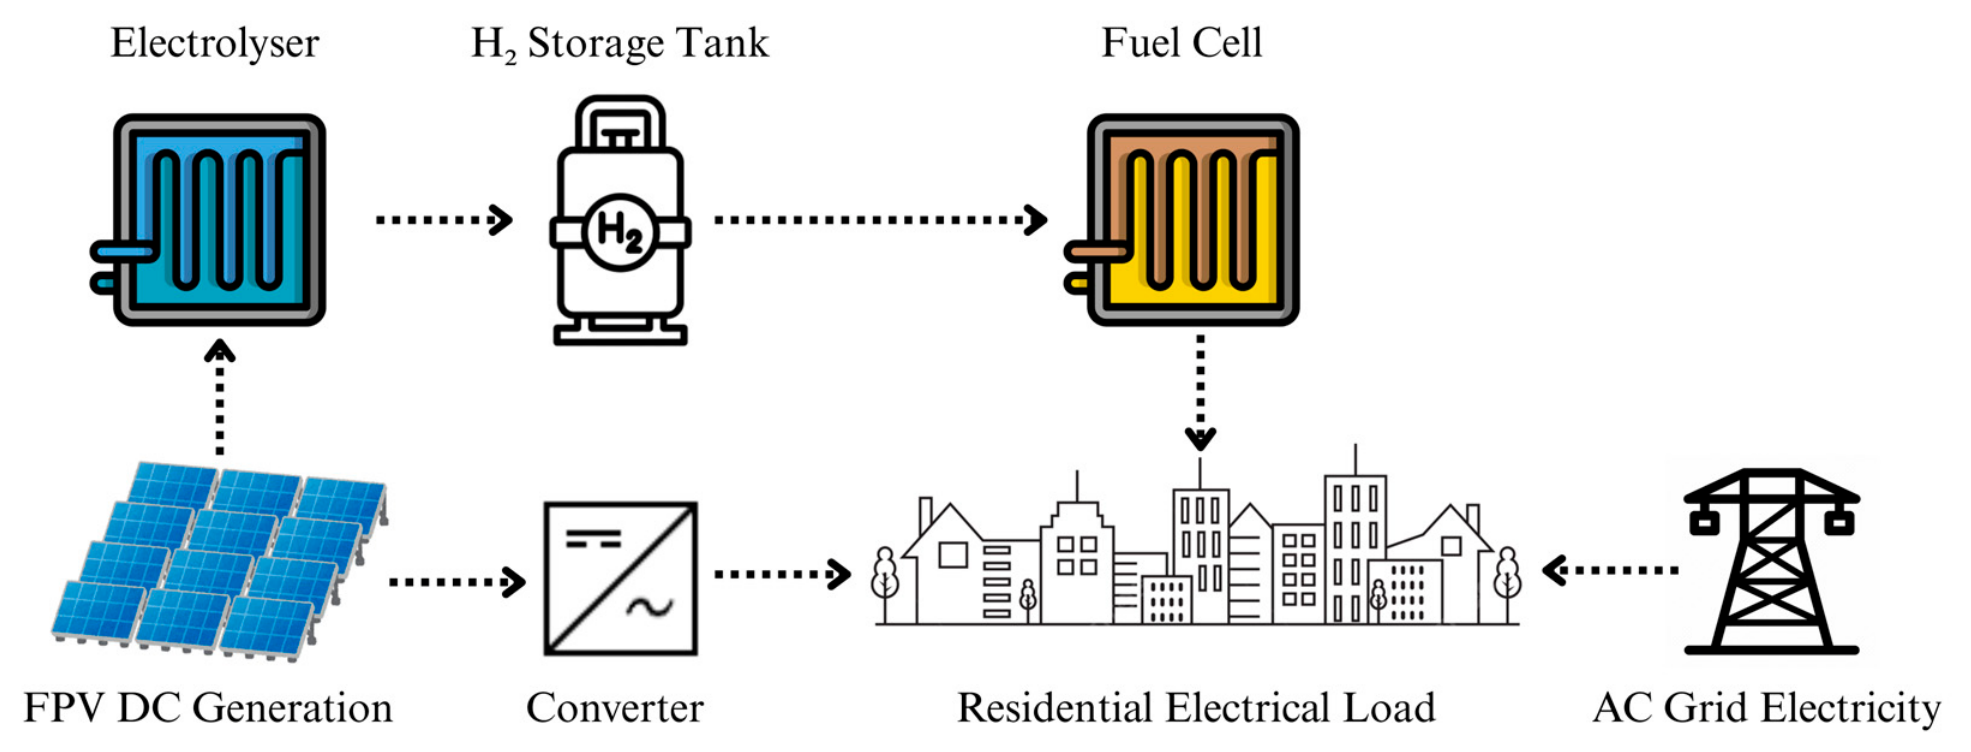
This scenario represents a direct supply configuration in which the electricity generated by the FPV system meets residential demand, with any periods when demand exceeds FPV output being supplied by the National Grid, as illustrated in Figure 6. The system was configured in HOMER Pro with hourly generation data from PVsyst and the modeled residential load profile; the results are presented in Section 3.2.

2.3.4. Hydrogen Integrated Electrical System Modeling

Modeled in HOMER Pro, this system integrates hydrogen storage to capture surplus energy during periods of excess FPV generation, then supplies electricity from a hydrogen fuel cell when solar output alone cannot meet demand, as illustrated in Figure 7. Only electricity not immediately consumed by the load is diverted to hydrogen production, simulating a flexible energy system capable of meeting delayed or shifted demand. The results are presented in Section 3.2.3. System components and performance were modeled using HOMER Pro.
To improve reproducibility, Table 7 summarizes the principal PVsyst and HOMER Pro input parameters used in the simulations, including geometry, losses, bifacial modeling assumptions, and hydrogen-system conversion efficiencies. Manufacturer-specific values were used where available, while literature-supported or software-default assumptions were adopted where site-specific measured data were unavailable.
Electrolyzer: PEM cells were selected for this study due to their efficiency, fast dynamics, scalability, and high hydrogen purity [31]. In HOMER Pro, the electrolyzer was configured to operate when FPV electricity production exceeded the residential load, converting surplus electricity into hydrogen using the fixed conversion efficiency reported in Table 7. HOMER optimized the electrolyzer sizing to maximize utilization of available surplus generation.
Hydrogen Storage Tank: Hydrogen storage allows excess energy generated by the FPV to be stored in chemical form as hydrogen, which can be used later when generation levels are insufficient to meet current demand. The tank sizing was optimized in HOMER to ensure that tank capacity never limits hydrogen generation.
Fuel Cell: PEM fuel cells operate on the inverse principle of PEM electrolyzers, recombining hydrogen from the hydrogen tank with oxygen to produce electricity and water. In HOMER Pro, the fuel cell was modeled as a generator with a conversion efficiency of 50% with an applied fuel curve slope of 0.0697 kgH2/hr/kW [6]. The system was auto-sized by HOMER to optimize its contributions to meeting electrical demand.
HOMER Pro was used for hourly energy-balance and dispatch modeling; however, detailed controller-level modeling of electrolyzer response, grid/off-grid transitions, converter dynamics, and degradation-aware PEM operation were outside the scope of this study.
The hydrogen applications assessed in this study were modeled as separate end-use pathways using the same surplus electricity resource and annual hydrogen production, and were therefore evaluated independently rather than as simultaneous combined uses.

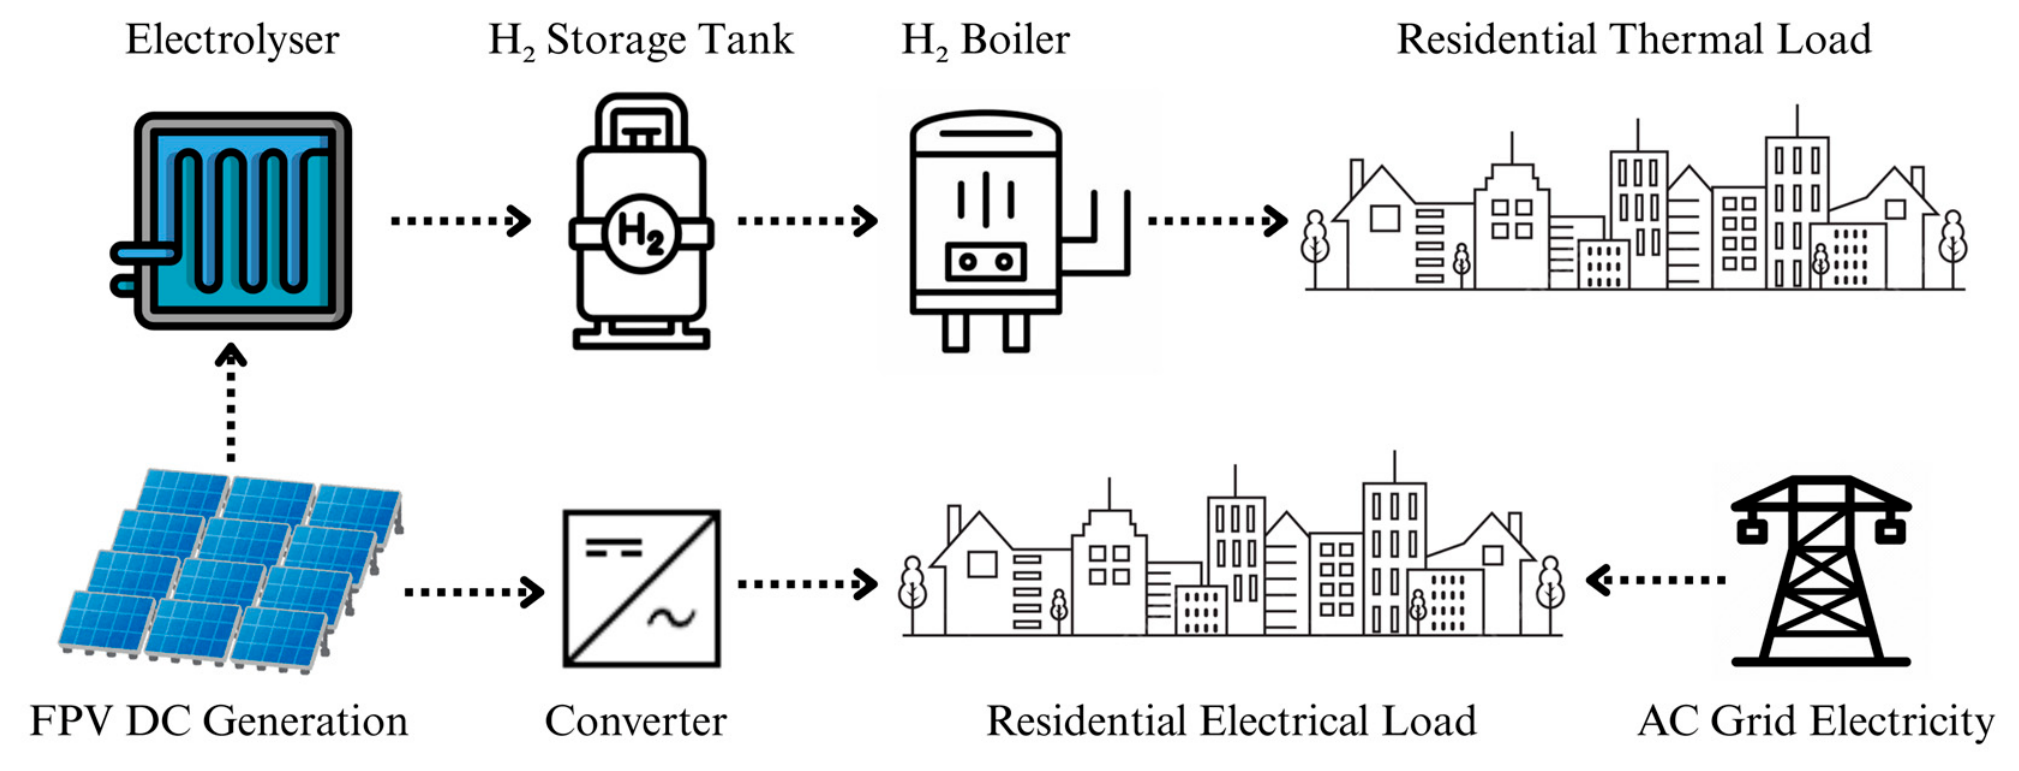
2.3.5. Hydrogen-to-Heat Scenario Modelling

This scenario uses the hydrogen produced by the excess FPV generation directly as a heating fuel in domestic hydrogen-compatible boilers, illustrated in Figure 8. This avoids fuel cell reconversion losses and supports the decarbonization of domestic heating. The hydrogen production values simulated in HOMER were extracted, and secondary analysis was performed to convert the hydrogen into thermal energy, considering an efficiency of 90% for a modern hydrogen-compatible boiler [112] and assuming a lower heating value of hydrogen gas of 33.33 kWh/Kg [113]. Calculated thermal energy was used to estimate the number of domestic dwellings this system could heat, and the results are presented in Section 3.3.

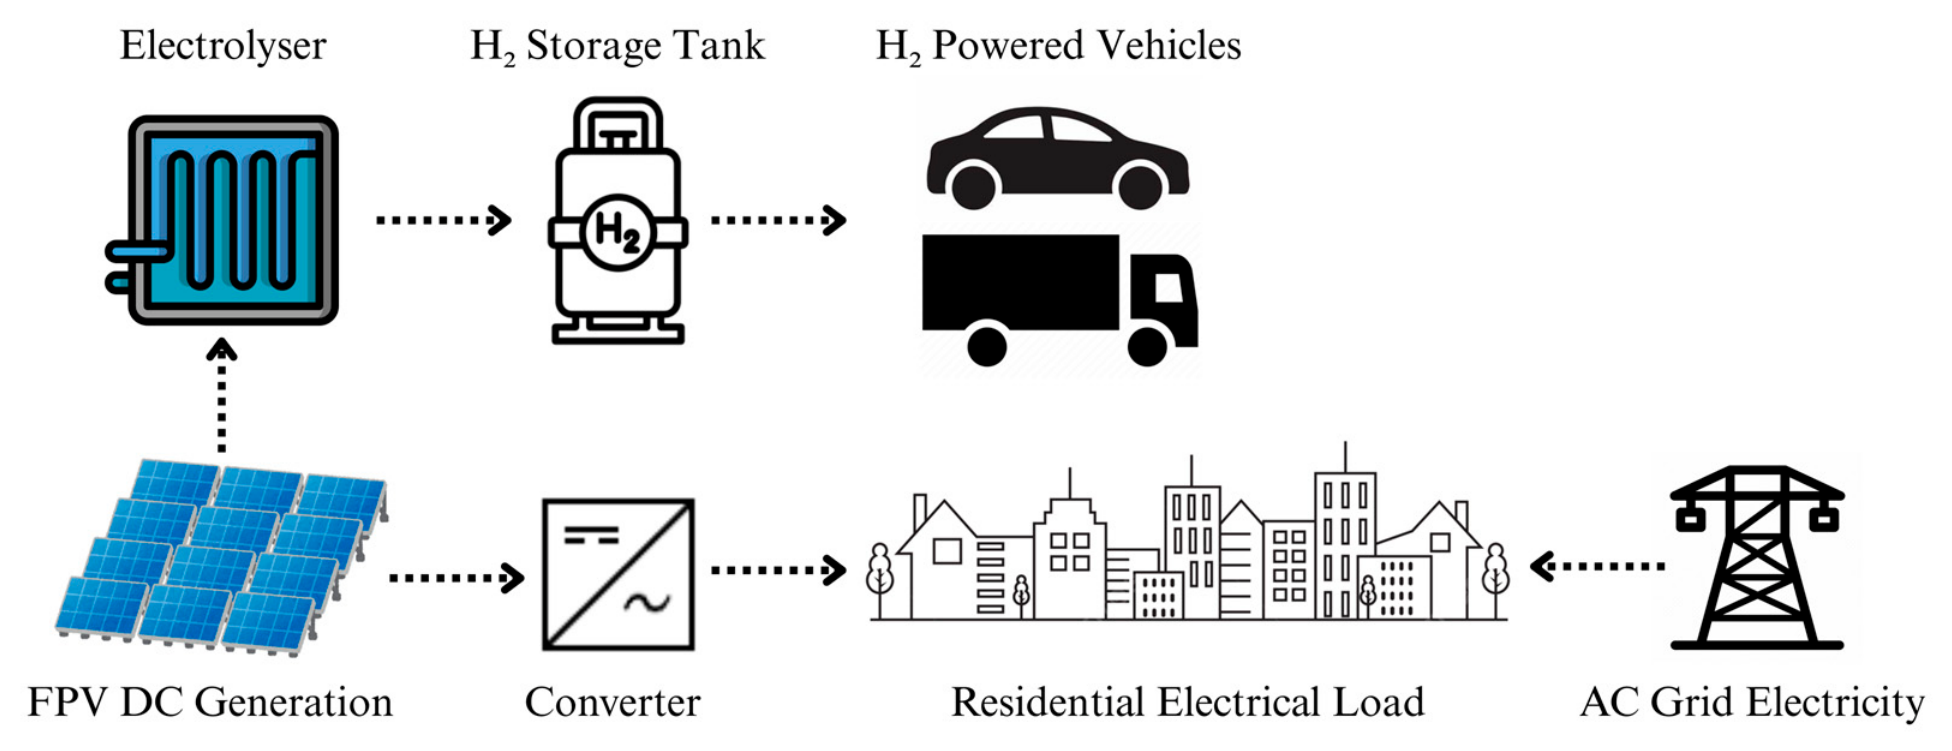
2.3.6. Hydrogen-to-Transport Scenario Modelling

In this scenario, the hydrogen produced from surplus solar energy is modeled as a fuel for a hydrogen-powered vehicle rather than for domestic energy needs, as detailed in Figure 9. Modern fuel cell-based models were selected for simulation due to their higher efficiency compared to combustion models [114]. Results presented in Section 3.4 are expressed in terms of the approximate number of vehicle miles facilitated by each system. A consumption rate of 70 miles (113 km) per kg was assumed in line with the literature [115] and modern hydrogen cars such as the Toyota Mirai [116,117].

2.4. Evaporation Savings

The annual evaporation savings for each site were quantified using a two-stage calculation. First, the annual open-water evaporation rate was estimated using Linacre’s simplified empirical method, which adapts the Penman approach to estimate evaporation from mean temperature, elevation, latitude, and dew-point temperature. Second, FPV-induced water savings were calculated by multiplying the annual evaporation rate by reservoir surface area, FPV coverage fraction, and a literature-derived evaporation reduction factor β. The site-specific input values are presented in Table 8. Mean temperature was obtained from the Meteonorm data used in PVsyst, while dew-point temperature was obtained from long-term county-specific averages [118]. For each reservoir, the adjusted temperature (Tm) was calculated using Equation (2):
T m = T + 0.006 h
The daily evaporation rate (mm/m2) was then calculated using Equation (3). To convert results to annual evaporation rates ( W l o s s ), the outputs were multiplied by the number of days in a year (365).
E 0 = 700 × T m 100 A × 80 T + 15 × T T d 80 T
The potential annual water savings due to the reduction in evaporation in FPV deployment areas were calculated using the methodology from Kulat et al. [119] where total annual water saved (Wi) for each reservoir was calculated using Equation (4).
W i = A r e s × σ c o v e r a g e   × W l o s s × β × 10 9
where
  • Ares = reservoir surface area;
  • σcoverage = surface coverage by FPV;
  • Wloss = annual evaporation rate, as calculated in Equation (3);
  • β = assumed evaporation reduction factor corresponding to FPV surface coverage, adopted from literature-based estimates for partially covered open-water systems.
Table 8. Site-specific evaporation rate calculation inputs.
InputUnitKillingtonDrift
T°C7.5812.25
hm (A.O.D)20385
Adegrees54.2950.10
Td°C45
Wlossmm/m2/yr9501550
Aresm2640,000250,000
σ%58.7335.35
β [120,121]%5533
A.O.D: Elevation above mean sea level (Ordnance Datum Newlyn, UK).
The β values used for Killington and Drift were adopted as simplifying literature-based assumptions for the selected coverage ratios. These factors should be interpreted as indicative rather than site-validated values, as FPV-specific evaporation reduction depends on site geometry, wind conditions, humidity, and array layout.

3. Results

3.1. FPV Electrical Generation

3.1.1. Annual Energy Generation

The annual energy yield was simulated for both monofacial and bifacial systems at the Killington and Drift reservoirs, as detailed in Section 2.2, with results presented in Table 9 as total energy generation and normalized specific yield. Killington reservoir had higher overall production than Drift due to its larger scale, but Drift had the higher specific yield due to slightly higher irradiance. Killington saw a bifacial gain of 4.7%, and Drift reservoir saw a gain of 7.4%, likely due to higher irradiance at the site.
To complement the maximum build-out results, Table 10 presents estimated partial deployment scenarios at 10%, 25%, and 50% surface coverage. These scenarios provide a more policy-relevant comparison by showing how reduced FPV coverage may affect electricity generation, hydrogen production potential, evaporation reduction, and direct grid CO2 avoidance under more realistic ecological or planning constraints. Direct grid CO2 avoidance was calculated using the DESNZ 2025 UK grid electricity conversion factor of 0.177 kgCO2e/kWh, equivalent to 177 tCO2e/GWh [122].

3.1.2. Monthly Energy Production

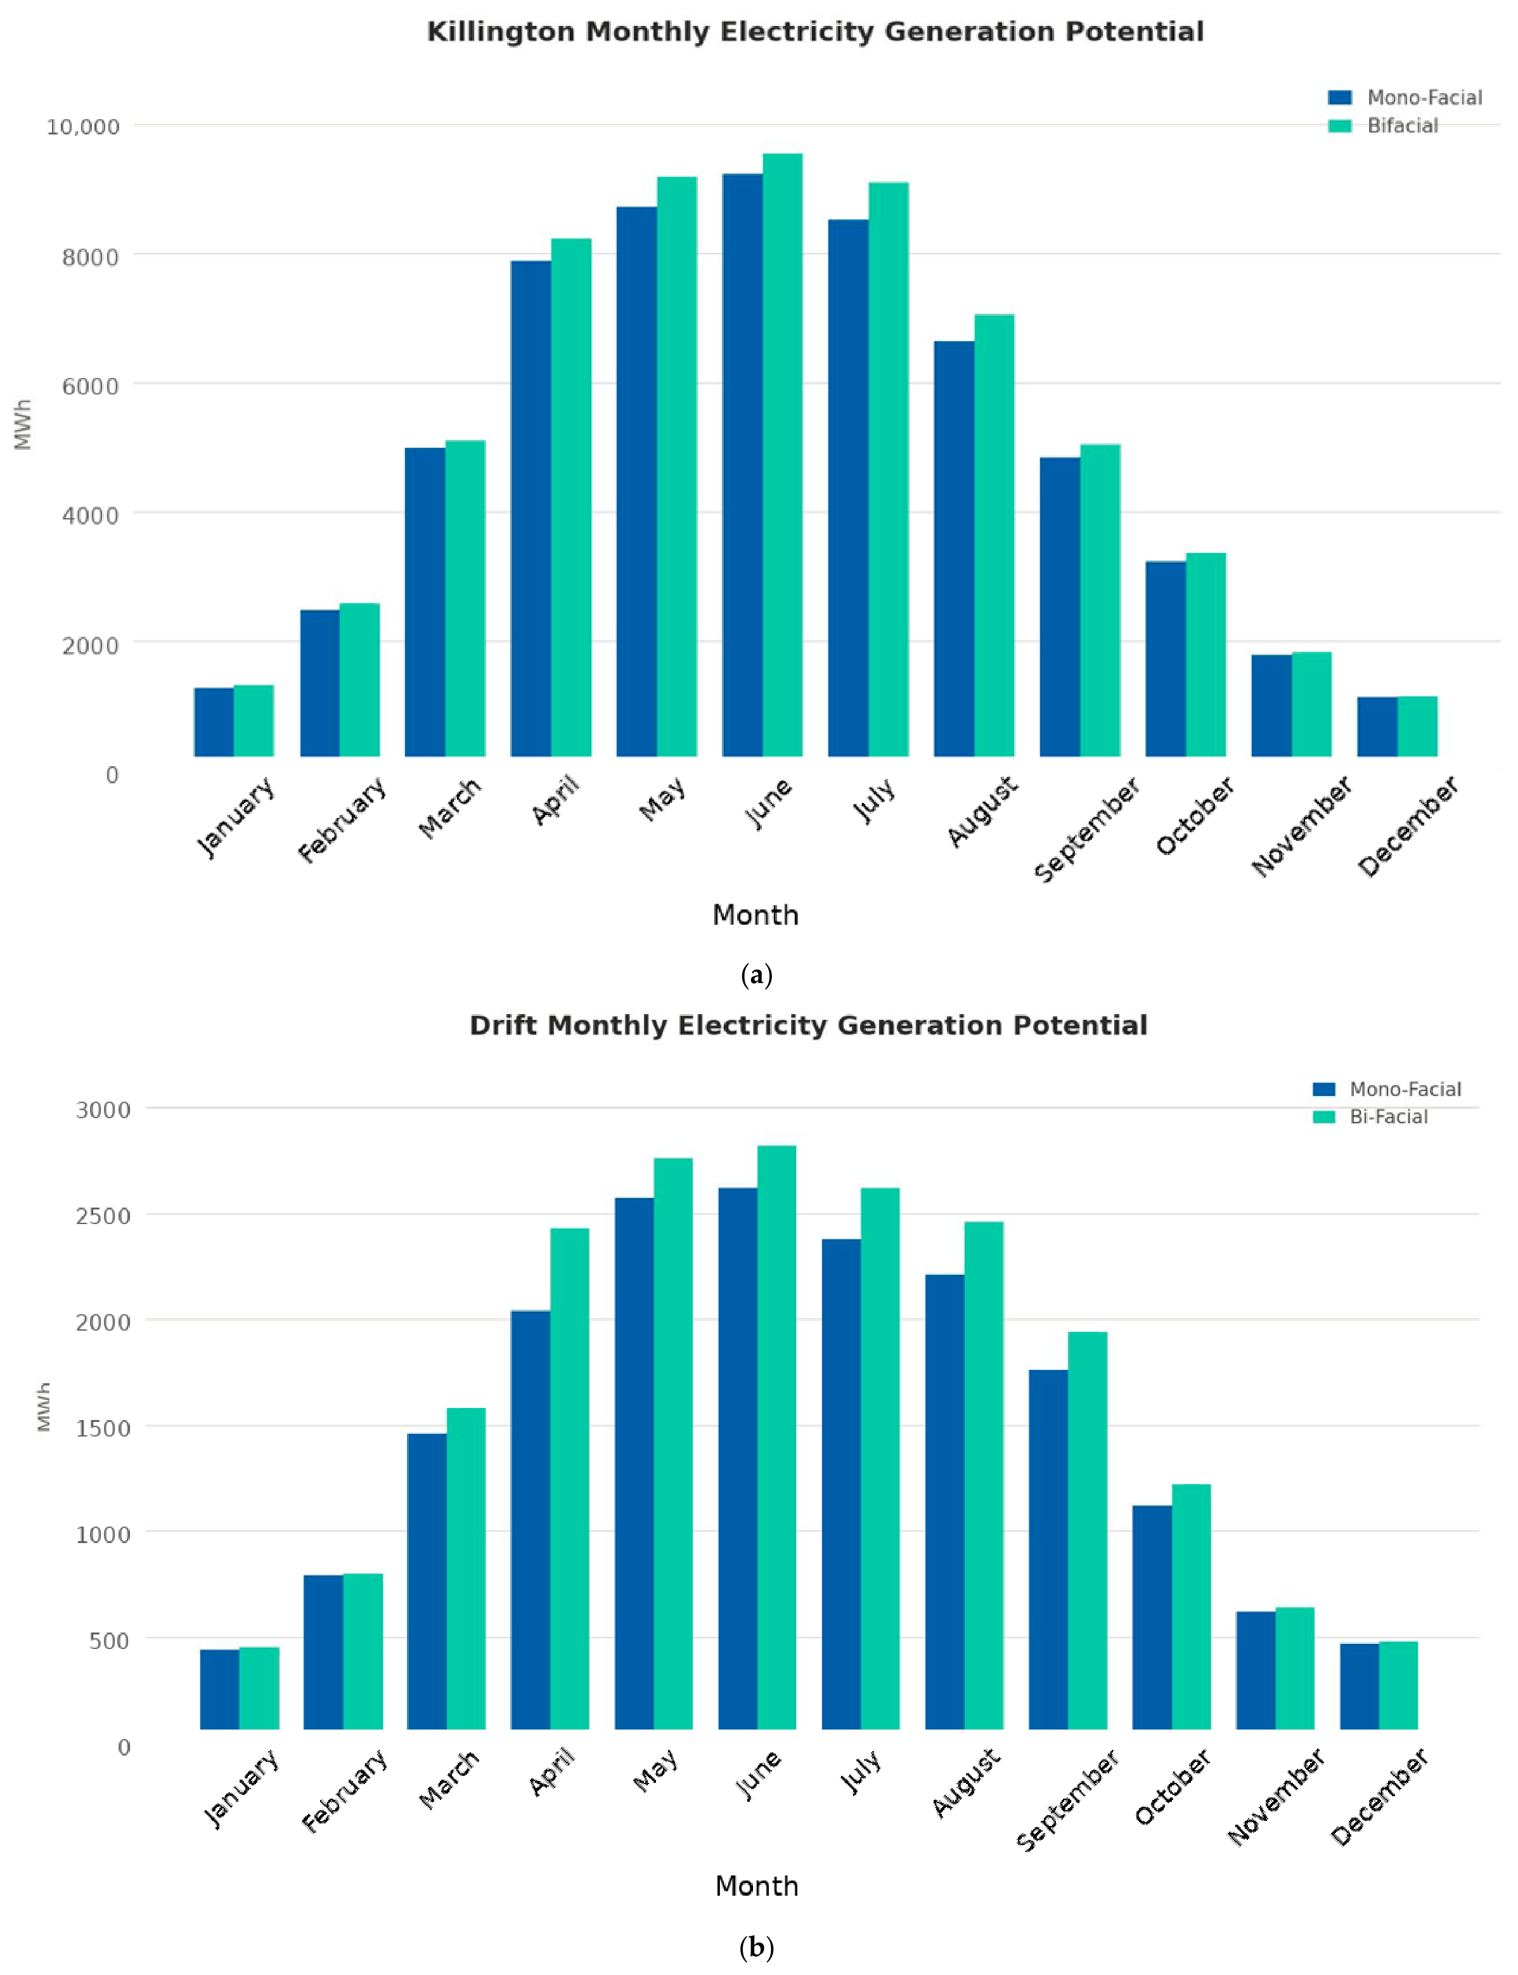
Figure 10 presents the simulated monthly generation for both monofacial and bifacial systems at the Killington reservoir, demonstrating seasonal variation at the site. Peak output occurs during the summer months, from May to July, at both sites, with significantly lower output in the winter. The bifacial systems outperform the monofacial systems across both sites, with the largest gains occurring in months with the highest irradiance.

3.2. Direct Electrical Supply

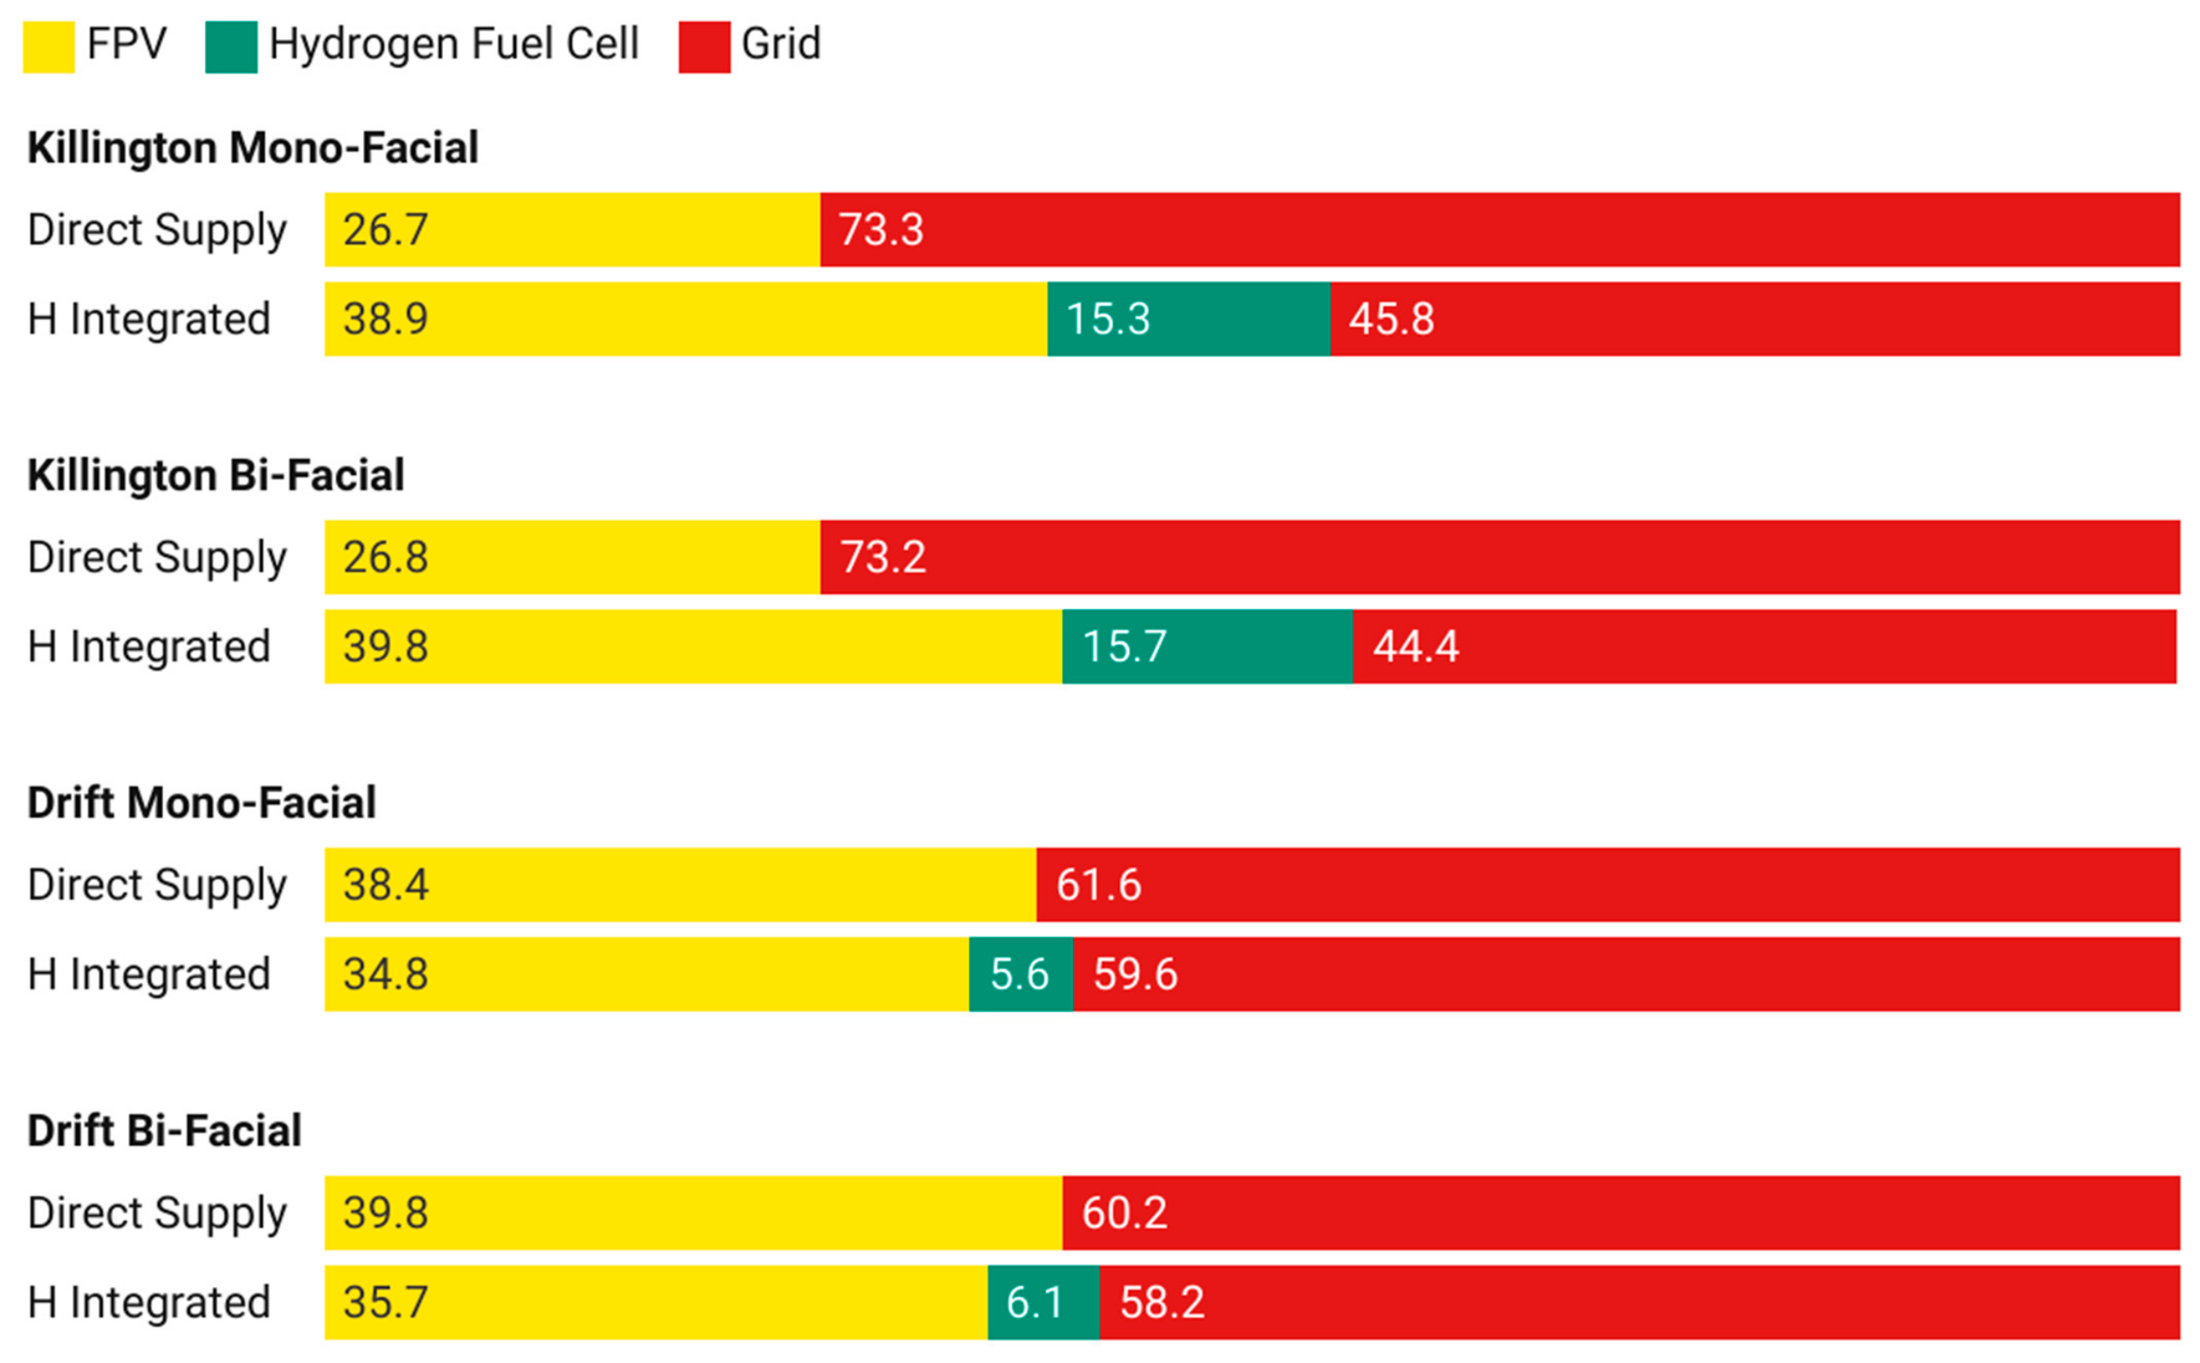
This section presents the results of the direct supply scenario, as modeled in Section 2.3.3. Table 11 breaks down the proportion of annual demand met by FPV for each location and scenario.

3.2.1. Direct Electrical Supply Breakdown

Total annual domestic electricity demand for populated areas local to the sites and average household demand were calculated in Section 2.1.3. FPV generation results in Table 9 and demand estimates in Table 4, were used to estimate the proportion of local demand that the proposed systems could meet. The results suggest that generation from the monofacial development at Killington was equal to 108% of Kendal’s electrical demand, and the bifacial system equivalent to 110–115%. For the Drift reservoir, the monofacial system was equivalent to 58.3% of Penzance’s electricity demand and 63% from bifacial. While the max-build-out scenario modeled in this study may not be practically feasible due to policy regulations and environmental concerns, the results demonstrate the technical feasibility of large-scale FPV in supporting the decarbonization of domestic electricity demands.

3.2.2. Load-Profile Mismatch

While Killington’s total annual FPV generation exceeds Kendal’s annual electricity demand, the annual totals presented in Section 3.2.1 do not reflect temporal matching between generation and load. As illustrated by the monthly generation patterns in Figure 10 and the residential load profile in Figure 5, FPV output peaks during summer and around midday, whereas residential demand is typically highest in winter and during the evening. The direct supply scenario therefore reveals a substantial seasonal and diurnal mismatch between supply and demand. As shown in Table 11, this limits the practical direct contribution of FPV to 26.7–26.8% of annual demand in Kendal and 38.4–39.8% in Penzance. As discussed in Section 2.3.2, these direct coverage values depend on the adopted HOMER residential load profile and should therefore be interpreted as indicative demand-matching estimates rather than fully UK smart-meter-calibrated values. This affects the precision of the direct coverage percentages, but not the annual FPV generation, hydrogen production, heating, or transport results.
To quantify the sensitivity of the direct coverage values in Table 11 to load-profile shape, a bracketing analysis was performed across three demand scenarios spanning the plausible range of seasonal distributions for these communities: (i) the HOMER baseline profile, with a winter-to-summer demand ratio of 1.19; (ii) Elexon Profile Class 1 for domestic unrestricted customers, representing gas-heated households, with a winter-to-summer ratio of 0.91; and (iii) a community-weighted mixed profile combining standard domestic demand with higher winter electricity sensitivity associated with off-gas-grid or electrically heated households, yielding indicative ratios of 1.10 and 1.18 for the two case-study communities. Coverage estimates under each scenario were derived by applying the proportional dispatch relationship established from the HOMER baseline run.
Results, summarized in Table 12, indicate that the direct coverage values are relatively insensitive to the tested seasonal load-profile variations. At Killington, the maximum deviation across all scenarios is +1.3 percentage points, reflecting the site’s temporal-mismatch-constrained nature. Because annual FPV generation at Killington exceeds annual local demand, direct coverage is limited mainly by the timing of generation and demand rather than by the total amount of FPV electricity available. Therefore, profiles with relatively higher summer demand slightly improve direct matching, as FPV output is also highest in summer.
At Drift, where annual FPV generation is lower than annual demand and coverage is more supply-constrained, the maximum deviation is ±0.7 percentage points. In this case, most FPV output can be absorbed by the local load across the year, so changing the seasonal demand profile has a smaller effect on the total direct coverage percentage. Annual FPV generation, hydrogen production volumes, and all heating and transport pathway results are invariant across scenarios, as these quantities depend on annual energy balances rather than the precise hourly load-profile shape.

3.2.3. Hydrogen Integrated Electrical System

Table 13 presents the results of the hydrogen integrated scenario, following the methodology in Section 2.3.4. In this analysis, surplus electricity generated by the FPV is used to produce green hydrogen, which is then converted back to electricity via a fuel cell when the FPV cannot meet demand. The values for “Electricity Supplied by FPV” do not represent total electrical generation from the FPV; they reflect only what the FPV contributed directly to meet the electrical load, and do not include the energy it provides to the electrolyzer. The electricity used by the electrolyzer and annual hydrogen production values are reported in Table 13.

3.2.4. Hydrogen-Integrated Electrical Supply Breakdown

Hydrogen made a greater contribution to meeting local electricity demands at the Killington site, supplying between 15 and 16%, which can be attributed to the scale of the FPV system relative to local demand. While Killington FPV’s generation exceeded Kendal’s demand, the Drift deployment did not exceed the local electricity demand in Penzance. Killington, therefore, had longer periods of excess generation, allowing the electrolyzer and fuel cell to operate more consistently.

3.2.5. Seasonal and Daily Variation

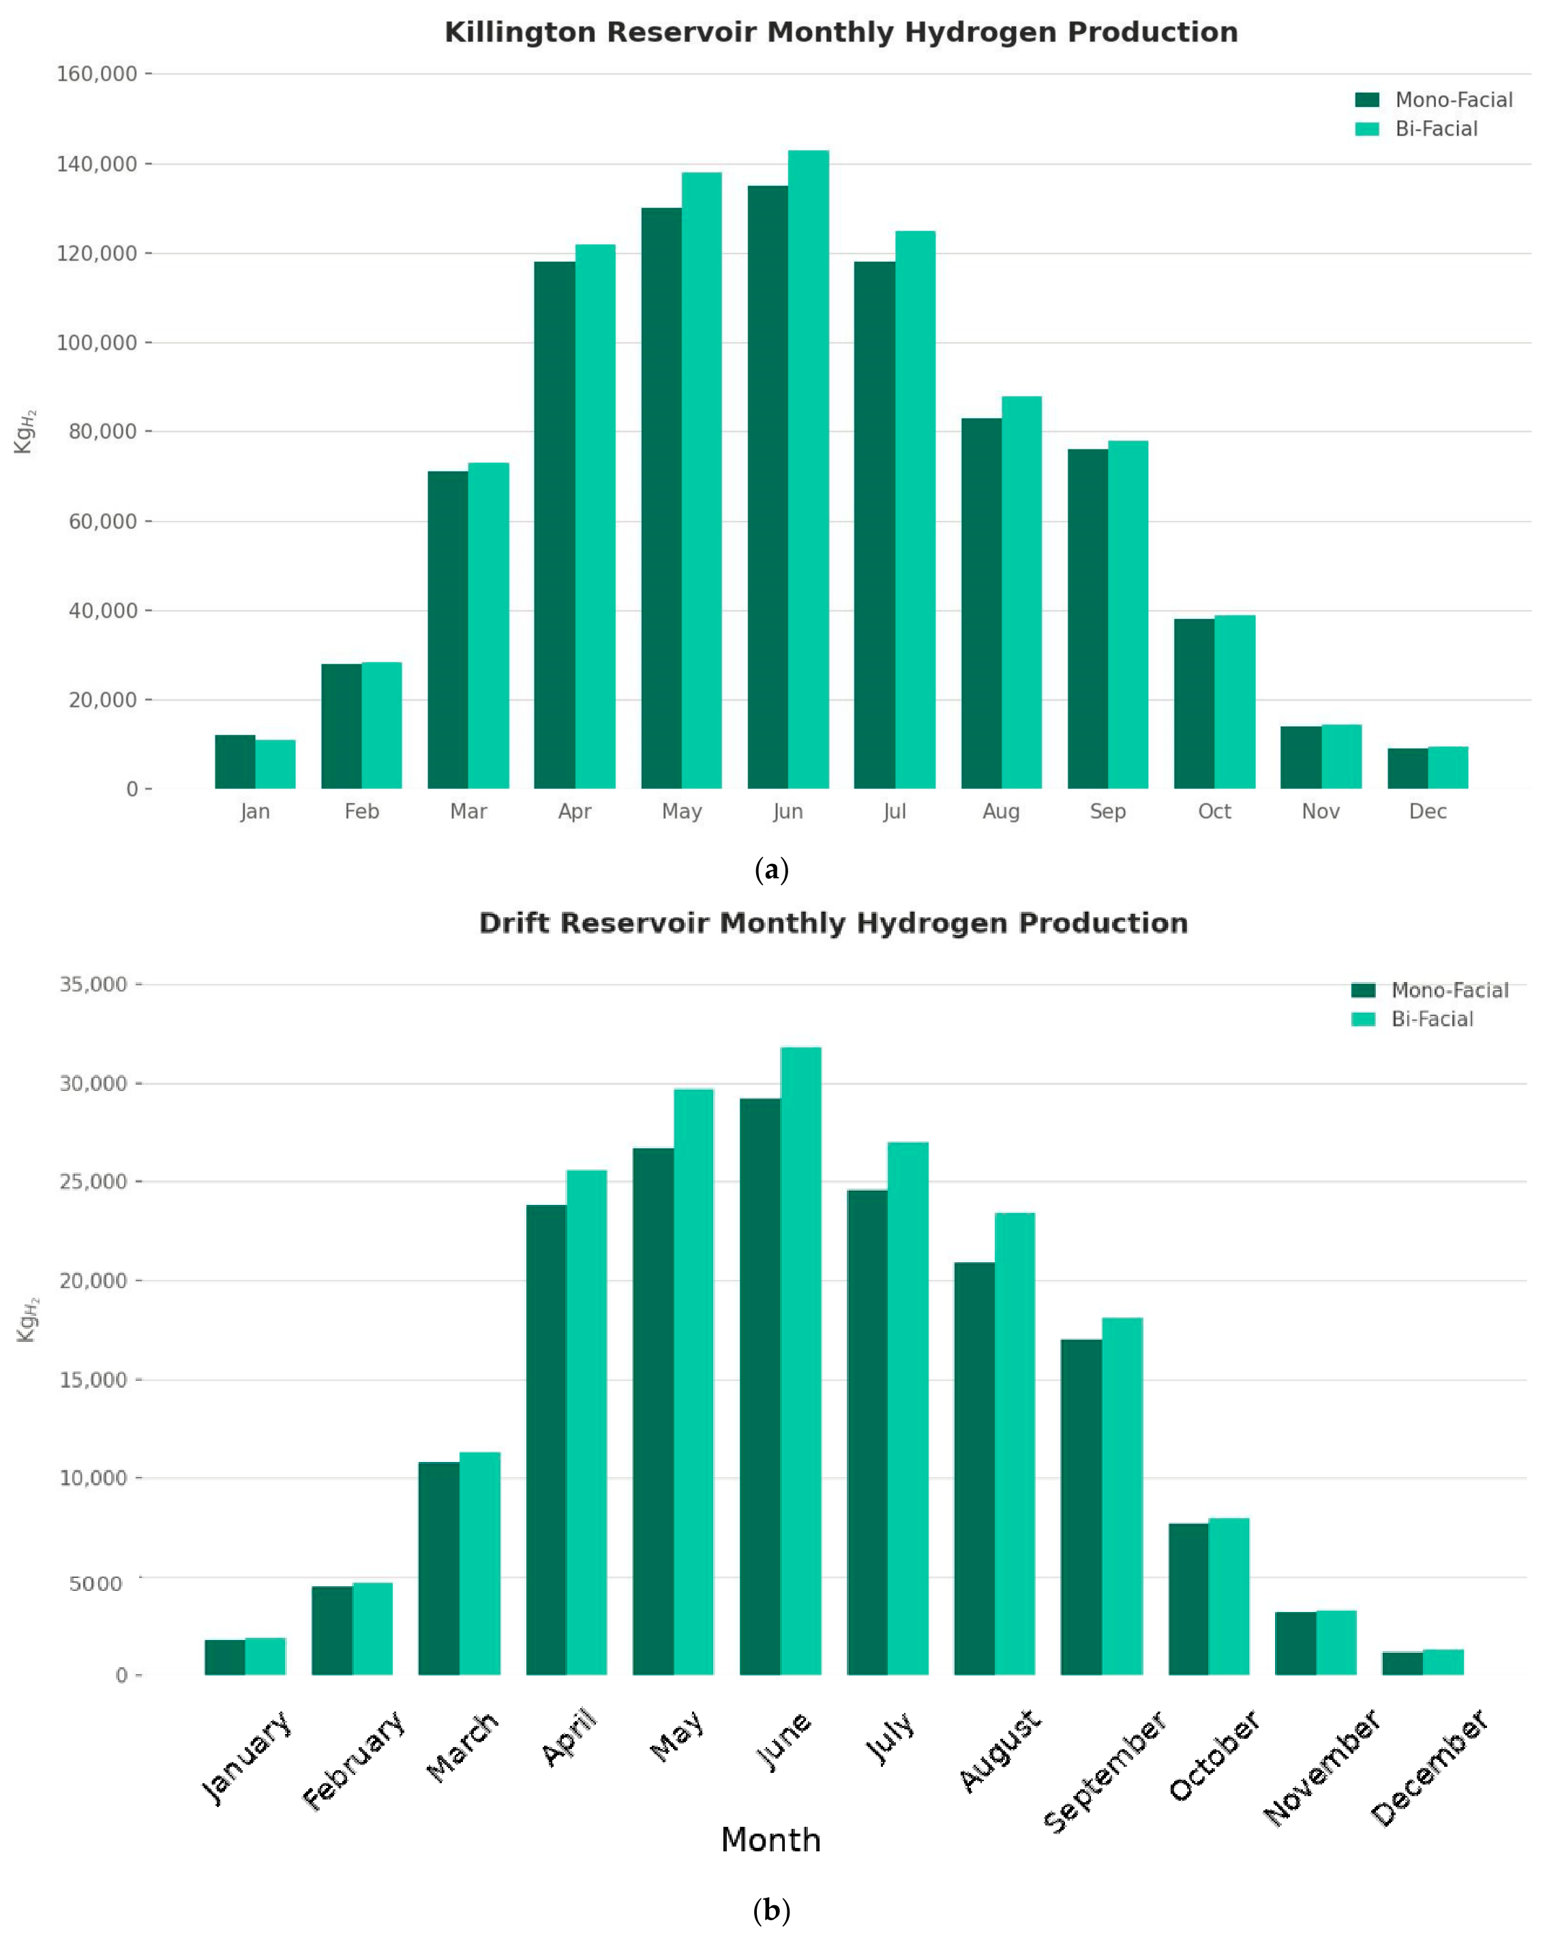
Monthly hydrogen production followed a strong seasonal trend, as shown in Figure 11, which closely aligns with the FPV generation profiles in Figure 10. Peak hydrogen production occurred between May and July, with maximum monthly outputs of 145,000 kg at Killington and 30,000 kg at Drift. Production during the winter months was very low, as total FPV generation was also at its lowest and electricity demand was at its highest. For most of the year, bifacial systems produced more hydrogen than monofacial systems due to their higher PV output. However, in the winter months, the monofacial systems produced more hydrogen; as both systems have similar PV outputs over this period, this suggests that a larger proportion of the bifacial electrical generation output could be used directly to meet demand, reducing the surplus available for hydrogen generation.
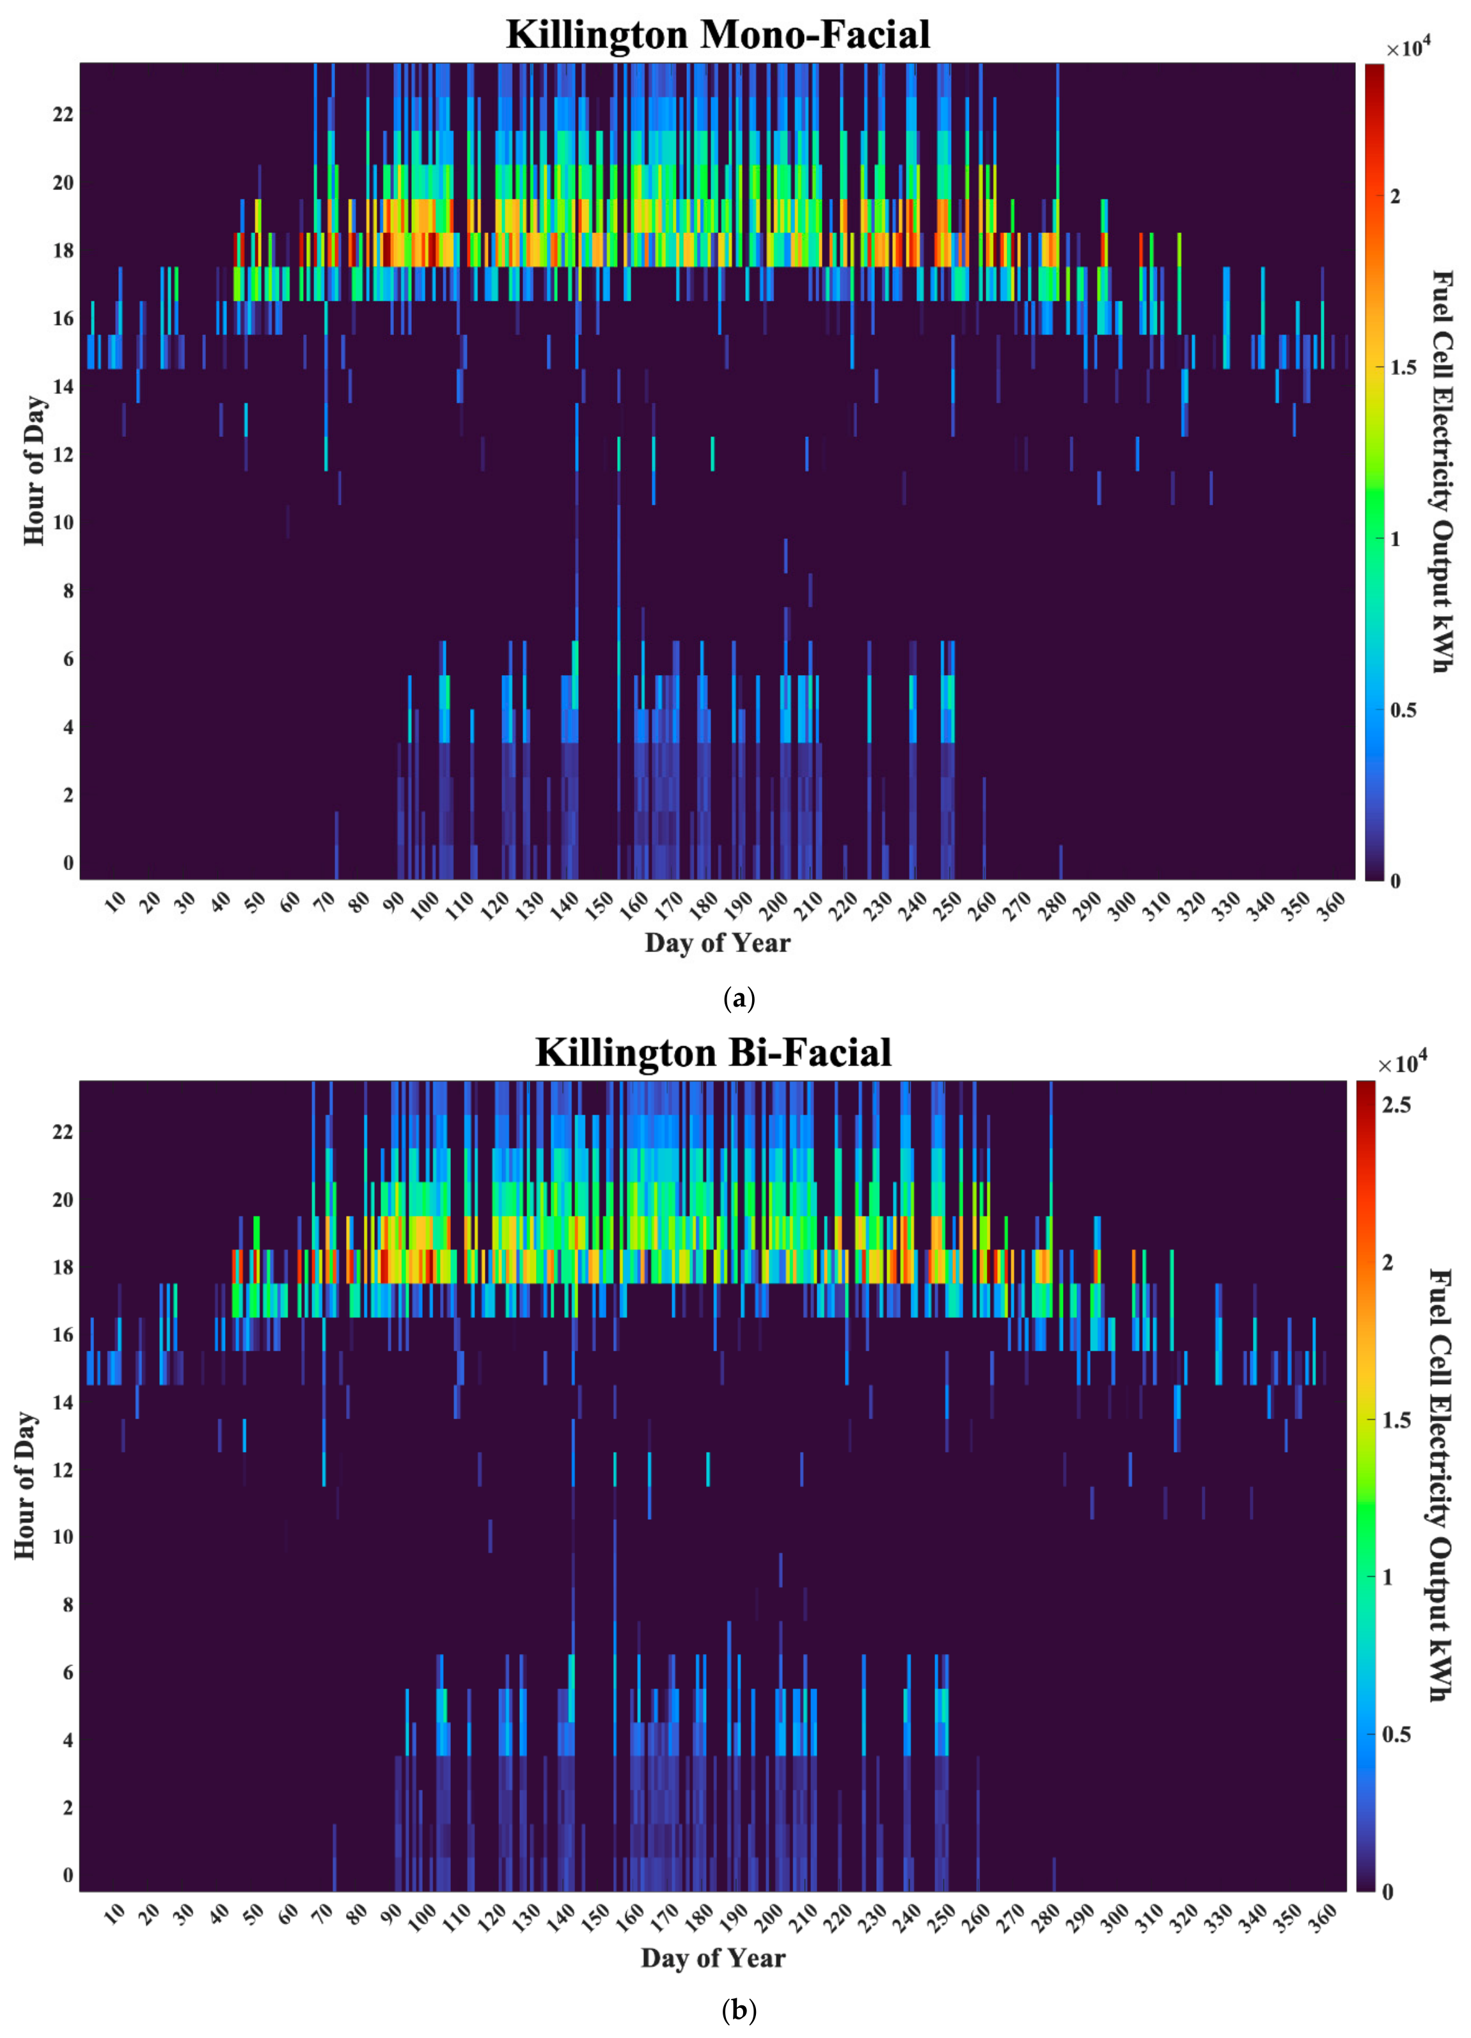
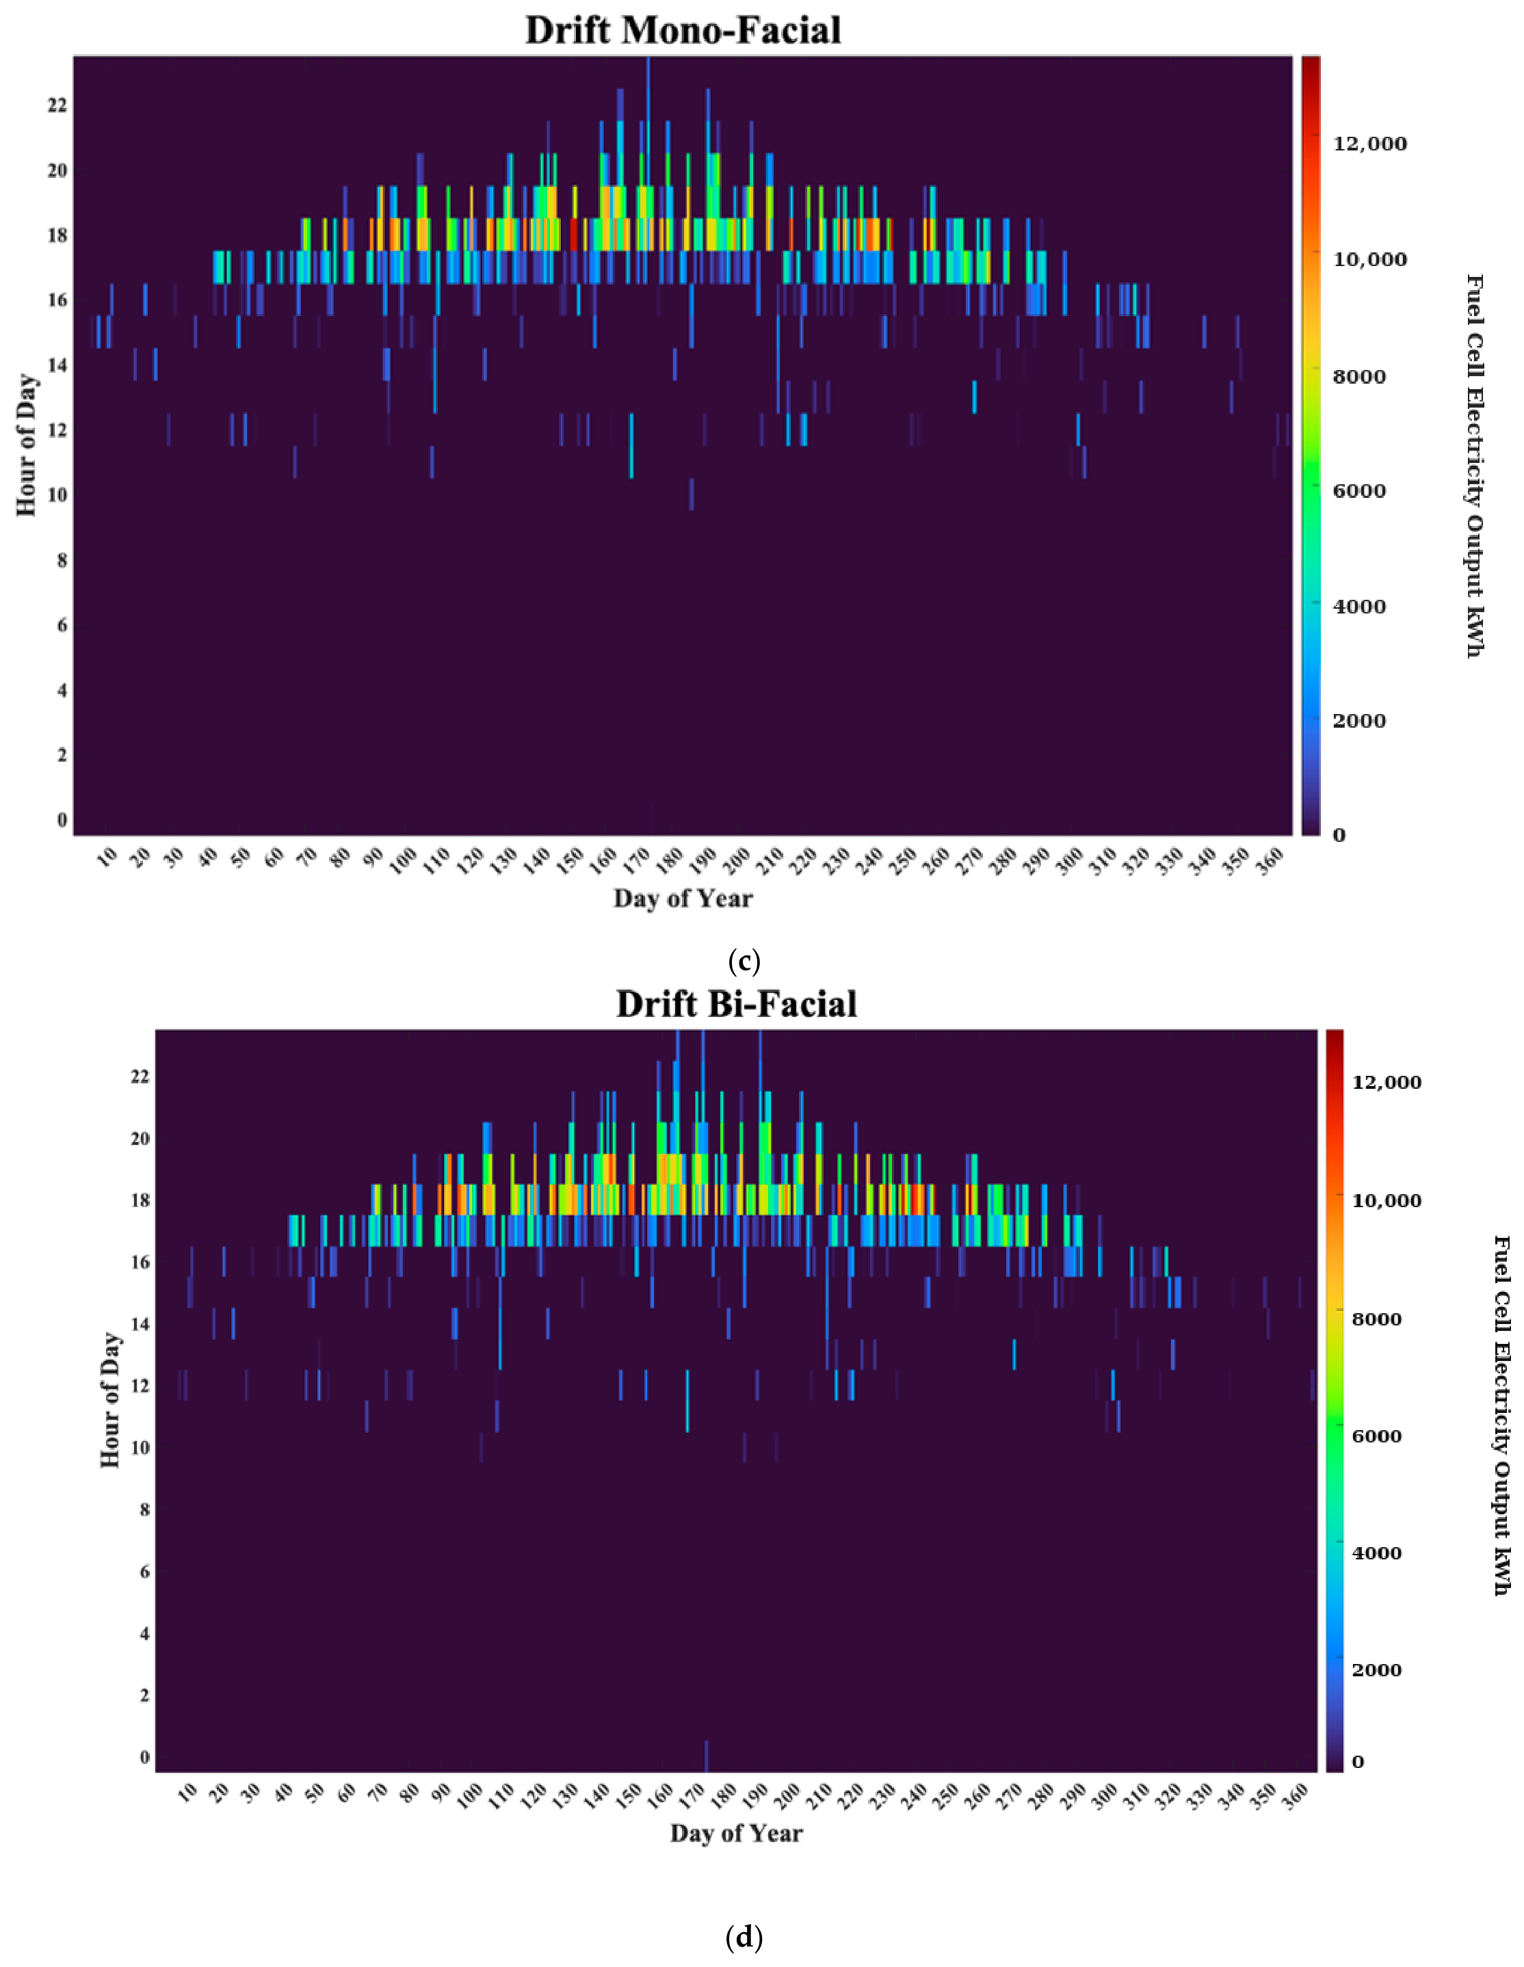
Fuel cell operations displayed similar temporal patterns. Figure 12 presents the daily and annual variation in fuel cell electricity generation. In both systems, electricity from hydrogen was prominently supplied during the evening hours, between 17:00 and 21:00, when demand is high, and FPV generation is low. Less electricity was delivered in the winter, consistent with reduced hydrogen availability.

3.2.6. Impact on Domestic Electricity

While hydrogen-supplied electricity contributes a minority share across all scenarios in this analysis, it still represents a significant step toward decarbonizing the domestic electricity supply. Based on the consumption rates presented in Table 4, at Killington, the monofacial system delivered 8.934 GWh of hydrogen-derived electricity, equivalent to powering 2131 households. The bifacial system generated 9.126 GWh, which is sufficient for 2196 households. At Drift, the monofacial system could supply the equivalent of 376 households, and the bifacial system could supply the equivalent of 408 households.

3.3. Hydrogen-to-Heat Results

This section presents the results of a scenario in which all hydrogen produced from surplus FPV electricity is used directly in hydrogen-compatible boilers to meet domestic heating demand, rather than converting it back to electricity via a fuel cell, following the methodology in Section 2.3.5.

3.3.1. Hydrogen Energy and Thermal Delivery

Table 14 presents the quantity of hydrogen produced by each system, its energy potential, and the estimated thermal energy which could be delivered as domestic heating for each site and configuration.

3.3.2. Potential Impact of Domestic Heating

The results were used to estimate the potential practical impact of hydrogen generation for heating. Assuming an average annual domestic heating demand of 11,500 kWh [123] in the UK, at Killington reservoir the hydrogen produced by the monofacial system could provide the thermal energy equivalent to the heating demand of 2187 households, and the bifacial system equivalent to 2267. For the Drift reservoir, the monofacial system represents 447 households, and the bifacial system 483.

3.4. Hydrogen-to-Transport Results

This scenario assumes all the hydrogen produced by the FPV during excess generation periods is supplied to the transport sector for use in hydrogen-compatible vehicles, following the methodology in Section 2.3.6. The estimated vehicle ranges are presented in Table 14.
Based on the consumption rates of modern commercially available hydrogen fuel cell vehicles, the hydrogen generated by the modeled systems could support approximately 418,237–1,225,808 km of travel annually, depending on the site and system configuration. Assuming an average petrol passenger vehicle emission factor of approximately 130 g CO2/km, this corresponds to a reduction in emissions of approximately 59–154 tons of CO2 annually, excluding upstream fuel production emissions [124].

3.5. Evaporation Reduction

Evaporation rates were calculated using the Linacre method detailed in Section 2.4, which considered climatic and geographical parameters for each reservoir. The results presented in Table 8 revealed that Drift reservoir had a higher evaporation rate than Killington, reflecting the warmer average temperatures in the Southwest UK. This study estimated that utility-scale FPV deployment could reduce annual evaporation by 1,960,000 m3 at Killington and 452,000 m3 at Drift, as detailed in Table 15. Considering that the average person in the UK consumes 139 L of water per day, these evaporation savings equate to the annual demand of 38,700 and 8900 individuals [125].

4. Discussion

4.1. FPV

This study evaluated the potential of FPV and hydrogen integrated systems to support UK decarbonization across multiple sectors. By modeling two contrasting reservoir sites, the analysis assessed how surplus solar generation could be used to produce hydrogen for electricity, heating, or transport, while also delivering environmental co-benefits such as evaporation reduction.
The results demonstrate that the UK has suitable inland water bodies for utility-scale FPV deployment, offering a significant contribution to net-zero ambitions. Meeting the UK’s goal of 90 GW solar capacity by 2050 using exclusively terrestrial PV would occupy approximately 0.6% of UK land placing pressure on agriculture and protected habitats [126]. Ground-mounted PV systems typically require approximately 0.8–1.6 hectares per MW of installed capacity, depending on layout and spacing [127]. Based on this range, large-scale FPV deployment at Drift and Killington could conserve on the order of 400–800 hectares of land that would otherwise be required for terrestrial PV. The results from Killington and Drift reservoirs suggest that large-scale FPV deployment can deliver significant energy output, even in areas of lower irradiance such as the Northwest of the UK and also highlight the benefits of deploying bifacial systems in areas of high irradiance, with Drift reservoir benefitting from an increase in specific yield of around 50 (kWh/kWp/year).
The partial deployment scenarios further demonstrate that meaningful energy and environmental benefits can still be achieved without relying on maximum reservoir utilization. This is important because practical FPV deployment may be constrained by ecological protection, reservoir operation, visual amenity, and stakeholder acceptance. The 10% and 25% scenarios, therefore, provide more realistic reference points for planning discussions, while the maximum build-out case should be interpreted as a theoretical upper-bound technical potential rather than an immediately deployable configuration.
The co-benefit of FPV identified in this analysis in reducing evaporation by nearly 2.4 million m3 further highlights the benefits of FPV deployment as they not only support the UK’s growing electricity demands but also reduce strain on land and water resources.

4.2. Hydrogen Integration

A key challenge with standalone FPV systems is their temporal misalignment with domestic demand, which, as highlighted in Section 3.3, generally peaks during times of low FPV output. The results demonstrate that integrating hydrogen storage enables greater penetration of renewable energy into the electricity supply. As shown in Figure 13, hydrogen integration consistently reduced reliance on the National Grid compared to direct FPV supply across all scenarios. This highlights hydrogen’s role in enhancing the temporal flexibility of solar generation, allowing a larger proportion of domestic demand to be met by low-carbon resources.
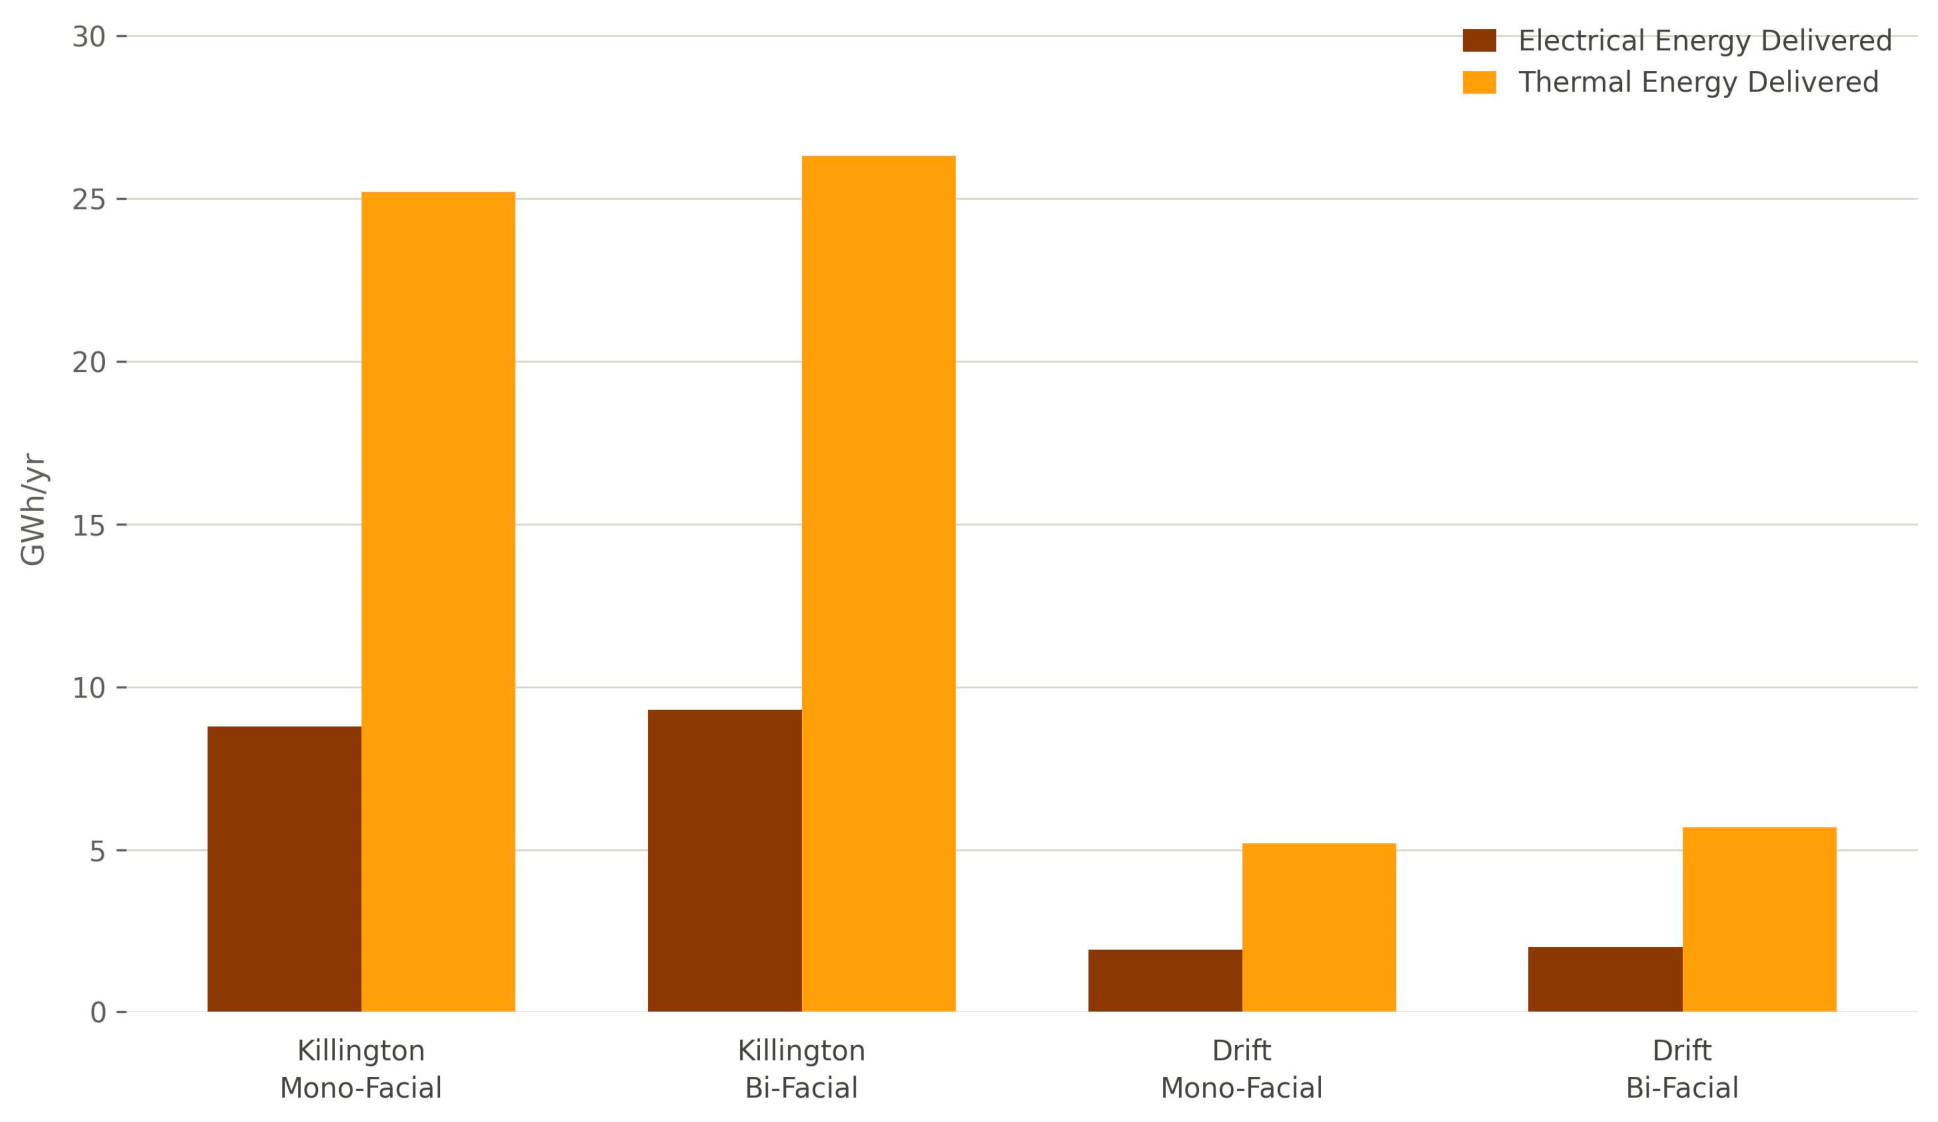
While converting green hydrogen produced from excess FPV generation back into electricity improves the system’s ability to meet domestic demand, the relatively low efficiency of fuel cells, assumed at 50% in this study, means a significant portion of stored energy is lost before reaching the end user. In contrast, when hydrogen is used for heating in highly efficient compatible boilers, up to 90% of the energy stored in the hydrogen can be delivered as useful thermal energy. Figure 14 compares the total electrical and thermal energy delivered by the generated green hydrogen for all scenarios, demonstrating that hydrogen used for heating consistently results in significantly greater energy recovery.
As an opportunity-cost benchmark, direct injection of FPV electricity into the UK grid was also considered. The resulting direct grid CO2 avoidance values are reported in Table 10 for each partial and maximum deployment scenario. This benchmark provides a quantitative comparison for interpreting the hydrogen pathways, since electrolysis, storage, and fuel cell reconversion introduce additional energy losses. Therefore, hydrogen use is most relevant where temporal flexibility, long-duration storage, or hard-to-electrify end uses are prioritized over maximum immediate CO2 displacement.
Domestic heating is one of the largest contributors to UK carbon emissions and, as discussed in Section 1, requires significant decarbonization. The results of this study suggest that green hydrogen generated through FPV offers significant potential for low-carbon heating, with the energy to heat thousands of households. However, while hydrogen boilers are commercially available and trials such as the HYDeploy have successfully integrated hydrogen into mains gas supplies [56], widespread adoption would require extensive infrastructure upgrades and industrial investment. Additionally, while hydrogen is non-toxic, it presents notable safety concerns as hydrogen is highly flammable with a lower ignition energy than gasoline or natural gas [128]. Although this research indicates that hydrogen combustion for thermal energy demand could be a more efficient use of green hydrogen, infrastructure costs and safety concerns may remain barriers to widespread adoption.
Recent literature increasingly questions the suitability of hydrogen as a primary residential heating pathway due to thermodynamic and economic disadvantages compared with direct electrification. Rosenow’s meta-review of 54 studies found that hydrogen heating is generally less efficient and more costly than heat pumps, with limited support for its use as a large-scale domestic heating solution [112]. Similarly, Gao et al. [129] reported that hydrogen-based heating pathways require substantially greater primary energy input than heat-pump-based electrification because of cumulative losses in electrolysis, storage, distribution, and end-use conversion. More recently, Aneggi et al. [130] concluded that electrification, particularly through heat pumps, remains the most efficient and cost-effective long-term pathway for residential heat decarbonization, while hydrogen is better suited to niche or system-level roles such as seasonal storage, backup supply, and grid balancing. Therefore, the hydrogen-heating results in this study should be interpreted as an alternative end-use scenario rather than a recommendation that hydrogen should replace direct electrification for domestic heating.
Because the hydrogen outputs reported in this study represent a limited annual resource, practical deployment would require an allocation strategy rather than treating electricity reconversion, heating, and transport as interchangeable outcomes. A priority-based dispatch framework could allocate hydrogen according to seasonal demand, grid conditions, and sectoral value. During periods of high grid demand or low renewable generation, stored hydrogen may provide greatest system value through fuel cell reconversion or backup power. During winter, hydrogen may be more valuable for heat support where direct electrification is constrained, although heat pumps remain the more efficient primary heating pathway. Transport use may be prioritized where hydrogen demand is concentrated in fleet or depot-based applications, where shared refueling infrastructure can improve utilization [131]. Therefore, future FPV–hydrogen systems should be evaluated using multi-objective scheduling methods that compare hydrogen allocation across electricity, heat, transport, storage, and grid-support services based on emissions avoided, economic value, seasonal demand, and system resilience [132].
Large-scale FPV–hydrogen deployment would also require careful grid-interface design, because variable FPV output, electrolyzer operation, fuel cell reconversion, and local demand fluctuations can affect voltage regulation, reactive power exchange, harmonics, and power quality in distribution networks or islanded microgrids. Advanced inverter and power-electronic control strategies are therefore essential for maintaining a stable and high-quality grid connection under variable renewable generation. Zhang et al. [133] proposed a voltage–power coordinated control strategy for grid-connected inverters in low-voltage microgrids, demonstrating the relevance of coordinated voltage and power regulation for microgrid stability. Similarly, Boscaino et al. [134] reviewed grid codes, inverter topologies, and control techniques for photovoltaic power plant grid connection, highlighting power quality, control robustness, and grid-code compliance as key requirements for high-performance grid-connected PV systems. Therefore, future FPV–hydrogen studies should evaluate inverter control, reactive power support, harmonic mitigation, fault ride-through, and grid-code compliance alongside hydrogen production and storage optimization.
The calculated LCOE values ranged from £44.30/MWh to £62.53/MWh across the four modeled systems. These values suggest that electricity generation from utility-scale FPV may be broadly competitive with the wider range reported for large-scale solar systems, although caution is warranted in direct comparisons because the present study uses simplified cost assumptions and does not include the additional infrastructure costs associated with hydrogen production, storage, or downstream use. The LCOE results are therefore most useful here as indicative comparative values between the modeled FPV configurations rather than as complete project-level economic metrics.
The baseline LCOE of £44–62/MWh was estimated using the PVsyst economic model and standard PV component cost assumptions. However, FPV systems can have higher balance-of-system costs than land-based PV due to additional floating structures, anchoring, and mooring requirements. Niccolai et al. (2024) [135] reported that FPV CAPEX costs are around 20–30% higher than ground-mounted systems, while LCOE is around 30% higher. Therefore, a 25% FPV cost premium was applied as a midpoint sensitivity adjustment, increasing the baseline LCOE range from £44–62/MWh to approximately £55–78/MWh. This adjusted range is not intended to replace the baseline PVsyst LCOE values, but to indicate how FPV-specific cost premiums may affect project economics.

4.2.1. Levelized Cost of Hydrogen Sensitivity

To extend the economic assessment beyond FPV-only electricity generation, a simplified levelized cost of hydrogen (LCOH) sensitivity analysis was conducted. The LCOH was estimated using:
L C O H = C e l e c + C e l , a n n + C O & M + C s t o r a g e , a n n M H 2
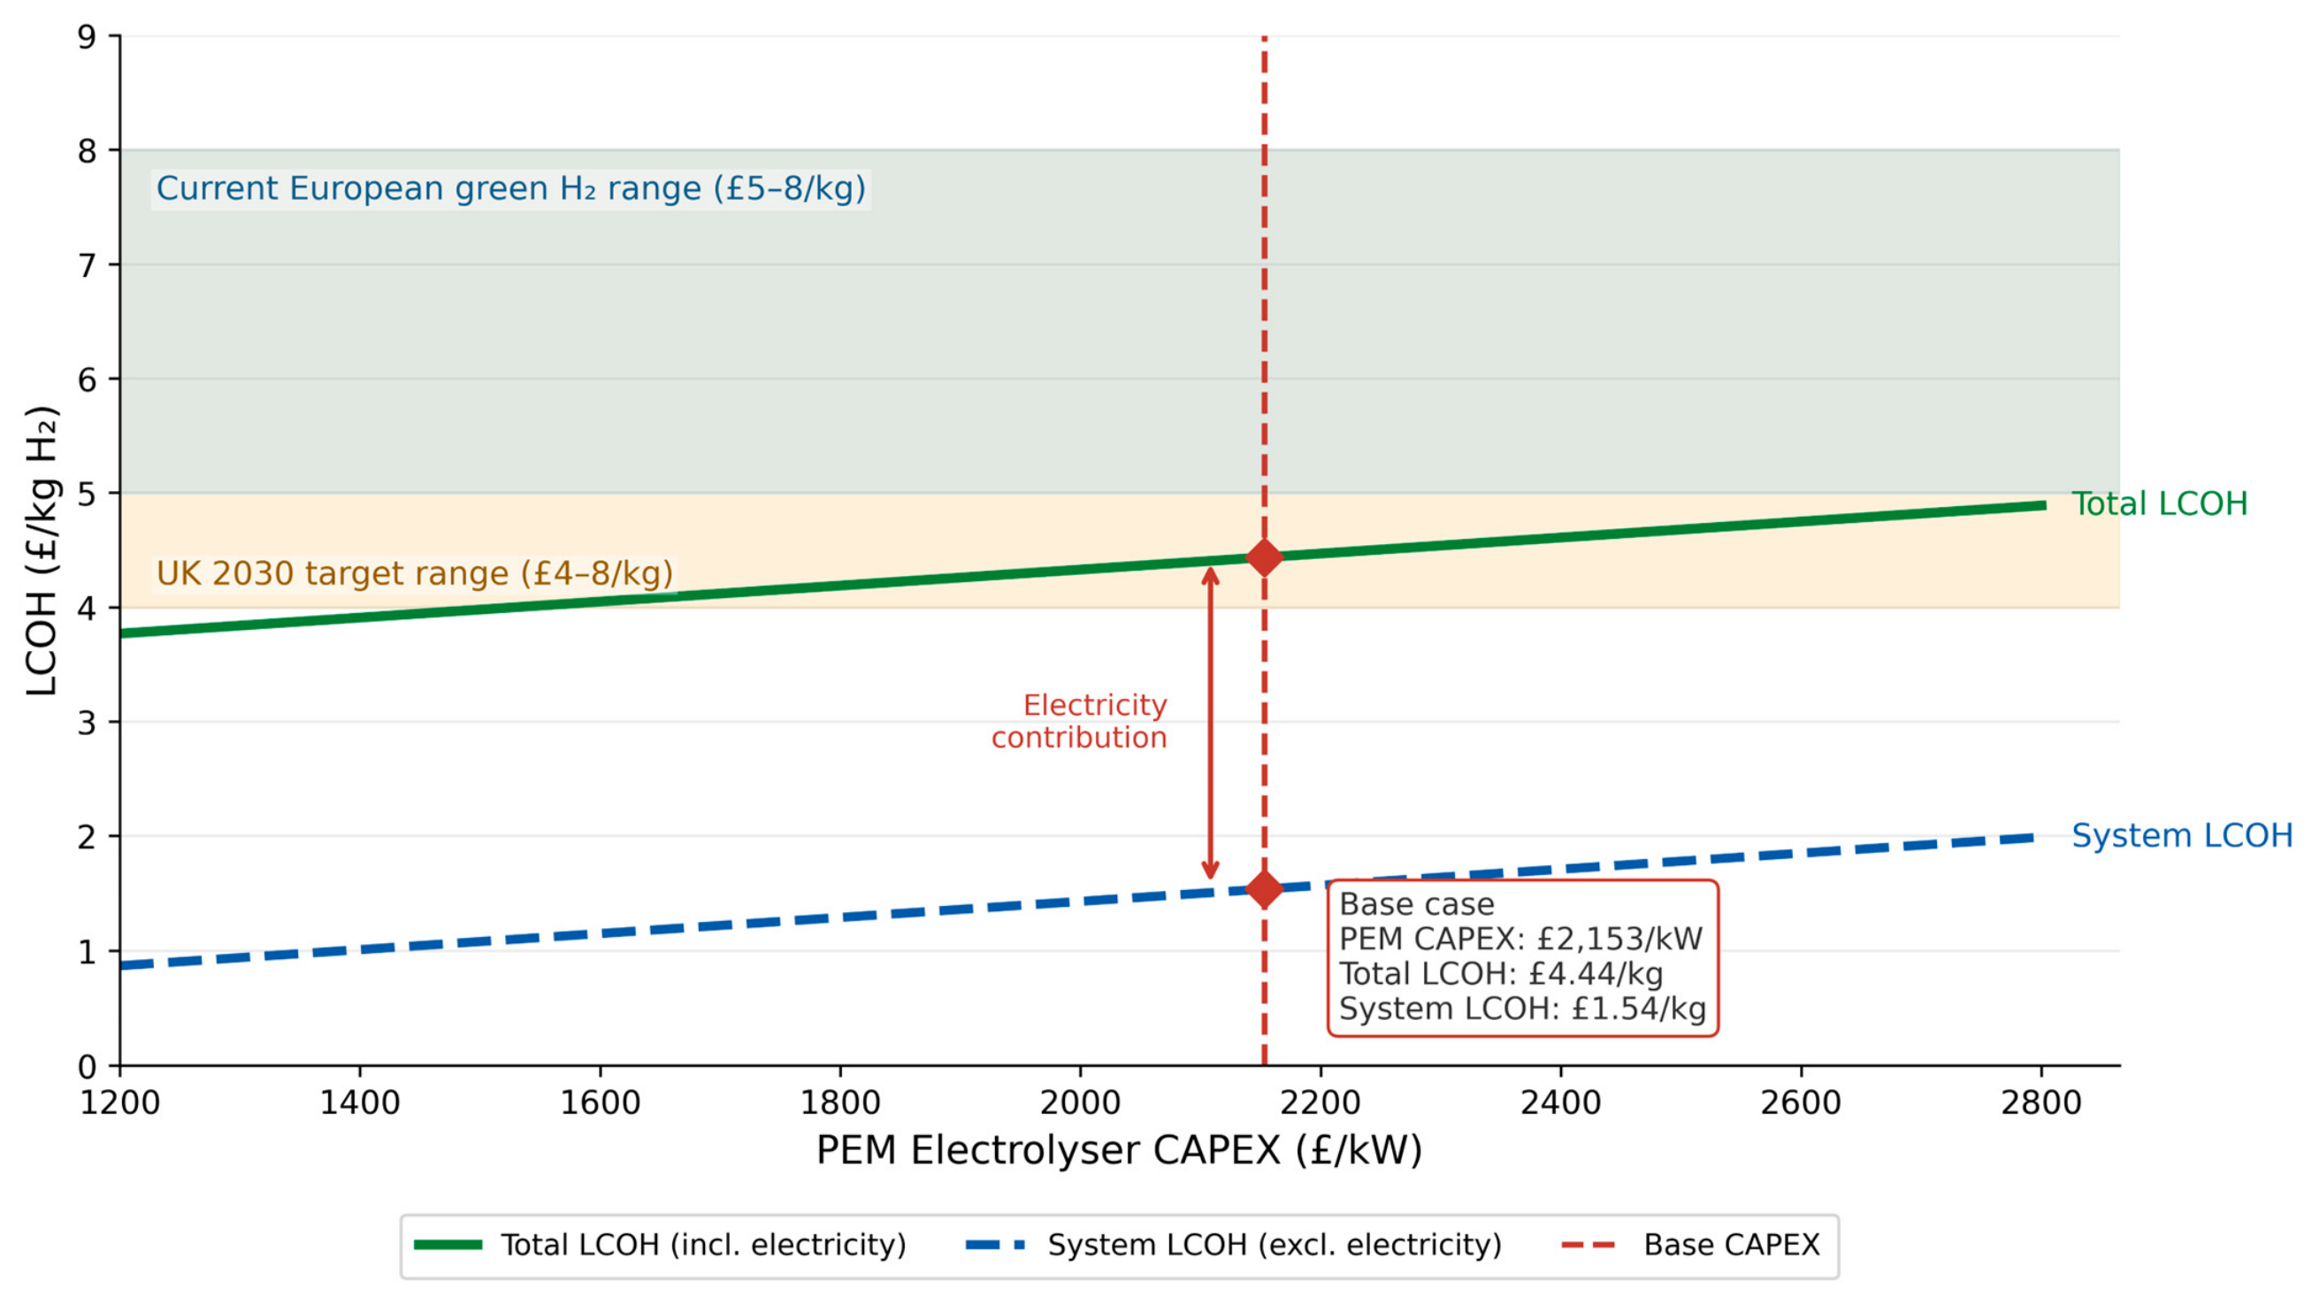
where C e l e c is the annual electricity cost allocated to hydrogen production, C e l , a n n is the annualized electrolyzer CAPEX, C O & M is annual electrolyzer operating cost, C s t o r a g e , a n n is the annualized hydrogen storage cost, and M H 2 is annual hydrogen production. The LCOH was modeled across a PEM electrolyzer CAPEX range of £1200–£2800/kW to reflect uncertainty in installed system costs. A base case of £2153/kW was adopted from the European Hydrogen Observatory 2025 industry survey [136], which reports a full-system PEM electrolyzer CAPEX of €2503/kW for a 100 MW advanced-stage project, converted at £0.86/€. Assuming a 20-year lifetime, 8% discount rate, 3% annual OPEX, and FPV electricity valued at £62.53/MWh, the total LCOH ranged from £3.77/kg to £4.89/kg, with a base case of £4.43/kg. These values remain below current European green hydrogen production costs of approximately £5–8/kg [137] and within the UK 2030 target range of £4–8/kg [52], suggesting that FPV-powered hydrogen may approach cost competitiveness under favorable deployment conditions. Nevertheless, the presented LCOH values remain indicative because they do not fully account for electrolyzer degradation, compression losses, financing variability, hydrogen transport infrastructure, or dynamic electricity market conditions. The sensitivity of LCOH to installed PEM electrolyzer CAPEX is illustrated in Figure 15.
Although direct like-for-like comparison with previous FPV–hydrogen studies is limited by differences in geographical location, solar resource, reservoir area, FPV capacity, electrolyzer sizing, storage configuration, load profile, economic assumptions, and hydrogen end-use pathway, published studies provide a useful order-of-magnitude benchmark for contextualizing the present results. In this study, the bifacial FPV–hydrogen systems produced 869,149 kg H2/year at Killington and 185,277 kg H2/year at Drift, with hydrogen reconversion supplying 9.216 GWh/year and 1.977 GWh/year of electricity, respectively. The Killington hydrogen output is approximately 5.1% higher than the 826,624 kg H2/year reported by Al Saadi and Ghosh [5], for an Oman-based FPV–hydrogen system, whereas the Drift output is approximately 77.6% lower, mainly reflecting the smaller reservoir area, lower system scale, and reduced surplus electricity available for electrolysis. By comparison, Li et al. [63] assessed FPV–hydrogen potential across reservoirs in Hong Kong and reported annual hydrogen production ranging from 180,502 kg H2/year to 36,310,221 kg H2/year, with LCOH values of USD 10.2–19.4/kg depending on reservoir size and system configuration. The Drift result is therefore close to the lower end of Li et al.’s reported range, while the Killington result is approximately 4.8 times higher than Li et al.’s lowest reservoir case but remains far below their largest reservoir-scale scenario. Gagliardi et al. reported up to 4199 tons H2/year for the largest FPV configuration on an Italian irrigation reservoir under variable-load electrolyzer operation, which is approximately 4.8 times higher than the Killington output and 22.7 times higher than the Drift output. Gagliardi et al. [138] also reported approximately 1.87 million m3/year of water conservation and an LCOH of EUR 13.18/kg, representing a 26% reduction compared with fixed-load operation. Therefore, the present UK results should not be interpreted as outperforming or underperforming these studies, but as showing that reservoir-based FPV–hydrogen systems in temperate UK conditions can achieve hydrogen outputs within the same broad order of magnitude as selected published case studies, while relative performance remains highly dependent on system scale, surplus electricity availability, end-use assumptions, and cost boundaries.
This analysis also considered the use of FPV-generated green hydrogen for domestic transport. As the 2035 UK Government ban on the sale of new petrol and diesel vehicles approaches, there is greater focus on low-carbon alternatives to petrol and diesel. Based on the consumption rates of modern hydrogen fuel cell vehicles and the emission rates of fossil fuel-based vehicles, the proposed systems could lead to a reduction in carbon equivalent emissions of between 1475 and 3850 tons across their 25-year lifetime. Although hydrogen has significant technical potential for transport decarbonization, limited adoption in the UK currently restricts the impact of integrated FPV–hydrogen systems. However, as alternatives to fossil fuels become necessary, hydrogen production from FPV could play a key role in supporting future transport infrastructure.
Beyond standalone hydrogen production, integrated FPV–hydrogen systems may also contribute to broader sector-coupling frameworks, where electricity, heating, transport, and hydrogen infrastructures operate as interconnected energy vectors within an integrated low-carbon energy system [139]. In such systems, excess FPV generation may simultaneously support domestic electricity demand, hydrogen production, thermal energy systems, electric vehicle charging, and grid-balancing services depending on real-time operating conditions. Recent studies emphasize the importance of intelligent energy management architectures, including predictive dispatch algorithms, smart microgrid controllers, and hybrid storage coordination strategies to optimize renewable energy utilization and minimize curtailment losses [140]. Furthermore, Vehicle-to-Grid (V2G) and Vehicle-to-Home (V2H) frameworks may provide additional operational flexibility by allowing electric vehicles to function as distributed storage resources capable of peak shaving and short-term balancing [141]. Within highly renewable energy systems, hydrogen storage is increasingly viewed as complementary to battery storage, where batteries address short-duration fluctuations while hydrogen provides long-duration and seasonal storage capability [142]. Consequently, the proposed FPV–hydrogen systems should not be interpreted solely as isolated hydrogen production facilities, but rather as potential components of future smart renewable microgrids capable of supporting multi-sector decarbonization, energy resilience, and flexible grid operation under high renewable penetration scenarios.
Beyond direct hydrogen use in electricity, heat, and transport, further conversion pathways may increase the system value of surplus FPV-generated hydrogen. In particular, power-to-ammonia can convert green hydrogen into a more easily stored and transported chemical carrier, while ammonia can also support power-sector decarbonisation through co-firing or later reconversion. Zhou et al. [143] proposed an electricity–hydrogen–ammonia integrated energy-system planning model that combines power-to-hydrogen, power-to-ammonia, ammonia co-firing, and waste-heat recovery, showing how coordinated planning can improve system flexibility and operating economics. Similarly, Tu et al. [144] developed a multi-dimensional electricity–hydrogen–ammonia–heat integrated energy system using liquid ammonia as a central energy hub, reporting improved renewable energy accommodation, high overall system efficiency, and lower carbon emissions compared with a system without ammonia integration. Therefore, future FPV–hydrogen assessments should consider ammonia synthesis, ammonia reconversion or co-firing, waste-heat recovery, and integrated electricity–hydrogen–ammonia–heat optimization as additional pathways for improving the economic value and flexibility of reservoir-based green hydrogen systems.
The UK Hydrogen Strategy sets a target of delivering 5 GW of low-carbon hydrogen production capacity by 2030, with the potential to produce up to 42 TWh annually [52]. While this study analyzed only two reservoir sites, the systems modeled at Killington and Drift could produce over 1 million kg of green hydrogen from surplus FPV electricity, equivalent to approximately 35 GWh of energy. This suggests that widespread deployment of FPV and hydrogen integration across more of the UK’s 2117 large reservoirs could contribute significantly to hydrogen generation goals [145]. The Hydrogen Strategy emphasizes “hard to electrify” sectors, such as heating and transport, and pledges £240 million in investment through the Net Zero Hydrogen Fund to support production capacity. Although the maximum build-out systems modeled in this study represent idealized rather than immediately deployable configurations, continued technological and policy developments may improve the feasibility of similar integrated FPV–hydrogen systems in the future.

4.2.2. Sensitivity Analysis

To evaluate the robustness of the modeled FPV–hydrogen systems, a simplified non-linear sensitivity analysis was conducted for several key uncertain parameters, including surface albedo, electrolyzer efficiency, evaporation reduction factor (β), and FPV capital expenditure (CAPEX). Figure 16 illustrates the relative variation in system outputs resulting from ±10% and ±20% changes in each parameter compared to the baseline assumptions adopted in this study.
The analysis indicates that electrolyzer efficiency and FPV CAPEX exerted the strongest influence on system performance. Variations in electrolyzer efficiency produced substantial changes in hydrogen yield, reflecting the strong dependence of green hydrogen production on electrolysis conversion performance. Similarly, changes in FPV CAPEX had the largest impact on the levelized cost of electricity (LCOE), highlighting the economic sensitivity of large-scale FPV deployment to capital investment assumptions.
The evaporation reduction factor (β), used to estimate water savings from FPV surface coverage, also showed significant influence on predicted evaporation reduction benefits. This reflects the uncertainty associated with site-specific environmental conditions, including wind speed, humidity, and array layout, which are difficult to fully capture using simplified empirical assumptions. In contrast, surface albedo produced comparatively smaller variations in overall system performance, although changes in albedo still influenced bifacial gain by altering rear-side irradiance availability.
Overall, despite variations in absolute outputs across the tested ranges, the comparative trends between sites and system configurations remained consistent. The sensitivity analysis therefore supports the robustness of the study’s broader conclusions regarding the technical feasibility and multi-sector decarbonization potential of FPV-integrated green hydrogen systems in the UK.
The feasibility of the proposed systems remains sensitive to several assumptions beyond the tested parameter ranges. Interannual solar-irradiance variability would directly affect annual FPV generation and therefore the surplus electricity available for hydrogen production; lower-irradiance years would reduce hydrogen yield and increase reliance on the grid, while higher-irradiance years would improve electrolyzer utilization. Electrolyzer operating load range is also important, because fixed-efficiency modeling does not capture part-load efficiency losses, start-up/shutdown behavior, or degradation under intermittent operation. Therefore, the reported hydrogen yields should be interpreted as system-level estimates under fixed-performance assumptions rather than dynamic electrolyzer performance predictions. Conversely, future reductions in electrolyzer CAPEX, improved stack efficiency, longer lifetimes, and lower FPV balance-of-system costs would improve LCOH and strengthen techno-economic feasibility. These uncertainties do not change the main comparative conclusion that larger reservoirs with greater surplus FPV generation provide stronger hydrogen potential, but they affect the absolute economic and hydrogen production values reported in this study.

4.3. Limitations and Future Work

This study provides a technical assessment of FPV-integrated green hydrogen systems under defined modeling assumptions. The analysis includes maximum build-out and partial deployment scenarios at 10%, 25%, and 50% reservoir coverage, allowing both upper-bound potential and more constrained deployment cases to be examined. The maximum build-out case should therefore be interpreted as a theoretical resource benchmark, while the partial deployment scenarios provide more practical reference points for planning and policy discussion.
However, actual FPV deployment would still depend on site-specific engineering, and environmental and planning requirements. Reservoir operation, anchoring and mooring design, maintenance access, ecological protection, visual amenity, and stakeholder acceptance would influence the final deployable area. This is particularly relevant for Killington reservoir. Although it lies outside the formal Lake District National Park boundary, its proximity to a nationally protected landscape introduces additional landscape and visual sensitivity. UK LVIA guidance for renewable energy developments highlights the need to assess potential effects on scenic character, visual amenity, and recreational value near nationally designated landscapes. Therefore, any practical FPV deployment at Killington would require a detailed visual impact assessment, stakeholder engagement, and planning evaluation [146].
The FPV modeling was developed using available site data, PVsyst simulations, and literature-supported assumptions for albedo, thermal behavior, soiling, bifacial rear-side gain, and evaporation reduction. Sensitivity analysis was included for key parameters and supports the robustness of the main technical trends. Nevertheless, long-term UK operational data for reservoir-based FPV remain limited, particularly for bifacial modules over inland water bodies. Future work should use measured UK FPV performance data to refine these assumptions and validate simulated outputs.
The HOMER Pro model was used to assess annual energy balance, direct FPV supply, hydrogen production, storage, and reconversion. Annual electricity demand was scaled using UK-specific ONS/sub-national electricity consumption data, so the total demand values are representative of Kendal and Penzance. However, the hourly and monthly demand distribution was based on the HOMER residential library profile rather than measured UK smart-meter data. Comparison with Elexon domestic profile classes and DESNZ off-gas-grid statistics indicates that the adopted profile is a reasonable mixed-community approximation, but the exact seasonal and hourly demand pattern remains uncertain. This uncertainty does not invalidate the direct supply results in Table 11, but it affects the precision of the direct FPV coverage percentages, which depend on the timing overlap between FPV generation and residential demand. Therefore, Table 11 should be interpreted as an indicative demand-matching result under the adopted HOMER load profile, not as a fully UK smart-meter-calibrated estimate. Annual FPV generation, hydrogen production, heating, and transport results are unaffected by the load profile’s shape. HOMER also uses fixed component efficiencies and does not model transient electrolyzer operation, part-load performance, degradation, start-up and shutdown behavior, converter dynamics, or detailed balance-of-plant losses. Future work should use measured UK smart-meter demand profiles, dynamic PEM electrolyzer models, and control-oriented energy management, as recommended by Majumdar et al. [69] for PEM electrolyzers under variable renewable operation and demonstrated by Wang et al. [68], for electric–hydrogen microgrids.
The hydrogen end-use pathways were assessed as alternative applications of the same annual hydrogen production. Electricity reconversion, domestic heating, and transport were therefore evaluated separately rather than simultaneously. Future research should optimize hydrogen allocation across electricity, heat, transport, storage, and grid-support services according to demand timing, cost, emissions reduction, and system flexibility.
The evaporation-saving estimates indicate an additional water-conservation benefit from FPV coverage, but the calculations use simplified empirical relationships and constant reduction factors. More detailed hydrological and ecological modeling would help assess seasonal effects on evaporation, water quality, thermal stratification, aquatic ecosystems, and reservoir management.
Finally, this study focuses on two reservoir case studies representing contrasting UK climatic conditions. Wider conclusions for national deployment would require analysis of a larger UK reservoir dataset, supported by higher-resolution climatic data, techno-economic modeling, lifecycle assessment, grid-connection analysis, planning evaluation, and environmental impact assessment.


5. Conclusions

This study assessed the potential of green hydrogen integrated FPV systems to support UK decarbonization targets. Through modeling two different reservoir sites, it evaluated the capacity of FPV-generated electricity to meet local domestic electricity demand and the feasibility of using surplus solar generation to produce green hydrogen for domestic electricity, heating, and transport. Key conclusions from each modeled scenario are summarized below.
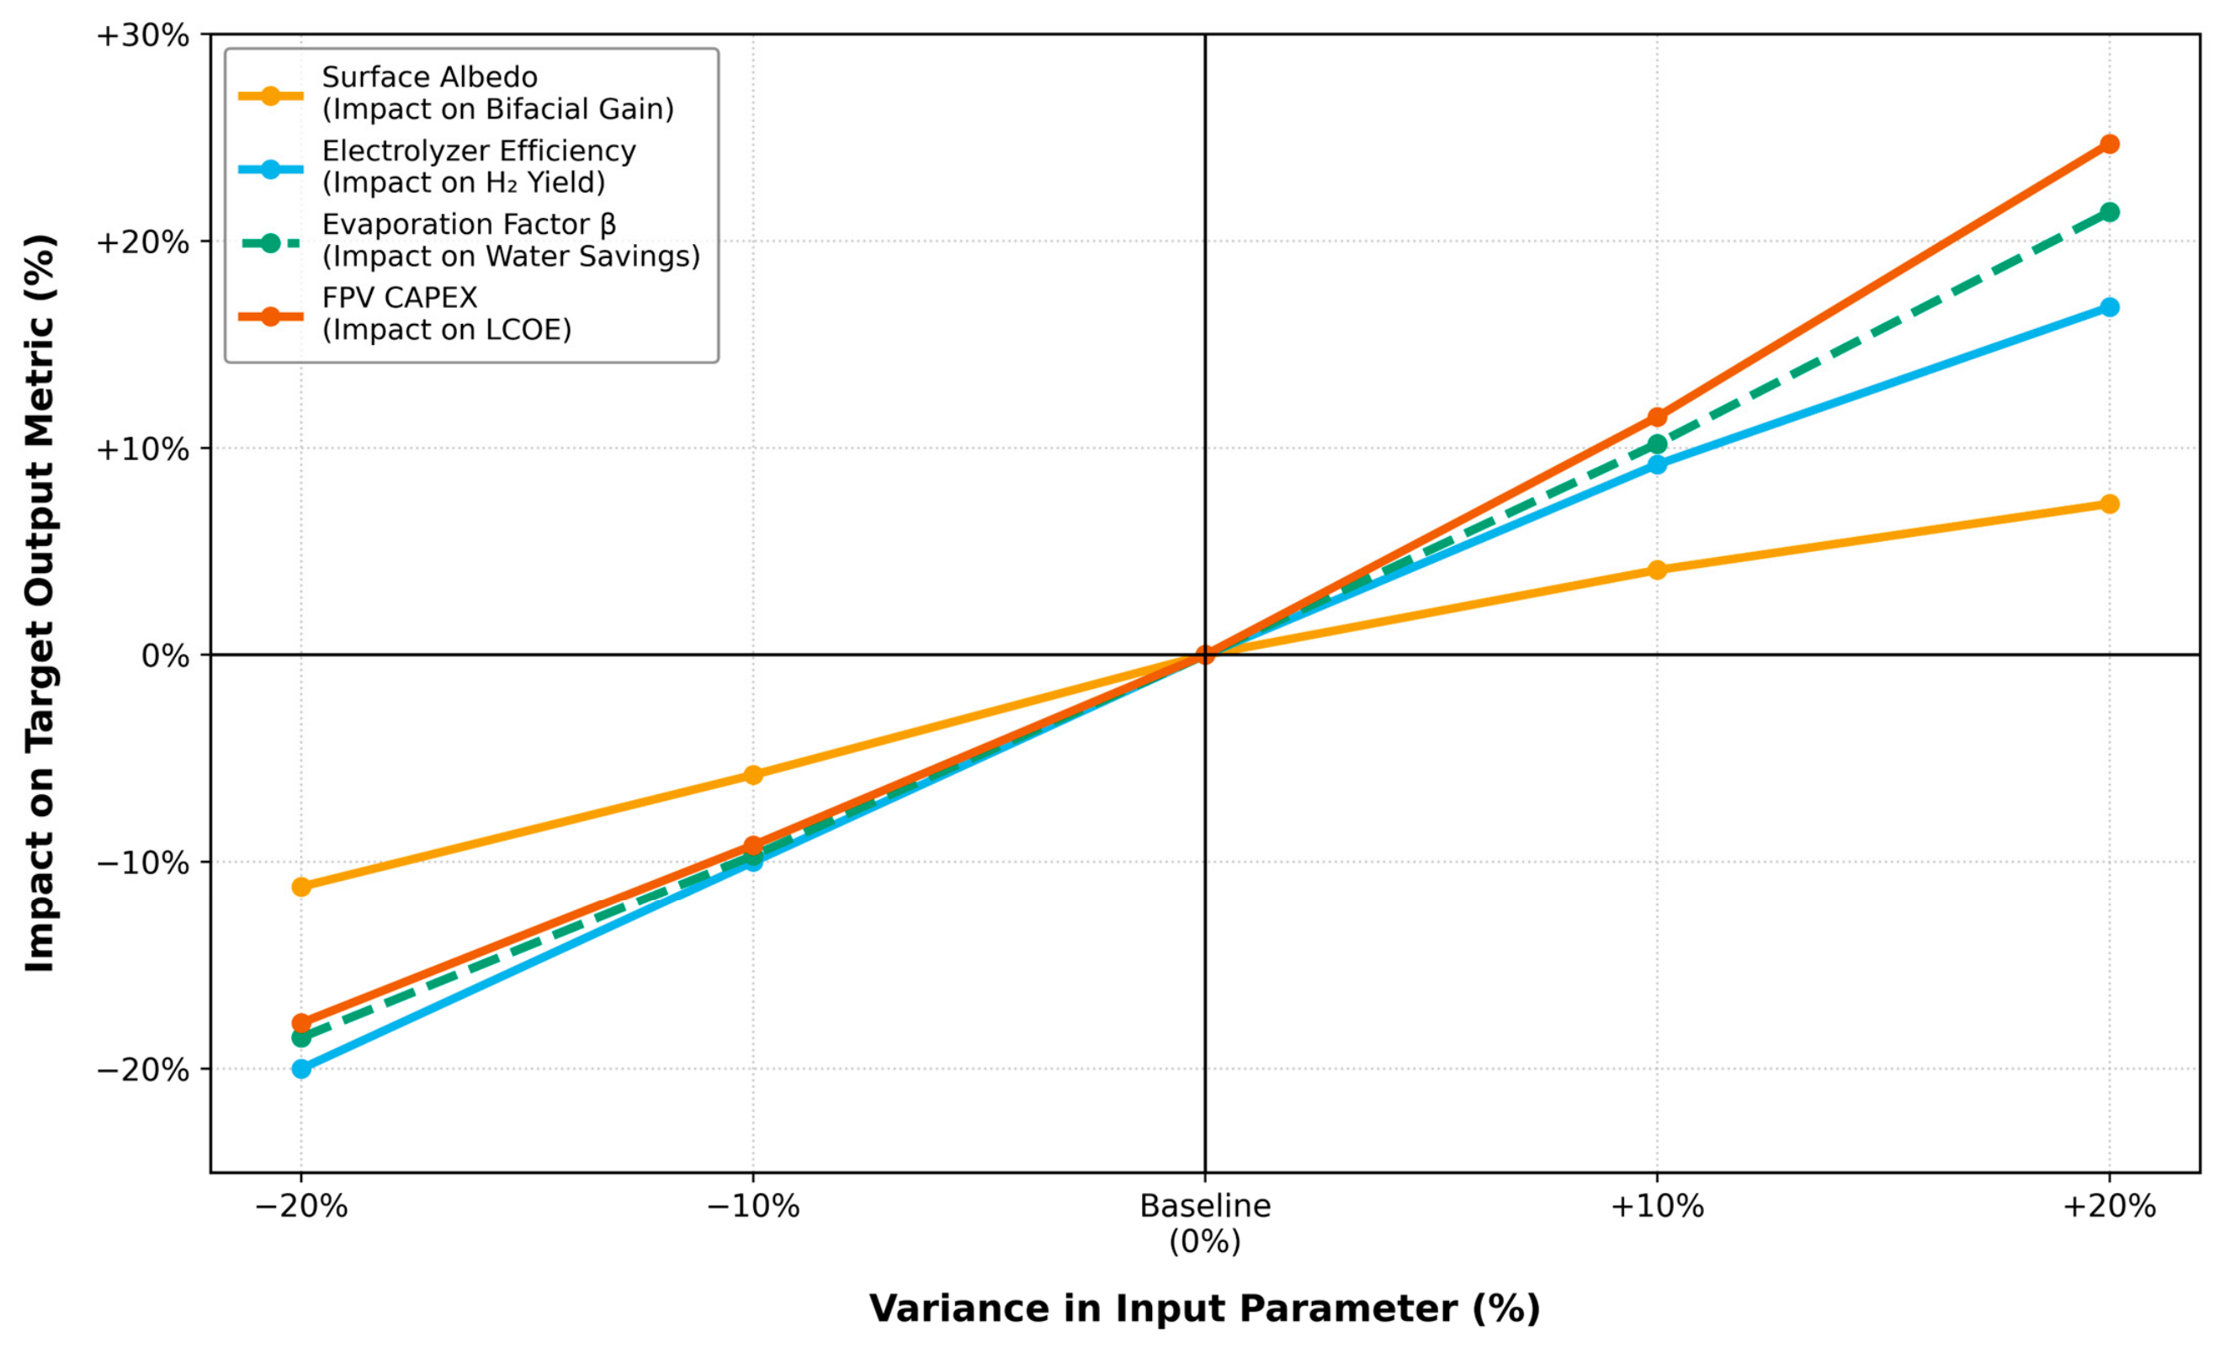
  • Direct FPV Electricity Supply
FPV systems at Killington and Drift reservoirs annually produced over 64 GWh and 20 GWh, respectively. However, temporal mismatches between PV generation and domestic demand limit the direct decarbonization potential.
  • Hydrogen Integrated Electricity Supply
Integrating hydrogen storage increased the share of electricity demand met by renewables at both sites, reducing reliance on the National Grid across all modeled scenarios.
  • Hydrogen for Domestic Heating
Green hydrogen generated from surplus solar energy could deliver up to 25 GWh of thermal energy annually at Killington and 5.5 GWh at Drift when used in high-efficiency hydrogen-compatible boilers.
  • Hydrogen for Domestic Transport
Surplus hydrogen from Killington could enable over 1 million km of hydrogen-powered travel annually, and over 400,000 km from Drift, saving approximately 1475–3850 tons of CO2 over a 25-year lifetime compared to petrol and diesel cars.
  • Evaporation Reduction
Utility-scale FPV deployment could reduce annual evaporation by 1,960,000 m3 at Killington and 452,000 m3 at Drift due to surface water coverage.
This study provides a site-specific, multi-sector assessment of FPV–hydrogen integration in the UK, addressing a gap in the current literature which is largely dominated by non-UK case studies. Quantifying energy output, hydrogen yield, and multi-sector applications, it indicates that hydrogen integrated FPV in the UK has promising technical potential as a reservoir-based, multi-sector energy-system configuration and may offer meaningful environmental co-benefits under idealized deployment conditions.

Author Contributions

Methodology, M.A.-M., S.N.H. and A.G.; software, M.A.-M., S.N.H. and A.G.; validation, M.A.-M., S.N.H. and A.G.; formal analysis, M.A.-M. and L.M.; investigation, M.A.-M., S.N.H. and A.G.; data curation, M.A.-M. and A.G.; writing—original draft preparation, M.A.-M., L.M. and A.G.; writing—review and editing, L.M., S.N.H., Z.Z., Z.J.C. and A.G.; visualization, M.A.-M.; L.M., S.N.H., Z.Z., Z.J.C. and A.G. conceptualization, A.G.; supervision, A.G.; project administration, Z.Z., Z.J.C. and A.G.; funding acquisition, Z.Z., Z.J.C. and A.G. All authors have read and agreed to the published version of the manuscript.

Funding

This research was funded by UK Research and Innovation (UKRI) through the SeaHIVE project (grant number UKRI4359). The funders had no role in the design of the study; in the collection, analyses, or interpretation of data; in the writing of the manuscript; or in the decision to publish the results.

Data Availability Statement

Data is available upon request.

Acknowledgments

The authors acknowledge the support of the SeaHIVE project and the University of Exeter for providing access to PVsyst and HOMER Pro software.

Conflicts of Interest

The authors declare no conflicts of interest.

Abbreviations

The following abbreviations are used in this manuscript:
FPVFloating photovoltaic
PVPhotovoltaic
LPVLand-based photovoltaic
PEMProton exchange membrane
HDPEHigh-density polyethylene
GHIGlobal horizontal irradiance
TMYTypical meteorological year
LCOELevelized cost of electricity
HOMERHybrid Optimization of Multiple Energy Resources
DCDirect current
ACAlternating current

References

  1. Woolway, R.I.; Zhao, G.; Rocha, S.M.G.; Thackeray, S.J.; Armstrong, A. Decarbonization Potential of Floating Solar Photovoltaics on Lakes Worldwide. Nat. Water 2024, 2, 566–576. [Google Scholar] [CrossRef]
  2. Ghosh, A. A Comprehensive Review of Water Based PV: Flotavoltaics, Under Water, Offshore & Canal Top. Ocean Eng. 2023, 281, 115044. [Google Scholar] [CrossRef]
  3. Ramanan, C.J.; Lim, K.H.; Kurnia, J.C.; Roy, S.; Bora, B.J.; Medhi, B.J. Towards Sustainable Power Generation: Recent Advancements in Floating Photovoltaic Technologies. Renew. Sustain. Energy Rev. 2024, 194, 114322. [Google Scholar] [CrossRef]
  4. Trapani, K.; Redón Santafé, M. A Review of Floating Photovoltaic Installations: 2007–2013. Prog. Photovolt. Res. Appl. 2014, 23, 524–532. [Google Scholar] [CrossRef]
  5. Al Saadi, K.; Ghosh, A. Investigating the Integration of Floating Photovoltaics (FPV) Technology With Hydrogen (H2) Energy for Electricity Production for Domestic Application in Oman. Int. J. Hydrogen Energy 2024, 80, 1151–1163. [Google Scholar] [CrossRef]
  6. Nagananthini, R.; Nagavinothini, R.; Balamurugan, P. Floating Photovoltaic Thin Film Technology—A Review. In Smart Innovation, Systems and Technologies; Springer Science and Business Media Deutschland GmbH: Berlin/Heidelberg, Germany, 2020; pp. 329–338. [Google Scholar]
  7. Friel, D.; Karimirad, M.; Whittaker, T.; Doran, W.J.; Howlin, E. A Review of Floating Photovoltaic Design Concepts and Installed Variations. In Proceedings of the 4th International Conference on Offshore Renewable Energy (CORE2019); ASRANet Ltd.: Glasgow, UK, 2019. [Google Scholar]
  8. Acharya, M.; Devraj, S. Floating Solar Photovoltaic (FSPV): A Third Pillar to Solar PV Sector? The Energy and Resources Institute (TERI): New Delhi, India, 2019. [Google Scholar]
  9. Gurfude, S.S.; Kulkarni, P.S. Energy Yield of Tracking Type Floating Solar PV Plant. In Proceedings of the National Power Electronics Conference (NPEC); IEEE: New York, NY, USA, 2019; pp. 1–6. [Google Scholar]
  10. Essak, L.; Ghosh, A. Floating Photovoltaics: A Review. Clean Technol. 2022, 4, 752–769. [Google Scholar] [CrossRef]
  11. Gasparin, F.P.; Kipper, F.D.; De Oliveira, F.S.; Krenzinger, A. Assessment on the Variation of Temperature Coefficients of Photovoltaic Modules With Solar Irradiance. Sol. Energy 2022, 244, 126–133. [Google Scholar] [CrossRef]
  12. Lovering, J.; Swain, M.; Blomqvist, L.; Hernandez, R.R. Land-Use Intensity of Electricity Production and Tomorrow’s Energy Landscape. PLoS ONE 2022, 17, e0270155. [Google Scholar] [CrossRef] [PubMed]
  13. Department for Environment, Food & Rural Affairs. Drinking Water Quality in England, 2017 to 2019; GOV.UK: London, UK, 2021.
  14. Environment Agency. Meeting Our Water Needs for the Next 25 Years; GOV.UK: London, UK, 2024. [Google Scholar]
  15. Mittal, D.; Saxena, B.K.; Rao, K.V.S. Potential of Floating Photovoltaic System for Energy Generation and Reduction of Water Evaporation at Four Different Lakes in Rajasthan. In Proceedings of the 2017 International Conference on Smart Technologies for Smart Nation (SmartTechCon); IEEE: New York, NY, USA, 2017. [Google Scholar]
  16. Tsanakas, I.; Selj, J.; Wieland, S. Floating Photovoltaic Power Plants: A Review of Energy Yield, Reliability, and Maintenance; IEA Photovoltaic Power Systems Programme (IEA-PVPS): Paris, France, 2025. [Google Scholar]
  17. Heynes, G. China’s CHN Energy Completes World’s Largest Open Sea Floating Solar PV Project. PVTECH, 14 November 2024.
  18. Global Energy Monitor. Saemangeum Floating Solar Farm. Available online: https://www.gem.wiki/Saemangeum_Floating_solar_farm (accessed on 15 June 2026).
  19. Global Green Growth Institute (GGGI). The 600MW Omkareshwar Dam Floating Solar Project; Global Green Growth Institute: Seoul, Republic of Korea, 2022. [Google Scholar]
  20. Kgi-Admin. Power Plant Profile: Pantabangan Floating Solar Power Project, Philippines. Power Technology, 9 November 2023.
  21. Maksumic, Z. One of Taiwan’s Largest Near-Shore Floating Solar Projects Completes. Offshore Energy, 22 February 2024.
  22. Verdict Media Power Plant Profile. Huaneng Dezhou Dingzhuang Reservoir Solar PV Park, China. Power Technology, 20 April 2023.
  23. Power Technology. Power Plant Profile: NTPC Ramagundam Floating Solar PV Park, India. Available online: https://www.power-technology.com/data-insights/power-plant-profile-ntpc-ramagundam-floating-solar-pv-park-india/ (accessed on 15 June 2026).
  24. Kemp, Y. Kenya: Floating Solar Energy Plant to Be Built in Hydropower Rich Seven Forks. SINOWARE, 22 July 2024.
  25. Global Energy Monitor. *Hapch’On Reservoir Solar Farm*. Available online: https://www.gem.wiki/Hapch%27On_Reservoir_solar_farm (accessed on 15 June 2026).
  26. Ross, K.M. ABP Submits Planning Permission for UK’s Largest Floating Solar Project. Solar Power Portal, 10 March 2025.
  27. Lightsource bp. *Queen Elizabeth II Reservoir Solar*. Available online: https://lightsourcebp.com/project/queen-elizabeth-ii-reservoir-solar/ (accessed on 15 June 2026).
  28. Bui Power Authority. *Bui Power Authority Leads the Way for Floating Solar Installation in the West African Sub-Region*. 26 July 2023. Available online: https://buipower.com/bui-power-authority-leads-the-way-for-floating-solar-installation-in-the-west-african-sub-region/ (accessed on 15 June 2026).
  29. International Energy Agency. The Future of Hydrogen; IEA: Mumbai, India, 2019. [Google Scholar]
  30. Baker, J.; Guler, M.; Medonna, A.; Li, Z.; Ghosh, A. Analysis of Large-Scale (1GW) off-Grid Agrivoltaic Solar Farm for Hydrogen-Powered Fuel Cell Electric Vehicle (HFCEV) Charging Station. Energy Convers. Manag. 2025, 323, 119184. [Google Scholar] [CrossRef]
  31. Wang, Y.; Pang, Y.; Xu, H.; Martinez, A.; Chen, K.S. PEM Fuel Cell and Electrolysis Cell Technologies and Hydrogen Infrastructure Development—A Review. Energy Environ. Sci. 2022, 15, 2288–2328. [Google Scholar] [CrossRef]
  32. Sikiru, S.; Olutoki, J.O.; Alomayri, T.; Soleimani, H. Integrating Hydrogen into Modern Power Grids: Infrastructure Requirements and Techno-Economic Perspectives. Int. J. Hydrogen Energy 2026, 228, 154511. [Google Scholar] [CrossRef]
  33. Al-Mandhari, M.; Ghosh, A. Modelling Solar Intermittency Effects on PEM Electrolyser Performance & Degradation: A Comparison of Oman and UK. Energies 2025, 18, 6131. [Google Scholar] [CrossRef]
  34. Al-Mandhari, M.; Cowdall, O.; Ghosh, A. Challenges and Advancements in Direct Solar PV to Water Electrolyser Technology for Hydrogen Production. Sustainability 2026, 18, 2089. [Google Scholar] [CrossRef]
  35. Hussain, S.N.; Ghosh, A. Techno-Economic Evaluation of a Floating Photovoltaic-Powered Green Hydrogen for FCEV for Different Köppen Climates. Hydrogen 2025, 6, 73. [Google Scholar] [CrossRef]
  36. Hasan, M.d.S.; Jawad, A. Clean Hydrogen Production From Floating Photovoltaics: A Case Study in Dhanmondi Lake, Dhaka. In Proceedings of the 2021 9th IEEE International Conference on Power Systems (ICPS), Cox’s Bazar, Bangladesh, 13–15 December 2023; pp. 1–6. [Google Scholar]
  37. Koca, K. Compensating Energy Demand of Public Transport and Yielding Green Hydrogen With Floating Photovoltaic Power Plant. Process Saf. Environ. Prot. 2024, 186, 1097–1105. [Google Scholar] [CrossRef]
  38. Temiz, M.; Javani, N. Design and Analysis of a Combined Floating Photovoltaic System for Electricity and Hydrogen Production. Int. J. Hydrogen Energy 2019, 45, 3457–3469. [Google Scholar] [CrossRef]
  39. Temiz, M.; Dincer, I. Development of Solar and Wind Based Hydrogen Energy Systems for Sustainable Communities. Energy Convers. Manag. 2022, 269, 116090. [Google Scholar] [CrossRef]
  40. Soltani, S.R.K.; Mostafaeipour, A.; Mishra, P.; Alidoost, S.; Jahangiri, M.; Abrisham Kar, M. Green Hydrogen Production and Prediction Using Floating Photovoltaic Panels on Wastewater Ponds. Renew. Energy 2025, 243, 122554. [Google Scholar] [CrossRef]
  41. Migliari, L.; Micheletto, D.; Marchionni, M.; Cocco, D. Integration of Floating Photovoltaics and Pumped Hydro Energy Storage With Water Electrolysis for Combined Power and Hydrogen Generation. J. Phys. Conf. Ser. 2024, 2893, 012007. [Google Scholar] [CrossRef]
  42. Sikora, M.; Kochanowski, D. Potentials of Green Hydrogen Production in P2G Systems Based on FPV Installations Deployed on Pit Lakes in Former Mining Sites by 2050 in Poland. Energies 2024, 17, 4660. [Google Scholar] [CrossRef]
  43. Rehman, S.; Menesy, A.S.; Zayed, M.E.; Zaery, M.; Al-Shaikhi, A.; Mohandes, M.A.; Irshad, K.; Kassas, M.; Abido, M.A. Synergistic Sizing and Energy Management Strategy of Combined Offshore Wind With Solar Floating PV System for Green Hydrogen and Electricity Co-Production Using Multi-Objective Dung Beetle Optimization. Results Eng. 2025, 25, 104399. [Google Scholar] [CrossRef]
  44. Güllü, E.; Mert, B.D.; Nazligul, H.; Demirdelen, T.; Gurdal, Y. Experimental and Theoretical Study: Design and Implementation of a Floating Photovoltaic System for Hydrogen Production. Int. J. Energy Res. 2021, 46, 5083–5098. [Google Scholar] [CrossRef]
  45. Guven, D. Assessing the Environmental and Economic Viability of Floating PV-Powered Green Hydrogen: A Case Study on Inland Ferry Operations in Türkiye. Appl. Energy 2024, 377, 124768. [Google Scholar] [CrossRef]
  46. Stewart, I.; Burnett, N.; Hewitt, T. The UK’s Plans and Progress to Reach Net Zero by 2050; House of Commons Library Research Briefing CBP-9888; House of Commons Library: London, UK, 2026; Available online: https://commonslibrary.parliament.uk/research-briefings/cbp-9888/ (accessed on 15 June 2026).
  47. Energy Consumption in the UK (ECUK). 2025. Available online: https://www.gov.uk/government/statistics/energy-consumption-in-the-uk-2025/energy-consumption-in-the-uk-ecuk-2025 (accessed on 14 April 2026).
  48. IEA Bioenergy. Trends of Bioenergy in the Member Countries of IEA Bioenergy: Country Reports—2024 Update; IEA Bioenergy: Paris, France, 2025; Available online: https://www.ieabioenergy.com/blog/publications/trends-of-bioenergy-in-the-member-countries-of-iea-bioenergy-country-reports-2024-update/ (accessed on 15 June 2026).
  49. Hutton, G.; Lewis, S.; Rankl, F. Planning for Solar Farms; House of Commons Library: London, UK, 2025; Available online: https://commonslibrary.parliament.uk/research-briefings/cbp-7434/ (accessed on 15 June 2026).
  50. SunSave. UK Electricity Consumption: Is It Increasing? 2026. Available online: https://www.sunsave.energy/solar-panels-advice/solar-energy/uk-electricity-consumption (accessed on 14 April 2026).
  51. UK Electricity Consumption. 2024. Available online: https://www.statista.com/statistics/322874/electricity-consumption-from-all-electricity-suppliers-in-the-united-kingdom/ (accessed on 14 April 2026).
  52. Department for Energy Security and Net Zero. UK Hydrogen Strategy; GOV.UK: London, UK, 2024.
  53. EDFEnergy. UK Gas Boiler Ban—Everything You Need to Know. Available online: https://www.edfenergy.com/heating/advice/uk-boiler-ban (accessed on 15 June 2026).
  54. Department for Energy Security & Net Zero. Decarbonising Home Heating; National Audit Office: London, UK, 2024.
  55. British Gas. How Might Hydrogen Help Heat Our Homes? Available online: https://www.britishgas.co.uk/the-source/greener-living/hydrogen-heating.html (accessed on 15 June 2026).
  56. Cadent. First UK Trial of Hydrogen Blended Gas Hailed a Success. Available online: https://cadentgas.com/news/september-2021/hydrogen-blended-gas-trial-hailed-a-success (accessed on 15 June 2026).
  57. Department for Transport. Phasing out the Sale of New Petrol and Diesel Cars from 2030 and Support for Zero Emission Vehicle (ZEV) Transition; GOV.UK: London, UK, 2025.
  58. Wilkinson, S. Hydrogen Cars: Are Hydrogen Fuel-Cell Cars the Future? Available online: https://www.drivingelectric.com/hydrogen-cars/183/hydrogen-cars-are-hydrogen-fuel-cell-cars-future (accessed on 15 June 2026).
  59. RAC. Hydrogen Cars: Are They the Future? Available online: https://www.rac.co.uk/drive/advice/buying-and-selling-guides/hydrogen-cars/ (accessed on 15 June 2026).
  60. Worldometer. European Countries by Population. Available online: https://www.worldometers.info/population/countries-in-europe-by-population/ (accessed on 15 June 2026).
  61. Solar Roadmap. Available online: https://www.gov.uk/government/publications/solar-roadmap (accessed on 14 April 2026).
  62. Baker, J.; Ghosh, A. Investigation of Fixed and East-West, North-South, and Azimuthal Single-Axis Tracking for Floating Photovoltaics (Floatovoltaics) in the UK. Energy 360 2026, 5, 100052. [Google Scholar] [CrossRef]
  63. Li, A.; Ghosh, A. Analysis of Floating Photovoltaics Potential in Hong Kong: Green Hydrogen Production and Energy Application. Int. J. Hydrogen Energy 2025, 181, 151567. [Google Scholar] [CrossRef]
  64. Intwala, M.H.; Ghosh, A. Investigation of Thermo-Electric Performance of Bifacial and Monofacial Floating Photovoltaics (FPV) System in Temperate Climate (UK). Sol. Energy 2025, 288, 113245. [Google Scholar] [CrossRef]
  65. Araimi, M.A.; Mandhari, M.A.; Ghosh, A. Comparative Analysis of Bifacial and Monofacial FPV System in the UK. Sol. Compass 2025, 13, 100106. [Google Scholar] [CrossRef]
  66. Exley, G.; Page, T.; Olsson, F.; Thackeray, S.J.; Chipps, M.J.; Armstrong, A.; Folkard, A.M. Modelling of the Potential of Floating Photovoltaics for Mitigating Climate Change Impacts on Reservoirs. Knowl. Manag. Aquat. Ecosyst. 2025, 26, 426. [Google Scholar] [CrossRef]
  67. Huang, L.; Elzaabalawy, H.; Sarhaan, M.; Sherif, A.; Ding, H.; Ou, B.; Yang, D.; Cerik, B.C. Developing Reliable Floating Solar Systems on Seas: A Review. Ocean Eng. 2025, 322, 120525. [Google Scholar] [CrossRef]
  68. Wang, Z.; Fan, F.; Zhang, H.; Song, K.; Jiang, J.; Sun, C.; Xue, R.; Zhang, J.; Chen, Z. Flexible On-Grid and Off-Grid Control for Electric–Hydrogen Coupling Microgrids. Energies 2025, 18, 985. [Google Scholar] [CrossRef]
  69. Majumdar, A.; Haas, M.; Elliot, I.; Nazari, S. Control and Control-Oriented Modeling of PEM Water Electrolyzers: A Review. Int. J. Hydrogen Energy 2023, 48, 30621–30641. [Google Scholar] [CrossRef]
  70. Solargis. Solar Resource Maps & GIS Data for 200+ Countries. Available online: https://solargis.com/resources/free-maps-and-gis-data (accessed on 15 June 2026).
  71. Solarplaza. Top 70 Floating Solar PV Plants. Available online: https://www.solarplaza.com/resource/11761/top-70-floating-solar-pv-plants/ (accessed on 15 June 2026).
  72. Bai, B.; Xiong, S.; Ma, X.; Liao, X. Assessment of Floating Solar Photovoltaic Potential in China. Renew. Energy 2023, 220, 119572. [Google Scholar] [CrossRef]
  73. Spencer, R.S.; Macknick, J.; Aznar, A.; Warren, A.; Reese, M.O. Floating Photovoltaic Systems: Assessing the Technical Potential of Photovoltaic Systems on Man-Made Water Bodies in the Continental United States. Environ. Sci. Technol. 2018, 53, 1680–1689. [Google Scholar] [CrossRef] [PubMed]
  74. UK Centre for Ecology & Hydrology. UK Lakes Portal. Available online: https://uklakes.ceh.ac.uk/ (accessed on 15 June 2026).
  75. Natural England. Natural England Open Data Geoportal. Available online: https://naturalengland-defra.opendata.arcgis.com/ (accessed on 15 June 2026).
  76. Cumbria County History Trust. Killington. Available online: https://www.cumbriacountyhistory.org.uk/township/killington (accessed on 15 June 2026).
  77. Old Cumbria Gazetteer. Killington Reservoir, Killington. Available online: https://www.lakesguides.co.uk/html/lgaz/lk06383.htm (accessed on 15 June 2026).
  78. Kernow Skies. Premium Drone Photography in Cornwall. Available online: https://kernowskies.com/ (accessed on 15 June 2026).
  79. Rockey, C.; Coombs, M. Drift Water Treatment Works; South West Water: Exeter, UK, 2012; Available online: https://waterprojectsonline.com/wp-content/uploads/case_studies/2012/Drift-WTW-2012.pdf (accessed on 15 June 2026).
  80. Cornwall Birds (CBWPS). Drift Reservoir. Available online: https://cbwps.org.uk/about/our-reserves/drift-reservoir/ (accessed on 15 June 2026).
  81. Environment Agency. Killington Reservoir Water Body—Catchment Data Explorer. Available online: https://environment.data.gov.uk/catchment-planning/WaterBody/GB31229430 (accessed on 15 June 2026).
  82. Environment Agency. Drift Reservoir Water Body—Catchment Data Explorer. Available online: https://environment.data.gov.uk/catchment-planning/WaterBody/GB30846547 (accessed on 15 June 2026).
  83. Google Earth. Available online: https://earth.google.com/web (accessed on 14 April 2026).
  84. Census—Office for National Statistics. Available online: https://www.ons.gov.uk/census (accessed on 14 April 2026).
  85. Lake District National Park Authority. Boundary Map for Lake District National Park. Available online: https://www.lakedistrict.gov.uk/caringfor/farming/farming-in-protected-landscapes/boundary-map-for-lake-district-national-park (accessed on 15 June 2026).
  86. Drinking Water Protected Areas (Surface Water)—Data.Gov.UK. Available online: https://www.data.gov.uk/dataset/3d136e9a-78cf-4452-824d-39d715ba5b69/drinking-water-protected-areas-surface-water (accessed on 14 April 2026).
  87. Sanchez, R.G.; Kougias, I.; Moner-Girona, M.; Fahl, F.; Jäger-Waldau, A. Assessment of Floating Solar Photovoltaics Potential in Existing Hydropower Reservoirs in Africa. Renew. Energy 2021, 169, 687–699. [Google Scholar] [CrossRef]
  88. Gadzanku, S.; Beshilas, L.; Grunwald, U. Enabling Floating Solar Photovoltaic (FPV) Deployment: Review of Barriers to FPV Deployment in Southeast Asia; National Renewable Energy Laboratory: Golden, CO, USA, 2021. [Google Scholar]
  89. Department for Business; Energy and Industrial Strategy. Subnational Electricity and Gas Consumption Statistics; GOV.UK: London, UK, 2024.
  90. DNV. DNV-RP-0584; Design, Development and Operation of Floating Solar Photovoltaic Systems. DNV: Arnhem, The Netherlands, 2021. Available online: https://www.dnv.com/energy/standards-guidelines/dnv-rp-0584-design-development-and-operation-of-floating-solar-photovoltaic-systems/ (accessed on 15 June 2026).
  91. Suntech—Photovoltaic Manufacturer. Available online: https://www.suntech-power.com/ (accessed on 14 April 2026).
  92. Floating Solar. Queen Elizabeth II Reservoir. Available online: https://www.frenchrenewableenergy.com/project-details/queen-elizabeth-ii-61 (accessed on 15 June 2026).
  93. Meteonorm. Meteonorm: Global Solar Data. Available online: https://meteonorm.com/ (accessed on 15 June 2026).
  94. Ramasamy, V.; Margolis, R. Floating Photovoltaic System Cost Benchmark: Q1 2021 Installations on Artificial Water Bodies; National Renewable Energy Laboratory: Golden, CO, USA, 2021. [Google Scholar]
  95. ESMAP; SERIS. Where Sun Meets Water: Floating Solar Handbook for Practitioners; World Bank: Washington, DC, USA, 2019. [Google Scholar]
  96. Veiga, A. Ultimate Guide to Utility-Scale PV System Losses; Rated Power: Madrid, Spain, 2022. [Google Scholar]
  97. Nisar, H.; Janjua, A.K.; Hafeez, H.; Shakir, S.; Shahzad, N.; Waqas, A. Thermal and Electrical Performance of Solar Floating PV System Compared to On-Ground PV System: An Experimental Investigation. Sol. Energy 2022, 241, 231–247. [Google Scholar] [CrossRef]
  98. Faiman, D. Assessing the Outdoor Operating Temperature of Photovoltaic Modules. Prog. Photovolt. Res. Appl. 2008, 16, 307–315. [Google Scholar] [CrossRef]
  99. Liu, H.; Krishna, V.; Leung, J.L.; Reindl, T.; Zhao, L. Field Experience and Performance Analysis of Floating PV Technologies in the Tropics. Prog. Photovolt. Res. Appl. 2018, 26, 957–967. [Google Scholar] [CrossRef]
  100. Patel, S.S.; Rix, A.J. Water Surface Albedo Modelling for Floating PV Plants. In Proceedings of the South African Solar Energy Conference (SASEC 2019), Johannesburg, South Africa, 25–27 November 2019. [Google Scholar]
  101. Fernández Solas, Á.; Riedel-Lyngskær, N.; Hanrieder, N.; Norde Santos, F.; Wilbert, S.; Nygard Riise, H.; Polo, J.; Fernández, E.F.; Almonacid, F.; Talavera, D.L.; et al. Photovoltaic Soiling Loss in Europe: Geographical Distribution and Cleaning Recommendations. Renew. Energy 2025, 239, 122086. [Google Scholar] [CrossRef]
  102. BirdGuides. Killington Reservoir Birdwatching Site. Available online: https://www.birdguides.com/sites/europe/britain-ireland/britain/england/cumbria/killington-reservoir/ (accessed on 15 June 2026).
  103. Drift Reservoir Birdwatching Site—BirdGuides. Available online: https://www.birdguides.com/sites/europe/britain-ireland/britain/england/cornwall/drift-reservoir/ (accessed on 14 April 2026).
  104. National Grid Electricity Transmission. Provide a Safe and Reliable Network. Available online: https://www.nationalgrid.com/electricity-transmission/who-we-are/riio-t2-performance/safe-and-reliable-network (accessed on 15 June 2026).
  105. European Commission; Joint Research Centre. Photovoltaic Geographical Information System (PVGIS). Available online: https://joint-research-centre.ec.europa.eu/photovoltaic-geographical-information-system-pvgis_en (accessed on 15 June 2026).
  106. UL Solutions. HOMER Pro—Microgrid Optimization Software. Available online: https://ul-renewables.com/homer/pro (accessed on 15 June 2026).
  107. Load Profiles and Their Use in Electricity Settlement—Elexon Digital BSC. Available online: https://bscdocs.elexon.co.uk/guidance-notes/load-profiles-and-their-use-in-electricity-settlement (accessed on 4 June 2026).
  108. Department for Energy Security and Net Zero. Subnational Electricity and Gas Consumption Summary Report 2024; Department for Energy Security and Net Zero: London, UK, 2025.
  109. Ilse, K.; Micheli, L.; Figgis, B.W.; Lange, K.; Daßler, D.; Hanifi, H.; Wolfertstetter, F.; Naumann, V.; Hagendorf, C.; Gottschalg, R.; et al. Techno-Economic Assessment of Soiling Losses and Mitigation Strategies for Solar Power Generation. Joule 2019, 3, 2303–2321. [Google Scholar] [CrossRef]
  110. Arunachalam, M.; Han, D.S. Efficient Solar-Powered PEM Electrolysis for Sustainable Hydrogen Production: An Integrated Approach. Emergent Mater. 2024, 7, 1401–1415. [Google Scholar] [CrossRef]
  111. Abedin, T.; Pasupuleti, J.; Paw, J.K.S.; Tak, Y.C.; Mahmud, M.; Abdullah, M.P.; Nur-E-Alam, M. Proton Exchange Membrane Fuel Cells in Electric Vehicles: Innovations, Challenges, and Pathways to Sustainability. J. Power Sources 2025, 640, 236769. [Google Scholar] [CrossRef]
  112. Rosenow, J. A Meta-Review of 54 Studies on Hydrogen Heating. Cell Rep. Sustain. 2024, 1, 100010. [Google Scholar] [CrossRef]
  113. Yue, M.; Lambert, H.; Pahon, E.; Roche, R.; Jemei, S.; Hissel, D. Hydrogen Energy Systems: A Critical Review of Technologies, Applications, Trends and Challenges. Renew. Sustain. Energy Rev. 2021, 146, 111180. [Google Scholar] [CrossRef]
  114. Bedi, U. Recent Advances in Fuel Cell Design and Modeling: A Comprehensive Review. Next Energy 2026, 11, 100517. [Google Scholar] [CrossRef]
  115. Hergart, C. Sustainable Transportation. In Engines and Fuels for Future Transport; Kalghatgi, G., Agarwal, A.K., Leach, F., Senecal, K., Eds.; Energy, Environment, and Sustainability; Springer: Singapore, 2022; pp. 7–38. [Google Scholar]
  116. Halder, P.; Babaie, M.; Salek, F.; Shah, K.; Stevanovic, S.; Bodisco, T.A.; Zare, A. Performance, Emissions and Economic Analyses of Hydrogen Fuel Cell Vehicles. Renew. Sustain. Energy Rev. 2024, 199, 114543. [Google Scholar] [CrossRef]
  117. Toyota United Kingdom. Toyota Mirai—Hydrogen Fuel Cell Vehicle. Available online: https://www.toyota.co.uk/new-cars/mirai (accessed on 15 June 2026).
  118. Location-Specific Long-Term Averages. Available online: https://www.metoffice.gov.uk/research/climate/maps-and-data/location-specific-long-term-averages (accessed on 14 April 2026).
  119. Kulat, M.I.; Tosun, K.; Karaveli, A.B.; Yucel, I.; Akinoglu, B.G. A Sound Potential Against Energy Dependency and Climate Change Challenges: Floating Photovoltaics on Water Reservoirs of Turkey. Renew. Energy 2023, 206, 694–709. [Google Scholar] [CrossRef]
  120. Gallego-Elvira, B.; Baille, A.; Martín-Górriz, B.; Martínez-Álvarez, V. Energy Balance and Evaporation Loss of an Agricultural Reservoir in a Semi-arid Climate (South-eastern Spain). Hydrol. Process. 2010, 24, 758–766. [Google Scholar] [CrossRef]
  121. Finch, J.W.; Hall, R.L. Estimation of Open Water Evaporation, A Review of Methods; R&D Technical Report W6-043/TR; Environment Agency: Bristol, UK, 2001. Available online: https://www.scirp.org/reference/referencespapers?referenceid=2342495 (accessed on 14 April 2026).
  122. Greenhouse Gas Reporting: Conversion Factors. 2025. Available online: https://www.gov.uk/government/publications/greenhouse-gas-reporting-conversion-factors-2025 (accessed on 23 May 2026).
  123. Average Gas and Electricity Usage. Ofgem. Available online: https://www.ofgem.gov.uk/average-gas-and-electricity-use-explained (accessed on 14 April 2026).
  124. Yurday, E. Average CO2 Emissions per Car in the UK. Available online: https://www.nimblefins.co.uk/average-co2-emissions-car-uk (accessed on 15 June 2026).
  125. Consumer Council for Water. How Much Water Do You Use? Available online: https://www.ccw.org.uk/save-money-and-water/averagewateruse/ (accessed on 15 June 2026).
  126. Solar Energy UK; Scurlock, J. National Farmers’ Union of England and Wales. In Solar Farms and Agricultural Land; Solar Energy UK: London, UK, 2024. [Google Scholar]
  127. National Trust. Ground Mounted Solar—Renewable Energy Guidance for Development Proposals. Available online: https://national-trust-renewable-energy-guidance.org.uk/ground-mounted-solar/ (accessed on 15 June 2026).
  128. U.S. Department of Energy. Safe Use of Hydrogen. Available online: https://www.energy.gov/cmei/fuels/safe-use-hydrogen (accessed on 15 June 2026).
  129. Gao, L.; Naylor, P.; Hegab, A.; Pilidis, P. ‘Greening’ the UK: A Comparative Study of Heat Pumps and Hydrogen Boilers in Residential Heating. Energies 2025, 19, 156. [Google Scholar] [CrossRef]
  130. Aneggi, E.; Scarbolo, M.; Zuccaccia, D. Meta-Analysis of Hydrogen’s Role in Residential Heat Decarbonization. Hydrogen 2026, 7, 34. [Google Scholar] [CrossRef]
  131. Campíñez-Romero, S.; Colmenar-Santos, A.; Pérez-Molina, C.; Mur-Pérez, F. A Hydrogen Refuelling Stations Infrastructure Deployment for Cities Supported on Fuel Cell Taxi Roll-Out. Energy 2018, 148, 1018–1031. [Google Scholar] [CrossRef]
  132. Zhu, Y.; Niu, S.; Dai, G.; Li, Y.; Wang, L.; Jia, R. Optimal Economic Dispatch of Hydrogen Storage-Based Integrated Energy System with Electricity and Heat. Sustainability 2025, 17, 1974. [Google Scholar] [CrossRef]
  133. Zhang, W.; Sun, C.; Wang, Y.; Song, K. A Novel Voltage-Power Coordinated Control Strategy for Grid-Connected Inverters in Low-Voltage Microgrids Based on Fast Non-Singular Terminal Sliding Mode. Electr. Power Syst. Res. 2026, 251, 112183. [Google Scholar] [CrossRef]
  134. Boscaino, V.; Ditta, V.; Marsala, G.; Panzavecchia, N.; Tinè, G.; Cosentino, V.; Cataliotti, A.; Di Cara, D. Grid-Connected Photovoltaic Inverters: Grid Codes, Topologies and Control Techniques. Renew. Sustain. Energy Rev. 2024, 189, 113903. [Google Scholar] [CrossRef]
  135. Niccolai, A.; Gandelli, A.; Grimaccia, F.; Leva, S.; Zich, R. A Review of Floating PV Systems with a Techno-Economic Analysis. Energies 2024, 17, 359. [Google Scholar] [CrossRef]
  136. Electrolyser Cost|European Hydrogen Observatory. Available online: https://observatory.clean-hydrogen.europa.eu/hydrogen-landscape/production-trade-and-cost/electrolyser-cost (accessed on 23 May 2026).
  137. Global Hydrogen Review 2024—Analysis. Available online: https://www.iea.org/reports/global-hydrogen-review-2024 (accessed on 23 May 2026).
  138. Gagliardi, G.G.; Cosentini, C.; Agati, G.; Borello, D.; Venturini, P. Green Hydrogen Production via Floating Photovoltaic Systems on Irrigation Reservoirs: An Italian Case Study. Renew. Energy 2025, 247, 123040. [Google Scholar] [CrossRef]
  139. Van Der Zwaan, B.; Fattahi, A.; Dalla Longa, F.; Dekker, M.; Van Vuuren, D.; Pietzcker, R.; Rodrigues, R.; Schreyer, F.; Huppmann, D.; Emmerling, J.; et al. Electricity- and Hydrogen-Driven Energy System Sector-Coupling in Net-Zero CO2 Emission Pathways. Nat. Commun. 2025, 16, 1368. [Google Scholar] [CrossRef] [PubMed]
  140. Hassan, M. Artificial Intelligence Powered Intelligent Energy Management Framework for Hydrogen Storage and Dispatch in Smart Microgrids. Sci. Rep. 2025, 15, 40394. [Google Scholar] [CrossRef] [PubMed]
  141. Štogl, O.; Miltner, M.; Zanocco, C.; Traverso, M.; Starý, O. Electric Vehicles as Facilitators of Grid Stability and Flexibility: A Multidisciplinary Overview. WIREs Energy Environ. 2024, 13, e536. [Google Scholar] [CrossRef]
  142. Jacobson, M.Z. Batteries or Hydrogen or Both for Grid Electricity Storage upon Full Electrification of 145 Countries with Wind-Water-Solar? iScience 2024, 27, 108988. [Google Scholar] [CrossRef] [PubMed]
  143. Zhou, J.; Fan, F.; Ye, X.; Wang, Z.; Xu, J.; Zhang, H.; Jiang, J.; Xue, R.; Sun, C.; Song, K.; et al. Power-to-Hydrogen-Ammonia Coordination and Planning for Integrated Energy Systems with Ammonia Co-Firing and Waste Heat Recovery. Appl. Energy 2026, 406, 127258. [Google Scholar] [CrossRef]
  144. Tu, N.; Yang, J.; Yan, X.; Fan, Z. Optimized Scheduling of Integrated Energy Systems: A Multi-Dimensional Electricity, Hydrogen, Ammonia, Heat Synergy Approach Using the LSDBO-WOA Algorithm. Sci. Rep. 2026, 16, 13130. [Google Scholar] [CrossRef] [PubMed]
  145. Environment Agency. Biennial Report on Reservoir Safety: 1 January 2021 to 31 December 2022. Available online: https://www.gov.uk/government/publications/reservoir-safety-biennial-report/biennial-report-on-reservoir-safety-1-january-2021-to-31-december-2022 (accessed on 15 June 2026).
  146. Davies, K.; King, I.; Jewitt, L. South Gloucestershire Council Landscape Sensitivity Assessment: Solar PV and Wind Energy Development; South Gloucestershire Council: Bristol, UK, 2021. [Google Scholar]
Figure 1. Global growth of installed FPV capacity [17]. Each column and the given values represent the total global installed capacity at the end of the year.
Energies 19 02931 g001
Figure 2. An overview of the study’s methodology.
Energies 19 02931 g002
Figure 3. Average daily global horizontal irradiance across the United Kingdom, showing the selected FPV case-study sites at Killington Reservoir and Drift Reservoir. The map highlights the contrast between the lower-irradiance Northwest region and the higher-irradiance Southwest region used for site comparison. [70].
Energies 19 02931 g003
Figure 4. (a) Geographical overview of Killington reservoir and Kendal. (b) Geographical overview of Drift reservoir and Penzance [77,78].
Energies 19 02931 g004
Figure 5. (a) Hourly load profiles, (b) monthly load profiles of Kendal and Penzance.
Energies 19 02931 g005
Figure 6. Schematic of the direct electrical supply system. FPV-generated DC electricity is converted to AC and supplied to the residential electrical load, while the National Grid provides backup electricity during periods when residential demand exceeds FPV output. Dashed arrows indicate electricity flow.
Energies 19 02931 g006
Figure 7. Schematic of the hydrogen-integrated electrical supply system. Surplus FPV electricity is converted into hydrogen by a PEM electrolyser, stored in an H2 tank, and later reconverted to electricity through a fuel cell to support the residential load. Grid electricity provides backup supply when required. Dashed arrows indicate energy-flow pathways.
Energies 19 02931 g007
Figure 8. Schematic of the hydrogen-to-heat system. Surplus FPV electricity is converted into hydrogen, stored in an H2 tank, and supplied to a hydrogen boiler to meet residential thermal demand. The lower pathway represents direct FPV electricity supply to the residential load, with grid backup when required. Dashed arrows indicate energy-flow pathways.
Energies 19 02931 g008
Figure 9. Schematic of the hydrogen-to-transport system. Surplus FPV electricity is converted into hydrogen by a PEM electrolyser and stored in an H2 tank before being supplied to hydrogen-powered vehicles. The lower pathway represents direct FPV electricity supply to the residential load, with grid backup when required. Dashed arrows indicate energy-flow pathways.
Energies 19 02931 g009
Figure 10. Monthly electricity generation from floating photovoltaic (FPV) systems at (a) Killington reservoir and (b) Drift reservoir.
Energies 19 02931 g010
Figure 11. Monthly hydrogen generation from surplus electricity at (a) Killington reservoir and (b) Drift reservoir.
Energies 19 02931 g011
Figure 12. Electricity delivered by the hydrogen fuel cell for (a) Killington monofacial, (b) Killington bifacial, (c) Drift monofacial, and (d) Drift bifacial systems.
Energies 19 02931 g012aEnergies 19 02931 g012b
Figure 13. Breakdown of the electricity supply mix for both sites, considering the direct electrical supply and the hydrogen integrated electrical system result.
Energies 19 02931 g013
Figure 14. Electrical and thermal energy delivered by generated green hydrogen at each site.
Energies 19 02931 g014
Figure 15. LCOH sensitivity to installed PEM electrolyzer CAPEX for the FPV–hydrogen system. The figure compares the system LCOH excluding electricity costs with the total LCOH including the FPV electricity cost contribution, electrolyzer CAPEX/OPEX, and hydrogen storage. The base case uses a PEM electrolyzer CAPEX of £2153/kW based on the European Hydrogen Observatory estimate [136], while the shaded benchmark ranges show the UK 2030 green hydrogen target range and current European green hydrogen production costs [52,137].
Energies 19 02931 g015
Figure 16. Sensitivity analysis of key system parameters, showing the influence of variations in albedo, electrolyzer efficiency, evaporation reduction factor (β), and FPV CAPEX on modeled system outputs.
Energies 19 02931 g016
Table 1. Summary of global utility-scale FPV deployment.
TitleLocationStatusCapacityOverviewRef.
Saemangeum Floating Solar ProjectSouth KoreaPlanned1.2 GWOffshore, developed by Hanwha Solutions[18]
Dongying Offshore Floating Solar PlantChinaActive1 GWOffshore, state-owned[17]
Omkareshwar Floating Solar Power ParkIndiaActive600 MWOnshore, developed by Rewa Ultra Mega Solar Limited[19]
Luzon Floating Solar ProjectPhilippinesPlanned524 MWOnshore, developed by Fuego Renewable Energy[20]
Changhua Offshore Floating Solar PlantTaiwanActive440 MWOffshore, developed by Ciel & Terre[21]
Dezhou Dingzhuang Floating Solar PlantChinaActive330 MWOnshore, developed by Huaneng Power International[22]
Ramagundam Floating Solar ProjectIndiaActive100 MWOnshore, developed by NTPC[23]
KenGen Floating Solar Power StationKenyaPlanned42.5 MWOnshore, developed by KenGen and the French Development Agency[24]
Hapcheon Dam Floating Solar PlantSouth KoreaActive41 MWOnshore, developed by Scotra Ltd.[25]
Barrow EnergyDockUKPlanned40 MWOffshore, developed by Green Cat Renewables[26]
Queen Elizabeth II Reservoir Floating Solar FarmUKActive6.3 MWOnshore, developed by Ciel & Terre and United Utilities[27]
Bui Dam Floating Solar ProjectGhanaActive5 MWOnshore, developed by Bui Power Authority[28]
Table 2. Literature review of research on FPV and hydrogen integrated systems.
Ref.DateLocationTechnologiesMethodObjective
[5]2024OmanFPV/hydrogenPVsyst/HOMERTechno-economic analysis of an FPV and hydrogen integrated system to meet 100% of local domestic demand.
[36]2023BangladeshFPV/hydrogenPVsyst/HOMERFeasibility assessment of technical, economic, and environmental concerns of hydrogen integrated FPV systems.
[37]2024TurkeyFPV/hydrogen/low-carbon transportPVsyst/HOMEREvaluate the feasibility of an integrated FPV and hydrogen system to meet community energy demands for travel and electricity.
[38]2020TurkeyFPV/hydrogenPVsyst/HOMERModel and integrated hydrogen storage system with FPV to provide an uninterrupted power supply, prevent reservoir evaporation, and conserve land.
[39]2022CanadaFPV/land-based bifacial PV/hydrogenSAM/PVSyst/EES
Develop and compare hybrid renewable energy systems to meet domestic energy demands.
[40]2025IranFPV/HydrogenPVsyst/HOMER/MATLAB/ANNDevelop a predictive model for green hydrogen production from FPV
[41]2024ItalyFPV/hydrogen/pumped hydroMATLAB R2024aEvaluate a hybrid renewable energy system to enhance grid stability
[42]2024PolandFPV/hydrogen/low-carbon transportGIS and simulation modelingAssess the potential of FPV-produced green hydrogen to decarbonize urban transport.
[43]2025Saudi ArabiaFPV/wind/hydrogenDung Beetle OptimizationOptimize system sizing and energy management of offshore wind and FPV hydrogen production
[44]2022TurkeyFPV/HydrogenExperimental analysisDesign and implement an FPV and alkaline electrolysis system.
[45]2025TurkeyFPV/hydrogen/low-carbon transportLife cycle assessment
GREET 2022 software
Analyze the environmental impacts of an FPV-integrated green hydrogen system
Table 4. Energy consumption of the local populated area.
KendalPenzance
Population29,80012,900
Number of Domestic Dwellings13,6006600
Mean Annual Electricity Demand per Dwelling (kWh)41974840
Estimated Total Electrical Demand (GWh)5732
Table 5. Specification of PV panels [91].
ParameterMonofacial ModuleBifacial Module
Model NameSTP570S-C72/VmhSTP565S-C72/Pmh+
Dimensions (mm)2278 × 1134 × 352278 × 1134 × 35
Number of Cells144 (6 × 24)144 (6 × 24)
Rated Power (Pmax, W)570565
Age Degradation Rate (%/year)0.550.45
Cost per Unit (£)102115
Table 6. FPV monofacial system specification.
ParameterUnitKillingtonDrift
Tilt AngleDegrees1515
AzimuthDegrees00
Pitchm44
Module Heightm1.21.2
Modules per String 3634
Total Number of Strings 53471311
Total Number of Modules 192,42944,574
Module Aream2375,88887,042
PV Panel Model STP570S-C72/VmhSTP565S-C72/Pmh+
Inverter Models SG3125HV-MVSG3125HV-MV
Table 7. Summary of key PVsyst and HOMER Pro input parameters used in the FPV–hydrogen-system simulations.
ParameterValue UsedModelSource/Rationale
Water-surface albedo0.2PVsyst bifacial modelPVsyst default assumption for enclosed water surfaces; tested in sensitivity analysis.
Bifaciality factor0.7PVsyst bifacial modelSuntech STP545–565S-C72/Pmh+ datasheet reports 70 ± 5% [91].
Thermal loss factor, Uc29 W/m2KPVsyst thermal modelPVsyst recommended/default value for free-standing open-rack modules using the Faiman model.
Wind-dependent thermal factor, Uv0 W/m2K/(m/s)PVsyst thermal modelAdopted with Uc = 29 W/m2K following the PVsyst free-standing Faiman configuration.
Soiling loss3%PVsyst detailed lossesConservative lower-bound value; Ilse et al. report global PV soiling losses of at least 3–4% [109].
Ohmic/wiring loss1.5%PVsyst detailed lossesPVsyst default initial value for array ohmic wiring loss at STC.
System unavailability2%PVsyst detailed lossesAnnual downtime allowance for maintenance and unexpected outages.
Monofacial module tilt15°PVsyst system geometrySelected to balance yield, self-cleaning, wind loading, and structural stability.
Bifacial module tilt12°PVsyst bifacial geometrySelected to support wider spacing and rear-side irradiance capture while limiting wind loading.
Monofacial pitch4 mPVsyst system geometrySelected to provide sufficient row spacing while maintaining high active-area utilization.
Bifacial pitch6 mPVsyst bifacial geometryIncreased pitch was used for the bifacial system to reduce rear-side shading and improve bifacial gain.
Module height1.2 mPVsyst bifacial geometryUsed as the PVsyst geometric input for module elevation above the water surface.
Far shadingPVGIS horizon profilePVsyst shading modelSite-specific horizon profiles were generated using PVGIS and imported into PVsyst to account for far-shading effects.
Near shadingNot explicitly modeledPVsyst shading modelNear shading from shoreline vegetation or infrastructure was assumed to be limited due to module spacing and the 50 m reservoir perimeter buffer.
PEM electrolyzer conversion efficiency85%HOMER ProHigh-performance PEM assumption; Arunachalam et al. reported 86.5–91.2% under favorable conditions [110]. This parameter was tested in the sensitivity analysis.
PEM fuel cell electrical efficiency50%HOMER ProConservative PEMFC reconversion assumption within the reported 50–60% range [111].
Fuel cell fuel curve slope0.0697 kg H2/h/kWHOMER ProHOMER Pro fuel consumption curve for hydrogen-to-electricity reconversion.
Hydrogen lower heating value33.33 kWh/kgSecondary calculationStandard lower heating value of hydrogen used to convert annual hydrogen production into usable energy content.
Hydrogen boiler efficiency90%Secondary calculationRepresentative high-efficiency hydrogen-compatible boiler assumption. [112]
Table 9. AC electrical generation of Killington and Drift reservoirs.
LocationSystem TypeTotal Yield (MWh/year)Specific Yield (kWh/kWp/year)Performance Ratio (%)LCOE (£/MWh)
KillingtonMonofacial61,38376880.47£57.07
Bifacial64,36579985.73£62.53
DriftMonofacial18,659100981.25£44.30
Bifacial20,135105786.57£47.65
Table 10. System outputs under partial FPV deployment scenarios representing environmentally constrained surface coverage assumptions.
ReservoirOutput Metric10% Coverage25% Coverage50% CoverageMaximum Potential
Killington
(Max: 65.7%)
Annual Energy Generation (GWh)9.2823.2146.4261
Green Hydrogen Yield (kg)132,290330,726661,445869,149
Evaporation Reduction (m3)298,326745,8141,491,6291,960,000
Direct Grid CO2 Avoidance (tCO2e/yr)16434108821610,797
Drift
(Max: 50.0%)
Annual Energy Generation (GWh)4102020
Green Hydrogen Yield (kg)37,05592,639185,277185,277
Evaporation Reduction (m3)90,407226,019452,037452,037
Direct Grid CO2 Avoidance (tCO2e/yr)708177035403540
Table 11. Electricity supply breakdown for direct electrical scenario.
LocationSystemElectricity Supplied by FPVElectricity Supplied by GridTotal Electricity Produced (GWh/yr)Load Demand
(GWh/yr)
Total (GWh/yr)%Total (GWh/yr)%
KillingtonMonofacial15.56226.742.68173.358.24357
Bifacial15.65126.842.51273.258.16357
DriftMonofacial13.18938.421.19361.634.38232
Bifacial13.79539.820.88760.234.68232
Table 12. Sensitivity of direct FPV demand coverage to seasonal load-profile shape.
ScenarioLoad-Profile AssumptionWinter:Summer Demand RatioKillington MonofacialKillington BifacialDrift MonofacialDrift Bifacial
BaselineHOMER residential profile1.1926.70%26.80%38.40%39.80%
Low winter-demand caseElexon PC1 domestic unrestricted profile0.9127.80%28.10%38.80%40.00%
Mixed-community caseStandard domestic demand adjusted for off-gas-grid/electrically heated households1.10 Killington; 1.18 Drift26.20%27.20%38.00%39.10%
Sensitivity rangeRange across all scenarios0.91–1.1926.2–27.8%26.8–28.1%38.0–38.8%39.1–40.0%
Maximum change from baselineLargest decrease/increase relative to HOMER baseline−0.5/+1.1 pp0.0/+1.3 pp−0.4/+0.4 pp−0.7/+0.2 pp
Note: Baseline values correspond to the direct coverage values reported in Table 11. Two additional seasonal demand scenarios are used to bracket uncertainty in the HOMER residential load profile: a low winter-demand case based on Elexon Profile Class 1 and a mixed-community case reflecting higher winter electricity sensitivity associated with off-gas-grid or electrically heated households. For the mixed-community case, the winter:summer ratio is 1.10 for Killington and 1.18 for Drift. Values are expressed as the percentage of annual local electricity demand directly supplied by FPV. “pp” denotes percentage points.
Table 13. Electricity supply breakdown for hydrogen integrated scenario.
LocationSystemElectricity Supplied by FPVElectricity Supplied by GridElectricity Supplied by HydrogenTotal Electricity Produced (GWh/yr)Total Hydrogen Produced
(kg/yr)
Total (GWh/yr)%Total (GWh/yr)%Total (GWh/yr)%
KillingtonMonofacial22.80338.926.86745.88.94315.358.613838,100
Bifacial23.36539.826.05044.49.21615.758.676869,149
DriftMonofacial11.37534.819.46459.61.8205.5732.659171,389
Bifacial11.69735.719.00958.21.9776.1132.683185,277
Table 14. Annual hydrogen production and estimated energy delivery.
LocationSystemElectricity Used by Electrolyzer (GWh/yr)Hydrogen Produced (kg/yr)Energy Potential of Hydrogen (GWh/yr)Thermal Energy Delivered (GWh/yr)Hydrogen Powered Vehicle Range (km/yr)
KillingtonMonofacial38.892838,10027.93425.1411,173,340
Bifacial40.340869,14928.96826.0711,225,808
DriftMonofacial7.955171,3895.7125.141418,237
Bifacial8.599185,2776.1755.558454,550
Table 15. Annual net reduction in water evaporation.
LocationEvaporation Rate (mm/m2/yr)Water Saved
(m3/yr)
Killington9491,963,931
Drift1550452,037
Disclaimer/Publisher’s Note: The statements, opinions and data contained in all publications are solely those of the individual author(s) and contributor(s) and not of MDPI and/or the editor(s). MDPI and/or the editor(s) disclaim responsibility for any injury to people or property resulting from any ideas, methods, instructions or products referred to in the content.