Article

Source Attribution of Produced Methane During Shale Gas Recovery Under Stepwise Depressurization: A Molecular Dynamics Study

1
State Key Laboratory of Low Carbon Catalysis and Carbon Dioxide Utilization, Yangtze University, Wuhan 430100, China
2
Cooperative Innovation Center of Unconventional Oil and Gas, Yangtze University, Ministry of Education & Hubei Province, Wuhan 430100, China
3
College of Petroleum Engineering, Yangtze University, Wuhan 430100, China
*
Authors to whom correspondence should be addressed.
Energies 2026, 19(12), 2885; https://doi.org/10.3390/en19122885
Submission received: 16 May 2026 / Revised: 12 June 2026 / Accepted: 16 June 2026 / Published: 18 June 2026
(This article belongs to the Topic Petroleum and Gas Engineering, 2nd edition)

Abstract

During depressurization-driven shale gas production, methane migration and state transformation in nanopores affect the source composition of produced gas. However, the relative contributions of initially free and initially adsorbed methane remain difficult to quantify at the molecular scale. In this study, we develop a Frame-0-based source-tracing framework for methane recovery in an idealized graphene square nanopore using molecular dynamics simulations under a stepwise depressurization protocol. Radical Voronoi local density and a two-component Gaussian mixture model are used to assign one-time initial labels to methane molecules at Frame 0. PID–preserving cross-frame tracking is then used to quantify the stage-wise and cumulative source contributions from the two initial populations. For the representative case of R = 10 nm and T = 353.15 K, the stage-wise fraction from the initially free population decreases from 79.5% to 62.2% as pressure decreases, while that from the initially adsorbed population increases from 20.5% to 37.8%. Increasing pore width mainly enhances total recovery through the contribution of initially free methane. Increasing temperature improves the contributions from both populations, with a stronger effect on initially free methane. The present results provide a molecular-scale quantitative characterization of methane initial-source attribution under the current stepwise depressurization protocol and establish a source-tracing framework that can be further extended to more realistic pore models.

1. Introduction

Shale gas is an important unconventional natural gas resource stored in organic-rich shale nanopores [1,2,3]. During depressurization-driven production, methane occurs mainly as free gas in pore centers and adsorbed gas on pore surfaces [4]. Field shale gas wells commonly show high initial output followed by rapid decline within the first 1–2 years [5,6,7], indicating that the microscopic source evolution of produced methane during pressure reduction needs further clarification. Existing experimental and simulation studies have quantified methane adsorption capacity and examined the effects of water content, TOC, thermal maturity, and pore structure [8,9,10,11]. However, these studies mainly describe adsorption capacity or its controlling factors and do not directly quantify how much produced methane originates from the initially free population or from the initially adsorbed population during stepwise depressurization.
Molecular simulation provides a molecular-level approach for analyzing methane adsorption and transport in shale nanopores. Examples include the Grand Canonical Monte Carlo (GCMC) and molecular dynamics (MD). GCMC simulations are well suited for evaluating equilibrium adsorption capacity, adsorption isotherms, and competitive adsorption under specified temperature–pressure conditions. Many studies on clay mineral systems have used single-mineral models to simulate CH4 adsorption. For example, Chen et al. [12] and Wang et al. [13] used the GCMC method to simulate methane adsorption in montmorillonite nanopores at different temperatures and pore sizes, demonstrating how pressure and temperature together influence equilibrium adsorption capacity. Xiong et al. [14], Zhang et al. [15], and Muther et al. [16] also used the GCMC simulation method to examine the adsorption characteristics of CH4 on kaolinite. They effectively calculated methane adsorption isotherms at different temperatures and pressures, consistently finding that methane adsorption on kaolinite increases with pressure but decreases with increasing temperature. Additionally, they found that higher moisture levels in kaolinite reduce CH4 adsorption. Chen et al. [17], Tang et al. [18], and Wang et al. [19] used the GCMC method to simulate the adsorption behavior of CH4 in illite molecular layers with different pore sizes. A comparative analysis revealed that kaolinite typically exhibits lower methane adsorption capacity than clay minerals such as montmorillonite and illite. However, GCMC mainly provides equilibrium statistics and cannot directly describe time-dependent molecular trajectories or transport kinetics. Therefore, molecular dynamics (MD) methods are often used in research to supplement GCMC. By contrast, MD simulations solve Newton’s equations of motion and can therefore characterize density distributions, adsorption-layer structures, diffusion, and transport behavior in confined nanopores [20,21,22]. In recent years, MD has been widely used to investigate the coupled adsorption–diffusion behavior of methane in the pores of organic matter (kerogen) and carbon materials. For example, Tesson et al. [23] developed kerogen slit pore models with different surface roughness, systematically evaluated methane adsorption capacity and self-diffusion behavior, and demonstrated that pore wall microtopography significantly impacts methane migration rates. Kazemi et al. [24] simultaneously examined methane adsorption and transport processes in a three-dimensional Type II chert model, illustrating the advantages of molecular dynamics (MD) in characterizing integrated “storage-transport” mechanisms. Yu et al. [25] investigated the diffusion behavior of CH4 in different types of three-dimensional kerogen matrix models, revealing the controlling influence of kerogen type and pore connectivity on diffusion pathways and migration efficiency. Deng et al. [26] created nanopores with various morphologies (e.g., arc-shaped, serrated) in kerogen and compared how pore shape affects methane adsorption and diffusion. Their results indicate that geometric irregularities in pore walls lead to significant differences in adsorption layer distribution and kinetic response. Furthermore, to address the issue of “dynamic processes”, Wang et al. [27] used high-fidelity molecular dynamics simulations to study methane adsorption kinetics in real organic rock micropores, providing time-dependent adsorption rates and interfacial occupancy insights. Sun et al. [28] analyzed the adsorption and transport behavior of methane within complex slit-like channels, shedding light on heterogeneous migration in nanopores. In multicomponent systems, MD simulations can also assess differences in adsorption and diffusion among methane, ethane, and mixed gases within kerogen pores, revealing competitive adsorption and migration patterns under high-pressure conditions [29]. Nevertheless, because stepwise pressure reduction involves desorption and long-range migration over timescales far beyond those accessible to conventional MD, and because MD models cannot directly represent reservoir-scale pore-network connectivity and pressure propagation, MD is more suitable for analyzing microscopic mechanisms and state transformation in idealized pore models than for directly reproducing field-scale production processes.
Existing studies mainly focus on equilibrium adsorption behavior or transport characteristics, making it difficult to quantitatively identify the initial sources of methane entering the production region during staged depressurization. In addition, quantitative approaches that preserve molecular identity across stages and enable source attribution of produced methane remain limited. Therefore, this study focuses on the source tracing of methane with respect to the initially adsorbed and initially free populations defined once at the initial equilibrium state in an idealized graphene nanopore. By developing an operational staged depressurization protocol based on molecular dynamics simulations, we propose a single-molecule-scale framework for source-partitioning analysis: (1) single-molecule local density is calculated using Radical Voronoi tessellation, and the threshold ρ* is determined using a Gaussian mixture model to distinguish the initially adsorbed and initially free populations at Frame 0; (2) molecules are tracked across frames using PID–hash table mapping to quantify source contributions; (3) the effects of pore width (5–15 nm) and temperature (300–400 K) on source partitioning and recovery behavior are systematically examined. The novelty of this study lies in establishing a molecular-scale source-tracing framework based on one-time initial labeling at Frame 0 and PID–preserving cross-frame tracking. Under the present stepwise depressurization protocol, this framework enables quantitative analysis of how methane entering the operational production region is partitioned between the initially free and initially adsorbed populations, and provides molecular-scale evidence for understanding the source evolution of produced methane during depressurization-driven shale gas recovery.

2. Methods

2.1. Construction of the Graphene Square Nanopore Methane Model

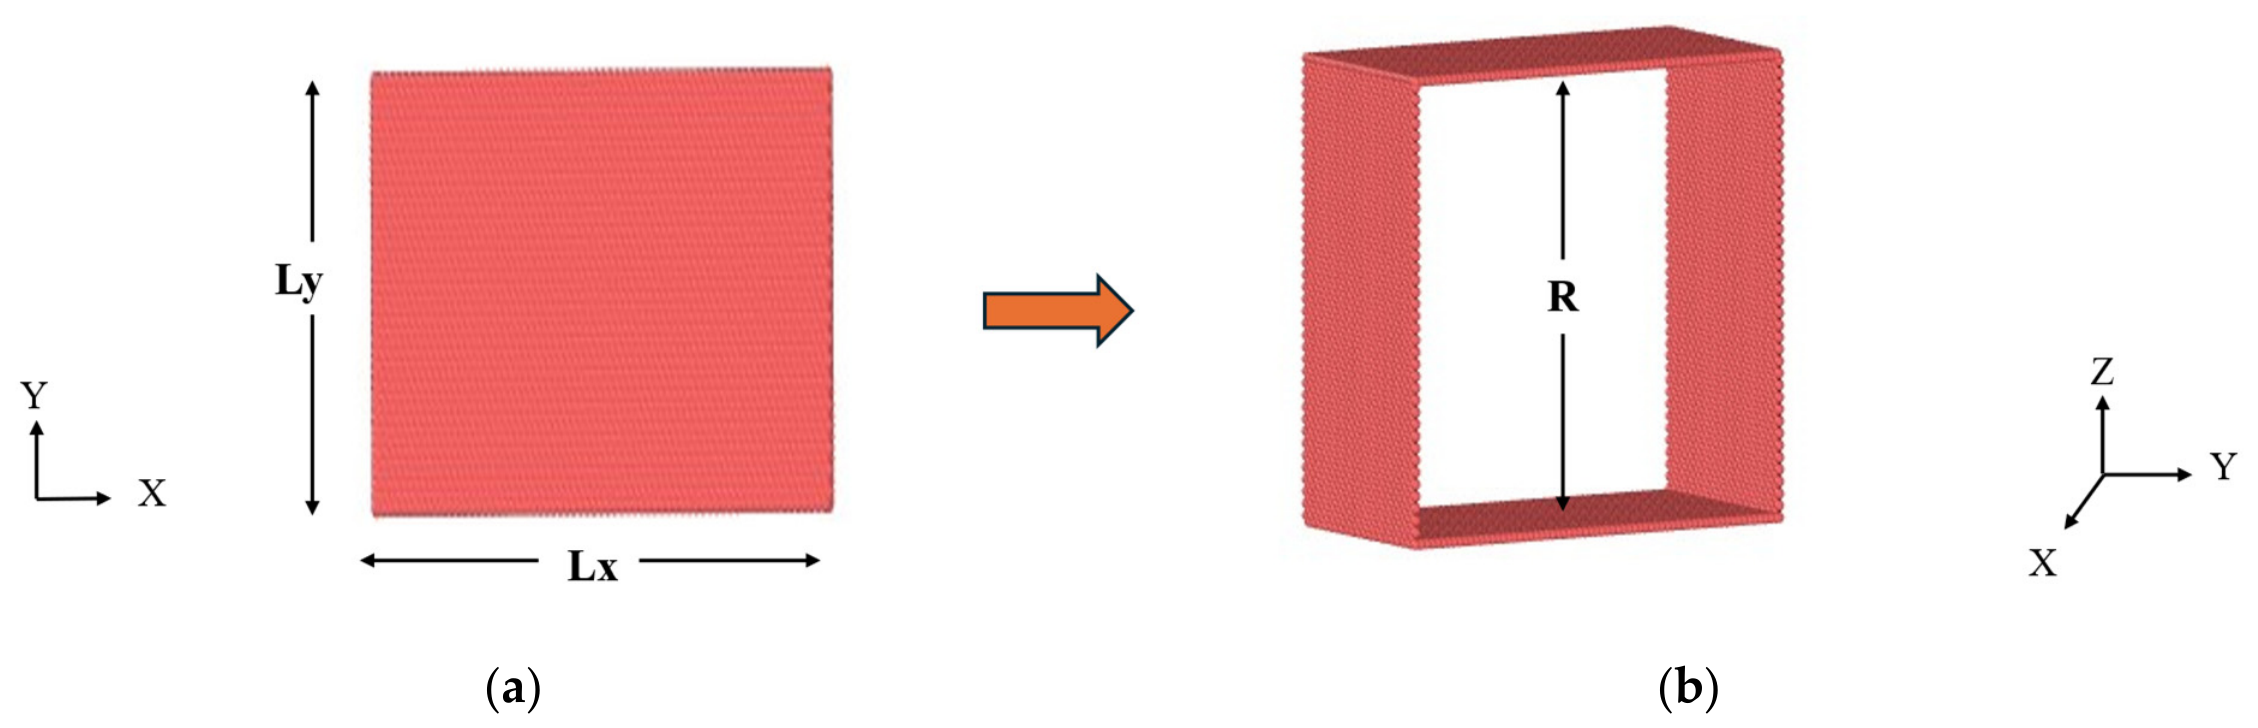
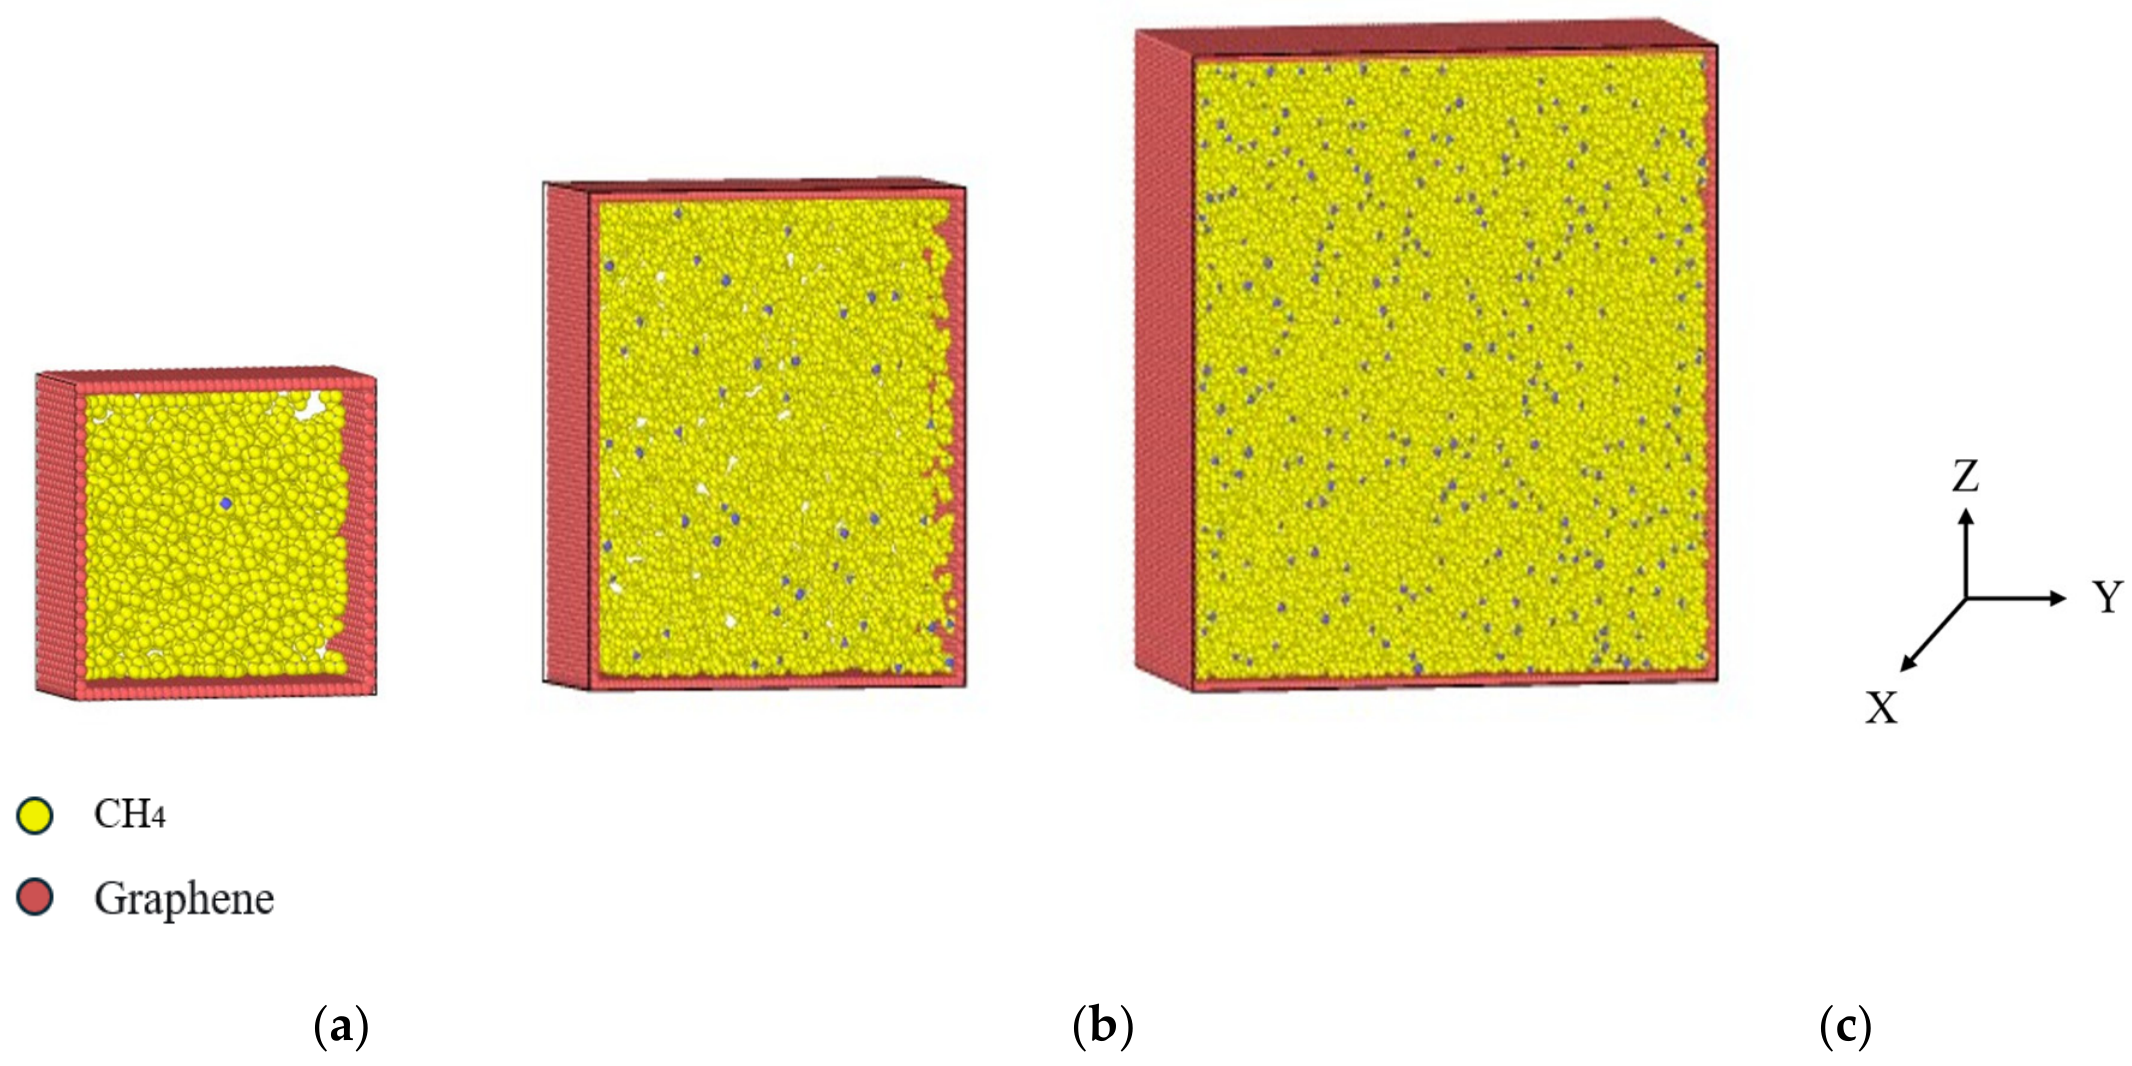
Because the chemical structure of shale organic matter is highly heterogeneous, graphene was adopted here as an idealized carbonaceous benchmark that allows controlled analysis of pore-width effects and source tracing under well-defined confinement. Previous studies have shown that methane adsorption on monolayer graphene captures key adsorption characteristics relevant to shale and can serve as a reasonable simplified benchmark for methane adsorption studies [30]. Nevertheless, this simplified graphene nanopore model is not intended to fully reproduce the complex pore networks of real shale reservoirs, which commonly involve heterogeneous pore geometries, mineral compositions, organic–inorganic interfaces, and water-bearing environments. Instead, it provides a controllable molecular-scale system for developing and testing the proposed source-tracing framework. On this basis, a graphene square nanopore methane model was constructed in LAMMPS [31]. As shown in Figure 1, the model consists of four rigid graphene walls, namely the upper, lower, left, and right walls, which together form a through square nanopore in the central region. The pore width R is defined as the distance between two opposing inner carbon atom planes. To cover the characteristic mesopore size range reported for organic-rich shales [32], R was set to 5, 10, and 15 nm. The corresponding methane-filled (or equilibrated) configuration is shown in Figure 2. Periodic boundary conditions were applied in the x, y, and z directions [33]. Van der Waals interactions were described by the Lennard-Jones (12-6) potential (Equations (1) and (2)), electrostatic interactions by the Coulomb potential, and bond stretching and angle bending by harmonic potentials (Table 1). Long-range electrostatic interactions were evaluated with the particle–particle particle–mesh (PPPM) method [34].
Methane was represented by a flexible all-atom model with a C-H bond length of 0.109 nm and an equilibrium H-C-H bond angle of 107.8 degrees. Bond stretching and angle bending were modeled harmonically, and non-bonded interactions were described with the OPLS-AA force field [35].
For each pore width, the initial methane loading was determined iteratively under fixed pore size and temperature until the equilibrated system pressure reached the target initial pressure of 37.5 MPa. Using the 5 nm case as an example, 553 CH4 molecules reproduced the target initial pressure after equilibration. This 37.5 MPa state was then used as Frame 0 for the subsequent stepwise depressurization analysis.
U i j L J ( r i j ) = 4 ε i j σ i j r i j 12 σ i j r i j 6 .
The values of σ i j   and ε i j   are given by the Lorentz–Berthelot mixing rule:
σ i j = σ i   +   σ j 2 ,                 ε i j = ε i ε j .
Table 1. Potential energy parameters of each atom [36].
MoleculeAtomM/(gmol−1)ε/k_B (K)σ (Å)Q/e
MethaneC12.011135.243.550−0.24
H1.00795.03222.4500.6
Graphene wallC12.011135.243.5500

2.2. Simulation and Analysis Workflow

2.2.1. Initial Equilibration

After system construction, energy minimization was performed using the conjugate-gradient method [37]. The convergence criterion was a maximum atomic force below 1.0 × 10⁻⁸ kcal mol−1 Å−1, with up to 1000 iterations. The minimized system was then pre-equilibrated in the NVT ensemble using the Nose-Hoover thermostat algorithm [38] implemented in LAMMPS at 353.15 K. The equilibration stage lasted 300,000 steps (0.3 ns), with a time step of 1 fs.
During pre-equilibration, temperature, pressure, and total energy were monitored to confirm convergence. Temperature was calculated from methane molecules only, excluding fixed graphene atoms. Pressure was evaluated using the virial stress [39] of methane atoms rather than from the global pressure of the whole simulation cell. In the LAMMPS implementation, methane atoms were assigned to the (all_gas) group, while graphene atoms were assigned to the fixed (wall) group. The per-atom virial stress tensor of methane atoms was calculated using compute stress/atom, and the methane pore pressure was obtained from the trace of the summed gas-phase stress tensor:
P g a s = S x x   +   S y y   +   S z z 3 V e f f ,
where S x x , S y y , and S z z are the summed diagonal components of the methane atomic stress tensor, and V e f f is the effective pore volume used for pressure normalization. Fixed graphene atoms were not included as thermal degrees of freedom or directly summed in the gas-phase virial stress. However, methane–wall interactions were included through their contribution to the virial stress of methane atoms. Therefore, the pressure in this work represents the confined methane pore pressure, rather than the mechanical pressure of the entire graphene–methane simulation cell.
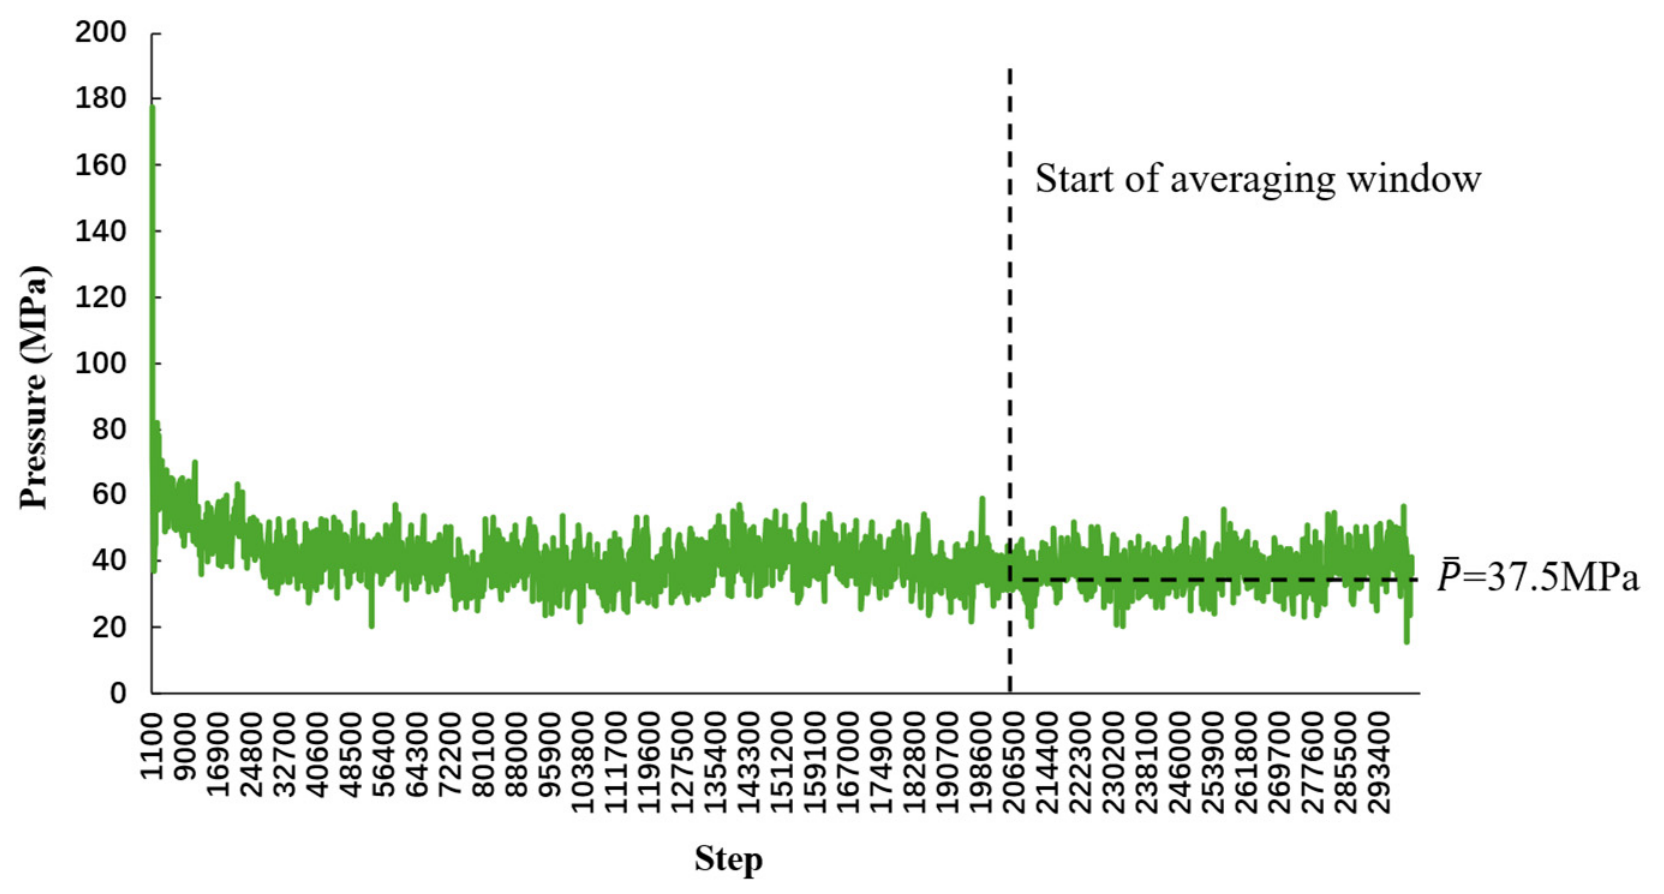
The time-averaged pressure over the last 100,000 steps was taken as the representative value for the equilibrated state (Figure 3). The resulting restart file was used as the thermodynamically balanced initial configuration for the subsequent depressurization simulations.

2.2.2. Stepwise Depressurization Protocol

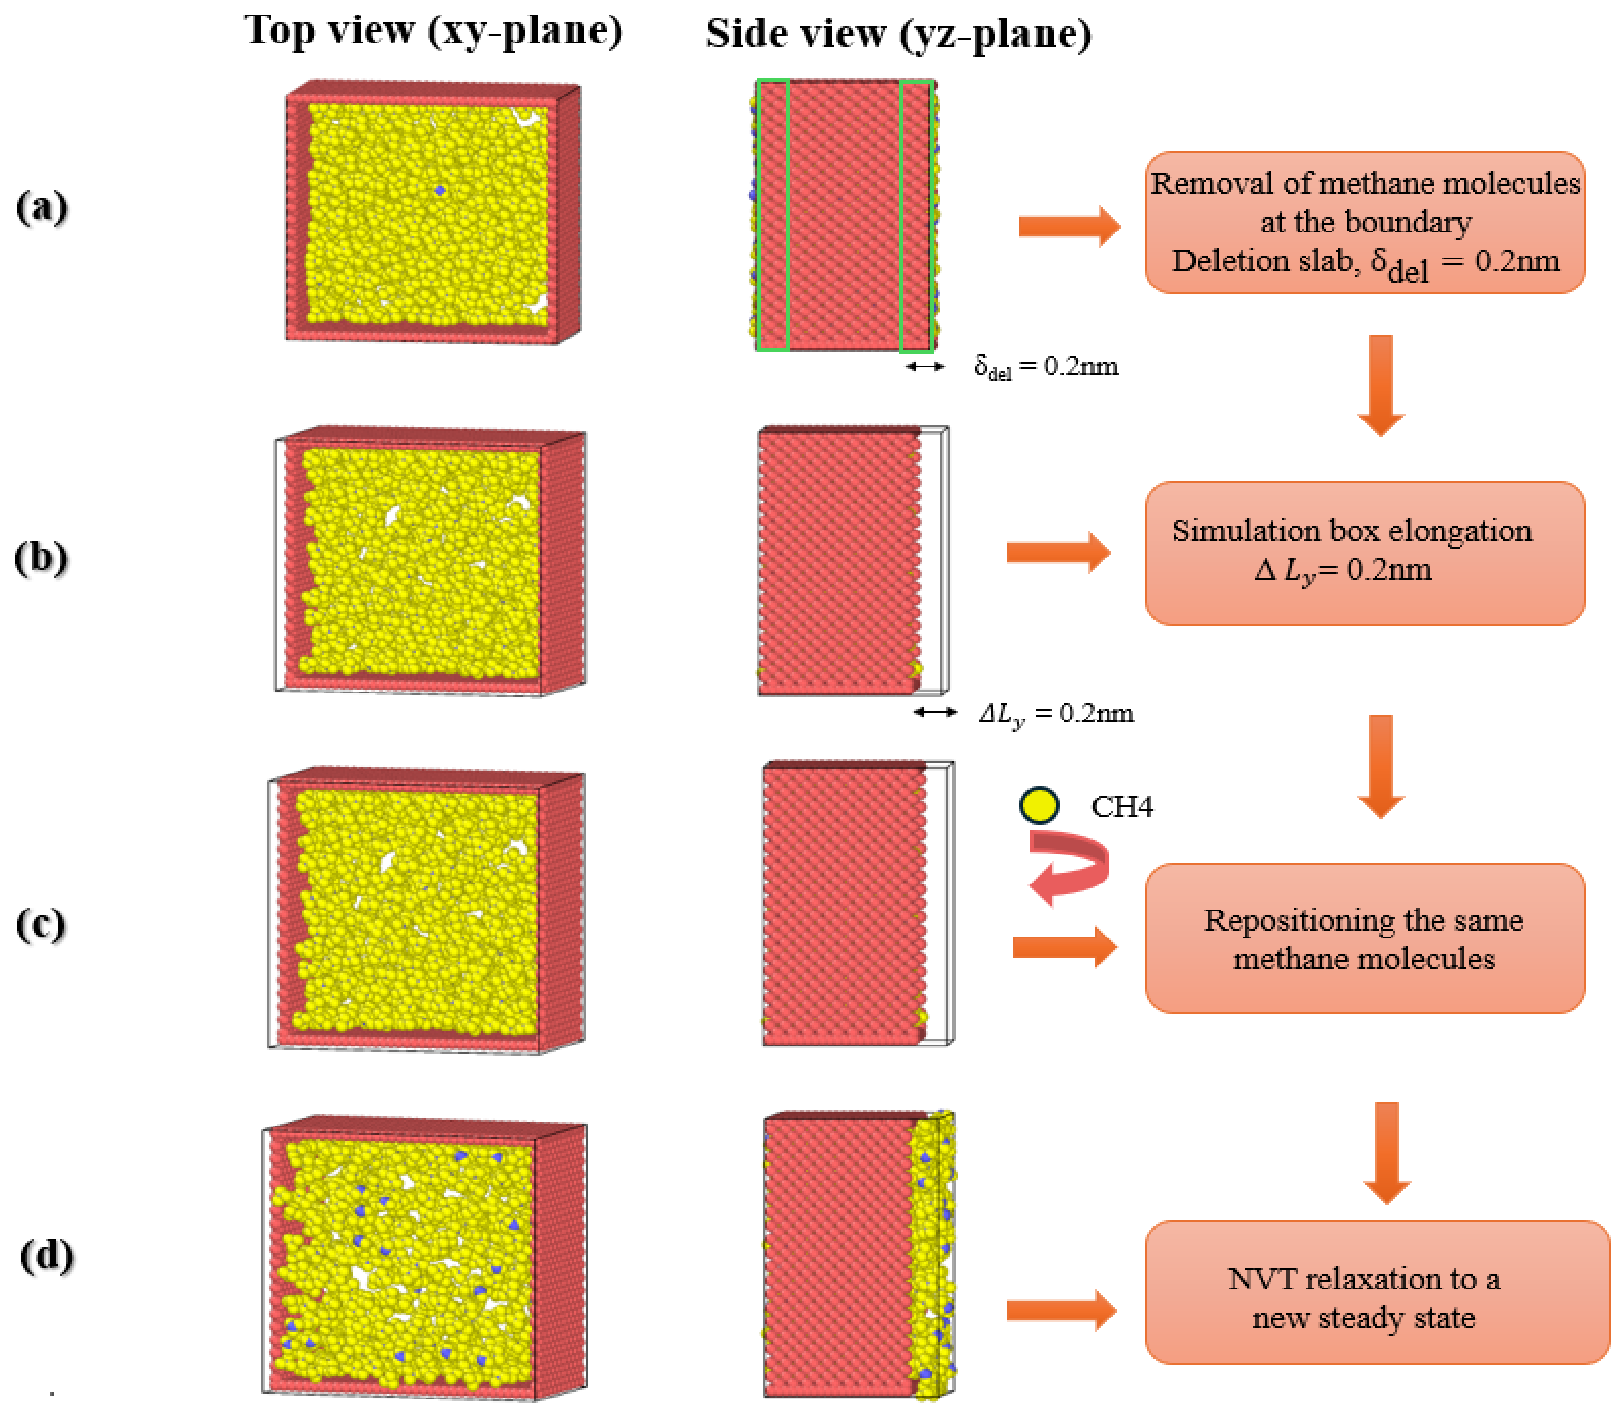
Before formal depressurization, the system was equilibrated at 37.5 MPa to generate the initial configuration (Frame 0). Depressurization was then represented by a stepwise elongation of the simulation box along the y direction using a Remove–Stretch–Reposition–Relaxation cycle at each target stage (Figure 4). Box elongation increases the accessible volume and lowers the average methane number density; after relaxation at the enlarged box size, the system reaches a new lower-pressure equilibrium state. Within this controlled setting, the procedure serves as a quasi-static, isothermal depressurization protocol at the nanoscale.
Because periodic boundary conditions were applied, some methane molecules could straddle the boundary during box elongation. To avoid artificial truncation, a deletion slab of thickness δ d e l was first defined near the boundary, and methane molecules inside this slab were temporarily removed. The box length was then increased from L y i 1 to L y i = L y i 1   +   Δ L y , where Δ L y = 0.2   n m in this work. After elongation, the same molecules were reinserted into the bulk region by coordinate reassignment while preserving their original PIDs. The system was then relaxed under the NVT ensemble at 353.15 K with a time step of 1 fs for 300,000 steps after each box elongation. During post-stretch relaxation, the instantaneous pressure was continuously monitored, and the stage pressure was evaluated by time averaging. A pressure stage was regarded as having reached a steady state when the pressure time series no longer showed an obvious systematic drift and fluctuated around a stable mean value. The average pressure at that stage was then evaluated over the final 100,000 steps, consistent with the treatment used in the initial equilibration stage. The same steady-state criterion and pressure-averaging procedure were applied consistently to all depressurization stages, and source statistics were collected only after the corresponding stage had entered this steady fluctuation regime. This procedure was repeated until all target pressure stages were completed.
In this framework, the newly added volume segment created after box elongation is defined as an operational production region for source-attribution analysis. Methane molecules whose centers of mass fall inside this region after NVT relaxation are counted as produced molecules. This definition provides the basis for the subsequent source-partitioning analysis described in Section 2.2.6. Methane molecules that enter this region after relaxation are therefore counted as produced molecules. This definition is used for controlled nanoscale source-partitioning analysis and provides the basis for quantifying the contributions of different initial populations to the operational production region.

2.2.3. Radical Voronoi-Based Local Density Calculation

To distinguish methane molecules in the wall-associated adsorption layer from those in the pore-center free region, a single-molecule local density was introduced as the state descriptor. Compared with the geometric distance from the pore wall, local density reflects both the degree of spatial confinement and the local packing environment, and is therefore more suitable for characterizing the microscopic occupancy state of methane in confined nanopores.
In this work, the local density of each methane molecule was calculated based on Radical Voronoi tessellation [40]. For the i -th methane molecule, the local Voronoi cell volume was denoted as V i , and the corresponding single-molecule local density was defined as
  ρ i = m C H 4 V i ,
where m C H 4   is the molecular mass of methane. In the confined methane system considered here, methane molecules in the adsorption layer usually occupy smaller local volumes and thus exhibit higher local densities, whereas molecules in the pore-center free region tend to occupy larger local volumes and exhibit lower local densities.
Accordingly, the distribution of ρ i   provides an effective basis for distinguishing different initial methane states. The resulting local-density data were subsequently used for the GMM-based classification described in Section 2.2.4.

2.2.4. GMM-Based Classification of Initially Adsorbed and Initially Free Populations

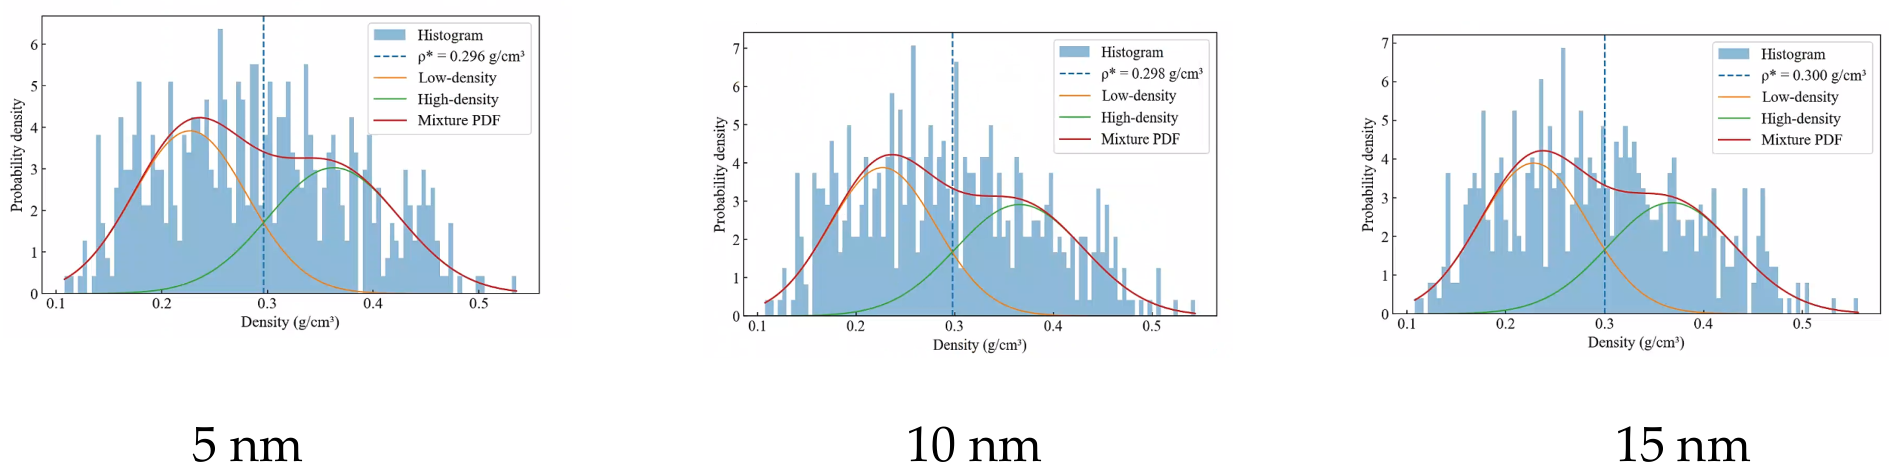
Based on the local-density descriptor defined in Section 2.2.3, methane molecules at the initial equilibrium state (Frame 0) were classified into two populations: initially adsorbed population and initially free population. The local-density distribution is clearly bimodal, reflecting the coexistence of a dense wall-associated population and a lower-density pore-center population. Because the two distributions partially overlap, an empirical threshold would be subjective and potentially unstable.
To obtain an objective classification criterion, a two-component Gaussian mixture model (GMM) [41] was fitted to the local-density distribution. As shown in Figure 5, the bimodal shape is consistently observed for different pore widths, and the two fitted Gaussian components provide a natural statistical separation between the two populations. The probability density function is written as
P ( ρ i ) = w 1 N ( ρ i μ 1 , σ 1 2 ) + w 2 N ( ρ i μ 2 , σ 2 2 ) ,
where w 1 and w 2 are the mixture weights, and μ 1 , μ 2 , σ 1 , and σ 2   are the means and standard deviations of the two Gaussian components, respectively. The physically meaningful intersection between the two fitted components was taken as the density threshold ρ .
Methane molecules with ρ i > ρ were classified as belonging to the initially adsorbed population, whereas those with ρ i < ρ were classified as part of the initially free population. The classification was performed only once at Frame 0, and the resulting labels were propagated to later frames through PID–based cross-frame tracking. This one-time labeling strategy enables consistent source attribution throughout the stepwise depressurization process.
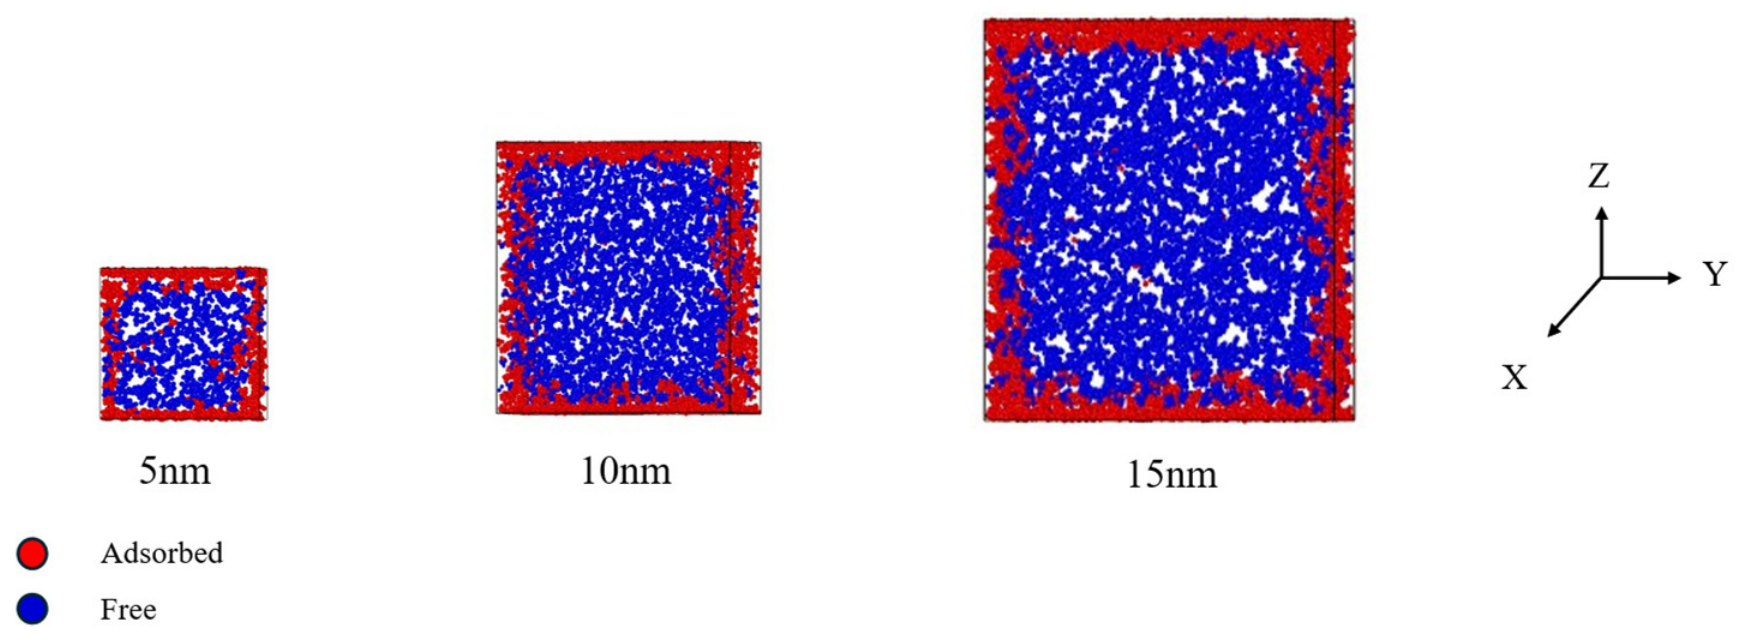
Figure 6 visualizes the initial-state classification based on the threshold ρ : methane molecules classified as initially adsorbed (red) cluster near the wall surface and form a dense adsorption layer, whereas methane molecules classified as initially free (blue) mainly occupy the pore-center region. As pore width increases, the free population in the pore center expands. At the same time, the near-wall adsorption layer remains unchanged, further supporting the physical relevance of the local-density criterion.

2.2.5. PID–Based Cross-Frame Source Tracing of Methane Molecules

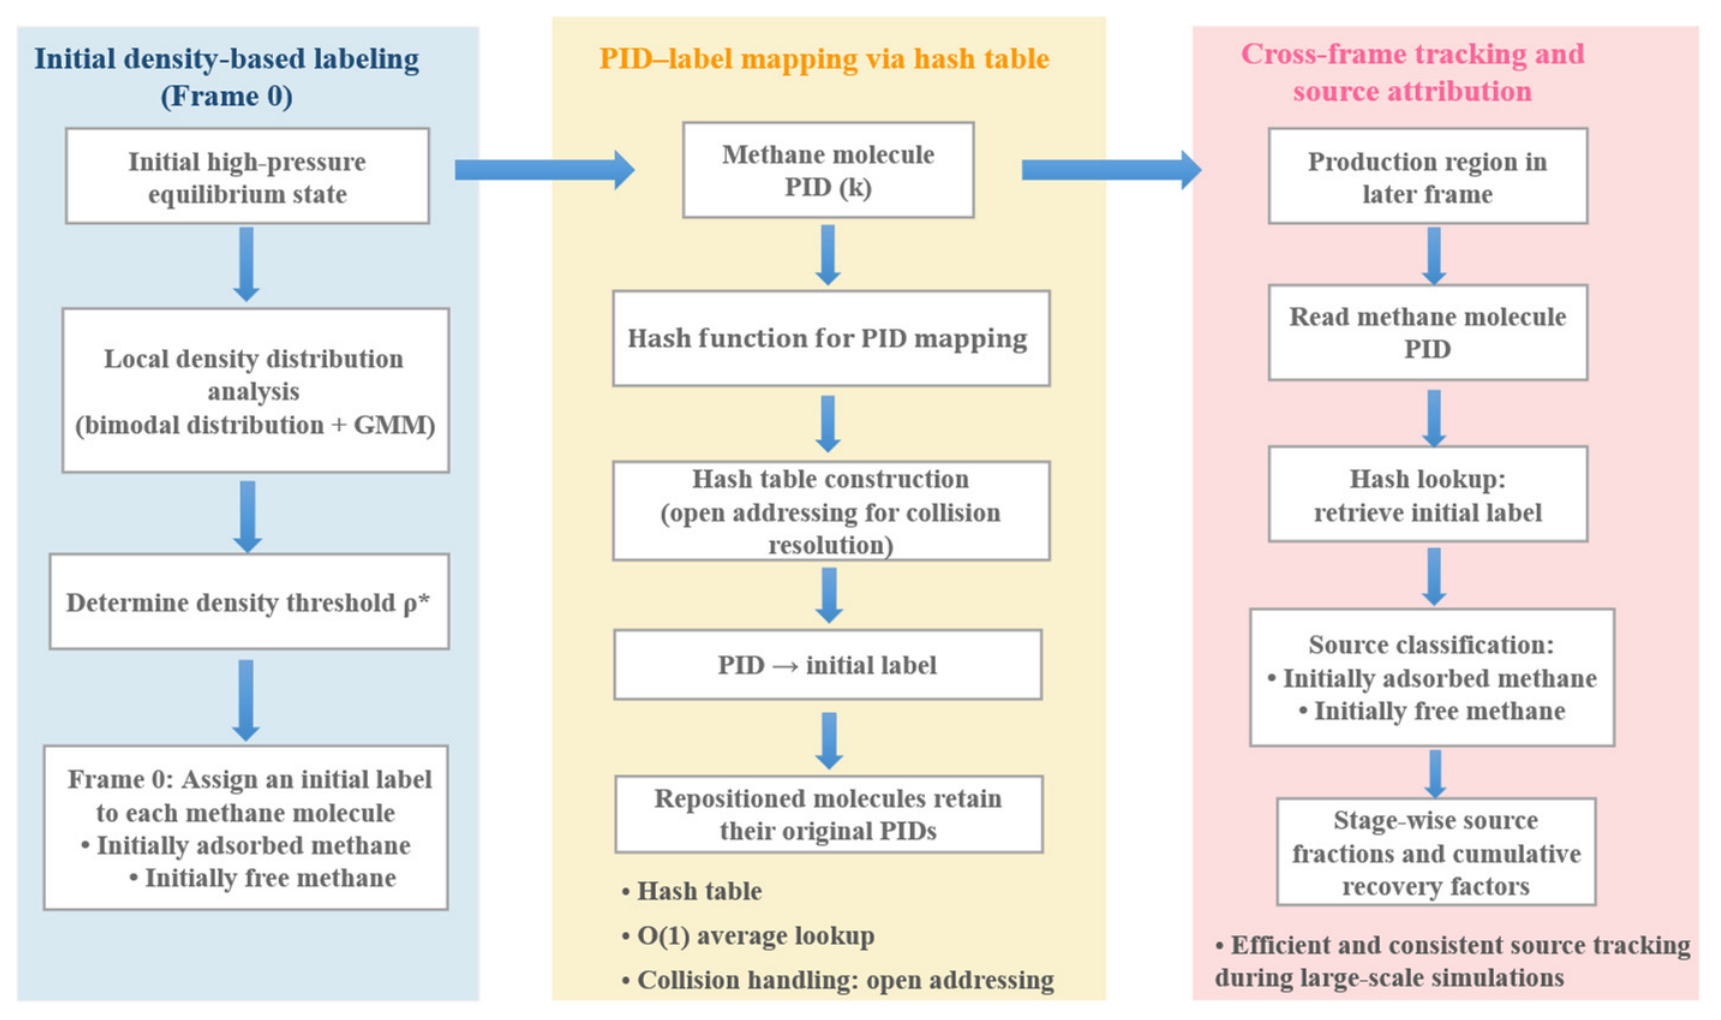
To identify the source of methane molecules during stepwise depressurization, a cross-frame tracking method based on molecular unique identifiers (PIDs) was developed, and the overall workflow is illustrated in Figure 7. At the initial equilibrium state (Frame 0), each methane molecule was assigned a one-time source label, namely initially free population or initially adsorbed population, according to the GMM-based local-density threshold ρ described in Section 2.2.4. This initial labeling was then preserved in all subsequent frames to ensure a consistent source-attribution criterion throughout the depressurization process. In this way, methane molecules observed at later stages can always be traced back to their initial occupancy states.
For efficient implementation, the mapping of the molecular PID to its initial label was stored in a hash table [42]. For a given molecular PID, the corresponding hash value was computed using the multiplicative hash function shown in Equation (6).
h ( k ) = ( ( k × C )   m o d   2 64 ) ( 64 p ) .
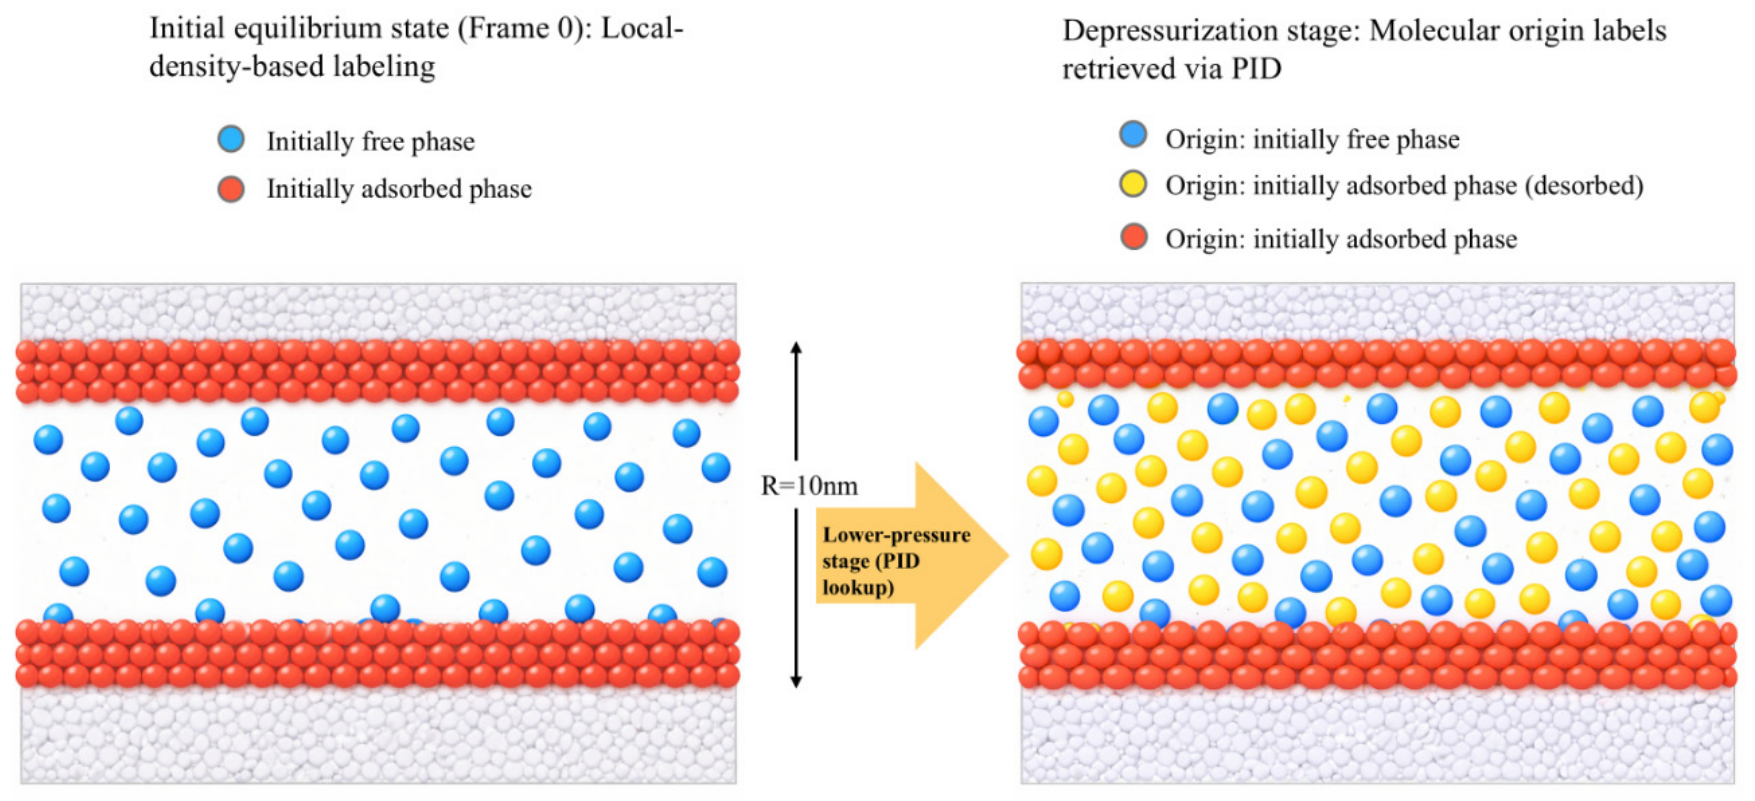
In the present work, methane molecules temporarily removed from the boundary slab during stepwise depressurization were reinserted with unchanged PIDs, and were therefore not treated as newly created molecules. At each pressure stage, the PIDs of methane molecules located in the target statistical region were matched to their Frame 0 labels, allowing stage-wise source contributions to be quantified consistently. The phase labeling and molecular origin tracking process is schematically illustrated in Figure 8.

2.2.6. Definition of Produced Molecules and Recovery Factors

In each depressurization step, elongation of the simulation box along the y-direction creates a newly added volume segment, which is defined here as the operational production region. If the box length from/to L y i = L y i 1   +   Δ L y , the operational production region at this step is defined as
Ω _ p r o d = { ( x , y , z ) y ( L y i 1 , L y i ) } .
After relaxation at a given step, a methane molecule is counted as produced methane if its center-of-mass position falls inside the operational production region. The total amount of methane produced at this step is denoted as N_prod. This operational definition does not directly correspond to field-scale gas production or wellbore outflow. Rather, it is used to characterize, at the molecular scale, the migration of methane molecules into the newly defined operational production region under the present depressurization protocol. In other words, this work does not aim to predict field production rates, but to quantitatively identify whether the methane molecules entering the operational production region originated from the initially free or initially adsorbed populations.
Using the Frame 0 source labels defined in Section 2.2.4 and Section 2.2.5, the produced molecules in the operational production region are decomposed into two source groups: N_free, representing molecules originating from the initially free population, and N_ads, representing molecules originating from the initially adsorbed population.
N _ p r o d = N _ f r e e + N _ a d s .
The cumulative recovery factors are normalized by the initial total number of methane molecules N 0 :
R F _ t o t a l = i N _ p r o d N 0 ,           R F _ f r e e = i N _ f r e e N 0 ,         R F _ a d s = i N _ a d s N 0 .
Here, RF_total represents the total cumulative recovery, while RF_free and RF_ads represent the cumulative contributions originating from the initially free and initially adsorbed populations, respectively. For each pressure step, the stage-wise source fractions of produced methane are further expressed as
  f _ f r e e = N _ f r e e N _ p r o d , f _ a d s = N _ a d s N _ p r o d .

3. Results and Discussion

3.1. Adsorbed–Free Identification and Threshold Robustness (ρ*)

The Radical Voronoi local-density distribution at the initial equilibrium state shows a clear bimodal feature, indicating the coexistence of a low-density pore-center population and a high-density wall-associated population. The low-density component corresponds to methane molecules mainly located in the pore-center free region, whereas the high-density component corresponds to methane molecules concentrated near the graphene walls. As shown in Figure 5, the two-component GMM provides a statistical separation between these two populations, and the resulting classification is consistent with the spatial distribution shown in Figure 6.
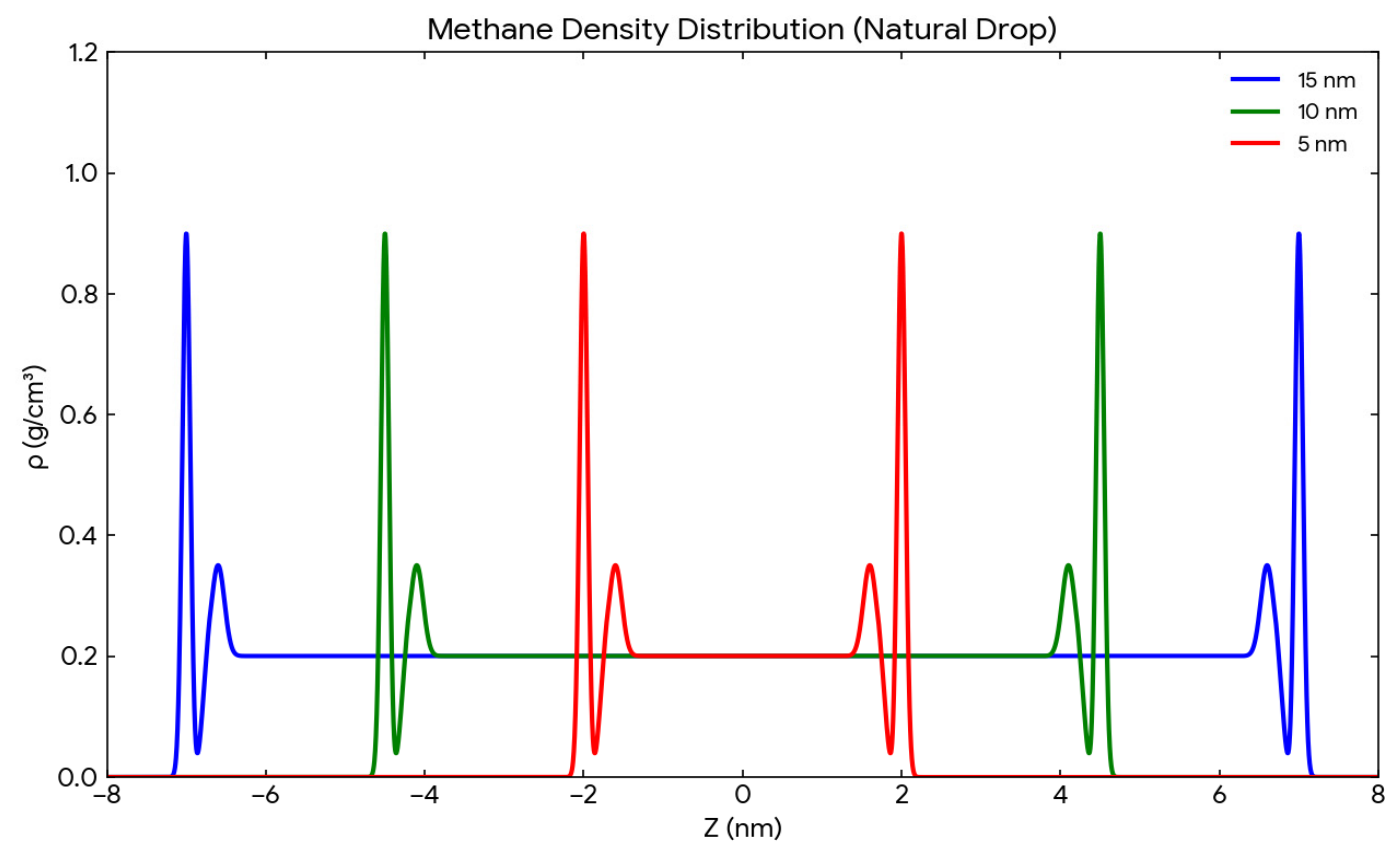
This classification is further supported by the z-direction averaged density profiles shown in Figure 9. For all pore widths, a pronounced high-density peak appears near the wall, and both its position and characteristic thickness remain nearly unchanged. In contrast, the low-density plateau in the pore-center region expands significantly with pore width. These results support describing methane occurrence in the nanopore as a coexistence of a near-wall adsorption layer and a pore-center free region, in agreement with the local-density-based classification and previous reports [43,44,45].
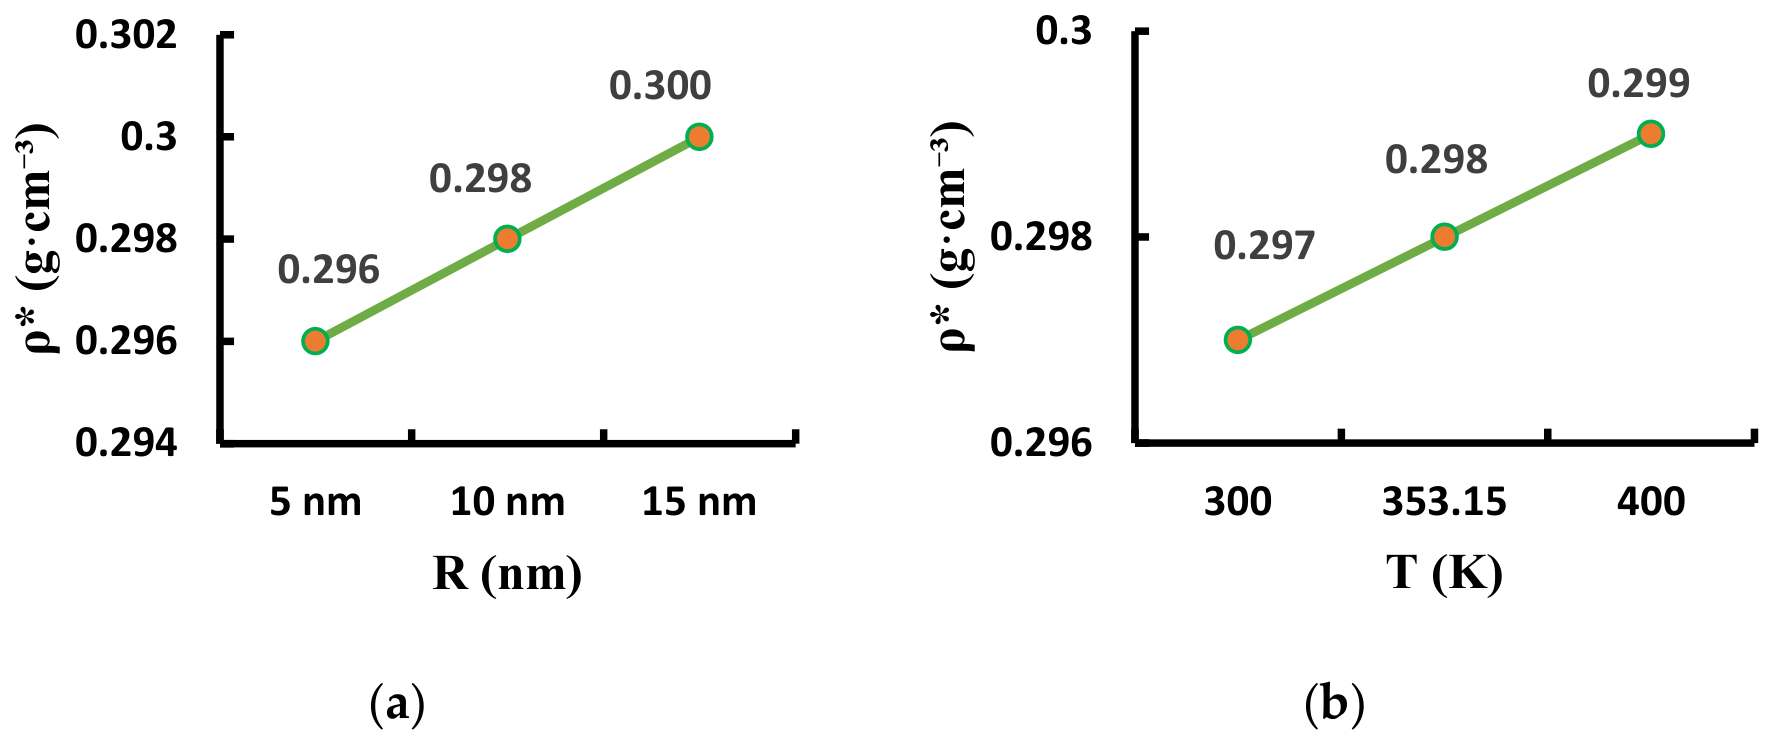
To evaluate the robustness of the criterion, ρ was determined for systems with different pore widths and temperatures. As shown in Figure 10, the variation in ρ is very small: at fixed T = 353.15   K , it changes only from 0.296 to 0.300 when pore width increases from 5 to 15 nm; at fixed R = 10   n m, it remains within 0.297–0.299 when the temperature increases from 300 to 400 K. This indicates that the GMM-based local-density criterion is stable over the range investigated.
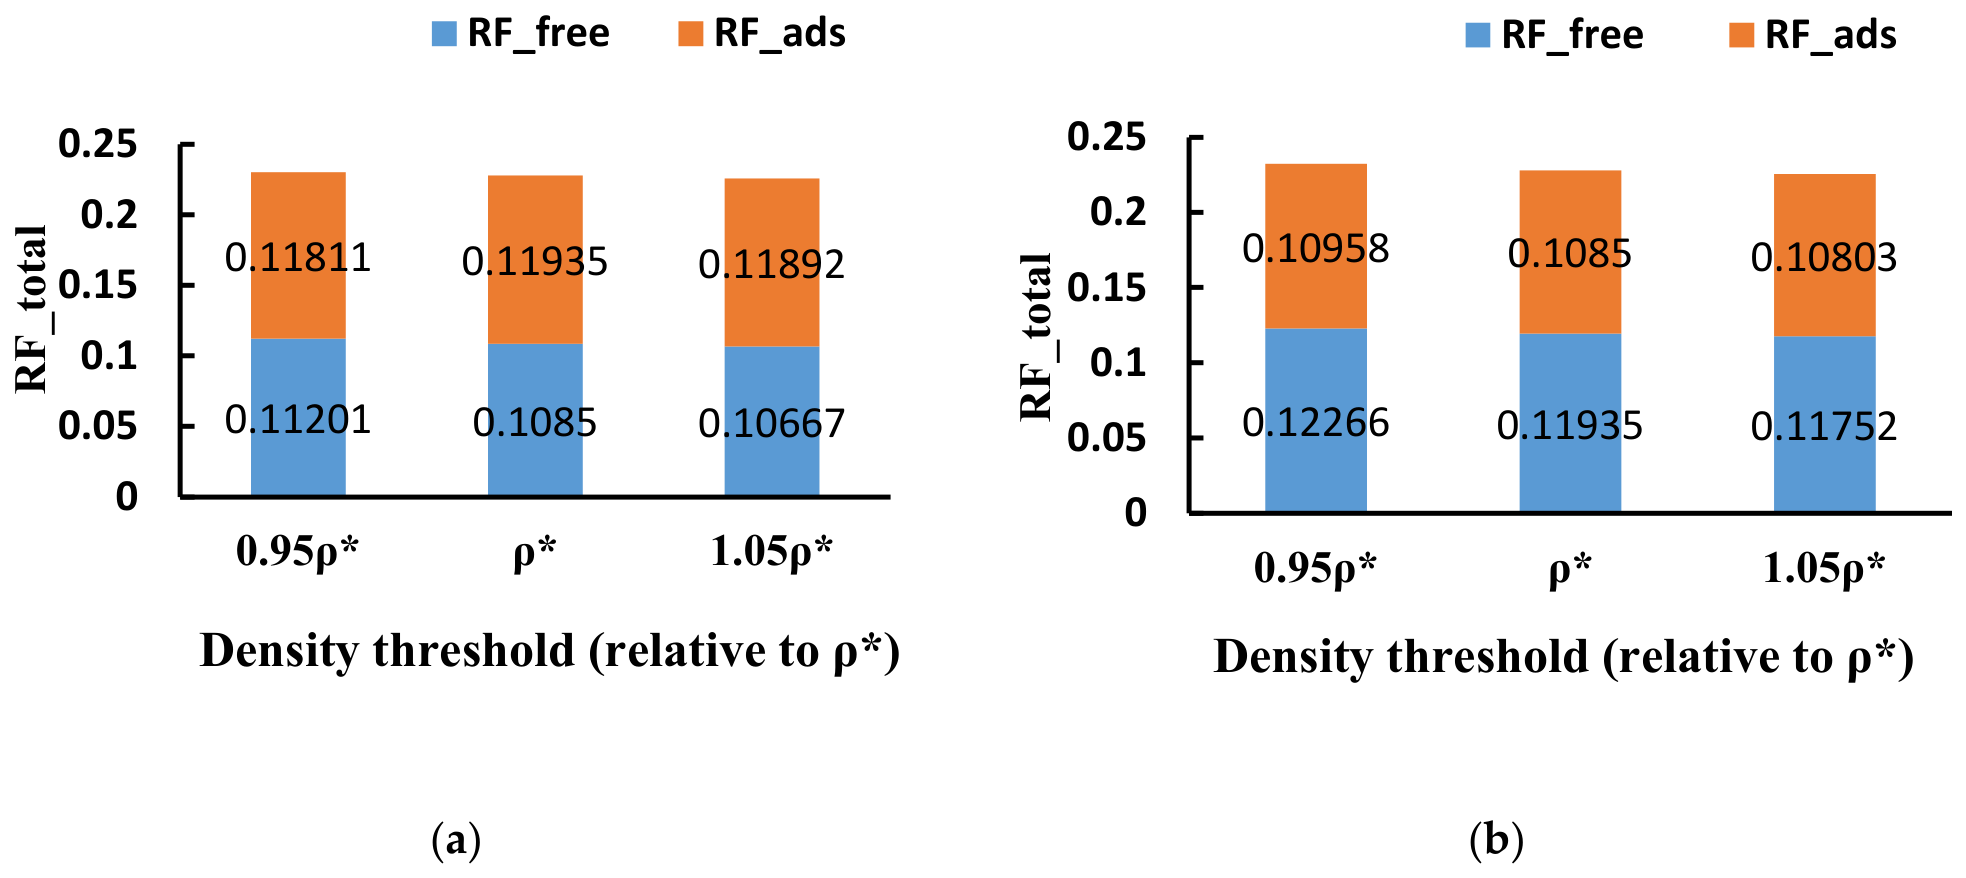
In addition, representative perturbation tests were performed by imposing an artificial variation of ±5% on ρ for two cases, R = 5   n m and T = 353   K , and R = 10   n m and T = 300   K , followed by repetition of the PID–based source-tracing analysis. As shown in Figure 11, the resulting R F free and R F ads change only slightly, and the total endpoint recovery remains nearly unchanged. The magnitude of these variations is much smaller than the differences caused by pore width or temperature. Therefore, small uncertainties in ρ do not materially affect the classification results or the subsequent decomposition of produced methane into initially free and initially adsorbed population contributions.
Several alternative criteria could also be used to distinguish adsorbed and free methane molecules. For example, a distance-to-wall criterion can classify molecules within a prescribed cutoff distance from the graphene wall as adsorbed methane, while molecules farther from the wall are regarded as free methane. Another possible approach is to determine the adsorption-layer thickness from spatial density profiles and classify molecules within the near-wall adsorption layer as adsorbed. In addition, a methane–wall interaction energy criterion could be used, in which molecules with sufficiently strong methane–wall interaction energies are identified as adsorbed. However, these approaches generally require prescribing an empirical wall-distance cutoff, adsorption-layer thickness, or energy threshold. In comparison, the present GMM-based local-density criterion determines ρ   directly from the simulated local-density distribution, and the threshold-perturbation test indicates that the source-attribution results are insensitive to small variations in ρ .

3.2. Stage-Wise Source Attribution of Produced Methane During Stepwise Depressurization

To analyze stage-wise changes in methane source fractions during depressurization, the representative case of R = 10 nm and T = 353.15 K was selected. Using the Frame 0 source labels, the produced methane molecules at each pressure stage were decomposed into N_free and N_ads, corresponding to molecules originating from the initially free and initially adsorbed populations, respectively. The corresponding stage-wise source fractions are denoted as f_free and f_ads.
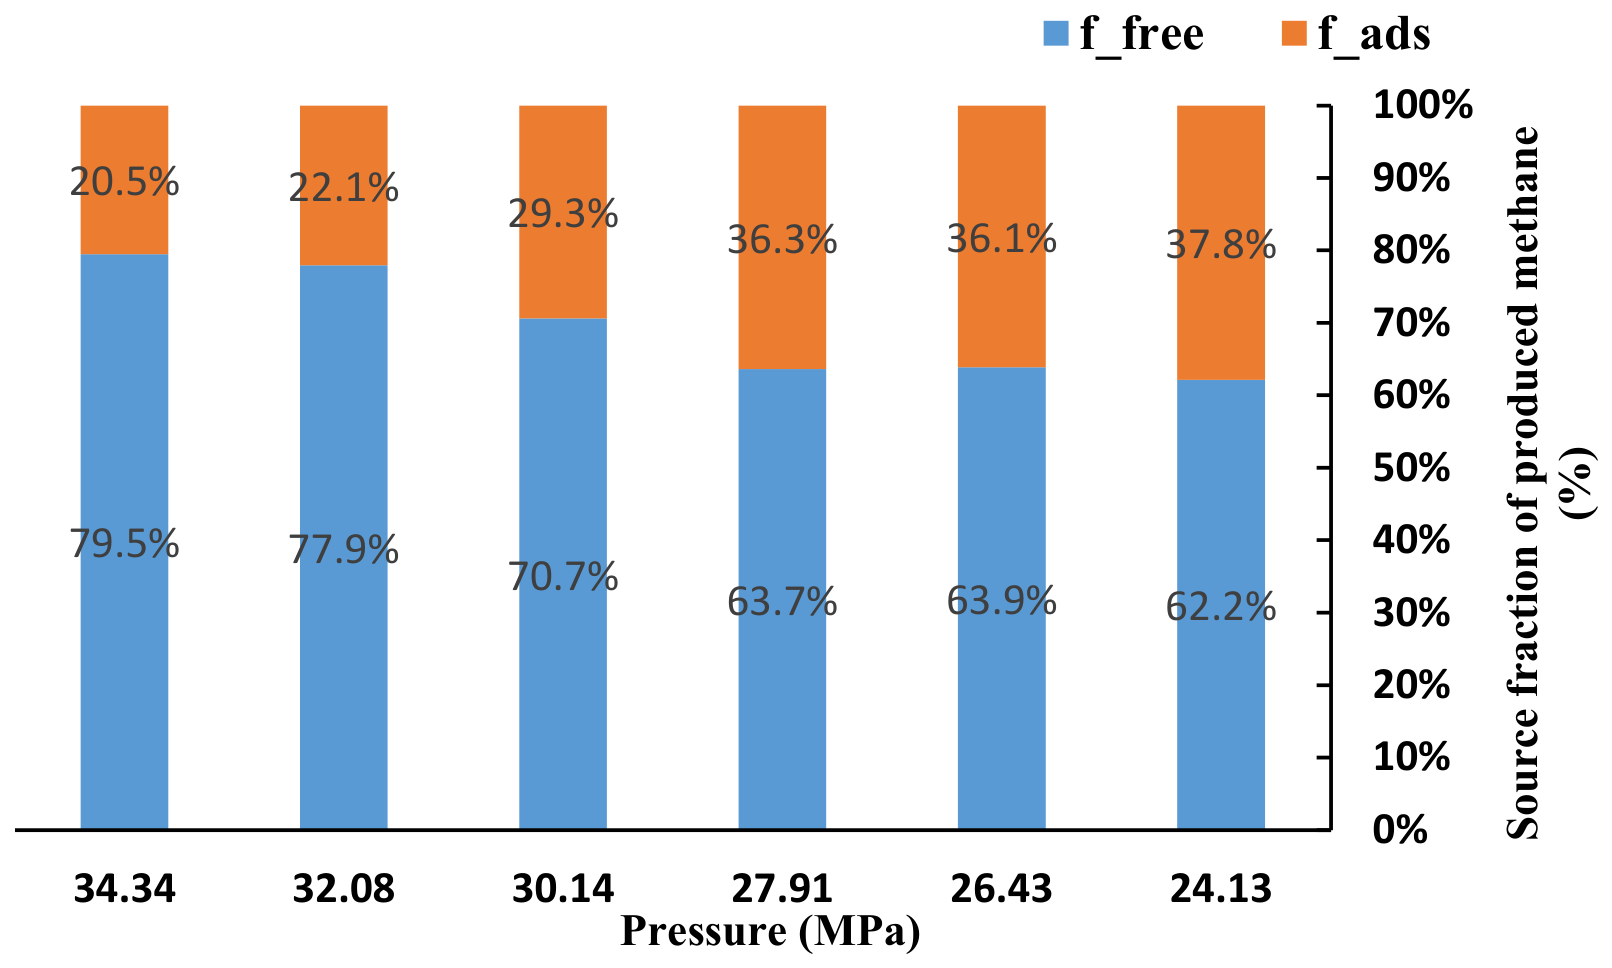
As shown in Figure 12, with pressure decreasing from 34.34 MPa to 24.13 MPa, the source fractions of produced methane change systematically. The fraction of f_free decreases from 79.5% to 62.2%, whereas f_ads increases from 20.5% to 37.8%. This indicates that stage-wise production is initially dominated by methane originating from the initially free population, but the relative contribution from the initially adsorbed population becomes increasingly important as depressurization proceeds.
A pronounced acceleration in the increase in f_ads is observed in the two consecutive stages near 30.14 MPa. In the high-pressure range from 34.34 to 32.08 MPa, f_ads increases only slightly, by about 1–2% per pressure step. In the subsequent two stages near 30.14 MPa, however, the increase reaches about 7% per step. Within the present simulation protocol, this behavior indicates a nonuniform stage-wise change in source contribution, with enhanced participation of the initially adsorbed population as depressurization proceeds. Because the pressure stages adopted in this study are discrete and limited, this apparent acceleration should not be regarded as definitive evidence of a physical transition. We speculate that this behavior may be related to the gradual redistribution of methane during depressurization; however, because the pressure sampling is relatively sparse, the possibility that it is influenced by the selected pressure intervals cannot be excluded. Finer pressure sampling would be required in future work to further determine whether this phenomenon corresponds to a genuine physical transition or a gradual redistribution process.
Overall, methane originating from the initially free population is more directly associated with the pore-center mobile region and therefore contributes preferentially to production in the earlier stages. As depressurization proceeds, this initially free population is preferentially produced in the previous pressure steps, so its incremental contribution gradually weakens. Meanwhile, methane originating from the initially adsorbed population continues to replenish the mobile phase, so its relative contribution becomes more important in the later stages.

3.3. Effect of Pore Width on Methane Recovery and Source Attribution

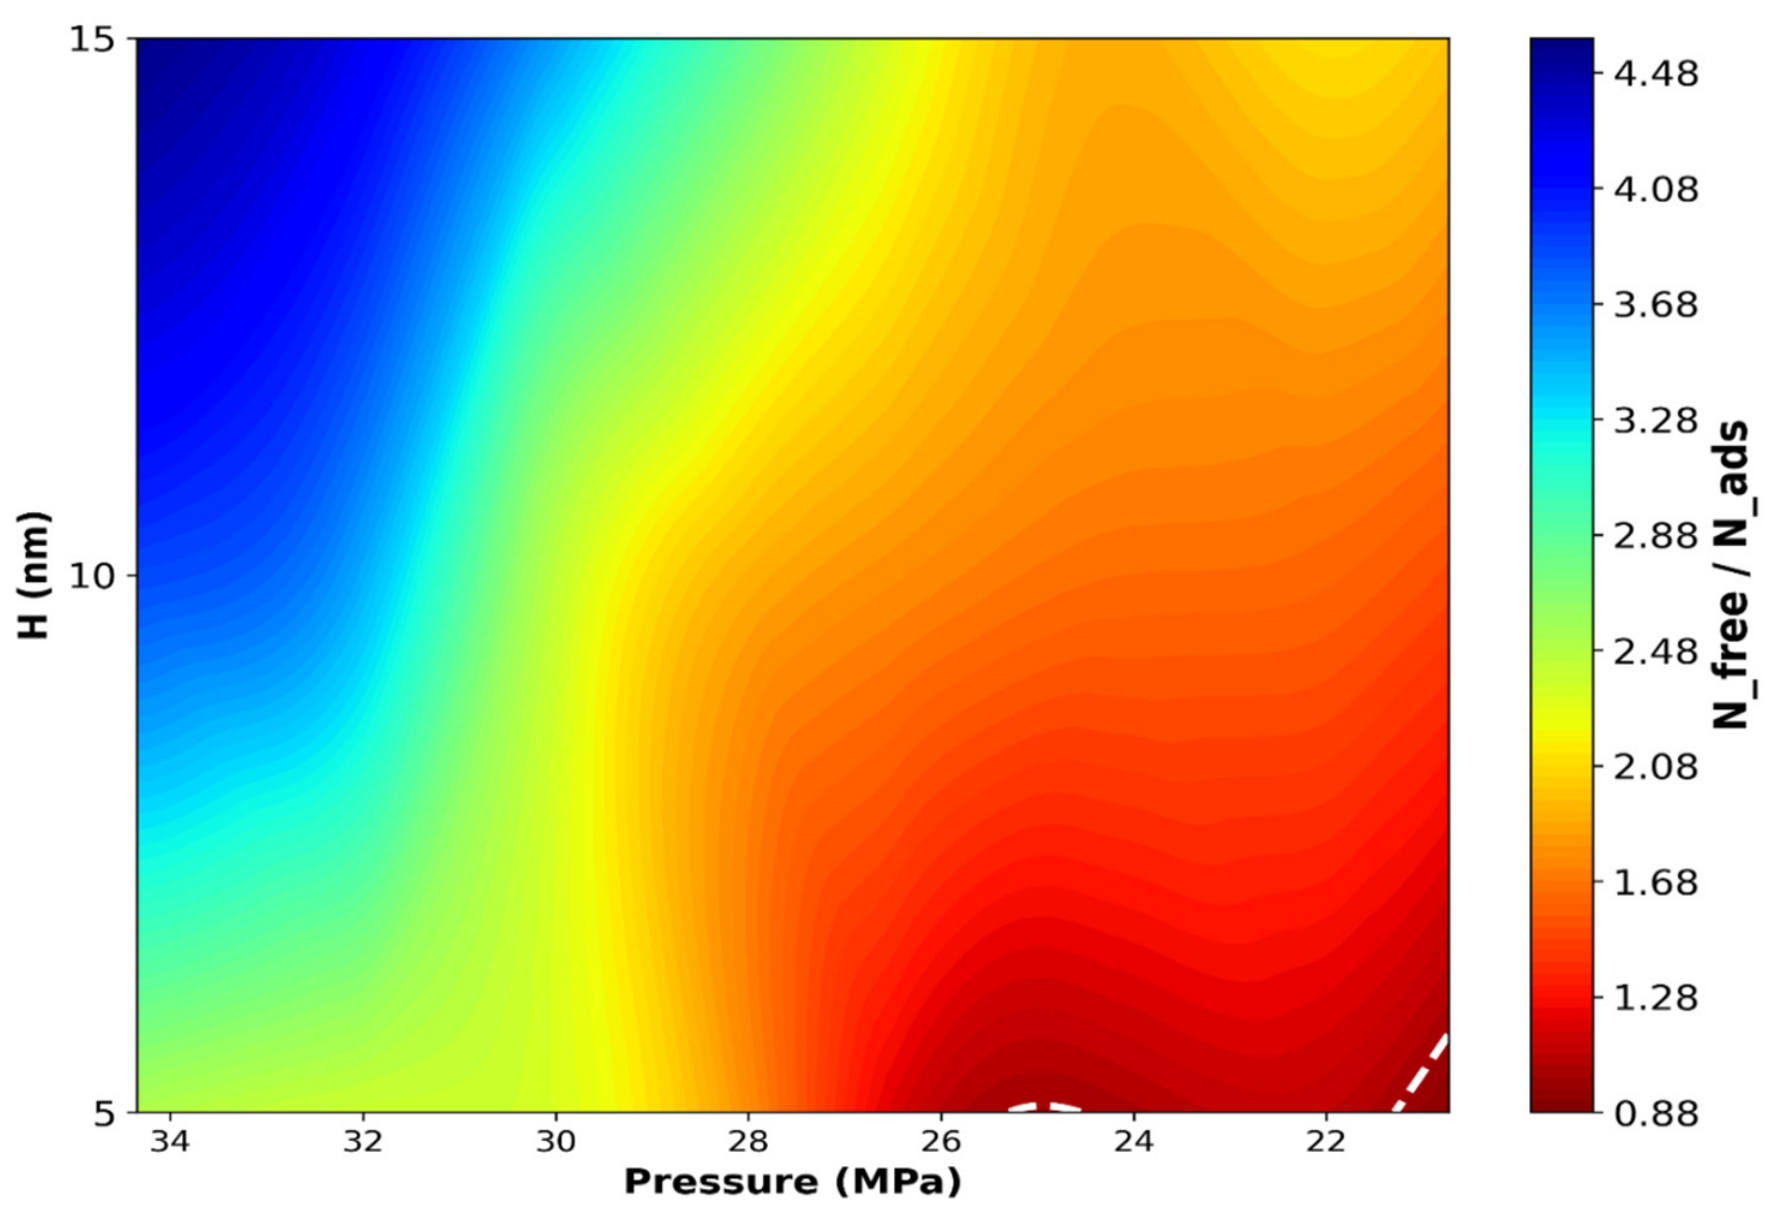
Figure 13 shows the two-dimensional distribution of the source ratio N_free/N_ads during stepwise depressurization under different pore widths. Here, N_free and N_ads denote the numbers of produced methane molecules originating from the initially free and initially adsorbed populations, respectively. Larger values of N_free/N_ads indicate stronger dominance of the initially free population, whereas values approaching unity indicate a substantially enhanced relative contribution from the initially adsorbed population. This distribution already suggests that pore-width variation affects source partitioning in a nonuniform manner, with a preferential strengthening of the initially free population.
At a given pressure, the ratio N_free/N_ads generally increases with pore width. This means that wider pores tend to maintain stronger dominance over the initially free population in stage-wise production. In contrast, as pressure decreases, the ratio declines overall, indicating that methane originating from the initially adsorbed population contributes increasingly to production. The transition region where N_free/N_ads ≈ 1 is mainly distributed in the low-pressure and small-pore domain, implying that narrow pores are more likely to reach a state where the two initial sources make comparable contributions.
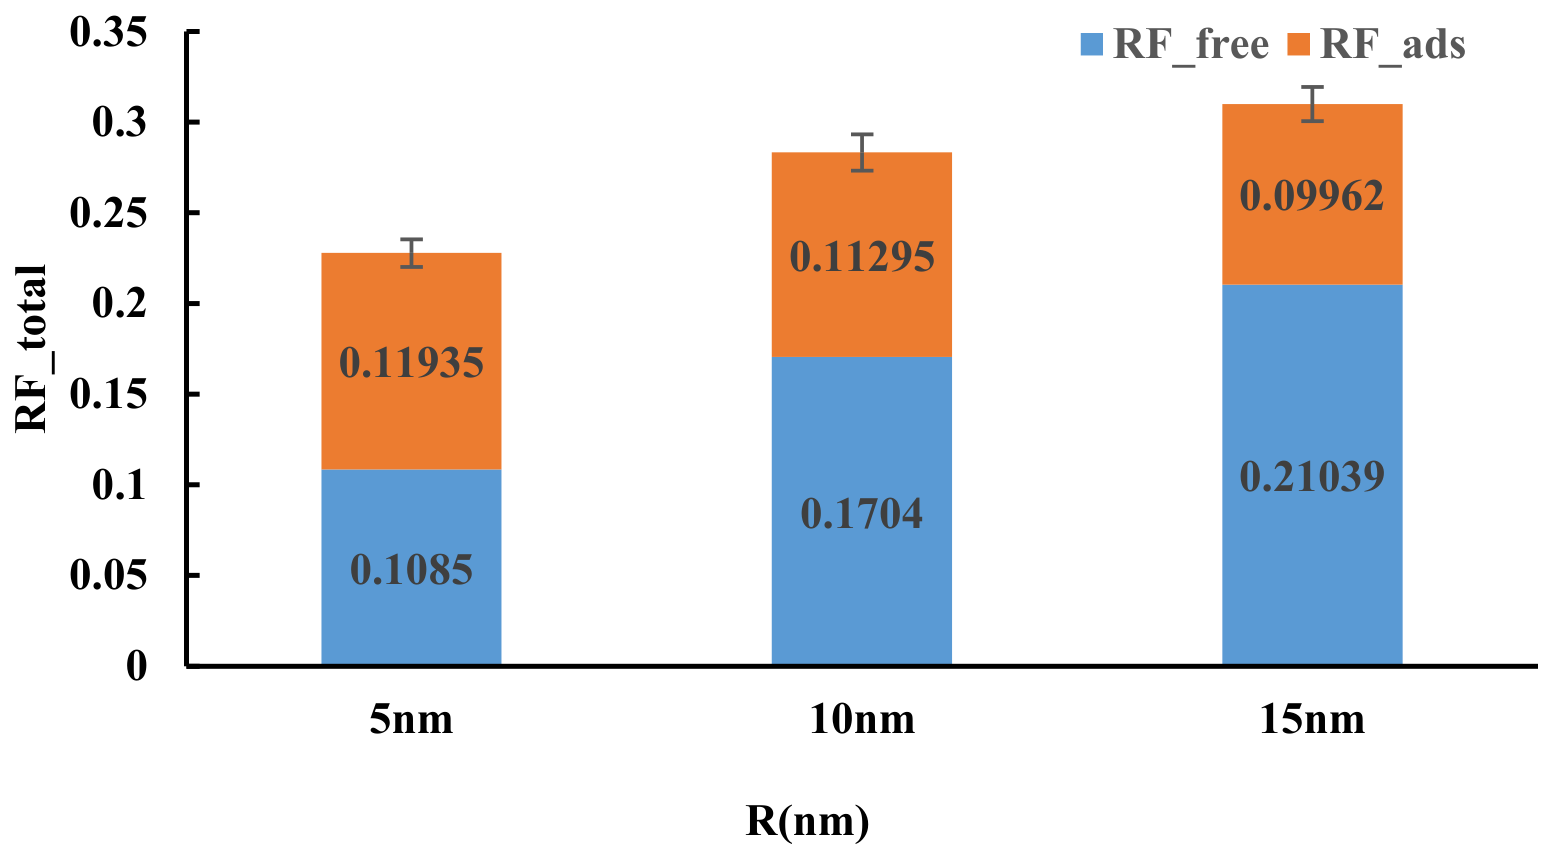
Figure 14 compares the cumulative recovery factors at different pore widths under T = 353.15 K. The total cumulative recovery factor RF_total increases from 0.228 to 0.283 and further to 0.310 as pore width increases from 5 to 10 and 15 nm, respectively. The error bars, expressed as mean ± standard error from four independent simulations, are much smaller than the pore-size-induced differences, indicating that the observed trend is statistically robust.
Decomposition of the cumulative recovery shows that the response to pore-width increase is strongly asymmetric with respect to source type. As pore width increases from 5 to 10 and 15 nm, RF_total increases from 0.228 to 0.283 and 0.310, respectively. This increase is mainly contributed to by RF_free, which rises markedly from 0.108 to 0.170 and then to 0.210, whereas RF_ads changes only slightly and tends to decrease weakly. Therefore, the pore-width effect is not a uniform enhancement of methane recovery from all initial sources, but a source-asymmetric increase dominated by contributions from the population initially classified as free.
Within the present model and statistical definition, this source asymmetry is consistent with the expansion of the pore-center free region as pore width increases, while the near-wall high-density region remains identifiable. As a result, increasing pore width mainly corresponds to a larger contribution originating from the initially free population, whereas the contribution originating from the initially adsorbed population changes much less strongly. This interpretation is also consistent with the initial-state classification and density-profile results, which show that the pore-center free region expands with pore width whereas the near-wall high-density region remains identifiable. Therefore, under the present framework, the pore-width effect on methane production is mainly reflected in a preferential increase in the contribution from the initially free population.

3.4. Effect of Temperature on Methane Recovery and Source Attribution

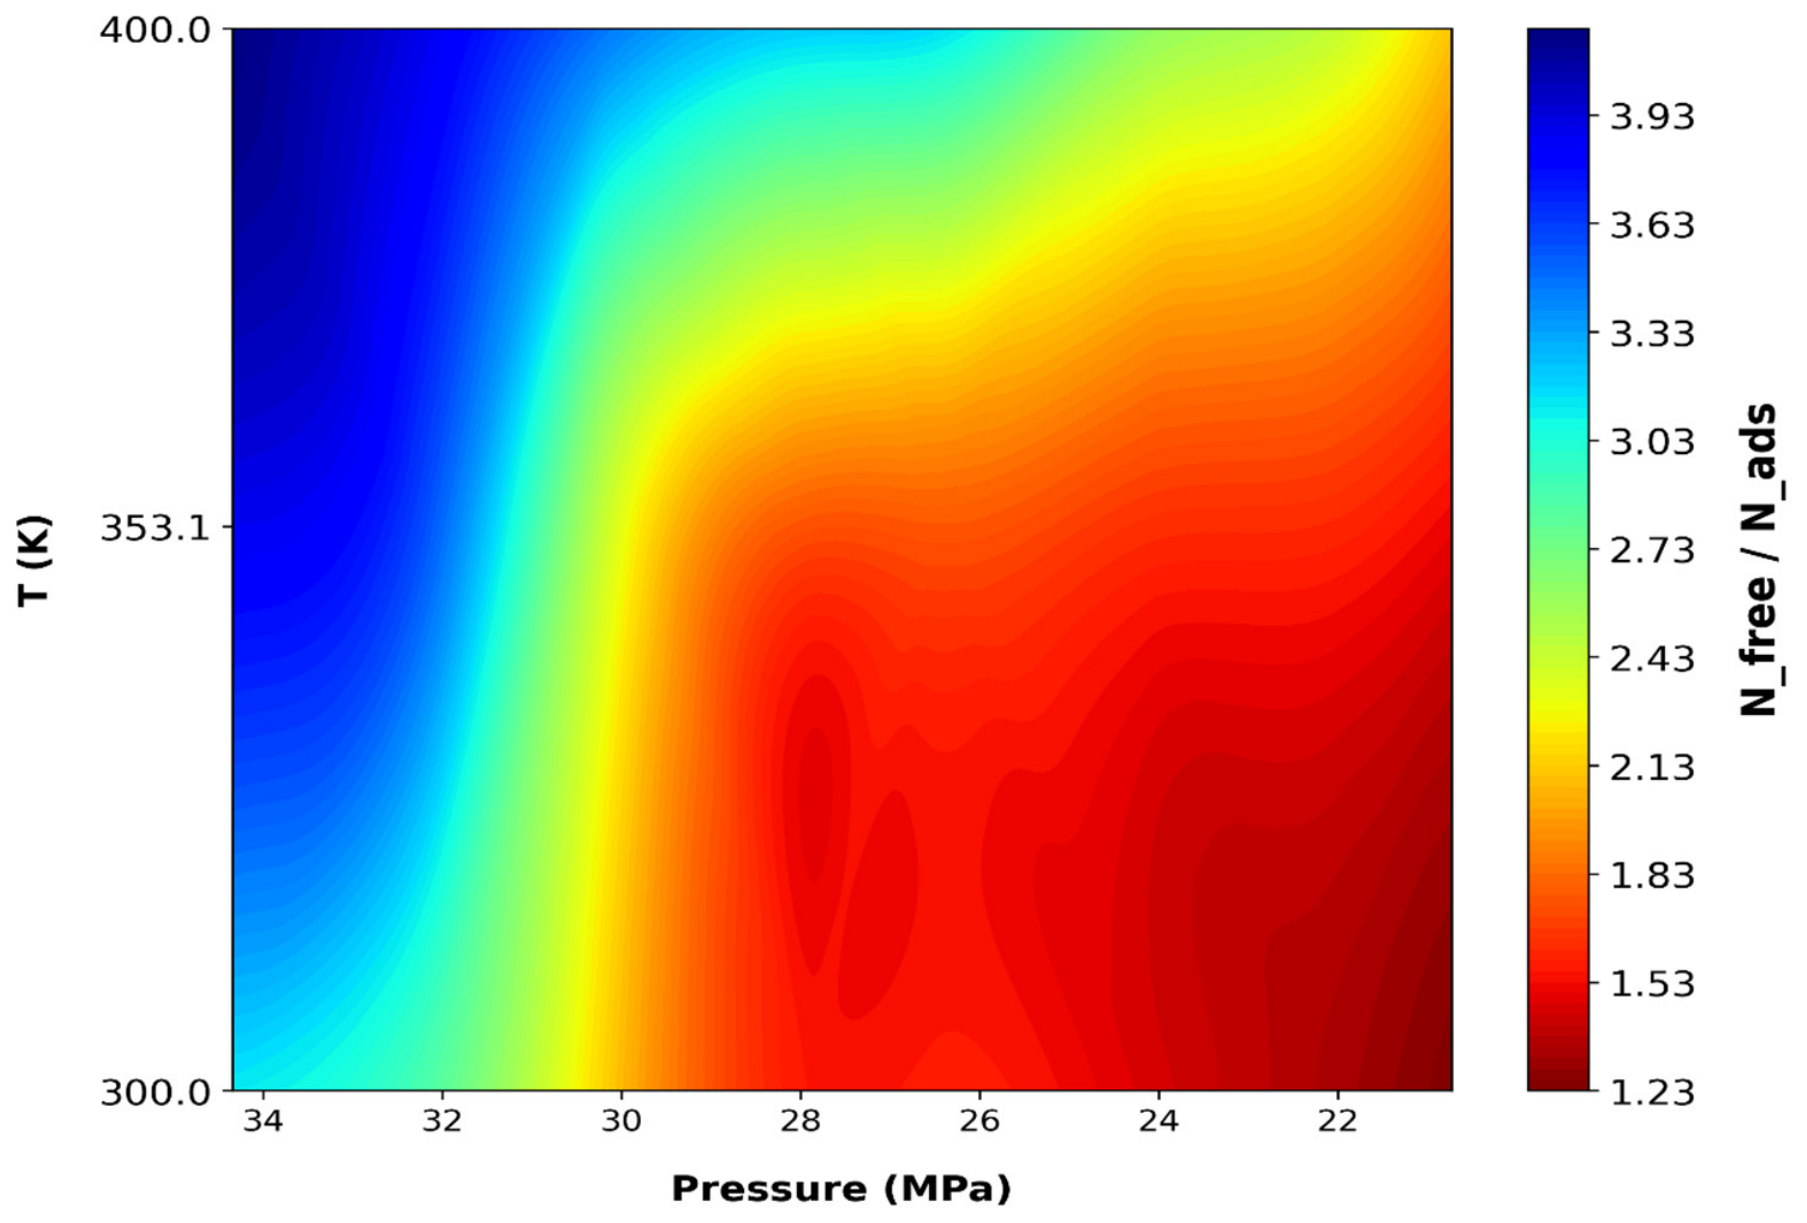
Figure 15 presents the two-dimensional distribution of the source ratio N_free/N_ads at different temperatures for a fixed pore width of R = 10 nm. Here, N_free and N_ads again represent produced methane molecules originating from the initially free and initially adsorbed populations, respectively. As temperature increases from 300 to 400 K, the ratio N_free/N_ads generally increases, and the transition region shifts toward lower pressure. This indicates that higher temperatures allow the production process to remain dominated by the initially free population over a broader depressurization range. This trend already suggests that temperature affects source partitioning in a nonuniform manner, with a preferential strengthening of the initially free population contribution.
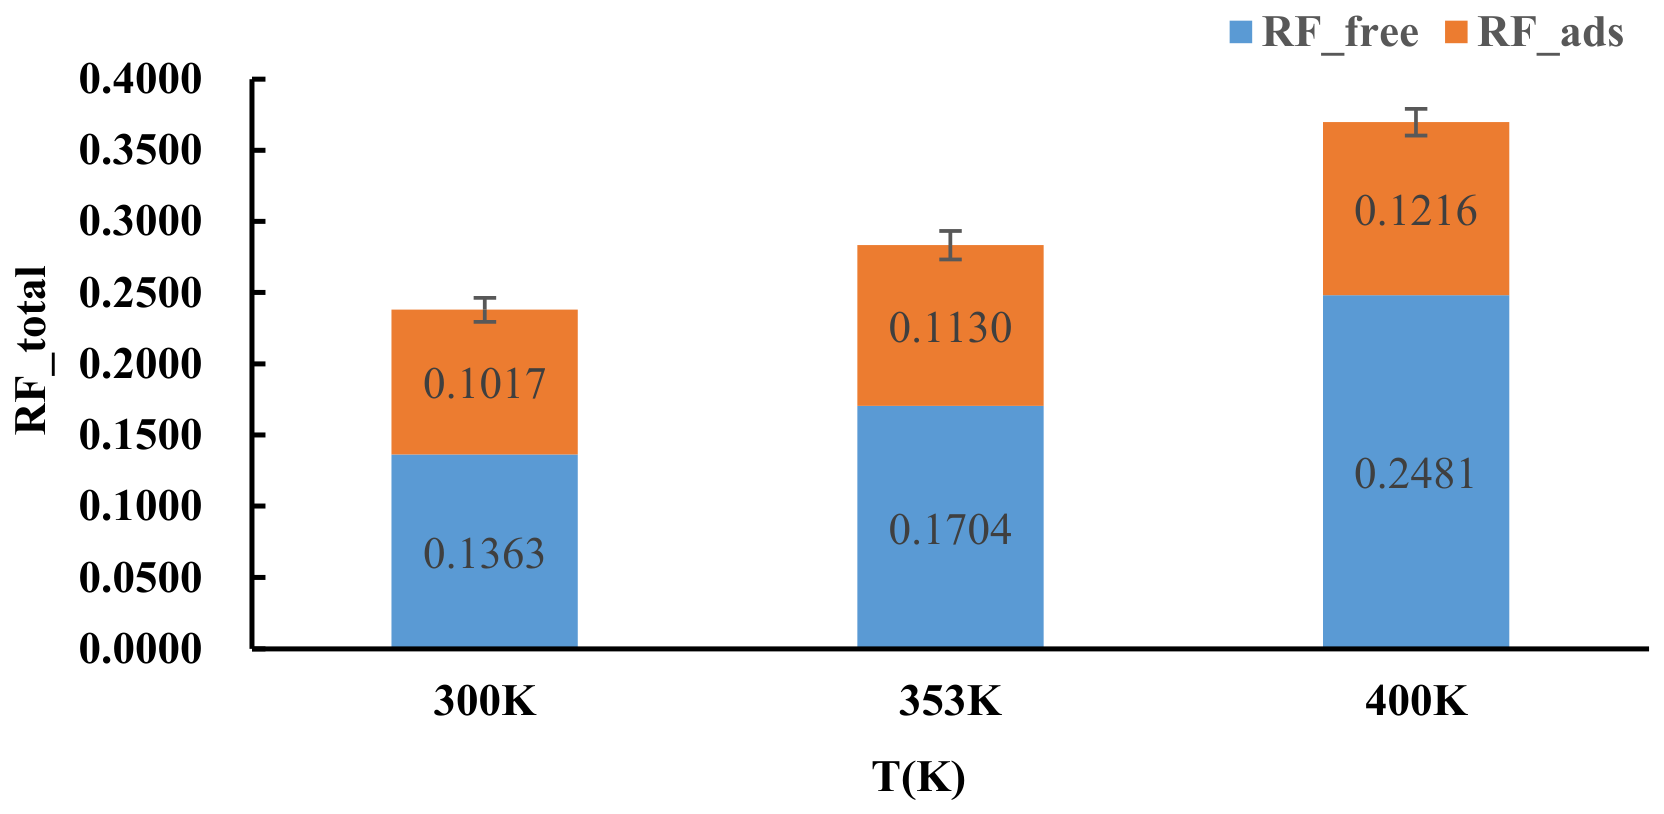
The cumulative recovery factors at different temperatures are shown in Figure 16. The total cumulative recovery factor RF_total increases steadily with temperature, from about 0.24 to 0.28 and then to about 0.37 at 400 K. The corresponding error bars are smaller than the temperature-induced differences, confirming the robustness of the trend. The decomposition shows that both RF_free and RF_ads increase with temperature, but the increase in RF_free is much more pronounced. Specifically, RF_free increases from 0.1363 to 0.1704 and then to 0.2481, whereas RF_ads increases only from 0.1017 to 0.1130 and then to 0.1216.
The temperature effect also shows a clear source asymmetry. As temperature increases from 300 to 400 K at R = 10 nm, RF_total rises from about 0.24 to about 0.28 and then to about 0.37. However, this increase is dominated by RF_free, which increases from 0.1363 to 0.1704 and then to 0.2481, whereas RF_ads increases only from 0.1017 to 0.1130 and then to 0.1216. Therefore, increasing temperature does not enhance methane recovery from all initial sources uniformly, but preferentially strengthens the contribution from methane originating from the initially free population.
Within the present model and statistical definition, this source asymmetry is reflected in the fact that the contribution originating from the initially free population increases much more strongly with temperature than that originating from the initially adsorbed population. This trend is consistent with a stronger temperature response of methane associated with the pore-center free region. Meanwhile, the contribution originating from the initially adsorbed population also increases, but with a comparatively smaller magnitude. Therefore, under the present framework, the temperature effect may be understood as a source-asymmetric enhancement dominated by the stronger response of the initially free population contribution.

3.5. Limitations and Future Work

This study uses an idealized graphene square nanopore to establish and test a one-time initial labeling plus PID–preserving cross-frame tracing framework for quantifying the source attribution of produced methane during stepwise depressurization.
Although the framework has been validated in the idealized nanopore model, real shale pore systems are much more complex. They typically include irregular pore shapes, branched or interconnected channels, diverse mineral types such as quartz, calcite, and clays, complex surface chemistry involving various functional groups and surface charges, variable water content, and multicomponent gas mixtures such as methane, carbon dioxide, and nitrogen. These factors may affect methane migration and production behavior in different ways. Irregular pore shapes and interconnected pore networks can change the accessible pore volume, surface-to-volume ratio, diffusion pathways, and transport tortuosity, leading to nonuniform methane migration and possible local retention in narrow or poorly connected regions. Different mineral components and surface functional groups may alter methane–wall interaction strength and adsorption site distribution, thereby affecting adsorption capacity, desorption difficulty, and the relative contributions of initially adsorbed and free methane. Surface charges and polar functional groups may also influence the distribution of water and gas molecules near the pore walls. The presence of water can compete with methane for adsorption sites, occupy small pores or throats, and partially block transport pathways, thus changing methane desorption and diffusion behavior. In multicomponent gas mixtures, competitive adsorption and different molecular diffusivities may further modify methane release and migration.
The depressurization production process considered in this study has certain limitations and cannot fully reproduce gas production in real shale reservoirs. Field-scale gas production is jointly controlled by multiple factors, including pressure propagation, pore-network connectivity, multiphase transport, geomechanical deformation, and wellbore flow behavior. These processes are beyond the scope of the present idealized nanopore model. Future work will further investigate the relationship between these factors and pressure reduction in order to improve the applicability of the proposed framework to realistic depressurization-driven shale gas production processes.
Future work will extend the present framework to more realistic kerogen pores, mixed organic–inorganic pore systems, methane–water systems, and multicomponent gas mixtures, and will combine source attribution with additional dynamical descriptors. Such extensions would help clarify how pore structure, surface chemistry, and initial methane occurrence jointly affect shale gas recovery during depressurization.

4. Conclusions

Overall, this work establishes a molecular-scale source-tracing framework for quantifying how produced methane is partitioned between the two populations defined at Frame 0 during stepwise depressurization.
  • A molecular-scale source-tracing framework was established by combining GMM-based initial classification with PID–preserving cross-frame tracking. The sensitivity test showed that a ±5% perturbation of ρ caused only about 1% variation in endpoint production, indicating that the classification is robust under the present protocol.
  • During depressurization, the stage-wise source fractions of produced methane change systematically. As pressure decreases from 34.34 to 24.13 MPa, f_free decreases from 79.5% to 62.2%, whereas f_ads increases from 20.5% to 37.8%. These results indicate that produced methane is initially dominated by the contribution originating from the initially free population, whereas the contribution originating from the initially adsorbed population becomes progressively more important at later stages. In particular, the accelerated change around 30.14 MPa suggests that the stage-wise source fractions originating from the two Frame-0-defined populations vary nonuniformly with depressurization stage.
  • Increasing pore width significantly improves ultimate recovery, mainly through enhancement of the contribution originating from the initially free population. At T = 353.15 K, RF_total increases from 0.228 to 0.283 and 0.310 as R increases from 5 to 10 and 15 nm, while RF_free increases from 0.108 to 0.170 and 0.210. This result indicates a source-asymmetric pore-width effect: larger pores are mainly associated with an enhanced contribution originating from the initially free population, whereas the contribution originating from the initially adsorbed population changes only modestly.
  • Increasing temperature also enhances final recovery, again with a stronger effect on the contribution originating from the initially free population. At R = 10 nm, RF_total increases from about 0.24 to 0.28 and then to about 0.37 at 400 K. Over the same range, RF_free rises from 0.1363 to 0.1704 and 0.2481, whereas RF_ads increases more moderately from 0.1017 to 0.1130 and 0.1216. This indicates a source-asymmetric temperature effect, in which the contribution originating from the initially free population shows a much stronger increase than that originating from the initially adsorbed population. These findings provide molecular-scale evidence for understanding the source evolution of produced methane during depressurization-driven shale gas recovery and may support future modeling of shale gas production mechanisms in more realistic pore systems.

Author Contributions

Conceptualization, J.C. and J.S.; methodology, J.S.; software, J.C.; validation, D.L., J.C., X.Y. and J.H.; formal analysis, M.H.; investigation, J.H. and X.Y.; resources, D.L.; data curation, J.S.; writing—original draft preparation, J.C.; writing—review and editing, J.C., J.S. and D.L.; visualization, J.C. and M.H.; supervision, J.S. and D.L.; project administration, J.S.; funding acquisition, J.S. All authors have read and agreed to the published version of the manuscript.

Funding

This research was funded by the Research Project of the Hubei Provincial Department of Education, grant number (B2020032).

Data Availability Statement

The original contributions presented in this study are included in the article. Further inquiries can be directed to the corresponding authors.

Acknowledgments

The authors thank the Cooperative Innovation Center of Unconventional Oil and Gas, Yangtze University, for academic support and helpful discussions.

Conflicts of Interest

The authors declare no conflicts of interest.

Abbreviations

The main abbreviations used in this study are summarized below.
Symbol/AbbreviationDefinition
MDMolecular dynamics
GCMCGrand Canonical Monte Carlo
PIDParticle identifier
GMMGaussian mixture model
RFRecovery factor
NVTConstant number of particles, volume, and temperature ensemble
PPPMParticle–particle particle–mesh
RPore width
TTemperature
ρ*GMM-derived local-density threshold
N_prodNumber of produced methane molecules
N_freeNumber of produced methane molecules originating from the initially free population
N_adsNumber of produced methane molecules originating from the initially adsorbed population
RF_totalTotal cumulative recovery factor
RF_freeCumulative recovery contribution from the initially free population
RF_adsCumulative recovery contribution from the initially adsorbed population
P g a s Methane pore pressure calculated from the virial stress of methane atoms
S x x Summed xx-component of the methane atomic virial stress tensor
S y y Summed yy-component of the methane atomic virial stress tensor
S z z Summed zz-component of the methane atomic virial stress tensor
V e f f Effective pore volume used for pressure normalization

References

  1. Zhang, D.; Yang, T. An overview of shale gas production. Acta Pet. Sin. 2013, 34, 792–801. [Google Scholar] [CrossRef]
  2. Yan, J.P.; Zhang, T.W.; Li, Y.F.; Lv, H.G.; Zhang, X.L. Effect of the organic matter characteristics on methane adsorption in shale. J. China Coal Soc. 2013, 38, 805–811. [Google Scholar]
  3. Wang, R.; Yang, C.X.; Ru, H.Y.; Wang, P.; Yang, Y. Comparison of error in methane isotherm adsorption by volumetric method for shale and coal. Unconv. Oil Gas 2021, 8, 43–48,57. [Google Scholar] [CrossRef] [Scilit]
  4. Curtis, J.B. Fractured shale-gas systems. AAPG Bull. 2002, 86, 1921–1938. [Google Scholar] [CrossRef] [Scilit]
  5. Guo, K.; Zhang, B.; Wachtmeister, H.; Aleklett, K. Characteristic production decline patterns for shale gas wells in Barnett. Int. J. Sustain. Future Hum. Secur. 2017, 5, 12–21. [Google Scholar] [CrossRef] [Scilit] [PubMed]
  6. Wang, H. What factors control shale gas production and production decline trend in fractured systems: A comprehensive analysis and investigation. SPE J. 2017, 22, 562–581. [Google Scholar] [CrossRef] [Scilit]
  7. U.S. Energy Information Administration. Rapid Declines from Horizontal Wells Require More Drilling to Sustain Production. Today in Energy. 5 November 2025. Available online: https://www.eia.gov/todayinenergy/detail.php?id=66564 (accessed on 5 November 2025).
  8. Zhang, T.; Ellis, G.S.; Ruppel, S.C.; Milliken, K.; Yang, R. Effect of organic-matter type and thermal maturity on methane adsorption in shale-gas systems. Org. Geochem. 2012, 47, 120–131. [Google Scholar] [CrossRef] [Scilit]
  9. Merkel, A.; Fink, R.; Littke, R. The role of pre-adsorbed water on methane sorption capacity of Bossier and Haynesville shales. Int. J. Coal Geol. 2015, 147–148, 1–8. [Google Scholar] [CrossRef] [Scilit]
  10. Hu, H.; Zhang, T.; Wiggins-Camacho, J.D.; Ellis, G.S.; Lewan, M.D.; Zhang, X. Experimental investigation of changes in methane adsorption of bitumen-free Woodford Shale with thermal maturation induced by hydrous pyrolysis. Mar. Pet. Geol. 2015, 59, 114–128. [Google Scholar] [CrossRef] [Scilit]
  11. Mohd Aji, A.Q.; Mohshim, D.F.; Maulianda, B.; Elraeis, K.A. Supercritical methane adsorption measurement on shale using the isotherm modelling aspect. RSC Adv. 2022, 12, 20530. [Google Scholar] [CrossRef] [Scilit] [PubMed]
  12. Chen, G.; Lu, S.; Zhang, J.; Xue, Q.; Han, T.; Xue, H.; Tian, S.; Li, J.; Xu, C.; Pervukhina, M. Keys to linking GCMC simulations and shale gas adsorption experiments. Fuel 2017, 199, 14–21. [Google Scholar] [CrossRef] [Scilit]
  13. Wang, L.; Wang, D.; Cai, C.; Li, N.; Zhang, L.; Yang, M. Effect of water occupancy on the excess adsorption of methane in montmorillonites. J. Nat. Gas Sci. Eng. 2020, 80, 103393. [Google Scholar] [CrossRef] [Scilit]
  14. Xiong, J.; Liu, X.; Liang, L.; Zeng, Q. Adsorption behavior of methane on kaolinite. Ind. Eng. Chem. Res. 2017, 56, 6229–6238. [Google Scholar] [CrossRef] [Scilit]
  15. Zhang, B.; Kang, J.; Kang, T. Monte Carlo simulations of methane adsorption on kaolinite as a function of pore size. J. Nat. Gas Sci. Eng. 2018, 49, 410–416. [Google Scholar] [CrossRef] [Scilit]
  16. Muther, T.; Dahaghi, A.K. Monte Carlo simulations on H2 adsorption in kaolinite nanopore in the presence of CO2 and CH4 gases. Fuel 2024, 365, 131249. [Google Scholar] [CrossRef] [Scilit]
  17. Chen, G.; Lu, S.; Liu, K.; Han, T.; Xu, C.; Xue, Q.; Shen, B.; Guo, Z. GCMC simulations on the adsorption mechanisms of CH4 and CO2 in K-illite and their implications for shale gas exploration and development. Fuel 2018, 224, 521–528. [Google Scholar] [CrossRef] [Scilit]
  18. Tang, X.; Zhou, X.; Peng, Y. Molecular simulation of methane adsorption within illite minerals in the Longmaxi Formation shale based on a grand canonical Monte Carlo method and the pore size distribution in southeastern Chongqing, China. J. Nat. Gas Geosci. 2019, 4, 111–119. [Google Scholar] [CrossRef] [Scilit]
  19. Wang, R.; Yang, X.; Li, G.; Zheng, W.; Zou, Z.; Sun, C. Pattern and dynamics of methane/water two-phase flow in deep-shale illite nanoslits. Int. J. Heat Fluid Flow 2024, 110, 109625. [Google Scholar] [CrossRef] [Scilit]
  20. Huang, L.; Ning, Z.; Wang, Q. Molecular simulation of adsorption behaviors of methane, carbon dioxide, and their mixtures on kerogen: Effect of kerogen maturity and moisture content. Fuel 2018, 211, 159–172. [Google Scholar] [CrossRef] [Scilit]
  21. Allen, M.P.; Tildesley, D.J. Computer Simulation of Liquids, 2nd ed.; Oxford University Press: Oxford, UK, 2017; Available online: https://global.oup.com/academic/product/computer-simulation-of-liquids-9780198803195 (accessed on 22 June 2017).
  22. Hansen, J.-P.; McDonald, I.R. Theory of Simple Liquids: With Applications to Soft Matter, 4th ed.; Academic Press: Amsterdam, The Netherlands, 2013; Available online: https://www.sciencedirect.com/book/9780123870322/the-theory-of-simple-liquids (accessed on 12 August 2013).
  23. Tesson, S.; Firoozabadi, A. Methane adsorption and self-diffusion in shale kerogen and slit nanopores by molecular simulations. J. Phys. Chem. C 2018, 122, 23528–23542. [Google Scholar] [CrossRef] [Scilit]
  24. Kazemi, M.; Maleki, H.; Takbiri-Borujeni, A. Molecular dynamics study of transport and storage of methane in kerogen. In Proceedings of the SPE Eastern Regional Meeting, Pittsburgh, PA, USA, 13 September 2016. Paper SPE-184058-MS. [Google Scholar] [CrossRef] [Scilit]
  25. Yu, K.B.; Bowers, G.M.; Loganathan, N.; Kalinichev, A.G.; Yazaydin, A.O. Diffusion behavior of methane in 3D kerogen models. Energy Fuels 2021, 35, 16515–16526. [Google Scholar] [CrossRef] [Scilit]
  26. Deng, J.; Guo, S.; Wan, J.; Zhang, L.; Song, H. Molecular dynamics of CH4 adsorption and diffusion characteristics through different geometric shale kerogen nanopores. Chem. Eng. J. 2024, 500, 156784. [Google Scholar] [CrossRef] [Scilit]
  27. Wang, R.; Datta, S.; Li, J.; Al-Afnan, S.F.K.; Gibelli, L.; Borg, M.K. Interfacial adsorption kinetics of methane in microporous kerogen. Langmuir 2023, 39, 3742–3751. [Google Scholar] [CrossRef] [Scilit] [PubMed]
  28. Sun, Z.; Li, X.; Liu, W.; Zhang, T.; He, M.; Nasrabadi, H. Molecular dynamics of methane flow behavior through realistic organic nanopores under geologic shale condition: Pore size and kerogen types. Chem. Eng. J. 2020, 398, 124341. [Google Scholar] [CrossRef] [Scilit]
  29. Collell, J.; Galliero, G.; Vermorel, R.; Ungerer, P.; Yiannourakou, M.; Montel, F.; Pujol, M. Transport of multicomponent hydrocarbon mixtures in shale organic matter by molecular simulations. J. Phys. Chem. C 2015, 119, 22587–22595. [Google Scholar] [CrossRef] [Scilit]
  30. Lin, K.; Yuan, Q.; Zhao, Y.-P. Using graphene to simplify the adsorption of methane on shale in MD simulations. Comput. Mater. Sci. 2017, 133, 99–107. [Google Scholar] [CrossRef] [Scilit]
  31. Plimpton, S. Fast parallel algorithms for short-range molecular dynamics. J. Comput. Phys. 1995, 117, 1–19. [Google Scholar] [CrossRef] [Scilit]
  32. Luo, P.; Zhong, N.; Tang, Y. Pore structure of organic matter in the lacustrine shale from high to over mature stages: An approach of artificial thermal simulation. ACS Omega 2022, 7, 17784–17796. [Google Scholar] [CrossRef] [Scilit] [PubMed]
  33. Frenkel, D.; Smit, B. Understanding Molecular Simulation: From Algorithms to Applications, 2nd ed.; Academic Press: San Diego, CA, USA, 2001; Available online: https://www.sciencedirect.com/book/9780122673511/understanding-molecular-simulation (accessed on 19 October 2001).
  34. Hockney, R.W.; Eastwood, J.W. Computer Simulation Using Particles, 1st ed.; IOP Publishing: Bristol, UK, 1988; Available online: https://iopscience.iop.org/book/978-0-7503-1172-3 (accessed on 24 March 2021).
  35. Jorgensen, W.L.; Maxwell, D.S.; Tirado-Rives, J. Development and testing of the OPLS all-atom force field on conformational energetics and properties of organic liquids. J. Am. Chem. Soc. 1996, 118, 11225–11236. [Google Scholar] [CrossRef] [Scilit]
  36. Mosher, K.; He, J.; Liu, Y.; Rupp, E.; Wilcox, J. Molecular simulation of methane adsorption in micro- and mesoporous carbons with applications to coal and gas shale systems. Int. J. Coal Geol. 2013, 109–110, 36–44. [Google Scholar] [CrossRef] [Scilit]
  37. Falk, K.; Sedlmeier, F.; Joly, L.; Netz, R.R.; Bocquet, L. Ultralow liquid/solid friction in carbon nanotubes: Comprehensive theory for alcohols, alkanes, OMCTS, and water. Langmuir 2012, 28, 14261–14272. [Google Scholar] [CrossRef] [Scilit] [PubMed]
  38. Nosé, S. A unified formulation of the constant temperature molecular dynamics methods. J. Chem. Phys. 1984, 81, 511–519. [Google Scholar] [CrossRef] [Scilit]
  39. Thompson, A.P.; Plimpton, S.J.; Mattson, W. General formulation of pressure and stress tensor for arbitrary many-body interaction potentials under periodic boundary conditions. J. Chem. Phys. 2009, 131, 154107. [Google Scholar] [CrossRef] [Scilit] [PubMed]
  40. Lu, J.; Lazar, E.A.; Rycroft, C.H. An extension to Voro++ for multithreaded computation of Voronoi cells. Comput. Phys. Commun. 2023, 291, 108832. [Google Scholar] [CrossRef] [Scilit]
  41. Cui, J.; Cheng, L. A theoretical study of the occurrence state of shale oil based on the pore sizes of mixed Gaussian distribution. Fuel 2017, 206, 564–571. [Google Scholar] [CrossRef] [Scilit]
  42. Cormen, T.H.; Leiserson, C.E.; Rivest, R.L.; Stein, C. Introduction to Algorithms, 3rd ed.; MIT Press: Cambridge, MA, USA, 2009; Available online: https://mitpress.mit.edu/9780262033848/introduction-to-algorithms/ (accessed on 31 July 2009).
  43. Ren, W.; Li, G.; Tian, S.; Sheng, M.; Geng, L. Adsorption and surface diffusion of supercritical methane in shale. Ind. Eng. Chem. Res. 2017, 56, 3446–3455. [Google Scholar] [CrossRef] [Scilit]
  44. Chen, F.; Tang, J.; Wang, J. Effects of pi-pi stacking on shale gas adsorption and transport in nanopores. ACS Omega 2023, 8, 46577–46588. [Google Scholar] [CrossRef] [Scilit] [PubMed]
  45. Deng, J.; Zhang, Q.; Zhang, L.; Lyu, Z.; Rong, Y.; Song, H. Investigation on the adsorption properties and adsorption layer thickness during CH4 flow driven by pressure gradient in nano-slits. Phys. Fluids 2023, 35, 016104. [Google Scholar] [CrossRef] [Scilit]
Figure 1. Schematic diagram of the graphene nanopore model. (a) Top view of the model, with planar dimensions L x = 5   n m and L y = 5   n m. (b) Three-dimensional structure of the square nanopores, where R   represents the pore width.
Energies 19 02885 g001
Figure 2. Snapshots of methane molecules in graphene nanopores with different pore widths: (a) R = 5 nm, (b) R = 10 nm, and (c) R = 15 nm. The yellow and red particles represent CH4 molecules and graphene atoms, respectively.
Energies 19 02885 g002
Figure 3. Instantaneous pressure evolution during the initial equilibration stage (0–0.3 ns). The mean pressure averaged over the last 100,000 steps is P ˉ = 37.5 M P a .
Energies 19 02885 g003
Figure 4. Schematic of the stepwise depressurization procedure. (a) Removing methane molecules within a deletion slab of thickness δ_del = 0.2 nm; (b) extending the simulation box by ΔL_y = 0.2 nm; (c) repositioning the removed methane molecules into the bulk region with unchanged PIDs; (d) relaxing the system under NVT to a new steady state.
Energies 19 02885 g004
Figure 5. Bimodal local-density distributions of methane and GMM-derived thresholds at different pore widths.
Energies 19 02885 g005
Figure 6. Phase-state distribution of CH4 molecules in graphene nanopores with different pore widths.
Energies 19 02885 g006
Figure 7. Flowchart of PID–based cross-frame source tracing for methane molecules.
Energies 19 02885 g007
Figure 8. Schematic illustration of phase labeling and molecular origin tracking.
Energies 19 02885 g008
Figure 9. Equilibrium z-averaged methane density profiles in graphene square nanopores with pore widths of R = 5 , 10, and 15 nm at T = 353.15 K .
Energies 19 02885 g009
Figure 10. Variation in the GMM-derived density threshold ρ*. (a) ρ* as a function of pore width R at fixed T = 353.15 K. (b) ρ* as a function of temperature T at fixed R = 10 nm.
Energies 19 02885 g010
Figure 11. Sensitivity of cumulative recovery contributions to the density threshold ρ for two representative cases: (a) R = 5   n m and T = 353   K ; (b) R = 10   n m and T = 300   K . The threshold was perturbed to 0.95 ρ and 1.05 ρ , and the resulting RF_free and RF_ads remain close to those obtained with the original ρ .
Energies 19 02885 g011
Figure 12. Stage-wise composition of production originating from initially free and initially adsorbed populations (R = 10 nm, T = 353.15 K).
Energies 19 02885 g012
Figure 13. Two-dimensional distribution of the stage-wise production ratio N_free/N_ads during depressurization for different pore widths.
Energies 19 02885 g013
Figure 14. Final recovery and its decomposition into contributions from the initially free and initially adsorbed populations under different pore widths.
Energies 19 02885 g014
Figure 15. Two-dimensional distribution of the stage-wise production ratio N_free/N_ads during depressurization at different temperatures.
Energies 19 02885 g015
Figure 16. Final recovery and its decomposition into contributions from the initially free and initially adsorbed populations at different temperatures.
Energies 19 02885 g016
Disclaimer/Publisher’s Note: The statements, opinions and data contained in all publications are solely those of the individual author(s) and contributor(s) and not of MDPI and/or the editor(s). MDPI and/or the editor(s) disclaim responsibility for any injury to people or property resulting from any ideas, methods, instructions or products referred to in the content.