1. Introduction
The productive horizons of the Kurovdagh field were investigated to assess optimization strategies and control mechanisms aimed at improving reservoir development efficiency and production performance [
1].
Forecasting oil production and identifying the characteristics and factors influencing it have always been important in the processes of controlling and regulating field development. A reliable oil production forecast is based on the generalization and systematization of geological and field data and can be improved through a comparative analysis of field development conducted for formations, production facilities, or deposits similar in geotechnological parameters of reservoir systems [
2,
3,
4].
More advanced reservoir development models may incorporate additional components, including time-dependent well performance behavior, economic threshold constraints, and other operational parameters. Although these factors can significantly improve the representation of specific field conditions, they mainly serve as extensions of the fundamental methodological framework employed in this study [
5]. Consequently, the selection of an appropriate development strategy and production system should be based on the geological characteristics, operational conditions, and production history of the reservoir under investigation [
6]. The evaluation of hydrocarbon reservoirs and productive horizons is aimed at obtaining comprehensive information on reservoir performance, production conditions, fluid-flow behavior, and changes occurring during field exploitation. Such information is essential for designing efficient production systems, selecting suitable development and recovery techniques, optimizing oil production equipment, and establishing economically justified operating regimes that maximize hydrocarbon recovery. Effective control of field development requires reliable geological and production data, including reservoir fluid properties, reservoir and bottom-hole pressure dynamics, the evolution of water–oil contacts, and the technical condition of producing wells. Continuous monitoring of these parameters provides the basis for informed decision-making and supports the efficient management of reservoir development processes [
1,
4].
Recent studies on reservoir characterization, fracture effectiveness evaluation, and wellbore integrity analysis demonstrate the importance of integrating geological heterogeneity, fracture systems, and reservoir flow behavior into production optimization and recovery assessment processes.
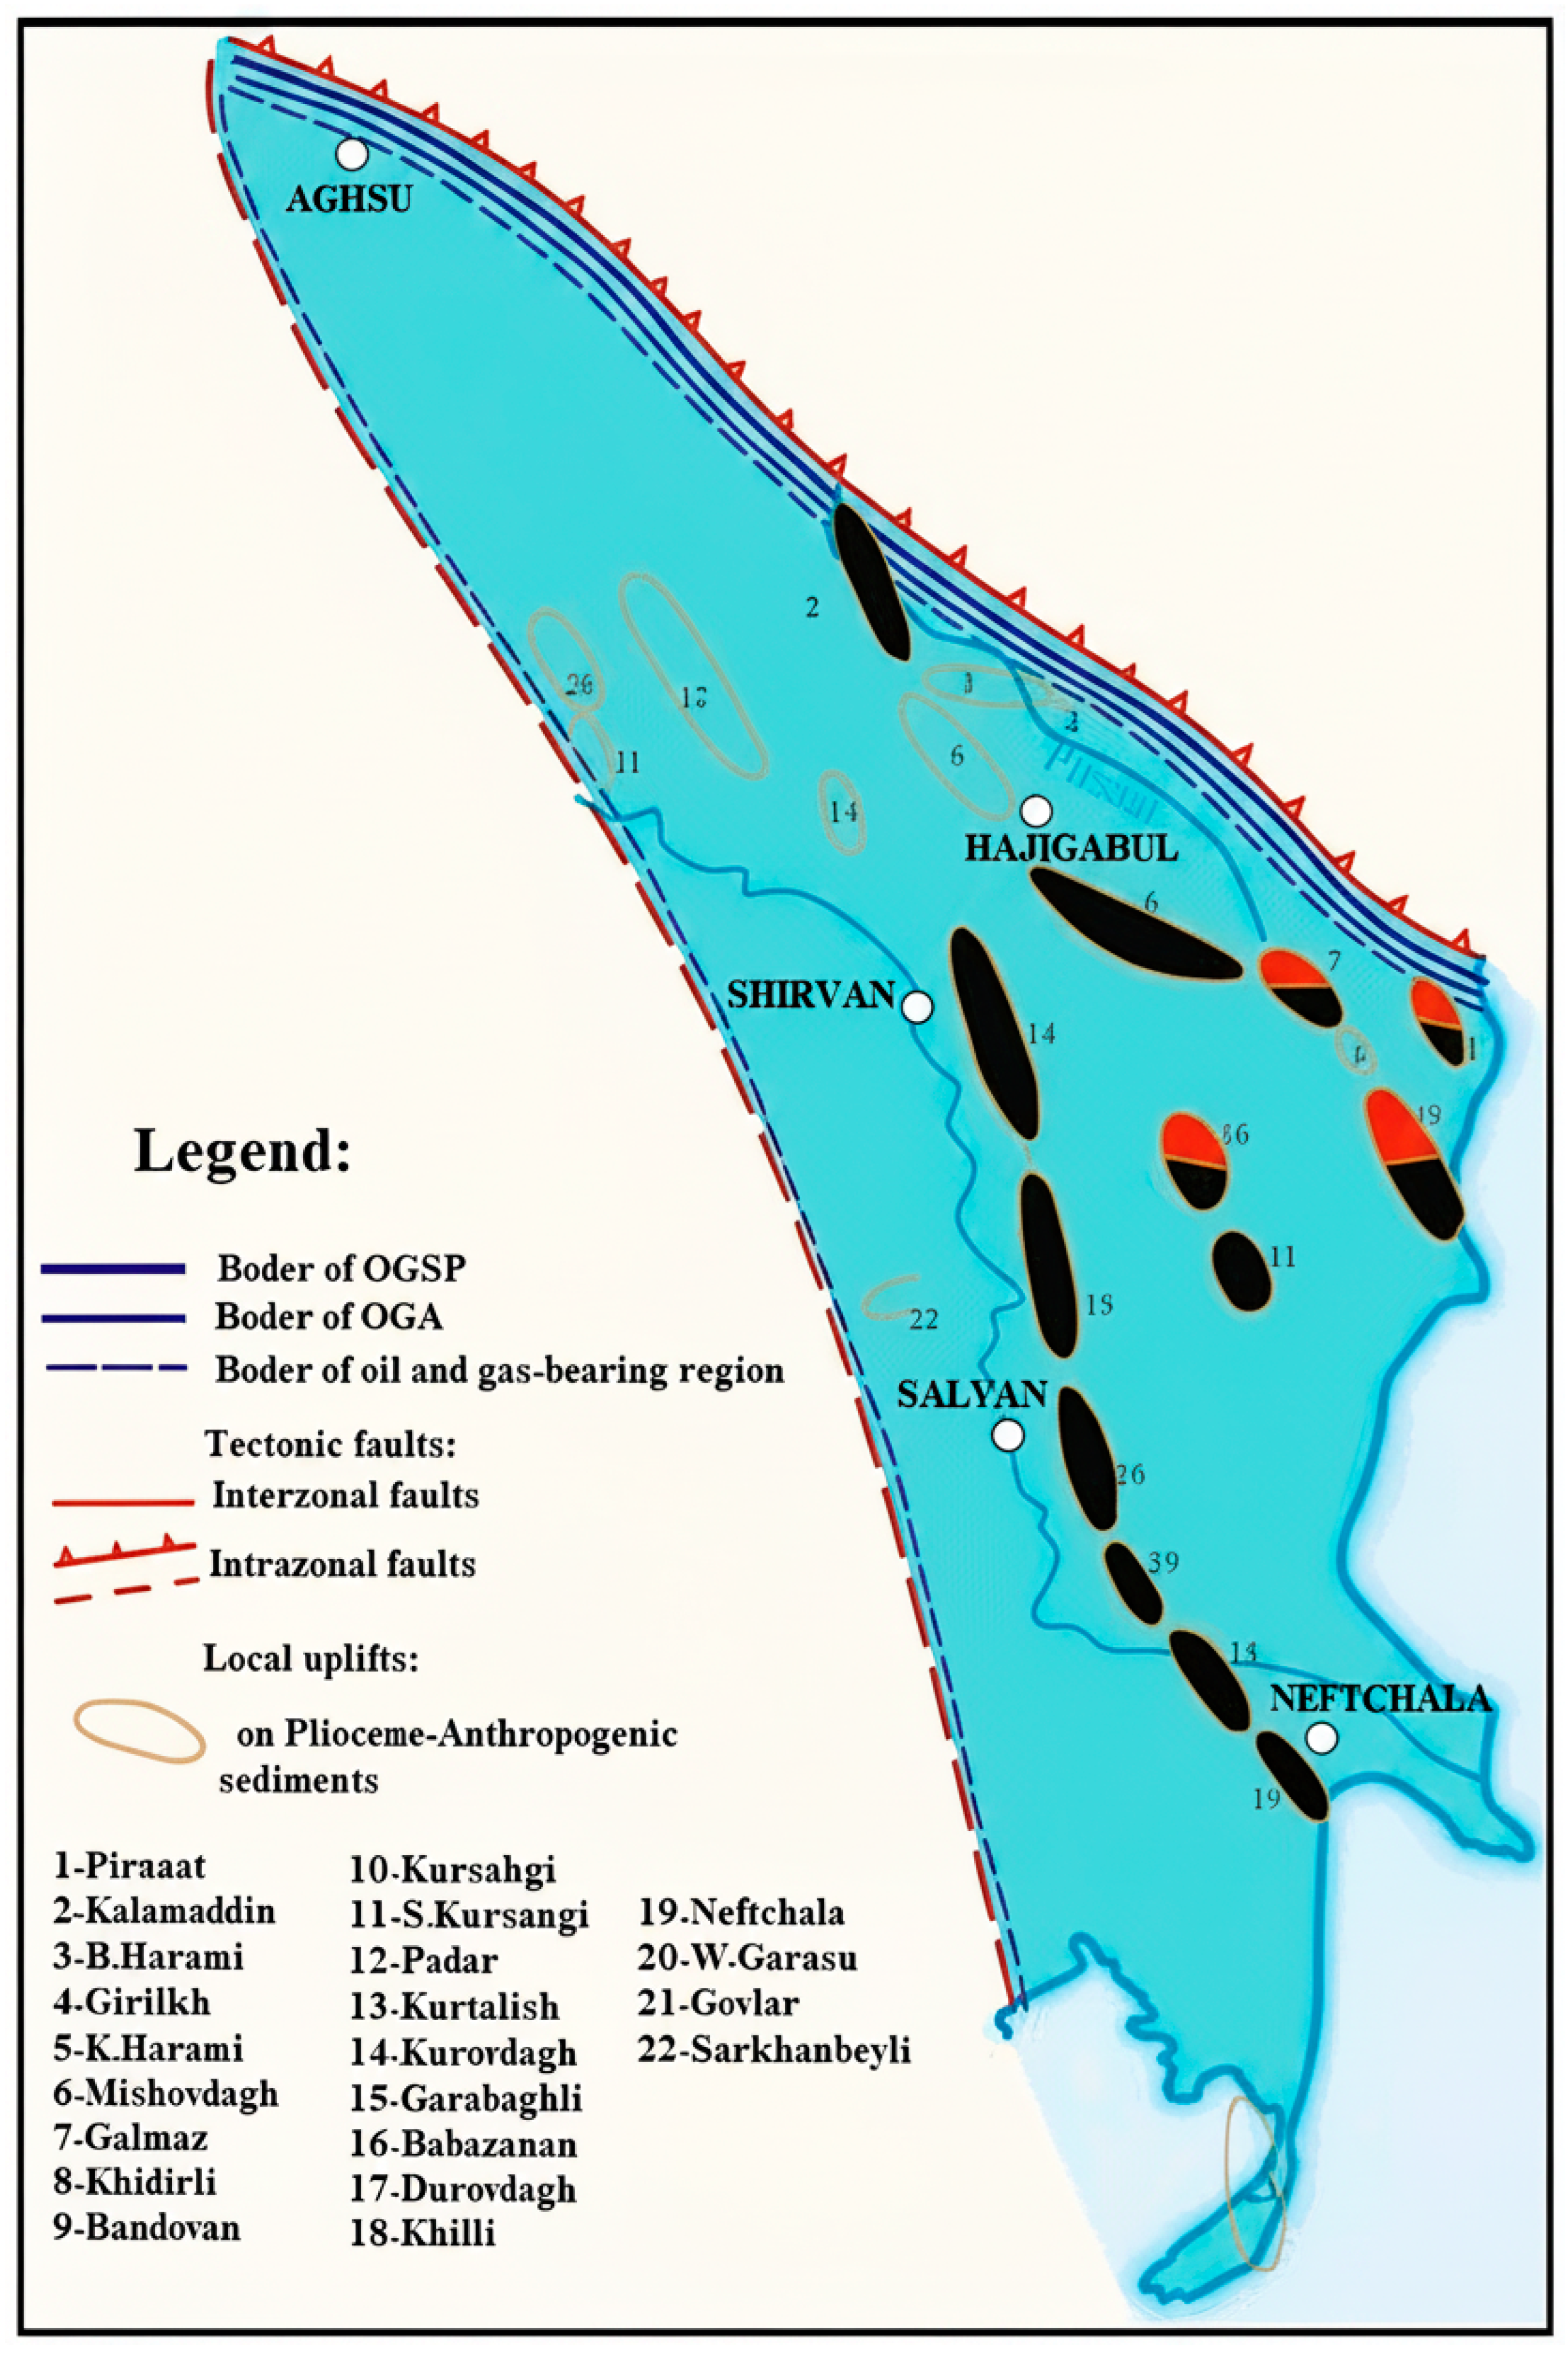
Information about the field. The Kurovdagh field is located in the Kurovdagh–Neftchala anticline zone, between the Padar and Garabaghli fields, adjacent to the city of Shirvan. Morphologically, the territory of the Lower Kura Depression, where the Kurovdagh field is located, represents a wide plain extending along the Kura River, complicated by the not-too-high elevations. Tectonically, it is a brachyanticline belonging to the Padar–Babazanan–Neftchala tectonic zone (
Figure 1) [
7].
The area of the field is 115 km2. The Kurovdagh deposit is located in the Kura sedimentation basin, which has an area of approximately 2500 km2. Its central part is complicated by numerous mud volcanoes. Gas and oil are released to the surface through these volcanoes. Most of the area of the field corresponds to the Salyan plain with a hypsometric level of 22–24 m. In the central part of the plain, there are two hills, Pirgari and Goytepe, which are a geomorphological expression of the Pliocene fold.
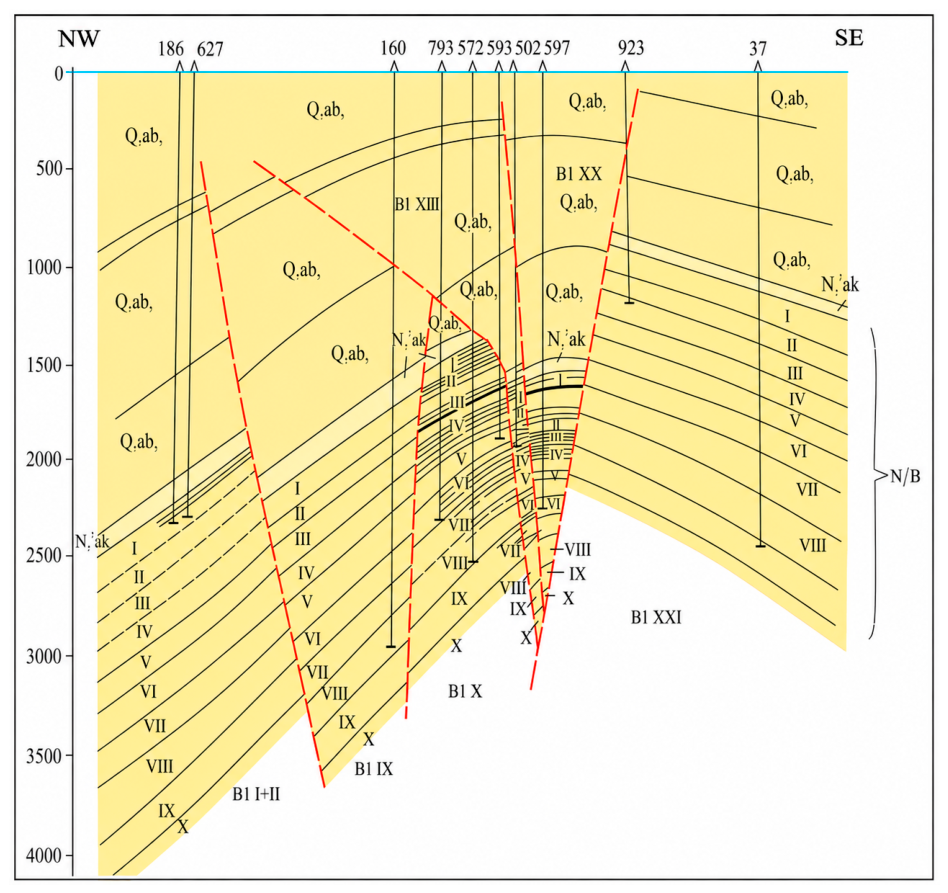
The geological structure of the Kurovdagh field includes the Pontic, Productive Series (PS), Aghjagil, Absheron, Baku, Khazar, and Quaternary sediments (
Figure 2) [
8].
Khazar, Baku, and Absheron sediments have been studied in detail through geological mapping work carried out here, and these sediments are exposed to the surface. The Aghjagil and Productive Series sediments were studied through structural-prospecting and deep-exploration drilling.
The PS sediments are considered the main oil–gas complex in the Lower Kura Depression. These sediments come to the surface along the Langebiz–Alat uplift zone, as well as in the crest parts of the Babazanan, Aghzibir, Mishovdagh, Boyuk andKichik, Harami, and Kalameddin folds. The PS sediments were uncovered in other structures by deep drilling.
Hypsometrically, the top of the PS sediments is 500–600 m (Kichik Harami, Langebiz–Alat uplift zone) above sea level. It is buried in synclines to a depth of 4000 m and more (Garadaghly synclinorium). Thus, the amplitude of the hypsometric position of the top of the PS in the Lower Kura Depression varies between approximately 4500 and 5000 m.
The section of PS is mainly characterized by the instability of the lithological composition of sandy horizons and clayey parts. The upper part of the section, which is 800 m thick, is characterized by its relatively high sand content. The clay content in the section increases from the Kurovdagh anticline to the southwest and northeast.
The total thickness of the PS sediments varies between 3000 and 3500 m and consists of alternations of sand, sandstone, aleurite, and clay. Sand and sandstones are characterized by large grain size and good sorting and have high porosity (16–28%), and permeability varies between 35 and 117 mD. The lower section of the Productive Series comprises all major subdivisions of the Absheron facies, namely the Post-Kirmaki Clayey (PKC), Post-Kirmaki Sandy (PKS), Kirmaki Suite (KS), Pre-Kirmaki (PK), and Gala Suite (GaS). Nevertheless, their equivalents in the Kurovdagh field are characterized mainly by clay-dominated deposits. The total thickness of the sediments of the lower stage is 390 m.
The upper horizons of the PS (horizons I–VI) are characterized by maximum sand content (30–45%), in the lower horizons; the sand content does not exceed 12–25%. The XX horizon is the base horizon of the upper stage of the PS, consisting of alternating layers of conglomerate, sand, and clay. The total thickness of the upper-stage sediments is 2850 m.
The sediments of the Aghjagil stage consist of dull-gray clays and sands. The sand layers are mainly located in the middle part of the section. The thickness is 60–260 m.
Absheron sediments are mainly exposed to the earth’s surface in the crest and southwestern limb of the structure. According to the composition and lithological characteristics of the fauna, they are divided into three substages, and all three substages consist of the section of the research area.
The Upper Absheron substage is composed predominantly of clay, sand, and sandstone layers exhibiting variable lithological characteristics and colors, with a total thickness ranging from 270 to 520 m. The Middle Absheron substage is represented by alternating sandy limestones, well-sorted coarse-grained sands, limestone beds, and occasional pebble-bearing intervals, with an average thickness of approximately 80 m. Lithologically, the Lower Absheron substage consists mainly of light-brown clays interbedded with sands and minor volcanic ash layers, reaching a thickness of about 630 m. The Middle Absheron sediments are relatively rich in sandy deposits and contain two to three hydrocarbon-bearing horizons, whereas the Lower Absheron substage is dominated by clay-rich sediments. The cumulative thickness of the Absheron succession in the study area reaches approximately 2000 m.
The sediments of the Khazar and Baku stages consist of grayish-brown clays with clayey and volcanic ash interlayers. The thickness of the sediments varies between 150 and 250 m.
Quaternary sediments are of continental and marine origin and are of alluvial, diluvial, and lacustrine types. They consist mainly of clays. These sediments are sometimes covered by thick (up to 600 m) mud volcano breccias.
From a tectonic point of view, the Kurovdagh uplift is a brachyanticline directed from northwest to southeast, extending from the southwestern saddle to the Pirgari volcano. The Kurovdagh structure forms a pronounced asymmetric brachyanticline with a longitudinal extent of approximately 22–25 km and a maximum width of about 5 km.
From the crest towards the limbs, the thickness of individual stratigraphic units increases, which is explained by the syndepositional nature of the fold. This phenomenon is more pronounced in Kurovdagh than in other folds of the Lower Kura Depression [
9].
The fold axis is controlled by a regional deep longitudinal fault, while the overall structure is further dissected by two major longitudinal fault systems extending throughout the Neftchala–Kurovdag tectonic zone. As a result of these longitudinal faults, the fold is divided into three main areas: northeast, central, and southwest. The central block of the northwest part of the fold has subsided relative to the other blocks. The mud volcano present in the area is associated with this fault.
In addition to the longitudinal fault, a number of transverse and radial faults have also been identified in the area. Two of them, cutting the southwestern limb in a radial direction (the eastern limb has been downthrown by 70–120 m), play an important role in the distribution of horizons I–III of the PS deposits (
Figure 2).
The amplitudes of the faults identified in the eastern limb of the structure vary between 100 and 270 m. The northwestern periclinal part of the fold exhibits a complex structural configuration controlled by both longitudinal and radial faults. The hinge line of the fold plunges gently northwestward at an angle of approximately 2–3°. The southwestern limb is broken by a number of transverse faults. These, in turn, divide the limb into three blocks: southeastern, central, and northwestern.
In the central and northwestern periclinal part of the fold are the throats of mud volcanoes, the peaks of which are Goytepe and Pirgari.
The northwestern periclinal of the Kurovdagh fold extends from the peak of Pirgari to the north for 10 km in the direction of Lake Hajigabul. A part of the northwestern periclinal has subsided around the Pirgari volcano.
The seismic profile materials and data from exploration drilling conducted from the southwest to the southeast in the direction of the Pirgari volcano show the burial of sediments, in other words, the folding of the layers, which is explained by the debris of the mud volcano.
The structure of the northeastern limb of the Kurovdagh brachyanticline is somewhat complex. This limb is divided into blocks that have undergone stepwise subsidence relative to each other.
The southwestern limb of the Kurovdagh anticline represents a large structural element approximately 14 km long and 1.5–2.5 km wide within the horizon I interval, with a vertical structural amplitude of nearly 1850 m. Exploration drilling and subsequent geological investigations revealed commercial oil and gas accumulations throughout horizons I–X of the Productive Series. Hydrocarbon distribution within the field is markedly uneven, both stratigraphically and areally, reflecting the strong control exerted by fracture systems and tectonic discontinuities on reservoir compartmentalization and fluid migration pathways.
Industrial-scale hydrocarbon accumulations in the Kurovdagh field were identified within 17 productive horizons, including AP03, AP02, AP01, Aghjagil, and the PS01–PS13 intervals. Based on well data, it was determined that the main hydrocarbon resources of the field are concentrated in the southwestern limb. Oil-bearing objects were also discovered in horizons II, III, IV, V, and VI of the PS, in the Aghjagil and Middle Absheron-stage sediments in this part of the field.
In the central part of the field, horizons I and II are high oil-bearing. In the Aghjagil stage, horizons III, IV, and V are also high oil-bearing. In the northwestern periclinal of the field, the oil content of horizon II, in decreasing order of horizons V, IV, I, III, and Aghjagil-stage sediments was determined. In the southeastern periclinal, the highest oil content was determined in horizon IV, then in horizons III, V, II, VI, and I, as well as in the Aghjagil stage.
In the southeastern part of the NE limb of the field, gas objects were identified in horizons I–III of the PS. Gas layers were also identified in objects I–II of the Middle Absheron. Average debits for wells operating from individual horizons are 0.3–200 t/day for oil and 1.9–155 thousand m3/day for gas. Wells on most horizons yield water simultaneously with oil. The physicochemical properties of crude oil exhibit considerable variability both vertically and laterally across the Kurovdagh field. For example, the average oil density within horizon I of the Productive Series is approximately 915 kg/m3, whereas lower values of about 865 kg/m3 are observed in horizons VII and VIII, indicating variations in reservoir fluid characteristics throughout stratigraphic succession.
At present, hydrocarbon production is concentrated within ten actively developed horizons, including AP02, AP01, Aghjagil, and PS01–PS08. The remaining productive intervals are currently inactive due to the abandonment or technical decommissioning of production wells, which has limited their continued exploitation.
Throughout the entire exploitation process, 70% of the wells in the field were drilled in AP 02 and PS01, 20% in PS02–PS05, and 10% in PS03 and PS05 to the lower horizons of the PS. AP01 and Aghjagil horizons are developed through “returned” wells.
The Kurovdagh field is also an old depleted field and has a significant amount of residual recoverable reserves. Industrial oil content in the field was first identified in 1955 by structural wells (No. 37, 42, 43, 47) drilled in the lower part of the southwestern limb of the fold. Later, as a result of drilling prospecting–exploration wells, industrial oil content was identified in the Aghjagil stage and in the sediments of the PS.
3. Materials and Methods
We chose the Shewhart control chart method to regulate the reservoir development process.
Shewhart control charts are preferred over other monitoring methods for mature oil field production due to their clarity, simplicity, and statistical foundation. They enable the distinction between random fluctuations and systematic changes, allowing early detection of anomalies such as sudden production declines or water breakthroughs, and facilitate assessment of process stability over time. The use of standard control limits provides objectivity and supports timely corrective actions. Moreover, Shewhart charts can be easily integrated with reservoir analysis and enhanced oil recovery strategies, making them a practical and effective tool for comprehensive field management.
According to the method, the number of measurements of the parameters
(annual oil production volumes, produced water, injected water, number of wells, water cut, oil recovery, and water production per well) is equal to
n. The average value of the investigated parameter was determined according to the following expression:
The deviation range (
R), in turn, is determined by the following formula:
Then, the optimal development zone of the process, or the top and bottom control limits (TCL and BCL), are determined by the following formula:
where the value
taken from a special table developed by Walter A. Shewhart is equal to 1.128 [
11].
In this study, the coefficient d2 = 1.128 was selected based on the standard Shewhart moving range method using subgroup size n = 2 for sequential annual production data. The moving range approach is commonly applied for long-term continuous monitoring processes where paired consecutive observations are analyzed.
The study covers horizons PS03, PS06, and Aghjagil of the Kurovdagh field.
Horizon PS03 of the Kurovdagh field has been developed for more than 64 years since 1959.
This object is characterized by significant heterogeneity, which is the reason for the different characteristics of the realization of reserves on the object [
12]. It was put into operation with an oil production of 1 thousand tons. In 1960, this number was increased to 43.5 thousand tons.
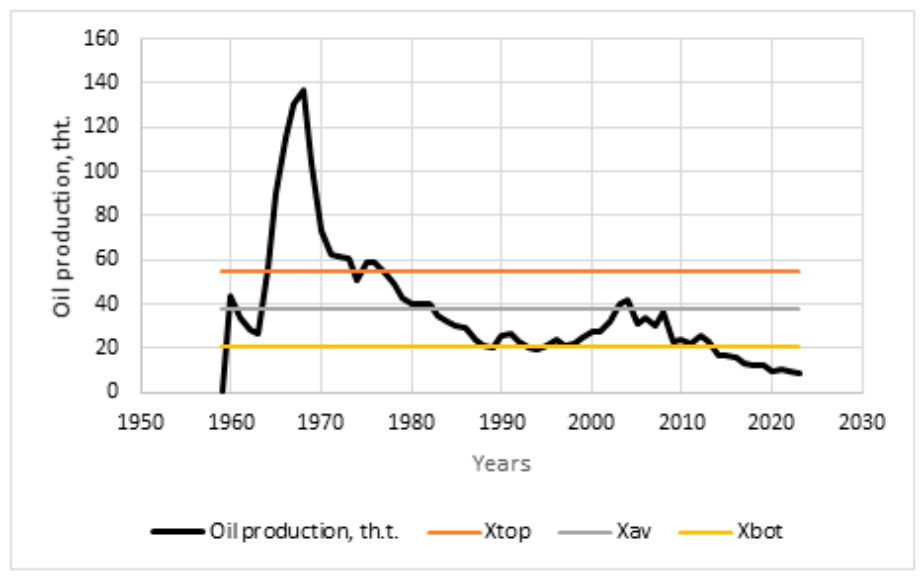
The analysis based on Shewhart’s model shows that for this horizon, the area of statistical regulation (top and bottom limits) of annual oil production is within 21–55 thousand tons (Xtop = 55, Xaverage = 38, Xbottom = 21).
However, the established limits are symmetrical with respect to the center. If the annual oil production volume exceeds the prescribed normative limits, this indicates a violation (deviation from the optimal process, disruption of the optimal operating conditions, departure from optimal performance, breakdown of optimal process control) of the optimal development process and the need to take measures that will bring the process back to its optimal course.
As can be seen, sharp fluctuations in this parameter are noted at the initial stage of development. The production curve from 1964 to 1977 is located beyond the top limit of regulation, so the amount of extracted product from the layer exceeds 55 thousand tons of oil (
Figure 6). However, from 1977 to 2014, with an intense drop in oil production, the production curve decreases sharply, although it is still in the regulation area. After 2014, the curve is beyond the lower line of regulation, and the value is 9.2 th.t. of oil. To identify the underlying causes of the observed trend, a comprehensive analysis was performed using Shewhart control charts developed for the key field development parameters, namely the number of producing wells, annual water production, injection well count, injected water volumes, water cut, and average oil and water production per operational well (
Figure 7a–f) [
13].
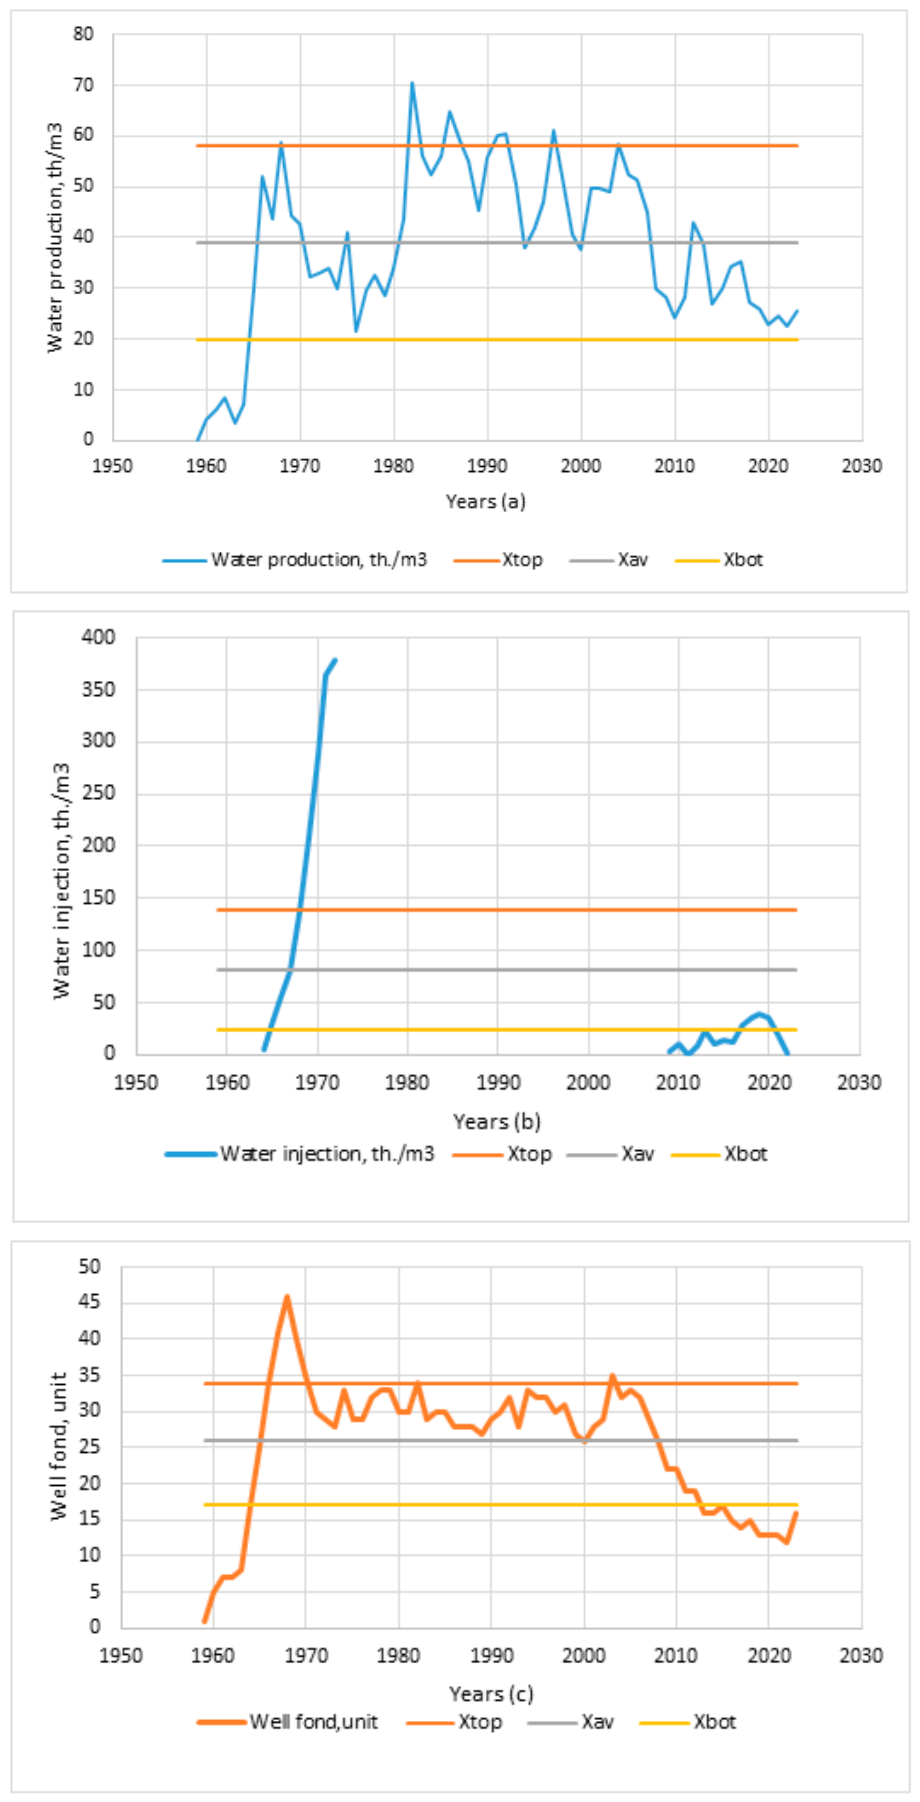
According to the results of the calculation of field data using the Shewhart method, the top, bottom, and average limits of water extracted from the exploitation facility were determined. Thus, the top, average, and bottom limits of the regulation are Xtop = 58, Xaverage = 39, and Xbottom = 20 (in thousand m3 of water), respectively. Since the beginning of development (1959), the annual production of water was very low; it amounted to 0.1 thousand m3 of water, as there was no water cut in the formation.
Since 1965, there has been a gradual flooding of the layer, and it has continued until 2023. During this period, the annual production amounted to 21.7–70.6 thousand m
3 of water and was within the bottom and top limits of regulation (with the exception of 1982, 1986, 1987, 1991, 1992, 1996, and 1997). In these years, the annual production of water was respectively 70.6, 64.8, 59, 60.1, 64.2, and 61.2 thousand m
3 of water. In the mentioned years, the annual production was beyond the top limit of regulation, and flooding of the layer occurred (
Figure 7a).
The processes of flooding on the studied horizon began in 1964. Flooding of the development object is carried out by using edge, boundary, mixed, and spot waterflooding methods [
7].
According to the results of the calculation of field data by the Shewhart method, the top, bottom, and average limits of water injected into the exploitation object were determined. Thus, the top, average, and bottom limits of regulation are X
top = 139, X
average = 81, and X
bottom = 23 (thousand m
3 of water), respectively. The amount of water injected into the horizon in 1964 was 5.5 thousand m
3. Although the amount of water injected into the layer increased sharply during development, it remained within the regulation limits (
Figure 7b).
As can be seen in
Figure 7b, the curve of the quantity of injected water, increasing, crossed the top limit of regulation. In 1968, there was an increase in the amount of injected water from 79.7 thousand m
3 to 135.3 thousand m
3. This was due to the increase in the number of injected wells. Starting in 1969, the amount of injected water reached 378 thousand m
3 and exceeded the top limit of regulation. It is worth noting that the increase in the amount of injected water led to the flooding of the object [
14]. Therefore, in 1972, the water injection process was stopped. From 1972 to 2008, the development facility operated without water injection. However, in 2009, development was resumed with a small amount of water (3.7 thousand m
3) injected into the formation. In 2010–2022, the amount of water injected into the formation was 1.1–38.5 thousand m
3. In 2023, the water injection process was stopped again (see
Figure 7b). Despite the amount of water injected into the formation of 1.1 thousand m
3, the water cut of the formation was high (73.4%). This can be explained by the penetration of technical or other formation water from the outer layers into the horizon, which reduces the recovery rate [
15,
16]. The penetration of formation or injected water from outer layers into the target horizon is a critical phenomenon in reservoir engineering, particularly in multilayered systems. This process is primarily controlled by reservoir heterogeneity, permeability contrast, and pressure gradients between adjacent layers. Water tends to migrate preferentially through high-permeability zones, leading to uneven sweep efficiency and early water breakthrough in production wells. In addition, both edge-water and bottom-water drive mechanisms significantly influence the dynamics of water encroachment into hydrocarbon-bearing horizons. Recent studies (2021–2025) have shown that accurate prediction of water invasion requires integrated geological and hydrodynamic modeling, especially in vertically heterogeneous reservoirs. Understanding these mechanisms is essential for optimizing production strategies and minimizing water-related production issues.
According to field data, the operational facility was developed in 1959 by a single well. The number of operational wells from 1959 to 1963 reached 8; 7 wells were drilled; the curve showing the dynamics of the wells is beyond the bottom limit of regulation.
Despite the fact that for this horizon, the area of statistical regulation (top and bottom limits) for wells is within 17–34 units (X
top = 34, X
average = 26, X
bottom = 17). Since 1964, a sharp increase in the number of drilled operational wells has been observed, and during this period of time, until 1968, 46 wells were drilled. The curve was outside the top regulation line from 1966 to 1970. However, since 1970, the curve was beyond the top and middle line of regulation until 2009, with the exception of 2003, when more than one well passed the top limit. Starting from 2008, the curve gradually fell and approached the bottom limit of regulation. This shows us that some operational wells have been stopped or put in for repair within five years. Further, since 2013, the number of operational wells has decreased and passed the bottom line of regulation. While there, the number of operational wells was 17 units. Some wells stopped, and in 2022, the number of operational wells was 12 units. Periodically, some wells were put into operation, so that in 2023, the number of operational wells increased to 17 units. From 2022 to the present day, the curve is below the regulation limit (
Figure 7c).
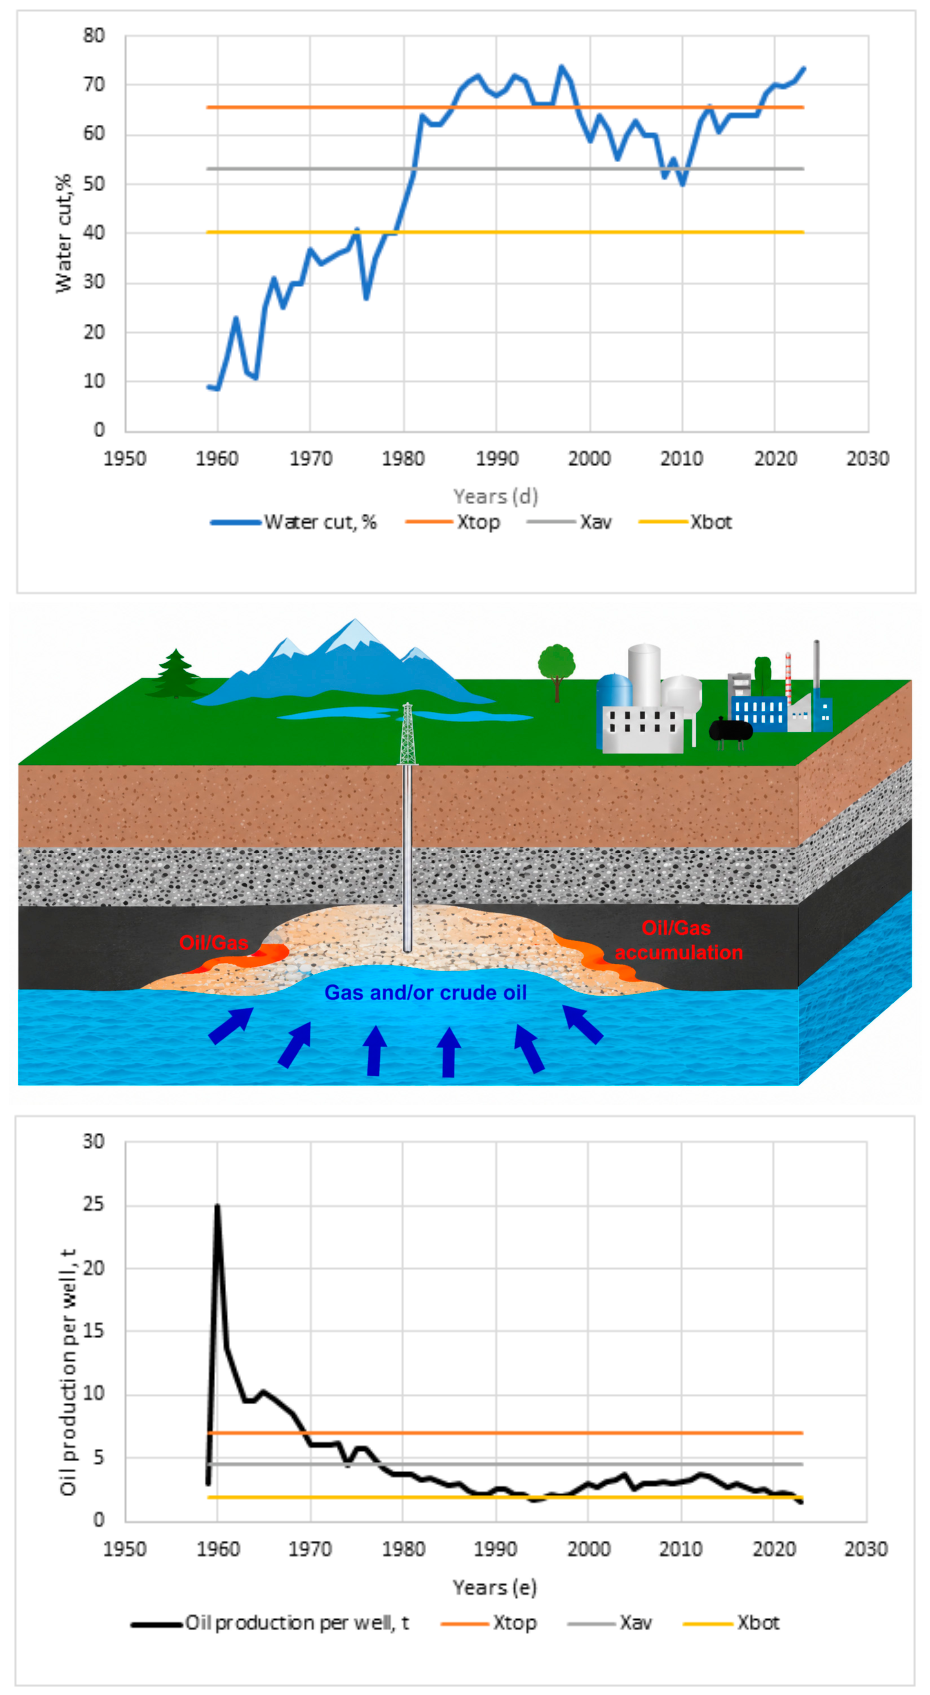
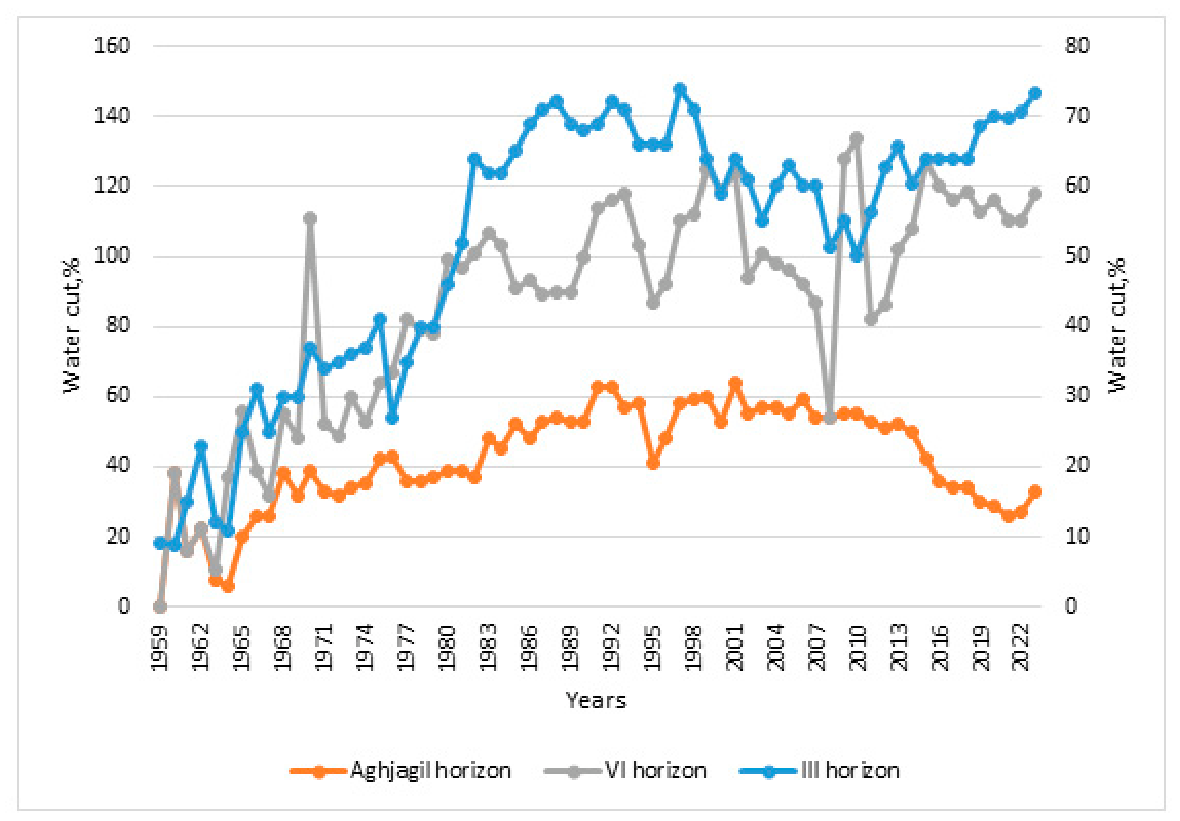
During the development process, the top, bottom, and average limits of the water cut of the PS03 horizon were determined. Thus, they are Xtop = 60.5, Xaverage = 53, and Xbottom = 40.5 (%), respectively.
From 1959 to 1979, the water cut level of the horizon was low, with the water cut curve of the layer beyond the bottom line of regulation. In 1980–1984, the water level of the layer was at the top and bottom regulation limits. In the interval of 1985–2002, the water cut level increased sharply and was even beyond the top limit of regulation (
Figure 7d). In 2003–2011, the water cut of the productive horizon was within the top and bottom limits. However, since 2012, the water cut of the layer has begun to increase rapidly and exceed the top limit of regulation, reaching 73.4%. Today, the horizon is flooded, the reason for which is the penetration of foreign waters into the layer from the surrounding layers [
15].
Figure 7.
(
a) Shewhart control chart for regulation of water production. (
b) Shewhart control chart for regulation of injected water into the target object. (
c) Shewhart control chart for regulation of wells. (
d) Shewhart control chart for regulation of water cut of the target object and foreign water penetration into the object [
17]. (
e) Shewhart control chart for regulation of oil production per well. (
f) Shewhart control chart for regulation of water production per well.
Figure 7.
(
a) Shewhart control chart for regulation of water production. (
b) Shewhart control chart for regulation of injected water into the target object. (
c) Shewhart control chart for regulation of wells. (
d) Shewhart control chart for regulation of water cut of the target object and foreign water penetration into the object [
17]. (
e) Shewhart control chart for regulation of oil production per well. (
f) Shewhart control chart for regulation of water production per well.
Limits of regulation of oil production per one well are Xtop = 7, Xaverage = 4.6, and Xbottom = 2 (ton).
As can be seen from
Figure 7e, oil production per one well of horizon PS03 of the Kurovdagh field began in 1959 with 3 tons of oil and was within the regulation limits. In 1960, it increased sharply, exceeded the top limit of regulation, and amounted to 24.9 tons. Starting from 1960, production slowly decreased, and during the course of 9 years, it was kept at the top limit of regulation. However, from 1970 to 1993, production per well decreased to 2.1 tons, but it was within the regulation. Two years later, from 1995 to 1996, the curve crossed the bottom limit of regulation, but from 1997 to 2022, the curve of oil production per one well was within the regulation, and the production fluctuated between 2.0 and 3.8 tons. Since 2023 and as of today, it is below the line of regulation (
Figure 7e).
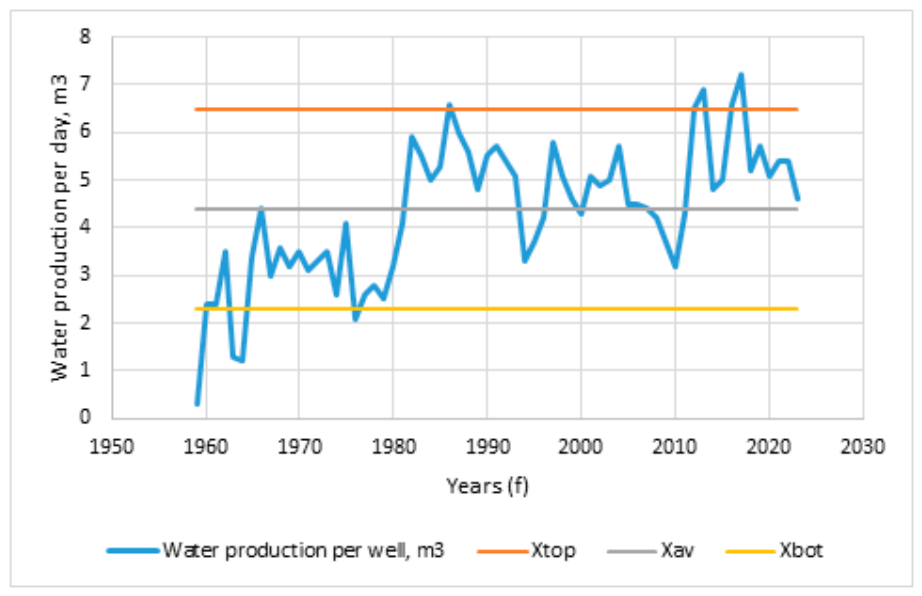
Limits of regulation of water production per one well are Xtop = 6.5, Xaverage = 4.4, and Xbottom = 2.3 (ton).
Production of water per one well of horizon PS03 of the Kurovdagh field began in 1959 with 0.3 tons of water and was beyond the limit of regulation. Since 1960, the production, slowly increasing, was within the limits of regulation, with the exception of 1963, 1964, and 1976, when the curve of production crossed the bottom limit of regulation, and in 1986, 2016, and 2017, the curve of production water, per one well, crossed the top limit of regulation and amounted to 6.6, 6.6, and 7.2 tons, respectively. Since 2023 and until today, it has been within the limits of the regulation (
Figure 7f).
The units of water production and water injection indicators were revised throughout the manuscript to ensure consistency between volume-based and mass-based measurements.
A product of the Aghjagil horizon confined to terrigenous reservoir rocks (sand, sandstone), with a porosity of 22.1% and a permeability of 85·10−3 μm2.
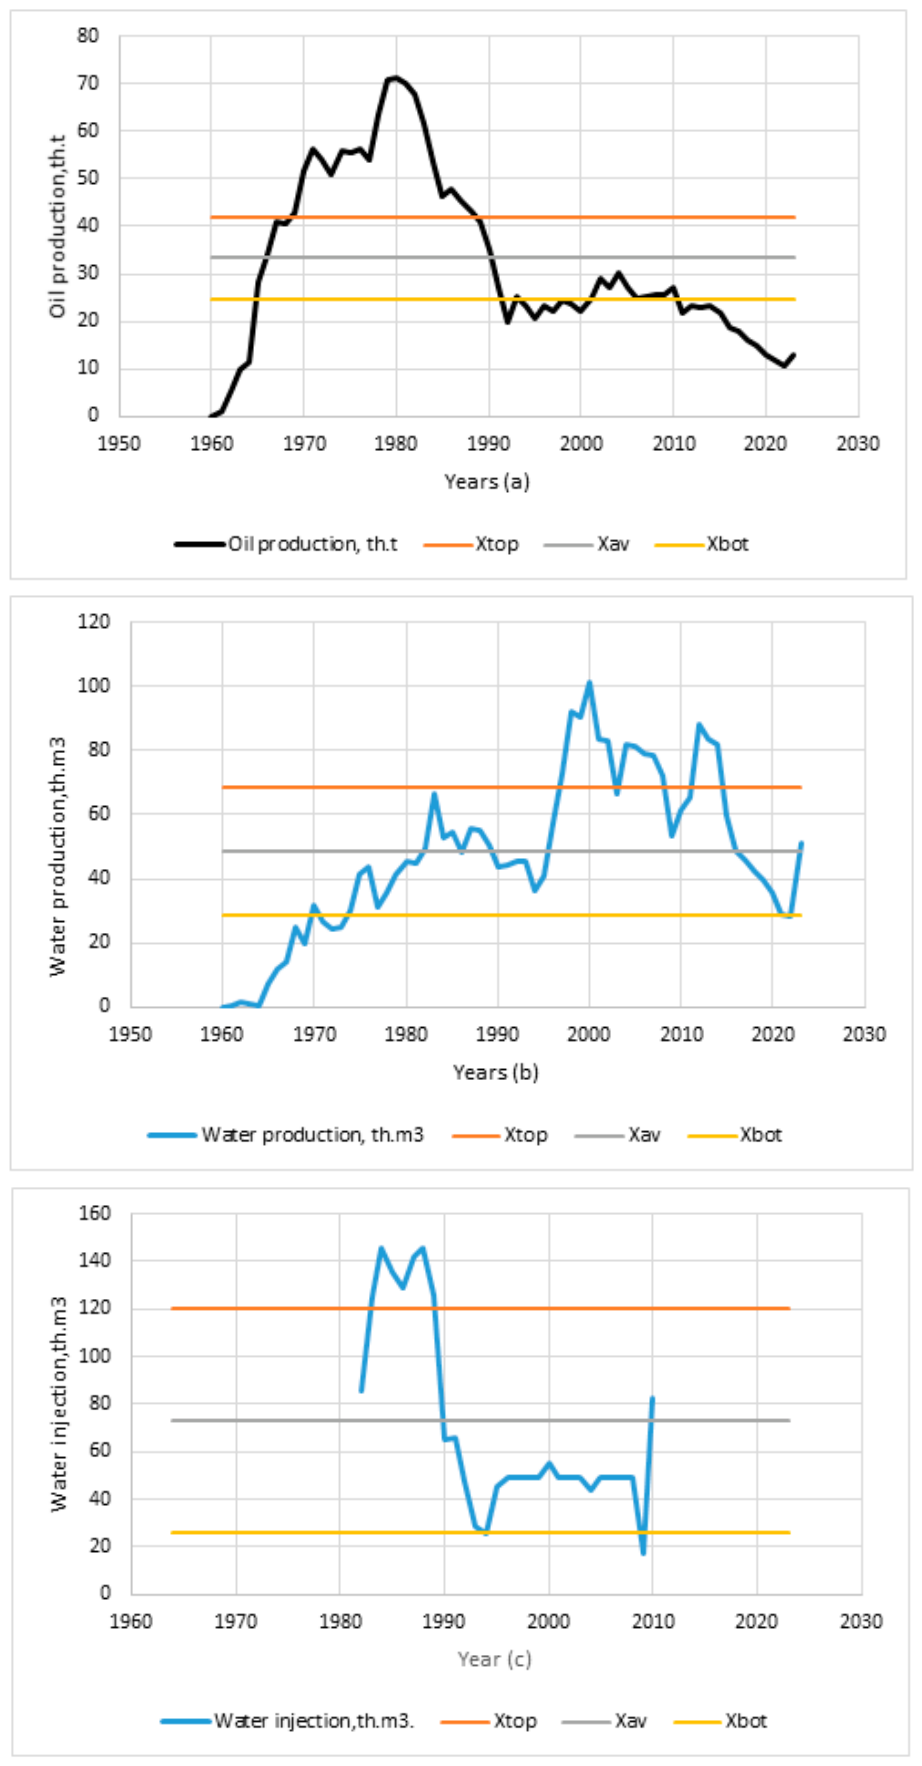
The analysis based on Shewhart’s model shows that for the Aghjagil horizon of the Kurovdagh field, the area of statistical regulation (top and bottom limits) of annual oil production is within 24.6–42 thousand tons (X
top = 42, X
average = 33.3, X
bottom = 24.6) (
Figure 8a).
As can be seen from the control chart, oil production shows a classical development trend with clearly expressed stages. During the early development period (1960–1965), oil production was low due to a limited number of producing wells and incomplete reservoir drainage.
From 1965 to late 1981, oil production increased sharply as a result of intensive drilling, commissioning of new wells, and active reservoir exploitation. The maximum oil production of approximately 71.4 th.t was reached in late 1980, significantly exceeding the top regulation limit, which indicates a peak production stage and highly intensive reservoir withdrawal.
After reaching this maximum, oil production entered a decline phase and production steadily decreased due to pressure depletion, reduction in natural energy, and growing water encroachment. By the early 1990s, oil production fell below the average regulation line, confirming the transition to a mature development stage.
From 2000 onward, oil production remained close to the bottom regulation limit, with only minor fluctuations, reflecting late-stage development, high water saturation, and limited remaining recoverable reserves.
The regulation limits of water production for the Aghjagil horizon are Xtop = 68.4, Xaverage = 48.4, and Xbottom = 28.4 (ton).
The model illustrates (
Figure 8b) the long-term dynamics of water production. In the initial development stage (1960), water production was minimal, which is typical for reservoirs dominated by oil flow and limited water breakthrough.
During the 1970s and 1980s, water production gradually increased and approached the average control line. This increase is associated with advancing water fronts, growing water cut, and expansion of the drainage area.
A sharp rise in water production occurred in the late 1990s and early 2000s, when values exceeded the top control limit and reached approximately 90–100 th.t. This period reflects intensive water breakthrough, channeling effects, and increased influence of edge or injected water.
After 2010, water production remained high with noticeable fluctuations (2012–2013), indicating unstable hydrodynamic conditions and dominance of water flow in the reservoir system.
The water injection chart (
Figure 8c) reflects the reservoir pressure maintenance strategy. During the late 1970s and early 1980s, water injection volumes were high and exceeded the top control limit (X
top = 120, X
average = 73.5, X
bottom = 26 th.m
3), indicating active pressure support and waterflood implementation.
After 1990, injection volumes decreased sharply, falling closer to the average and bottom control limits. This reduction suggests declining efficiency of water injection, possible injector shut-ins, or redistribution of injection patterns.
A short-term increase around 2010 may be related to local stimulation measures or operational adjustments. However, the general trend indicates reduced pressure maintenance activity in the late development stage.
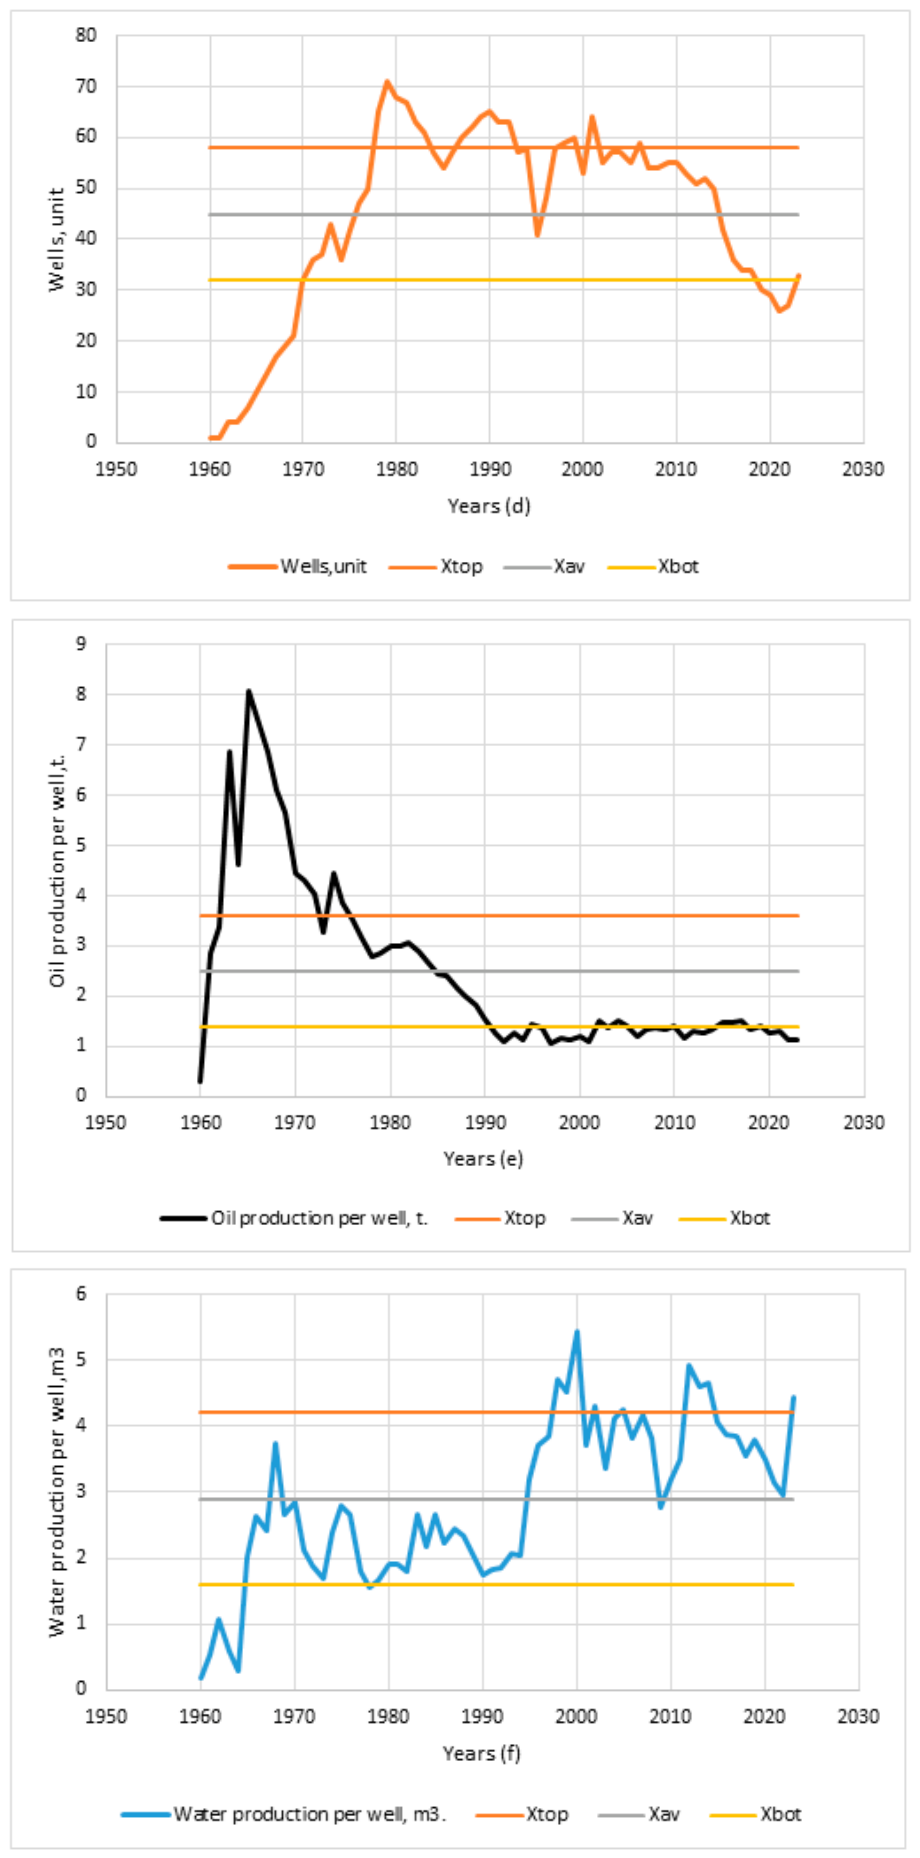
As shown in
Figure 8d, the number of active wells increased rapidly from the early 1960s and reached its maximum of about 71 wells around 1980, exceeding the top control limit; despite that, X
top = 58. This reflects an intensive drilling campaign aimed at maximizing oil recovery during peak production.
After 1980, the number of wells gradually declined due to reservoir depletion, reduced economic efficiency, and abandonment of low-productivity wells.
From 2000 onward, the number of wells decreased sharply and approached the bottom control limit (Xbottom = 32) by 2019, indicating field contraction and transition to selective operation of remaining productive wells. In early 2023, it was possible to regulate well numbers reaching about 33 wells, which was above the bottom regulation limit.
The control chart (
Figure 8e) demonstrates changes in well productivity. During the early development stage, oil production per well was very high, reaching 7–8 t/well, which significantly exceeded the top control limit. This reflects strong reservoir energy and high permeability of the reservoir.
After 1970, oil production per well steadily declined due to pressure depletion, increased water cut, and reservoir heterogeneity effects. By the early 1990s, productivity fell below the average control line.
Since then, oil production per well has remained close to the bottom control limit, confirming low well efficiency and advanced depletion of the reservoir.
As can be seen from
Figure 8f, water production per well gradually increased over time. During the 1960s to 1980s, values were relatively low and close to the average line.
From the late 1990s onward, water production per well exceeded the average control limit and reached maximum values around 2000–2005, indicating strong water breakthrough and increasing water dominance.
Although some stabilization occurred later, water production per well remained elevated, confirming worsening production conditions and high water saturation.
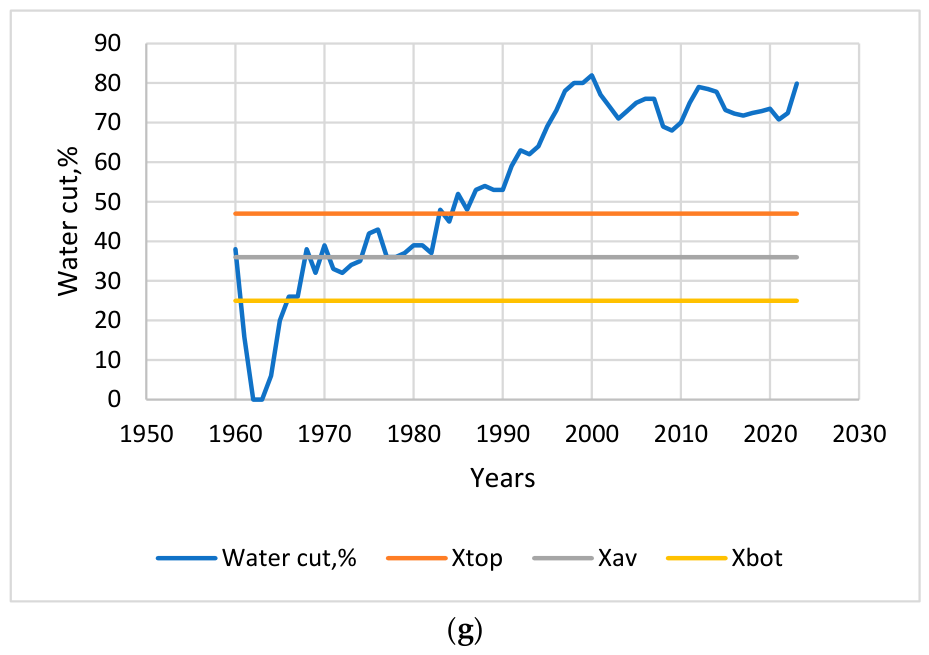
The figure illustrates the variation in water cut (%) along the horizon from 1960 to 2020, along with the top (Xtop = 47%) and bottom (Xbot = 25%) control limits and the average value (Xav = 36%). In the early 1960s, the water cut sharply decreased and fell below the lower control limit, which can be explained by the initial stage of field development, low water production, or possible inconsistencies in early data recording.
From 1960 to the late 1980s, the water cut gradually increased with moderate fluctuations and remained mostly within the control limits, indicating relatively stable reservoir performance and a controlled displacement process.
However, starting from the late 1980s and continuing through the 1990s, the water cut exceeded the upper control limit, marking a significant deviation from stable conditions. This behavior is primarily associated with intensified water encroachment from surrounding and underlying formations, the breakthrough of injected water, and the heterogeneous structure of the reservoir, which promotes preferential flow through high-permeability zones [
15,
16].
In the early 2000s, the water cut reached its peak (around 82%), reflecting an advanced stage of reservoir depletion and dominant water production. Unlike the previous case, the parameter remained consistently above the upper control limit in the following years, indicating a persistent loss of process stability. This sustained high water cut can be attributed to continuous water invasion, long-term water flooding effects, and inefficient sweep of hydrocarbons. In 2023, the water cut reached 79.9%, remaining significantly above the upper control limit. This indicates sustained reservoir depletion and ongoing water encroachment, confirming that water production continues to dominate over oil production.
Overall, the exceedance of the control limits—particularly the prolonged crossing of the upper limit—demonstrates that the field development process is strongly influenced by geological heterogeneity, pressure imbalance, and water breakthrough mechanisms, rather than random variations, highlighting the need for improved reservoir management and water control strategies.
Horizon VI is characterized by maximum sand content (30–45%). The industrial oil content of the horizon was determined in 1963 and was put into operation with a production of 4.5 thousand tons. The obtained data reveal significant variations in crude oil properties among different hydrocarbon reservoir types [
18]. The oil of the horizon is associated with a structural and stratigraphic type of (tectonic screened, etc.) trap. The occurrence depth of the horizon is 2670 m, the effective thickness is 28.7 m, and porosity and permeability are estimated at about 19.7% and 30·10
−3 MPa·s, respectively.
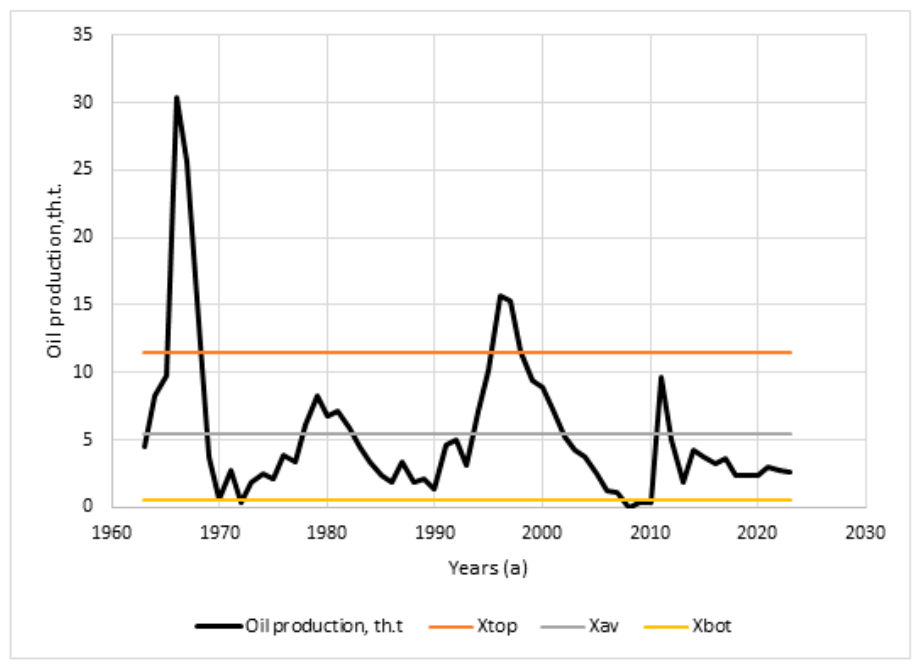
Figure 9a shows unstable oil production behavior, while X
top = 11.5, X
average = 5.5, and X
bottom = 0.5 th.t. A sharp peak occurred in 1966, reaching about 30.36 th.t, followed by a rapid decline. This indicates short-term intensive exploitation without long-term stability.
Later periods show smaller production peaks, particularly around 2007, likely related to redevelopment or secondary recovery efforts. However, after 2007, oil production declined again and remained below the lower control limit until 2010, indicating exhaustion of remaining reserves. From 2011 to 2023, it remained between the adjustment limits.
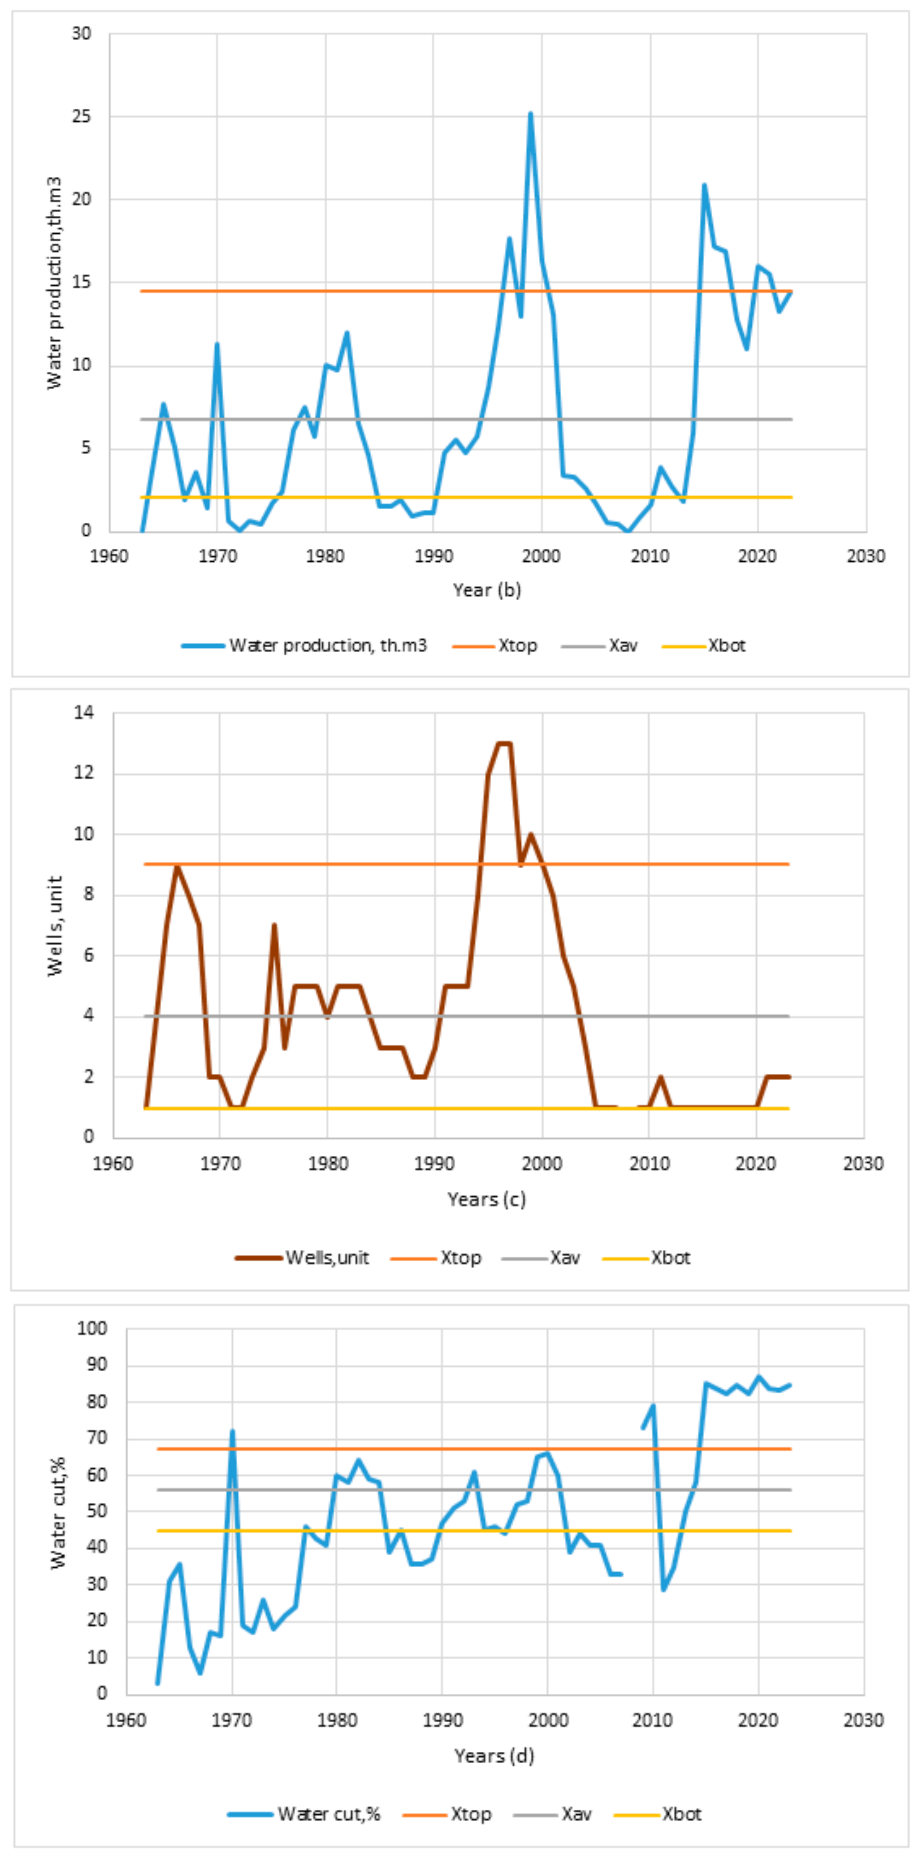
As shown in the adjustment chart, water production increased gradually and reached a major peak (25.2 th.m3) in late 1999, exceeding the top adjustment limit, while Xtop = 14.5, Xaverage = 6.8, and Xbottom = 2.1 th.m3. This indicates large-scale water breakthrough and reservoir flooding.
After a short decline, water production increased again in 2015, reaching 20.9 th.m3, remaining above the top line. This confirms late-stage water dominance and reduced oil displacement efficiency.
Modern trends in the development of domestic scientific thought in the field of hydrocarbon production are increasingly gravitating towards production management processes through regulation of the operating modes of production wells [
19].
In optimizing the operating modes of production wells [
20],
Figure 9c shows several drilling phases. The horizon was put into production in 1963 with only one well. An initial increase occurred in 1964, followed by a decline in 1966. A second drilling peak in the 1990s reached the top control limit, while X
top = 9, X
average = 4, and X
bottom = 1 unit.
After 2005, a sharp decline in well count was observed, indicating abandonment of inefficient wells and optimization of field operations.
Figure 9d demonstrates a steady long-term increase in water cut. From relatively low values in 1963, water cut exceeded 72% by the late 1970s.
After minor fluctuations, a sharp increase occurred after 2009–2010, reaching 73–79%, well above the top control limit, while Xtop = 67, Xaverage = 56, and Xbottom = 45%. This clearly indicates critical water encroachment and dominance of water in production.
During the development period, the water cut dropped sharply from 79% to 29% at the end of 2010 (with the exception of 2008, as no data on water cut were recorded for that year) [
17]. This was due to the blockage of external waters penetrating the horizon. However, at the end of the year, the water cut of the horizon began to increase again. A further increase in water cut in wells reached 85% in 2015 and 87.2% in 2020 due to artificial water injection. Despite the implementation of measures to limit water inflow in the 2023 water cut of extracted products and wells, about 84.7% was noted, while a sharp increase in water cut of products was observed; however, it is above the top limit line.
Thus, the main problem at the horizon is water injection into the middle and upper oil-saturated parts of the object section, which contributes to rapid water movement into the reservoir and, consequently, rapid flooding of the production wells. This is evidenced by the ongoing water shutoff operations at the field, with varying degrees of success [
21,
22].
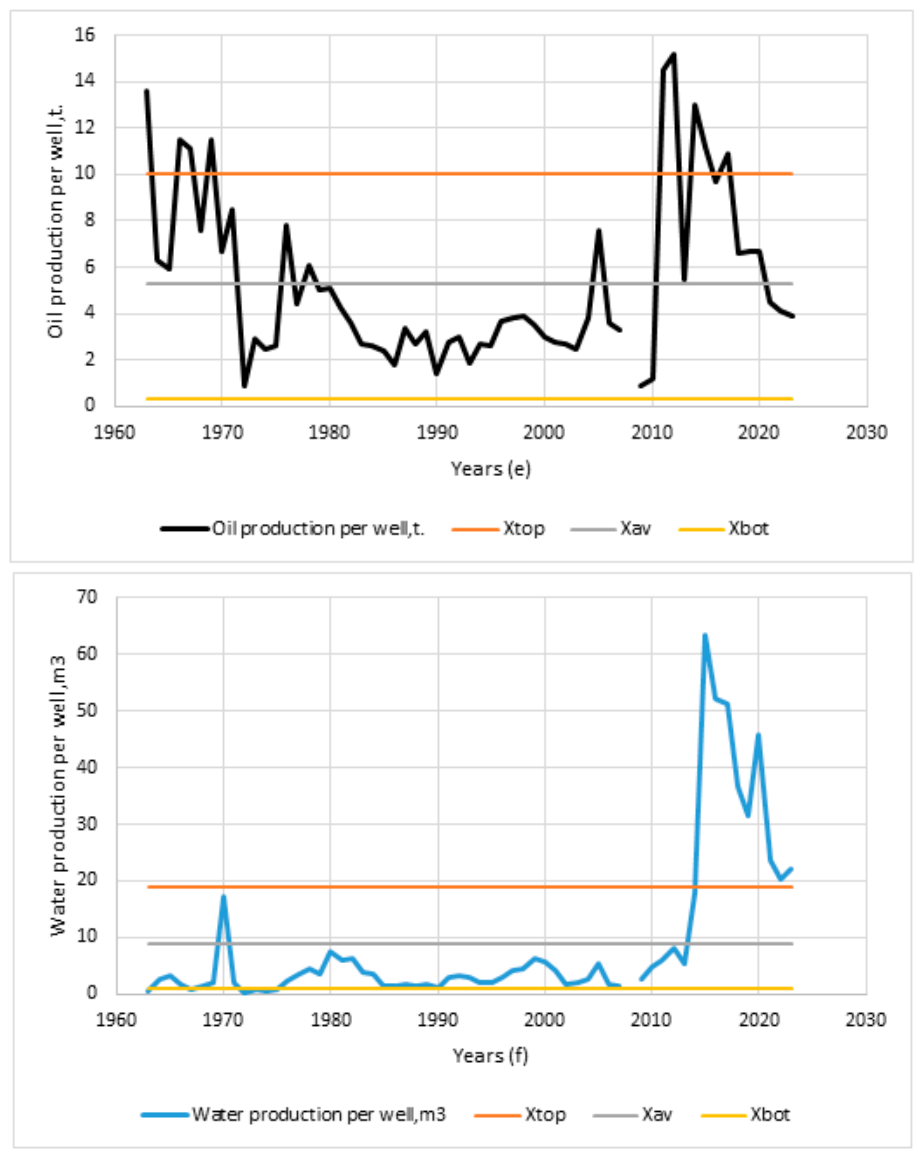
The oil production per well (
Figure 9e) was high during early development but declined sharply after 1971. From the 1980s to early 2000s, productivity remained low and unstable (with the exception of 2008, as no data on oil production per well were recorded for that year) [
17], while X
top = 10, X
average = 5,3, and X
bottom = 0.3 ton.
A short-term increase after 2010 suggests temporary operational improvements, with the production rate per well reaching 15.2 tons. This was followed by another decline, confirming the limited sustainability of production enhancement measures.
The volumes of produced water per well remained below the mean regulation limit (1970 exception) until 2010, while Xtop = 19, Xaverage = 9, and Xbottom = 1 m3. After this point, a dramatic increase occurred, with values exceeding the top control limit and reaching maximum levels (63.3 m3) around 2015.
Although some decline followed, water production per well remained high, confirming severe water breakthrough and late-stage reservoir conditions. Various strategies have been implemented to manage the significant volumes of produced water associated with the production object.





 ,
,