1. Introduction
The deep decarbonization of energy-intensive industries has become a decisive component of global climate governance. While international climate agreements have established long-term mitigation goals, the practical challenge increasingly lies in identifying sector-specific pathways that can deliver large-scale emission reductions without undermining industrial output, supply-chain stability, or regional economic development [
1,
2,
3]. This challenge is particularly acute in China, where industrial production and electricity consumption remain highly concentrated in several high-emitting sectors. In 2024, China’s carbon emissions still accounted for approximately one third of global emissions [
4]. Within China’s domestic industrial system, steel, cement, aluminum smelting, and chemicals are among the most emission-intensive sectors, and the primary aluminum industry alone contributes a substantial share of national industrial carbon emissions [
5,
6].
Primary aluminum production is a strategically important but difficult-to-abate sector. Its decarbonization challenge differs from that of many other industrial sectors in two respects. First, the industry’s emissions are not only generated by direct process-related sources, such as carbon anode consumption and perfluorocarbon emissions, but also heavily shaped by indirect electricity-related emissions. Because electrolysis is highly electricity-intensive and requires continuous, stable power supply, the carbon intensity of aluminum production is strongly coupled with the structure and reliability of the power system. Second, mitigation options are technologically heterogeneous. Process-side measures, such as inert anodes, cathode optimization, low-voltage electrolysis, and intelligent control systems, differ substantially from power-side measures, such as renewable electricity substitution, energy storage, and direct-current power supply configurations. End-of-pipe technologies such as carbon capture, utilization, and storage (CCUS) introduce another layer of cost, maturity, and deployment uncertainty. Therefore, the central problem is no longer whether individual low-carbon technologies exist, but how these technologies should be selected, sequenced, and combined under different temporal, economic, and energy-system constraints.
Existing studies have made important contributions to understanding carbon mitigation in primary aluminum and other energy-intensive industries. A first group of studies focuses on process improvement and electrolysis efficiency, including anode innovation, cathode retrofitting, and cell-structure optimization. These studies provide valuable technical insights, but they often evaluate single technologies or specific process links rather than the full mitigation portfolio. A second group examines renewable electricity integration and industrial energy-system coordination. These studies highlight the importance of green power substitution, storage, and source–grid–load coordination, but many of them emphasize energy-system operation rather than the comparative selection of industrial mitigation technologies. A third group discusses CCUS as a supplementary pathway for deep decarbonization, yet its deployment in primary aluminum remains constrained by cost, energy consumption, and uncertain commercialization conditions. In addition, marginal abatement cost curve studies provide a useful economic evaluation framework, but conventional MAC-based approaches often remain static and are less able to represent phased technology deployment, evolving carbon prices, renewable-energy penetration, and changing mitigation targets across short-, medium-, and long-term horizons.
These limitations reveal a clear research gap. Current literature has not yet provided an integrated and dynamic optimization framework that simultaneously incorporates process-side upgrading, power-side decarbonization, and CCUS-based mitigation for the primary aluminum industry. More specifically, three issues remain insufficiently addressed. First, existing studies tend to assess mitigation technologies separately, making it difficult to compare technologies with different cost structures, emission-reduction potentials, and maturity levels within a unified decision framework. Second, many studies identify mitigation measures qualitatively or through static cost comparisons, but do not optimize technology portfolios across different decarbonization stages. Third, the interaction between marginal abatement cost, technological application effectiveness, renewable electricity substitution, carbon reduction speed, and industrial output has rarely been modelled in a coordinated way. As a result, it remains unclear which technology combinations should be prioritized at different stages, and how the mitigation pathway should evolve from short-term efficiency improvement to long-term deep decarbonization.
To address this gap, this study develops a multi-objective optimization framework for carbon mitigation pathway planning in the primary aluminum industry. The model jointly considers marginal abatement cost and technology application effectiveness, and applies the sequential unconstrained minimization technique (SUMT) to optimize mitigation technology portfolios under multiple scenarios. Xining City in Qinghai Province, China, is selected as an illustrative case because it combines concentrated primary aluminum production with abundant renewable energy resources, making it suitable for examining the coordination between industrial decarbonization and renewable-energy-driven power transformation. The scenario design considers three key variables: carbon reduction rate, renewable energy share, and primary aluminum output. The optimization is conducted for three time horizons—2030, 2035, and 2060—to capture the phased evolution of mitigation pathways.
This study contributes to the literature in three ways. First, it shifts the analysis from descriptive enumeration of mitigation technologies to an integrated optimization of technology portfolios, thereby providing a quantitative decision-support framework for primary aluminum decarbonization. Second, it links process-side, power-side, and CCUS-related mitigation options within a unified pathway-planning model, allowing the study to identify how technology priorities change from short-term efficiency improvement to medium-term process–power coordination and long-term deep decarbonization. Third, by applying the framework to a renewable-rich industrial region, this study demonstrates how regional resource endowments and industrial output constraints can be incorporated into sectoral mitigation planning, offering policy-relevant insights for low-carbon transition in energy-intensive industries.
2. Literature Review
Industrial sectors represent the primary battlefield for carbon emission reduction and are central to achieving China’s “dual carbon” targets. In particular, industries such as steel, primary aluminum, cement, and thermal power generation are characterized by high energy intensity and substantial emissions, making them priority targets for decarbonization strategies.
Existing studies generally identify three major categories of mitigation pathways in industrial sectors: (1) improvements in production processes, (2) enhancements in energy efficiency and increased adoption of renewable energy, and (3) the application of carbon capture, utilization, and storage (CCUS) technologies.
Process improvement constitutes a key pathway for reducing carbon emissions at the source. One important approach involves upgrading anode systems in industrial production. In the primary aluminum industry, for example, the use of high-quality anode materials can effectively reduce direct carbon emissions during the smelting process. In particular, the replacement of traditional consumable carbon anodes with inert anodes is widely regarded as a potential breakthrough capable of eliminating direct emissions from electrolysis.
Despite its promising potential, the commercialization of inert anode technology faces significant challenges, including material degradation under high-temperature molten salt conditions and high production costs [
7]. Nevertheless, ongoing research—such as the development of metal and cermet-based anode systems—continues to demonstrate its long-term potential for deep decarbonization, especially when combined with renewable electricity [
8]. Major international initiatives, including those led by RUSAL and ELYSIS, are actively advancing the industrial deployment of such technologies.
In addition to anode innovation, retrofitting electrolytic cells—particularly cathode system optimization—represents a core approach to reducing indirect emissions by lowering electricity consumption. Liu et al. provide a comprehensive review of energy-saving measures aimed at improving the magnetohydrodynamic stability of aluminum electrolytic cells [
9]. These measures focus on enhancing damping characteristics, optimizing current distribution, and refining magnetic field design. At the operational level, improvements in anode quality, as well as precise control of electrolysis temperature and electrolyte composition, have also been shown to reduce by-product formation and generate indirect emission reduction benefits [
10].
Improving energy efficiency and increasing the share of renewable energy are equally critical for achieving emission reduction in the primary aluminum industry. On the efficiency side, optimization of electrolytic cell structures can significantly reduce energy consumption per unit of output [
11].
On the renewable energy side, Sgouridis et al. demonstrate, using an hourly optimization model, that in regions with high solar irradiance, photovoltaic systems alone can replace more than 40% of electricity demand while significantly reducing carbon intensity and operational costs [
12]. At the system level, recent studies have explored hybrid energy systems and multi-energy integration strategies. For example, Zeng et al. propose a hybrid configuration combining concentrated solar power with conventional combined heat and power systems, supported by energy storage and demand-side response mechanisms to mitigate the intermittency of renewable energy [
13]. Yang et al. further develop a coordinated planning model integrating electrolytic cell thermal dynamics, waste heat recovery, and green electricity trading, significantly increasing both the share of “green aluminum” and overall system benefits [
14].
Carbon capture, utilization, and storage (CCUS) technologies are increasingly recognized as an important supplementary pathway for emission reduction. Promoting the development of CCUS is a key strategy for addressing climate change and achieving large-scale emission reductions.
Compared with conventional carbon capture and storage (CCS), carbon capture and utilization (CCU) technologies offer the additional advantage of converting CO
2 into valuable products such as chemicals, fuels, or construction materials, thereby creating economic value while reducing emissions [
15]. However, despite these advantages, CCUS technologies still face significant challenges, including high energy consumption, high costs, and slow commercialization progress [
16].
These challenges vary across different technological approaches. For example, although amine-based absorption technology is relatively mature in the capture stage, its large-scale deployment is constrained by high regeneration energy consumption, solvent degradation, and equipment corrosion [
17]. Solid adsorbent materials, such as activated carbon, zeolites, and metal–organic frameworks, have shown promising improvements in adsorption capacity and selectivity. However, issues related to long-term stability, cyclic performance, and large-scale production costs under real flue gas conditions remain unresolved.
As shown in
Table 1, existing research has generated rich insights into individual mitigation technologies, renewable electricity integration, CCUS deployment, and cost-based evaluation. However, these research streams remain only partially connected. Process-side studies provide technical feasibility but rarely optimize technology combinations under changing carbon constraints. Energy-system studies highlight the importance of renewable electricity but often do not endogenize industrial retrofit choices. CCUS studies discuss long-term mitigation potential but remain weakly integrated with sector-specific pathway planning. MAC-based studies provide economic comparability but are frequently static and single-objective. Therefore, despite the breadth of existing research, a unified framework for screening, integrating, and optimizing heterogeneous mitigation technologies in the primary aluminum industry is still lacking.
Two specific research gaps can be identified. First, existing technology evaluations remain highly fragmented. Most studies focus on isolated dimensions, such as process energy efficiency, green electricity substitution, or end-of-pipe carbon treatment. Although these studies clarify the technical or economic characteristics of individual mitigation options, they do not provide an integrated analytical framework capable of simultaneously incorporating multiple mitigation logics, including source prevention, process optimization, power-side decarbonization, end-of-pipe treatment, and resource circulation. As a result, technology selection in the primary aluminum industry still tends to rely on empirical experience, qualitative judgement, or separate cost comparisons rather than systematic quantitative optimization [
18].
Second, existing studies pay insufficient attention to the dynamic optimization of mitigation technology portfolios under medium- and long-term decarbonization targets. Industrial decarbonization is not a one-time technology selection problem, but a staged transition process involving technological iteration, evolving cost trajectories, changing carbon prices, renewable-energy penetration, and increasingly stringent emission constraints. However, most existing studies either conduct static analyses at specific time points or provide broad macro-scenario descriptions without optimizing the sequence and combination of technologies across different stages. Consequently, the literature has not yet fully answered a core planning question: at what time, in what sequence, and with which specific combination of technologies should mitigation options be deployed to achieve targeted deep emission reductions at minimum cost?
To address these gaps, this study constructs a staged pathway-planning framework that integrates multi-dimensional mitigation technologies, quantifies both marginal abatement costs and technology application effectiveness, and optimizes technology portfolios under short-, medium-, and long-term scenarios. By combining MAC analysis, technology application effectiveness, and multi-objective optimization, this study aims to provide a systematic decision-support framework for formulating cost-effective and technically feasible carbon mitigation pathways in the primary aluminum industry.
3. Materials and Methods
3.1. Data Resources and Preprocessing
The carbon mitigation technologies considered in this study are primarily derived from authoritative policy and technical documents, including the National Industrial Energy Conservation and Carbon Reduction Technology Application Guidelines and Case Studies (2024) [
19] issued by the Ministry of Industry and Information Technology, as well as the Catalogue of Key Energy-Saving and Low-Carbon Technologies for Promotion (2015) [
20] and the Green Technology Promotion Catalogue (2024 Edition) [
21] issued by the National Development and Reform Commission. In addition, the National Key Low-Carbon Technology Promotion Catalogue (Fifth Batch, 2025) [
22] and relevant academic literature are also incorporated.
Due to the difficulty in obtaining data on emission reduction technologies, we have chosen relevant energy-saving and emission reduction technology data released by Chinese government departments such as the National Development and Reform Commission, the Ministry of Ecology and Environment, and the Ministry of Industry and Information Technology. The data has a certain level of authority and does not require additional verification; However, the above data also has certain limitations, that is, the above data are based on empirical data formed by Chinese enterprises’ experiments and applications, and do not have representativeness from other regions around the world. They can only represent the experience of China’s electrolytic aluminum industry.
For missing data related to energy-saving and carbon reduction technologies in the primary aluminum industry,
Supplementary Information is collected from publicly available enterprise case studies [
23,
24]. These data are cross-validated and completed using interpolation methods where necessary to ensure consistency and completeness.
Regarding CCUS-related parameters, this study draws on data from the China Carbon Capture, Utilization, and Storage (CCUS) Annual Report [
25] published by the Institute of Environmental Planning, Ministry of Ecology and Environment, and integrates additional parameters from the literature to ensure robustness in model calibration.
Prior to model implementation, all data are standardized and harmonized to ensure comparability across different technologies and time horizons. Key variables, including investment cost, operation and maintenance (O&M) cost, emission reduction potential, and technology lifetime, are adjusted to a consistent temporal and monetary basis.
3.2. Model Framework
When constructing an industrial emission reduction model and selecting optimal carbon mitigation pathways, it is imperative to explicitly consider two critical dimensions: the marginal abatement cost (MAC) and the technological maturity of the mitigation options. To quantify the marginal abatement cost, this study builds upon the MACC model proposed by Liu et al. [
26]. However, we refine their framework by excluding the energy-saving cost reductions typically associated with mitigation (as the marginal costs here refer to actually incurred costs, and as the energy-saving cost resulting from emission reduction is an opportunity cost that does not actually occur, it is therefore excluded here) and instead incorporating the carbon revenues realized through the emissions trading system. This modification serves as the formulation for Objective Function 1, which aims to minimize the marginal abatement cost. Furthermore, the effectiveness of technological application is operationalized as the ratio of the actual emission reductions achieved upon implementation to the theoretical emission reduction potential. This specification offers two distinct methodological advantages: first, it isolates the direct efficacy of the mitigation technology, ensuring that the value of technology application effectiveness is strictly bounded within the [0, 1] interval; second, it formally introduces a shared endogenous variable—the actual emission reduction volume—that links both objective functions within the optimization framework.
Target Function 1: Minimize marginal Abatement Cost (MAC)
where
AIit denotes the annualized investment cost of technology
i in year
t;
represents the annual operation and maintenance (O&M) cost of technology
in year
;
indicates the carbon revenue derived from the emission reductions achieved by technology
in year
; and
stands for the actual volume of emission reductions achieved upon the implementation of technology
in year
.
where
denotes the total investment of technology
in year
;
represents the discount rate for the primary aluminum industry; and
indicates the lifetime of technology
.
where
denotes the raw material expenditure for operation and maintenance,
represents the energy expenditure for operation and maintenance, and
indicates the labour cost for operation and maintenance.
where
is the product output of electrolytic aluminum during the
period when using the i-th technology, and
, here
refers to the total CO
2 emissions generated from the production of
electrolytic aluminum (including emissions from production processes and energy consumption), and
is the emission parameter;
denotes the proportional relationship between the output of the primary product and the consumption of raw materials in the electrolytic aluminum industry, i.e., the output ratio, and
represents the per-unit price of raw materials.
where
denotes the carbon trading price in year t.
The constraints (St) are established as follows: St1 is defined as a soft economic-viability condition associated with MAC rather than a hard feasibility constraint, that is,
. It represents the aspirational enterprise-level condition under which emission-reduction technologies generate net economic benefits. Because the model is designed for industry-level pathway planning, technology portfolios with MAC > 0 are still allowed when they satisfy the emission-reduction target, technology applicability, output, and carbon-price scenario conditions. St2 imposes constraints on the carbon trading price, set at
for 2030, 24
for 2035, and
for 2060; St3 represents the carbon neutrality constraint for 2060, formulated as
Target Function 2: Maximizing Technology Application Effectiveness (TAE).
Considering that the increase in the effectiveness of technological applications is usually easy at first and difficult later,
is set as a two-parameter nonlinear model here as follows.
where
is the theoretical optimal emission reduction when adopting the i-th technology, and
is a parameter reflecting the application effect of the technology. Usually,
indicates that the application effect of the technology first increases and then slows down with the increase in
, that is, the increase in the application effect of the technology is first easy and then difficult.
Subject to: , and .
There are usually heuristic optimization algorithms (such as PSO, GA, etc.) and analytical optimization methods (such as SUMT) for solving multi-objective problems. For a detailed comparison of various optimization methods, please refer to Shen et al. [
27] and Yuan et al. [
28]. Due to the fact that this article is a multi-objective optimization problem with relatively few endogenous variables and relatively simple constraints, it is easy to transform into a single objective function. In this case, using the SUMT method has the following two most direct advantages: firstly, it can effectively transform complex multi-objective optimization problems with constraints into simple unconstrained single objective optimization problems, making the convergence speed of the solution fast and improving computational efficiency; Secondly, it has strict mathematical derivation and convergence analysis, which makes the optimization results stable and accurate.
The calculation steps of SUMT method are as follows:
First, an initial point , an initial penalty factor , a scaling factor , and an allowable error 0 are specified, with k = . The endogenous variable here is the actual emission reduction of each technology combination, and its initial value is set according to the degree of technology promotion publicly announced by the government.
Second, starting from point
, the unconstrained problem is solved.
Here, . The minimum point of the function is denoted as . is the result of transforming the second objective (Target Function 2) into a minimization problem by taking its reciprocal. The final objective function is obtained by calculating a weighted average of Objectives 1 (Target Function 1) and 2. Considering that Objective Function 1 is more important than Objective Function 2 (in government-related emission reduction technical documents, the TAE value or the promotion rate of individual technologies is usually reported), the weighting ratio between the two factors is chosen as 8:2 here. and are continuous functions in , where represents the inequality constraints and represents the equality constraints. Typical formulations for and are as follows: , . .
Finally, if , the computation is stopped, and the point is obtained. Otherwise, set , , and return to Step 2.
4. Scenario Design and Optimization Results
4.1. Scenario Design
In multi-objective optimization, constraints serve to filter feasible solutions, while scenario settings guide the direction and scope of the optimization process, directly affecting the choice of solution strategies and the effectiveness of the final solutions. Based on target indicators in existing policy documents and relevant literature, this study selects three indicators—carbon reduction rate, share of renewable energy, and primary aluminum output—as scenario variables.
This article chooses Xining City of Qinghai Province as the sample area for carbon reduction in the electrolytic aluminum industry, mainly for the following two reasons. Firstly, it responds to the paradox of “reducing carbon emissions means reducing production” in the electrolytic aluminum industry, demonstrating the feasibility of “stable supply of green electricity”. At present, although there has been significant technological progress in the global electrolytic aluminum industry, the proportion of newly built aluminum plants with their own thermal power is increasing, which has put the industry in a bottleneck for emission reduction [
29]. Xining’s electrolytic aluminum production capacity ranks first in Qinghai Province, with a large scale. Unlike the Middle East that relies on natural gas and the Nordic region that relies on hydropower, Xining relies on Qinghai’s abundant wind, solar, and water resources to achieve a 75–80% proportion of green electricity [
30]. It successfully explored how to stably apply intermittent wind and solar resources to large-scale electrolytic cells that can produce continuously 24 h a day. This is a valuable sample for arid or monsoon climate regions around the world, and effectively responds to the concerns of many regions around the world that “reducing carbon emissions will inevitably lead to reduced production”. Secondly, it effectively reflects the commercial value of the “green premium”. Xining’s “green aluminum” does not survive solely on subsidies, but has successfully entered the supply chains of international leading companies such as Apple, NIO, and Volvo with its extremely low carbon footprint. This indicates that downstream enterprises are willing to pay a premium for low-carbon upstream materials, and green investment is transforming into a tangible market access threshold.
Regarding carbon reduction speed, based on the new round of nationally determined contribution goals proposed by China at the United Nations Climate Change Summit in September 2025, “by 2035, China’s net greenhouse gas emissions across the entire economy will decrease by 7–10% from the peak, and we will strive to do even better”, and referencing the research of Shi et al. [
31], the carbon reduction speed for Xining City is set as shown in
Table 2.
Regarding the proportion of new energy, the specific setting for Xining City is determined by referencing the “Green Electricity Consumption Proportion of Key Energy-Consuming Industries in 2026 for Each Province (Autonomous Region, Directly Administered Municipality)” [
32] and the “Expected Targets for Renewable Energy Electricity Consumption Responsibility Weights in 2026 for Each Province (Autonomous Region, Directly Administered Municipality)” [
33] issued by the National Development and Reform Commission and the National Energy Administration in 2025. Additionally, the “Xining Development Zone’s Electrolytic Aluminum Annual Production Capacity Ranks First in the Province” [
30] released by the Information Office of the Qinghai Provincial People’s Government in 2025 is also taken into account. The specific settings are shown in
Table 2.
Regarding electrolytic aluminum production, the specific setting for Xining City is determined by referencing the “Nonferrous Metals Industry Welcomes a ‘Strong Policy Momentum’ against ‘Involution’” [
34] issued by the National Development and Reform Commission in 2025, as well as the Qinghai Provincial 14th Five-Year Plan [
35] and relevant documents [
23] released by the Management Committee of Xining (National) Economic and Technological Development Zone in 2025. The specific settings are also shown in
Table 2.
It should be noted that considering the deep emission reduction and renewable energy substitution process in the electrolytic aluminum industry, which may still be affected by factors such as technological boundaries, power system regulation requirements, and statistical errors, this article does not set the long-term scenario parameters as absolute 100%, but uses 99% as the upper limit approximation value to more accurately reflect the industry’s close to complete decarbonization or high degree of renewable energy substitution.
Rather than applying a uniform fluctuation rule across the three scenarios, the carbon reduction rate and the renewable energy share are calibrated differentially, reflecting their distinct indicator attributes and the industry’s developmental stages. Specifically, the magnitude of fluctuation for the carbon reduction rate expands progressively over time. As a composite outcome indicator of emission mitigation, the differences across scenarios accumulate dynamically as mitigation measures are sustained, exhibiting a staged trajectory: initial deviations are relatively modest, expanding in the medium term, and culminating in significant divergence over the long term. By contrast, the fluctuation range for the renewable energy share is held constant. Because it serves as a structural energy indicator subject to binding constraints—such as renewable resource endowments, grid integration capacity, and power supply stability—the cross-scenario variations are expected to remain relatively stable. Consequently, applying a uniform fluctuation margin ensures greater methodological consistency and comparability across the scenario specifications. Furthermore, because this study primarily aims to isolate the effects of alternative mitigation pathways and renewable energy substitution levels on carbon emissions, rather than to evaluate differences in industrial scale, primary aluminum production is held constant across all scenarios within any given year. This design choice strictly controls for scale effects, thereby enhancing the internal validity and comparability of the scenarios.
4.2. Selection and Composition of Mitigation Technologies
The set of carbon mitigation technologies for the primary aluminum industry is primarily derived from authoritative standards and guidelines issued by the National Development and Reform Commission (NDRC), the Ministry of Industry and Information Technology (MIIT), and the Ministry of Ecology and Environment (MEE), supplemented by relevant academic literature. Specifically, the official policy documents consulted include: Volume II (Energy-Saving and Efficiency-Enhancing Technologies for the Non-Ferrous Sector) and Volume VI (Energy Storage and Renewable Energy Utilization Technologies) of the National Industrial Energy Conservation Technology Application Guidelines and Cases (2021) [
36,
37]; Volume VIII (Energy-Saving and Efficiency-Enhancing Technologies for Efficient Utilization of Renewable Energy) of the 2022 Edition [
38]; Volume II (Energy-Saving and Carbon-Reducing Technologies for the Non-Ferrous Metals Industry) and Volume IX (Industrial Green Microgrid Technologies) of the National Industrial Energy Conservation and Carbon Reduction Technology Application Guidelines and Cases (2024 Edition) [
19,
39]. Additional sources encompass the National Key Energy-Saving and Low-Carbon Technology Promotion Catalogue (2015 Edition, Energy-Saving Section) [
20], the 2025 edition of the National Key Promotion Catalogue of Low-Carbon Technologies (Fifth Batch, 2024) [
22], and the Green Technology Promotion Catalogue (2024 Edition) [
21]. These policy baselines are further supplemented by empirical data and technical parameters from the scholarly literature, notably Xing et al. [
40]. The selected technologies, mapped to their specific operational processes, along with their corresponding technical parameters and carbon mitigation classifications, are detailed in
Table 3,
Table 4,
Table 5 and
Table 6.
Regarding the selection of technology portfolios, in general, the combinations are divided into two scenarios: with captive power plants and without captive power plants. Among them, in the scenario without captive power plants, the range of selectable technologies on the power side is relatively limited, and no supply-side energy storage technologies (Category H) or supply-side renewable energy integration technologies (Category I) are configured. The selection logic for process-side and user-side technologies remains consistent with that in the captive power plant scenario.
To reflect technological iteration and the pace of industrialization, this study adopts a staged selection and gradual introduction approach at three time points—2030, 2035, and 2060 (generational effect). Under both power supply scenarios, basic process retrofit technologies (A, B, C, D, E, F, G1, etc.) are continuously deployed as “baseline” measures in all stages. At the same time, some next-generation technologies are introduced in subsequent stages according to their maturity: G2, I2, and J2 are included in the optional set from 2035 onward; I1.2, J2, and K2 are included from 2060 onward to reflect further evolution of the power system and energy use patterns.
In terms of end-of-pipe and supplementary emission reduction, considering the availability and development stages of different generations of CCUS technologies, the CCUS module is grouped by generation and upgraded over time: first-generation technologies include S1 (post-combustion capture); second-generation technologies include U1 (chemical utilization) and U2 (biological utilization); third-generation technologies include U3 (carbon nanomaterials) and U4 (other utilization, such as mineralization and agriculture). Based on assumptions regarding technological maturity, this study sets: first-generation CCUS (S1) for 2030, second-generation CCUS (U1/U2) for 2035, and both second- and third-generation CCUS (U1–U4) available in 2060 to reflect the possibility of multiple pathways coexisting in the long term.
Under the above scenarios and staged rules, the number of technology combinations increases with time and the expansion of the optional technology set: in 2030, there are 4 combinations in the captive power plant scenario and 2 combinations in the non-captive scenario; in 2035, there are 16 combinations in the captive power plant scenario and 8 combinations in the non-captive scenario; in 2060, there are 256 combinations in the captive power plant scenario and 64 combinations in the non-captive scenario.
Furthermore, based on the scenario setting for Xining in
Section 4.1, the technology combinations for each year are classified into three scenarios: low-speed emission reduction scenario, baseline scenario, and high-speed emission reduction scenario.
First, to ensure comparability of emission reduction technologies across different stages within a unified evaluation framework, when constructing the technology combination scenarios for 2030, 2035, and 2060, this study refers to documents such as the Benchmark and Baseline Levels of Energy Efficiency in Key Industrial Fields (2023 Edition) [
42]. Combined with the renewable energy share assumptions in the scenarios, outputs such as aluminum production, power generation, and energy storage supply capacity in relevant technology cases are converted into a unified scale, so that primary aluminum production is comparable.
After completing the comparability adjustments, this study further compares the total investment and CO2 emission reductions of each technology combination and classifies them into low-speed, baseline, and high-speed emission reduction scenarios. Specifically, in 2030, a total of 6 technology combinations are formed, with 2 in each of the three scenarios; in 2035, a total of 24 combinations are formed, with 8 in each scenario; in 2060, a total of 320 combinations are formed, including 105 in the low-speed scenario, 110 in the baseline scenario, and 105 in the high-speed scenario.
4.3. Selection Results of Emission Reduction Technology Combinations
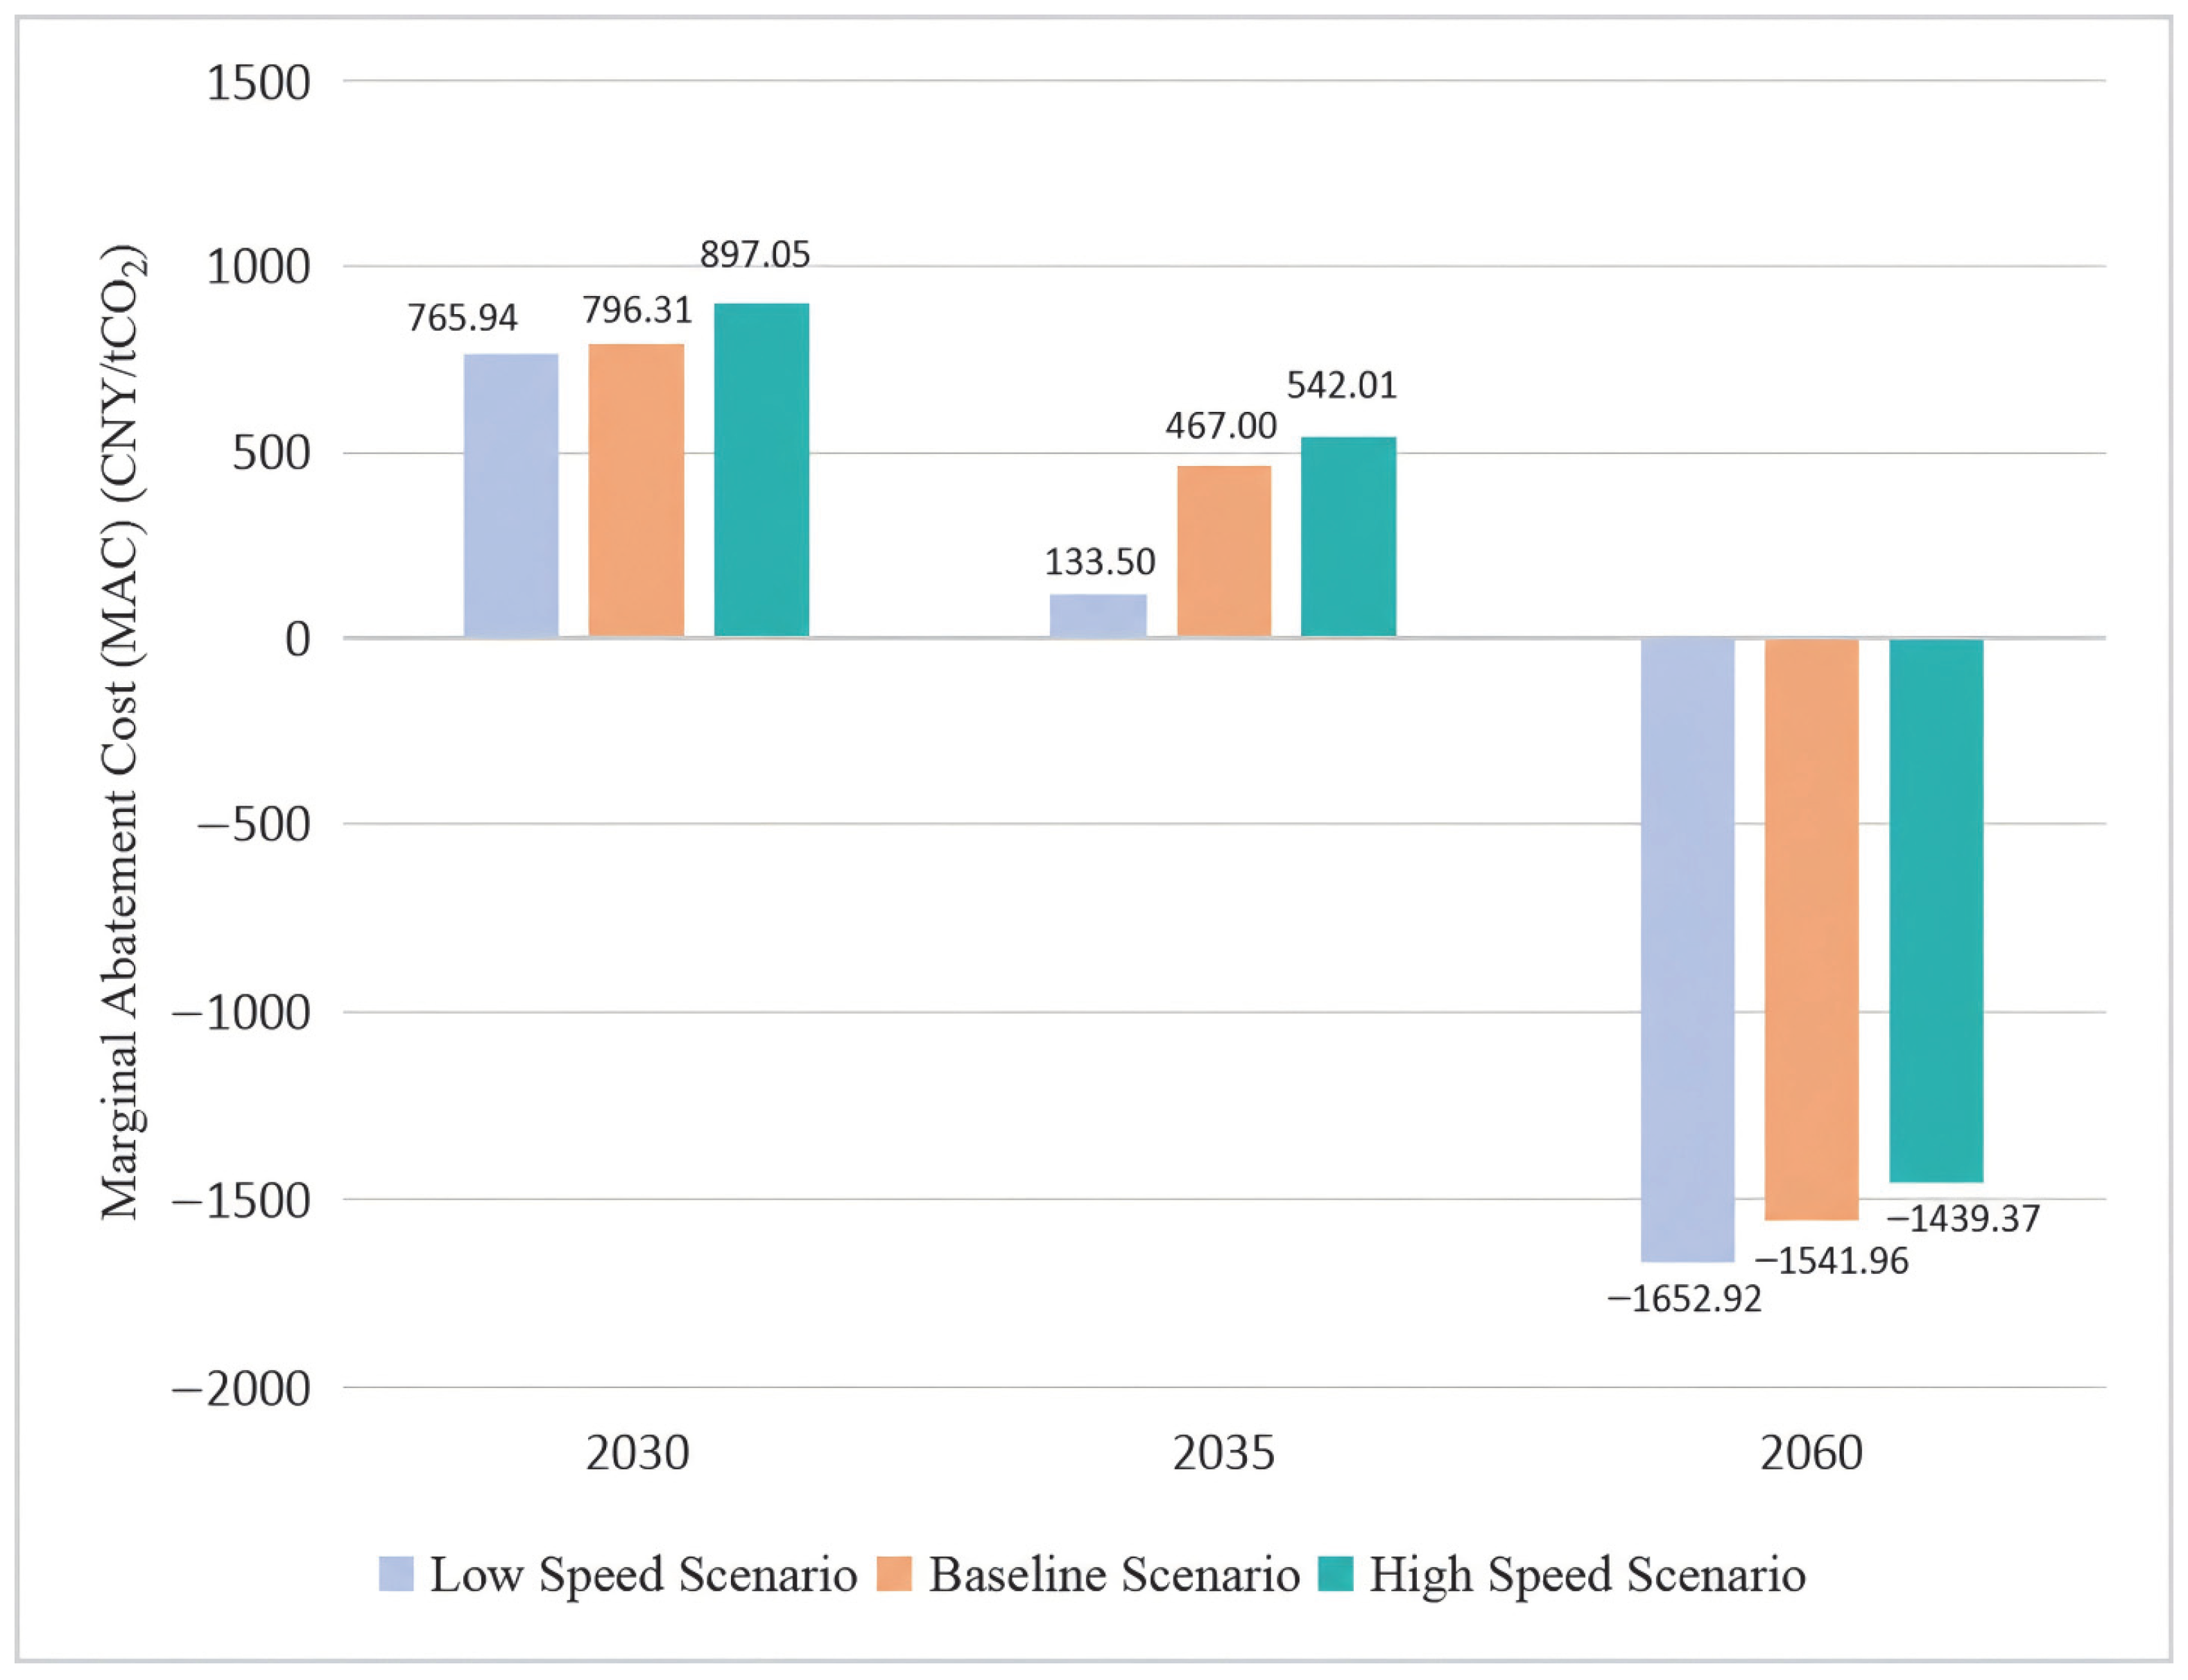
By introducing the commonly used penalty function method for optimization calculation and comparison, the selection results are shown in
Table 7 and
Figure 1. It can be seen that before 2030, under all defined scenarios, the marginal abatement costs (MAC) of all technology combinations are greater than zero. Specifically, the MAC is 765.94 RMB/tCO
2 in the low-speed scenario, 796.31 RMB/tCO
2 in the baseline scenario, and 897.05 RMB/tCO
2 in the high-speed scenario. The optimal technology combination in the low-speed scenario is the one without captive power plants, while in the other scenarios the optimal combinations all include captive power plants. This indicates that with the continuous strengthening of emission reduction constraints and the gradual increase in reduction targets, the marginal abatement cost of technology combinations shows an increasing trend. For the non-captive power plant scenario, emission reduction technologies do not show significant advantages in marginal abatement cost before 2030.
In 2035, among the 24 technology combinations, the introduction of next-generation cathode technology (from G1 to G2), user-side photovoltaic–storage–direct current–flexible park/community microgrid technology (J1), AI-based high-precision visual inspection systems for high-altitude wind farms (I2), and updated CCUS technologies (from S1 to U1) leads to a significant reduction in MAC. Specifically, the optimal MAC is 133.50 RMB/tCO2 in the low-speed scenario, 467.00 RMB/tCO2 in the baseline scenario, and 542.01 RMB/tCO2 in the high-speed scenario. The optimal combination in the low-speed scenario remains the non-captive power plant case, while the other scenarios still favour combinations with captive power plants. It can be seen that at this stage, the MAC of emission reduction technologies without captive power plants is significantly lower than that with captive power plants. Under low-intensity emission reduction targets, the empirical results do not support the blind construction of captive power plants by primary aluminum enterprises solely for emission reduction purposes.
In 2060, among the 320 technology combinations, due to the upgrading of user-side renewable energy integration technologies (from J1 to J2), the advancement of CCUS technologies (from U1 to U3), and the application of large-scale perovskite solar cell technologies on the supply side (I1.2), the MAC decreases significantly and becomes negative. Specifically, the optimal MAC is −1652.92 RMB/tCO2 in the low-speed scenario, −1541.96 RMB/tCO2 in the baseline scenario, and −1439.37 RMB/tCO2 in the high-speed scenario. The optimal combination in the low-speed scenario is still the non-captive power plant case, while the other scenarios favour combinations with captive power plants. At this stage, due to the negative marginal costs of emission reduction technologies, it means that compared to the previous two stages, companies have full autonomy and initiative to promote the implementation of emission reduction technologies, without the need for industry managers to implement any subsidy policies to encourage companies to implement these emission reduction technologies. For enterprises, in the 2060 stage, regardless of the scenario, reducing one ton of CO2 emissions will bring at least 1400 yuan in revenue. This means that after the carbon trading price rises to a certain range, enterprises will rely on relatively mature carbon trading market forces to independently promote carbon reduction. This also means that the carbon reduction in China’s electrolytic aluminum industry has fully achieved a deep mechanism transformation from being led by regional governments and industry associations to being independently regulated and promoted by the carbon market.
From the perspective of power grid enterprises, under the low-speed emission reduction scenario, combinations without captive power plants are sufficient to meet emission reduction requirements, indicating significant cost advantages under low-intensity targets. However, as emission reduction constraints become stricter, the optimal combinations in the baseline and high-speed scenarios shift to those including captive power plant technologies, suggesting that relying solely on non-captive pathways is insufficient to support higher emission reduction targets. Therefore, non-captive power plant combinations are more suitable as priority options for short-term or low-intensity targets, while captive power plant combinations, although more costly, are necessary for achieving deep emission reduction under medium- to high-intensity scenarios.
5. Discussion
The optimization results indicate that carbon mitigation in the primary aluminum industry is not a single-stage technology substitution problem, but a staged transition process involving process upgrading, power-system decarbonization, and long-term carbon utilization. In the short term, the optimal pathways are mainly concentrated on electrolysis efficiency improvement, including low-temperature and low-voltage electrolysis, low-carbon long-life cathodes, and intelligent control technologies. This finding suggests that before large-scale structural transformation of the power system is fully realized, reducing electricity consumption per unit of aluminum output remains the most feasible and cost-effective mitigation strategy. For enterprises, such technologies are relatively mature, have lower implementation barriers, and can be incorporated into existing production systems without fundamentally changing production organization.
In the medium term, the results show a transition from process-side optimization to a coordinated mitigation pattern combining process upgrading and power decarbonization. Around 2035, improvements in electrolysis efficiency alone are insufficient to support deeper emission reduction targets. Renewable electricity substitution, source–grid–load–storage coordination, and flexible power supply arrangements become increasingly important. This implies that the decarbonization of primary aluminum production depends not only on technological progress within smelting enterprises, but also on the capacity of regional power systems to provide stable, low-carbon electricity. Therefore, emission reduction planning for the primary aluminum industry should be coordinated with renewable energy deployment, grid regulation capacity, energy storage construction, and industrial park-level energy management.
In the long term, the optimized pathway evolves toward a deeper decarbonization stage dominated by energy-system restructuring and carbon utilization. Under high renewable-energy penetration, direct-current power supply configurations, energy storage support, and carbon utilization technologies, the primary aluminum industry can move from incremental efficiency improvement to structural emission reduction. The negative marginal abatement costs observed in the long-term scenarios suggest that, when carbon prices increase and mitigation technologies become more mature, emission reduction may generate net economic benefits rather than only impose additional costs. This finding highlights the importance of improving carbon market mechanisms, increasing the credibility of carbon prices, and creating stable expectations for long-term low-carbon investment.
The case of Xining also provides practical implications for renewable-rich industrial regions. Xining combines concentrated primary aluminum production with abundant renewable energy resources, making it a useful case for examining how energy-intensive industries can be linked with regional clean-energy advantages. For local governments and industrial park managers, the results suggest that low-carbon transition should not rely solely on administrative emission constraints. Instead, policy design should support integrated planning among aluminum producers, renewable power suppliers, grid enterprises, storage operators, and carbon-market institutions. In particular, differentiated policies may be needed across stages: short-term support should focus on process energy-saving retrofits; medium-term policy should promote green electricity trading, power-system flexibility, and industrial load coordination; long-term policy should encourage large-scale renewable power integration, CCUS demonstration, and carbon utilization business models.
For enterprises, the findings indicate that mitigation technology selection should be based on both marginal abatement cost and technology application effectiveness. Technologies with low cost but limited application potential may be suitable for early deployment, while technologies with higher initial cost but stronger long-term mitigation potential may become more valuable under stricter carbon constraints. For power-grid enterprises, the results emphasize the need to improve the compatibility between continuous industrial electricity demand and intermittent renewable power supply. Flexible load management, energy storage, direct green power supply, and coordinated dispatching will be essential for supporting deep decarbonization in electricity-intensive industries.
Several limitations should also be acknowledged. First, the study uses Xining City in Qinghai Province as the case region. Although Xining is representative of renewable-rich industrial regions in China, its resource endowment, industrial structure, electricity supply conditions, and policy environment differ from those of other aluminum-producing regions. Therefore, the numerical results should not be directly generalized to all regions without further calibration. Second, the technology parameters are mainly derived from publicly available government documents, technical catalogues, industry reports, and literature sources. Although these sources are authoritative and suitable for pathway-level analysis, they may not fully reflect firm-level operational heterogeneity, project-specific investment conditions, or real-time changes in technology costs. Third, the treatment of CCUS and carbon utilization technologies is still subject to uncertainty because their large-scale application in the primary aluminum industry remains at an early stage. Future changes in capture cost, utilization pathways, transport infrastructure, and carbon market rules may affect the optimal long-term pathway.
Future research can extend this study in three directions. First, multi-region comparative analysis can be conducted to examine how different renewable-resource endowments, electricity prices, carbon prices, and industrial structures affect the optimal mitigation pathway. Second, firm-level survey data and project-level engineering data can be incorporated to improve parameter accuracy and better capture technology adoption barriers. Third, uncertainty analysis can be further expanded by considering stochastic carbon prices, renewable power curtailment, technology learning curves, and policy changes. Such extensions would improve the robustness and practical applicability of the proposed optimization framework.
6. Conclusions and Policy Implications
This study develops a multi-objective optimization framework for carbon mitigation pathway planning in the primary aluminum industry, jointly considering marginal abatement cost (MAC) and technology application effectiveness (TAE). Using Xining City in Qinghai Province as an illustrative case, this study evaluates optimal mitigation technology portfolios under short-, medium-, and long-term decarbonization scenarios. By integrating process-side improvement, power-side decarbonization, and carbon utilization-related options into a unified analytical framework, this study provides a quantitative basis for identifying staged low-carbon transition pathways in the primary aluminum industry.
The main conclusions are as follows. First, before 2030, the optimal mitigation pathway is dominated by process-side energy-saving technologies, particularly electrolysis efficiency improvement. Technologies such as low-temperature and low-voltage electrolysis, low-carbon long-life cathodes, and intelligent control measures play a central role in reducing electricity consumption per unit of output. Second, around 2035, the pathway shifts from single process optimization to coordinated mitigation through process upgrading and power decarbonization. At this stage, renewable electricity substitution and source–grid–load–storage coordination become increasingly important for achieving deeper emission reduction. Third, by 2060, the mitigation pathway evolves toward deep decarbonization supported by renewable-energy-based power restructuring, direct green power supply, energy storage, and carbon utilization technologies. The long-term results indicate that, under higher carbon prices and more mature low-carbon technologies, emission reduction may gradually shift from a cost-driven constraint to a market-supported transformation pathway.
This study makes three main contributions. First, it extends conventional marginal abatement cost analysis by incorporating technology application effectiveness into a multi-objective optimization framework. Second, it links heterogeneous mitigation technologies across different production and energy-system stages, allowing the optimal technology portfolio to be identified dynamically across different time horizons. Third, it demonstrates how regional renewable-resource endowments and industrial output constraints can be incorporated into sectoral decarbonization planning, thereby improving the practical relevance of mitigation pathway analysis for energy-intensive industries.
The findings lead to several policy implications. In the short term, policymakers should prioritize mature and deployable energy-saving technologies in electrolysis, provide targeted support for equipment retrofitting, and encourage enterprises to reduce electricity consumption intensity without disrupting production stability. In the medium term, policy design should shift toward coordinated industrial and energy-system planning, including green electricity trading, renewable power integration, flexible load management, and energy storage deployment. In the long term, deep decarbonization will require stronger carbon-market incentives, stable expectations for carbon prices, and demonstration projects for direct green power supply, CCUS, and carbon utilization. For renewable-rich industrial regions, coordinated planning among aluminum producers, grid enterprises, renewable power suppliers, and local governments is essential for transforming resource advantages into low-carbon industrial competitiveness.




 ,
,