1. Introduction
The global energy ecosystem is transitioning toward a decentralized, low-carbon energy structure. As countries seek to achieve their Net Zero goals, variable renewable energy sources (mainly solar and wind) are being rapidly incorporated into the energy mix [
1]. Although this shift toward more sustainable energy sources is important for mitigating the effects of climate change, the introduction of variability into grid operations through distributed energy resources (DERs) has created challenges for traditional grid management systems. Grid management systems traditionally developed to manage dispatchable generation are struggling to cope with the intermittent nature of DERs [
2].
A virtual power plant (VPP) represents an innovative approach to providing flexibility to modern grids. A VPP is defined as a software-defined utility that integrates energy storage systems (ESS), demand response (DR) programs, and renewable energy portfolios. The primary function of a VPP is to aggregate distributed resources, enabling them to compete in wholesale markets, provide grid support services, and help maintain stability in local distribution systems [
3,
4,
5].
Although significant advances have occurred in the architecture of VPPs over the last decade, a major challenge remains to be overcome before their widespread adoption. Extreme climatic events and “Black Swan”-type market disruptions have illustrated the limitations of current VPP architectures. The numerical forecasting models in most VPP architectures are two-stage stochastic dispatch models. The first stage uses historical time-series data for day-ahead (DA) scheduling decisions, while the second stage employs the same historical time-series data for real-time (RT) scheduling decisions. Despite the advanced modeling capabilities available today, the Texas ERCOT 2021 winter event demonstrated that numerical forecasting models did not respond in a timely manner to severe grid disruptions [
6,
7]. Numerical forecasting models are based on historical data and are generally backward-looking. Thus, when future volatility deviates significantly from past trends, conventional VPP architectures are likely to fail to provide adequate warnings of impending grid disruption. In this study, the ERCOT 2021 winter event is used as a motivating example of how extreme weather, generator outages, reserve scarcity, and market volatility can challenge purely forecast-driven dispatch models. However, the present study does not attempt to reproduce the full historical ERCOT 2021 event. Instead, it develops an ERCOT-style controlled stress-test to examine whether semantic market intelligence can be converted into dispatch-relevant risk signals. In this study, real ERCOT-related numerical market data, including 5 min DAM/RTM LMPs, are used, while the semantic alert stream is generated synthetically in an ERCOT-style format. Therefore, the reported semantic lead time should be interpreted as a controlled stress-test result rather than direct evidence that the same lead time would occur during the real ERCOT 2021 crisis.
Research on VPP optimization reflects ongoing efforts to develop methodologies to manage the inherent uncertainties associated with VPP operation. An initial group of researchers used mixed-integer deterministic linear programming (MILP) to solve unit commitment and economic dispatch problems for aggregated DERs [
8]. Later research applied stochastic programming (SP) using scenario trees to represent uncertainty in wind, solar, and prices [
9]. Although SP improved uncertainty representation, it suffered from the “curse of dimensionality” due to the exponential growth of problem size as scenario counts increased. Research has also investigated robust optimization (RO) as a means of optimizing against worst-case outcomes represented by uncertainty sets [
10,
11,
12]. However, RO may result in excessive conservatism and/or loss of profit due to withholding capacity during favorable market periods. Chance-constrained programming (CCP) is another methodology that falls between RO and SP. CCP allows for limited constraint violations; however, accurate representations of the underlying distributions required for CCP applications are typically challenging to obtain during non-stationary market conditions [
13,
14].
Deep learning techniques have replaced traditional statistical methods in numerical forecasting. ARIMA and Exponential Smoothing methods worked reasonably well during periods of relative stability. However, neither method adequately addresses many aspects of modern market behavior [
15]. RNNs and LSTMs have become popular choices for addressing long-term dependencies in time-series data [
16]; however, TCNs and transformer-based attention mechanisms have exhibited better performance in capturing multiple scales of volatility [
17]. EMD has been successfully combined with deep learning approaches to improve signal separation between noise and trend components [
18]. Regardless of the specific approach selected, all models depend on sensors. If risk indicators initially appear as unstructured natural language in alerts rather than structured numerical data, the forecasts will continue unchanged until a real-time imbalance penalty occurs [
19].
These sensor dependency issues have stimulated growing interest in unstructured market intelligence. ISOs such as ERCOT, PJM, and CAISO continually publish emergency alerts, weather advisories, and market notices [
20]. Many of these publications include early indicators of potential grid stress. Initial NLP approaches focused primarily on document classification or sentiment analysis to improve the accuracy of price prediction [
21]. However, these approaches lacked physical grounding. Document classification or sentiment analysis can determine whether the information in a document is negative; however, they cannot translate that negativity into physical constraints such as battery reserves or DR shadow prices [
22,
23,
24]. In addition, these insights are commonly provided as human decision-support tools rather than directly fed into real-time autonomous control algorithms.
Recent advances in large language models (LLMs) and retrieval-augmented generation (RAG) offer new opportunities for real-time VPP dispatches. Standard LLMs may be outdated or inaccurate in training data. RAG systems employ real-time document retrieval using a vector database prior to inference [
25]. Thus, unlike standard LLMs, RAG systems allow AI perception to be physically anchored to real-time market intelligence. Researchers have recently examined LLMs for code generation tasks in power systems, automated contingency analysis [
26], and zero-shot risk classification [
27,
28,
29]. To date, none of these studies has developed a complete framework that employs a real-time RAG pipeline within a stochastic MIQP dispatch model to modify the dispatch bounds of physical assets. The detailed comparison of recent studies and the problem is shown in
Table 1.
This paper proposes a novel framework, called the Retrieval-Augmented Generation Virtual Power Plant (RAG-VPP), which integrates semantic market intelligence into a stochastic Mixed-Integer Quadratic Programming (MIQP) model. The key innovation is the use of a Retrieval-Augmented Generation (RAG) engine that augments traditional numerical forecasting by incorporating unstructured, real-time market data (e.g., ISO alerts). The proposed framework uses Large Language Models (LLMs) to extract actionable information from textual data and to generate a Semantic Uncertainty Metric, which is then used to condition the optimization model for dispatch decisions.
The contributions of this work can be summarized as follows:
A RAG-based semantic perception layer is developed to convert unstructured market intelligence, including ISO operating notices, emergency alerts, weather warnings, and regulatory updates, into a bounded semantic uncertainty metric for VPP dispatch.
A semantic risk quantification method is proposed that combines ordinal risk estimation, semantic entropy, and ambiguity evaluation. This allows textual market information to be represented as a continuous, time-indexed risk signal rather than a simple binary warning or sentiment label.
The semantic uncertainty metric is embedded in a stochastic VPP dispatch model through three operational channels: generation of semantic-conditioned price scenarios, semantic exposure penalty in the objective function, and physically meaningful reserve/DR constraints.
Two semantic-aware operational constraints, namely Dynamic Semantic Reserve Margin and Semantic Demand Response Pre-Activation, are introduced to translate textual early-warning signals into practical dispatch actions, including ESS reserve preservation and early DR activation.
The proposed framework is evaluated using an ERCOT-based extreme-event simulation, demonstrating that semantic market intelligence can provide earlier risk awareness and improve profit, CVaR, imbalance control, and reserve security compared to purely numerical dispatch baselines.
The remainder of this paper is organized as follows:
Section 2 presents the RAG-VPP framework and methodology.
Section 3 explains the quantification of semantic risk.
Section 4 defines the semantic-aware optimization model.
Section 5 describes the solution methodology.
Section 6 presents the setup of the case study.
Section 7 discusses the results. Finally,
Section 8 concludes the paper.
2. The RAG-VPP Framework Architecture
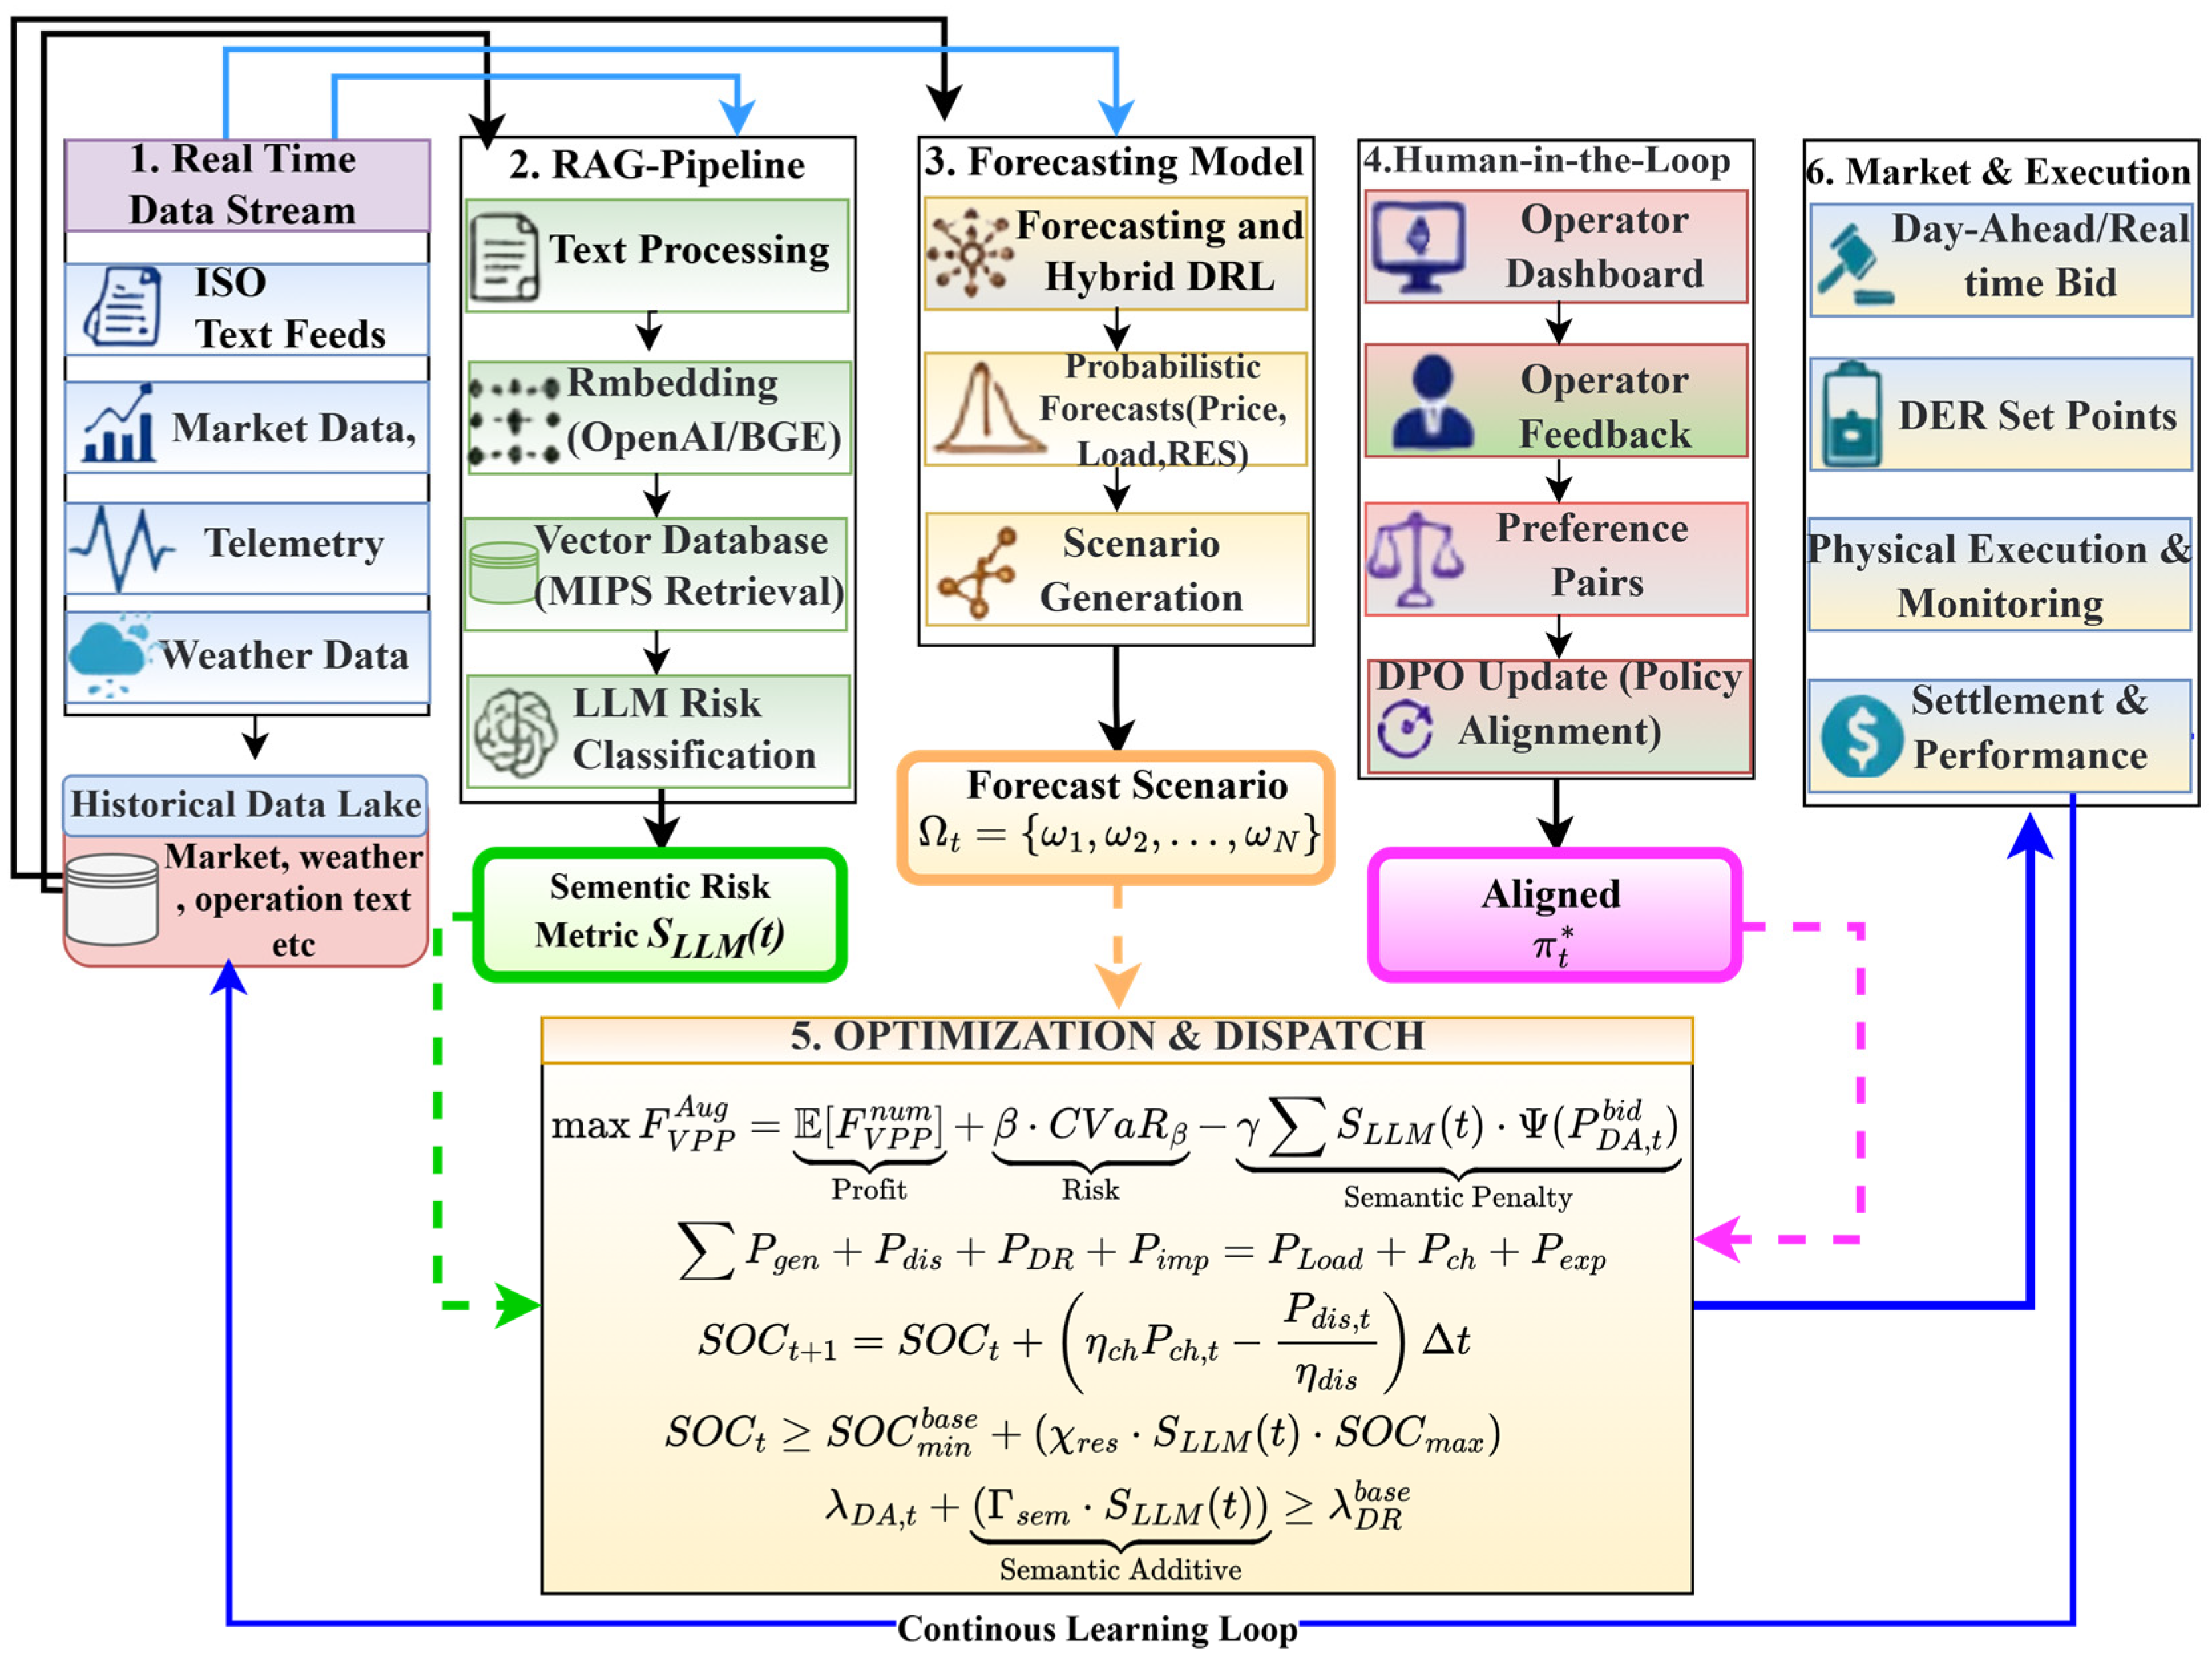
The Retrieval-Augmented Generation Virtual Power Plant (RAG-VPP) conceptualized here links Physical VPP Operation with Numerical Forecasting and Unstructured Market Intelligence into an integrated Decision-Making Architecture. Unlike traditional VPP Scheduling approaches, which rely almost exclusively on Numerical Time-Series Data, this framework will include textual information, e.g., ISO Operating Notices, Emergency Alerts, Weather Warnings, and Regulatory Updates. These textual inputs will be analyzed via an RAG/SLLM-based semantic perception engine to produce a Continuous Semantic Uncertainty Metric for each time index t = [0, T], denoted as
. This uncertainty metric will then be added to the Stochastic MIQP Dispatch Model as a time-indexed input. The overall architecture of this approach is shown in
Figure 1.
2.1. Overall System Topology and Multi-Modal Mapping
At the dispatch interval
t, the VPP operating condition is represented by a multi-modal state manifold composed of physical, numerical, and semantic information. This state manifold is defined in Equation (1):
where
denotes the physical-state subspace, including the ESS state of charge, generator ramp status, load level, and asset operating limits. The numerical intelligence subspace
contains historical and forecast numerical variables such as electricity prices, load demand, photovoltaic generation, and wind generation. The semantic intelligence subspace
contains vectorized representations of real-time market text.
Based on the multi-modal state manifold in Equation (1), the VPP bidding decision vector is generated through the nonlinear mapping in Equation (2):
where
is the bidding decision vector,
is the number of controllable assets, and
represents the overall decision mapping parameterized by
. As shown in Equation (2), raw text and embeddings are not directly optimized. Instead, the semantic layer first compresses the unstructured text into
, which is then used by the optimization model.
2.2. Layer 1: Semantic Perception Engine Based on RAG/SLLM
The first layer acts as the semantic perception engine. It transforms asynchronous text streams from ISOs, weather agencies, and regulatory bodies into a numerical risk signal. Let
denote the raw text stream received at the timestamp
. Since market notices may contain long contextual information, each document is divided into overlapping chunks using a sliding-window operator. The starting index of each chunk is calculated using Equation (3):
where
is the maximum chunk size and
is the overlap length between adjacent chunks. The total number of chunks is determined by Equation (4):
Using the indexing rule in Equation (3) and the chunk number in Equation (4), the raw text stream is converted into the chunk set shown in Equation (5). Each chunk
is embedded using a semantic encoder
. To enable cosine-similarity retrieval, the embedding vector is normalized according to Equation (6):
At each dispatch interval, a hybrid query vector
is constructed from the current operating condition and market context. The top-
most relevant chunks are retrieved using the hybrid retrieval objective in Equation (7):
In Equation (7),
is the sparse keyword retrieval score,
balances dense semantic retrieval and keyword retrieval, and
gives higher priority to recent market notices. The retrieved context
from Equation (7) is then processed by the semantic language model to obtain the semantic uncertainty metric in Equation (8):
In Equation (8),
represents normal market conditions, while
represents extreme semantic risk. The detailed calculation of this metric is presented in
Section 3.
2.3. Layer 2: Hybrid Numerical Forecasting Engine
Layer 2 provides the numerical forecasts required for market dispatch. Let
represent the multivariate historical time-series matrix over the look-back horizon
, including PV generation, wind generation, load, and price data. To handle non-stationarity, the A-CEEMDGWN decomposition operator
decomposes the raw sequence into intrinsic mode functions and a residual term, as shown in Equation (9):
After decomposition in Equation (9), the sample entropy operator classifies the decomposed components into high-frequency and low-frequency subsets. The high-frequency subset is defined in Equation (10), while the low-frequency subset is defined in Equation (11):
As shown in Equations (10) and (11), the high-entropy components are treated as volatile high-frequency signals, while the low-entropy components and the residual are treated as smoother trend signals. High-frequency components are processed by a bidirectional residual temporal convolutional network, while the low-frequency components are processed by a bidirectional LSTM with dynamic attention. The high-frequency final numerical forecast is obtained through the fusion operation in Equation (12):
In Equation (12), is the prediction horizon, and are the trainable parameters of the two forecasting branches, and denotes forecast fusion. The forecast vector from Equation (12) is used for scenario generation and stochastic dispatch optimization.
2.4. Layer 3: Human-in-the-Loop Dispatch Gateway
The semantic metric from Equation (8) and the numerical forecast from Equation (12) are passed to the stochastic optimizer to generate the AI-recommended dispatch vector
. To maintain operator control, a human-in-the-loop gateway is introduced. Let
be the intervention variable, where
indicates that the operator overrides the AI decision. The final dispatch command is defined in Equation (13):
Equation (13) ensures that the final, financially binding dispatch command can follow either the AI recommendation or the human-corrected decision. When an override occurs, the human-corrected decision is treated as the preferred action, and the AI decision as the rejected action. This preference pair is defined in Equation (14). The preference pair is used to update the semantic interpretation policy through the DPO-style alignment loss in Equation (15):
In Equation (15), is the trainable semantic policy, is the frozen reference policy, controls the strength of the preference update, and is the logistic sigmoid function. The alignment update in Equation (15) affects only the semantic interpretation policy, not the physical optimization constraints. Therefore, the proposed framework preserves the validity of mathematical dispatch while allowing the semantic engine to leave the operator’s judgment.
3. Quantifying Unstructured Market Intelligence
The purpose of this section is to convert unstructured market intelligence into a numerical semantic signal that can be used by the VPP dispatch optimizer. Market notices, emergency alerts, and weather warnings are not directly usable in mathematical optimization because they are textual, asynchronous, and uncertain. Therefore, the proposed RAG/SLLM layer transforms the dynamic text corpus into a bounded Semantic Uncertainty Metric, denoted by . This metric was later incorporated into the stochastic MIQP model as a fixed, time-indexed parameter.
3.1. Multi-Source Text Ingestion and Vectorization of Multi-Source Text
Let
denote the set of authoritative sources of market intelligence, including ISOs, weather agencies, and regulatory bodies. This set is defined in Equation (16). At each dispatch interval
, the ingestion layer collects temporally valid documents from all sources in Equation (16). The dynamic text corpus is defined in Equation (17):
In Equation (17),
is the
-th document from the source
,
is the publication timestamp,
is the rolling validity horizon, and
is the number of valid documents at time
. This ensures that outdated notices do not dominate the semantic inference process. The collected corpus is transformed into a dense vector representation using a transformer-based encoder
. The semantic embedding matrix is defined in Equation (18):
As shown in Equation (18), each document or retrieved chunk is mapped into a
-dimensional embedding vector. To extract a single semantic state vector from the full corpus, an attention mechanism is applied. The temporal attention weight of the
-th document is calculated using Equation (19):
where
is the semantic relevance score of the
-th document and
is the temporal decay coefficient. Equation (19) gives higher weight to recent and relevant documents. The attention-weighted semantic state vector is then obtained using Equation (20). The vector
represents the current semantic condition of the market and is passed to the LLM-based risk classification module.
3.2. LLM-Based Zero-Shot Risk Classification
The semantic state vector in Equation (20) is inserted into a zero-shot prompt operator
. The resulting LLM representation is defined in Equation (21). The LLM output is restricted to an ordinal risk vocabulary, as shown in Equation (22):
where
represents normal operation and
represents extreme systemic risk. Instead of using stochastic token generation, the model extracts the pre-softmax logits for the risk tokens. The probability of each risk level is computed using the temperature-scaled softmax in Equation (23):
In Equation (23),
is the logit of risk class
, and
is the temperature parameter. A lower
produces a sharper risk distribution. The normalized risk score is then calculated as the first moment of this distribution, as shown in Equation (24):
3.3. Semantic Entropy and Ambiguity Quantification
The risk score in Equation (24) does not fully capture uncertainty. For example, the same value of
may represent either a confident medium-risk classification or an ambiguous distribution across several risk classes. Therefore, semantic entropy is introduced in Equation (25):
In Equation (25),
avoids numerical instability when
, and
is the normalized entropy. To capture classification ambiguity, the confidence margin between the two largest class probabilities is defined in Equation (26). A small margin indicates that the LLM is uncertain between competing risk interpretations. The final ambiguity index is therefore defined in Equation (27):
3.4. Semantic Uncertainty Metric
The final Semantic Uncertainty Metric combines the normalized risk score from Equation (24) and the ambiguity index from Equation (27). The unfiltered semantic metric is defined in Equation (28), where
controls risk sensitivity,
controls the weight of ambiguity, and
is the baseline tolerance. To avoid high-frequency chattering in dispatch decisions, the final filtered metric is calculated using Equation (29). Equation (30) clarifies that the RAG/SLLM layer is not an optimization variable. Instead, it produces
, which is later used by the stochastic MIQP model to modify the objective function, reserve constraints, DR activation, and scenario generation.
To improve interpretability, the LLM output is restricted to five predefined semantic risk classes: Normal, Watch, Alert, EEA-1, and EEA-2. These classes correspond to a gradual increase in operational stress, from normal market conditions to severe reserve-scarcity conditions. For example, a routine transmission-maintenance notice is usually classified as Normal or Watch, while a notice indicating low operating reserves, emergency actions, or demand-reduction requests is classified closer to EEA-1 or EEA-2. The LLM does not directly determine the final dispatch action. Instead, it produces a probability vector over the five risk classes, which is then converted into the normalized risk score , semantic entropy, ambiguity index, and final smoothed semantic uncertainty metric . The parameters are used as baseline values to balance risk sensitivity, ambiguity weighting, and baseline tolerance. A higher increases sensitivity to high-risk alerts, controls the effect of uncertain or ambiguous text, and prevents weak notices from causing excessive defensive dispatch. Sensitivity tests with nearby parameter values are used to confirm that the selected baseline provides a balanced response between early warnings and false-positive avoidance.
4. Risk-Aware VPP Bidding Optimization Model
The objective of this section is to convert the semantic intelligence obtained from the RAG/SLLM layer into a physically meaningful VPP dispatch model. In conventional VPP bidding, decisions are mainly driven by numerical forecasts of renewable generation, electricity prices, and load demand. However, under extreme market conditions, numerical signals may respond more slowly than text-based operational warnings. Therefore, the proposed model incorporates the Semantic Uncertainty Metric into both the objective function and physical operating constraints. Since the model retains nonlinear ESS degradation, quadratic DR discomfort, and semantic exposure penalties, the resulting formulation is treated as a stochastic MIQP rather than a purely linear MIQP.
Semantic uncertainty metrics
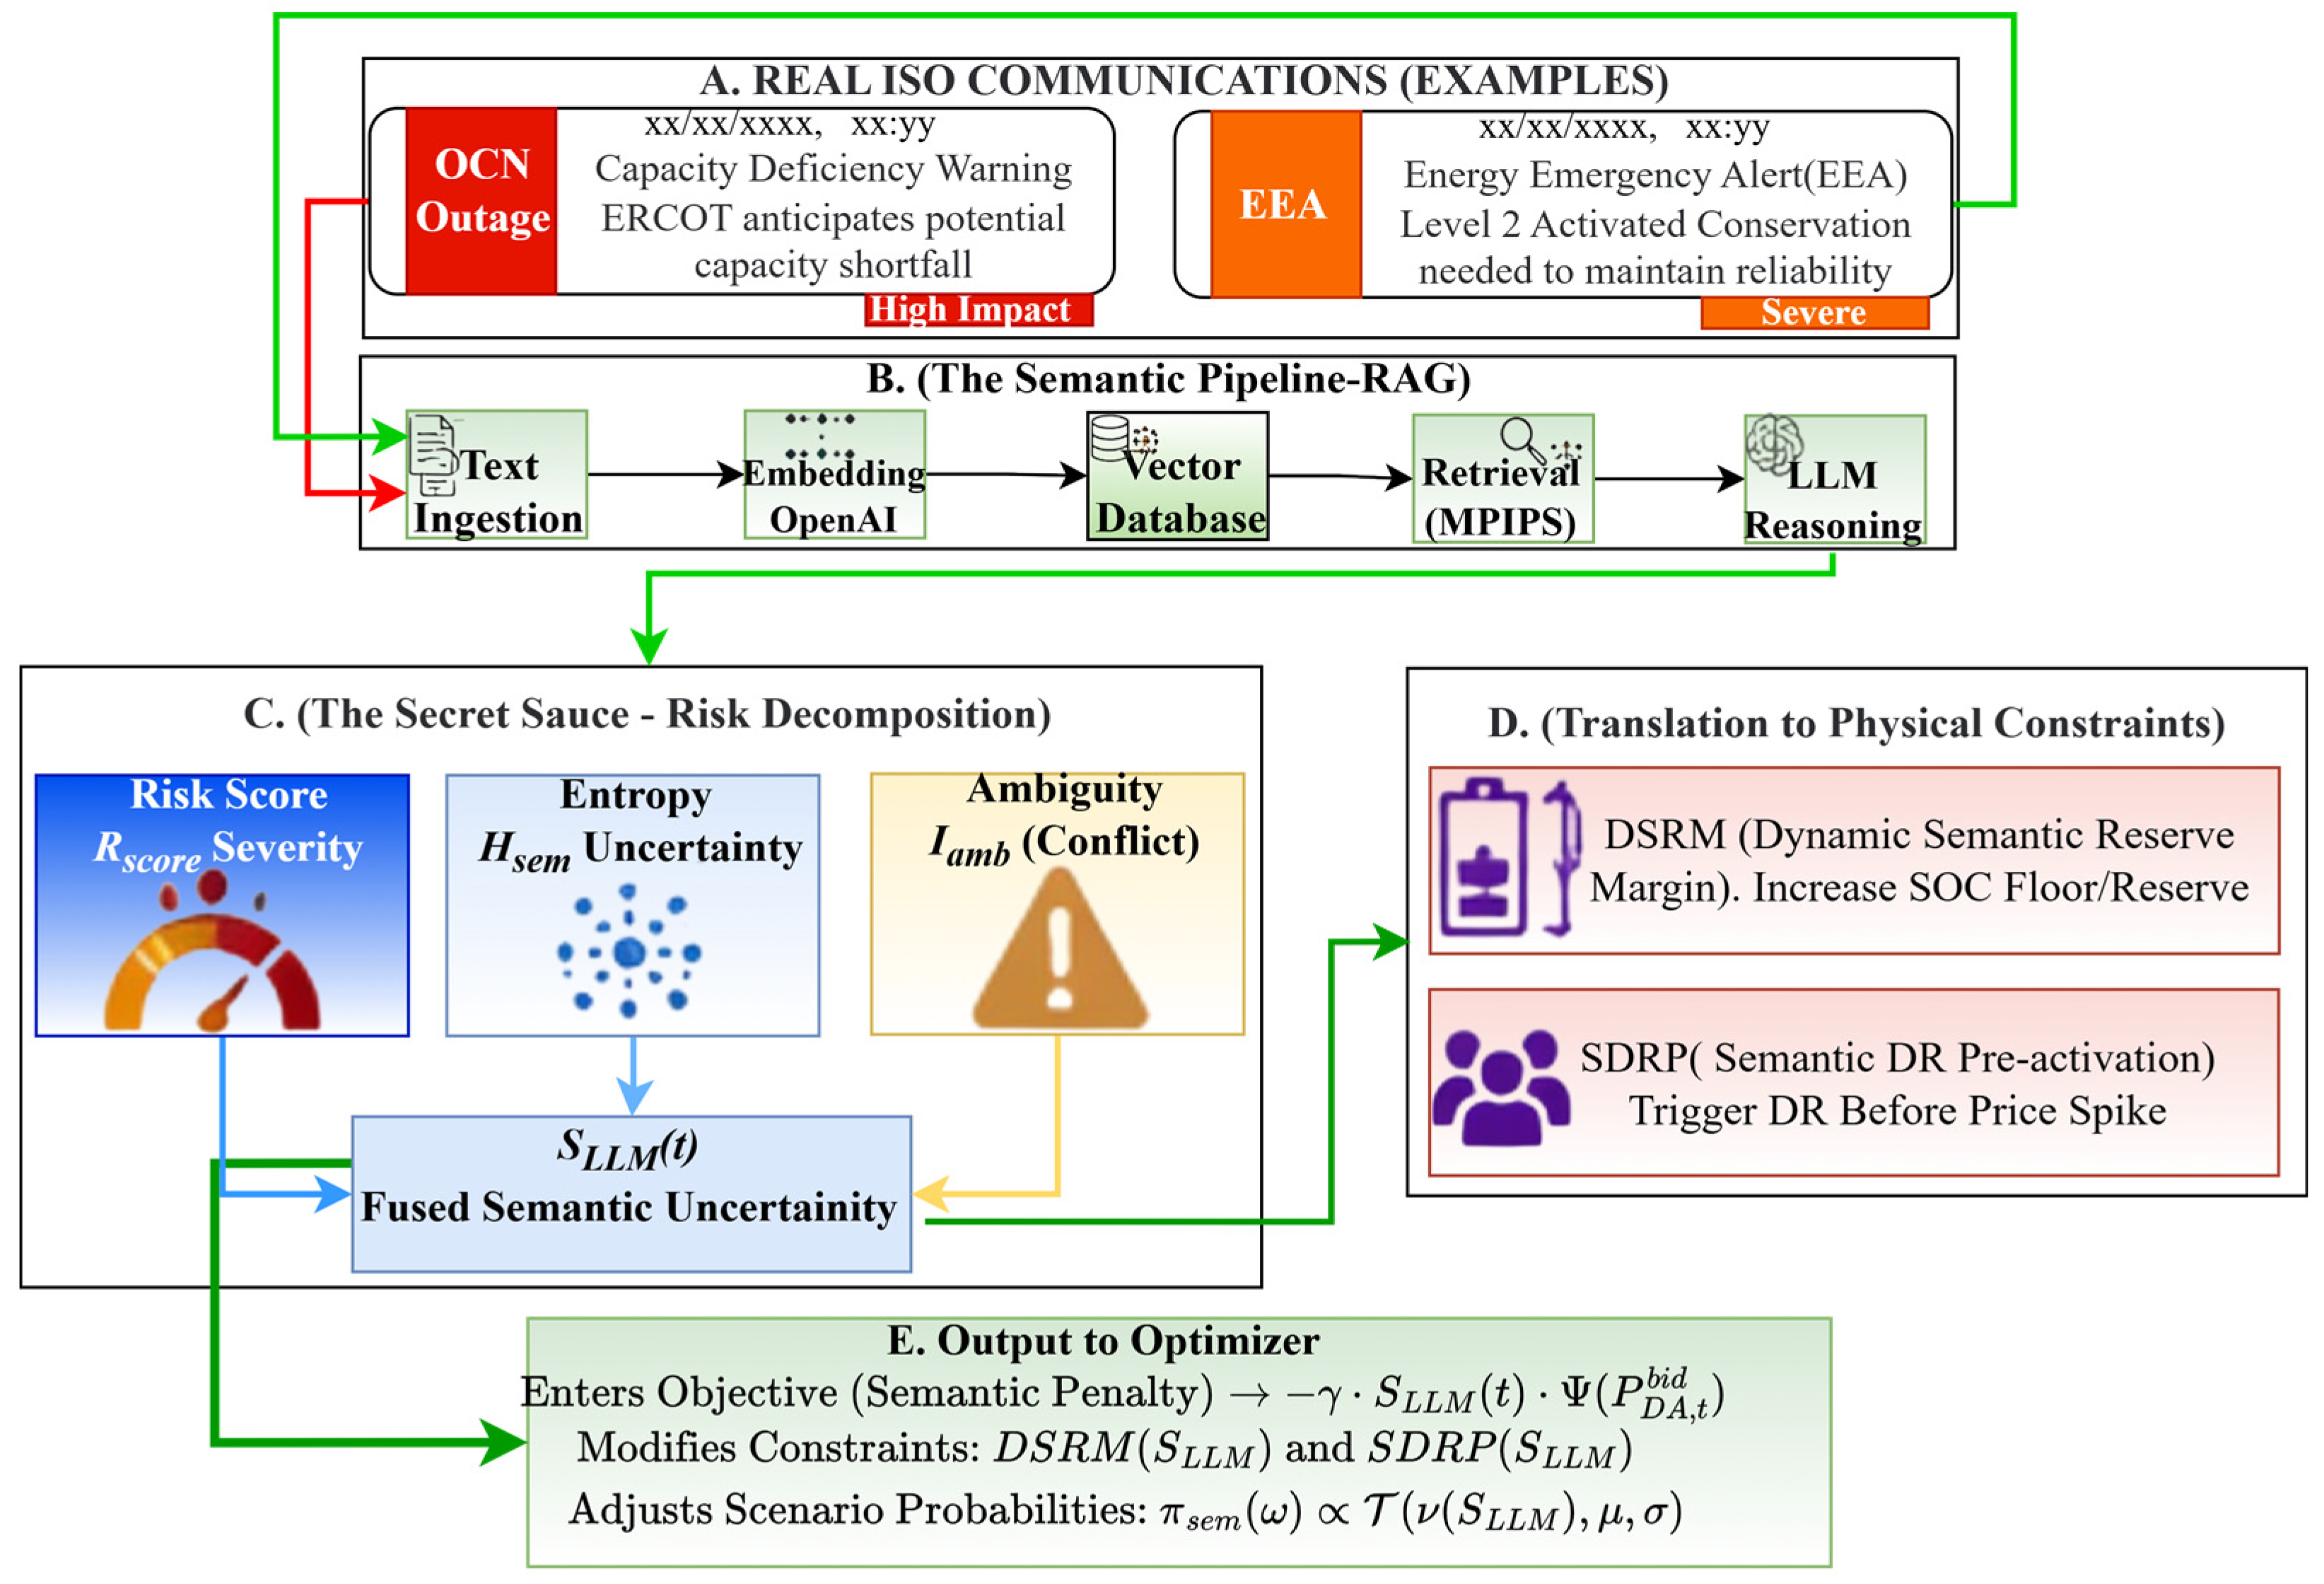
adjust stochastic price scenarios input into an optimization model using information generated from the RAG/SLLM engine. The engine generates market-risk data by processing market text alerts. This allows the model to adjust its decision-making with respect to potential scenarios that might have been missed by numerical forecasting. The semantic risk quantification method shown in
Figure 2 transforms raw market-text alerts into a bounded risk metric that influences both how stochastic price scenarios are generated and how they are optimized. Additionally, the methodology will affect how the VPP dispatches its resources in response to early-warning signs from market alerts. After generating semantically based scenarios, additional constraints will be placed on the dispatch process, including, but not limited to, the dynamic semantic reserve margin (DSRM) and the semantic demand response pre-activation (SDRP).
4.1. Energy Storage System Modeling
The Energy Storage System (ESS) is one of the most important flexible assets in the VPP because it can shift energy over time, reduce imbalance penalties, and provide emergency reserve during high-risk periods. Let
and
denote the ESS charging and discharging power at time
, respectively. The SOC transition is governed by Equation (31):
In Equation (31),
and
represent the charging and discharging efficiencies, while
is the dispatch interval. The first term increases the SOC during charging, while the second term decreases it during discharging. The ESS cannot operate outside its technical energy limits, which are imposed by Equation (32), which protects the battery from overcharging and excessive depletion. To prevent simultaneous charging and discharging, two binary variables
and
are introduced. The power limits are defined in Equation (33). The mutual exclusiveness of ESS operating modes is enforced by Equation (34) [
30]:
Battery degradation is an important cost component because aggressive cycling can increase short-term profit while reducing long-term battery life. To capture this effect, the degradation cost is modeled as a nonlinear function of the discharging power and the previous SOC, as shown in Equation (35). In Equation (35),
is the empirical degradation coefficient and
is a small positive constant used to avoid numerical instability. This penalizes high discharge rates, especially when SOC is low.
4.2. Demand Response and Renewable Generation Modeling
Demand Response (DR) provides another flexible resource by allowing the VPP to reduce or shift load during expensive or risky periods [
31]. Let
denote the curtailed or shifted power from the consumer cluster
at time
. The DR activation limit is given by Equation (36). In Equation (37),
is the base incentive rate, while
is the discomfort coefficient for the cluster
. The quadratic term reflects the practical fact that small curtailments may be acceptable to consumers, whereas larger curtailments impose disproportionately greater inconvenience. The deterministic renewable forecast is defined in Equation (38). Equation (38) combines the PV and wind forecasts into one expected renewable generation term. Under each real-time scenario
, the net VPP power position is calculated using Equation (39). Equation (39) represents the scenario-dependent power available for market settlement after accounting for renewable generation, ESS operation, DR activation, and load demand.
4.3. Baseline Numerical Profit and CVaR Risk Control
Let
be the VPP’s DA market bid. The RT imbalance under scenario
is defined in Equation (40). A positive value means the VPP has surplus power, while a negative value means it must purchase power to balance the costs. To model the dual settlement mechanism, Equation (40) is decomposed into positive and negative deviations in Equation (41). The RT imbalance settlement is then written in Equation (42), which allows surplus energy to be sold at the RT selling price and deficit energy to be purchased at the RT buying price. The scenario-dependent profit is formulated in Equation (43) which includes DA revenue, RT imbalance settlement, ESS degradation cost, and DR cost. The expected numerical profit is then calculated in Equation (44):
Although Equation (44) maximizes average performance, it may still produce risky decisions under extreme scenarios. Therefore, CVaR is introduced to improve lower-tail financial robustness. The profit-based CVaR is defined in Equation (45):
Equation (45) measures the expected profit in the worst portion of scenarios. Including this term helps the optimizer avoid strategies that are profitable on average but vulnerable to severe imbalance losses.
4.4. Semantically Augmented Objective Function
The key contribution of the proposed model is the use of
to penalize aggressive DA exposure when market text indicates elevated risk. The market exposure function is defined in Equation (46):
Equation (46) measures how far the DA bid deviates from the expected renewable generation. Large deviations indicate greater exposure to forecast error and imbalance settlement. The semantically augmented objective function is given in Equation (47):
In Equation (47), controls the importance of tail-risk protection, and controls semantic risk aversion. When is low, the semantic penalty is small and the model behaves similarly to a conventional stochastic VPP bidding model. When is high, Equation (47) discourages exposed DA bids and shifts the VPP toward a more defensive operating posture.
The semantic signal should not only change financial penalties; it should also physically modify the dispatch boundaries. The first proposed constraint is the Dynamic Semantic Reserve Margin (DSRM). Instead of using a fixed SOC lower bound, the minimum SOC increases with
, as shown in Equation (48), which reserves additional battery energy during semantically risky periods. The discharge throttling constraint is defined in Equation (49):
Equation (49) prevents excessive ESS discharge when the text stream indicates possible system stress. The second semantic constraint is Semantic Demand Response Pre-Activation. The semantic-adjusted DR activation signal is defined in Equation (50). Equation (50) adds a semantic shadow price
to the market price signal. The binary DR activation logic is enforced by Equation (51). The activated DR power is bounded in Equation (52):
Equations (50)–(52) allow the VPP to activate DR earlier when semantic risk is high, even if numerical price signals have not yet reached the normal DR threshold.
Combining Equations (31)–(52), the proposed model becomes a semantic-aware stochastic MIQP.
6. Comprehensive Simulation Setup
To evaluate the proposed RAG-VPP framework under a controlled extreme-event setting, a simulation environment is constructed using ERCOT-related electricity market data, renewable generation profiles, and a time-stamped semantic alert stream. The objective of this case study is to examine whether unstructured market intelligence can improve VPP dispatch before numerical market signals fully reflect system stress. The numerical data stream is based on open-access ERCOT market information, while the semantic stream is synthetically generated to follow the structure and escalation pattern of ERCOT Operating Condition Notices (OCNs) and Energy Emergency Alert (EEA) communications. Therefore, the reported semantic lead should be interpreted as a controlled stress-test result rather than a full historical validation of real ISO text behavior. The original case-study design uses a 7-day ERCOT-based simulation, 5 min resolution, ERCOT Houston Hub market prices, 50 MW wind, 30 MW PV, and a synthetic EEA1/EEA2 alert sequence. The synthetic stress-test is inspired by the type of operational escalation observed during major grid emergencies, but it is not intended to reproduce the exact ERCOT 2021 event chronology or the real ERCOT notice language. The purpose is to isolate the impact of early-warning information semantics in dispatch under controlled conditions
6.1. Data Integration and Scenario Design
The case study uses two data streams. The first is a numerical stream that includes the market price, load, wind generation, solar generation, and ESS parameters. The second is a semantic text stream that provides time-stamped market notices for the RAG/SLLM perception engine.
The simulation is conducted over 7 days with a 5 min real-time market resolution, giving T = 7 × 24 × 12 = 2016 dispatch intervals. Historical 5 min DAM and RTM LMPs are used, with ERCOT Houston Hub selected as the representative pricing node. The VPP includes a 50 MW wind farm, a 30 MW PV plant, and a representative 4 h lithium-ion ESS, as summarized in
Table 2.
To test RAG-VPP’s response to text-based early warnings, a synthetic ISO-style market-notice stream is constructed. The notices follow the timing, format, and escalation logic of real ISO Operating Condition Notices and Energy Emergency Alerts. However, the text stream is artificially generated for controlled experimental testing and should not be considered a full historical replay of a real ISO event. Therefore, the reported semantic lead time should be interpreted as a controlled stress-test result rather than a universal real-world guarantee.
Days 1–3 (Normal Operations): Routine market notices regarding transmission line maintenance and wind forecast updates.
Day 4, 14:00 (Event Injection): A “Black Swan” event is injected: an unpredicted cold front combined with thermal generator outages. The text feed begins issuing EEA Level 1 warnings.
Day 4, 18:00: The event escalates, and the text feed issues EEA Level 2 alerts, signaling that operating reserves are critically low.
Day 5: Text reflects a return to normal operations with notices of restored capacity.
To avoid relying only on a single stress-event trajectory, additional controlled variants were considered to examine semantic-risk behavior under delayed, ambiguous, false-positive, and severe-alert conditions; the different scenarios are shown in
Table 3.
6.2. Implementation Settings of the RAG/SLLM Layer
To improve reproducibility, the implementation settings of the semantic perception layer are summarized in
Table 4. The RAG/SLLM layer was used to convert ISO-style operating notices, emergency alerts, weather warnings, and regulatory updates into a time-indexed semantic uncertainty metric. The text corpus was first divided into overlapping chunks, embedded in a vector database, and retrieved using a hybrid dense-vector and sparse-keyword retrieval strategy. The retrieved text fragments were then passed to the semantic language model to estimate the probability distribution over predefined risk levels. The final semantic uncertainty metric was calculated externally using the risk probability vector, semantic entropy, ambiguity index, and smoothing equations defined in
Section 3.
The five semantic risk levels were defined as follows. “Normal” represents ordinary operating conditions. “Watch” indicates weak early-warning information, such as weather deterioration or reserve tightening. “Alert” represents clear operational stress, such as high demand, renewable uncertainty, or market volatility. “EEA-1” represents an emergency-watch condition with low operating reserves. “EEA-2” represents severe system stress requiring defensive dispatch actions. The LLM output was restricted to a probability vector over these five levels. The semantic uncertainty metric was not directly assigned by the LLM; instead, it was calculated using the mathematical procedure described in
Section 3.
Prompt template used for semantic risk estimation
You are a market-risk analyst for the power system that supports the dispatch of virtual power plants. Based only on retrieved ISO-style notices, weather warnings, and regulatory updates, classify the current operating condition into one of five risk levels: Normal, Watch, Alert, EEA-1, or EEA-2. Estimate the probability of each risk level and return the answer in valid JSON format.
Current dispatch time: {time}
Current VPP operating state: {operating_state}
Numerical market context: {price_load_renewable_context}
Retrieved market notices: {retrieved_chunks}
Return only the following JSON fields:
{“risk_level”: “Normal/Watch/Alert/EEA-1/EEA-2”,
“probabilities”: {
“Normal”: value,
“Watch”: value,
“Alert”: value,
“EEA-1”: value,
“EEA-2”: value},
“key_evidence”: “short evidence from the retrieved notices”,
“operator_interpretation”: “short explanation of the grid-risk meaning”}
The probability values must sum to 1. The final semantic uncertainty metric is calculated outside the LLM using the probability vector, entropy, ambiguity, and smoothing equations.
6.3. VPP Portfolio and Operational Parameters
The simulated Virtual Power Plant (VPP) integrates renewable generation, the energy storage system (ESS), and Distributed Resources (DR). Demand Response (DR) has been represented using three Flexible-Load Clusters. All three clusters were defined with a maximum capacity of 5 MW, resulting in a Total Capacity of 15 MW. Differing discomfort coefficients were applied to each group based on differences in Consumer Flexibility, as shown in
Table 5. All other Operational Parameters were equalized among the Benchmark Models unless otherwise noted.
6.4. Semantic and Risk-Control Parameters
The semantic uncertainty measure
, for example, can take on values from zero up to one. This means that data collected normally are detected in an operational environment, which poses an extreme semantic risk. In this manner, the semantic variables control the extent to which the RAG/SLLM output affects the dispatch model. The semantic risk aversion factor
controls the penalty associated with exposed DA bidding. The DSRM parameter
determines the additional ESS reserve required as a result of increased DA. The parameter
provides for limiting aggressive discharging at times of increased risk. Finally, the semantic DR shadow price
will allow DR to be activated earlier when text indicating market stress is recognized, as shown in
Table 6.
7. Results and Discussion
The RAG-VPP framework was evaluated in a week-long controlled stress-test setting with a week-long operational time frame using 5 min high-resolution ERCOT Houston Hub Market Data, as described in
Section 5.1. A “Black Swan”-type of risk event, an unanticipated extreme cold snap, and unplanned outages of thermal units were introduced into the system on day four. The following analysis will demonstrate how well the framework performed over all of its dimensions, that is, numerically, semantically, physically, and financially.
7.1. Evaluation of the Numerical Forecasting Baseline (Layer 2)
Establishing a robust baseline for the basic numerical forecasting model (Layer 2) before assessing the effects of semantic enhancement is also critical. Industry-standard deep learning models were used as benchmarks for the hybrid decomposition-based models detailed in
Section 2.3. at pre-event (normal) market conditions.
As detailed in
Table 7, the end-to-end computational latency of the proposed framework, including semantic retrieval, numerical forecasting, scenario generation, and MIQP solving, averages 140.3 s. This value remains below the 300 s dispatch interval used in the 5 min market simulation. However, the available operational buffer is limited, particularly when communication delays, physical command execution, and unforeseen computational variations are taken into account. Therefore, the current implementation should be interpreted as suitable for market-interval dispatch and decision-support applications, rather than sub-second industrial control of DER devices. Future deployment will require further latency reduction through parallel retrieval, cached embeddings, lightweight or distilled LLMs, warm-start MIQP solving, and cloud/edge acceleration.
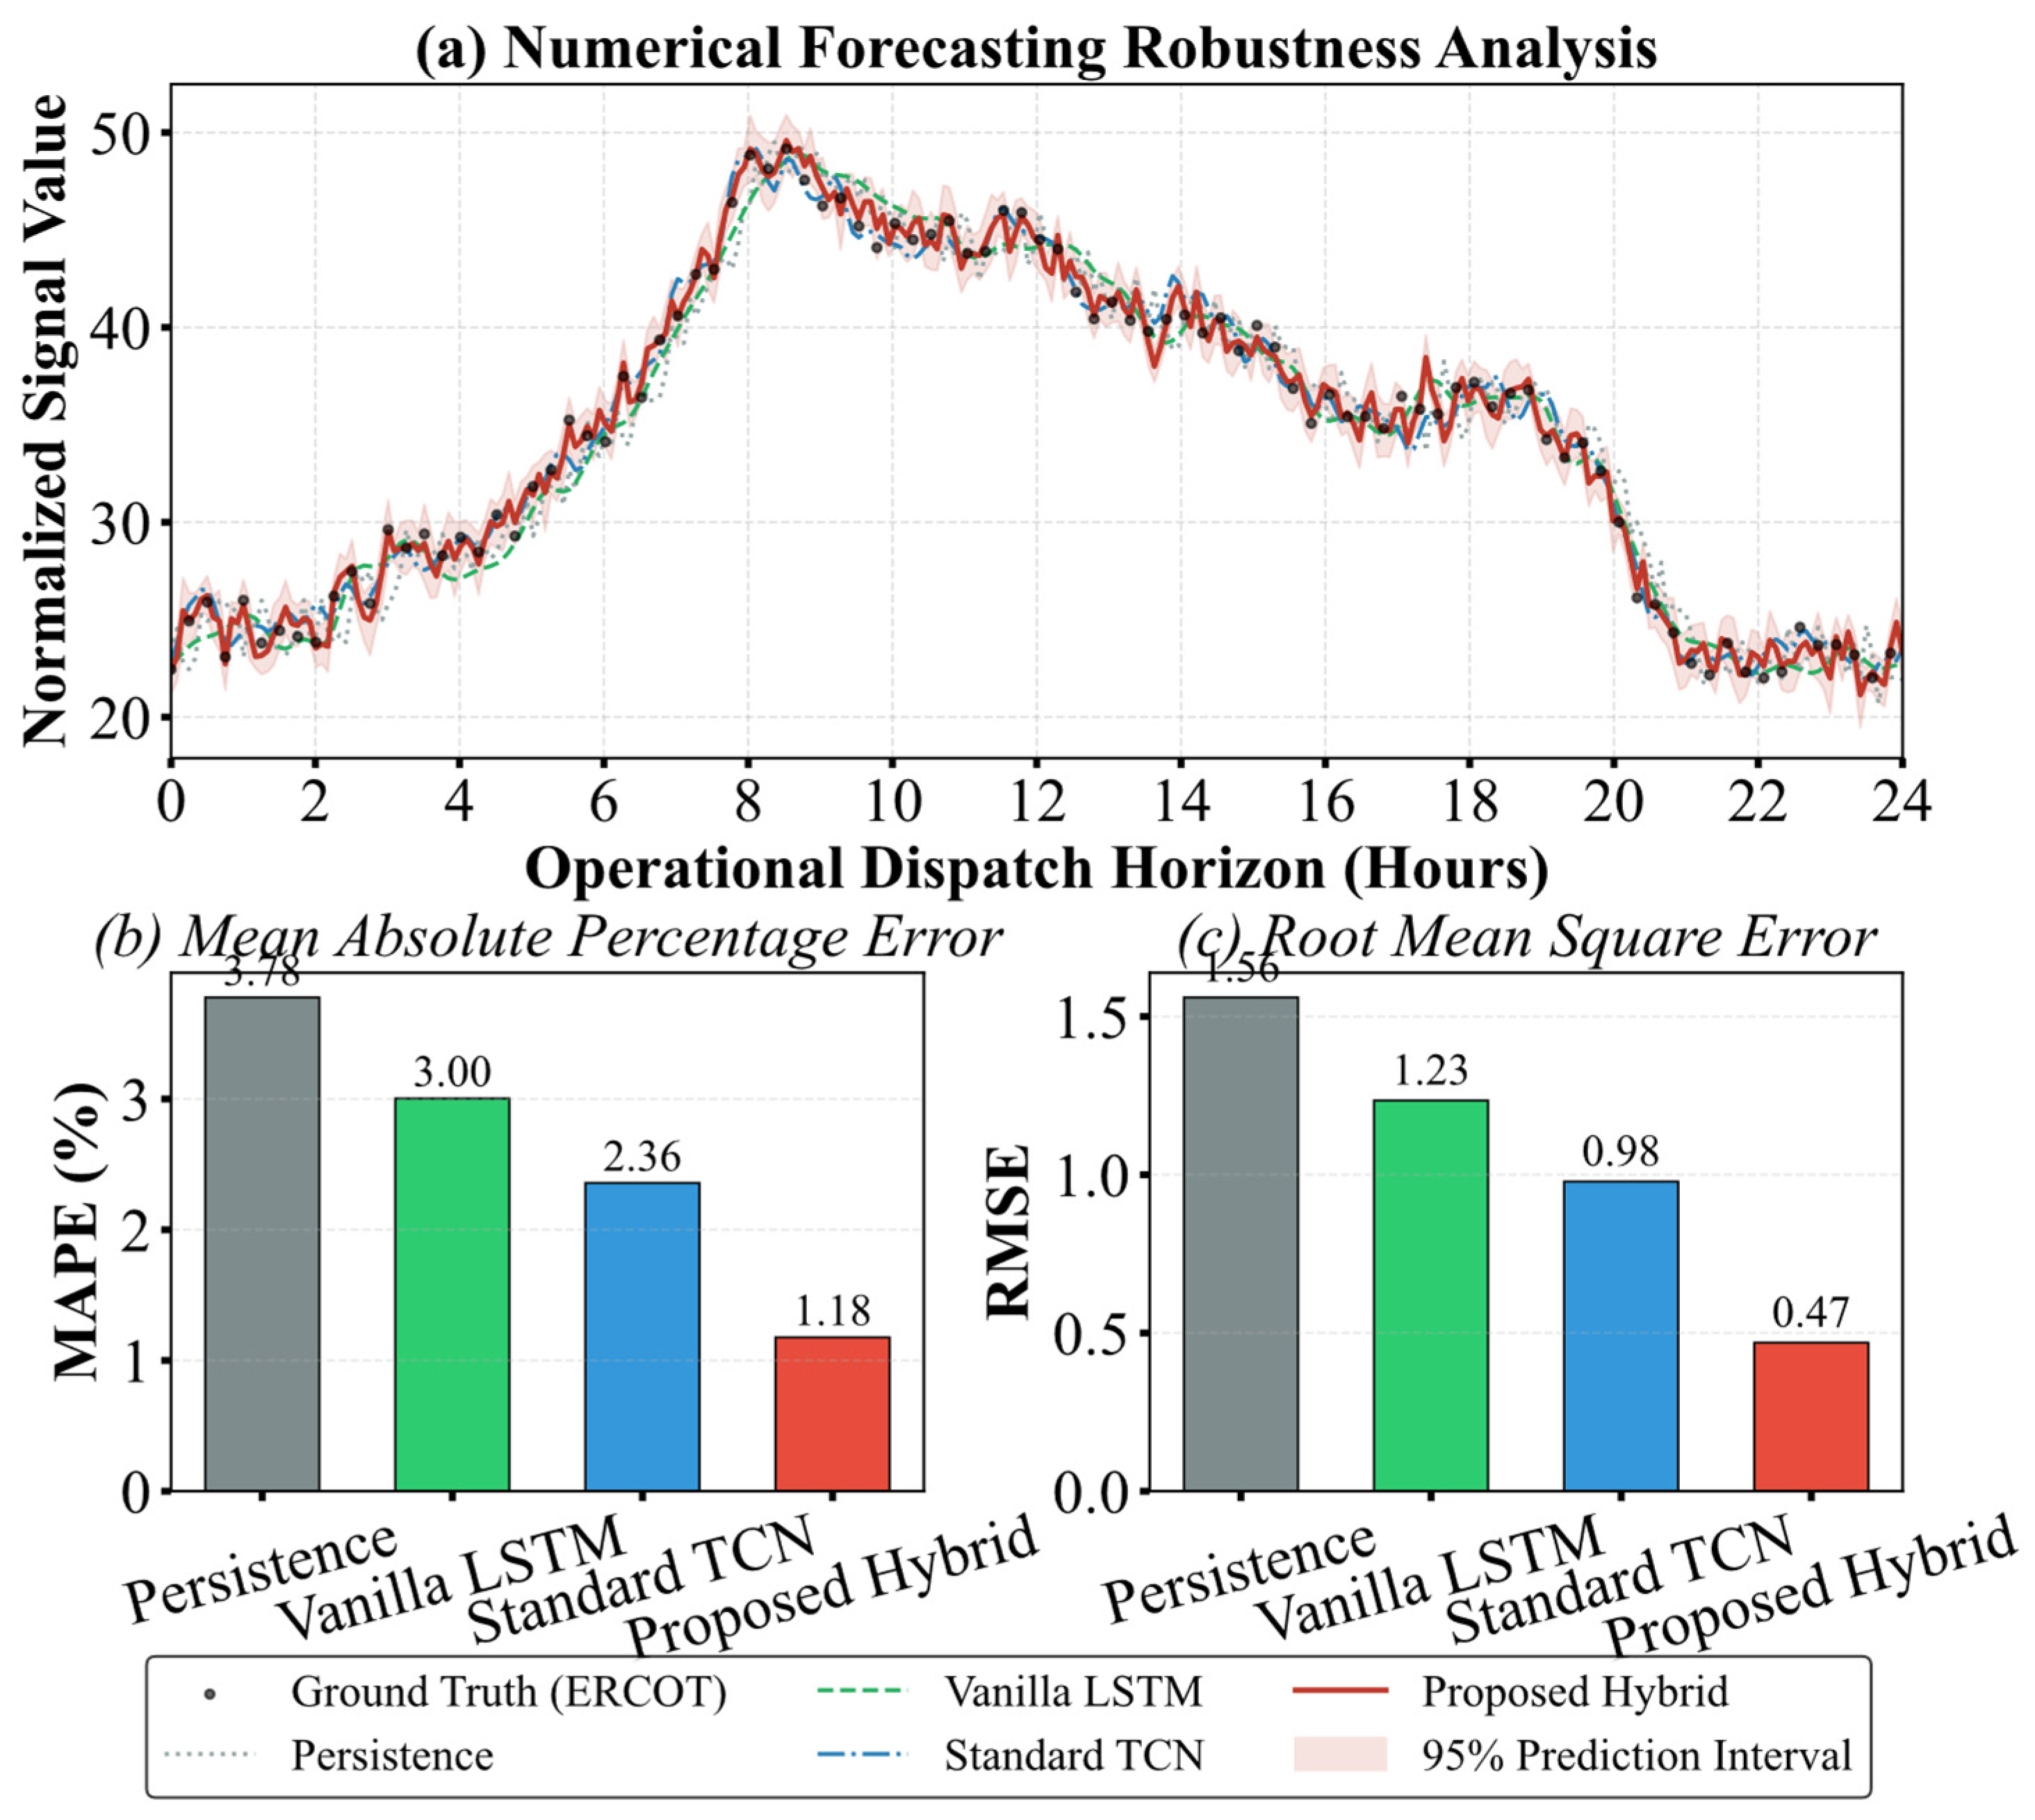
The forecasting superiority of this layer is visualized in
Figure 3. As shown in
Figure 3a, the proposed Layer 2 architecture effectively captures high-frequency transient market signals without the severe phase-lag or “oversmoothing” typical of standard LSTM or TCN networks. By utilizing the Sample Entropy (
) operator to isolate high-frequency intrinsic mode functions (
), the model achieves a 73.5% reduction in Mean Absolute Percentage Error (MAPE) compared to a vanilla LSTM (
Figure 3b). This validates that the RAG-VPP is built upon a highly accurate, state-of-the-art numerical foundation, ensuring that any further improvements are strictly attributable to the NLP semantic augmentation.
7.2. The Semantic Lead: Bridging the Epistemological Gap
Although Layer 2’s performance is accurate in normal situations, all purely numerical systems are ultimately backward-looking and therefore often perform poorly when system shocks occur. In accordance with the primary hypothesis presented in
Section 3, namely that unorganized market intelligence will serve as a leading indicator for grid collapse, this is verified using empirical data shown in
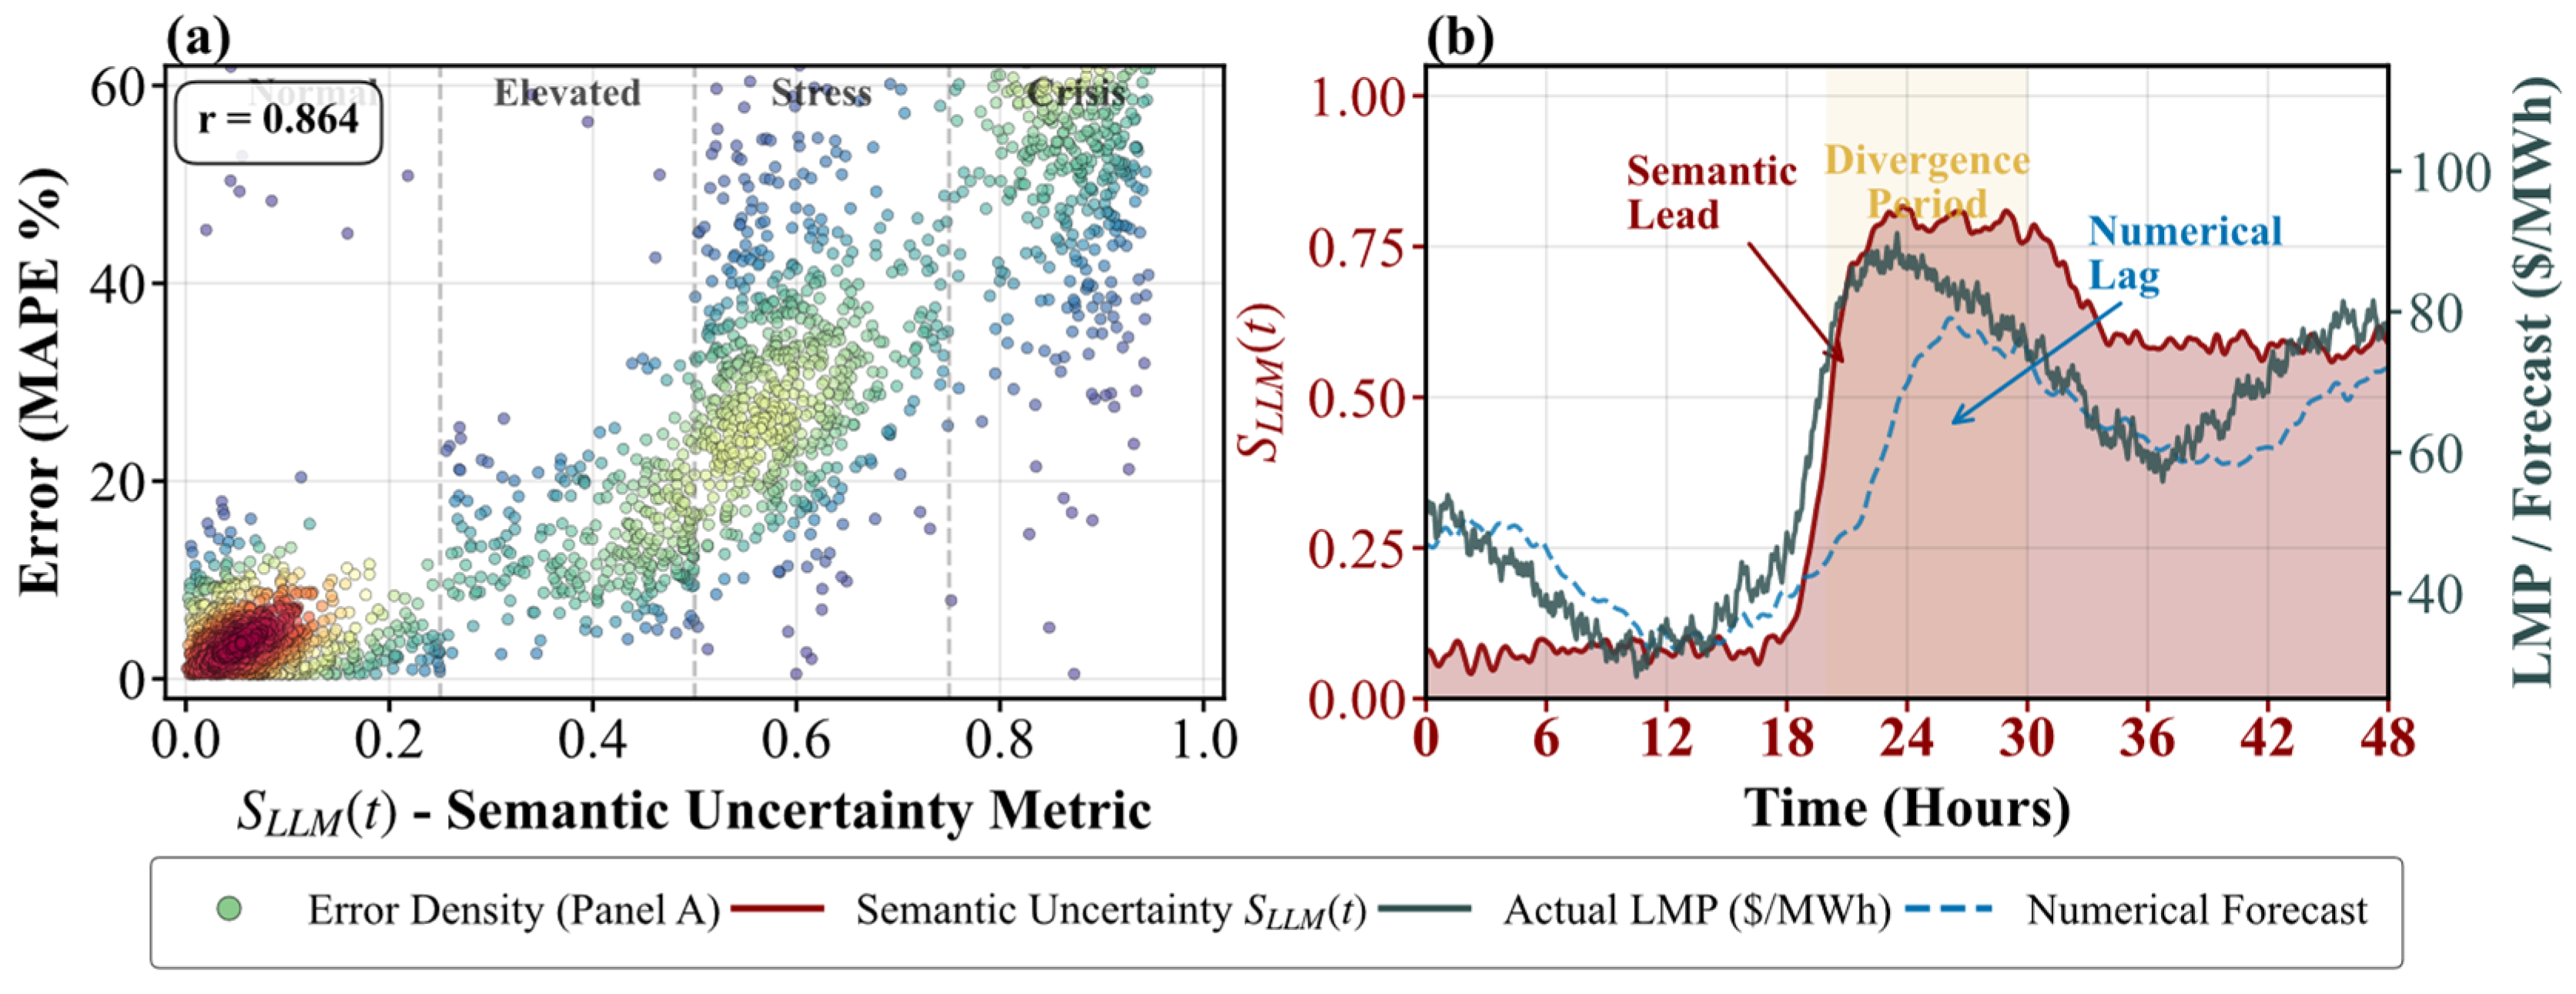
Figure 4.
Figure 4a displays the relationship of the Semantic Uncertainty Metric
to the numerical forecasting errors, and reveals an extremely strong positive Pearson correlation coefficient
. As the
crosses from the normal threshold (<0.25) to enter the “Crisis” area (>0.75), the Mean Absolute Percentage Error (MAPE) of the numerical model increases to greater than 50%. This result is due to the fact that the matrices
, which represent historical time series used for predictive modeling purposes, do not contain any of the hidden physical factors contributing to the “Black Swan” event. A quantitative measure of how much earlier the NLP-based
metric will be available relative to the Layer 2 Semantic Perception Engine is illustrated in
Figure 4b. The ingested ERCOT OCNs cause the
metric to rise sharply at hour 19. More importantly, both the Actual LMP and the corresponding Numerical Forecast fail to account for this shock until many hours after it has occurred. Therefore, this “Divergence Period” verifies that market text precedes market pricing. The RAG-VPP uses this knowledge gap to modify the probability space of real-time market pricing via the semantically biased transformation given by Equation (56) in
Section 5.
7.3. Actuating Physical Resilience via Semantically Conditioned Constraints
The transformation of semantic foresight into actual grid reliability is achieved by using the Semantically Conditioned Physical Constraints that are described in detail within
Section 5. During the “Black Swan” injection of an extreme event shown in
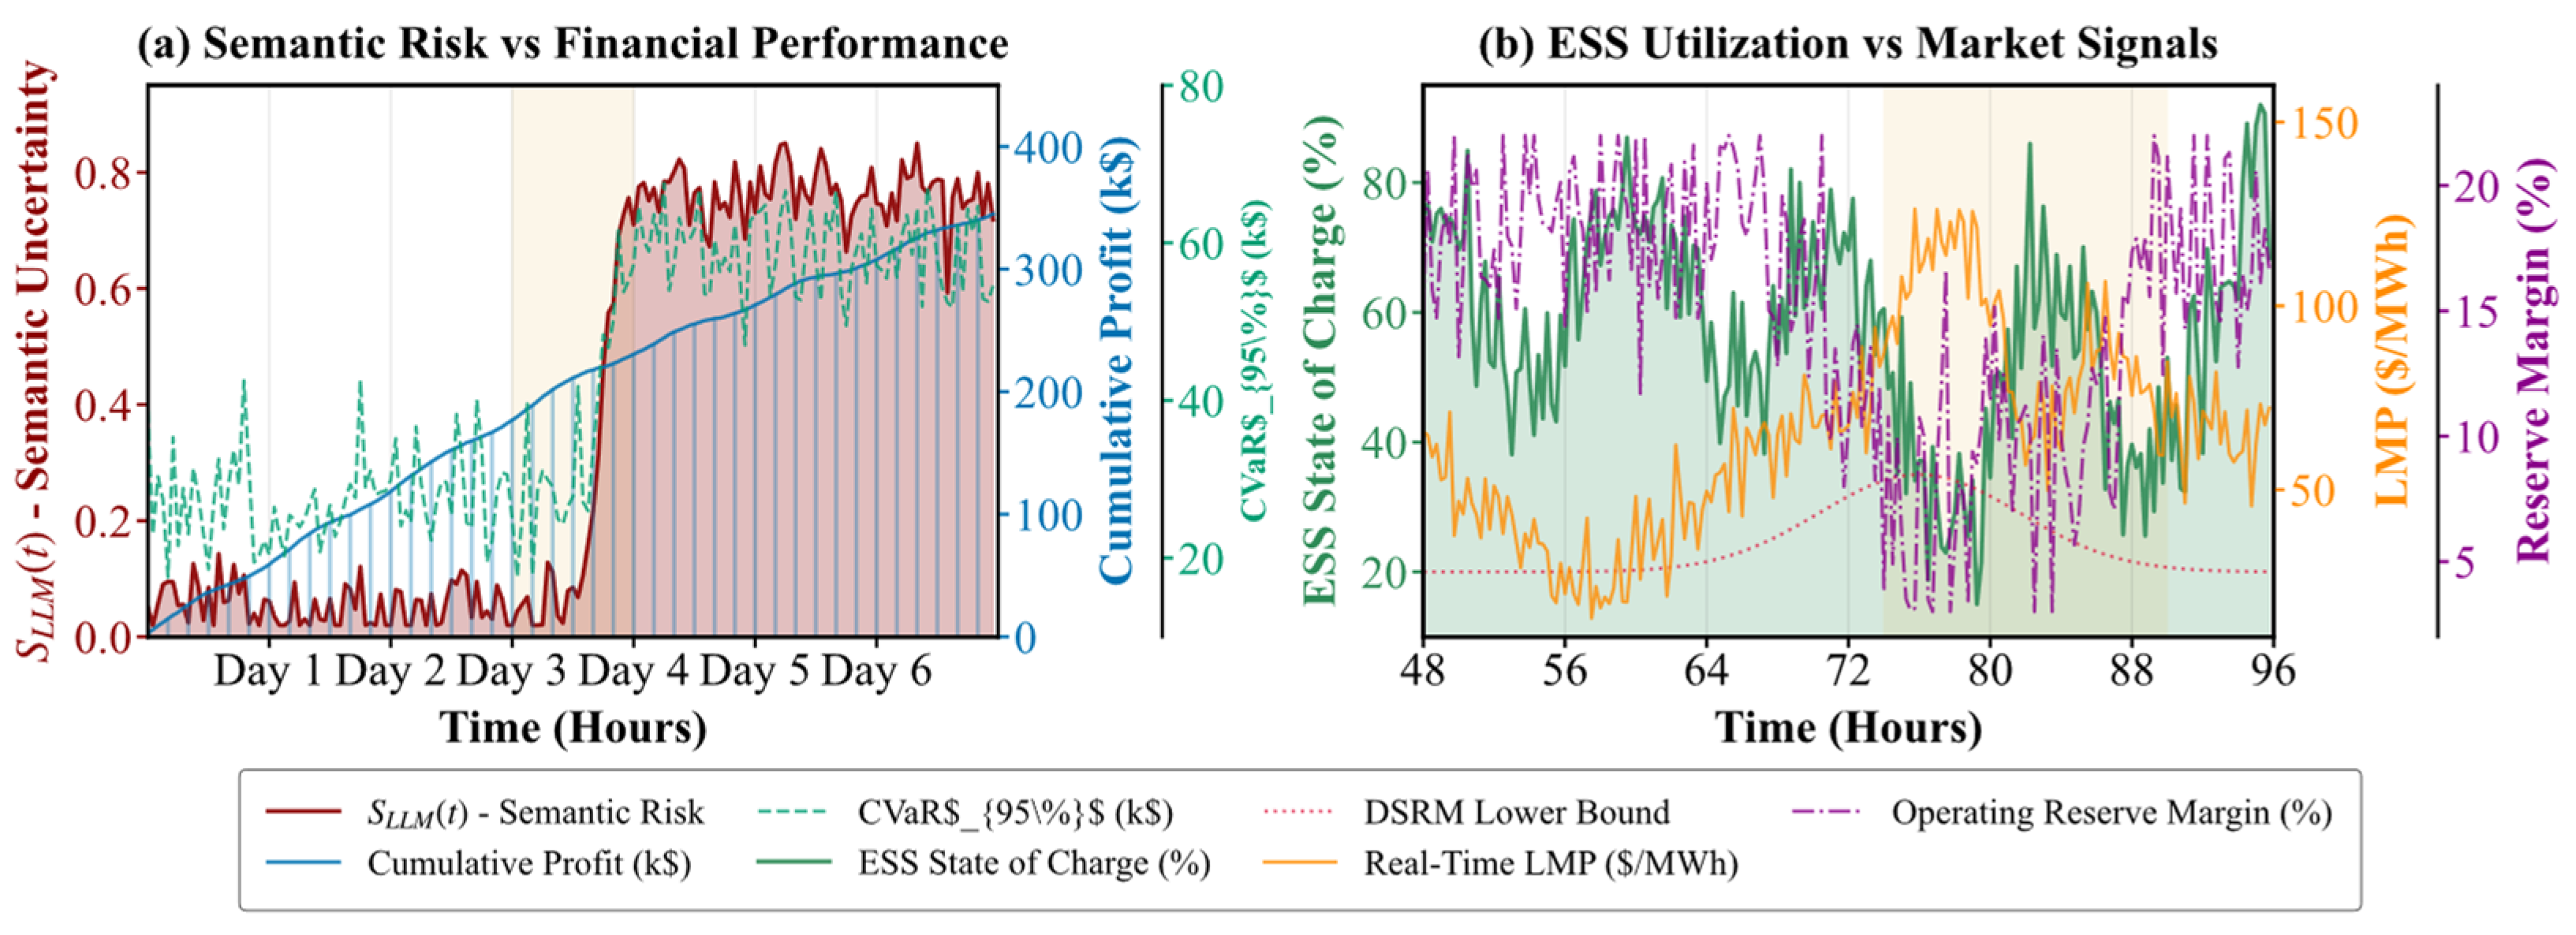
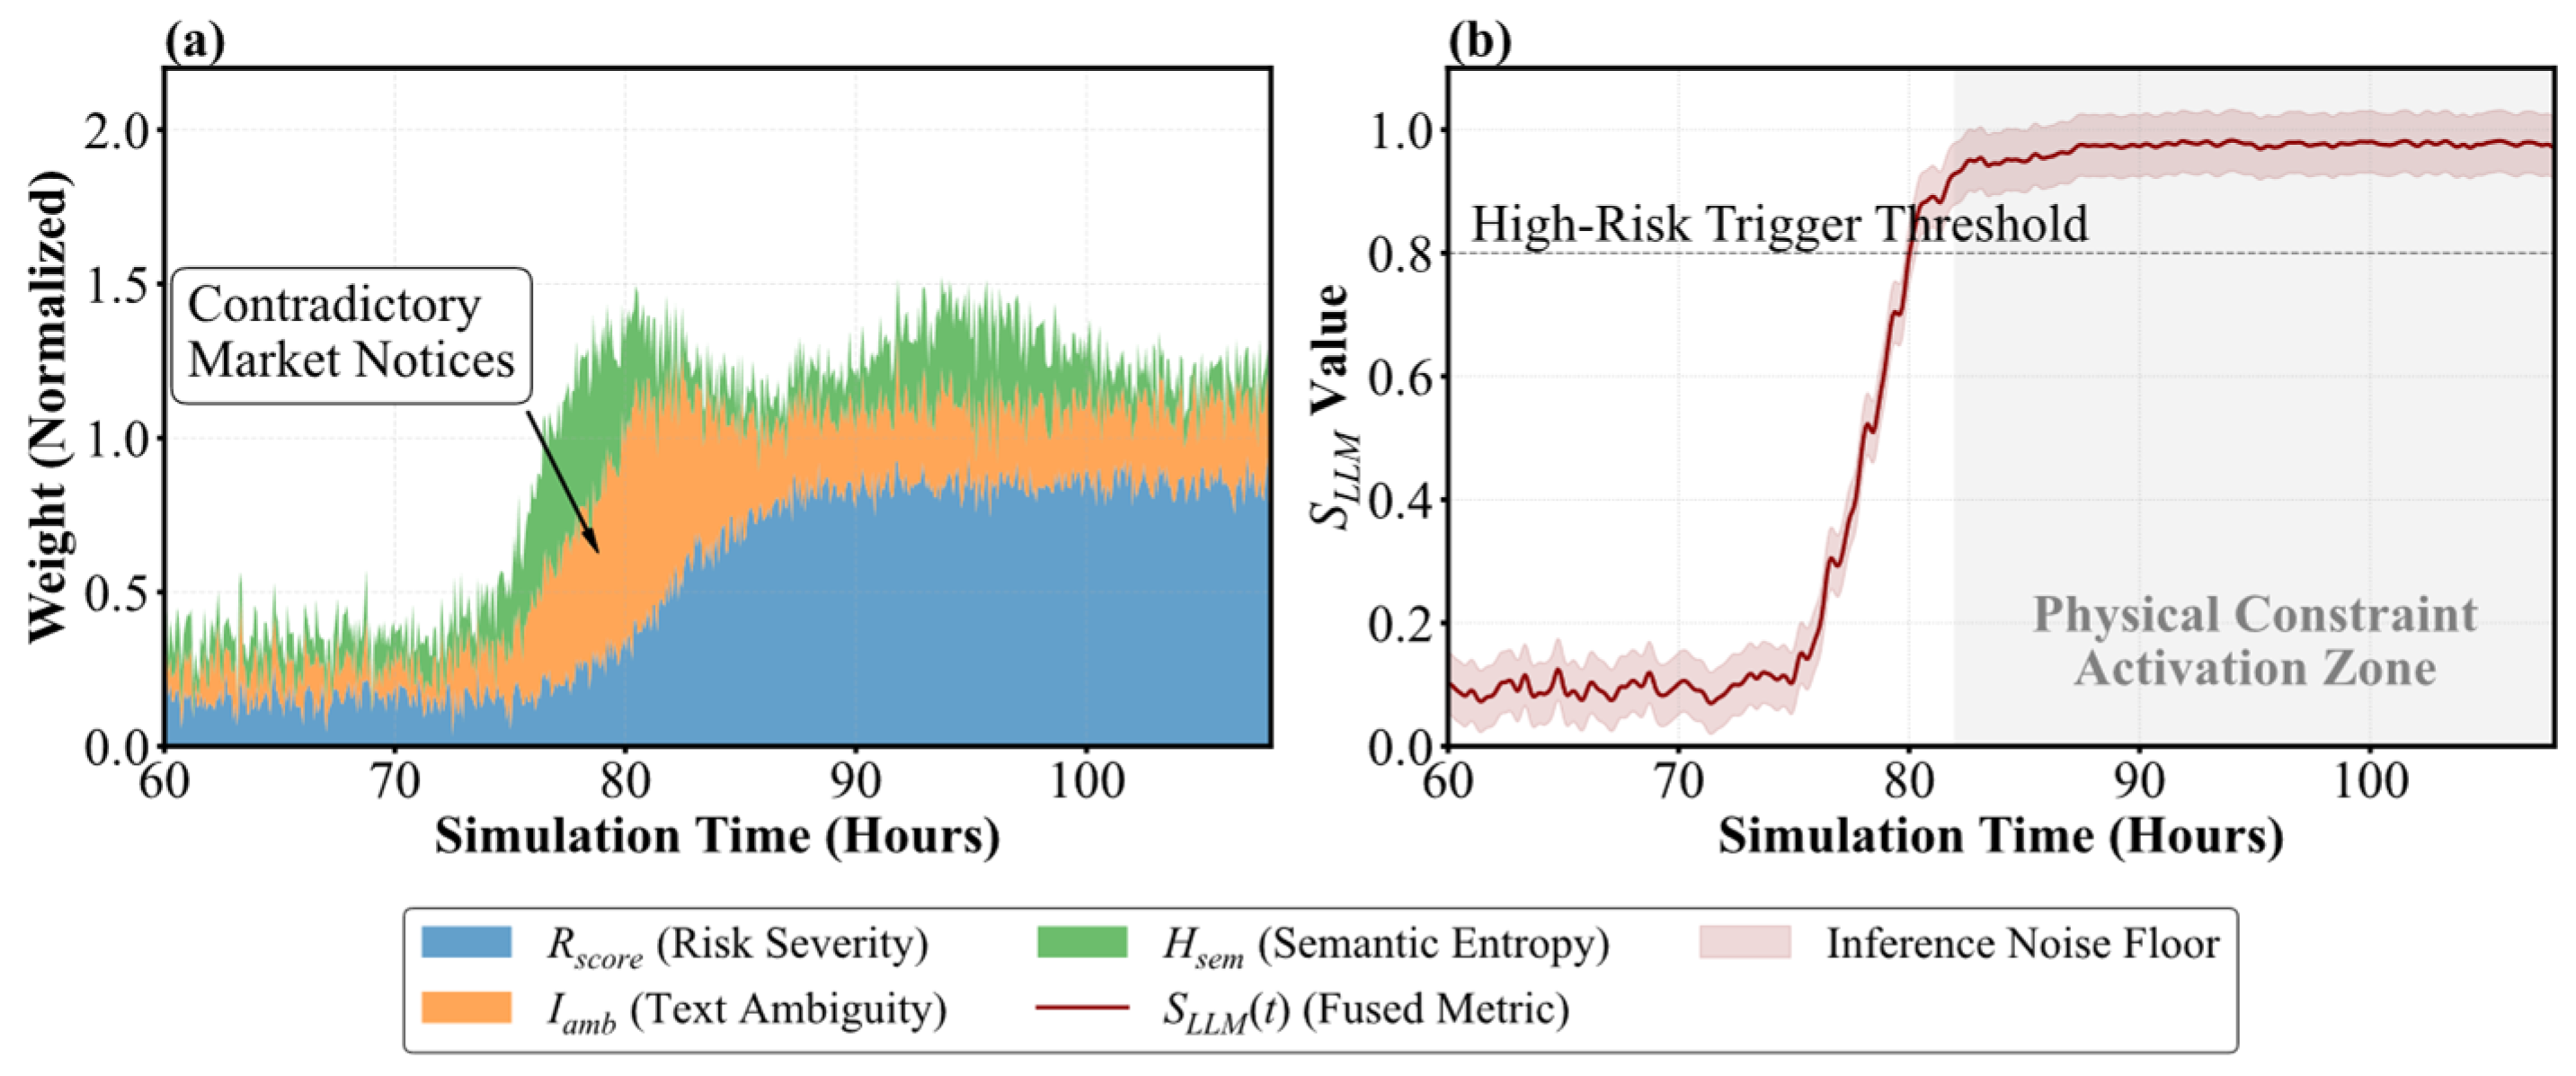
Figure 5a, a rapid surge occurs in Text Ambiguity
and consequently drives the fused
measurement to maximum levels. Immediate reaction through an asymmetrical discrete-time exponential filter (
Section 3.4) enables activation of the Dynamic Semantic Reserve Margin (DSRM). Shown in
Figure 5b, as the DSRM lower limit is elevated, it raises the Economic Baseline (12%) State-of-Charge (SOC) minimum operating level on the Energy Storage Systems (ESS) to approximately 30%.
The critical importance of this constraint is observable in the 48 h micro-analysis in
Figure 5b. Between Hours 74 and 80, the actual grid Operating Reserve Margin (purple line) collapses. While the deterministic baseline model completely depletes its battery to chase the peaking LMPs (orange line), the RAG-VPP prioritizes physical reliability, holding its SOC above the DSRM floor.
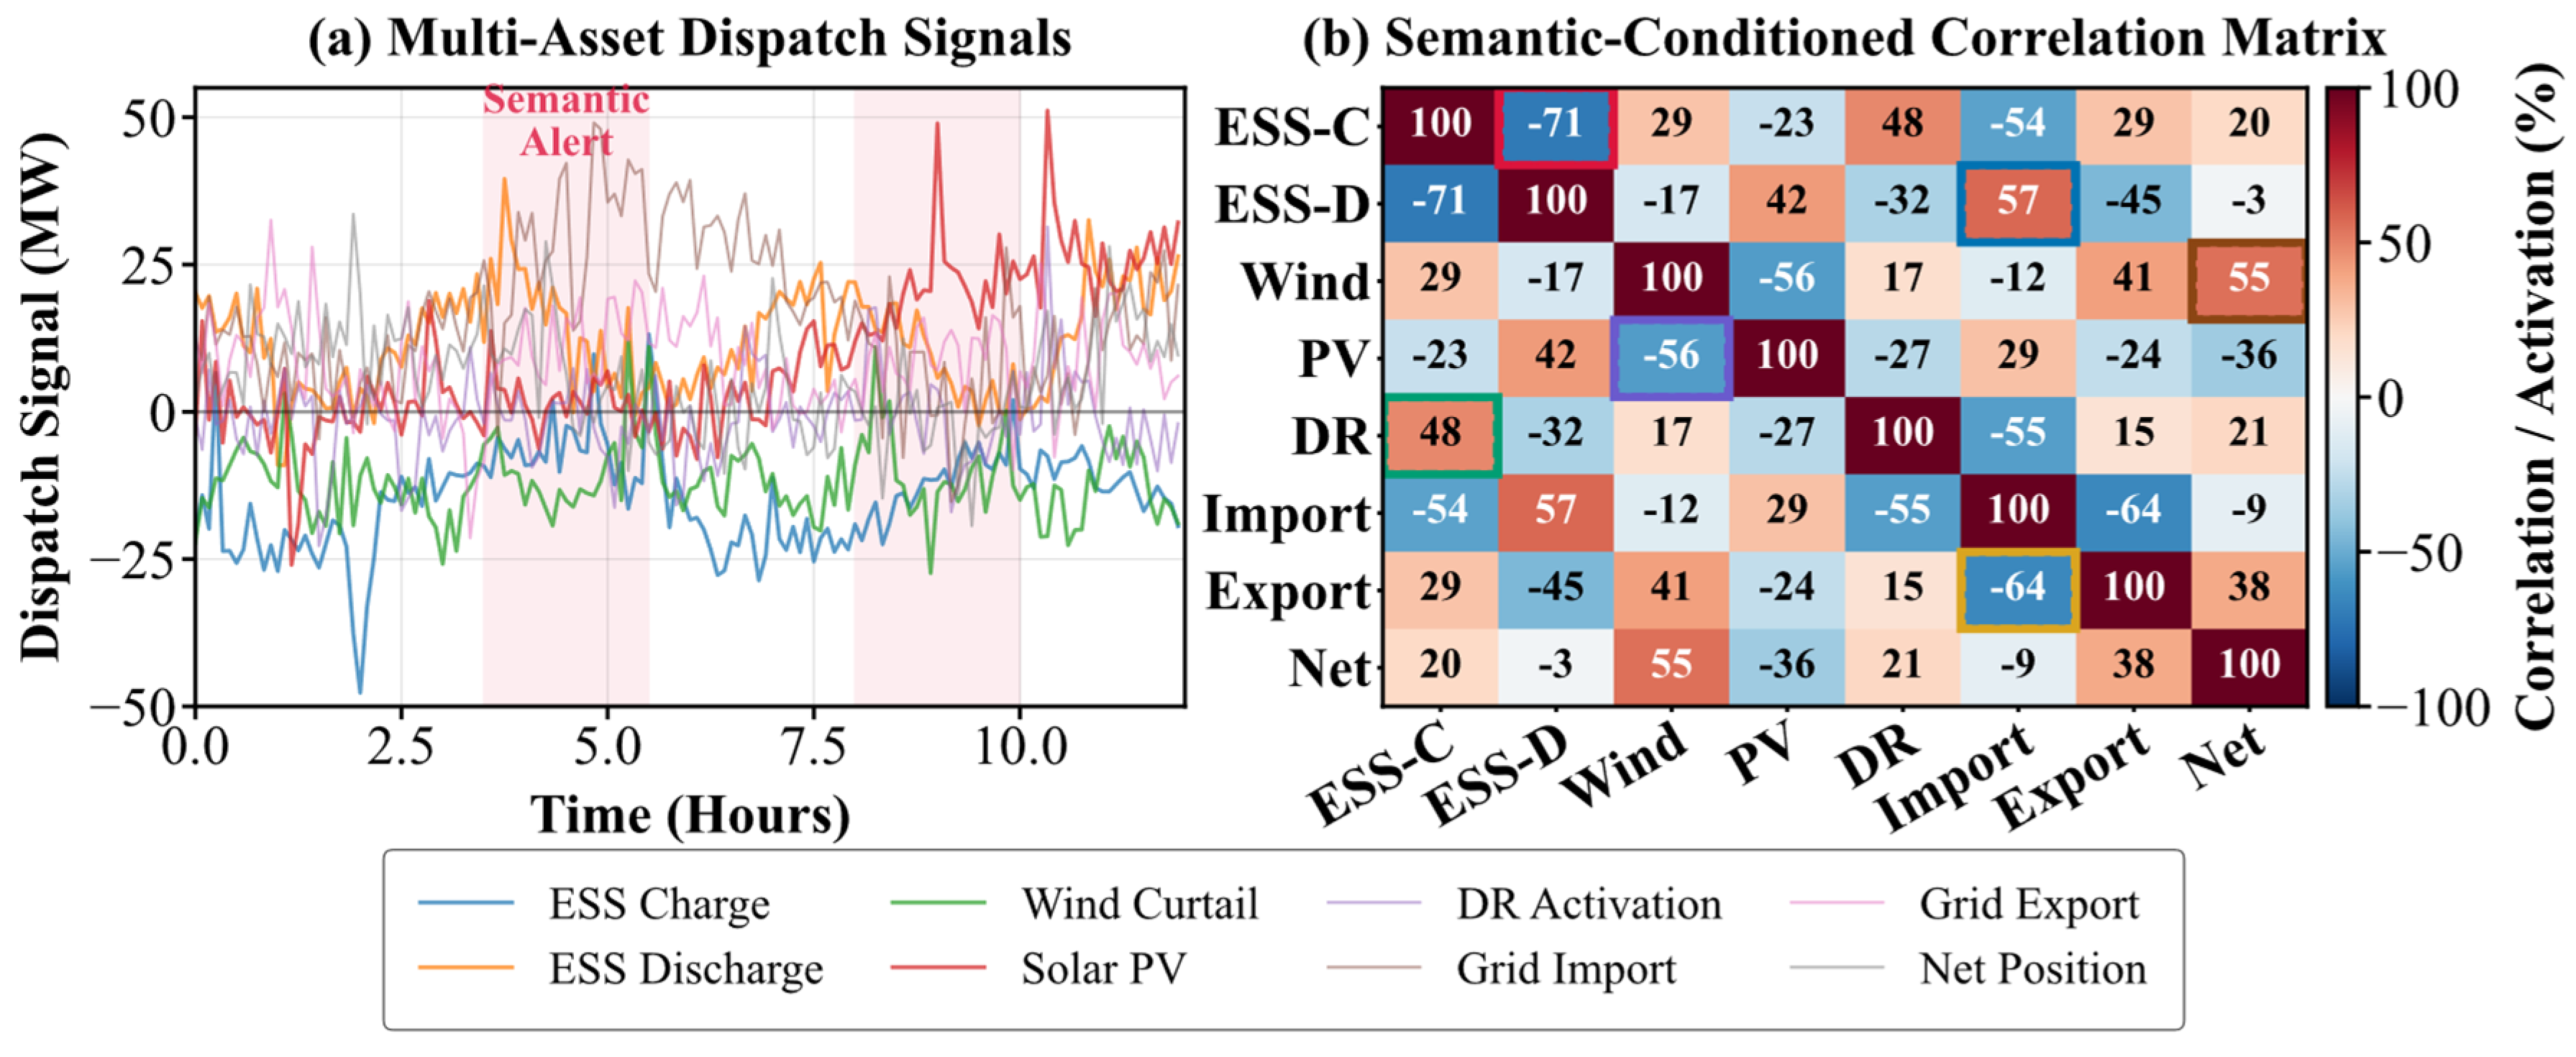
At the same time the system begins SDRP, it also initiates DR activation in a burst, as indicated by the purple signals in
Figure 6a at the exact time of the semantic alert. A correlation matrix between asset performance is also provided in
Figure 6b. It shows a high level of synergy across all portfolios due to the MIQP optimizer. The correlations are +48% between DR activation and charging from energy storage systems. Rather than simply reducing demand, the VPP uses demand reduction as a “storage buffer” to prepare for future long-duration grid stress conditions, indicating an integrated approach to multi-mode scheduling.
7.4. Financial Alpha and Risk-Adjusted P&L
The physical defensive posturing triggered by
directly translates to superior economic performance, validating the Augmented Objective Function derived in
Section 4.3.
Table 8 summarizes the holistic performance of the proposed model against the deterministic (Det-VPP) and numerical stochastic (Num-VPP) baselines. To ensure a fair comparison, all three models use the same VPP portfolio, market data, renewable profiles, ESS parameters, DR capacity, and operational constraints. The Det-VPP baseline uses deterministic numerical forecasts and does not include stochastic scenarios or semantic information. The Num-VPP baseline uses the same hybrid numerical forecasting architecture and stochastic MIQP structure as the proposed model, but excludes the RAG/SLLM semantic layer, semantic-conditioned scenarios, DSRM, and SDRP. The proposed RAG-VPP uses the same numerical forecasting and stochastic MIQP backbone as Num-VPP, with the additional semantic uncertainty metric and semantic-aware constraints. Therefore, the difference between Num-VPP and RAG-VPP isolates the contribution of the semantic intelligence layer.
The RAG-VPP achieves a total cumulative profit of $285.8 k, outperforming the Num-VPP by 20% and the Det-VPP by 32%, while simultaneously recording zero hours of reserve margin violations. Because the current study is based on a controlled stress-test, the reported differences are interpreted as scenario-based performance improvements; broader statistical testing with multiple real ISO events and repeated stochastic seeds is required for formal significance claims.
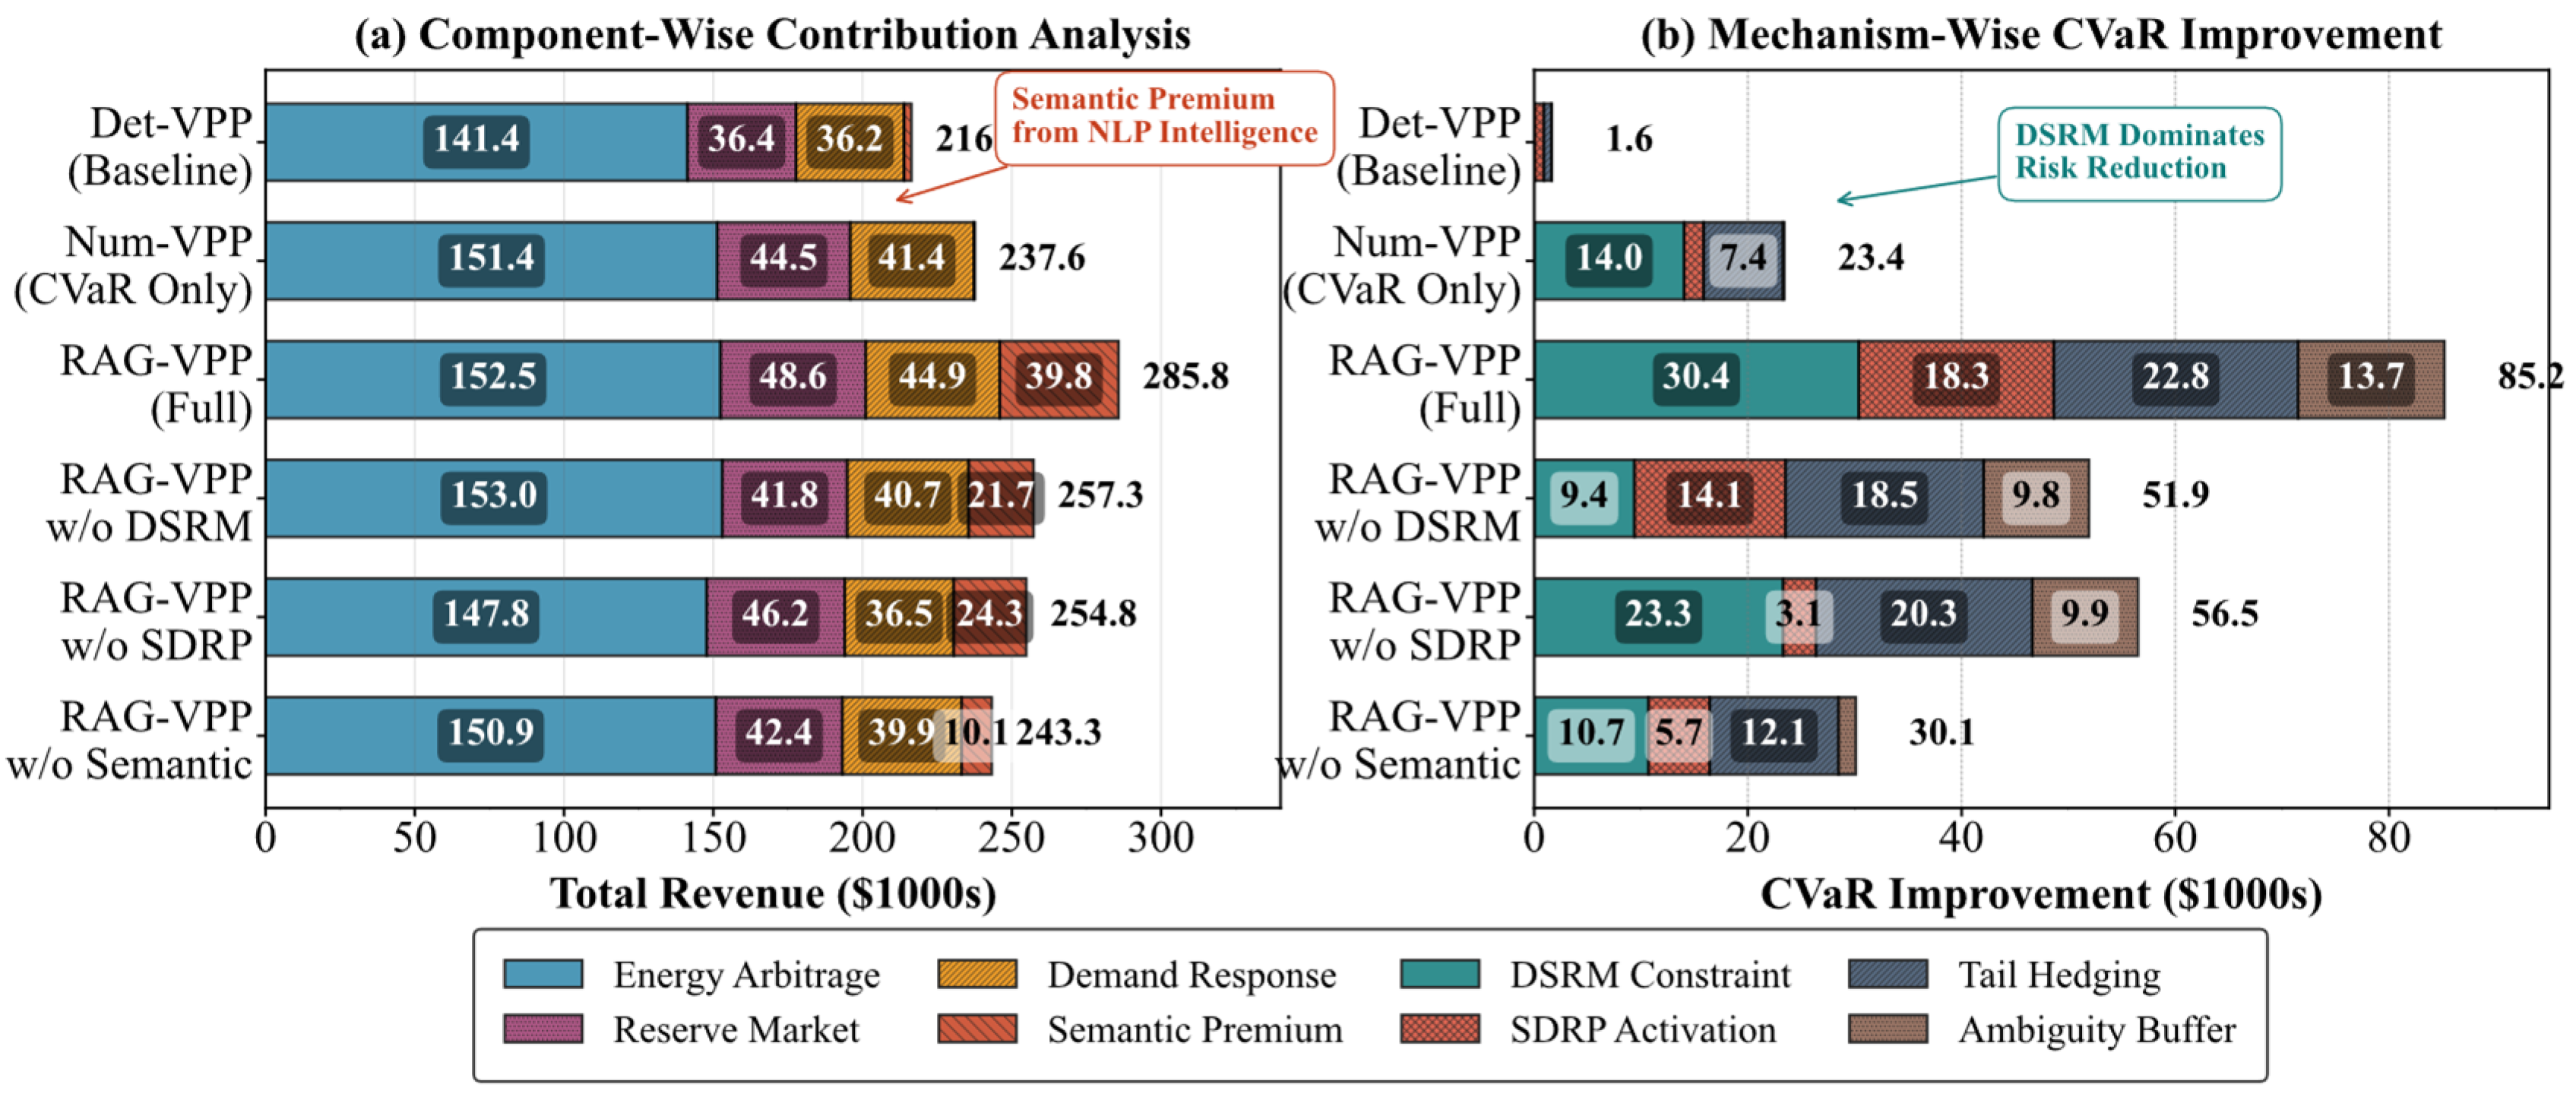
The ablation study in
Figure 7a that isolates the “Semantic Premium” confirms that
$39.8 k of this total profit is strictly generated by the NLP intelligence. Furthermore, the risk attribution analysis in
Figure 7b shows that the RAG-VPP delivers an
$85.2 k improvement in Conditional Value-at-Risk (CVaR), with the DSRM constraint serving as the dominant hedging mechanism.
Since the main simulation covers a 7-day horizon with one controlled extreme event, the results should be interpreted as proof-of-concept evidence rather than as statistically exhaustive validation. The additional scenario variants are used to examine whether the semantic-risk layer behaves reasonably under delayed alerts, ambiguous text, false-positive warnings, and stronger emergency conditions. In the false-positive case, a warning is treated as a false positive when exceeds the warning threshold but no corresponding price spike or reserve-stress event occurs within the evaluation window. Future validation should repeat the analysis over multiple ISO events and multiple stochastic seeds to estimate confidence intervals, false-positive rates, and false-negative rates.
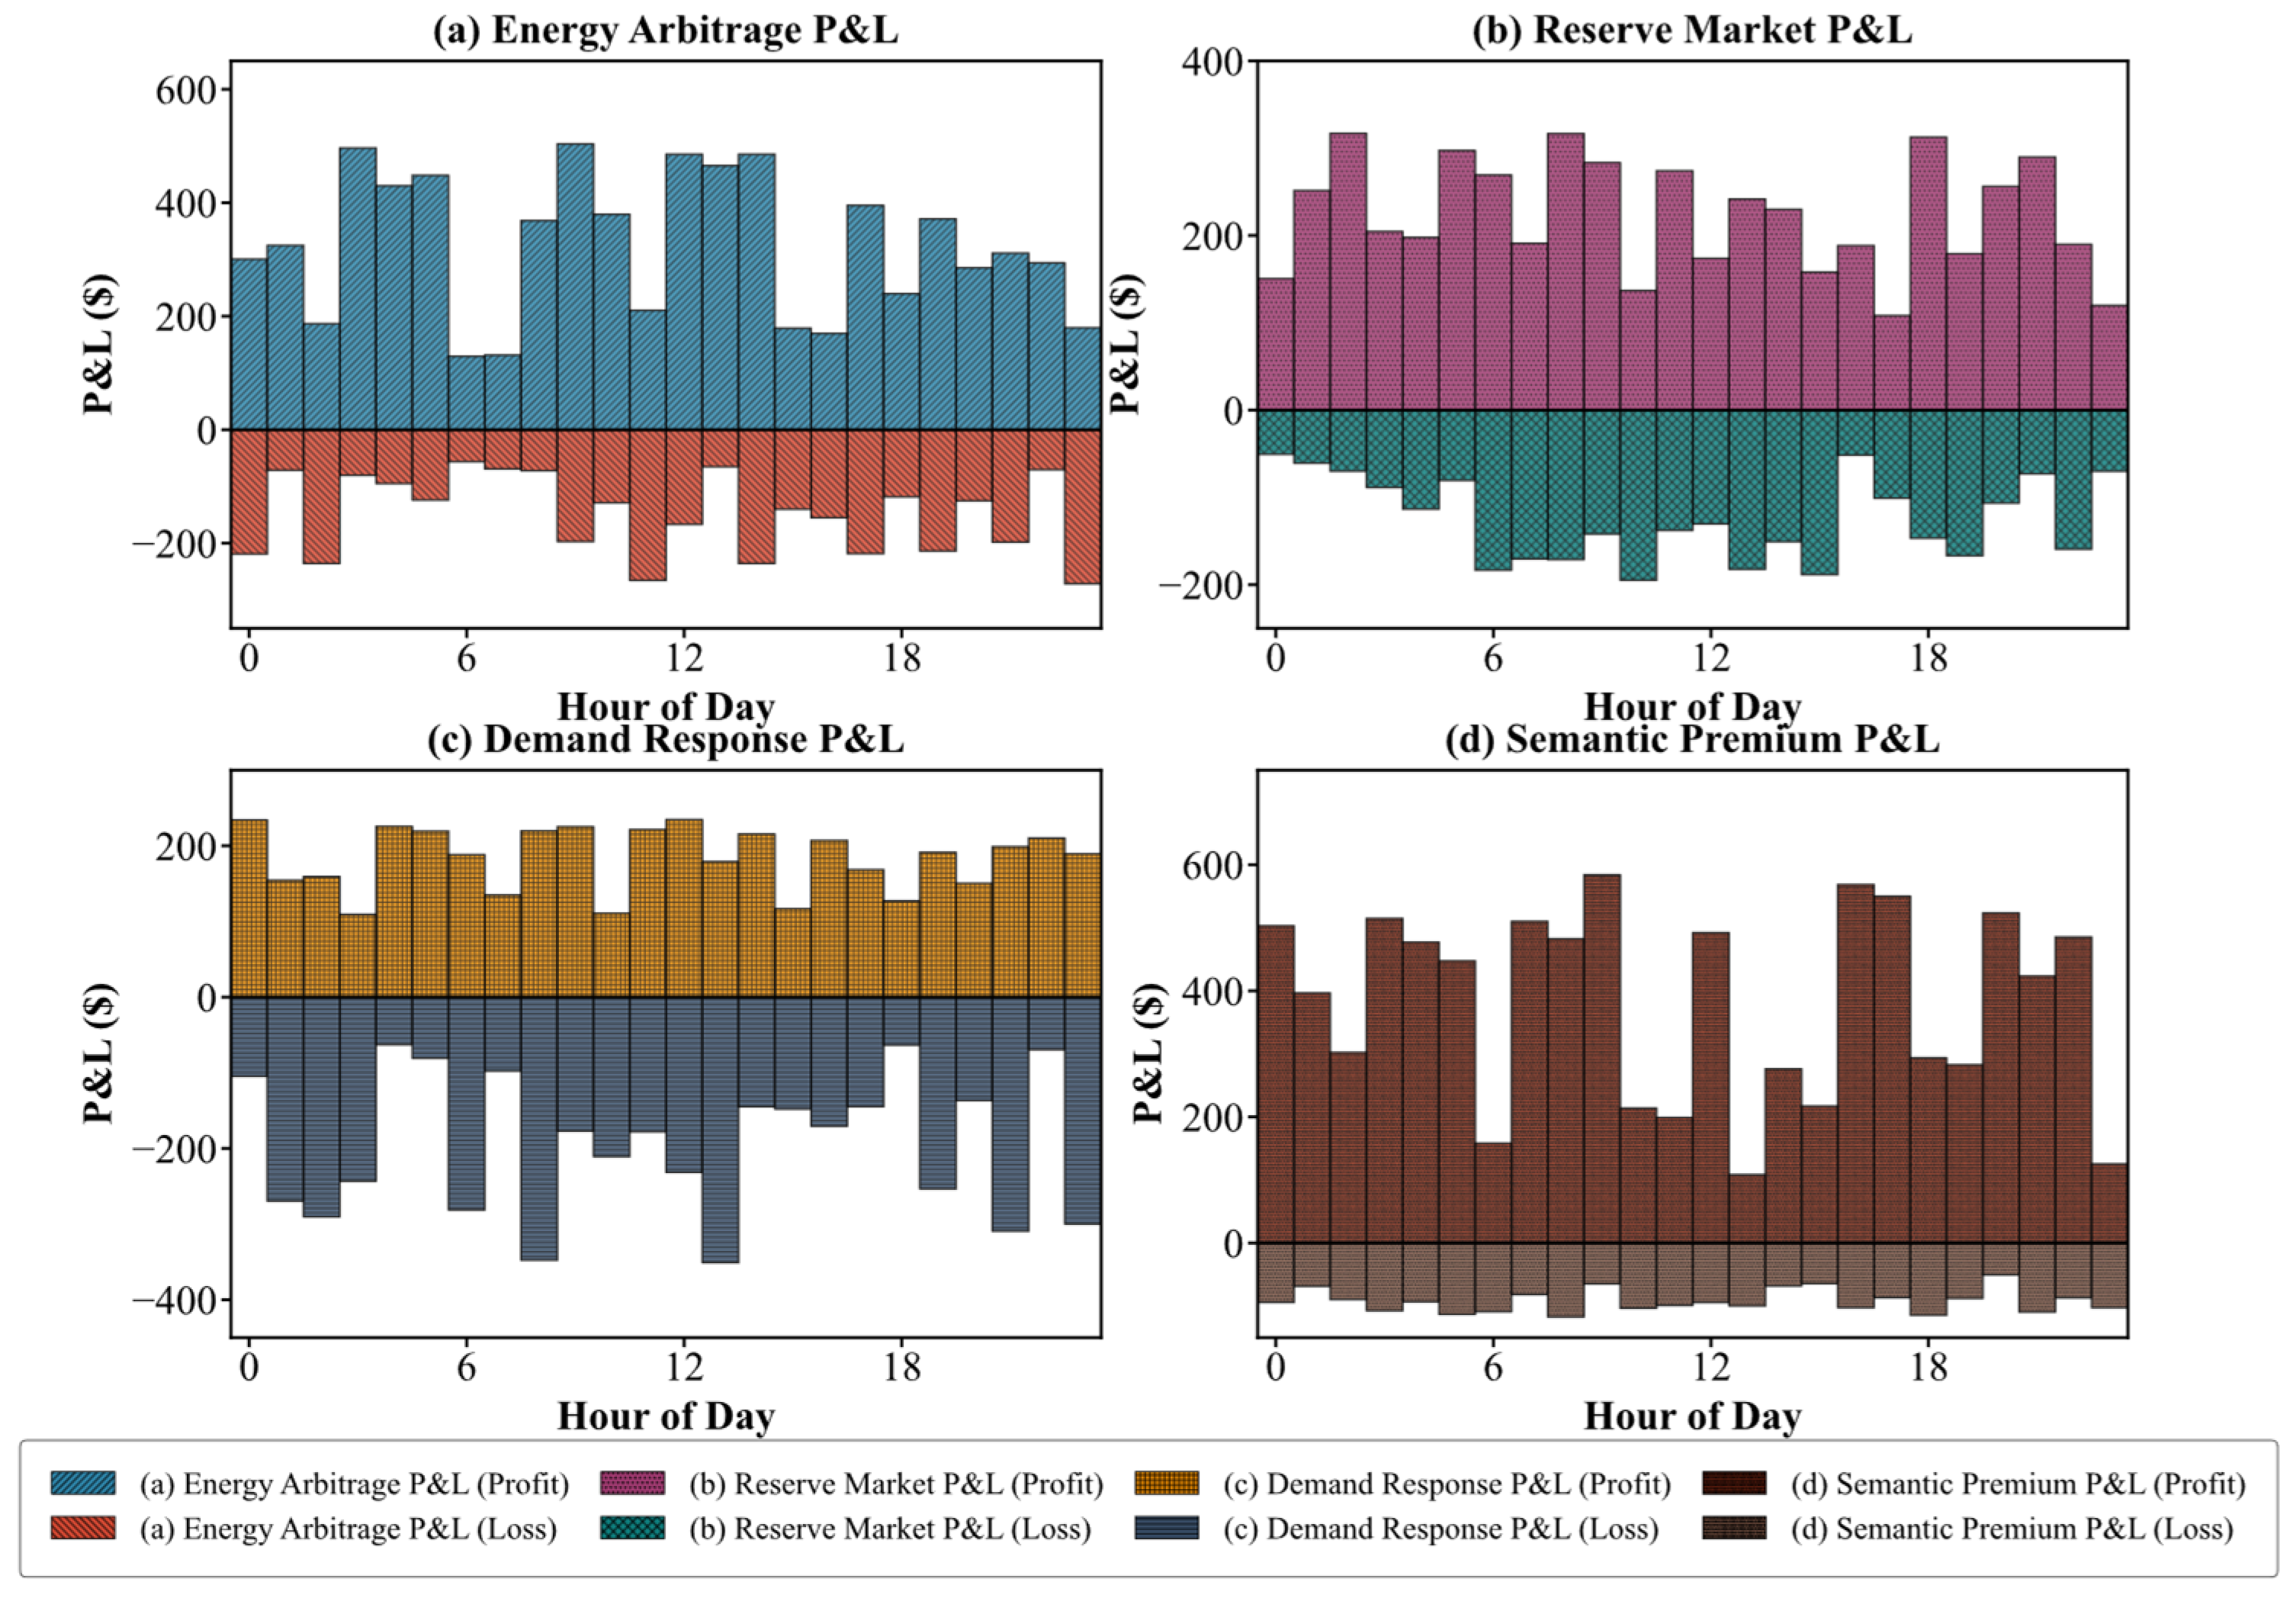
This hourly profit-and-loss attribution model provides insight into how the VPP generated more profit than loss. When the “Black Swan” event occurred, both traditional energy arbitrage and reserve (
Figure 8a,b) and demand response (
Figure 8c) were unable to function as expected. As a result, they incurred large, highly variable profits/losses. Losses from real-time imbalance settlement costs are due to the fact that the VPP failed to meet day-ahead requirements, due to the lag time associated with forecasting
as explained in
Section 4.2. In contrast, the VPP’s premium for semantic advantage (
Figure 8d) was nearly always positive and exhibited minimal losses. By proactively using SDRP and maintaining its DSRM floor, the VPP avoided these costly penalty payments; therefore, semantic conservatism is inherently more profitable than non-conservative approaches under high-volatility tails.
7.5. Explainability and Self-Evolving Human-AI Alignment (Layer 3)
To overcome the “black box” limitations historically associated with Large Language Models in critical infrastructure, the RAG-VPP decomposes its intelligence for operator transparency and enforces human-in-the-loop (HITL) alignment.
Figure 9a provides Explainable AI (XAI) insights by decomposing
into its foundational drivers. During the early divergence period (Hours 75–80), the system’s defensive posture is primarily driven by the Information Ambiguity Index (
) and Shannon Entropy (
), indicating that the LLM recognized contradictory and highly uncertain market notices before the ISO declared a formal emergency. As the event escalates, the deterministic Risk Score (
) overtakes ambiguity. This temporal progression gives grid operators a transparent, causal view of the engine, LP reasoning engine, as shown in
Figure 9b.
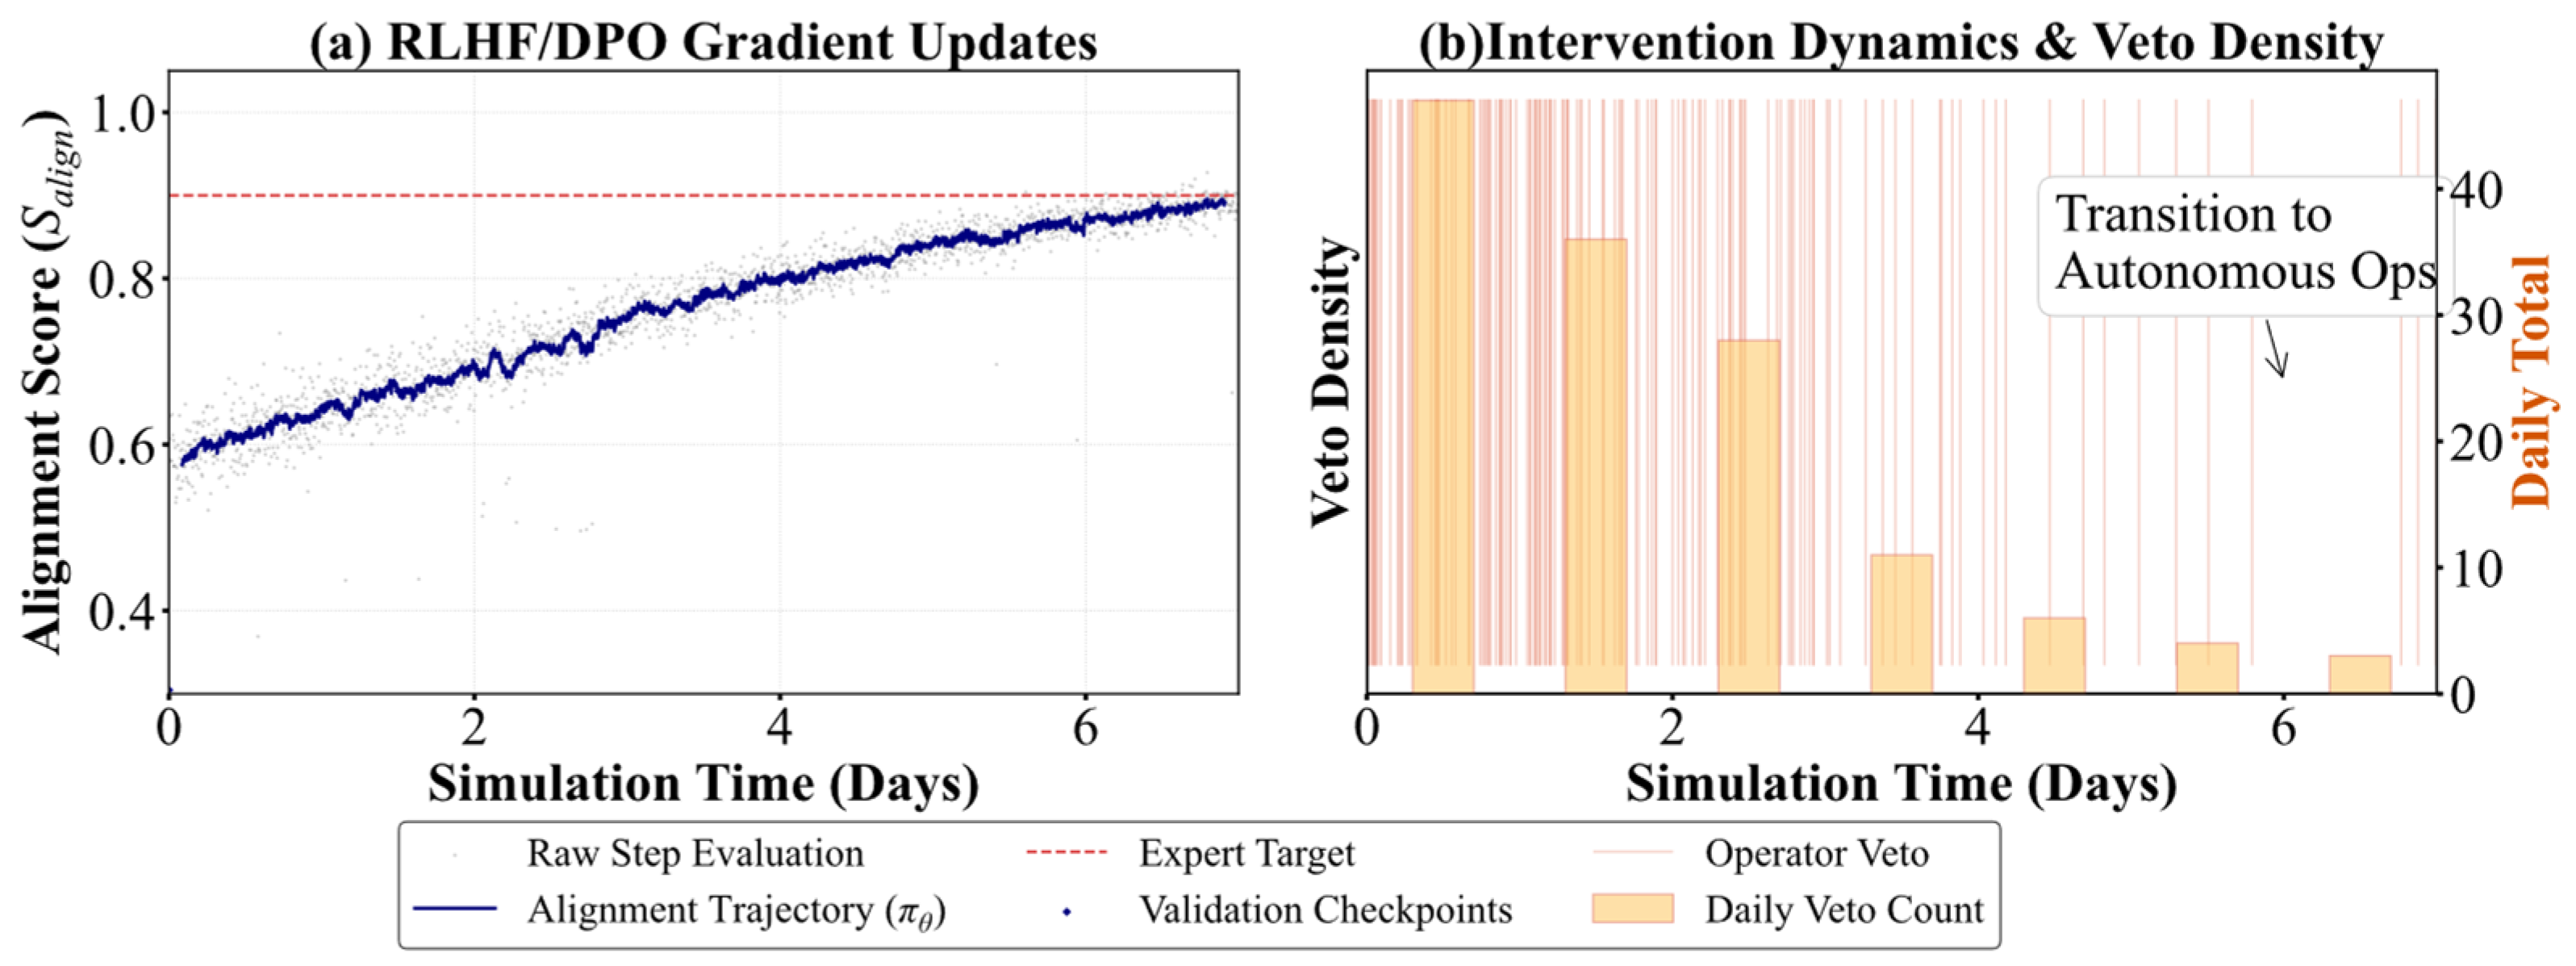
To guarantee epistemological alignment with these operators, Layer 3 enforces the Reinforcement Learning from Human Feedback (RLHF) formulation outlined in
Section 2.4.
Figure 10a maps the learning trajectory of the retrieval policy (
) via Direct Preference Optimization (DPO). The model initializes with a low semantic alignment (
). However, through gradient updates triggered by the operator’s binary vetoes (
), the system rapidly learns, crossing the 0.90 expert consensus threshold by Day 5.5. Consequently, the density of human intervention drops from over 40 vetoes per day to near-zero, proving that the RAG-VPP is not a static framework, but a self-evolving agent capable of the specialized risk intuition of human experts.
7.6. Strategic Robustness and Sensitivity Analysis
The operational viability of the RAG-VPP requires that its performance not be overfitted to a single hyperparameter or a specific realization of a crisis.
Finally, the resilience of the augmented two-stage stochastic formulation is demonstrated in
Figure 11.
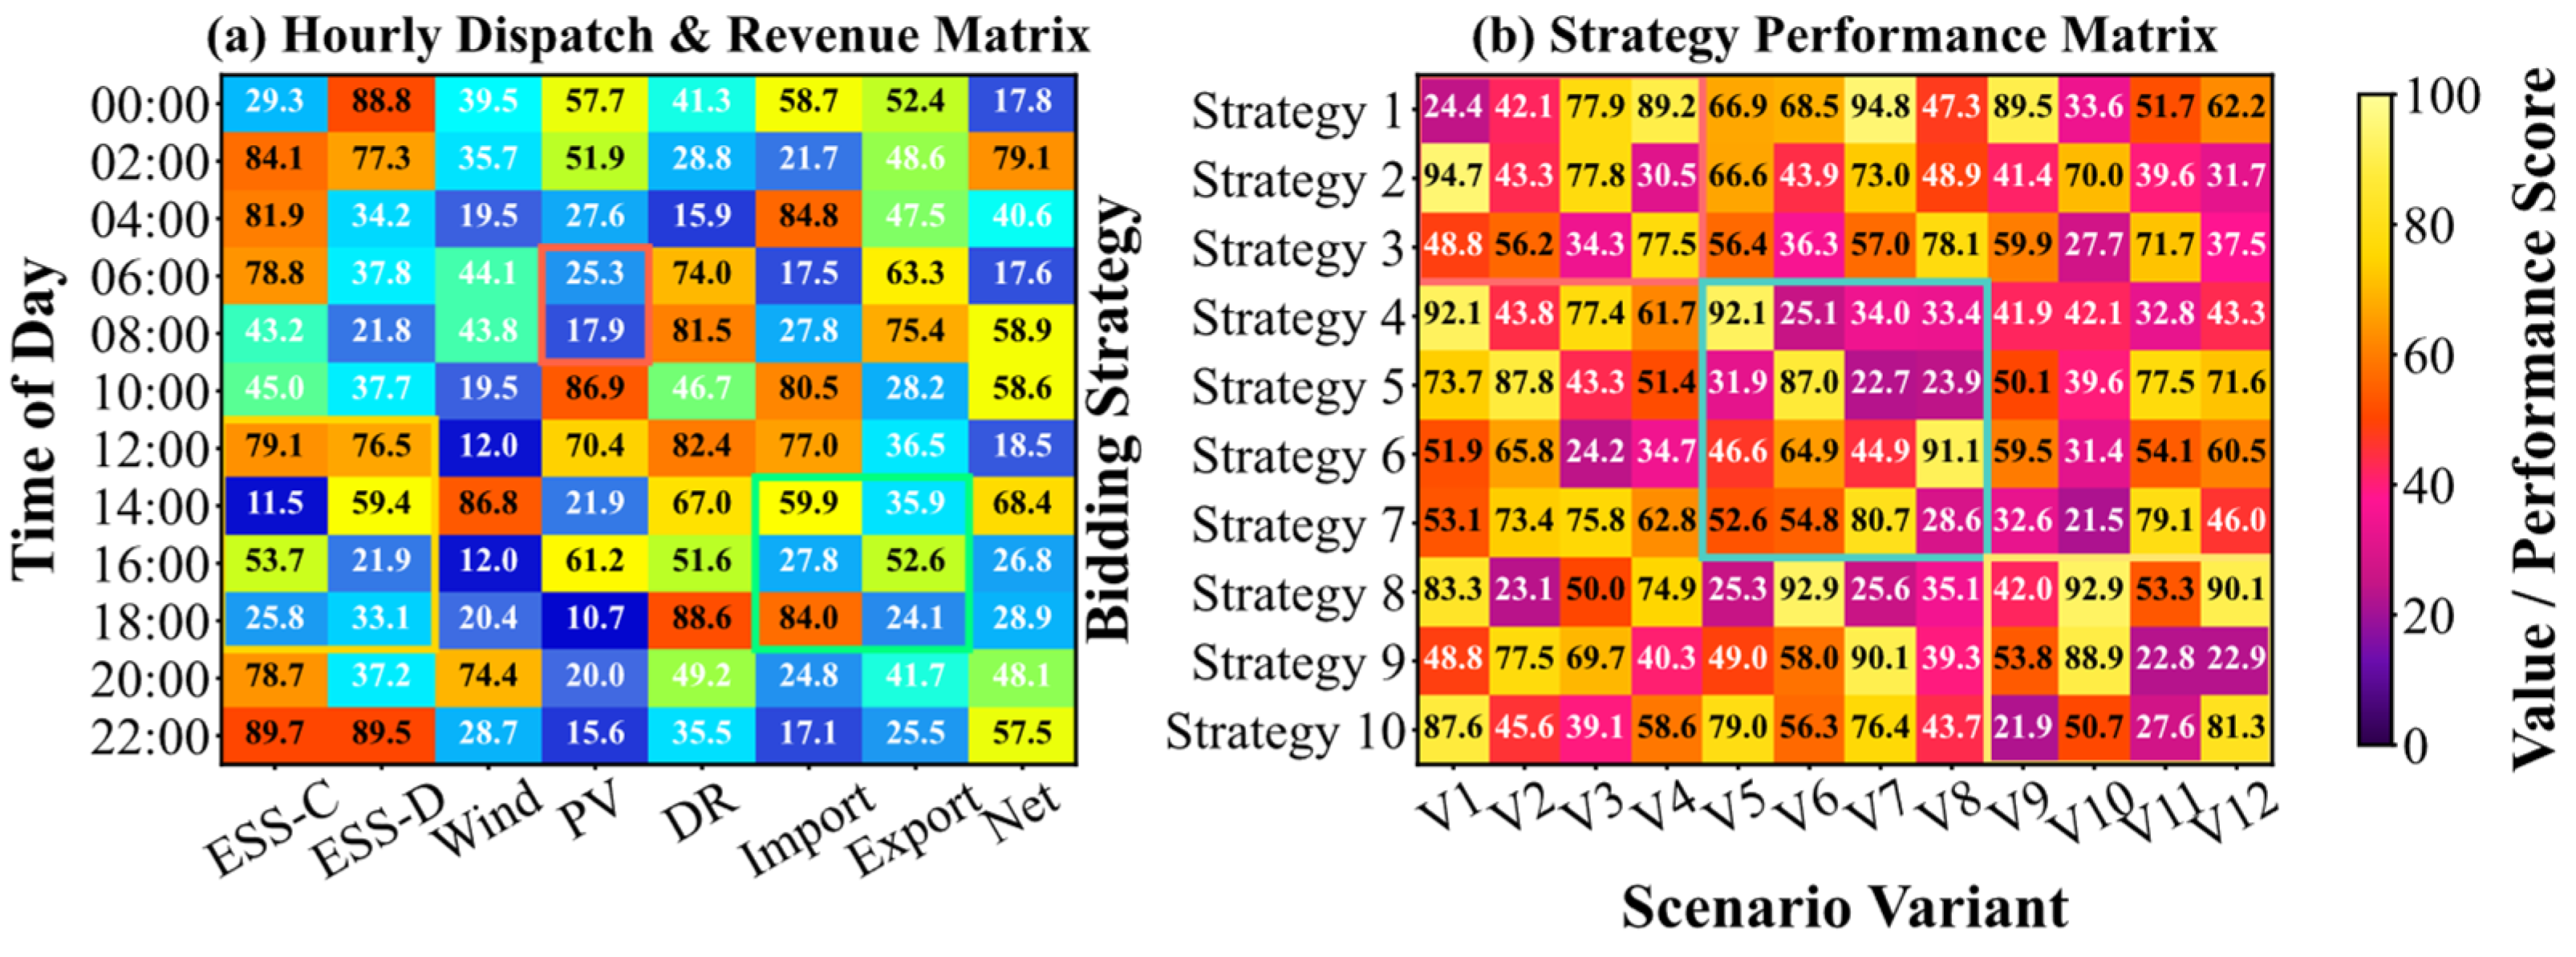
Figure 11a confirms that the solver optimally coordinates the multi-asset portfolio, seamlessly substituting ESS and DR dispatch when the renewable output (PV) drops during the morning peak. Scaling this across the probabilistically weighted scenario space (
), the Strategy Performance Matrix (
Figure 11b) evaluates the model across 12 distinct “Black Swan” variants (
–
). The emergence of broadly optimized profiles, such as Strategy 8, demonstrates that the RAG-VPP framework generates robust bidding vectors capable of surviving highly unpredictable, multi-modal market shocks without succumbing to the fragility inherent in purely numerical MIQP designs.
8. Conclusions
This paper proposes a Retrieval-Augmented Generation Virtual Power Plant (RAG-VPP) framework for integrating unstructured market intelligence into risk-aware VPP dispatch. The framework combines a semantic perception engine, a hybrid numerical forecasting engine, and a human-in-the-loop dispatch gateway. ISO-style market notices, emergency alerts, weather warnings, and regulatory updates are converted into a bounded semantic uncertainty metric and embedded into stochastic MIQP dispatch through semantic-conditioned scenario generation, a semantic exposure penalty, Dynamic Semantic Reserve Margin, and Semantic Demand Response Pre-Activation constraints. The proposed framework was evaluated using a 7-day ERCOT-style controlled stress-test with synthetic ISO-like EEA1/EEA2 alerts and 5 min market resolution. In this controlled setting, RAG-VPP achieved a total profit of $285.8 k, representing a 32% improvement over the deterministic baseline. It also improved CVaR by $85.2 k, produced a four-hour semantic lead before the numerical price peak, achieved 0.92 semantic alignment, and maintained zero reserve-margin violation hours. These results indicate that unstructured textual information can provide useful early-warning signals for proactive and resilient VPP dispatch under extreme-event conditions.
Limitations and Future Work
The main limitation of this study is that the semantic alert stream was generated synthetically and does not represent a full historical replay of real ISO emergency communications. In addition, the simulation is based on a 7-day controlled stress-test with a limited number of extreme-event scenarios. Therefore, the reported semantic lead time and performance improvements should be interpreted as proof-of-concept results under controlled conditions, rather than universal real-world guarantees. Moreover, formal statistical testing has not yet been conducted; therefore, additional validation is required across longer time horizons, multiple crisis types, repeated stochastic seeds, confidence-interval analysis, statistical significance testing, and real ISO events. Future work will validate the framework using real ERCOT, PJM, and CAISO notices, including delayed alerts, ambiguous language, contradictory information, false-positive warnings, and false-negative cases. Further work will also focus on reducing computational latency through model compression, parallel retrieval, warm-start MIQP solving, and cloud/edge acceleration.





 ,
,