Article

Study on the Influence of Sediment Particle Size on Sediment Wear and Energy Dissipation of Impulse Turbine Nozzles

by
Xijie Song
1,2,
Zhengwei Wang
2,*,
Huili Bi
2,
Lianheng Guo
3 and
Yongxin Liu
4
1
College of Hydraulic Science and Engineering, Yangzhou University, Yangzhou 225100, China
2
State Key Laboratory of Hydroscience and Engineering, Department of Energy and Power Engineering, Tsinghua University, Beijing 100084, China
3
Datang Xizang Energy Development Co., Ltd., Lhasa 850001, China
4
Harbin Electric Machinery Co., Ltd., Harbin 150040, China
*
Author to whom correspondence should be addressed.
Energies 2026, 19(12), 2800; https://doi.org/10.3390/en19122800
Submission received: 15 February 2026 / Revised: 8 April 2026 / Accepted: 29 May 2026 / Published: 10 June 2026

Abstract

Hydropower is a crucial component of renewable energy, and sediment erosion is a key factor affecting the operation of impulse turbines, with erosion inside the nozzle being particularly prominent and leading to reduced unit efficiency. This paper investigates the distribution patterns of energy dissipation and erosion locations inside the nozzle under varying particle sizes, based on numerical simulation and entropy production theory. The results indicate that small particle sizes (0.02 mm) exhibit good fluidity, uniform flow velocity distribution, and a small high-entropy-production region. As particle size increases (0.1 mm, 0.3 mm), fluidity gradually deteriorates, the flow field becomes more turbulent, and the high-entropy-production region expands. When the turbulent kinetic energy exceeds 10 m2/s2, the entropy production rate increases sharply. A significant negative correlation is observed between entropy production rate and erosion rate; smaller particle sizes correspond to more severe erosion. Erosion on the needle is primarily due to friction, while erosion on the nozzle is primarily due to impact. High erosion levels on both the nozzle and needle are concentrated within a particle velocity range of [80, 100], and the erosion rate within this speed range shows a sharp upward trend.

1. Introduction

Against the backdrop of the global energy structure shifting towards clean and low-carbon, hydropower—as a mature and stable renewable energy production method—occupies an important position in the global energy system due to its advantages of being clean, pollution-free, and highly adjustable [1]. Due to its unique advantages of adapting to high head and low-flow conditions [2], Pelton turbines are widely used in the construction of hydropower stations in mountainous and canyon areas, providing important support for energy supply and economic development in remote mountainous areas [3]. However, in the basins where numerous hydropower stations are located, a large number of rivers suffer from serious sedimentation problems due to geological structures and climate characteristics, making sediment-laden water flow conditions a typical operating environment that Pelton turbines continually face. The sediment erosion, as the core negative factor in the operation of units under sediment-laden water flow conditions, has become a key bottleneck restricting the efficient and safe service of Pelton turbines. The nozzle, as the core overcurrent component of the Pelton turbine, directly undertakes the core functions of guiding water flow and converting impact energy. Its surface morphology and structural integrity are crucial to the hydraulic performance of the unit. Under the long-term erosion of high-speed sediment-laden water flow, the surface of the needle and nozzle is prone to severe erosion, which not only causes structural damage such as dents and peeling on the surface of components, but also destroys the design form of the flow channel, causes flow field distortion, and significantly reduces the energy conversion efficiency of the unit [4].
Some scholars have carried out a series of research on the sediment abrasion of the Pelton turbine. Taking a typical power plant as an example, DIN Mohammad Zehab Ud [5] and others used experimental methods to study the effect of particle erosion on the nozzle of a Pelton turbine. Alomar et al. [6] evaluated the performance of the Pelton turbine by adjusting nozzle diameter, flow and head parameters to obtain the best operating conditions. With the rapid development of computational fluid dynamics (CFD) technology and computer performance, numerical simulation has been widely used by many researchers. Jitao Liu et al. [7] clarified the sediment erosion mechanism of the inner bucket of a large Pelton turbine through the combination of a numerical simulation and test, clarified the influence of sediment particle size, sediment flow velocity and metal materials on erosion, and established the calculation formula of erosion rate. Zeng [8,9] studied and simulated the three-dimensional unsteady gas–liquid two-phase flow in the rotating bucket of a Pelton turbine by modifying the turbulence model. It showed that the residual kinetic energy of discharge was the main reason for the efficiency loss of the turbine under a non-design head. Petley et al. [10] studied the influence of jet shape on the efficiency of the Pelton turbine. With an increase in the size of the nozzle and pinhole opening, the secondary velocity will lead to the degradation of free surface, thus affecting the interaction of the jet. Rai et al. [11,12] developed a simplified erosion model to describe the relationship between hydraulic abrasion and sediment characteristics, erosion speed, turbine material characteristics and erosion time in the Pelton turbine. Guo et al. [13] proposed a new Euler–Lagrange method, which can be applied to the study of solid–liquid–gas transient phenomena. By comparing the calculated sediment erosion results with the actual erosion at the power station, the reliability of the method is proven. Zhu W Q [14] and others have made it clear that there are three high concentration accumulation areas of sediment in the distribution ring pipe on the Pelton turbine, namely, the area near the outer wall, the side of the crescent rib on the nozzle, and the bottom. The erosion is concentrated in the nozzle (the most serious at the outlet), the nozzle needle and other parts, and the larger the particle size, the wider the erosion range and the more uneven. Deng X F [15] and others found that the jet level deformation of the bent inlet pipe jet mechanism is mainly affected by the eddy current. The hydraulic abrasion of the Pelton turbine jet mechanism is concentrated in the nozzle throat, the nozzle throat at the downstream of the cascade, and the tip of the nozzle, and the nozzle tip is more vulnerable to abrasion than the nozzle throat. Li C X [16,17] and other researchers found that particle size has different effects on the erosion of key components of the Pelton turbine under cavitation effect. The movement trajectory of large particle-size sediment particles is closer to the nozzle wall and water–air interface, which will inhibit the formation and development of cavitation on the back of the nozzle and bucket, while small particle-size particles have good fluidity and have little effect on cavitation. In addition, the influence mechanism of nozzle angle on erosion in different areas is different, and the influence of nozzle angle is the most significant. Cai L [18] and others found that eddy currents led to a “velocity loss zone” downstream of the fluid guide and needle tip, and the water flow had a significant impact on the particles. The high impact velocity of small particles made the erosion degree heavier, and the influence of centrifugal force and inertia force on large particles became worse with the fluidity. At present, scholars mainly analyze the erosion characteristics of the core flow passage components of the Pelton turbine, but they have not yet conducted collaborative research on the erosion characteristics and energy dissipation.
In recent years, entropy production theory has been widely used to evaluate energy dissipation in machinery. The advantage of this method is that it can determine the size and location of the loss, but few scholars have discussed the synergistic mechanism between erosion characteristics and energy dissipation. Therefore, it is particularly important to study the erosion of flow passage components of the Pelton turbine by combining energy dissipation.
Based on the entropy production theory, this paper uses the method of numerical simulation to study the internal erosion characteristics and energy dissipation of the Pelton turbine nozzle under different particle sizes, which can provide theoretical support for newly built hydropower stations, to improve their anti-erosion performance, reduce energy loss, and improve economic benefits, especially for the sediment-laden river environment. This has important theoretical value and practical significance.

2. Materials and Methods

2.1. Mathematical Model

2.1.1. Control Equations

Navier–Stokes equations are the basic equations describing fluid motion in fluid dynamics, which can be used to analyze and predict the velocity, pressure, and flow characteristics of water in hydraulic turbines. Therefore, the N-S equation is used to control the flow in the Pelton turbine [19].
The governing equation of the continuous phase obtained from the N-S equation is as follows:
ρ u t + ρ u u = p + ρ v Δ u ρ τ   + S t
where u is the flow velocity, t is time, ρ is the fluid density, p is the flow pressure, v is kinematic viscosity, S t is the source term, and τ is the Reynolds stress.

2.1.2. Turbulence Model

In this paper, the commercial software CFX (2024R1) is used to carry out numerical calculations based on the finite volume method. The solid–liquid two-phase flow simulation based on the combination of the turbulence model and the erosion model is used to capture the erosion characteristics of the flow passage components of the hydraulic turbine, focusing on accurately characterizing the erosion behavior of the nozzle of the Pelton turbine. The SST k- ω turbulence model is selected for hydrodynamic simulation, which is widely used in hydraulic turbine flow field simulation and has been verified by experiments with good reliability.

2.1.3. Multiphase Flow Model

In this study, the Euler–Lagrange method is employed to simulate solid–liquid two-phase flow, with the DPM model utilized for tracking particle trajectories. This methodology has been extensively applied in research on impulse turbines. In this paper, the trajectory of each particle was tracked by solving its force equation; particles and the flow field are bidirectionally coupled: fluid drag drives the particles, while the momentum feedback from particles affects the flow field distribution.

2.1.4. Erosion Model

The erosion model [20] can effectively consider the collision behavior between particles and curved walls, and can accurately predict the erosion characteristics of the rotating wall of hydraulic machinery. Relevant studies have verified its reliability. In this study, this model is used to predict the erosion characteristics in the nozzle of a Pelton turbine, and its specific expression is as follows:
E = f γ V p V 1 2 c o s 2 γ 1 1 V p V 3 s i n γ 2 + V p V 2 s i n γ 4
f γ = 1 + k 1 k 12 sin γ π / 2 γ 0 2
k 1 = 1   γ 2 γ 0 0   γ > 2 γ 0
where E is the dimensionless eroded mass, k 1 and k 12 are model constants, and V p is the particle impact velocity. The impact angle γ , f γ is a dimensionless function of the impact angle; V 1 , V 2 and V 3 are the particle collision velocity parameters.

2.2. Numerical Simulation Model

2.2.1. Geometric Model and Computational Domain

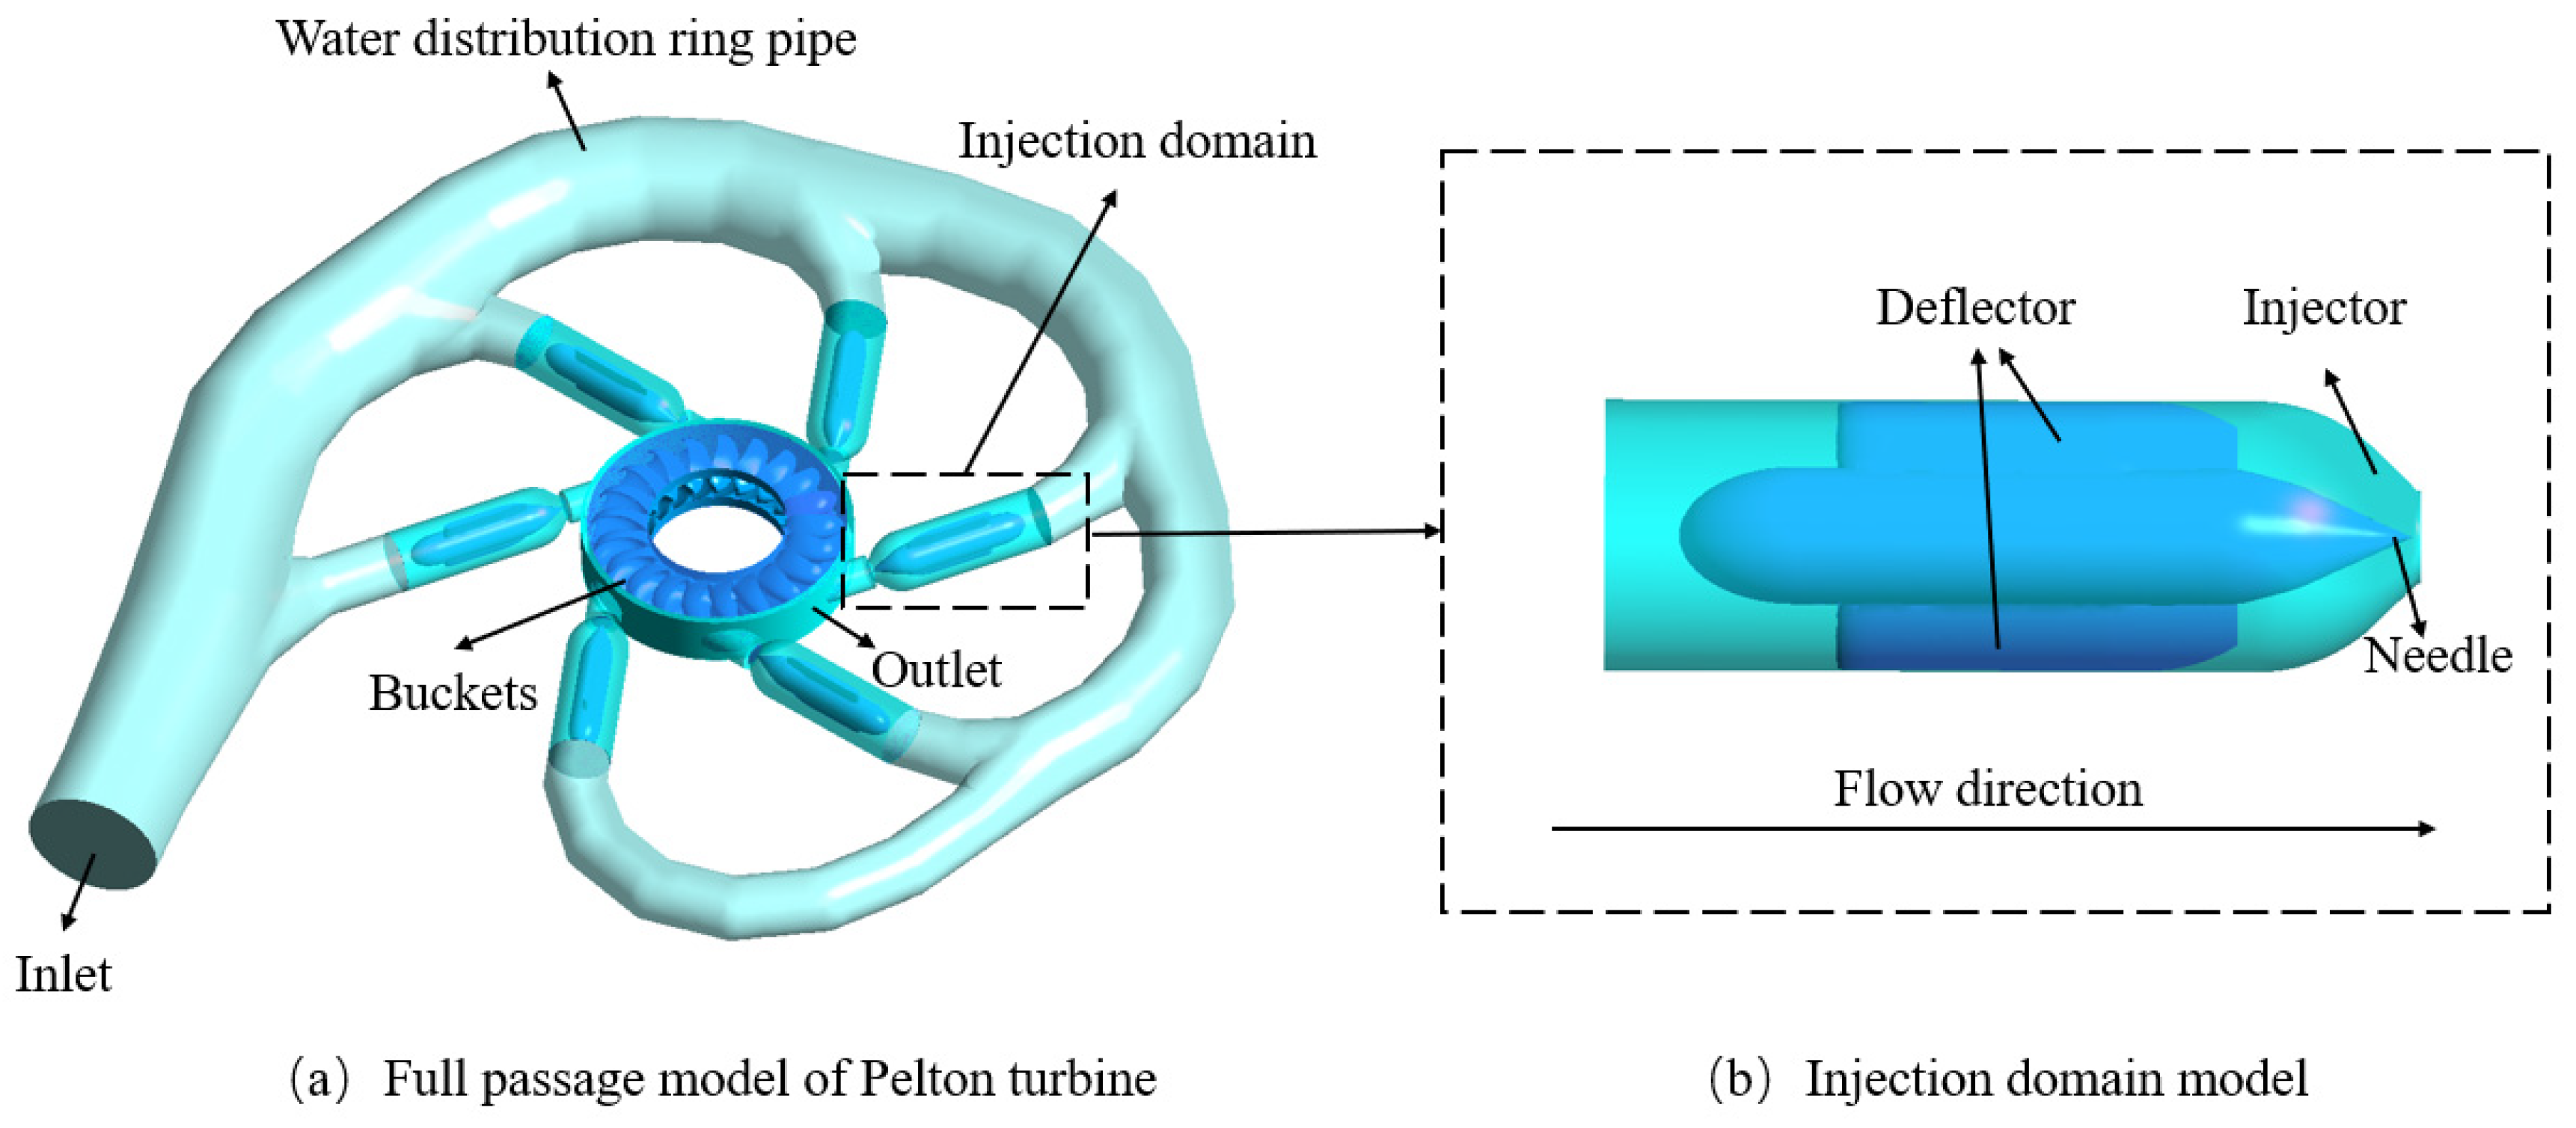
The research object of this paper is a Pelton turbine. The main parameters are shown in Table 1. The main components include the water distribution ring pipe, nozzle, needle, bucket, etc. The number of buckets is 21, the number of nozzles is 6, and the three-dimensional model is shown in Figure 1.

2.2.2. Mesh Delineation and Mesh Independence Study

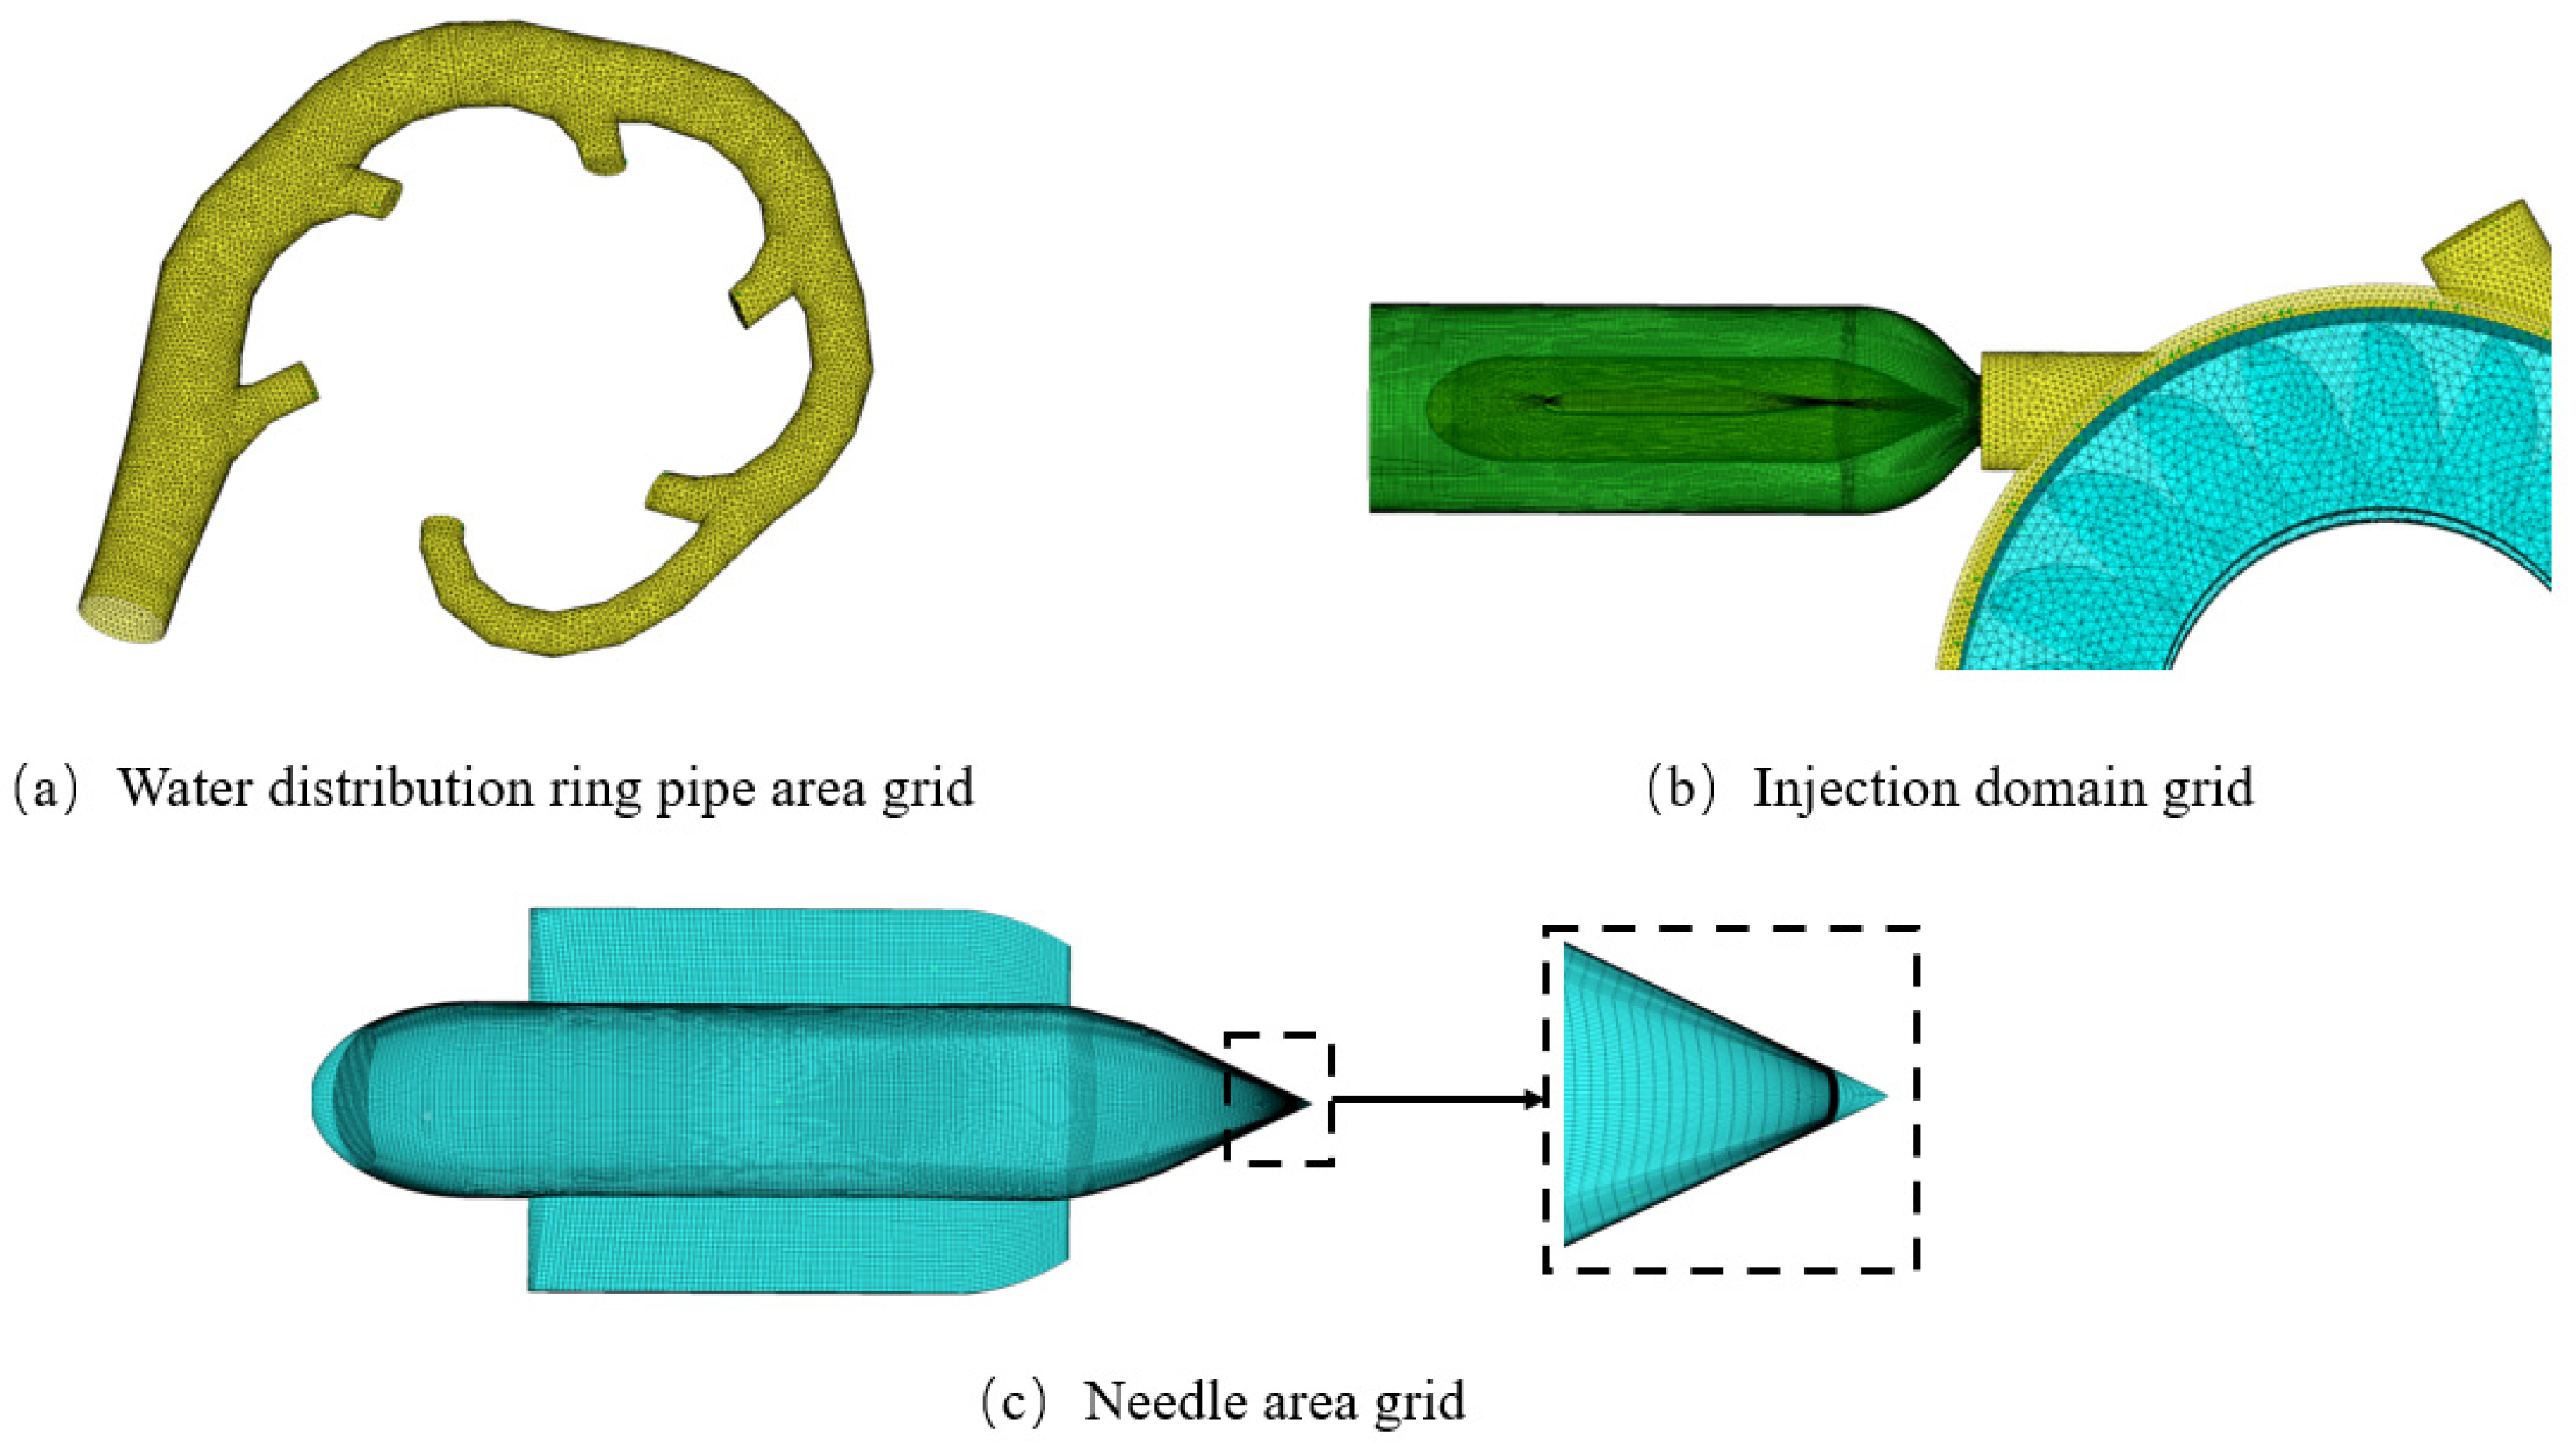
Due to the complex structure of the Pelton turbine, the geometric model adopts a hybrid grid, as shown in Figure 2. A hexahedral structured grid is used in the area of the nozzles to refine the grid on the surface of the needle and nozzle, so as to more effectively capture the state of sediment and water flow on the surface of the needle and nozzle. A tetrahedral unstructured grid is used in other areas.
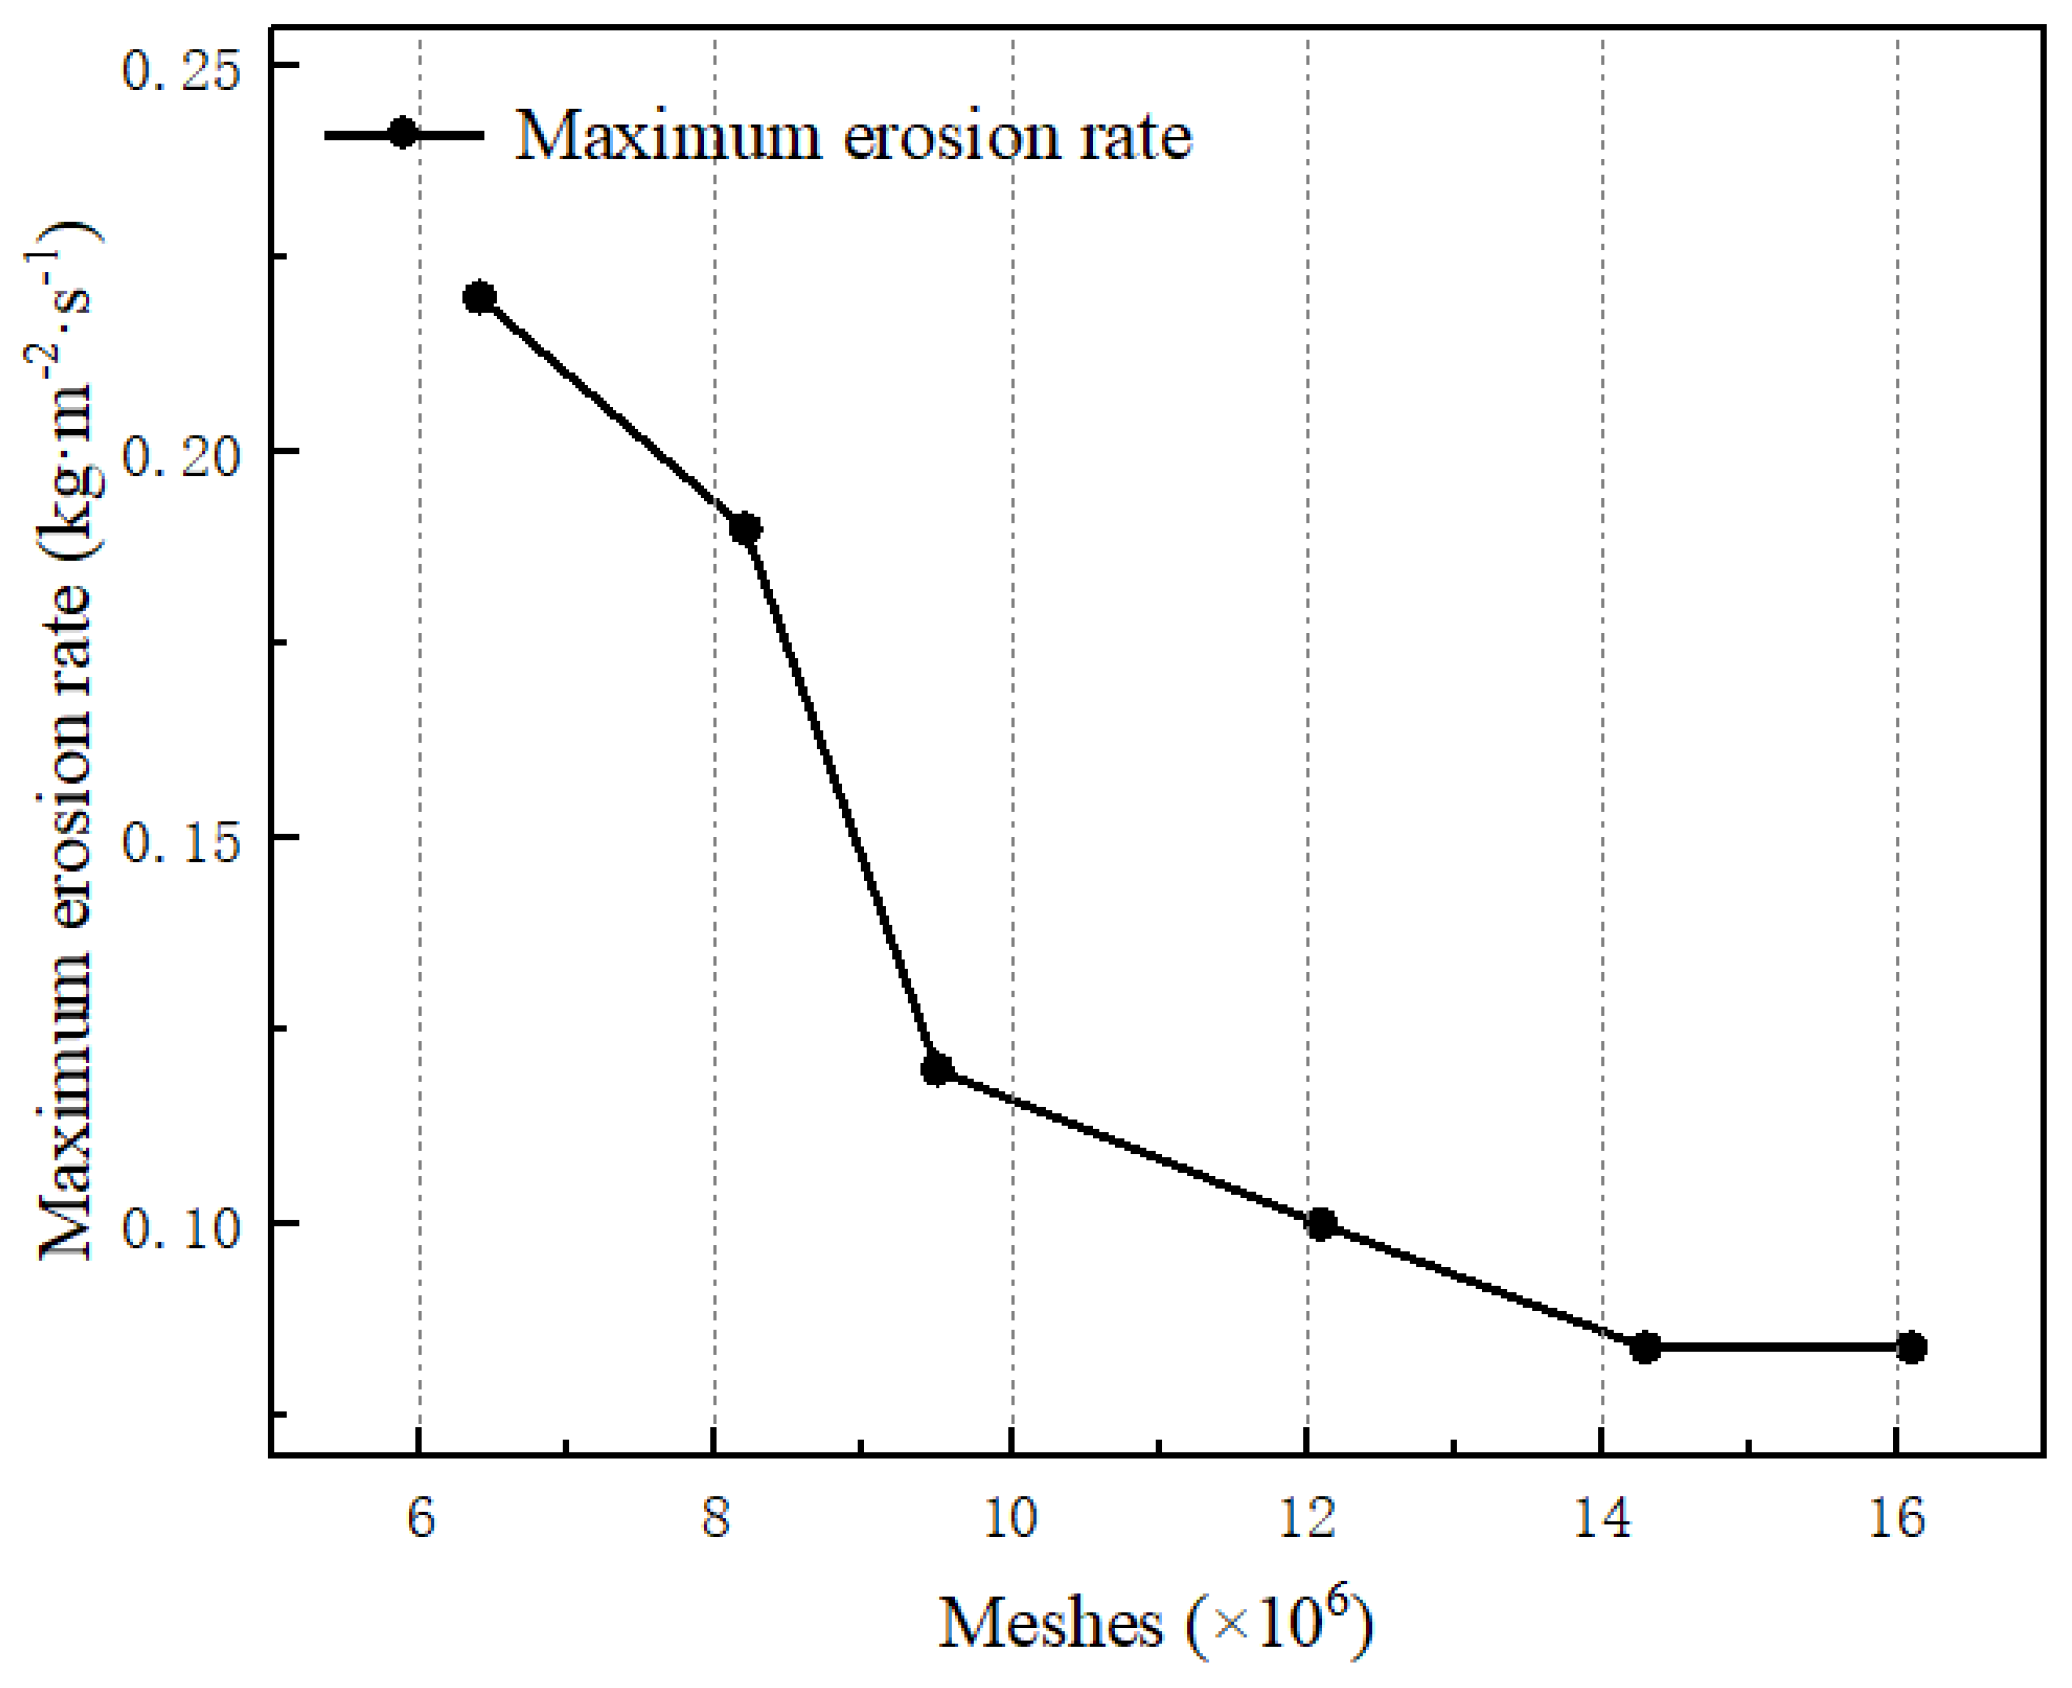
The number of grids will affect the calculation accuracy and efficiency, so it is necessary to analyze grid independence and take the maximum erosion rate as the index. It can be seen from Figure 3 that with the increase in the number of grids, the change in the maximum erosion rate of the injection mechanism tends to be stable.
Considering the accuracy and cost of calculation, the total number of grids was finally selected as 14.3 million for the numerical calculation of the whole channel, of which the number of grids of the injection mechanism was 7.4 million.

2.2.3. Boundary Conditions and Calculation Parameters

(a)
Boundary conditions
Assuming that the fluid is incompressible, the pressure inlet is used as the inlet boundary condition, and the velocity outlet is used as the outlet boundary condition. The fixed wall surfaces are set to be smooth without sliding, the runner is a rotating wall surface, and the rest are stationary surfaces. The “frozen rotor” model is used to deal with the dynamic and static interface between the jet region and the runner region. In the process of numerical solution, the “high resolution” scheme is used for the convection term and turbulence numerical method.
(b)
Calculation parameters
The sediment concentration calculated in this study is 2 kg/m3, the sediment density is 2300 kg/m3, and the sediment particle size is taken as 0.02 mm, 0.1 mm, and 0.3 mm, respectively. The particle sizes (0.02, 0.1, 0.3 mm) are motivated as fine/medium/coarse sand. The water source of the Pelton turbine is mostly natural river or reservoir water, of which 0.02 mm belongs to the category of fine sand, which is the particle size component with the highest content in natural water bodies, and has good fluidity. The typical particle size of medium fine sand is 0.1 mm, and coarse sand is 0.3 mm, with large particle mass and high impact kinetic energy.

2.3. Entropy Production Theory

Entropy generation stems from energy dissipation during irreversible processes, resulting in the transformation of mechanical energy to internal energy. According to the second law of thermodynamics, the operation of actual liquid systems is always accompanied by entropy increase [21,22]. In the process of liquid flow, viscous effects give rise to energy loss, thereby raising the entropy production rate. The entropy production rate is defined as follows:
S ˙ D = Q ˙ T
where S ˙ D is the entropy rate, KW/(m3·K). Q ˙ is the energy dissipation rate, m3/s. T is the temperature, K.
Based on the entropy production evaluation method for flow and heat transfer proposed by BEJAN [23], entropy production in turbulent flow is divided into two parts: that induced by time-averaged flow motion, and that arising from turbulent dissipation due to pulsating velocity.

3. Numerical Results and Analysis

3.1. Reliability Verification

As verified by Guo T [24] and others [25,26], the high erosion area of the nozzle is located near the nozzle contraction section, and its erosion position and strength are basically consistent with the erosion position of the actual erosion results, indicating that it is feasible to predict the erosion inside the nozzle through numerical calculation.

3.2. Full-Domain Flow Analysis of Impulse Hydrogenerator

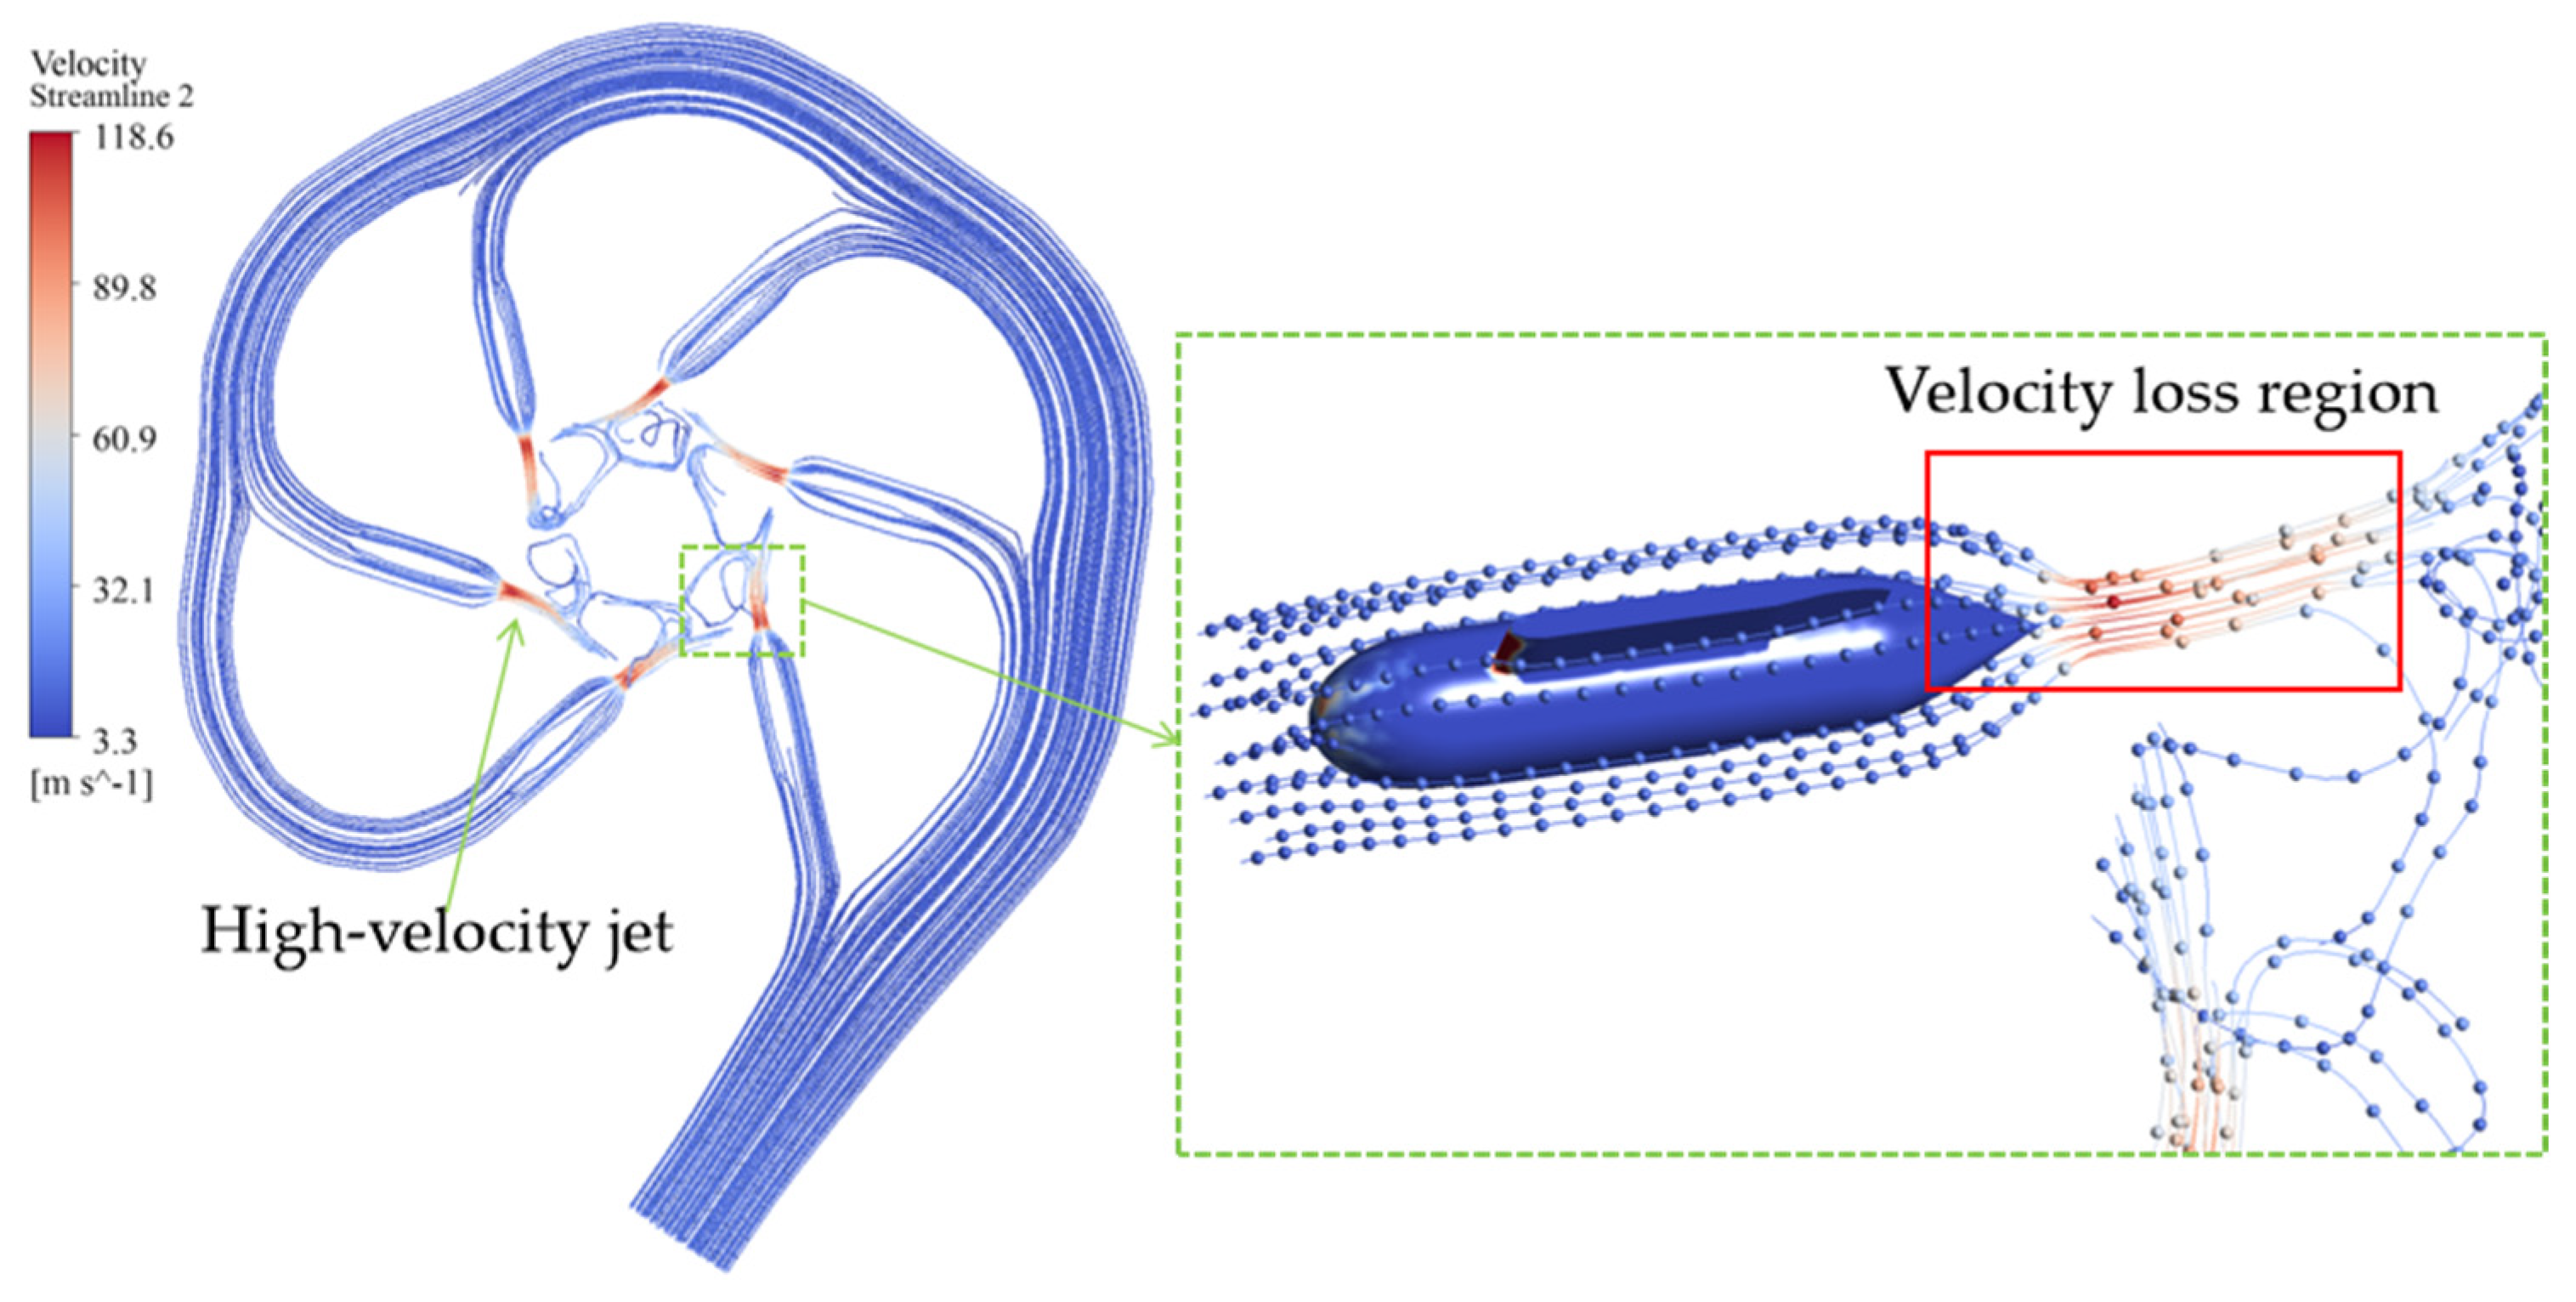
Figure 4 shows the overall flow state and wear rate distribution of the hydraulic turbine. The flow state distribution throughout the entire flow path of the impulse turbine indicates that the velocity is highest at the nozzle outlet, and the velocity loss is most severe in this region. The nozzle area is a critical location for velocity and flow instability. This paper will focus on analyzing the impact characteristics, wear characteristics, and energy loss characteristics at the nozzle.

3.3. Analysis of Sediment Impact Characteristics at the Nozzle

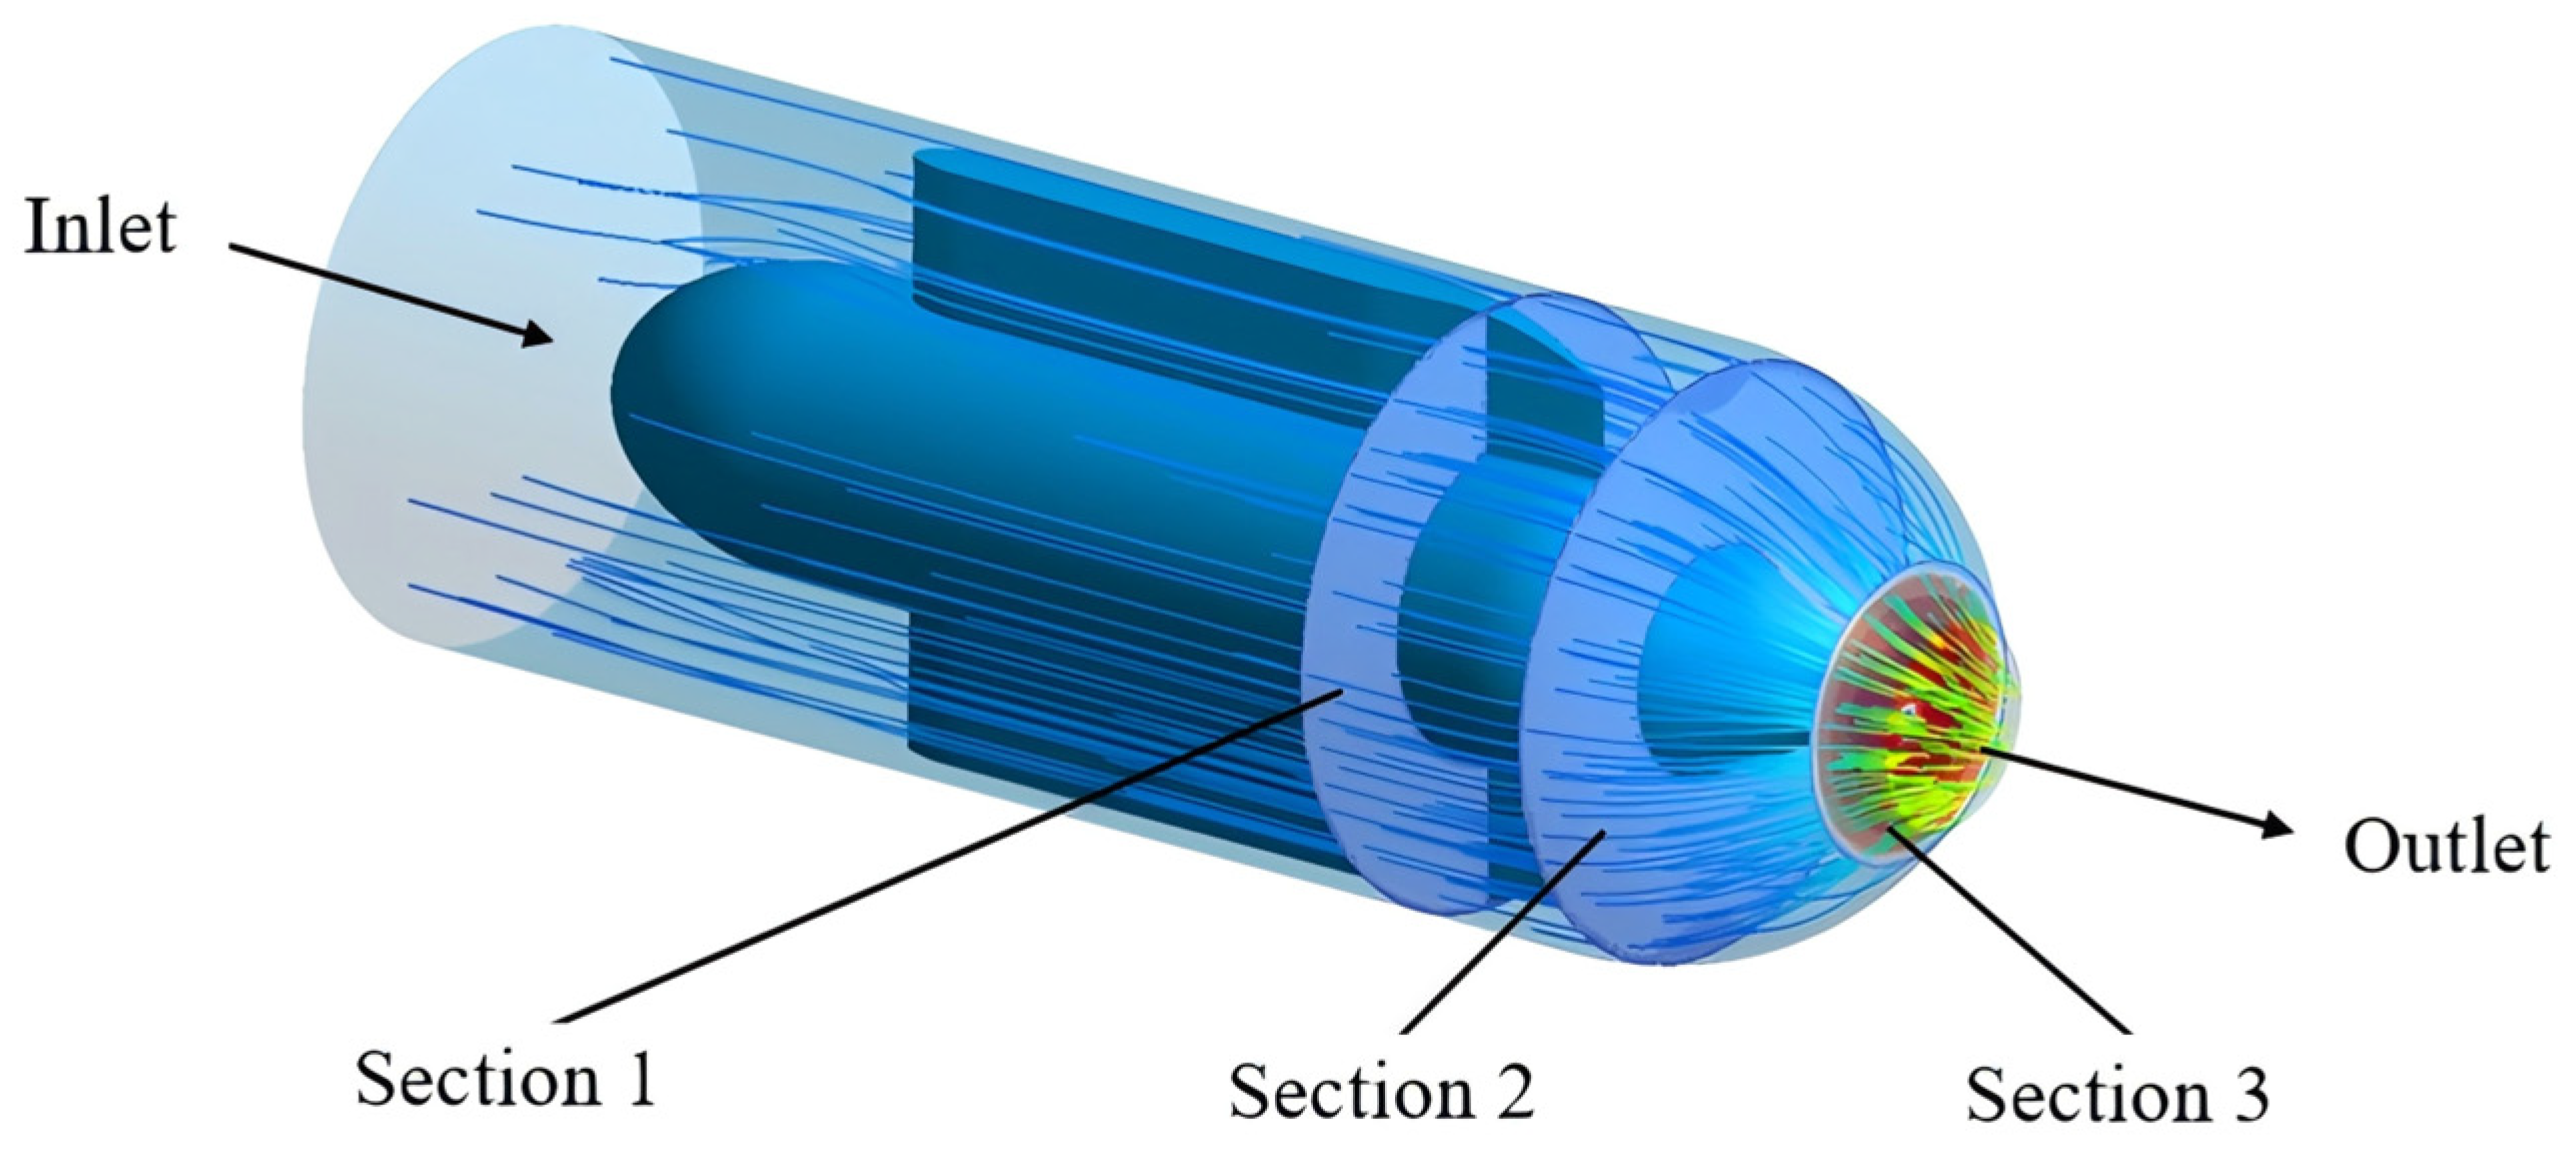
In order to explore the evolution law of the flow field velocity inside the nozzle along the water flow direction, this paper extracts the flow line inside the nozzle and arranges three characteristic sections along the water flow path. The specific positions of each section are shown in Figure 5.
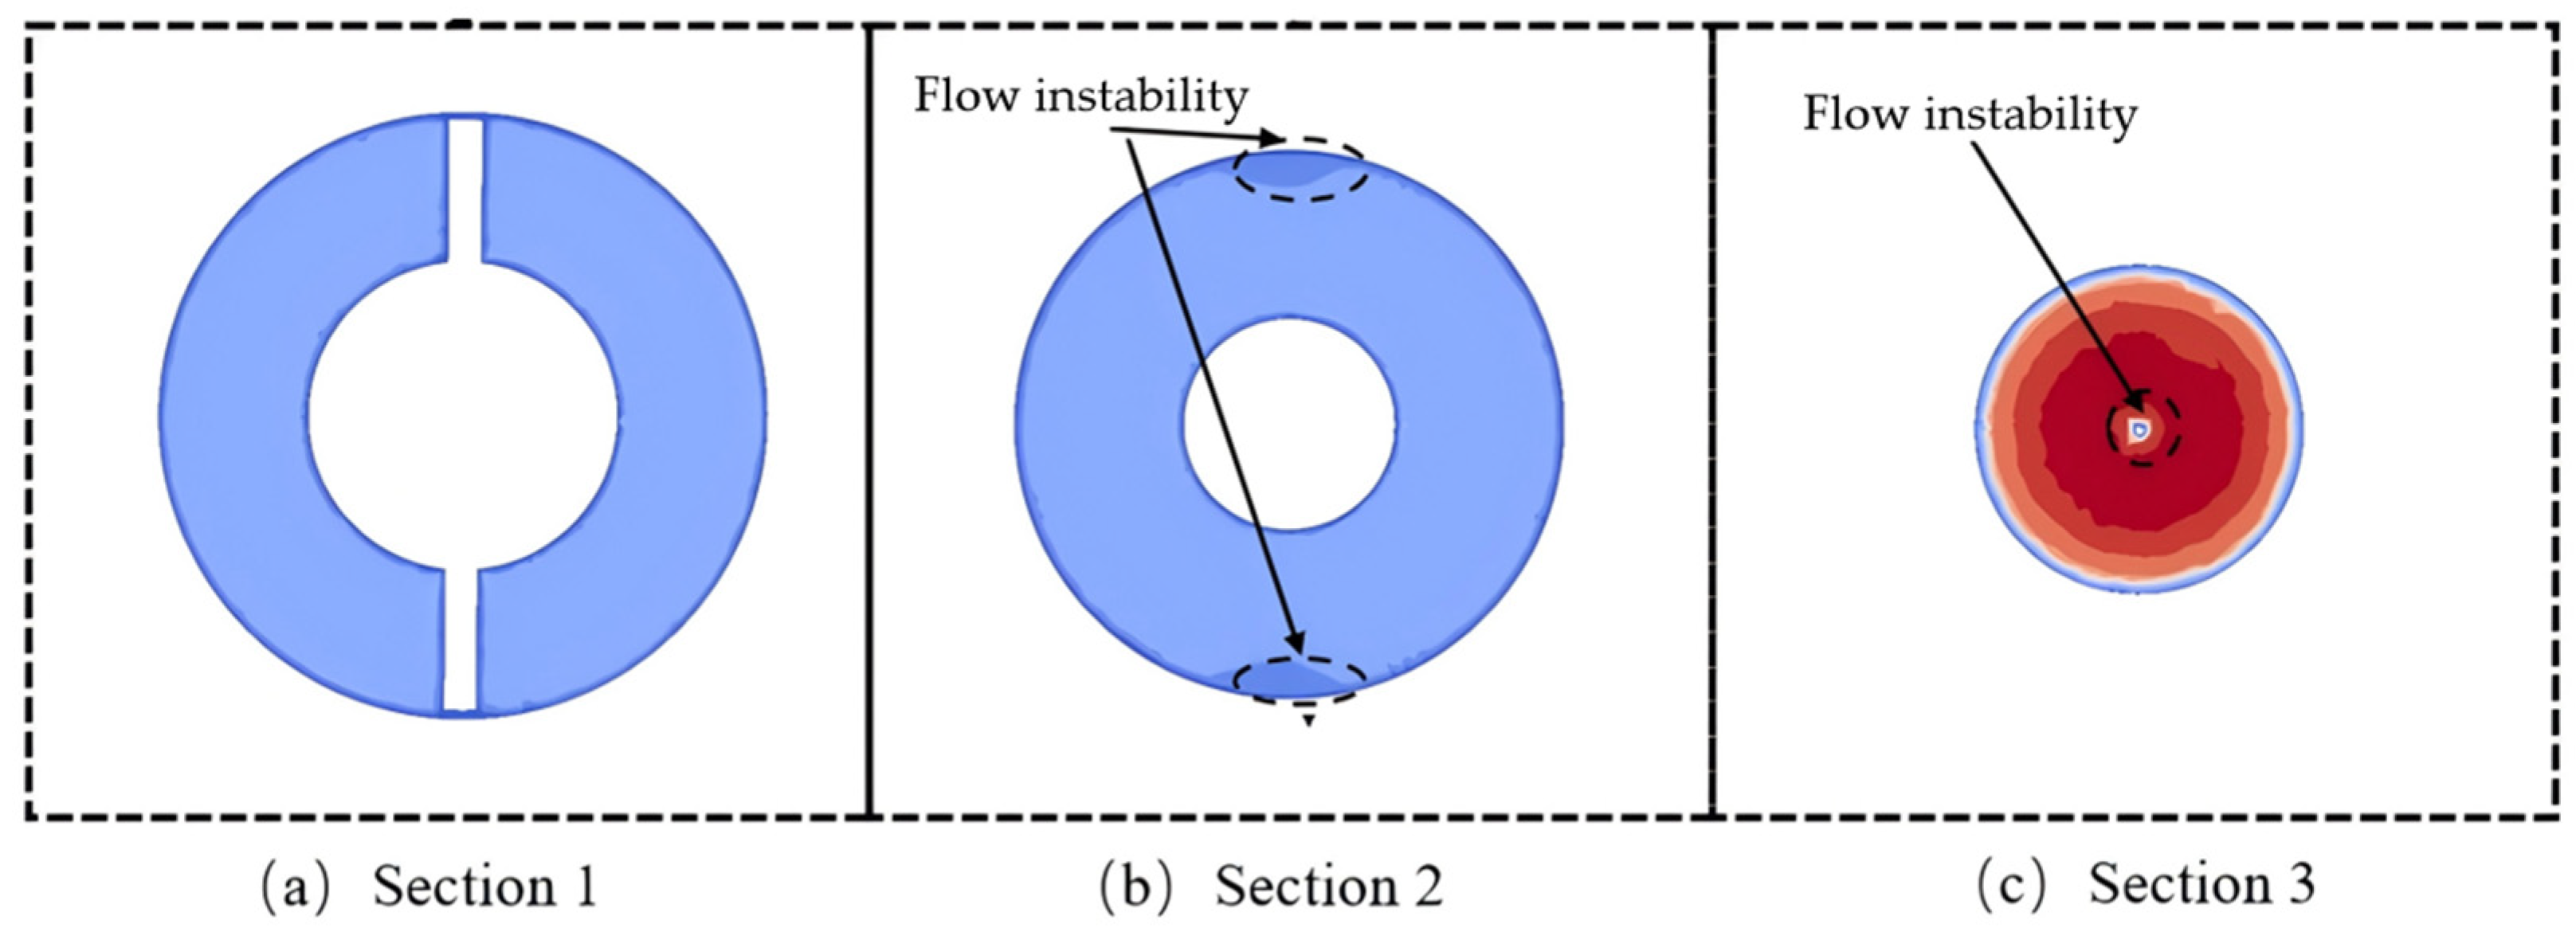
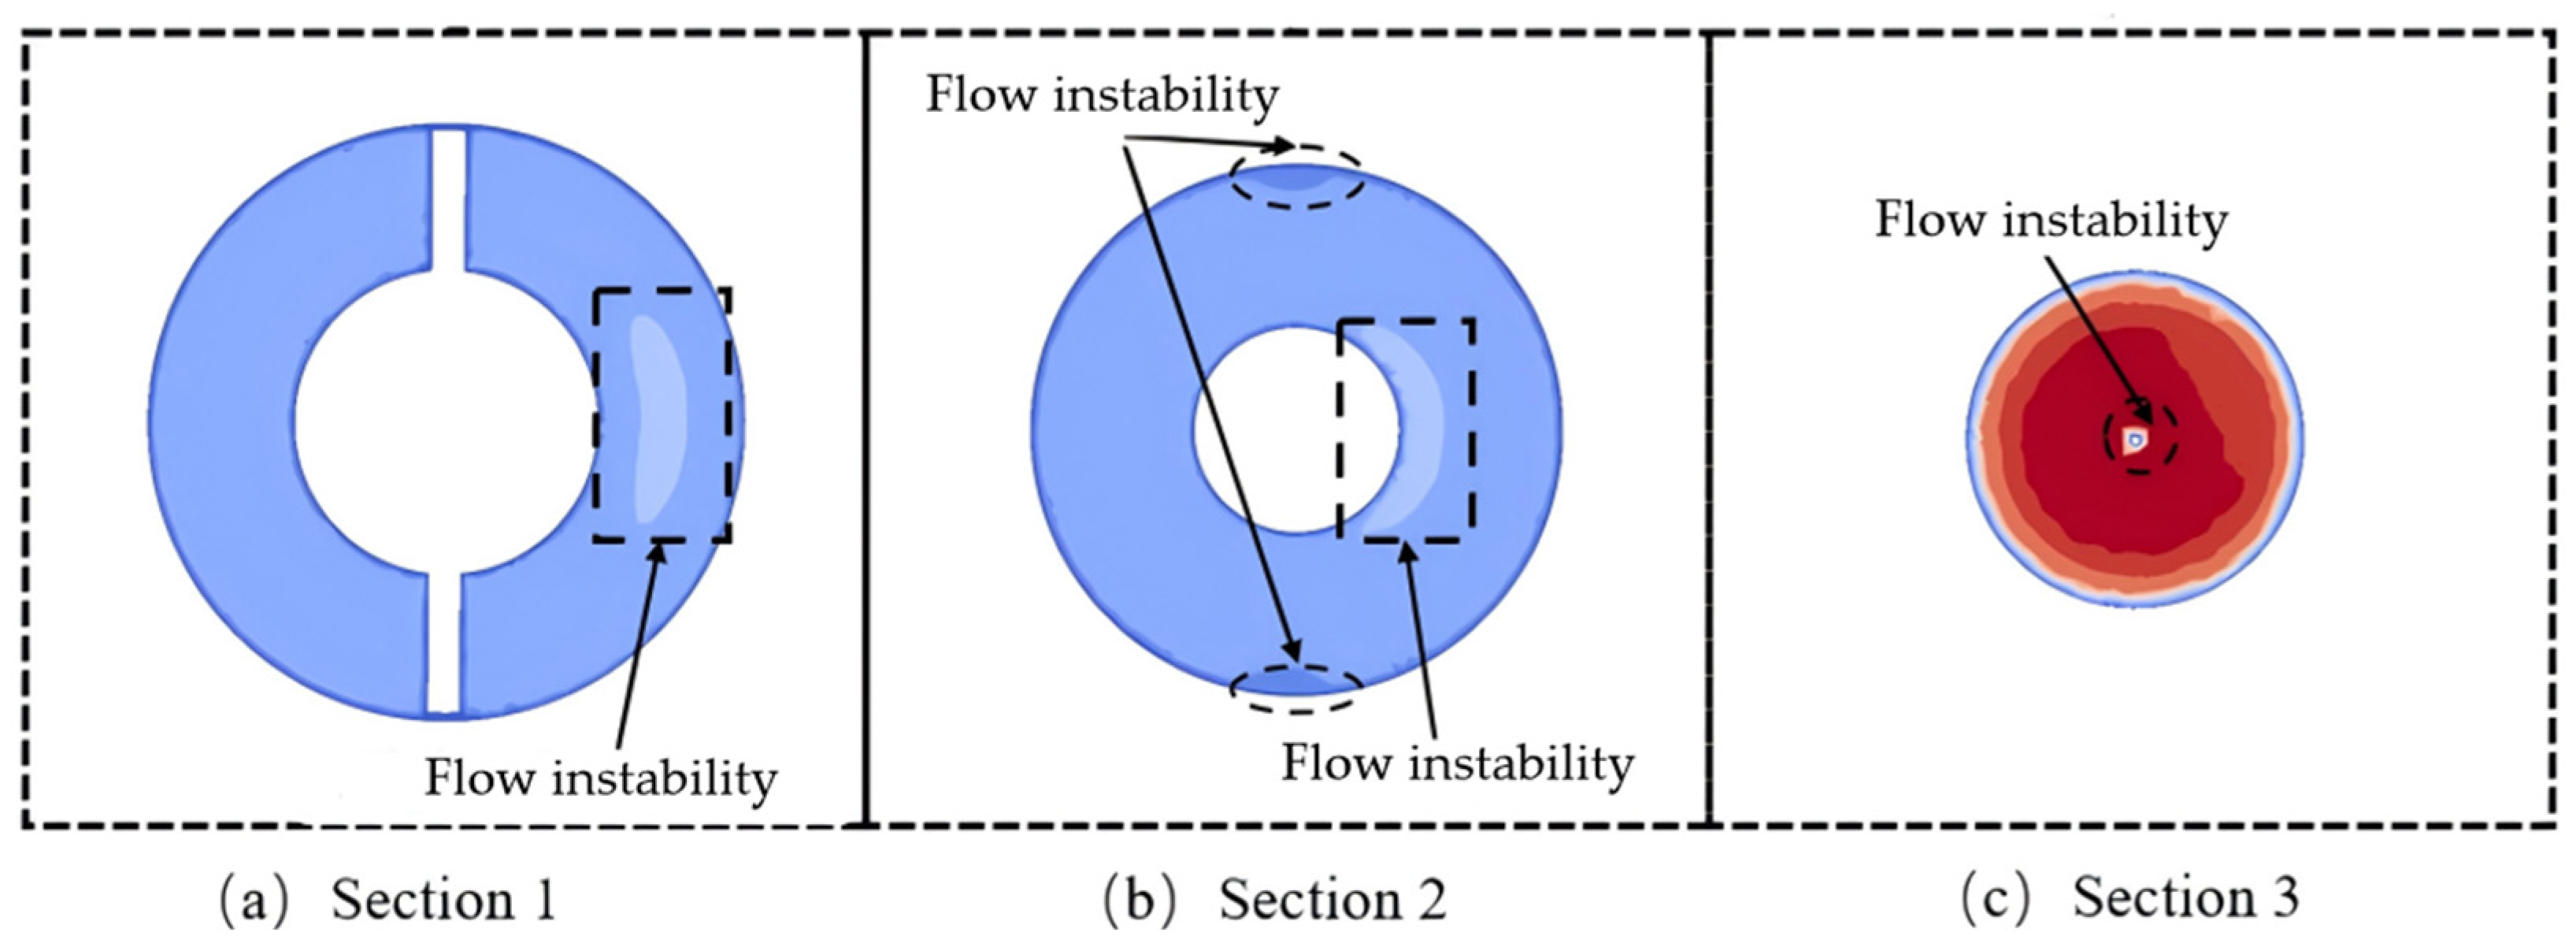
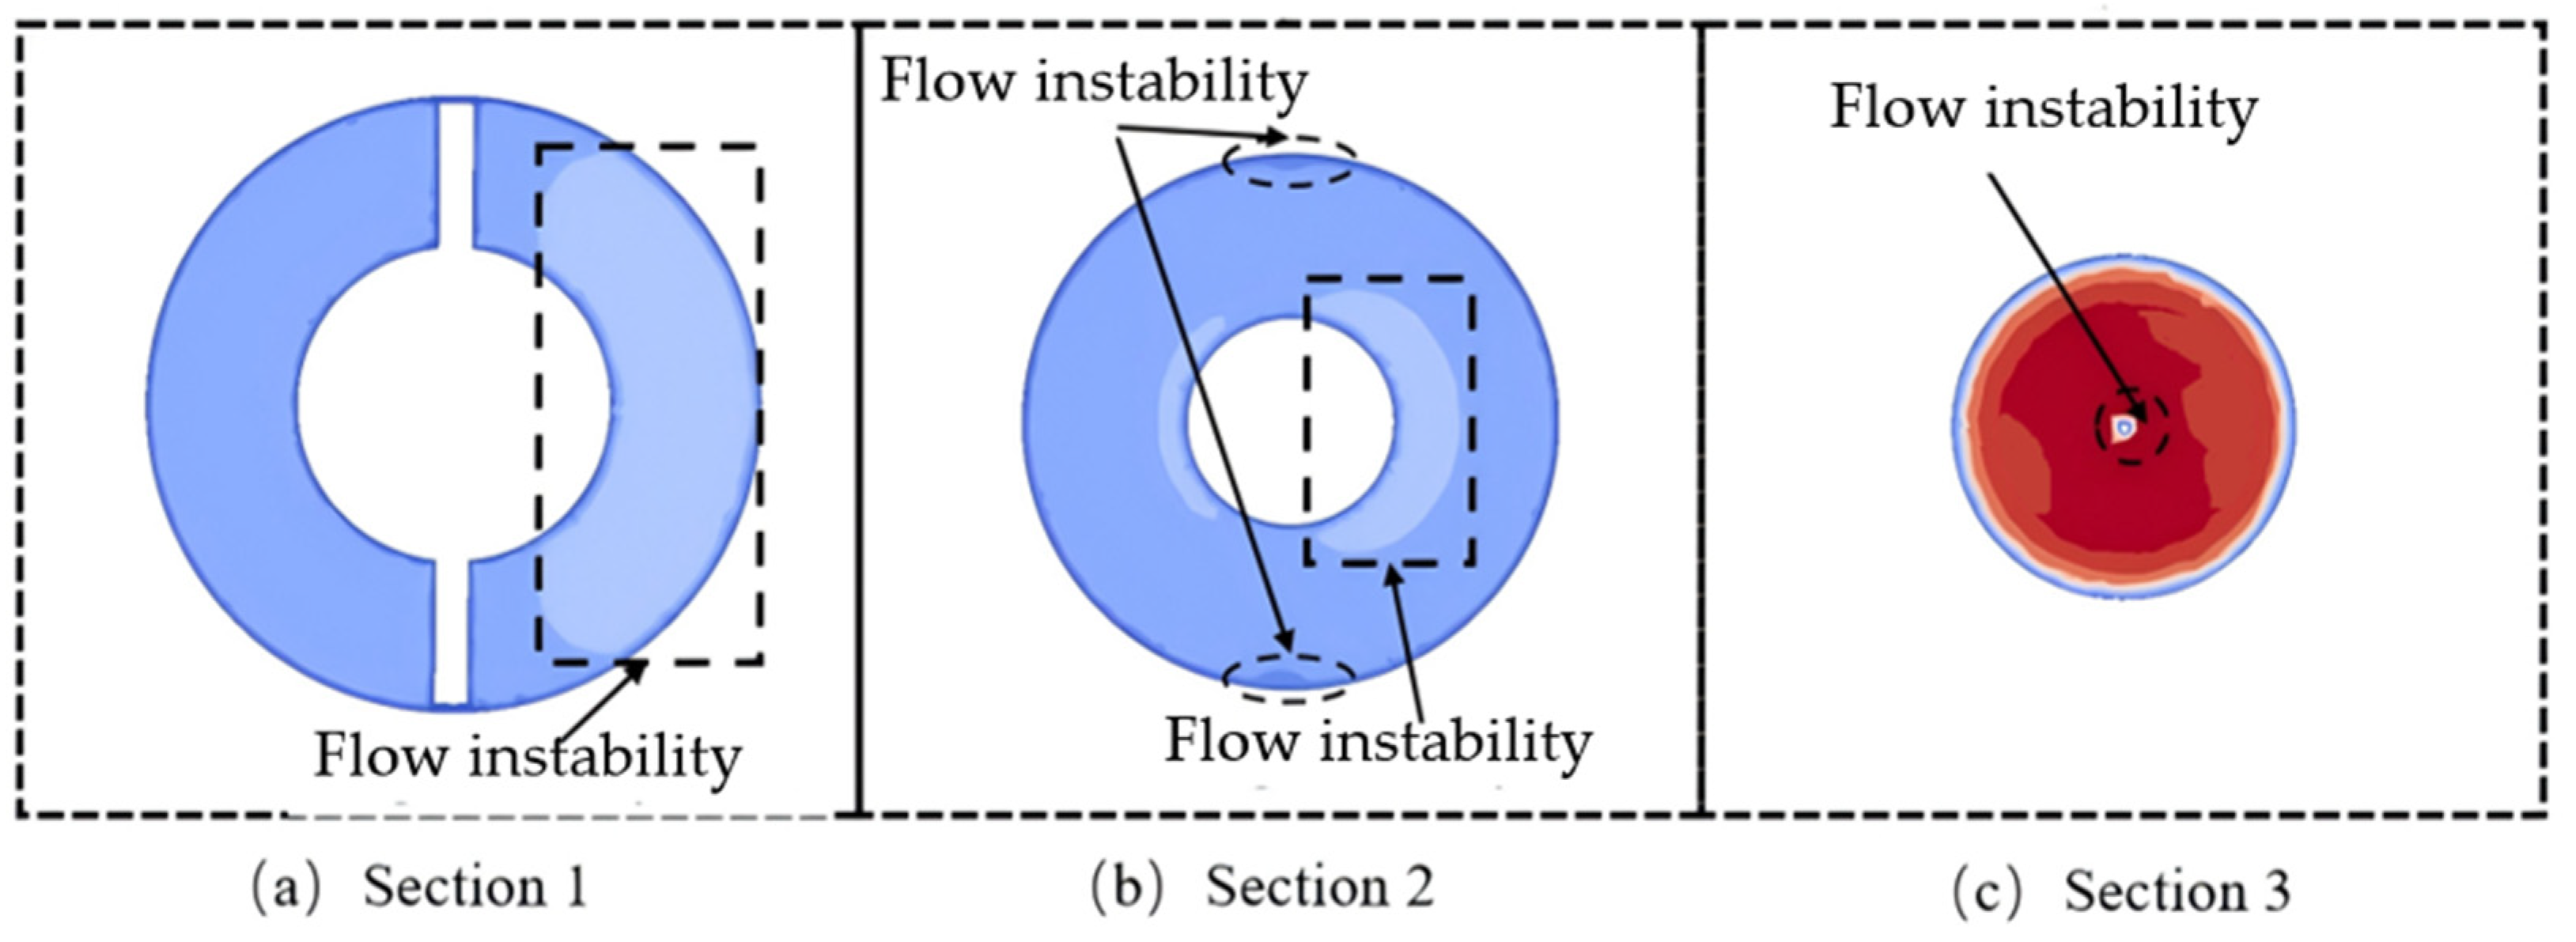
Figure 6, Figure 7 and Figure 8 show the velocity distributions across different sections of the nozzle under various particle sizes. Figure 9 shows the quantitative analysis of erosion rate and turbulent kinetic energy. When the particle size is 0.02 mm, the velocity distribution at Section 1 is generally uniform. As the flow passes through Section 2, velocity loss occurs only near the wall of the guide vane, which is due to the blocking effect of the boundary layer on the guide vane surface, leading to local flow deceleration. The flow structure at this section tends to be stable, with a uniform velocity gradient and only slight velocity loss in local regions. When the flow reaches Section 3, the velocity distribution becomes highly uniform, with only a small region of velocity loss near the nozzle tip. At the same time, the high-speed flow gradually detaches from the constraint of the nozzle wall, and the flow field begins transitioning to the free-jet stage. When the particle size increases to 0.1 mm, distinct high-velocity zones appear on the right side of Sections 1 and 2. As the particle size further increases to 0.3 mm, these high-velocity zones continue to expand. These observations indicate that as the particle size increases, the non-uniformity of the velocity distribution inside the nozzle gradually intensifies, and the sediment particle size has a significant effect on the velocity distribution at different nozzle positions.

3.4. Analysis of Sand Wear Characteristics at Nozzle

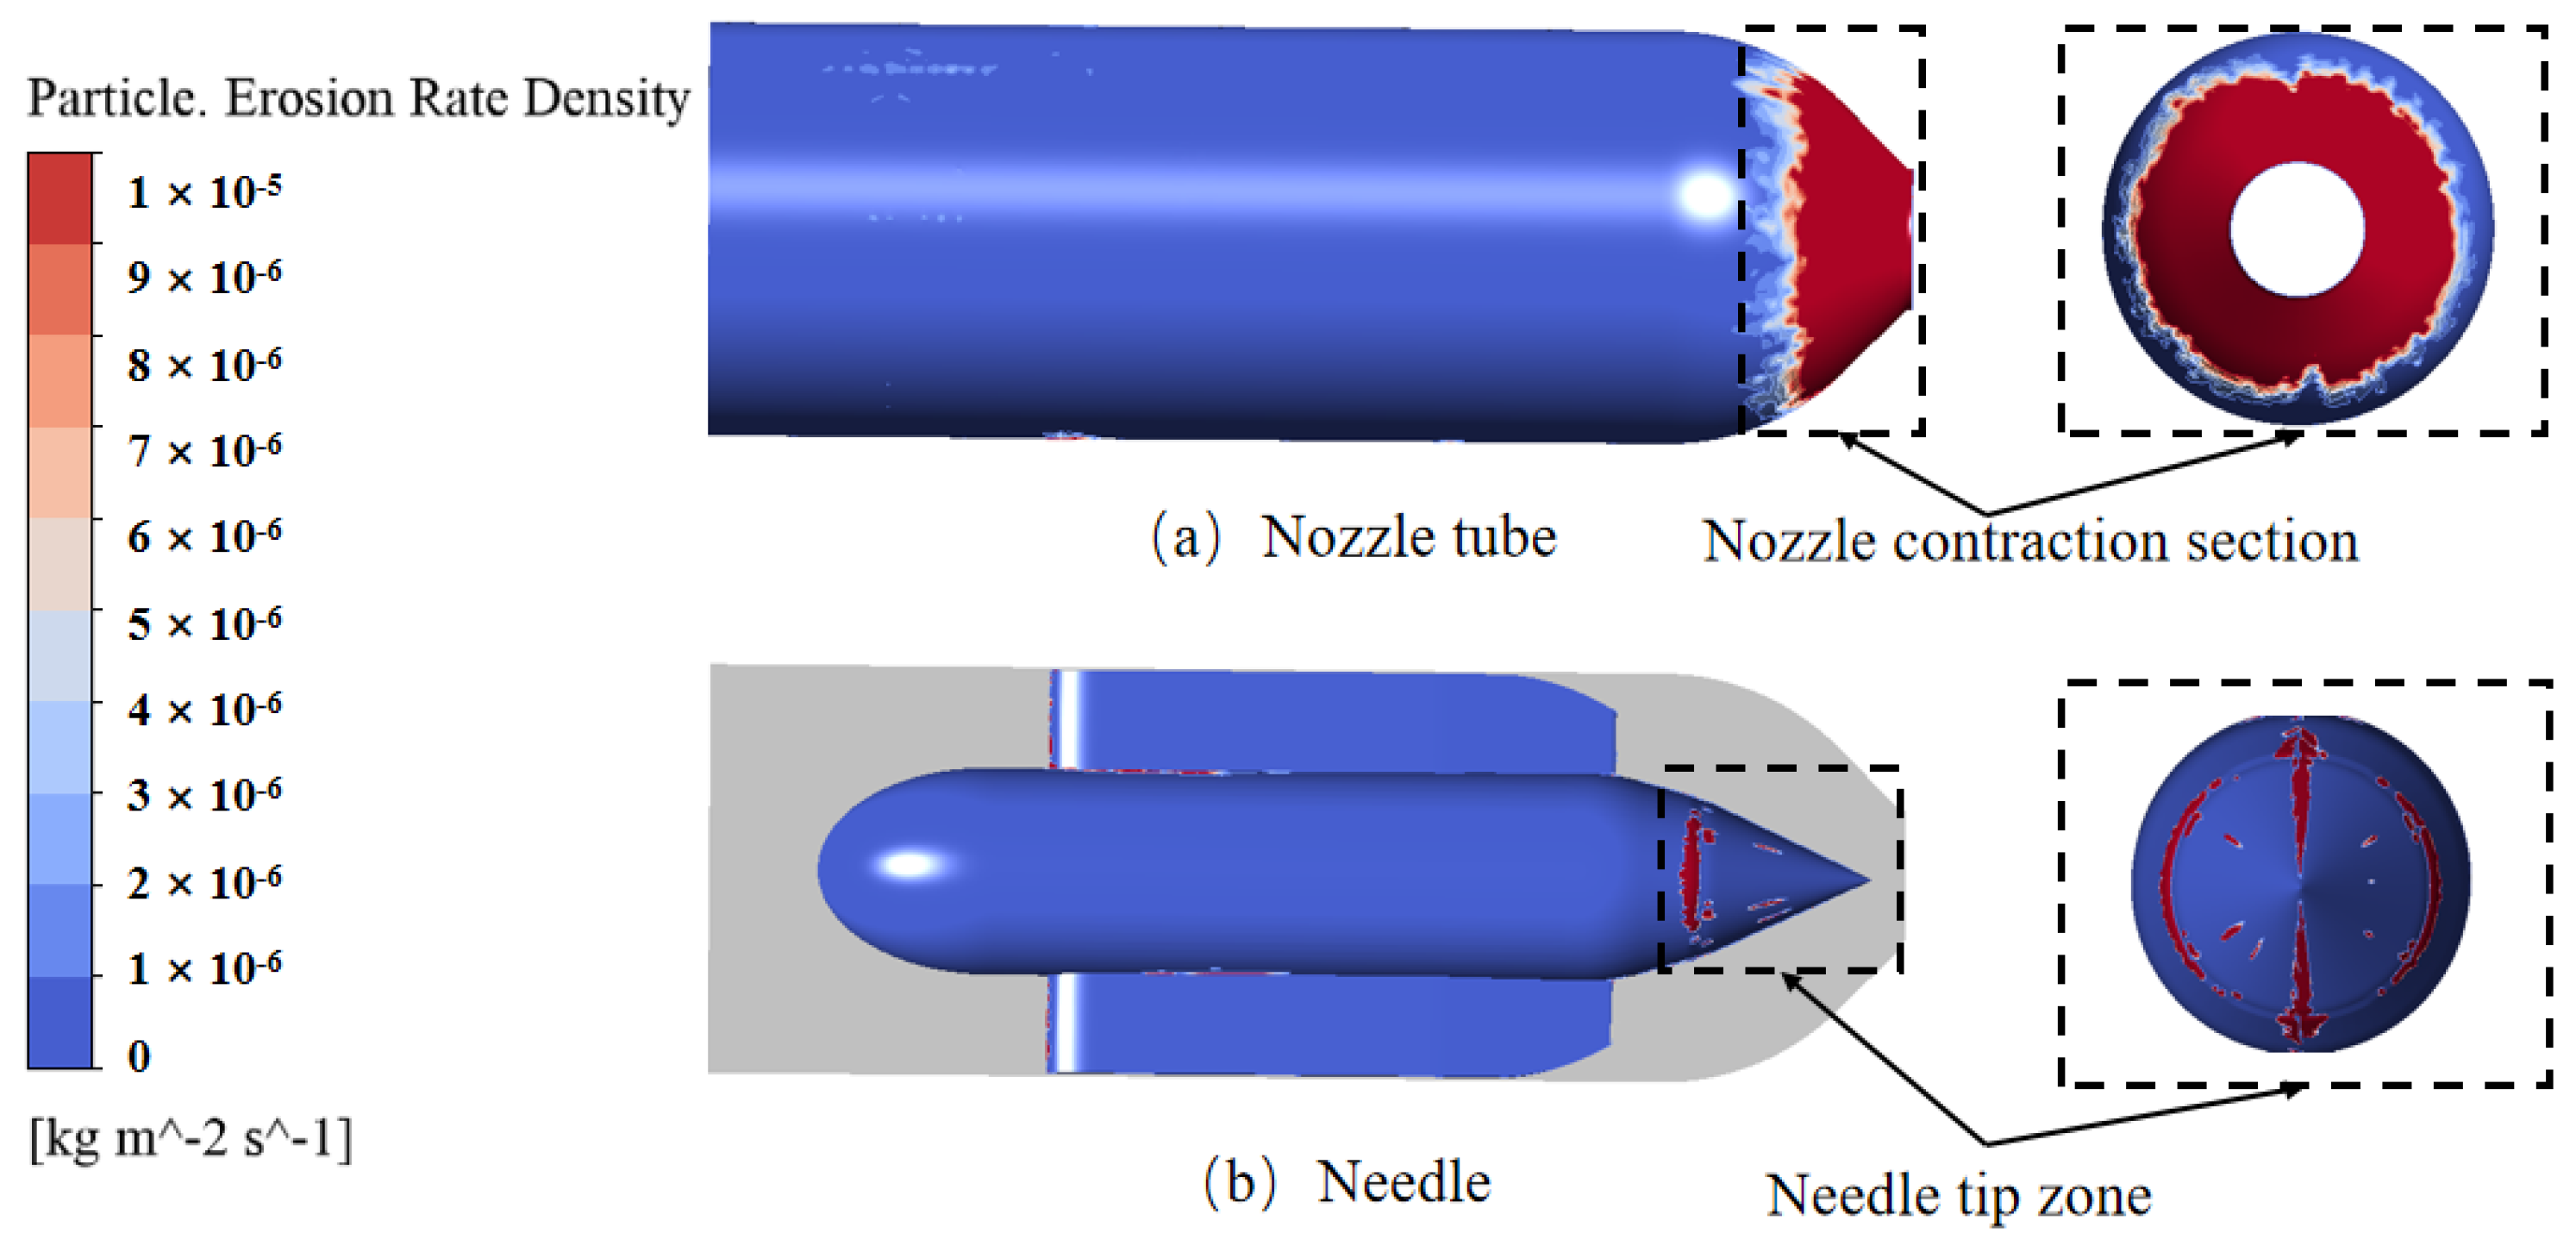
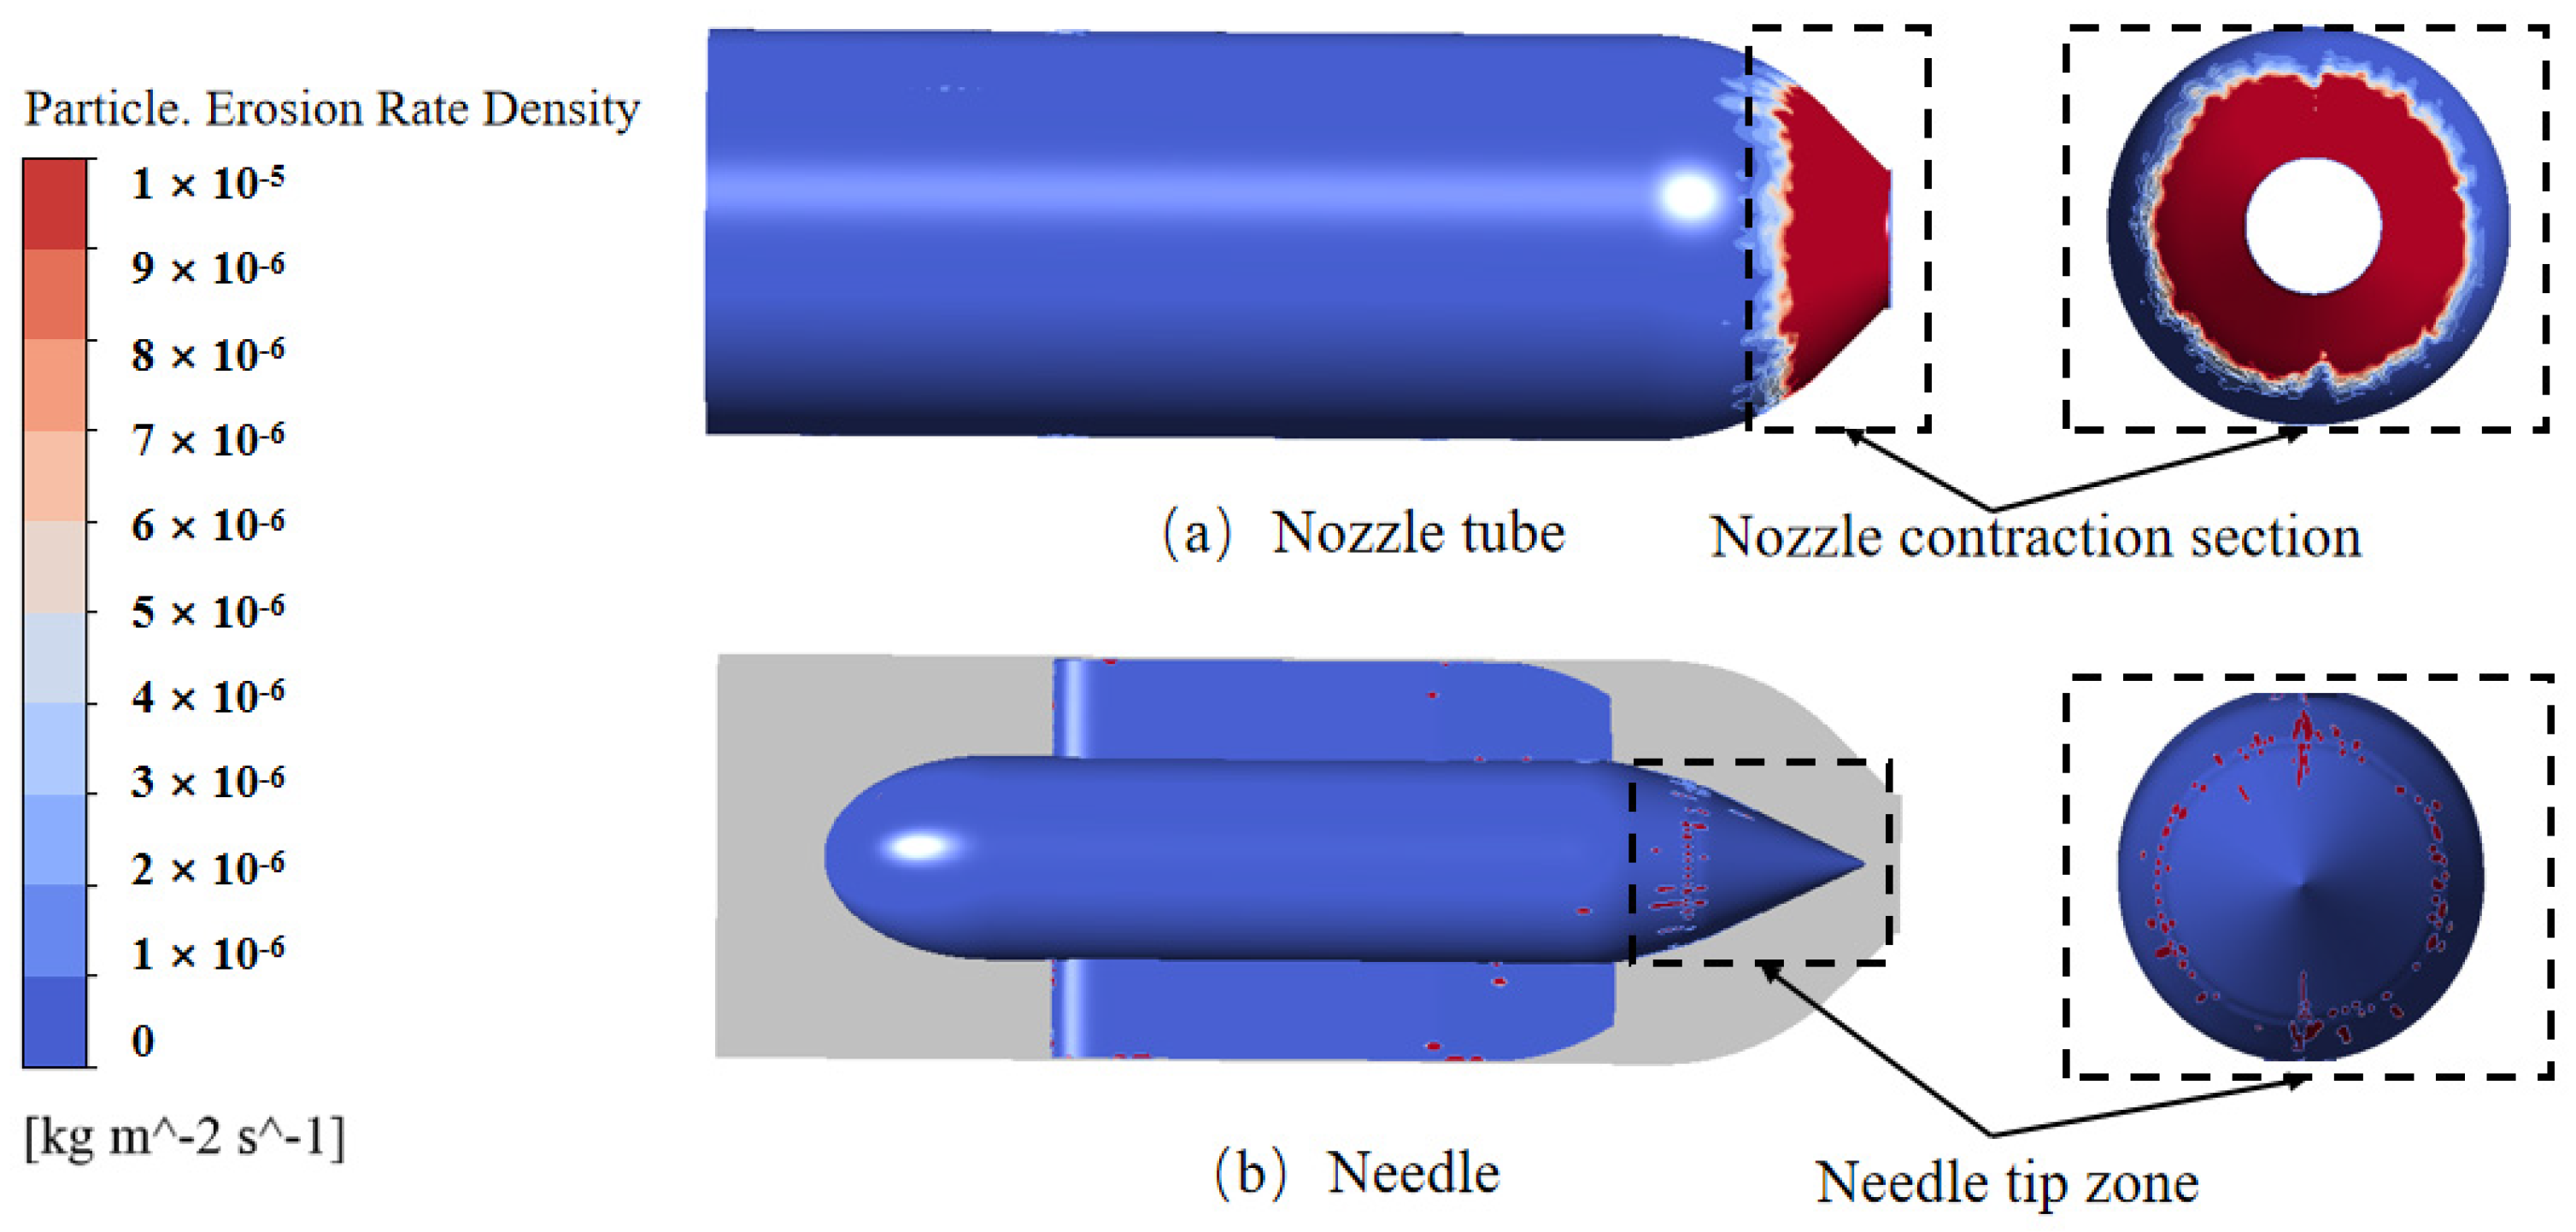
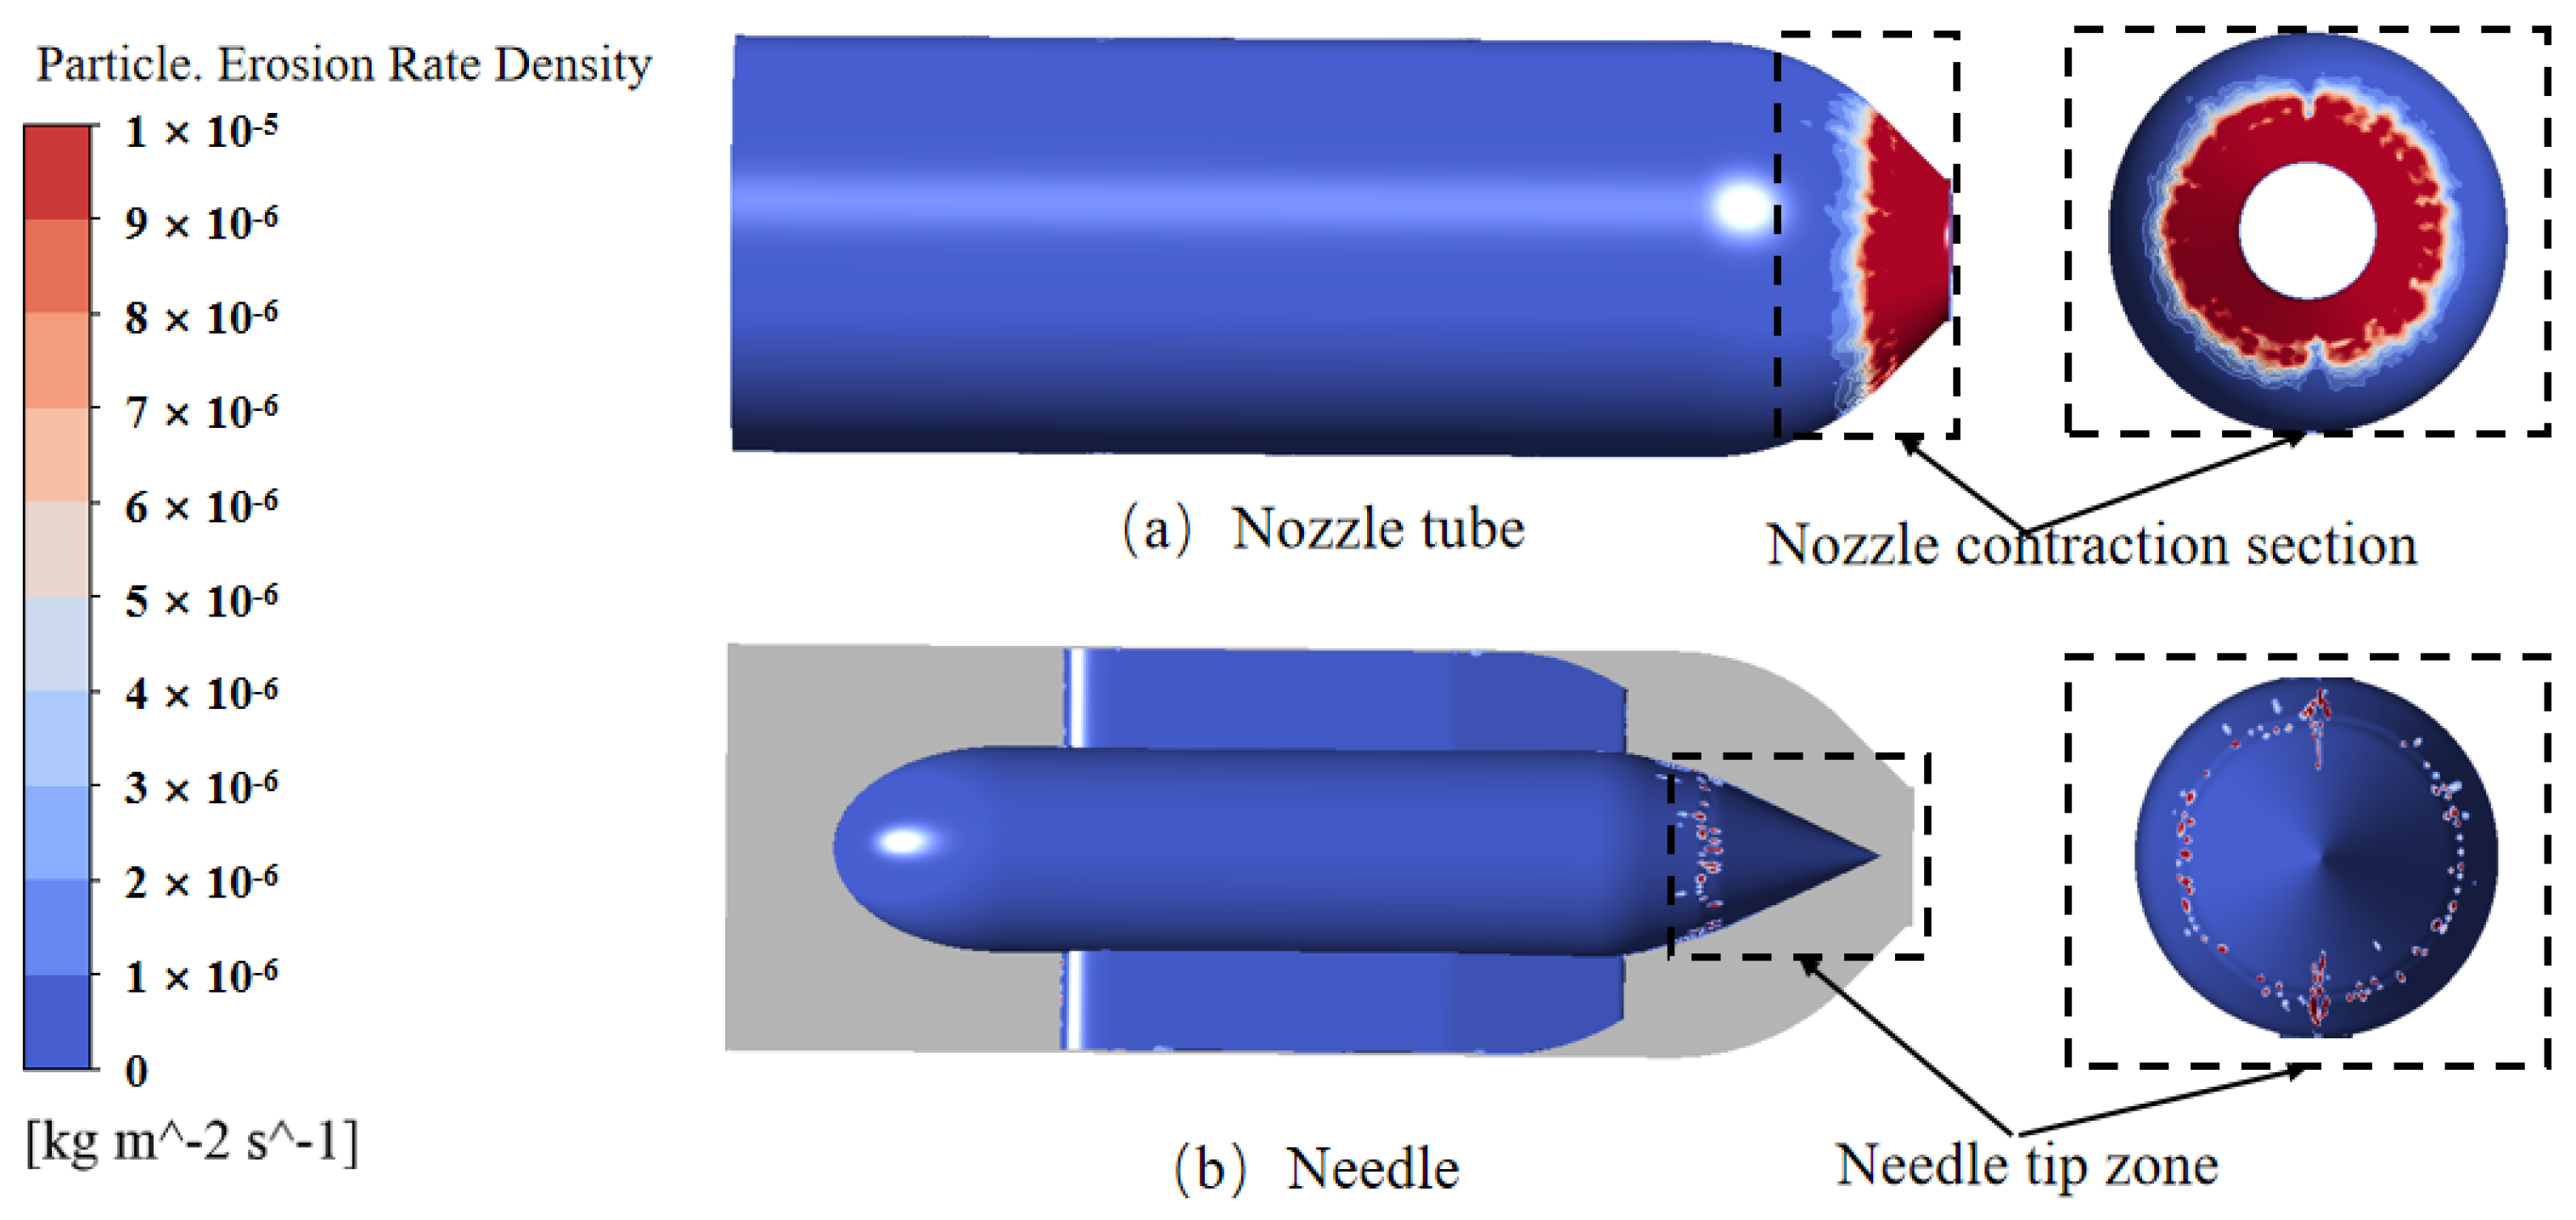
Figure 10, Figure 11 and Figure 12 show erosion rate distributions on a single nozzle and needle for different particle sizes. The entropy production distribution aligns well with erosion locations. The nozzle exhibits a significantly larger erosion-affected area than the needle, with erosion showing clear circumferential diffusion. In contrast, needle erosion is more limited and discretely distributed. At 0.02 mm, fine particles cause discrete erosion near the nozzle tip due to high wall-contact frequency. Nozzle erosion concentrates in the contraction section, especially at the outlet, forming circumferential patterns caused by particle impact at certain angles. At 0.1 mm, erosion ranges shrink for both components, with needle erosion remaining discrete. Larger particles reduce fluidity, weakening wall contact and friction on the needle, and reducing particle impacts on the nozzle contraction section. At 0.3 mm, particles mostly move away from the wall, with only minimal contact, significantly reducing erosion on both parts. In summary, friction erosion dominates for the needle, while impact erosion dominates for the nozzle. As particle size increases, the overall erosion degree decreases for both components.
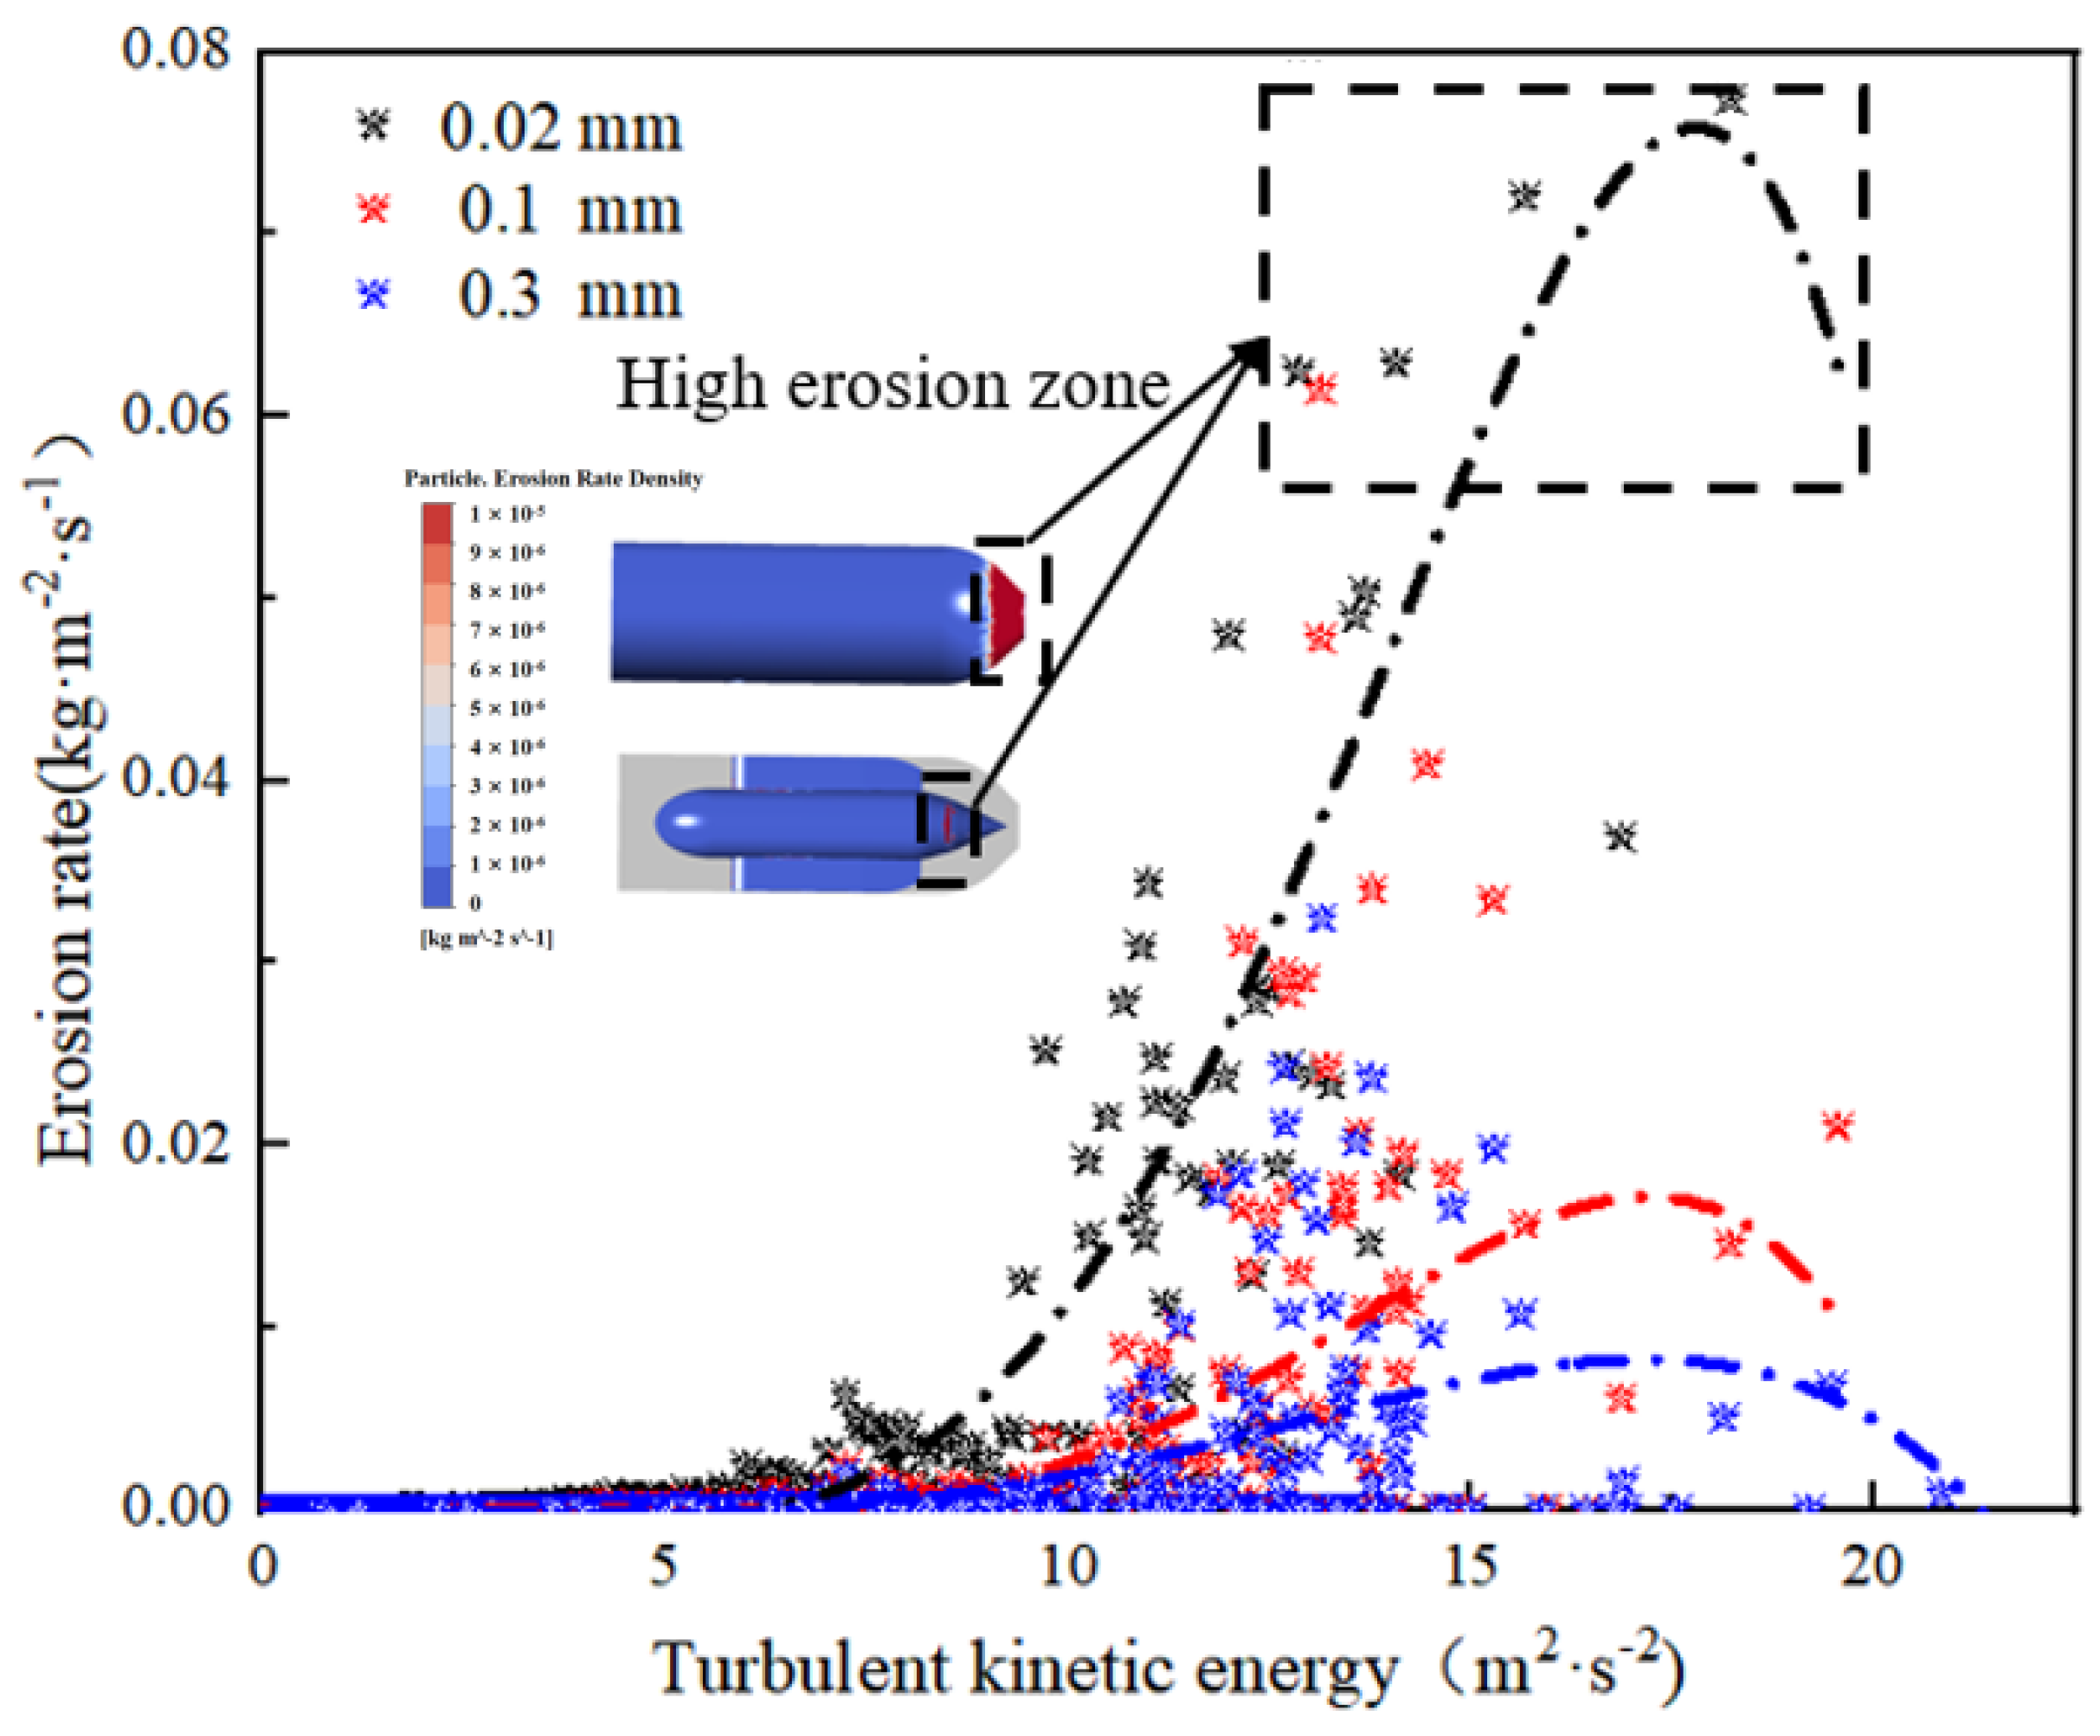
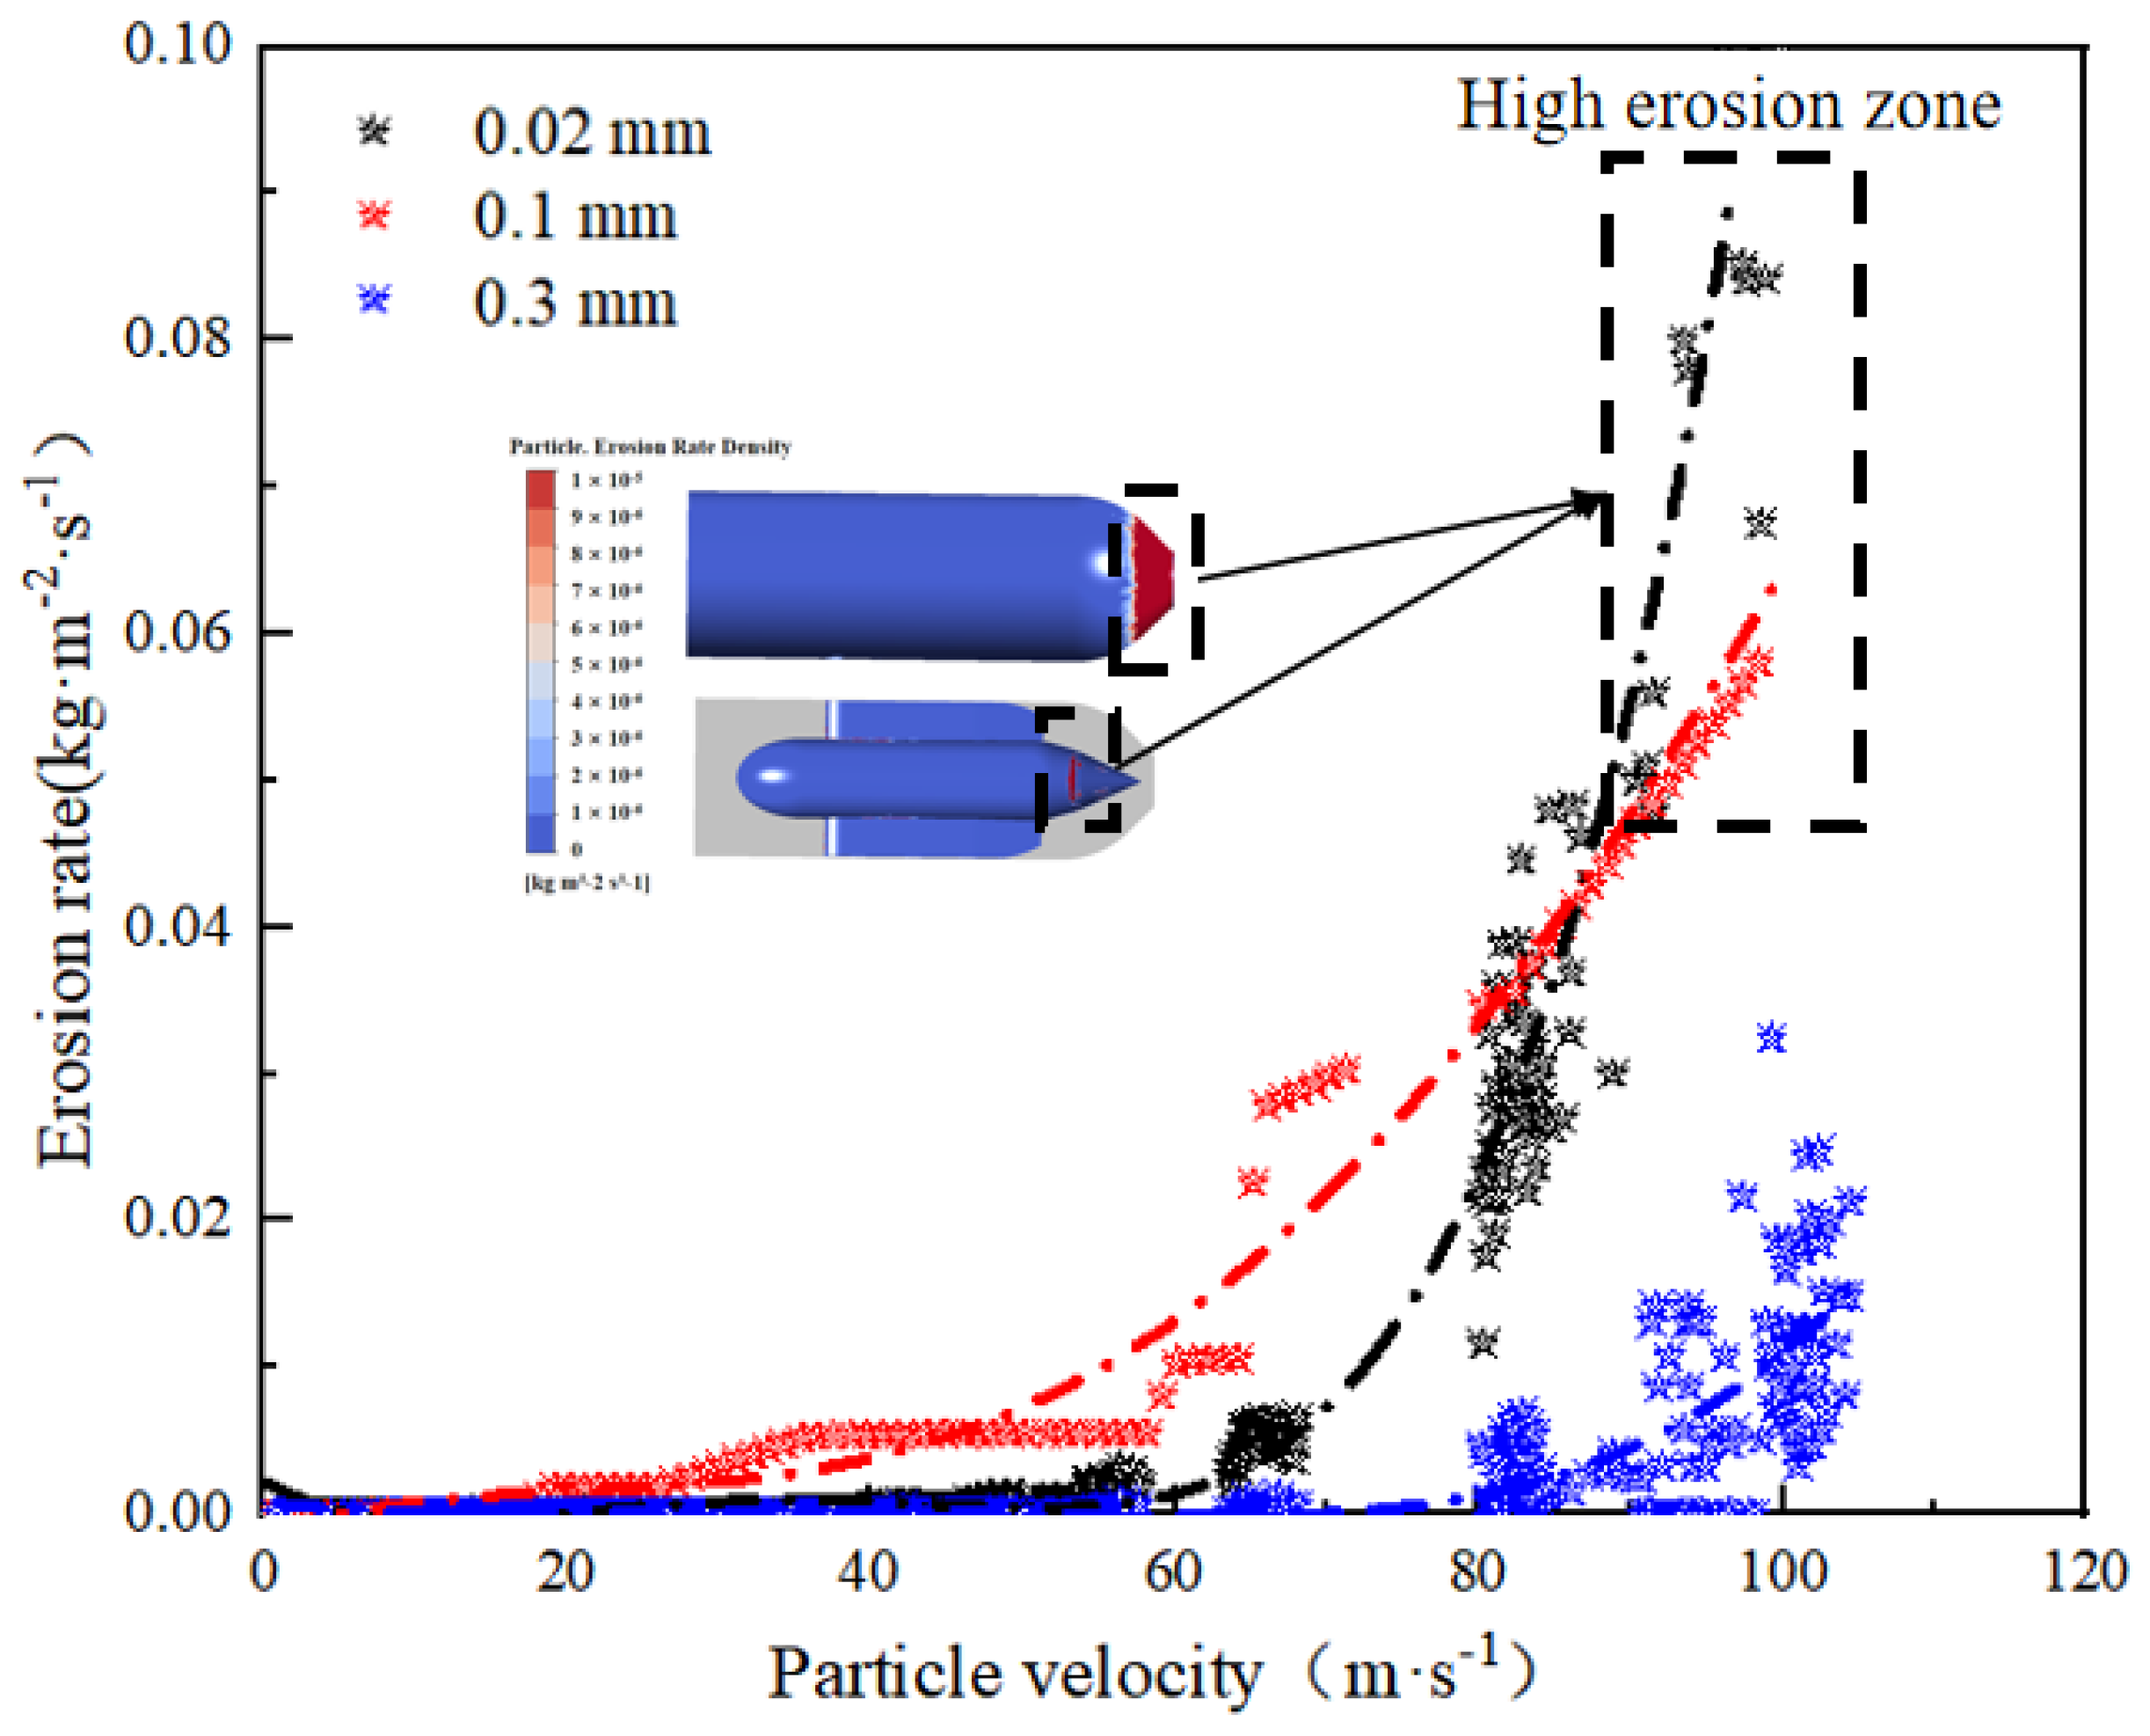
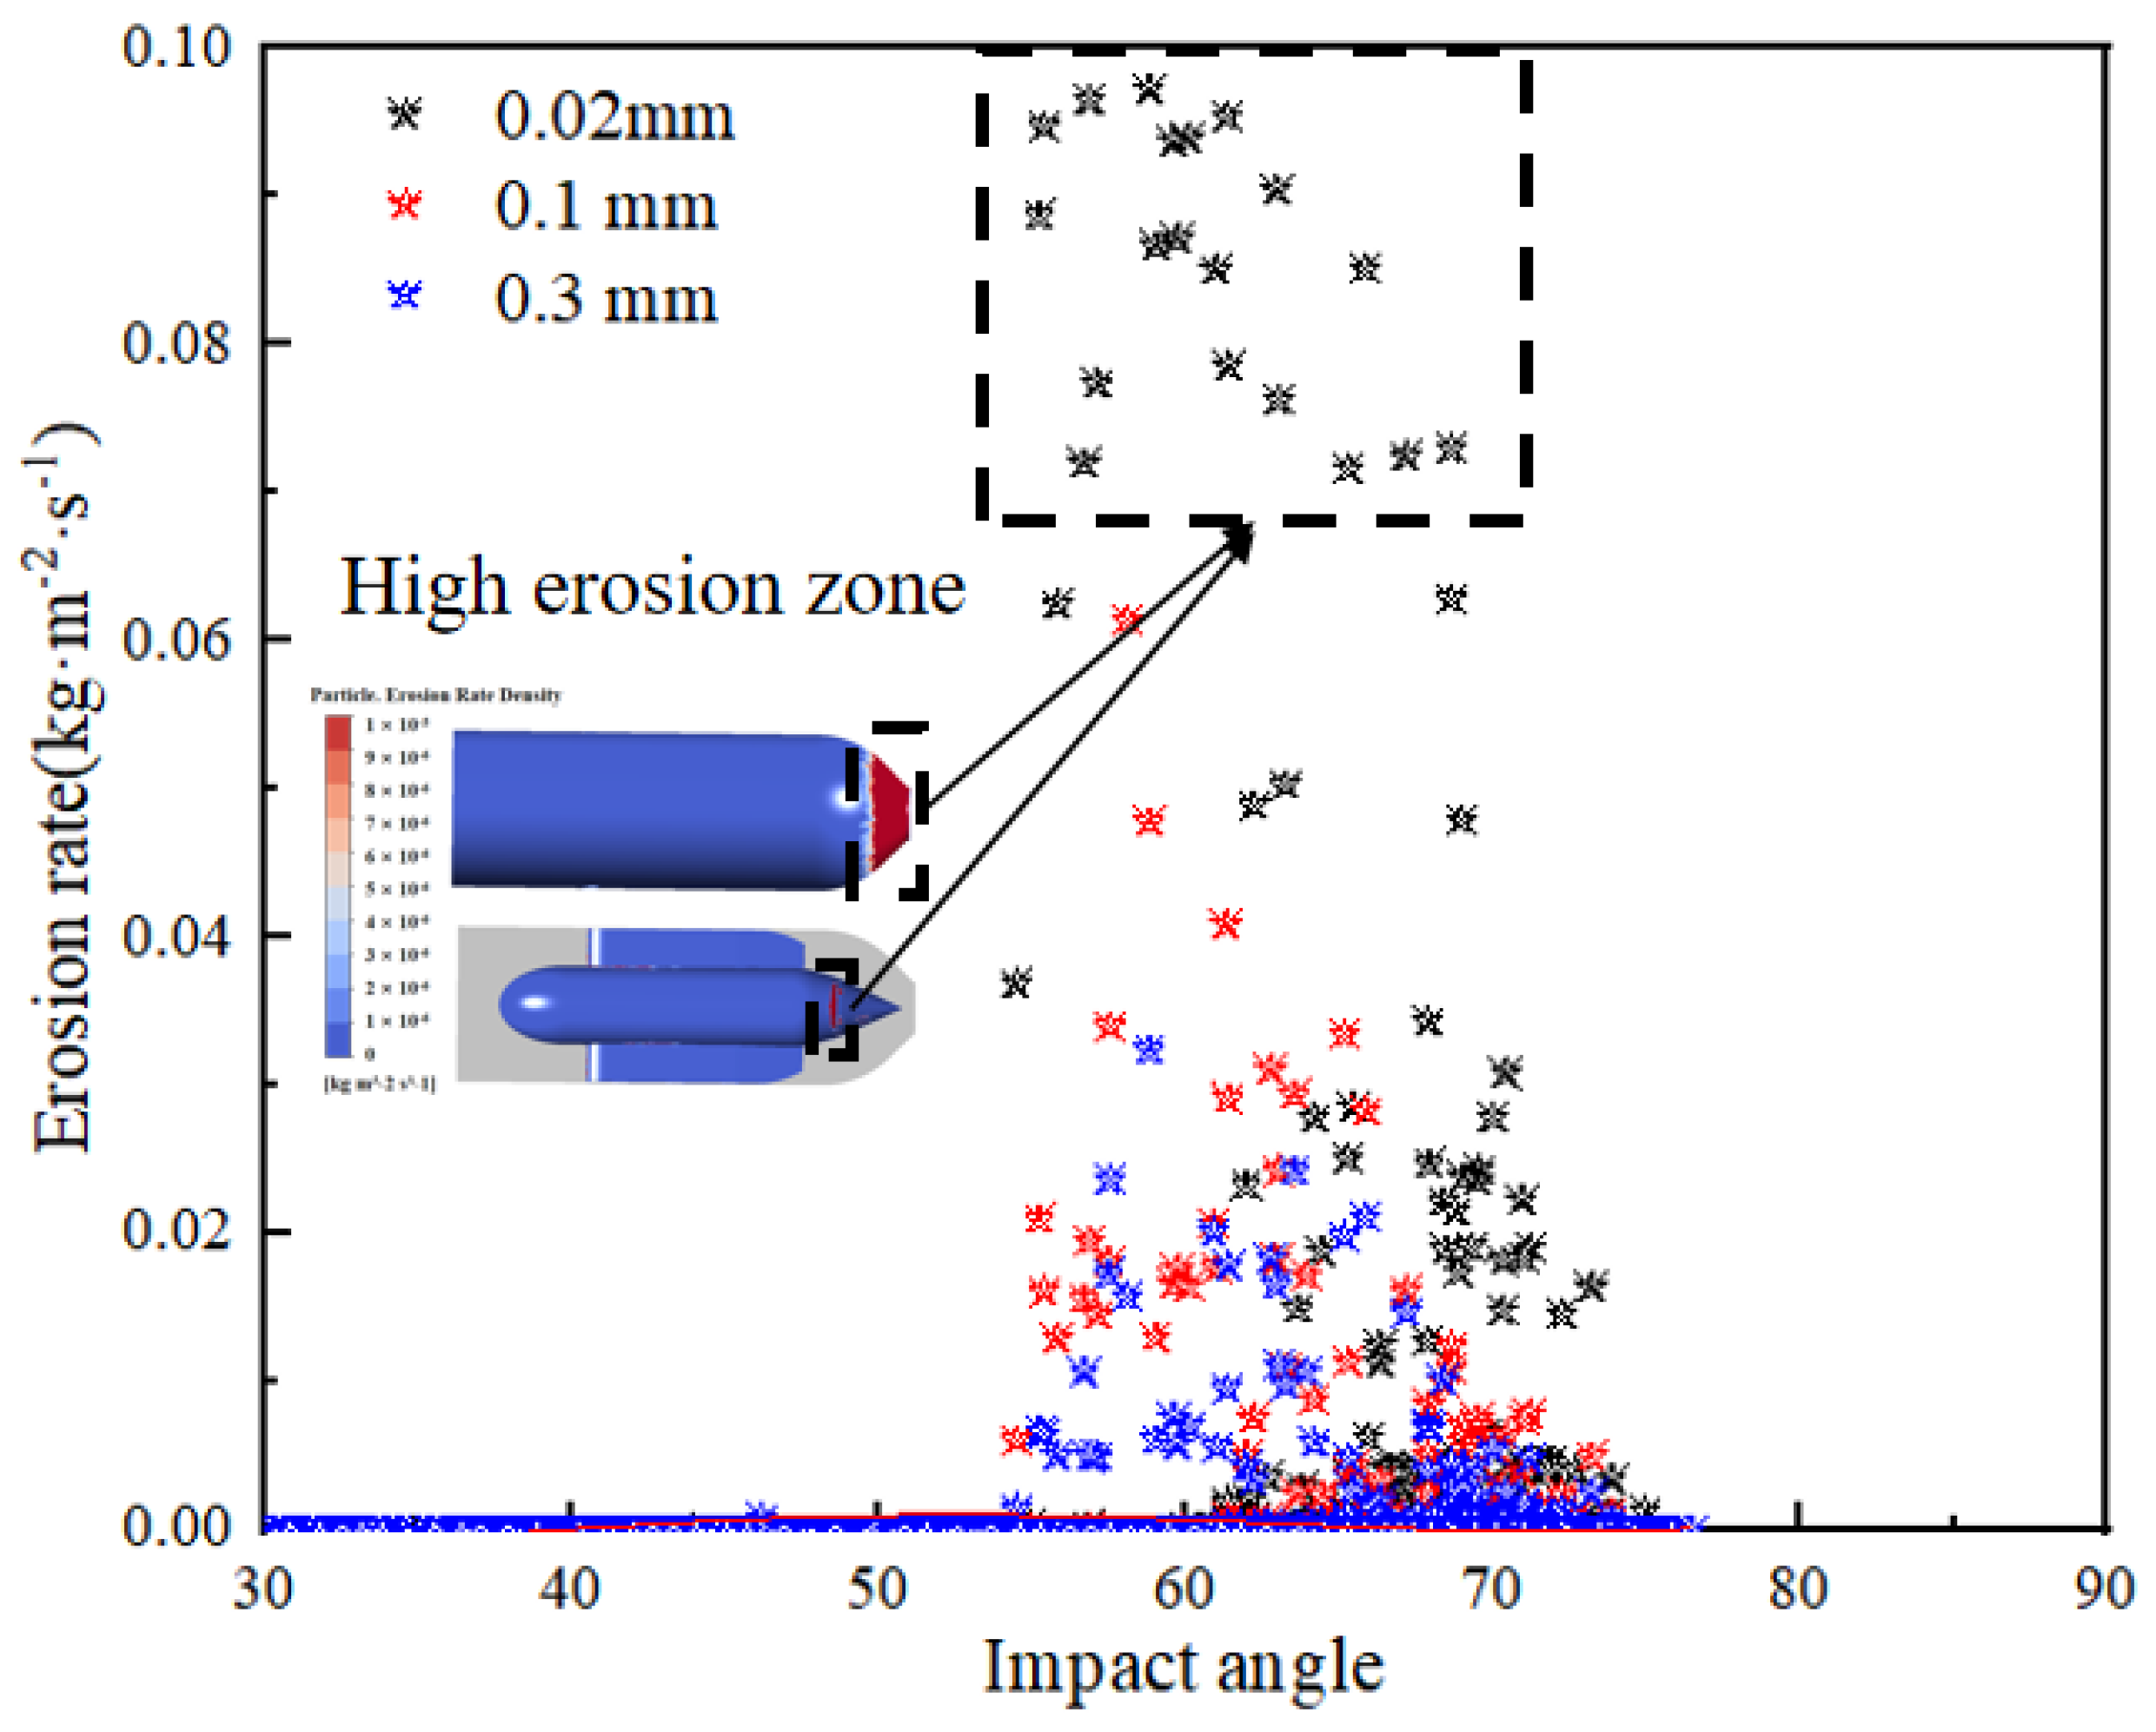
Figure 13 shows the curve of wear rate varying with impact velocity along the particle motion path. The severe erosion of the nozzle and needle valve is concentrated in the particle velocity range [80, 100], where the erosion rate exhibits a sharp upward trend. Figure 14 presents the curve of wear rate varying with impact angle under different particle sizes. The impact angles for different particle sizes are mainly concentrated between 50° and 80°. According to tribology, the inner wall of the nozzle is primarily subject to friction wear, while the area near the nozzle is mainly impacted by impact wear, and the impact wear characteristics become more pronounced with larger particle sizes. From these charts, it can be clearly observed that smaller particle sizes result in more severe erosion.
In order to analyze the influence of different particle sizes on the internal flow field in the nozzle, the movement characteristics of sediment particles with different particle sizes were compared.
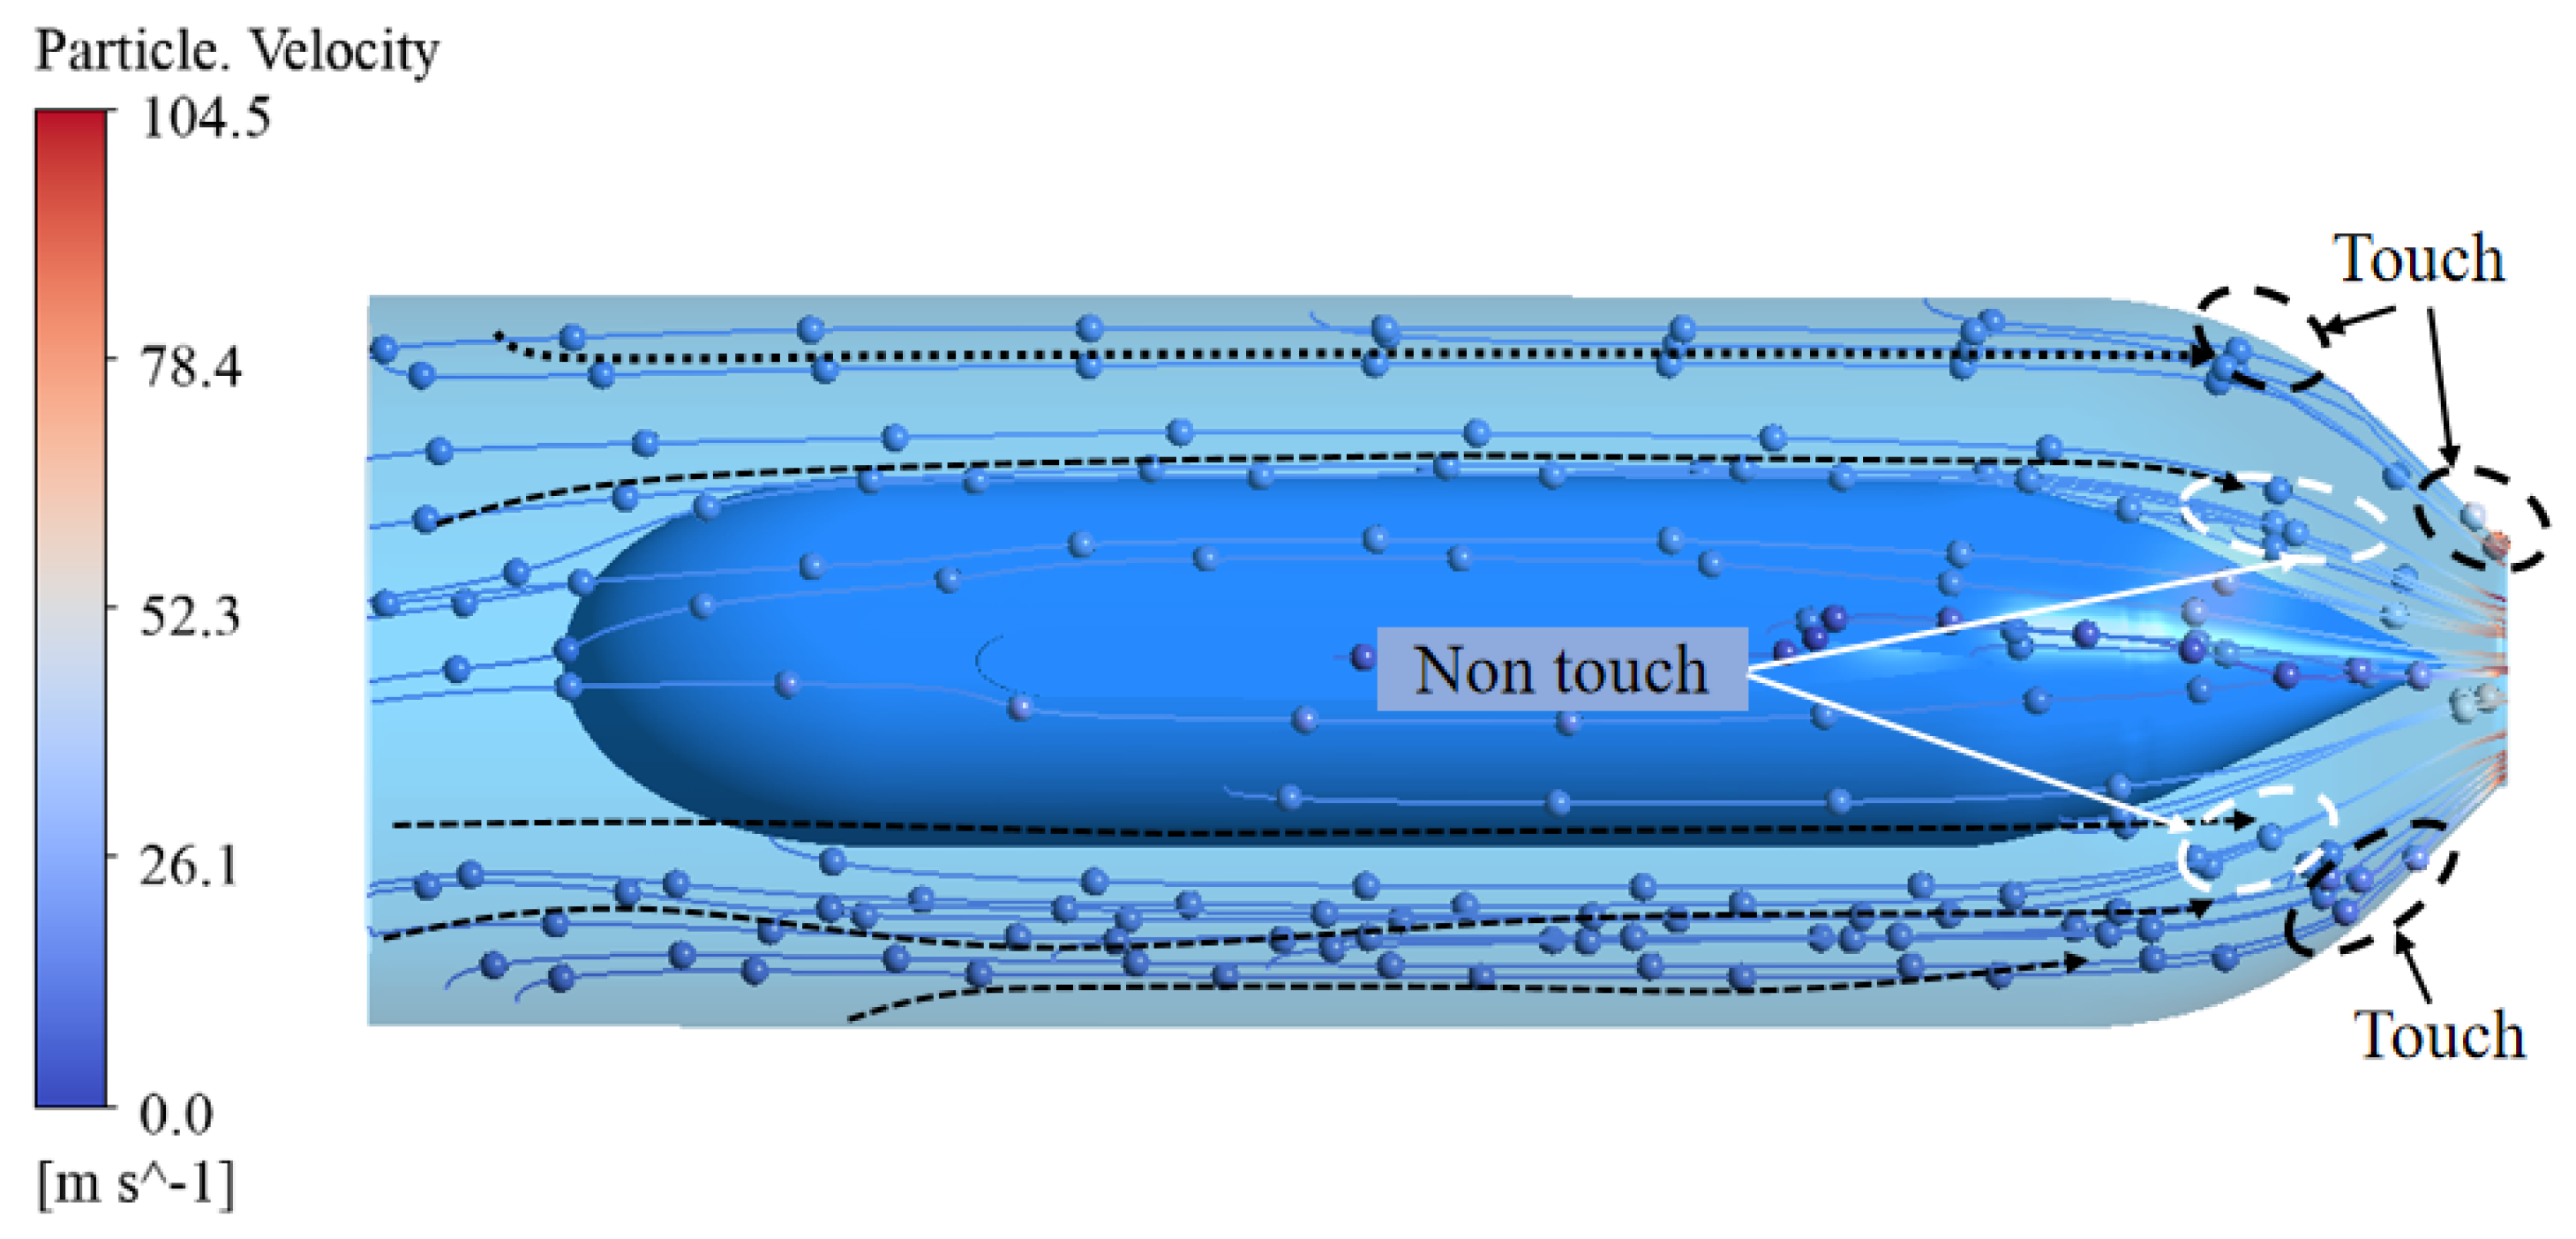
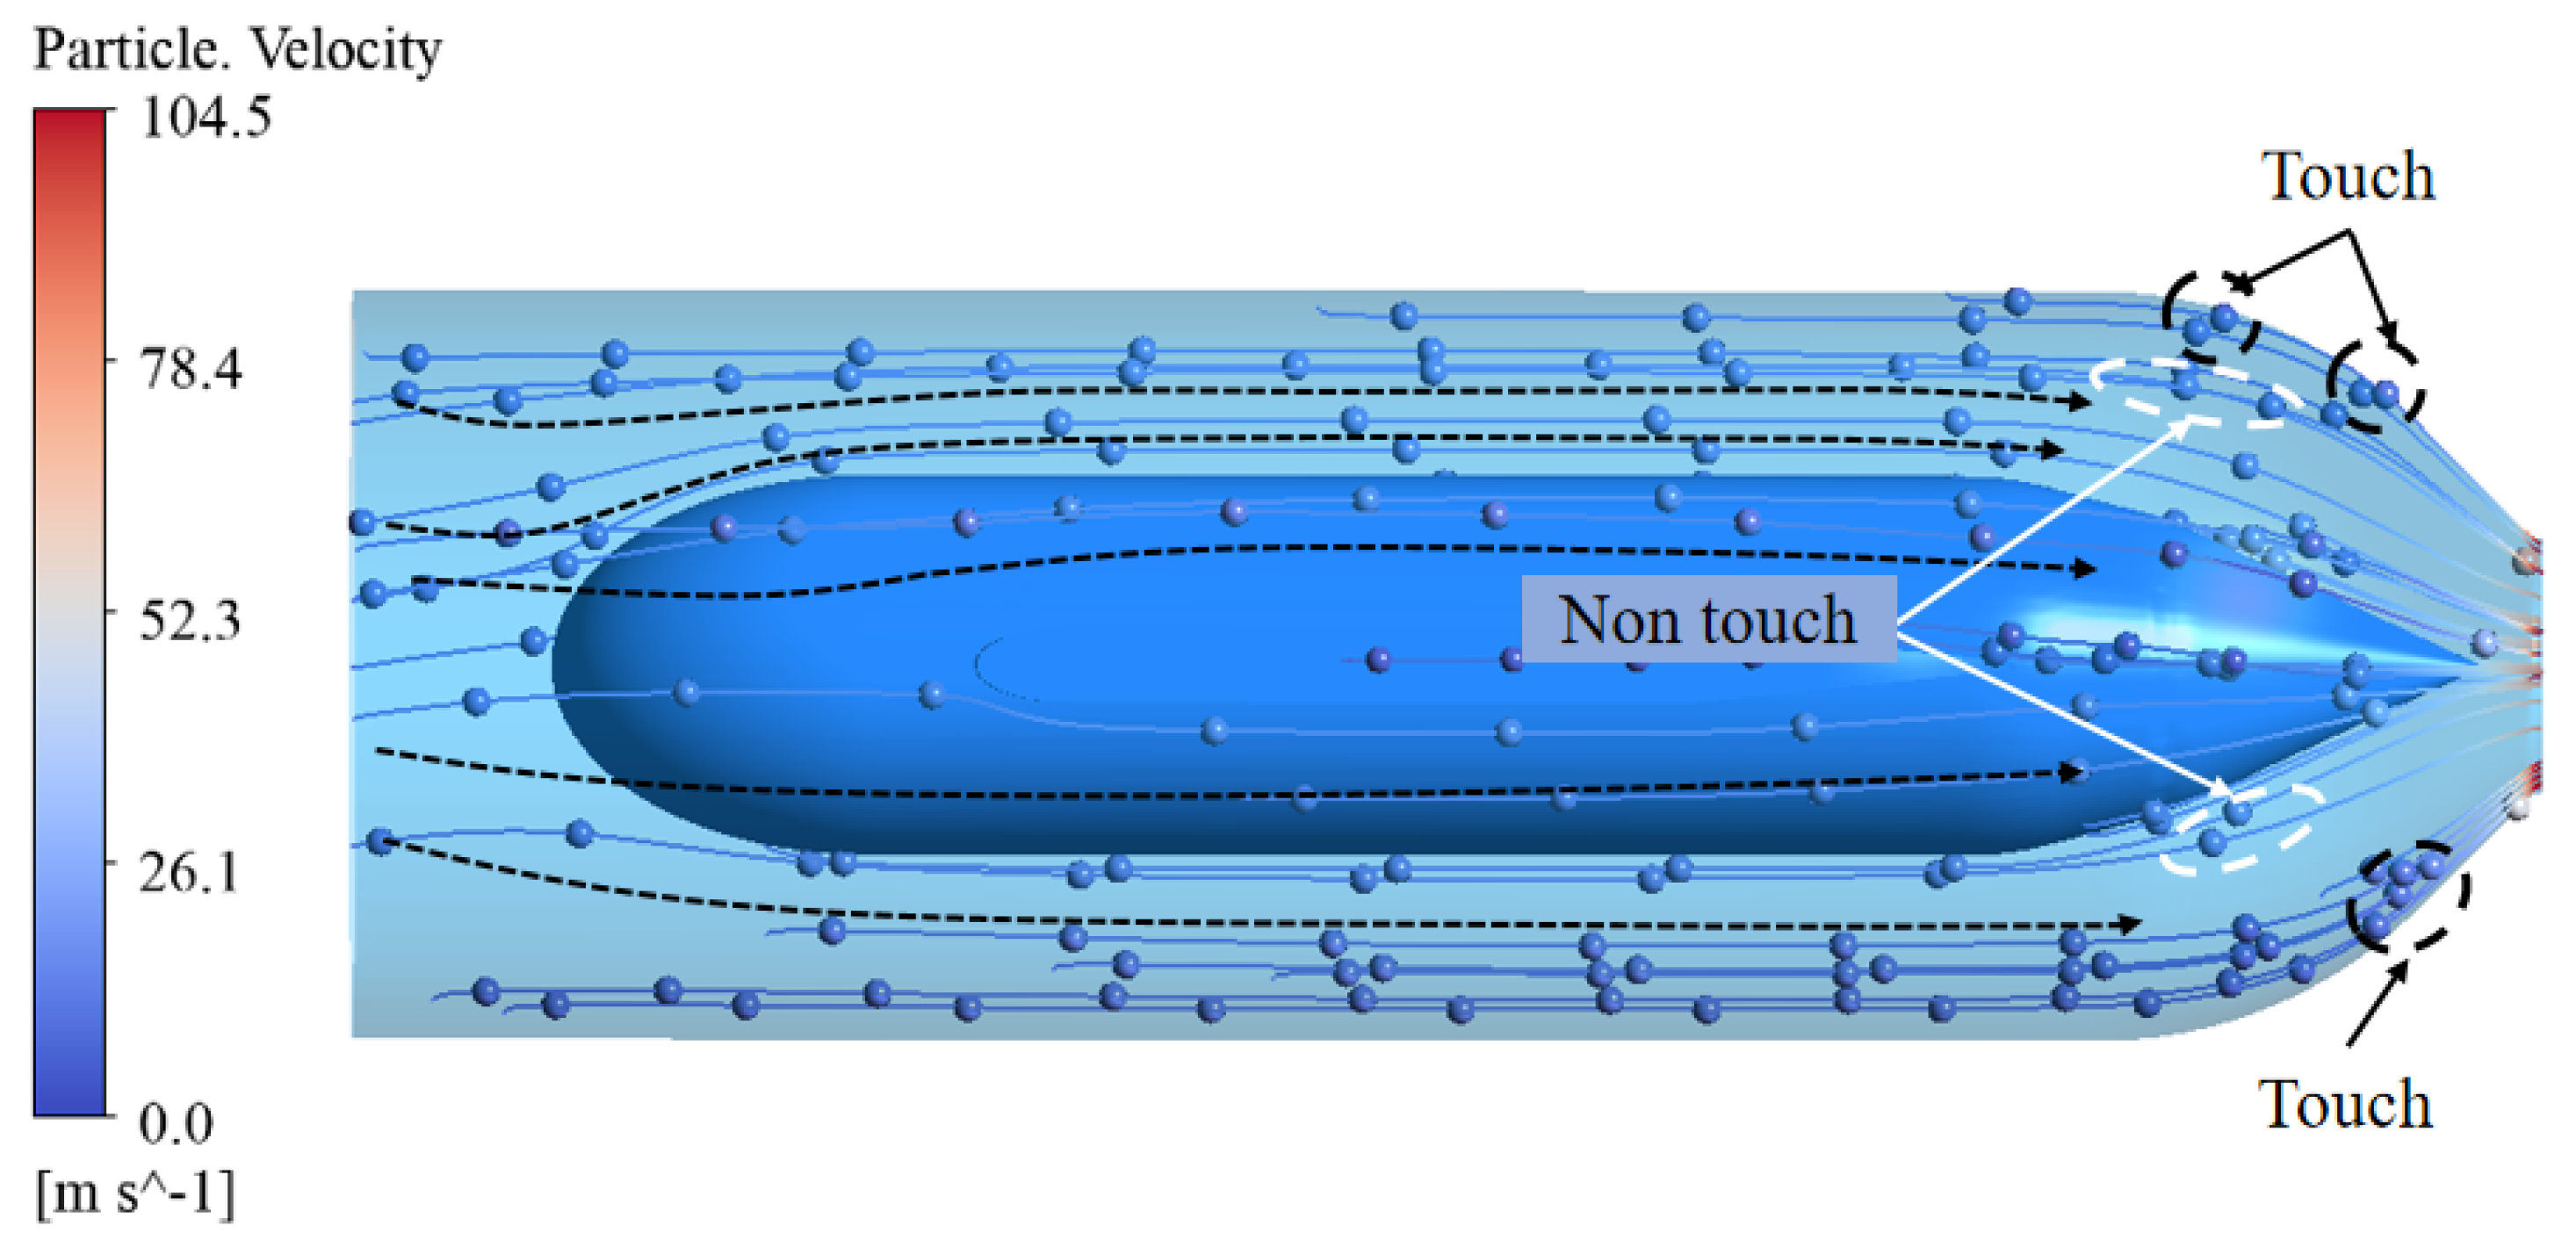
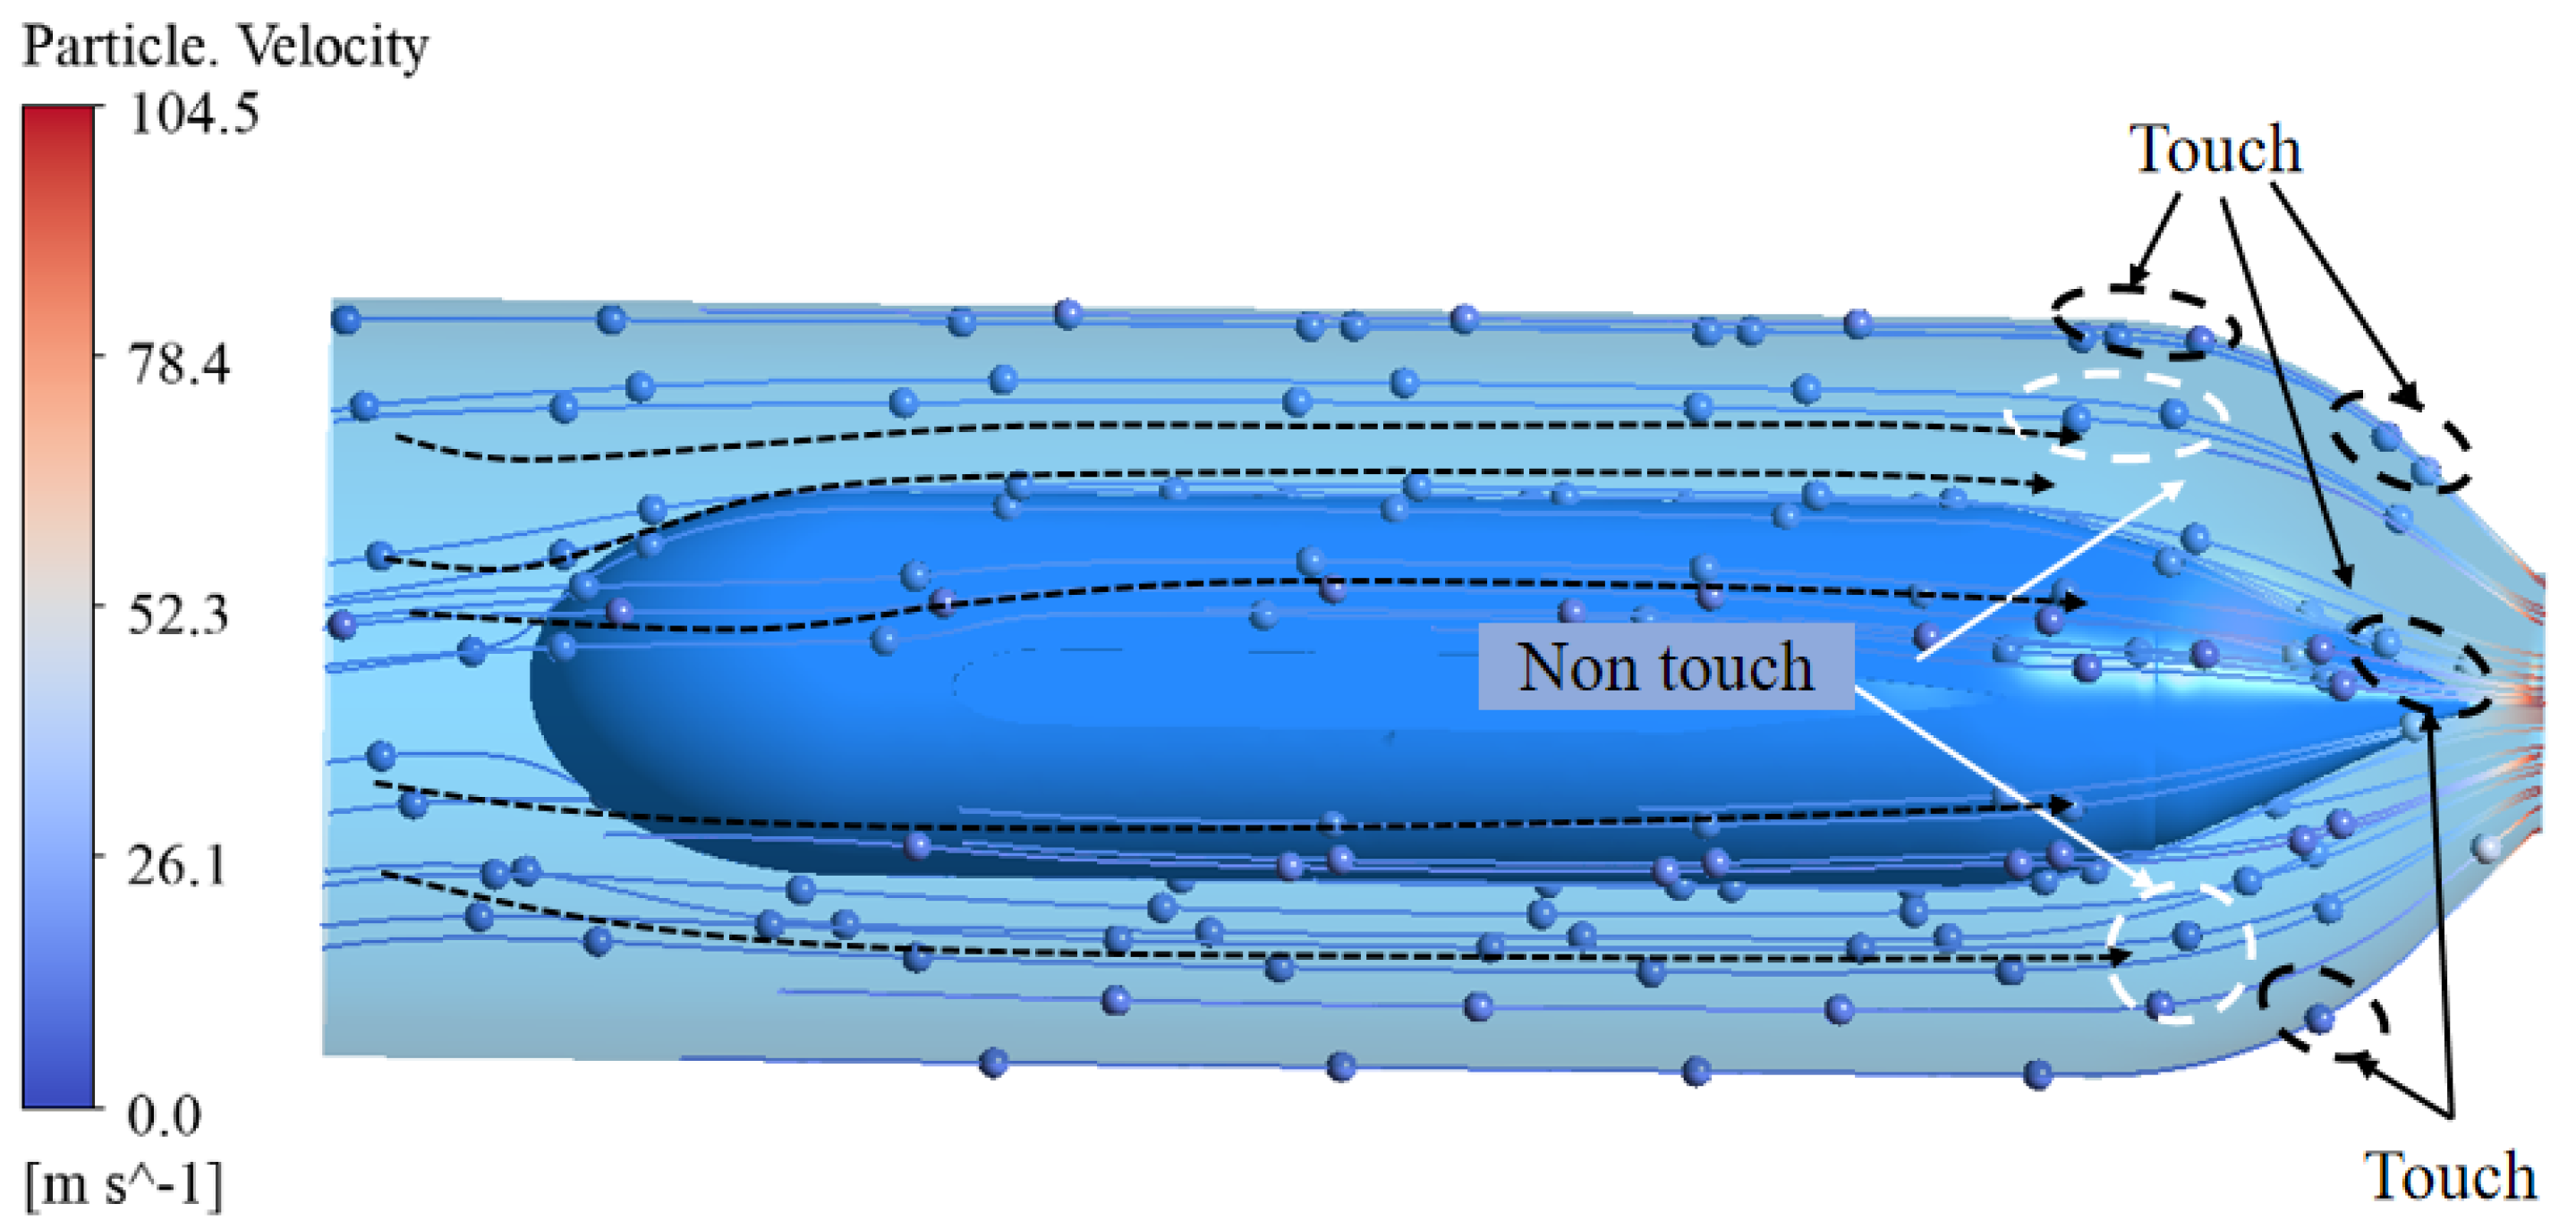
Figure 15, Figure 16 and Figure 17 show the trajectory distribution of sediment particles with different particle sizes. When the particle size is 0.02 mm, the particles basically follow the flow, and the flow is good. The trajectory of the particles almost coincides with the flow line, and some particles move close to the surface of the needle and the inner wall of the nozzle. It can be seen from the figure that due to good fluidity, a large number of particles rub along the surface of the needle tip and the contraction section of the inner wall of the nozzle. As the particle size increases to 0.1 mm, the particle trajectory is more chaotic than that of a small particle size of 0.02 mm. This is because the particle size increases, resulting in a significant increase in inertial force, which weakens the flow characteristics of particles. In this case, some particles move away from the mainstream area, and the contact frequency and contact area with the needle surface and the nozzle inner wall are reduced. When the particle size further increases to 0.3 mm, the motion trajectory of large particles significantly deviates from the jet center area, and a large number of particles break away from the constraint of water flow under the dominant effect of strong inertial force, as shown in the figure. Only a small number of particles are in contact with the inner wall of the nozzle.

3.5. Analysis of Influence of Different Particle Sizes on the Energy Dissipation of Nozzle

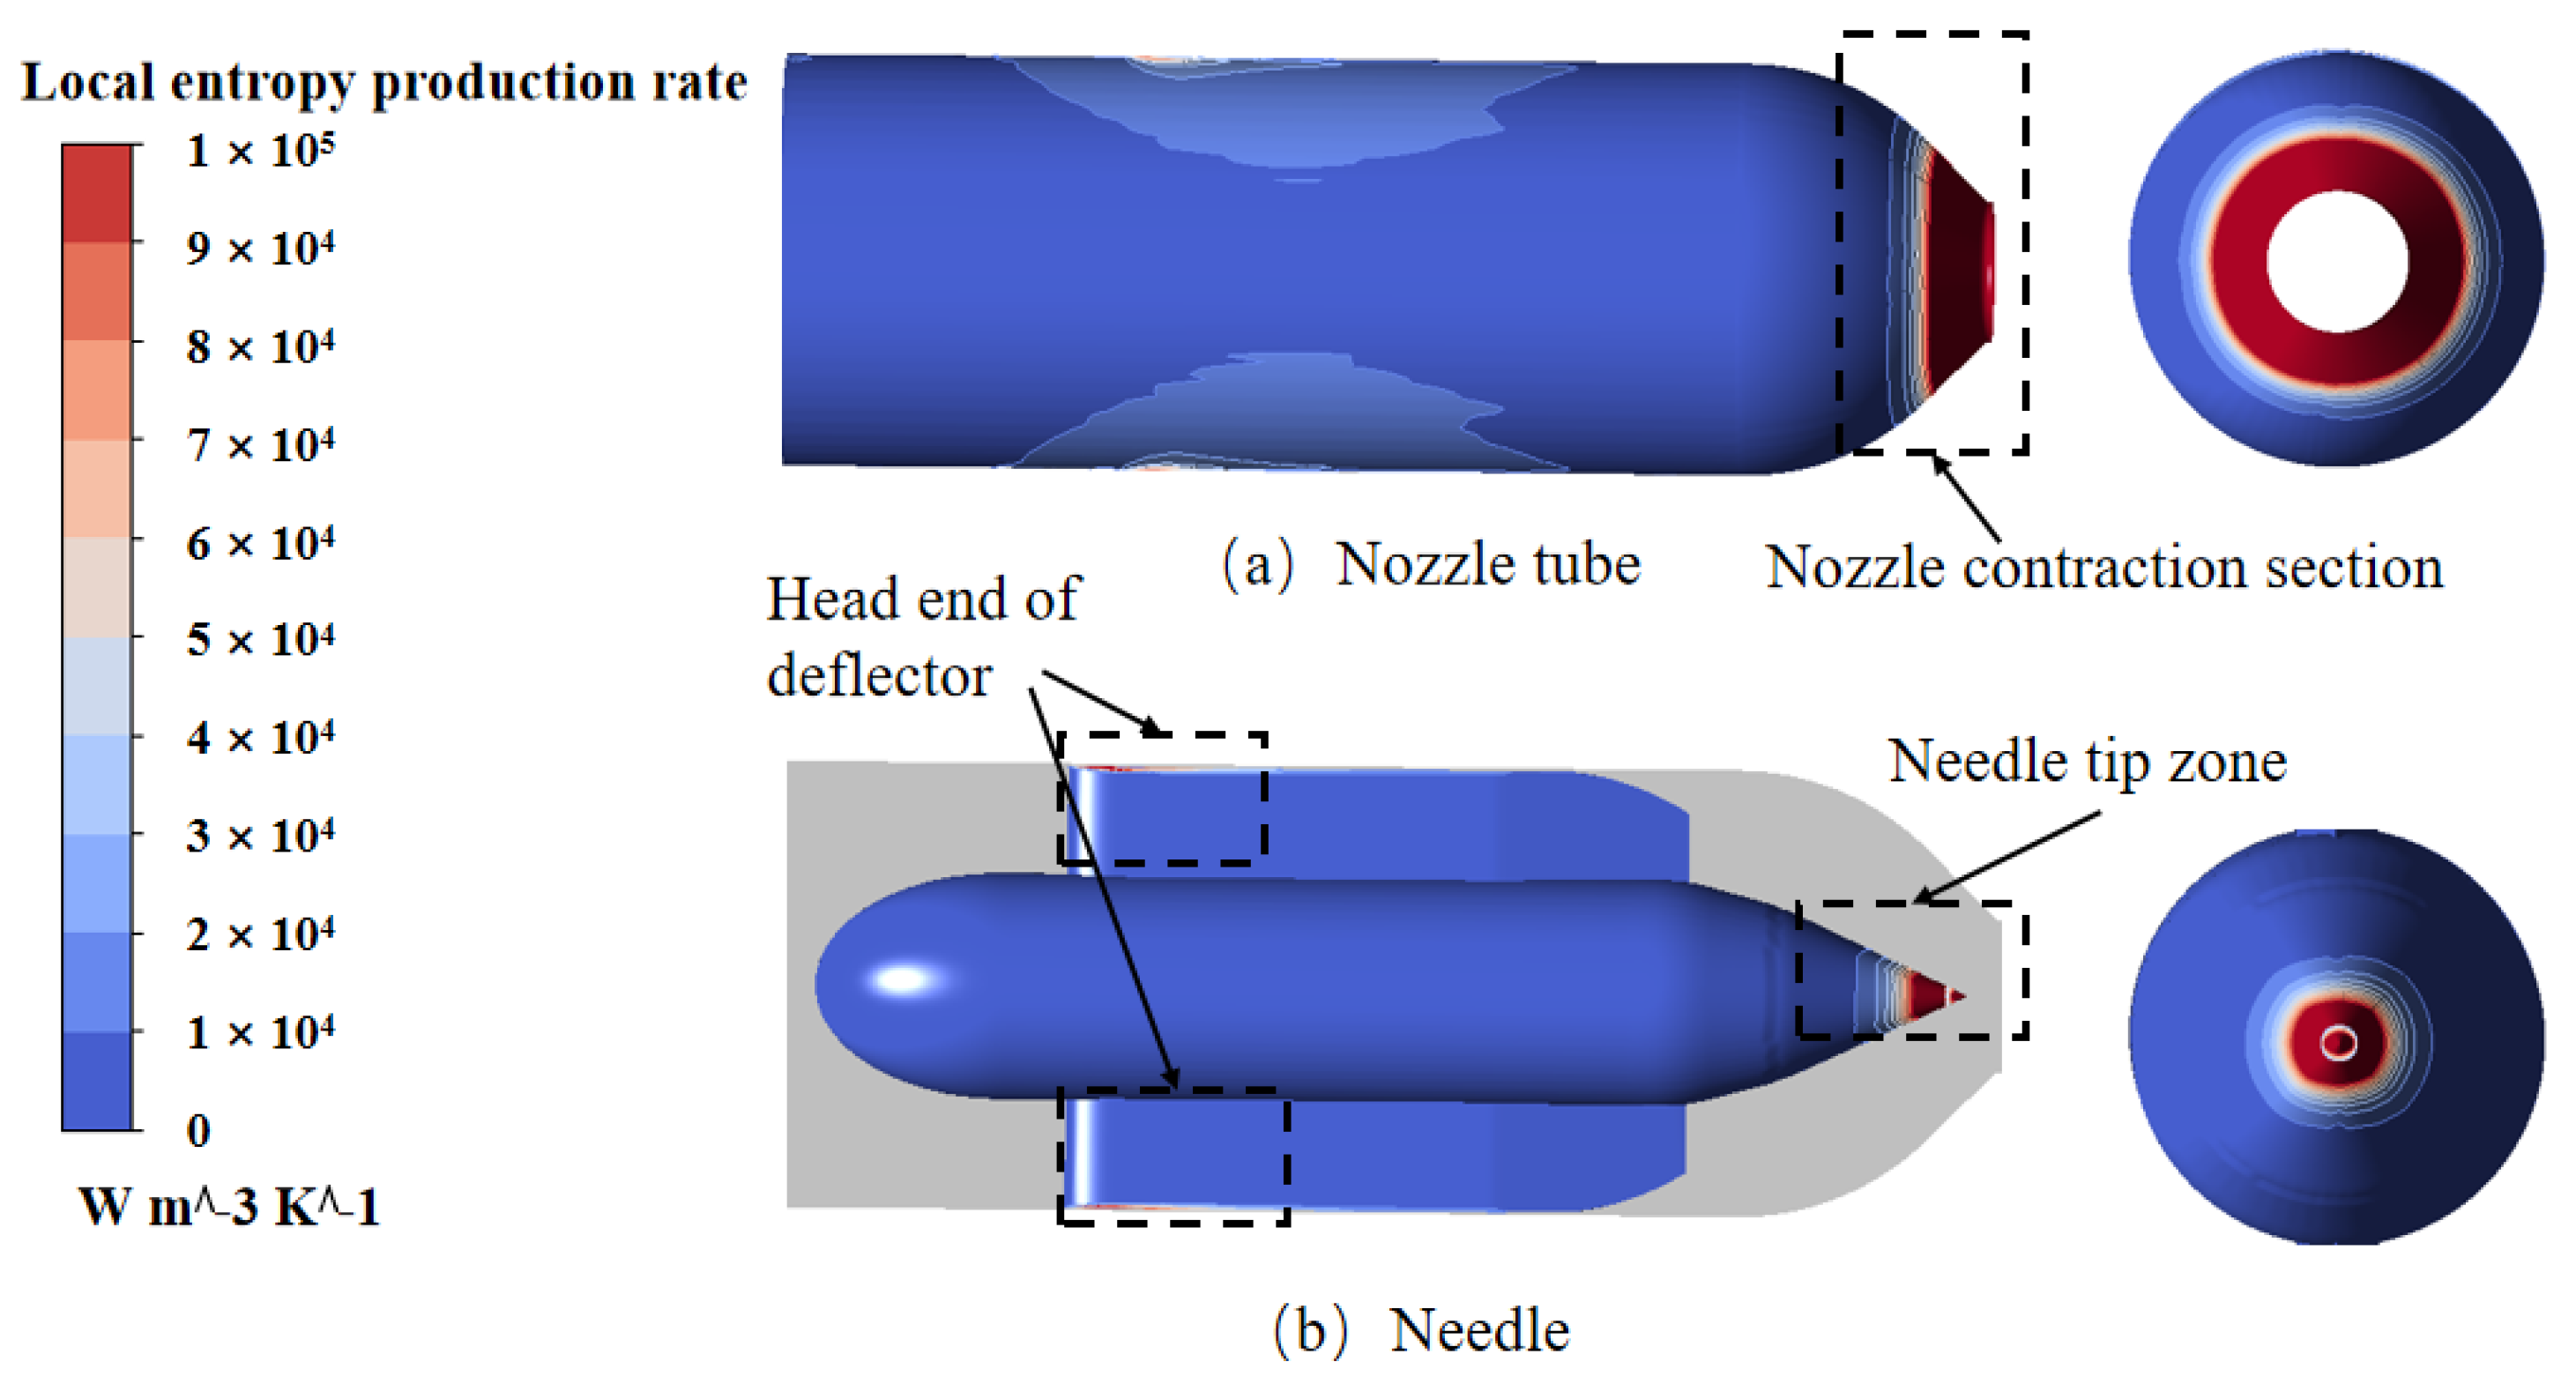
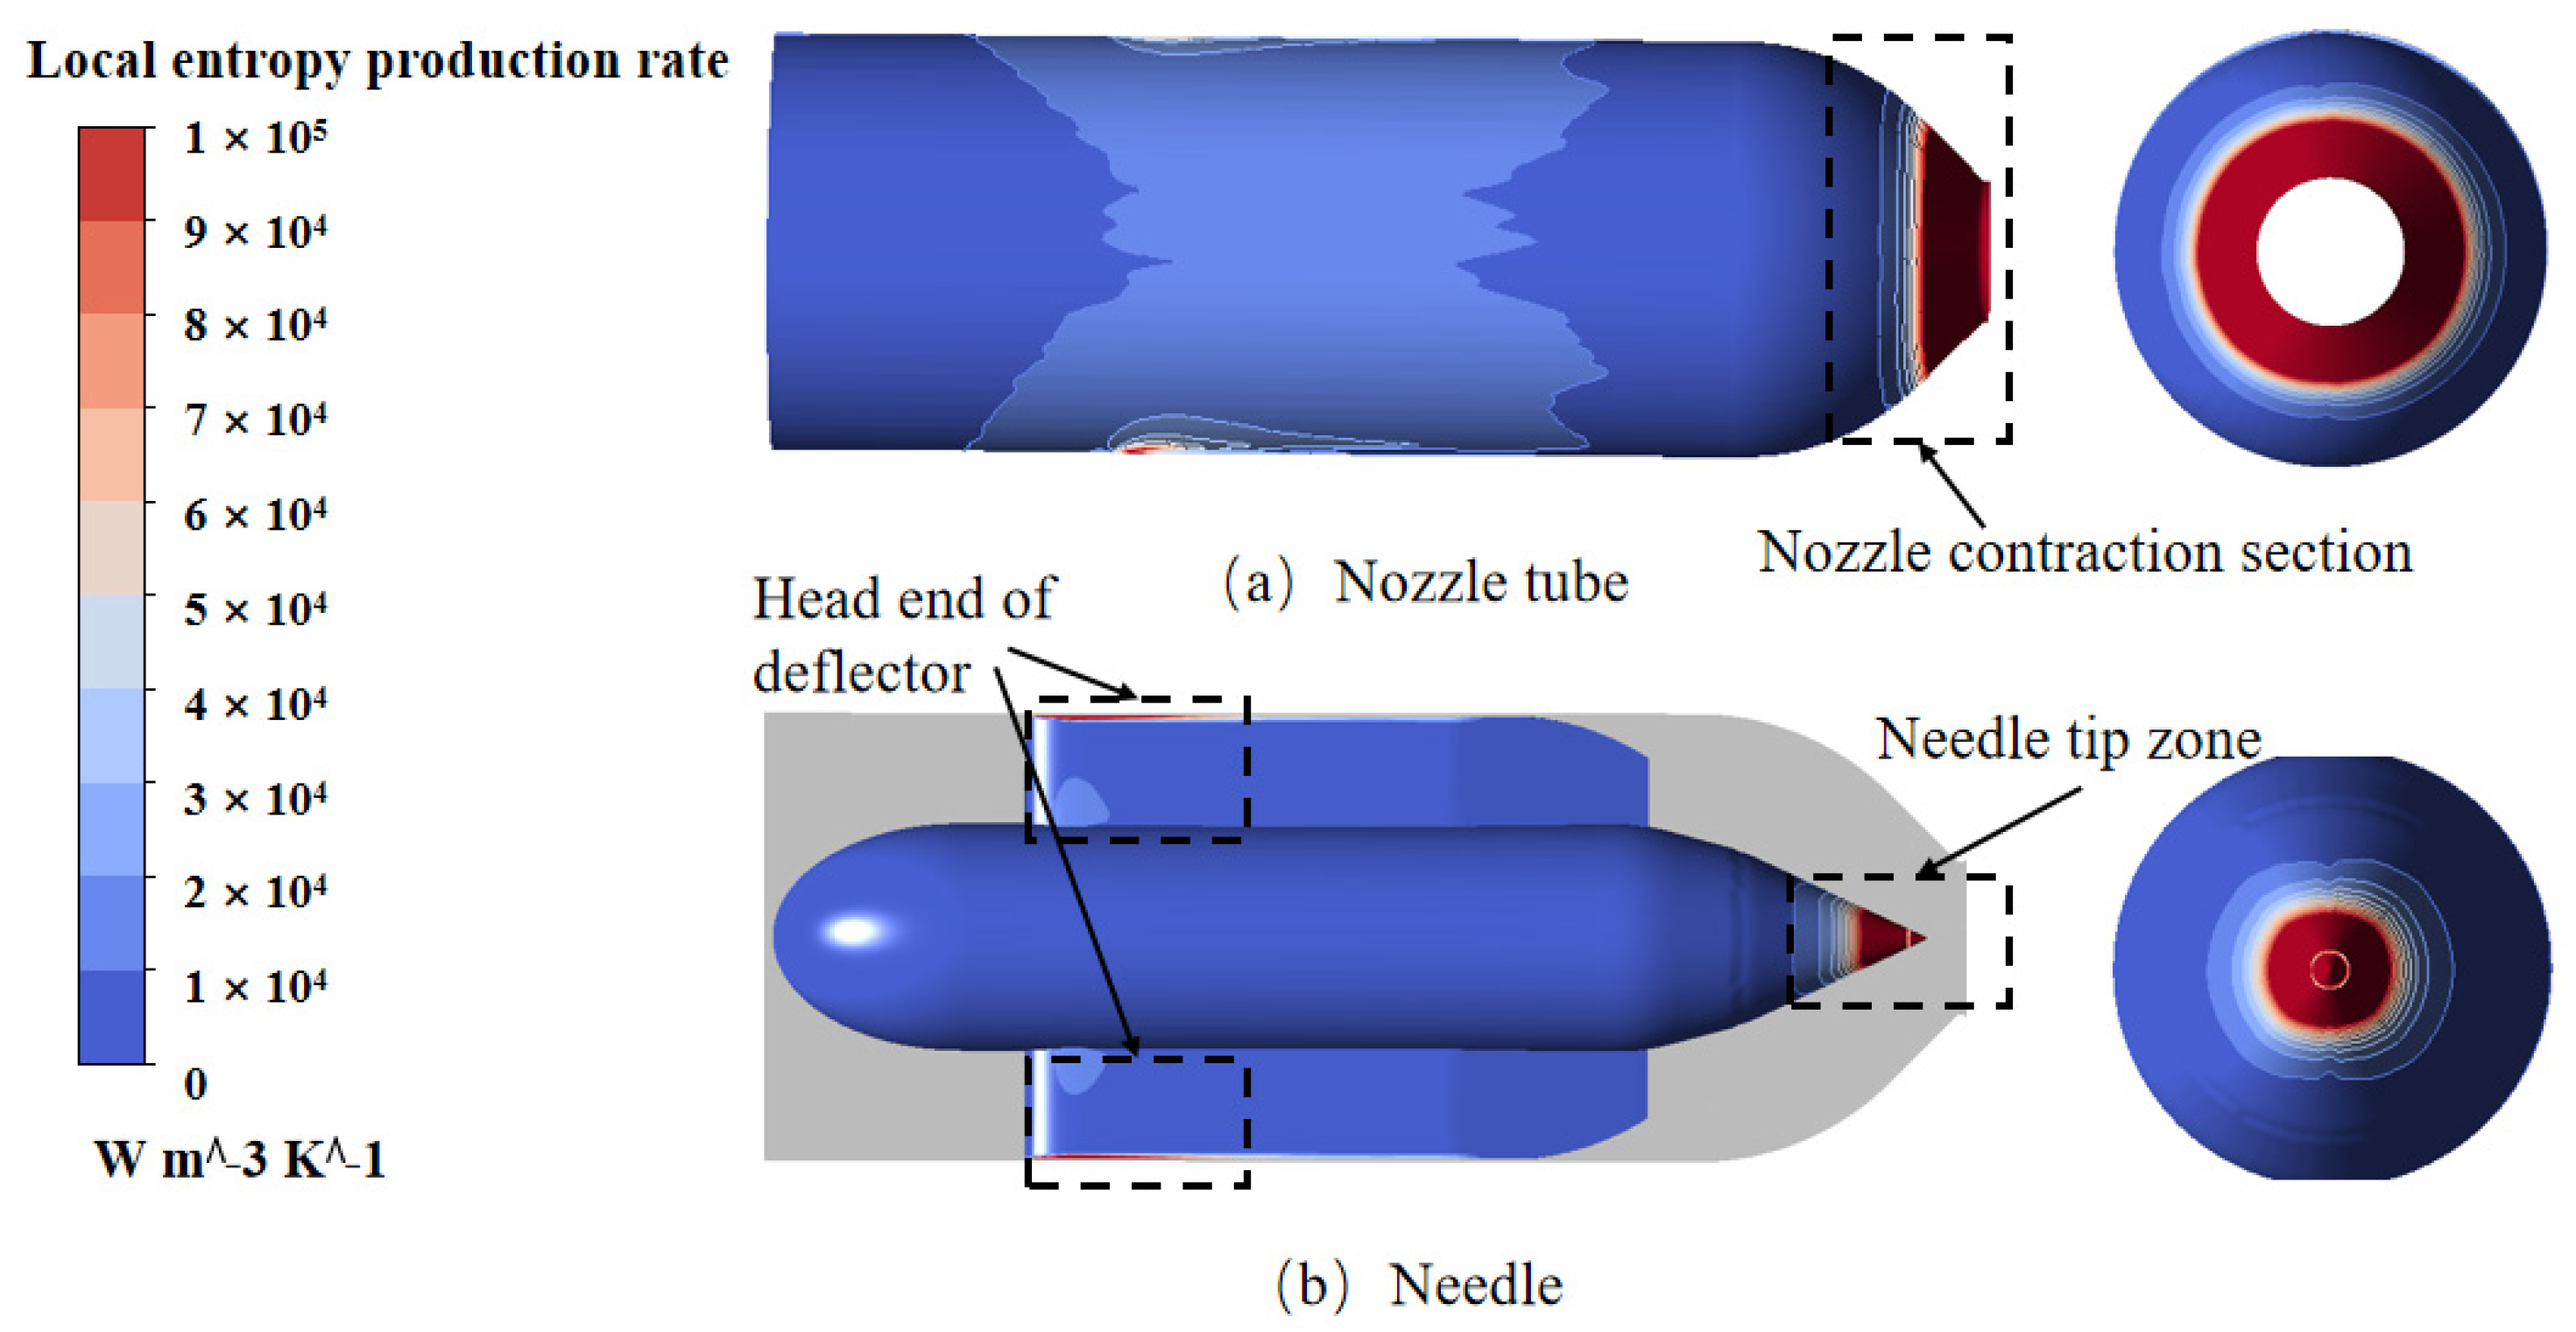
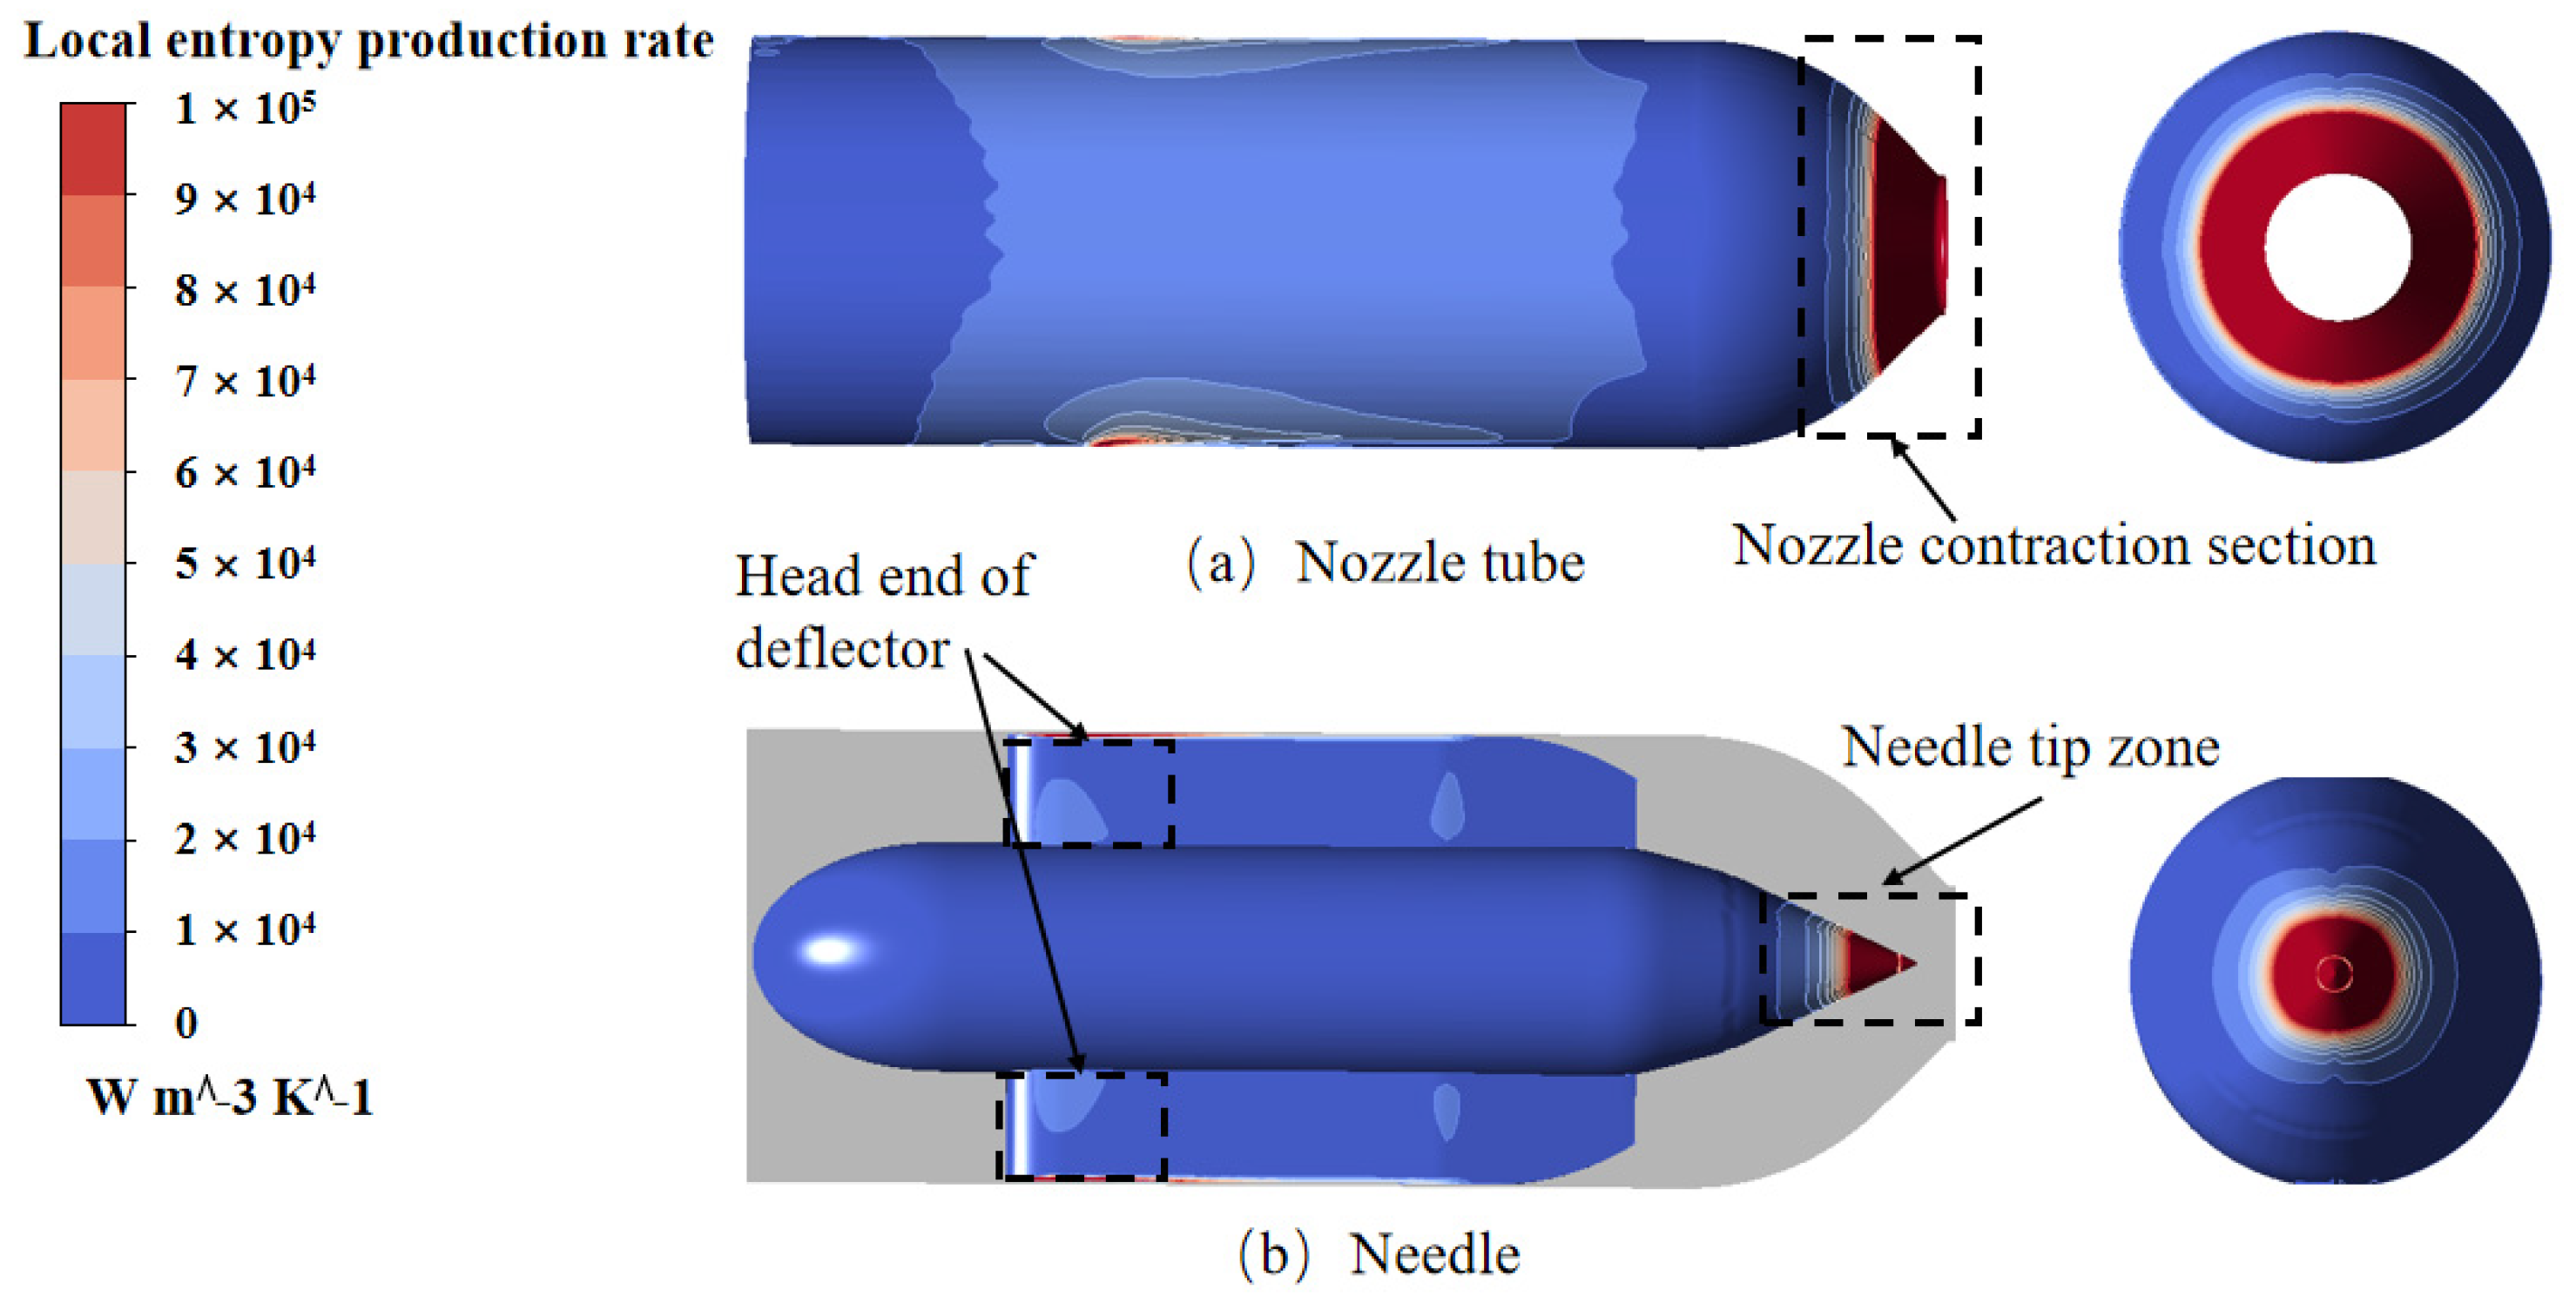
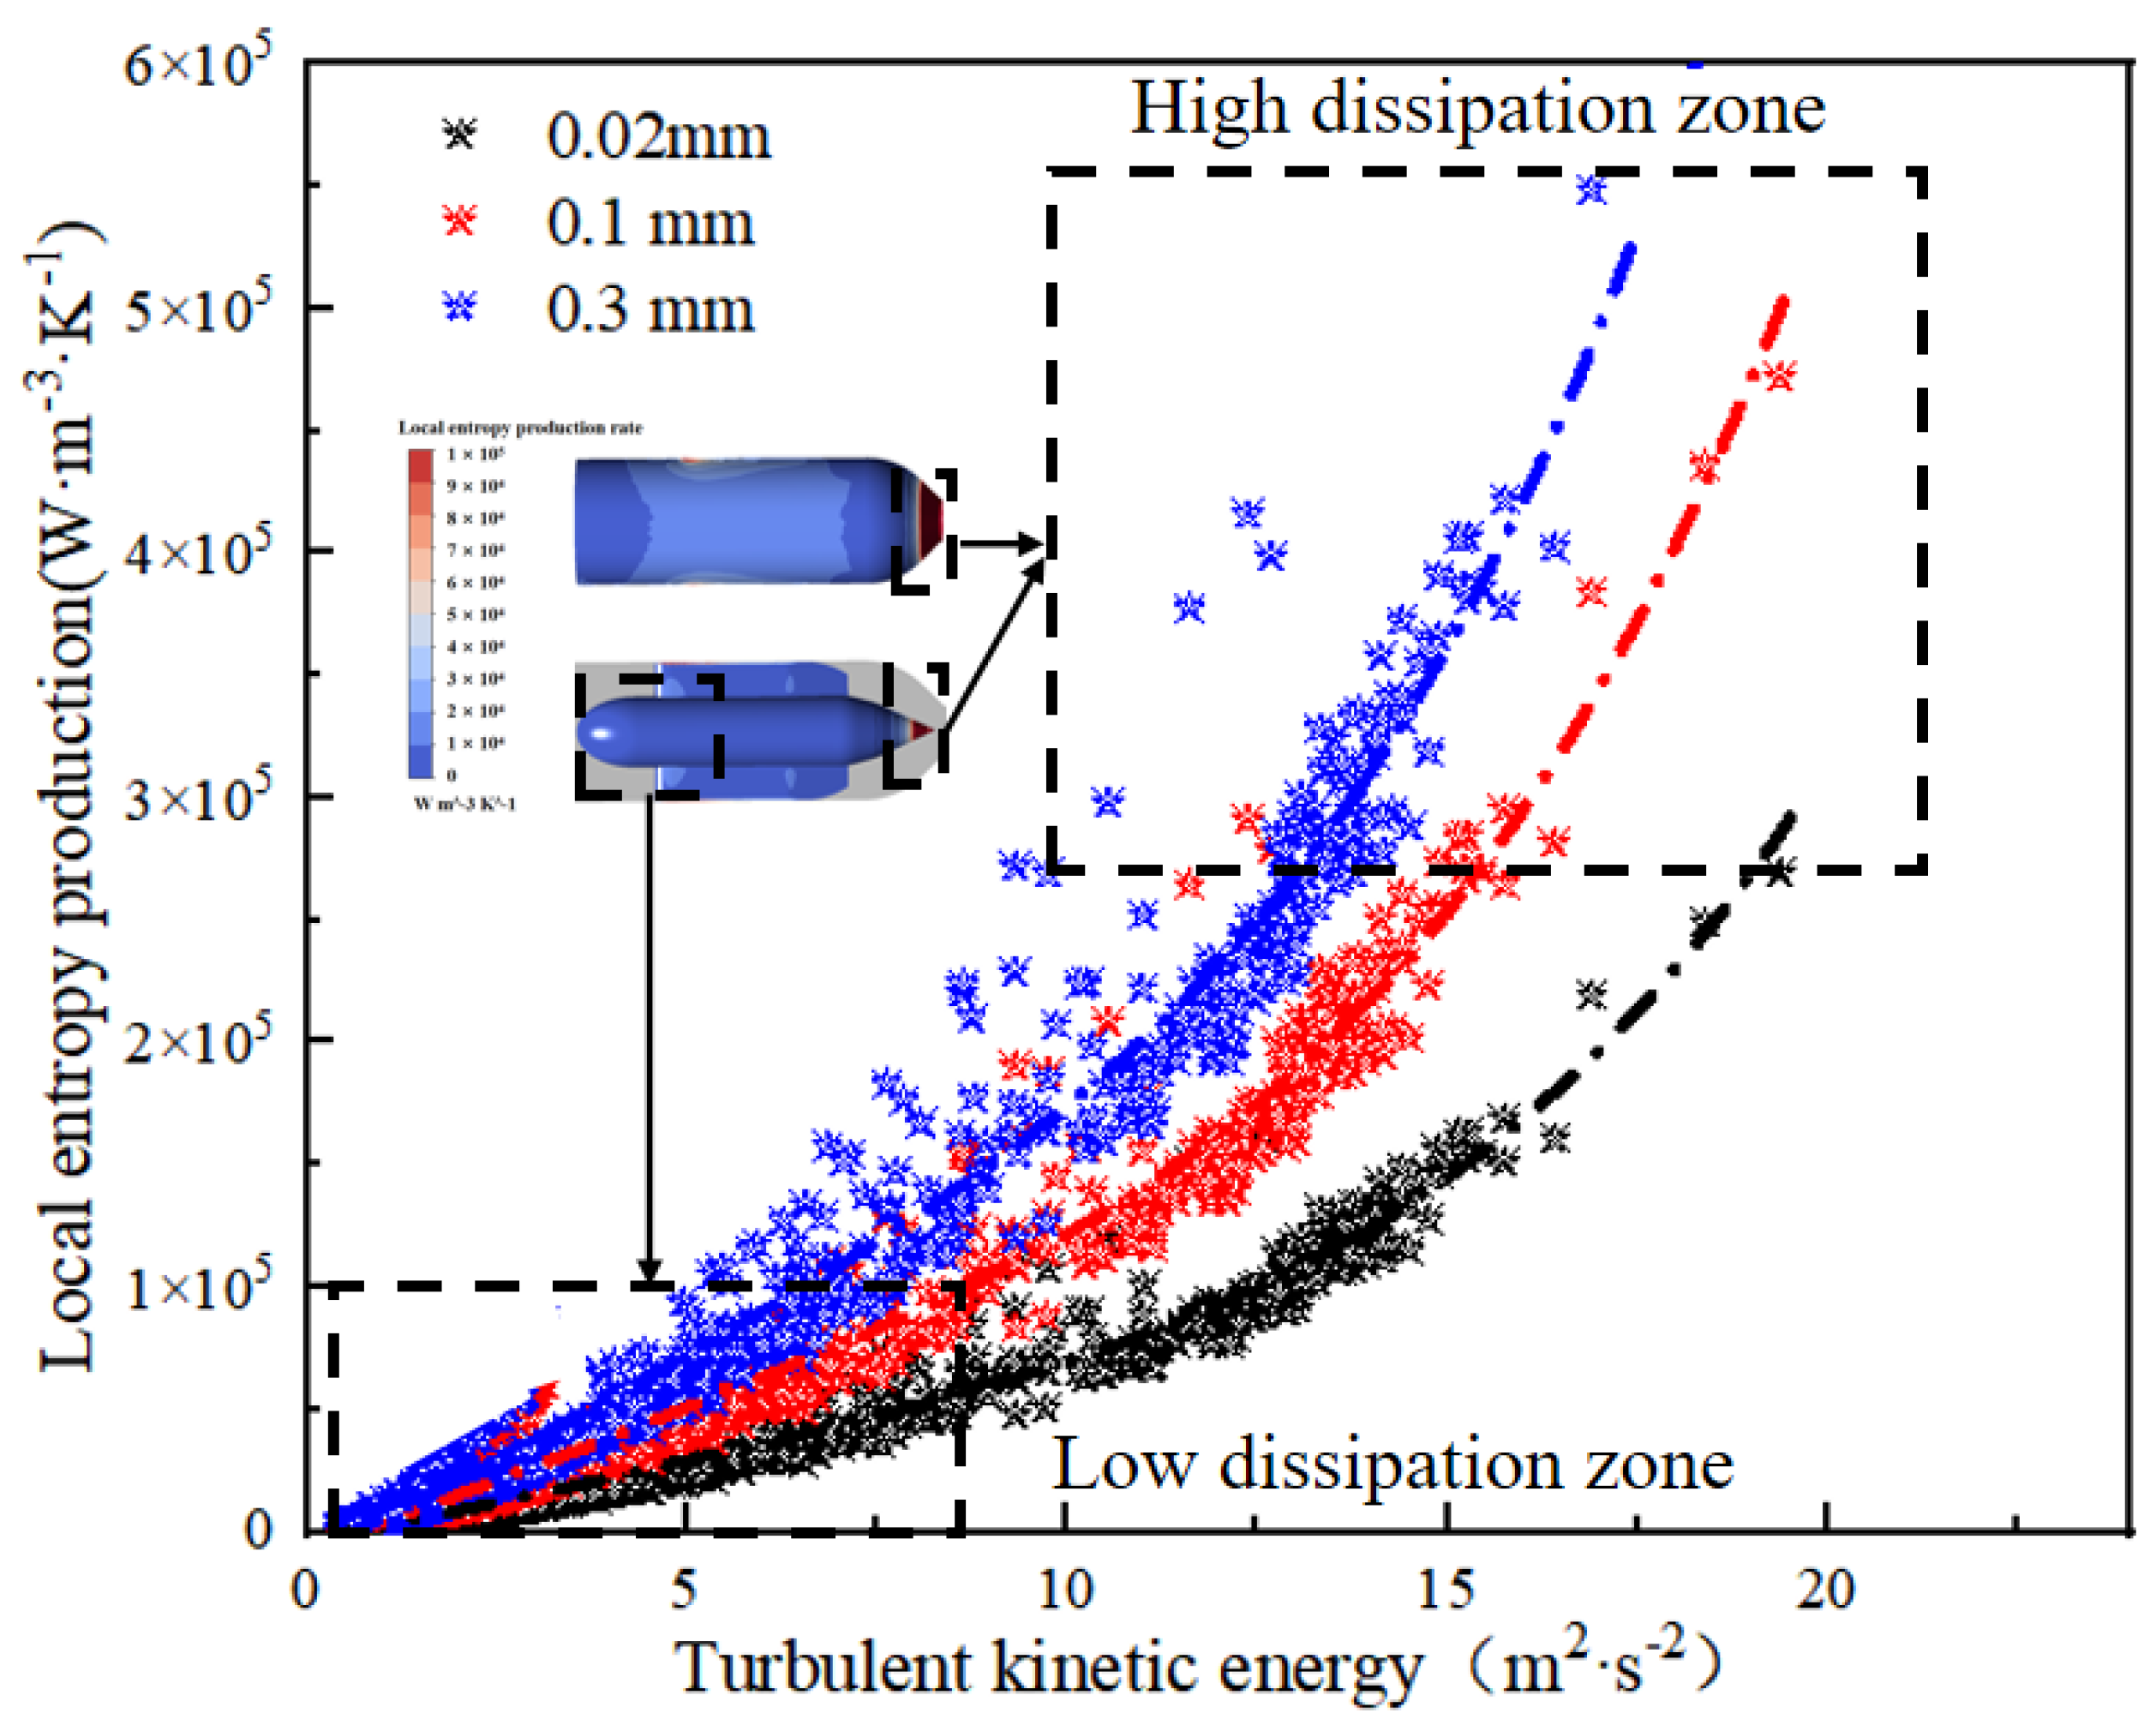
Figure 18, Figure 19 and Figure 20 show the distribution of entropy production rate in the nozzle under different particle sizes. According to the entropy production rate distribution cloud chart, when the particle size is 0.02 mm, the high entropy production area is mainly concentrated in the nozzle contraction section and the tip of the needle. In this area, the jet velocity increases sharply, the turbulence disturbance is significantly enhanced, and the turbulence dissipation is induced, thus forming a local high-value area of entropy production rate. When the particle size increases to 0.1 mm, the distribution range of entropy production in the nozzle tube is significantly expanded, and a small range of entropy production area appears on both sides of the front end of the fluid guide. This is because the water flows out of the nozzle tube and directly impacts the front end of the fluid guide, which further expands the disturbance range of the flow field and promotes the synchronous extension of the high entropy production area. When the particle size is further increased to 0.3 mm, the overall turbulence of the flow field is greatly increased, and the coverage area of the high entropy production area is also rapidly expanded. In conclusion, it can be inferred that there is a significant positive correlation between the turbulence degree of the internal flow pattern and the entropy production rate. The higher the turbulence degree of the flow field, the stronger the energy dissipation effect.
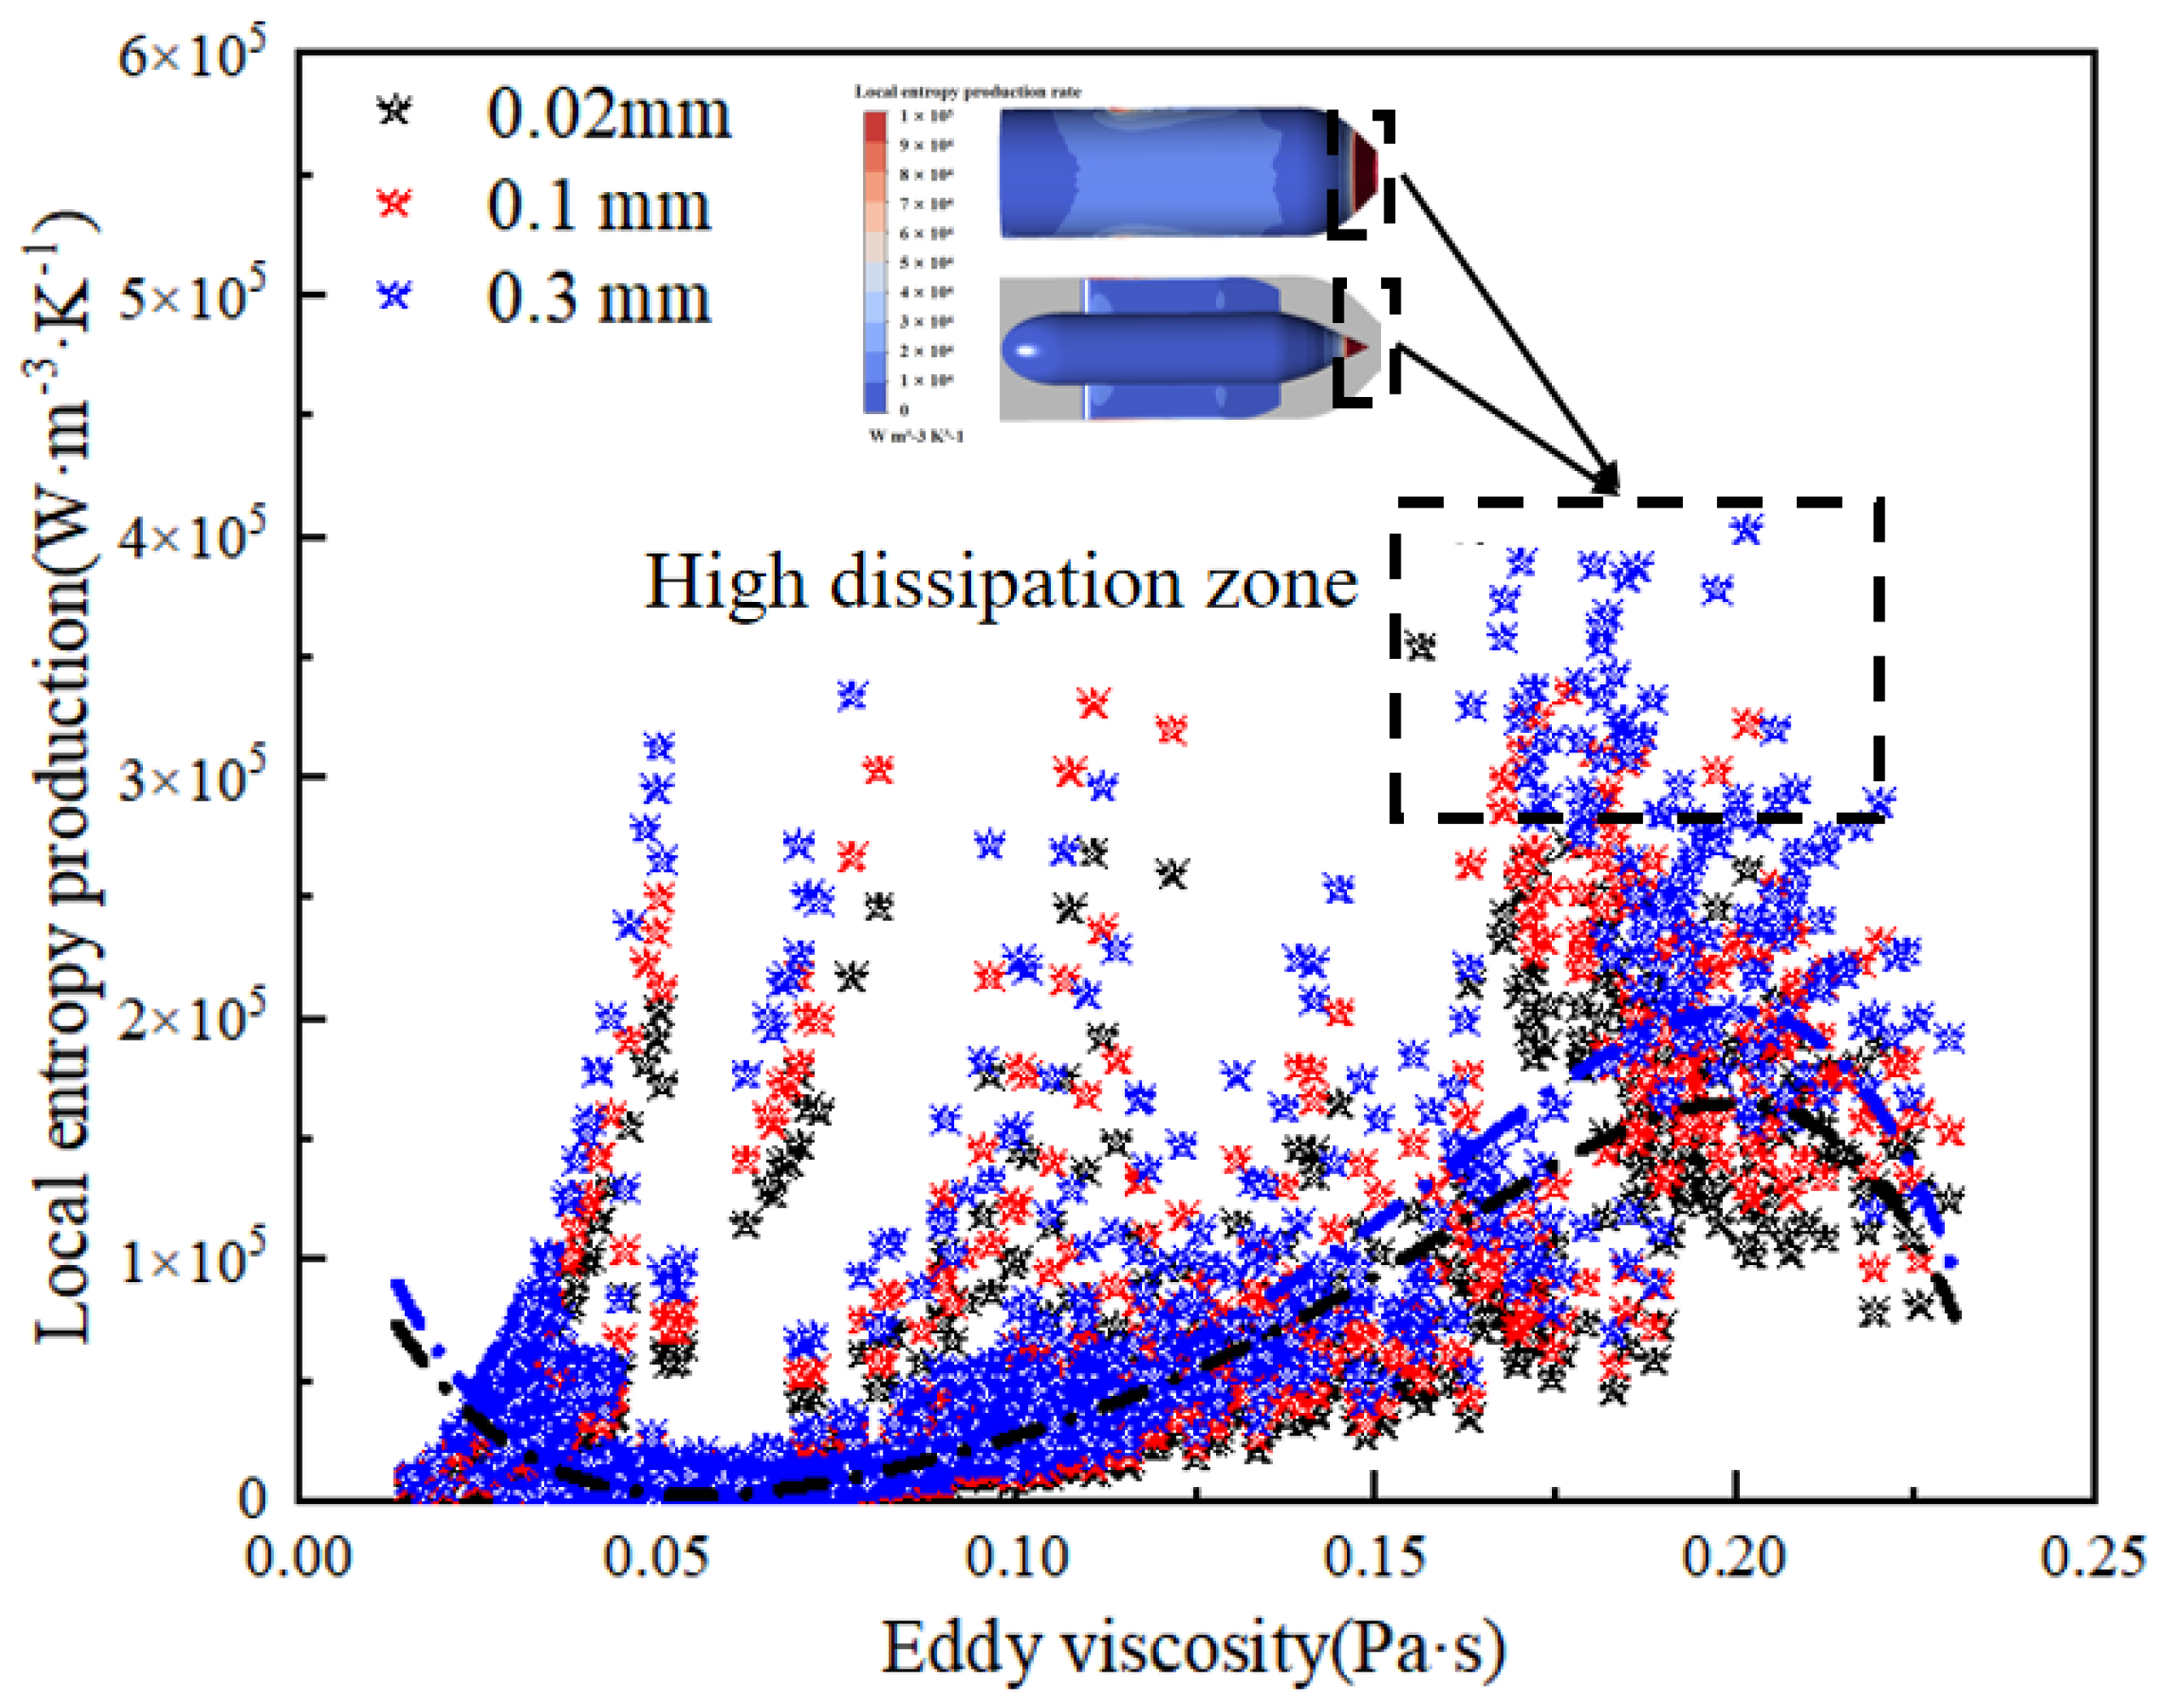
Figure 21 shows the scatter distribution relationship between local entropy production rate and turbulent kinetic energy under different particle sizes. The results show that there is a significant positive correlation between turbulent kinetic energy and entropy production rate. Among them, the high value area of entropy production is mainly concentrated in the turbulent kinetic energy below 10 m2/s2. When the turbulent kinetic energy exceeds 10 m2/s2, the entropy production rate shows a sharp upward trend. The scatter distribution characteristics of local entropy production rate and eddy viscosity under different particle sizes are shown in Figure 22. The overall distribution of data points is relatively uniform, and when the eddy viscosity value is about 0.2 Pa·s, the entropy production rate reaches the peak. In addition, according to the law of scatter diagram, the entropy production rate showed an overall upward trend with the increase in the particle size, which further verified the above conclusion. The larger the particle size, the higher the degree of turbulence in the internal flow field of the nozzle, the more significant the entropy production effect, and the energy consumption level of the system also increases.

4. Conclusions

In this paper, the erosion of the nozzle of a Pelton turbine under different particle sizes is studied, and the effects of different particle sizes on the erosion rate and energy dissipation are explored. The main conclusions are as follows:
(1)
The influence mechanism of different particle sizes on the flow pattern in the nozzle was revealed. The small particle (0.02 mm) has good fluidity, its motion trajectory is almost coincident with the flow streamline, and the flow field velocity distribution in the nozzle is relatively uniform. With the increase in the particle size (0.1 mm, 0.3 mm), the particle inertia force increases. With the deterioration of fluidity, the motion trajectory gradually deviates from the mainstream area, the non-uniformity of the flow field velocity distribution in the nozzle increases, and the degree of flow state disorder increases significantly.
(2)
Based on the entropy production theory, the influence of different particle sizes on the internal energy dissipation of the nozzle was analyzed. There is a positive correlation between the degree of flow field turbulence and entropy production rate. The larger the particle size is, the more severe the flow field turbulence is. The higher the entropy production rate is, the stronger the energy dissipation is. The high entropy production area is mainly concentrated in the nozzle contraction section and the tip of the needle. With the increase in the particle size, the range of high entropy production area shows an expanding trend. In addition, when the turbulent kinetic energy exceeds 10 m2/s2, the entropy production rate will show the characteristics of rapid rise.
(3)
The influence of different particle sizes on the internal erosion of the nozzle was clarified. The research shows that the erosion inside the nozzle is dominated by the particle size, and the smaller the particle size, the more serious the overall erosion is. This is because the smaller the particle size, the higher the contact frequency between the sediment particles and the wall, and the more significant the overall erosion is. The results show that the entropy production rate is significantly negatively correlated with the erosion rate, and friction erosion is dominant on the surface of the nozzle, while impact erosion is dominant on the inner wall of the nozzle.

Author Contributions

Conceptualization, X.S.; methodology, Y.L.; software, X.S.; formal analysis, X.S.; investigation, X.S.; resources, L.G.; data curation, L.G.; writing—review and editing, X.S.; supervision, writing—original draft preparation H.B.; funding acquisition, validation Z.W. All authors have read and agreed to the published version of the manuscript.

Funding

This research was supported by the National Key Research and Development Program of China (2023YFB3408400).

Data Availability Statement

The data that support the findings of this study are available from the corresponding author upon reasonable request.

Conflicts of Interest

Author Lianheng Guo was employed by the Datang Xizang Energy Development Co., Ltd. Author Yongxin Liu was employed by the Harbin Electric Machinery Co., Ltd. The remaining authors declare that the research was conducted in the absence of any commercial or financial relationships that could be construed as a potential conflict of interest.

References

  1. Li, W.; Liu, M.J.; Ji, L.L.; Li, S.; Song, R.; Wang, C.; Cao, W.; Agarwal, R.K. Study on the trajectory of tip leakage vortex and energy characteristics of mixed-flow pump under cavitation conditions. Ocean Eng. 2023, 267, 113225. [Google Scholar] [CrossRef]
  2. Wang, D.X.; Wang, X.; Hu, D.S.; Wang, W.-Q.; Yan, Y. Study on the hydrodynamic characteristics of a six-nozzle ultra-large capacity Pelton turbine during the switching of the operating nozzles. Energy 2026, 347, 140328. [Google Scholar] [CrossRef]
  3. Aggidis, G.; Zidonis, A.; Burtenshaw, L.; Dubois, M.; Orritt, S.; Pickston, D.; Prigov, G.; Wilmot, L. Development of a Novel High Head Impulse Hydro Turbine. Sustainability 2024, 16, 253. [Google Scholar] [CrossRef]
  4. Fahrni, F.; Staubli, T.; Casartelli, E. Efficiency Testing of Pelton Turbines with Artificial Defects—Part 2: Needles and Seat Rings. Energies 2025, 18, 2725. [Google Scholar] [CrossRef]
  5. Din, M.Z.U.; Harmain, G.A. Assessment of erosive wear of Pelton turbine injector: Nozzle and spear combination—A study of Chenani hydro-power plant. Eng. Fail. Anal. 2020, 116, 104695. [Google Scholar] [CrossRef]
  6. Alomar, O.R.; Maher, A.; Salih, M.M.M.; Ali, F.A. Performance analysis of Pelton turbine under different operating conditions: An experimental study. Ain Shams Eng. J. 2022, 13, 101684. [Google Scholar] [CrossRef]
  7. Liu, J.T.; Liu, X.B.; Chang, X.; Qin, B.; Pang, J.; Lai, Z.; Jiang, D.; Qin, M.; Yao, B.; Zeng, Y. Research on the mechanism of sediment erosion in the bucket of a large-scale Pelton turbine at a hydropower station. Powder Technol. 2025, 455, 120805. [Google Scholar] [CrossRef]
  8. Zeng, C.J.; Xiao, Y.X.; Luo, Y.Y.; Zhang, J.; Wang, Z.; Fan, H.; Ahn, S.-H. Hydraulic performance prediction of a prototype four-nozzle Pelton turbine by entire flow path simulation. Renew. Energy 2018, 125, 270–282. [Google Scholar] [CrossRef]
  9. Zeng, C.J.; Xiao, Y.X.; Wang, Z.W.; Zhang, J.; Luo, Y. Numerical analysis of a Pelton bucket free surface sheet flow and dynamic performance affected by operating head. Proc. Inst. Mech. Eng. Part A-J. Power Energy 2017, 231, 182–196. [Google Scholar] [CrossRef]
  10. Petley, S.; Zidonis, A.; Panagiotopoulos, A.; Benzon, D.; Aggidis, G.A.; Anagnostopoulos, J.S.; Papantonis, D.E. Out With the Old, in With the New: Pelton Hydro Turbine Performance Influence Utilizing Three Different Injector Geometries. J. Fluids Eng. -Trans. Asme 2019, 141, 081103. [Google Scholar] [CrossRef]
  11. Rai, A.K.; Kumar, A.; Staubli, T. Analytical modelling and mechanism of hydro-abrasive erosion in pelton buckets. Wear 2019, 436, 203003. [Google Scholar] [CrossRef]
  12. Rai, A.K.; Kumar, A.; Staubli, T. Effect of concentration and size of sediments on hydro-abrasive erosion of Pelton turbine. Renew. Energy 2020, 145, 893–902. [Google Scholar] [CrossRef]
  13. Guo, B.; Xiao, Y.X.; Rai, A.K.; Zhang, J.; Liang, Q. Sediment-laden flow and erosion modeling in a Pelton turbine injector. Renew. Energy 2020, 162, 30–42. [Google Scholar] [CrossRef]
  14. Gautam, S.; Neopane, H.P.; Acharya, N.; Chitrakar, S.; Thapa, B.S.; Zhu, B. Sediment erosion in low specific speed francis turbines: A case study on effects and causes. Wear 2020, 442–443, 203152. [Google Scholar] [CrossRef]
  15. Han, W.; Kang, J.; Wang, J.; Peng, G.; Li, L.; Su, M. Erosion estimation of guide vane end clearance in hydraulic turbines with sediment water flow. Mod. Phys. Lett. B 2018, 32, 1850100. [Google Scholar] [CrossRef]
  16. Pang, J.; Liu, H.; Liu, X.; Yang, H.; Peng, Y.; Zeng, Y.; Yu, Z. Study on sediment erosion of high head Francis turbine runner in Minjiang River basin. Renew. Energy 2022, 192, 849–858. [Google Scholar] [CrossRef]
  17. Xu, Z.; Zheng, Y.; Kan, K.; Chen, H. Flow instability and energy performance of a coastal axial-flow pump as turbine under the influence of upstream waves. Energy 2023, 272, 127121. [Google Scholar] [CrossRef]
  18. Cai, L.; Li, Z.G.; Wang, K.; Qin, J.; Li, X. Numerical analysis on abrasion of jet mechanism of Pelton turbine. J. Drain. Irrig. Mech. Eng. 2026, 1–12. [Google Scholar]
  19. Liu, B.Q.; Yang, W.; Li, S.E.; Huang, X. A nonlinear partially-averaged Navier-Stokes model with near-wall correction for separated turbulent flow. Mod. Phys. Lett. B 2021, 35, 2150262. [Google Scholar] [CrossRef]
  20. Chen, B.N.; Jin, Y.; Xue, Y.; Liang, H.; Tang, F. Prediction of Component Erosion in a Francis Turbine Based on Sediment Particle Size. Machines 2025, 13, 1030. [Google Scholar] [CrossRef]
  21. Yang, F.; Li, Z.B.; Hu, W.Z.; Liu, C.; Jiang, D.; Liu, D.; Nasr, A. Analysis of flow loss characteristics of slanted axial-flow pump device based on entropy production theory. R. Soc. Open Sci. 2022, 9, 211208. [Google Scholar] [CrossRef] [PubMed]
  22. Yu, A.; Tang, Y.B.; Tang, Q.H.; Cai, J.; Zhao, L.; Ge, X. Energy analysis of Francis turbine for various mass flow rate conditions based on entropy production theory. Renew. Energy 2022, 183, 447–458. [Google Scholar] [CrossRef]
  23. Bejan, A. Entropy production through heat and fluid flow. J. Appl. Mech. 1983, 50, 475. [Google Scholar] [CrossRef]
  24. Guo, T.; Liu, S.Y.; Hu, X.J.; Luo, Z.M. Physics of secondary flow phenomenon and erosion characteristics in the injector of a Pelton turbine. Eng. Appl. Comput. Fluid Mech. 2025, 19, 2479700. [Google Scholar] [CrossRef]
  25. Celik, I.B.; Ghia, U.; Roache, P.J.; Freitas, C.J.; Coleman, H.; Raad, P.E. Procedure for Estimation and Reporting of Uncertainty Due to Discretization in CFD Applications. J. Fluids Eng. 2008, 130, 078001. [Google Scholar] [CrossRef]
  26. Liu, J.; Pang, J.; Liu, X.; Huang, Y.; Deng, H. Analysis of Sediment and Water Flow and Erosion Characteristics of Large Pelton Turbine Injector. Processes 2023, 11, 1011. [Google Scholar] [CrossRef]
Figure 1. 3-D model of Pelton turbine.
Energies 19 02800 g001
Figure 2. Mesh of Pelton turbine components.
Energies 19 02800 g002
Figure 3. Mesh independence study of the calculation model.
Energies 19 02800 g003
Figure 4. The overall flow state and wear rate distribution of the hydraulic turbine.
Energies 19 02800 g004
Figure 5. The specific positions of each section.
Energies 19 02800 g005
Figure 6. Flow in nozzle with 0.02 mm particle size.
Energies 19 02800 g006
Figure 7. Flow in nozzle with 0.1 mm particle size.
Energies 19 02800 g007
Figure 8. Flow in nozzle with 0.3 mm particle size.
Energies 19 02800 g008
Figure 9. Quantitative analysis of erosion rate and turbulent kinetic energy.
Energies 19 02800 g009
Figure 10. Erosion distribution in nozzle with 0.02 mm particle size.
Energies 19 02800 g010
Figure 11. Erosion distribution in nozzle with 0.1 mm particle size.
Energies 19 02800 g011
Figure 12. Erosion distribution in nozzle with 0.3 mm particle size.
Energies 19 02800 g012
Figure 13. Quantitative analysis of erosion rate and particle velocity.
Energies 19 02800 g013
Figure 14. Quantitative analysis of erosion rate and impact angle.
Energies 19 02800 g014
Figure 15. Analysis of particle flow in nozzle with 0.02 mm particle size.
Energies 19 02800 g015
Figure 16. Analysis of particle flow in nozzle with 0.1 mm particle size.
Energies 19 02800 g016
Figure 17. Analysis of particle flow in nozzle with 0.3 mm particle size.
Energies 19 02800 g017
Figure 18. Entropy production distribution in nozzle with 0.02 mm particle size.
Energies 19 02800 g018
Figure 19. Entropy production distribution in nozzle with 0.1 mm particle size.
Energies 19 02800 g019
Figure 20. Entropy production distribution in nozzle with 0.3 mm particle size.
Energies 19 02800 g020
Figure 21. Quantitative analysis of local entropy production and turbulent kinetic energy.
Energies 19 02800 g021
Figure 22. Quantitative analysis of local entropy production and eddy viscosity.
Energies 19 02800 g022
Table 1. Parameters of Pelton turbine.
Design ParametersValue
Number of buckets21
Number of nozzles6
Rated speed (r/min)100
Rated head (m)671
Disclaimer/Publisher’s Note: The statements, opinions and data contained in all publications are solely those of the individual author(s) and contributor(s) and not of MDPI and/or the editor(s). MDPI and/or the editor(s) disclaim responsibility for any injury to people or property resulting from any ideas, methods, instructions or products referred to in the content.