Article

Control Strategy of the Vehicle Thermal Management System for Battery Electric Vehicles Considering Energy Consumption Optimization


by
Guangyu Yang
1,*,
Guang Xiao
2,
Chaofeng Pan
1,
Jiaxin Wu
1 and
Zihao Jia
1
1
Automotive Engineering Research Institute, Jiangsu University, Zhenjiang 212013, China
2
School of Automotive and Traffic Engineering, Jiangsu University, Zhenjiang 212013, China
*
Author to whom correspondence should be addressed.
Energies 2026, 19(11), 2687; https://doi.org/10.3390/en19112687
Submission received: 12 May 2026 / Revised: 29 May 2026 / Accepted: 1 June 2026 / Published: 3 June 2026

Abstract

The energy consumed by thermal management systems strongly affects the driving range of battery electric vehicles. In this study, we develop an integrated control strategy that couples the Sparrow Search Algorithm (SSA) with Nonlinear Model Predictive Control (NMPC) to simultaneously reduce energy consumption and satisfy cabin comfort and battery safety requirements. We construct a multiloop coupled, heat pump-based integrated thermal management model, including a compressor, heat exchangers, expansion valves, and an electro-thermal battery sub-model. Bench and vehicle-level tests confirm that the model predicts the refrigerant mass flow rate and heating capacity with mean relative errors of 4.76% and 4.30%, respectively. The SSA is used to tune the NMPC weighting parameters offline, minimizing the mean absolute errors of the cabin temperature, battery temperature, and total system energy consumption. The resulting SSA-NMPC strategy is evaluated under NEDC and CLTC-P driving cycles. Under the investigated NEDC-based high-load assessment with representative operating conditions, the proposed strategy limits the cabin temperature overshoot to 0.35 °C and battery temperature fluctuation to 0.26 °C, while achieving a 6.31% energy saving under high-speed cruising. The proposed framework focuses on cabin and battery thermal regulation and considers motor waste heat recovery. These results demonstrate that the SSA-NMPC approach can improve thermal management performance under the investigated operating conditions.

1. Introduction

In light of the global energy crisis and tightening environmental regulations, battery electric vehicles (BEVs) have become a major focus of the automotive industry owing to their high efficiency and zero tailpipe emissions [1]. However, range anxiety remains a primary barrier to their widespread adoption. The vehicle thermal management system is responsible for regulating the temperatures of the battery, drive motor, and passenger cabin, and its energy consumption directly influences the achievable driving range. Under extreme climatic conditions, the thermal management system alone can account for over 30% of the auxiliary energy load, significantly reducing the effective range [2,3]. In cold climates, the simultaneous demands of battery heating and cabin heating further increase the load on the heat pump or PTC heater [4,5]. Minimizing thermal management energy consumption while ensuring battery safety and occupant comfort is therefore critical for improving BEV competitiveness.
The thermal management system of a BEV consists of three interacting subsystems: the power battery thermal loop, the drive motor thermal loop, and the cabin climate loop [6]. These subsystems are strongly coupled: motor waste heat can be recovered for cabin heating, the battery heat generation rate depends on the discharge current, and the cabin thermal load is a function of ambient temperature and vehicle speed [7]. This multi-objective, strongly coupled, and multi-time-scale nature makes the control problem particularly challenging [8]. Improving the energy efficiency of the thermal management system is therefore essential for extending the driving range and enhancing the overall sustainability of electric transportation.
To address these challenges, in this study, we developed an integrated SSA-NMPC framework. Compared with previous MPC-based thermal management studies, the present work differs in three main aspects [9,10]. First, the heat pump refrigerant cycle, battery electro-thermal dynamics, and cabin thermal dynamics are integrated into a single unified nonlinear model, which is experimentally validated and serves as the controlled plant for the NMPC controller [11]. Second, the weighting parameters of the NMPC cost function are systematically tuned offline by the Sparrow Search Algorithm (SSA), avoiding the empirical trial-and-error that is often impractical for such a strongly coupled multi-objective system [12]. Third, the controller is evaluated under both steady-state (NEDC) and transient (CLTC-P) driving cycles as well as under extreme ambient conditions, and its performance is compared with baseline rule-based control and conventional NMPC strategies, demonstrating simultaneous improvements in temperature regulation and energy efficiency [13]. These three aspects together constitute the novelty of the proposed framework.
Recent studies have explored model predictive control (MPC) for BEV thermal management [14,15]. While these demonstrate improved temperature tracking and energy efficiency, most focus on a single subsystem (e.g., battery cooling) or adopt simplified linear models, and few systematically address the offline tuning of the MPC weighting parameters in a multi-objective, strongly coupled setting. The SSA has shown superior convergence speed and global search capability compared with genetic algorithms and particle swarm optimization in recent engineering optimization studies [16,17], but its application to thermal management weight tuning remains limited. The design and control optimization of thermal management systems for high-performance EVs have been further explored in [18].
The proposed SSA-NMPC framework uses the SSA exclusively for offline optimization of the NMPC weights; online control is performed by the SSA-tuned NMPC controller. A multiloop coupled, heat pump-based integrated thermal management model was constructed and calibrated through bench and vehicle-level tests. Although the present study focuses on vehicle-level thermal management control, reducing onboard thermal energy consumption directly extends the driving range and can consequently lower the frequency of charging stops. This connection is particularly relevant in extreme climates, where thermal management loads are largest. The quantitative evaluation of how such vehicle-level efficiency improvements translate into charging-station demand or infrastructure planning requires a separate multi-scale framework, which is beyond the scope of the present work [19].
Model predictive control (MPC) has attracted increasing attention for BEV thermal management due to its ability to anticipate future thermal loads. Dai et al. [14] applied MPC with NSGA-II optimization to a battery cooling system, demonstrating improved temperature tracking. Jia [15] developed a linear MPC for a battery liquid cooling system. However, these studies typically focus on a single subsystem (e.g., battery cooling) or adopt simplified linear models. Moreover, few MPC-based thermal management studies systematically address the offline tuning of weighting parameters in a strongly coupled, multi-objective setting, often relying on empirical trial-and-error. Nonlinear MPC (NMPC) remains underexplored for integrated cabin–battery–motor thermal regulation.
The Sparrow Search Algorithm (SSA) is a recently proposed metaheuristic that mimics the foraging and anti-predation behavior of sparrows. Compared with genetic algorithms (GAs) and particle swarm optimization (PSO), the SSA has demonstrated superior convergence speed and global search capability in several engineering optimization tasks [20,21]. Applications include chiller system energy optimization [22] and global optimization problems [23]. Nevertheless, the use of the SSA for the offline tuning of NMPC weighting parameters in a BEV thermal management system has not been reported.
Heat pump systems for EVs have been studied extensively from the perspective of component efficiency and refrigerant cycle design [24,25]. Recent advances also include CO2 heat pump systems with novel control strategies that achieve energy savings of 34.7% at −20 °C compared to R134a systems [26]. Additionally, waste heat recovery from electric drive systems has been shown to improve COP by over 20% in low-temperature conditions [27], and hybrid integrated thermal management systems based on CO2 heat pumps demonstrate 8–13% energy reductions across diverse ambient conditions [28]. Li and Sun’s experimental analysis further confirmed that waste heat recovery reduces energy consumption by 24–35% in extreme cold (−7 °C to −18 °C) [29]. However, system-level energy optimization that coordinates compressor speed, expansion valve opening, and coolant pump operation under transient driving cycles remains challenging. Most studies focus on steady-state efficiency maps rather than predictive, cycle-aware control.
The remainder of this paper is organized as follows. Section 2 describes the integrated thermal management system architecture, multiphysics component models, and NMPC-based control strategy. Section 3 presents the model validation and control performance under NEDC and CLTC-P driving cycles. Section 4 concludes the paper.

2. Model and Control

2.1. Overview of Thermal Management System

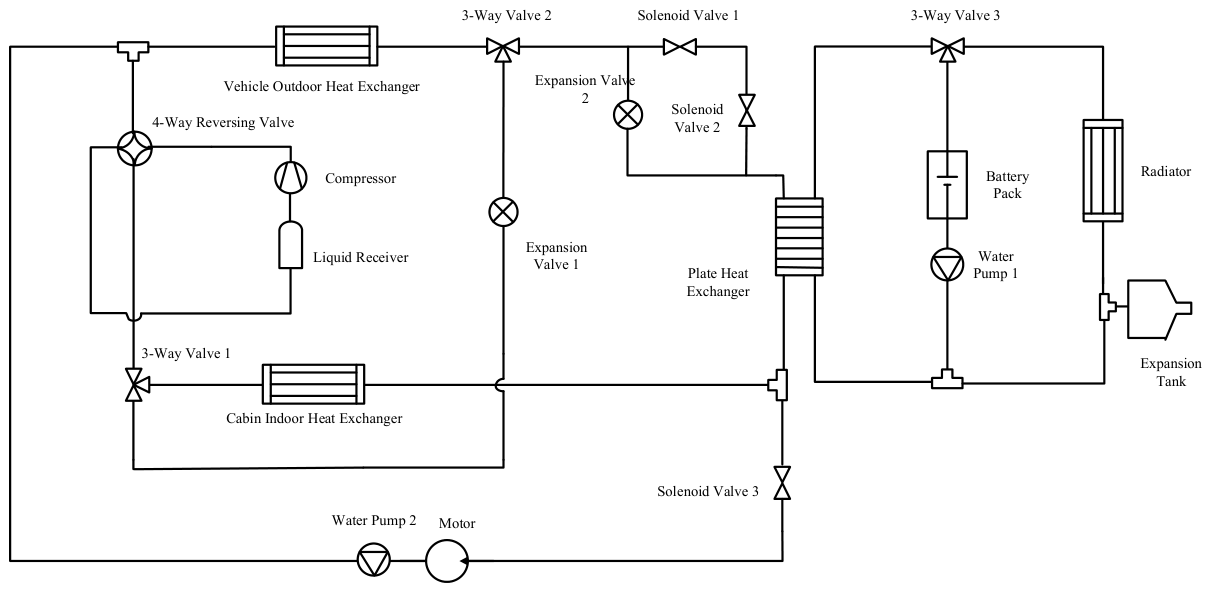
Figure 1 summarizes the main structure of the thermal management system studied in this paper: a compressor, indoor heat exchanger, outdoor heat exchanger, expansion valve, plate heat exchanger, radiator, four-way control valve, three-way valve, electromagnetic valve, etc. Table 1 summarizes the main components.
The system architecture integrates the heat pump refrigerant cycle, the battery thermal loop, and the cabin climate loop. Heat pump control strategies for EVs have been studied in [30]. The drive motor is treated as a boundary heat source for waste heat recovery rather than as a fully resolved thermal subsystem [31,32].
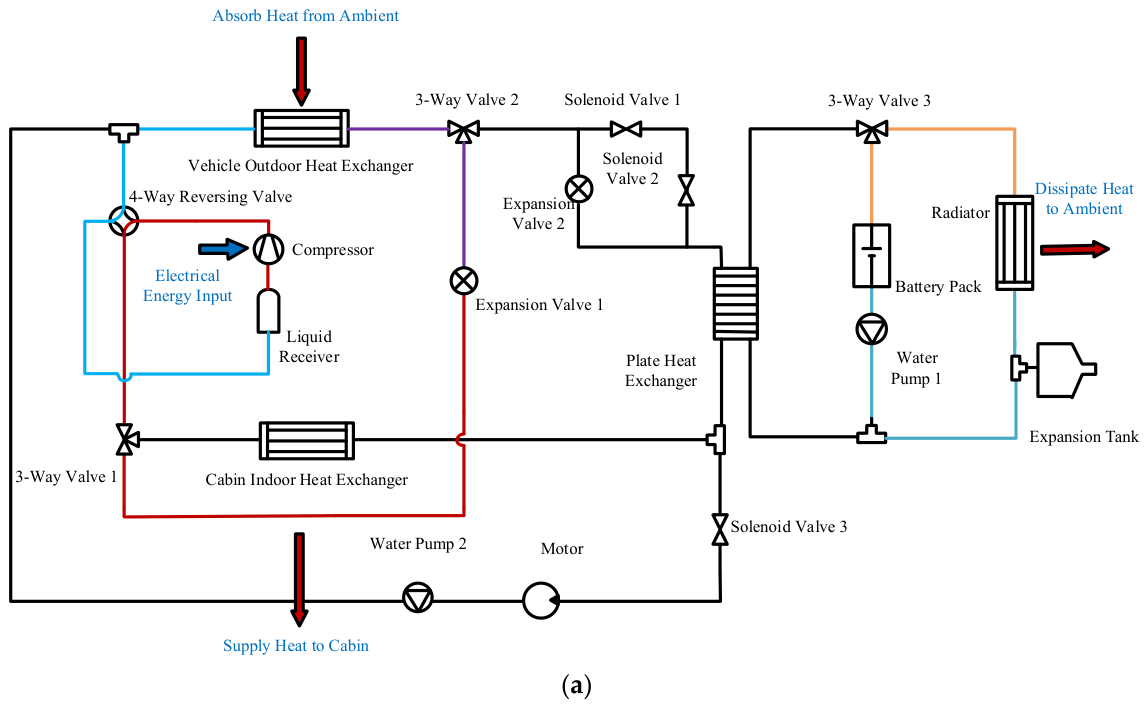
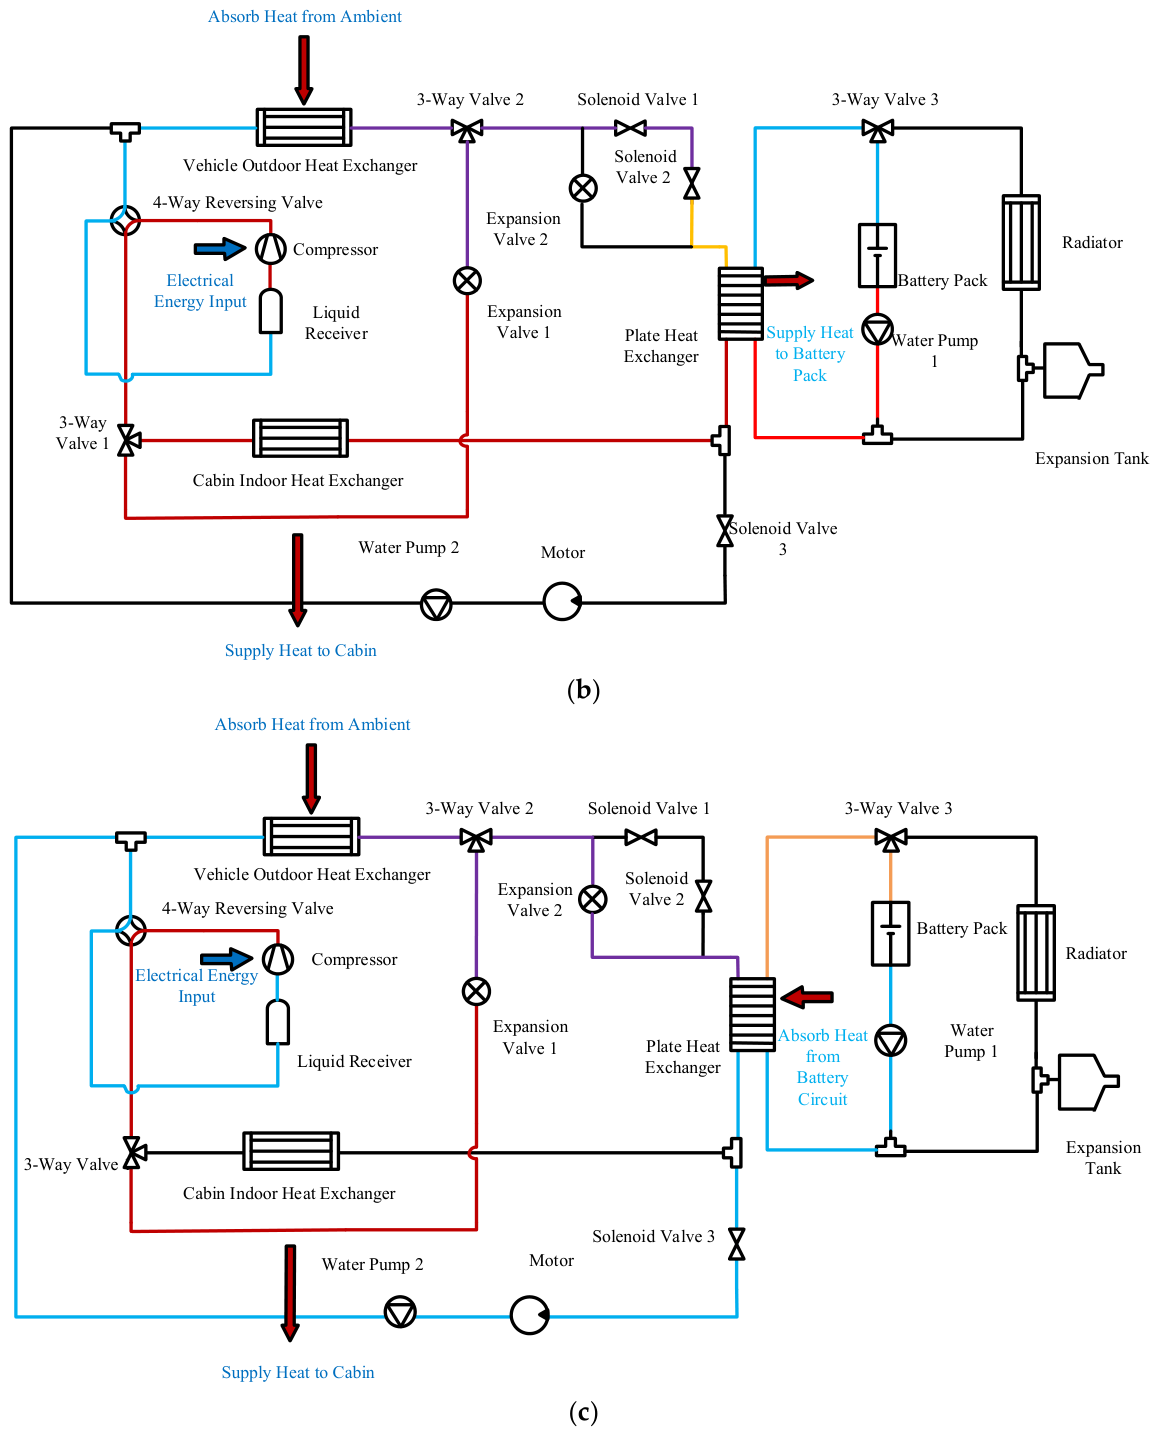
In low-temperature environments, the thermal management system must heat the passenger compartment and supply sufficient heat to the battery cooling circuit to keep the battery temperature at 25 °C. Because the passenger compartment and battery have different heating needs, the thermal management system needs to manage their different temperatures in several ways. The main modes are the joint heating of the passenger compartment and battery, the recovery of battery waste heat, and natural cooling of the battery. Figure 2 shows the flow of the refrigerant and coolant for each mode.

2.1.1. Cabin and Battery Heating Mode

Figure 2a shows the liquid flow paths of refrigerant and coolant circuits during passenger compartment and battery heating modes. The cycle starts as high-temperature high-pressure refrigerant leaves the compressor and passes through the four-way directional control valve to Three-Way Valve 1. There are two paths for the refrigerant. One leads to the indoor heat exchanger, where it heats the passenger compartment, and then through Expansion Valve 1 to Three-Way Valve 2. The other path leads to the plate heat exchanger, which heats the battery cooling circuit, and then through Expansion Valve 2 and Solenoid Valve 1 to Three-Way Valve 2. Once mixed, refrigerant flows through the external heat exchanger and absorbs environmental heat. Finally, it passes through the four-way directional control valve and liquid storage tank before returning to the compressor.
In this configuration, the coolant circulates from Water Pump 1 to the battery pack, passes through Three-Way Valve 3 and the plate heat exchanger, and then returns to Water Pump 1, thus completing the flow cycle.

2.1.2. Battery Waste Heat Recovery Mode

Figure 2b shows the liquid flow paths of the refrigerant and coolant circuits during battery waste heat recovery. High-temperature high-pressure refrigerant leaves the compressor, flows through the four-way control valve and Three-Way Valve 1, and enters the indoor heat exchanger to warm the passenger compartment, and then passes through Expansion Valve 1 and Three-Way Valve 2, where it splits into two paths. One leads to the external heat exchanger for absorbing environmental heat, and the other flows through Solenoid Valve 2 into the plate heat exchanger to recover residual heat from the battery coolant circuit. After passing through Solenoid Valve 3, both refrigerant streams merge, travel through the four-way control valve and liquid storage tank, and finally travel back into the compressor.
In this configuration, the coolant circulates from Water Pump 1 to the battery pack, passes through Three-Way Valve 3 and the plate heat exchanger, and then returns to Water Pump 1, completing the cycle.

2.1.3. Natural Heat Dissipation Mode of Batteries

Figure 2c shows the flow of the liquid through the refrigerant and coolant circuits when the battery is running in natural heat dissipation mode. High-temperature high-pressure refrigerant exits the compressor and enters the four-way reversing valve and Three-Way Valve 1. It flows to the cabin heat exchanger to warm the passenger compartment. Then, it travels through Expansion Valve 1 and Three-Way Valve 2, to the external heat exchanger, where it absorbs heat from the environment. Finally, it travels through the four-way reversing valve and liquid storage tank before returning to the compressor after one cycle.
At this stage, the coolant in the circuit bypasses the plate heat exchanger and instead circulates from Water Pump 1 to the battery pack, and then through Three-Way Valve 3, the radiator, and the expansion water tank, before returning to Water Pump 1 to complete the cycle.

2.2. Multiphysics Component Modeling

2.2.1. Compressor Model

Efficient heat pump modeling for BEVs has been addressed in [29]. In this study, we utilized a fixed-displacement scroll compressor. The compressor’s mass flow rate within the model is determined using Equation (1):
m ˙ r = ρ η v V n c o m
where m ˙ r is the refrigerant mass flow rate (kg/s), ρ is the refrigerant density at the compressor inlet (kg/m3), η v is the volumetric efficiency (-), V is the compressor displacement (cm3), and n c o m is the compressor rotational speed (r/min).
The energy consumed by the compressor during its operation is determined using Equation (2):
W c o m p = m ˙ r ( h 2 h 1 ) η i s η m e
where W c o m p is the compressor power consumption (kW), h 1 and h 2 are the theoretical specific enthalpies of the refrigerant at the compressor inlet and outlet (kJ/kg), η i s is the isentropic efficiency (–), and η m e is the mechanical efficiency (–).

2.2.2. Heat Exchanger Model

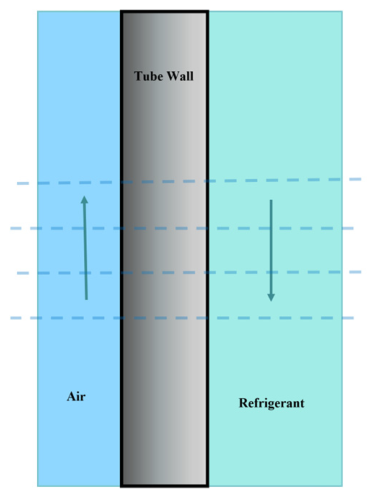
The refrigerant flow and heat exchange in the heat exchanger were simplified and modeled using discrete elements, namely air/wall, wall and fin, and refrigerant/wall, as depicted in Figure 3. In this study, the heat exchanger is reduced to a one-dimensional tube section, which is evenly divided into several discrete micro-elements. Within each micro-element control body, the refrigerant and air exchange heat via the tube wall and fins. The calculation result from the outlet of one micro-element serves as the inlet parameter for the subsequent micro-element control body, facilitating iterative calculation.
Regarding the heat transfer on the refrigerant side inside the heat exchanger:
Q i n t , i = h i n t , i A r , i ( T r , i T w , i )
In this formula, Q i n t , i represents the heat exchange capacity of refrigerant in the i-th micro-segment of the heat exchanger (kW), h i n t , i represents the convective heat transfer coefficient between the refrigerant and tube wall in the i-th micro-element section (kW/m2K), A r , i measures the heat exchange area of the refrigerant in the i-th micro-segment (m2), T r , i represents the temperature of the refrigerant in the i-th micro-segment (°C), and T w , i is the wall temperature of the heat exchanger in the same section (°C).
For calculating the heat exchange with single-phase refrigerants, the Gnielinski correlation formula is applicable, as detailed in Reference [30].
The heat exchange of refrigerant condensation in two phases can be calculated using Shah’s correlation [31] and Dittus and Boelter’s correlation [32]. For refrigerant evaporation in two phases, Chen’s correlation formula [33] can be applied. On the air side outside the heat exchanger, the heat exchange can be computed using Kim and Bullard’s experimental correlation formula [34].
The wall temperature of the heat exchanger can be solved by thermal equilibrium:
m w , i c p w , i d T w , i d t = Q i n t , i Q e x t , i
In the formula, m w , i denotes the mass of the i-th micro-element section of the heat exchanger (kg), c p w , i signifies the specific heat capacity of the i-th micro-element section of the heat exchanger (kJ/(kg·K)), t is time (s), and Q e x t , i is the heat exchange rate on the external side (air or coolant) of the i-th micro-element (kW).

2.2.3. Expansion Valve Model

The refrigerant undergoes an isenthalpic throttling process as it passes through the expansion valve. The mass flow rate of the refrigerant is determined using the following equation:
m ˙ r = C D A C 2 ρ e x p Δ p
where C D is the flow coefficient of the refrigerant passing through the expansion valve (–), A C is the flow cross-sectional area of the expansion valve (m2), ρ e x p is the density of the refrigerant at the expansion valve’s inlet (kg/m3), and Δ p is the pressure difference between the expansion valve’s inlet and outlet (MPa).

2.2.4. Cabin Model

Temperature fluctuations within the passenger compartment are affected by several factors, including the ambient temperature, vehicle speed, solar radiation, number of passengers, and heat pump’s heating capacity. The detailed models are presented in Equations (6) and (7):
ρ a V c a b i n c p , a d T c a b i n d t = Q c a b i n + Q h e a t p u m p
Q c a b i n = Q s o l a r + Q c o n v + Q m e t + Q m e c h + Q v e n
where ρ a is the air density (kg/m3), V c a b i n is the volume of the passenger compartment (m3), c p , a is the specific heat capacity of air at constant pressure (kJ/(kg·K)), T c a b i n is the cabin temperature (K), Q c a b i n is the net external heat load on the cabin (kW), Q h e a t p u m p is the heating or cooling capacity provided by the heat pump system (kW), Q s o l a r is the solar radiation load (kW), Q c o n v is the convective heat transfer load (kW), Q m e t is the metabolic heat produced by occupants (kW), Q m e c h is the heat dissipated by mechanical/electronic equipment in the vehicle (kW), and Q v e n is the ventilation heat load (kW).

2.2.5. Battery Electro-Thermal Coupling Model

The battery’s state of charge at any given moment is determined using the ampere-hour integration method.
S O C = S O C 0 1 C N 0 t I d t
where S O C is the current state of charge (–), S O C 0 is the initial state of charge (–), C N is the nominal capacity of the battery (Ah), and I is the current flowing through the battery (A).
The battery’s heat generation in the model is determined using the Bernardy battery heat generation equation [35]:
Q b a t = I 2 ( R o + R p ) + I T b a t d U o c v d T b a t
where Q b a t is the heat generated by the battery (kW), R o is the ohmic internal resistance of the battery (Ω), R p is the polarization internal resistance of the battery (Ω), T b a t is the battery temperature (K), U o c v is the open-circuit voltage of the battery (V), and d U o c v d T b a t is the entropy coefficient (V/K). Equations (8) and (9) together implicitly account for the effect of the charging/discharging current on both the electrical and thermal performance of the battery. Winter battery temperature control strategies have been further investigated in [36].
It should be noted that the battery electro-thermal model presented in Equations (8) and (9) does not incorporate capacity fade, internal resistance growth, or state-of-health (SOH) evolution. Cycle aging and calendar aging are not considered. The present work focuses on short-timescale (≤2100 s) thermal regulation under the assumption of a relatively new battery. The impact of the proposed thermal management strategy on battery lifetime will be investigated in a separate study.

2.2.6. Models of Other Components

The heat transfer formulas for other heat exchangers in the system (plate heat exchangers and radiators) follow the same modeling approach as the cabin and external heat exchangers; they are not repeated here. As noted in [37], the drive motor operates at temperatures above 80 °C across a fairly broad range, and its temperature effect on performance is minor. Therefore, the motor thermal behavior is treated as a boundary heat source for waste heat recovery analysis. The integrated thermal management system consequently focuses on cabin and battery thermal regulation with consideration of motor waste heat recovery, rather than on extensive motor thermal modeling.

2.3. Operational Modes and NMPC-Based Control Strategy

The thermal management system requires a control strategy that can handle the multi-objective, strongly coupled, and multi-time-scale characteristics identified in Section 2.1. Two control architectures are established in this work: a baseline rule-based controller that represents the current industrial practice, and the proposed SSA-tuned NMPC controller.

2.3.1. Baseline Rule-Based Control (FSMC)

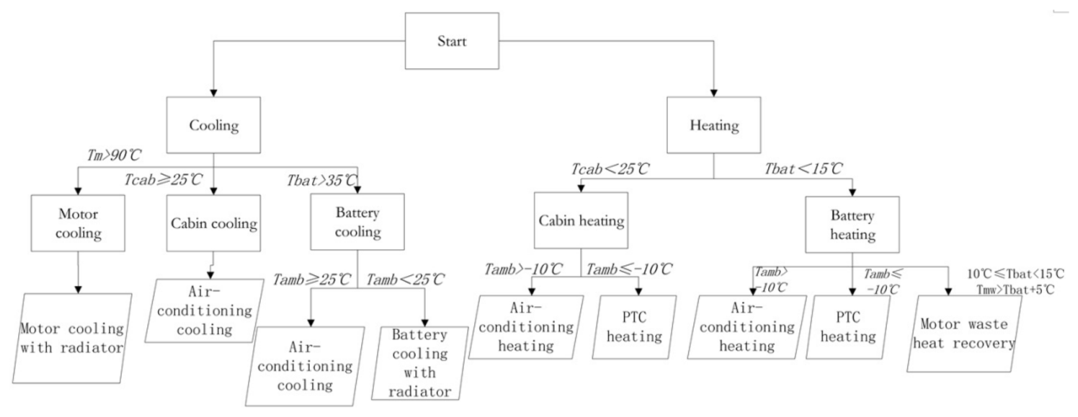
The baseline controller adopts a finite-state-machine (FSMC) structure with fixed temperature thresholds. Within the Amesim simulation environment, sensors collect real-time temperature readings for the ambient, cabin, battery, motor controller, and coolant circuits. These readings are compared with the predefined thresholds listed in Table 2, and the corresponding operating mode is activated according to the logic diagram shown in Figure 4. Although this rule-based strategy is simple to implement and responds quickly, it suffers from two fundamental limitations. First, the thresholds are fixed and cannot adapt to changing driving conditions or ambient environments, which often leads to delayed mode switching or unnecessary mode cycling. Second, the controller reacts only to the current measured temperatures and has no ability to anticipate future thermal loads. As a result, the FSMC strategy cannot achieve global energy consumption optimization, particularly under transient driving conditions.

2.3.2. Proposed SSA-Tuned NMPC

To overcome the limitations of the baseline rule-based controller, this work proposes an intelligent control strategy that integrates Nonlinear Model Predictive Control (NMPC) with offline weight tuning by the Sparrow Search Algorithm (SSA). The NMPC controller replaces the threshold-based decision logic with a predictive optimization framework. The SSA is used exclusively for offline tuning of the NMPC weighting parameters and does not participate in online control.
Online NMPC problem. At each sampling instant, the NMPC controller solves a constrained optimization problem over a prediction horizon Np = 12 and a control horizon Nc = 4. The cost function penalizes the predicted tracking errors and the control effort:
J = i = 1 N p y ( k + i ) y r e f ( k + i ) P 2 + j = 1 N c Δ u ( k + j 1 ) Q 2
where y contains the cabin temperature, the battery average temperature, and the battery temperature uniformity indicator; u consists of the compressor speed, the electronic expansion valve opening, the coolant pump speed, and the operating mode selection. The weighting matrices P = diag( ω 1 , ω 2 , ω 3 ) and Q determine the relative importance of each control objective and actuator penalty.
The decision variable vector to be optimized online is
X i = [ N p , N c , ω 1 , ω 2 , ω 3 , ω 4 , ω 5 , ω 6 , ω 7 ]
where ω 1 , ω 2 , ω 3 are the output-error weights (cabin temperature, battery average temperature, and battery temperature uniformity, respectively) and ω 4 , ω 5 , ω 6 , ω 7 are the control-effort weights corresponding to the individual actuators.
Offline SSA weight tuning. The eight parameters in X i are difficult to determine manually because the system is strongly coupled and involves conflicting objectives. This work adopts the SSA to perform an offline global search for the optimal weight combination. The SSA fitness function is defined as
F i t n e s s = α M A E c a b + β M A E b a t + γ E t o t a l
In the formula, M A E b a t denotes the average absolute error of the temperature in the passenger compartment, the average absolute error of the battery temperature, and the total energy consumption of the thermal management system. The terms M A E b a t , E t o t a l , α , β , and γ are the normalized coefficients.
The SSA was selected for its demonstrated advantages in convergence speed and global search capability in multi-parameter, multi-objective problems. Recent studies have shown that SSA outperforms genetic algorithm (GA) and particle swarm optimization (PSO) for engineering optimization tasks with similar characteristics [9,10]. The producer–scrounger mechanism and early-warning behavior of SSA help it escape local optima more effectively than conventional metaheuristics, which is particularly beneficial for the strongly coupled, nonlinear thermal management system considered here. The optimized weighting parameters were then used in the NMPC controller for subsequent simulation comparisons.
Constraints. The NMPC controller must respect the physical limits of the actuators and the thermal safety bounds of the components. The following constraints are enforced:
Compressor speed: ≤6000;
Electronic expansion valve opening: 5–95%;
Battery temperature: 25–45 °C;
Motor controller temperature: ≤85 °C;
Cabin temperature: 20–28 °C.
These constraints are included as hard bounds in the online optimization problem, ensuring that the controller never issues commands that would violate thermal safety or actuator limits.
Implementation simplification. To ensure practical feasibility on automotive-grade hardware, four real-time optimization measures were adopted: (i) The prediction horizon was reduced to Np = 12, which was identified through sensitivity analysis as the best trade-off between accuracy and computational load. (ii) The battery thermal model was simplified from a three-dimensional distributed form to a lumped-parameter one-dimensional representation (Section 2.2.5). (iii) Refrigerant property tables and heat transfer correlation coefficients were pre-computed as look-up tables, avoiding the online solution of complex algebraic equations. (iv) An early-stopping strategy was implemented in the SSA tuning loop: the optimization terminates when the best fitness value changes by less than 0.1% over five consecutive generations.
The NMPC problem was implemented in MATLAB/Simulink R2023b using the fminconsolver with the sequential quadratic programming (SQP) algorithm. The maximum number of iterations per sampling instant was set to 50. All simulations were executed on a desktop PC equipped with an Intel Core i7-12700H CPU @ 2.30 GHz and 16 GB of RAM. Over the entire CLTC-P driving cycle (1800 s, 1 s sampling interval), the average computation time per control interval was 0.47 s, and the maximum computation time was 0.83 s. No timing violation (computation time > 1 s) occurred. These results indicate feasibility on a high-performance automotive prototyping platform. Further optimization (e.g., code generation, fixed-point implementation) and validation on production embedded hardware (e.g., Infineon AURIX TC3xx series) are planned for future work.
Figure 4 presents a block diagram that illustrates the logical threshold relationships within the vehicle thermal management system. This diagram effectively describes the information presented in Table 2.

3. Comprehensive Analysis of NEDC and CLTC Driving Cycles

3.1. Comparative Analysis of Driving Cycle Characteristics

The two most important vehicle test standards are NEDC and CLTC, which differ significantly in their methods, characteristics, and results. Comparing them further helps us to understand how they affect an electric vehicle’s driving range. The combination of NEDC and CLTC-P allows the controller to be assessed under both relatively regular and highly transient driving conditions.
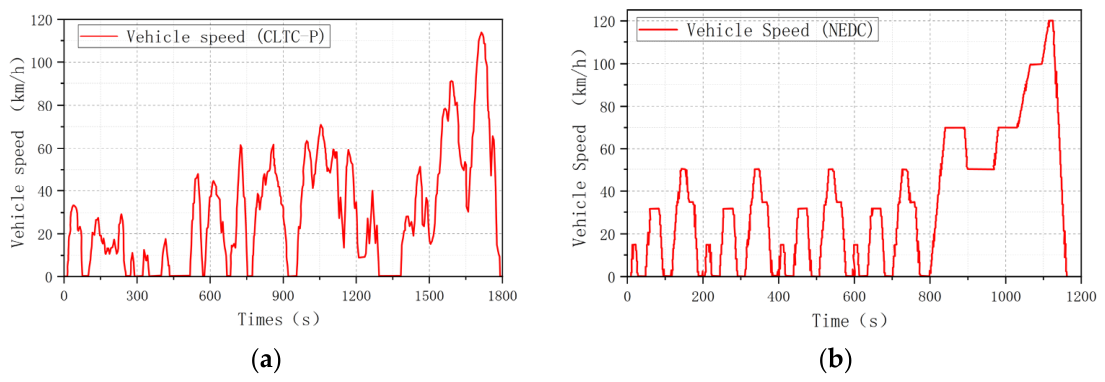
The NEDC comprises 4 urban driving cycles and 1 suburban cycle lasting 1180 s. In urban driving conditions, the average speed is 18.5 km/h (maximum 50 km/h), and in suburban driving conditions, the average speed is 62 km/h (maximum 120 km/h). CLTC-P conditions reflect real road driving conditions in China, consisting of three stages: low, medium, and high speed. It has a higher idle time proportion and frequent accelerations and decelerations. Figure 5 shows car speed curves in CLTC-P and NEDC conditions.

3.2. Model Validation

To verify the accuracy and reliability of the simulation model, we developed a thermal management system of electric vehicle heat pump air conditioning consisting of compressors, condensers, evaporators, and expansion valves. We then tested it experimentally under various working conditions, in particular with a variable condensing temperature, variable evaporation temperature, and variable speed compressor. All the validation tests were conducted under representative summer (40 °C) and winter (−17 °C) ambient conditions. The validated model is therefore considered suitable for evaluating control strategies under these investigated operating conditions, but its predictive accuracy for other climatic conditions (e.g., mild spring/autumn, extreme cold below −20 °C) has not been established.
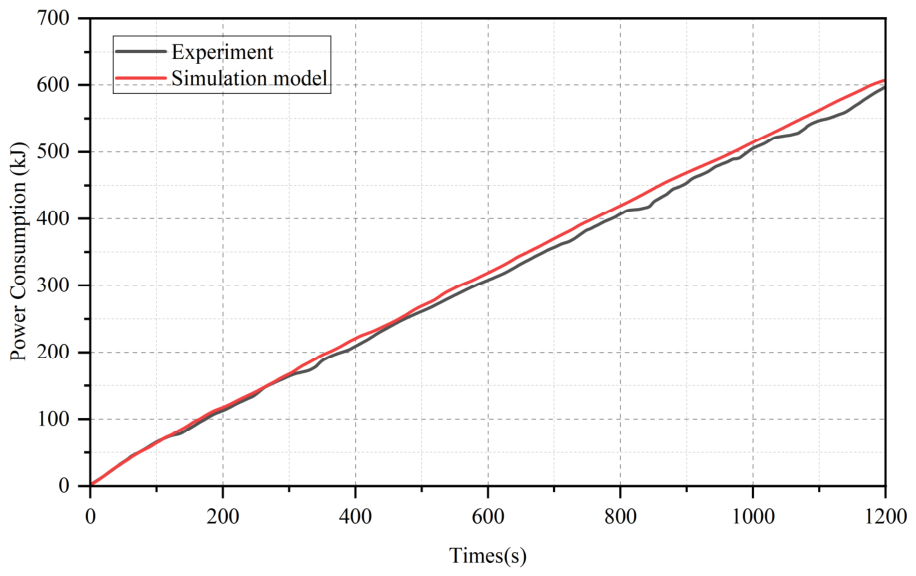
Comparative verification indicates that, across various working conditions, the average errors for the refrigerant mass flow rate, heating capacity, and cooling capacity are 4.76%, 4.30%, and 10.67%, respectively, all falling within an acceptable range. This supports the applicability of the calibrated model for comparative control-strategy evaluation. The purpose of this experimental validation is to establish a calibrated simulation platform; all subsequent control strategy comparisons (Section 3.3 and Section 3.4) are conducted on this validated model rather than directly on the test vehicle.
To further validate the model’s accuracy in real-world vehicle conditions, additional work was conducted, involving vehicle-level validation tests in both high-temperature summer and low-temperature winter environments.
The test vehicle is a compact battery electric passenger car equipped with a lithium iron phosphate (LFP) battery pack (system nominal voltage, 345.6 V; total energy, 54.3 kWh), a permanent magnet synchronous motor (peak power 60 kW), and a heat pump-based integrated thermal management system. The key vehicle parameters are summarized in Table 3.

3.2.1. Vehicle-Level Model Validation Under Summer High-Temperature Conditions

This test was designed to validate the accuracy of the baseline physical model, not to evaluate the SSA-NMPC strategy.
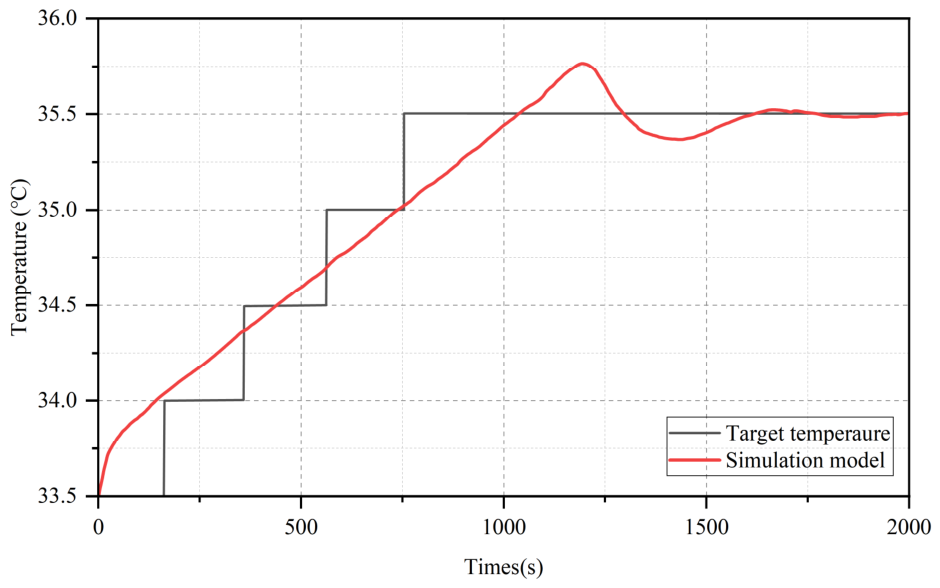
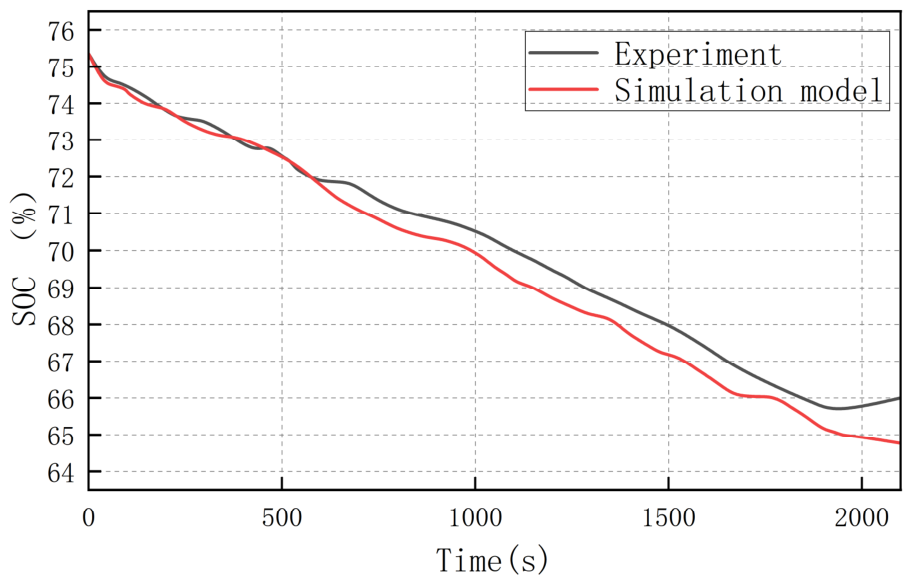
The initial conditions for the summer high-temperature test are as follows: an ambient temperature of 40 °C, a driving speed of 138 km/h, an initial battery temperature of 33.5 °C, an initial state of charge (SOC) of 75.35%, and a terminal SOC of 66.00%. The vehicle is driven for 2100 s.The key experimental test conditions are summarized in Table 4.
As shown in Figure 6, under high-temperature summer conditions, the battery temperature of the test vehicle increased from 33.5 °C to 35.5 °C, activating the refrigerant to cool the battery. The simulation results agree with the overall trend of the test data, with the battery temperature remaining near 35.5 °C. Figure 7 compares the SOC variation between the experimental vehicle and the simulation model under summer high-temperature conditions. The simulated terminal SOC is 64.76%, compared with 66.00% in the vehicle test, corresponding to a terminal deviation of approximately 1.24 percentage points. Although localized deviations appear during transient operating stages due to compressor switching, thermal load redistribution, and battery internal resistance variation, the overall SOC trend is captured reasonably well. The simulation slightly overestimates SOC consumption in the later stage of the driving cycle, but the overall agreement remains acceptable for system-level control strategy evaluation.

3.2.2. Vehicle-Level Model Validation Under Winter Low-Temperature Conditions

This test was designed to validate the accuracy of the baseline physical model, not to evaluate the SSA-NMPC control strategy.
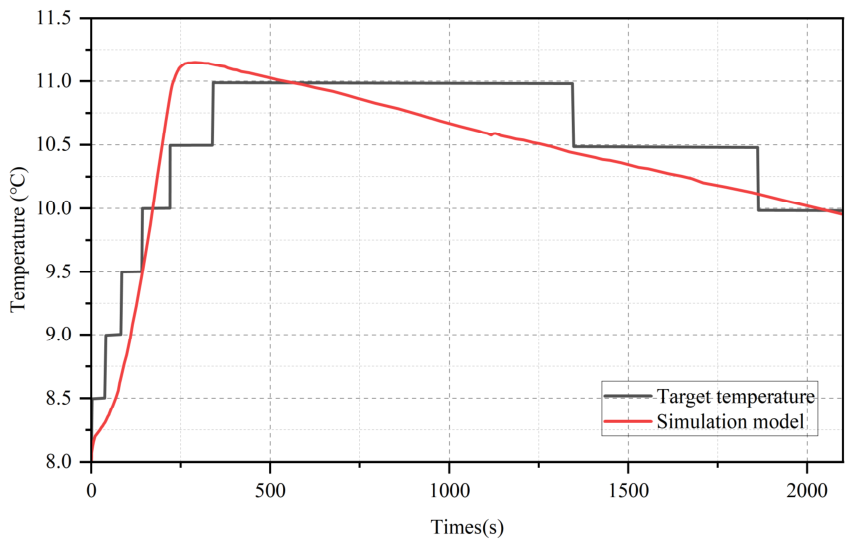
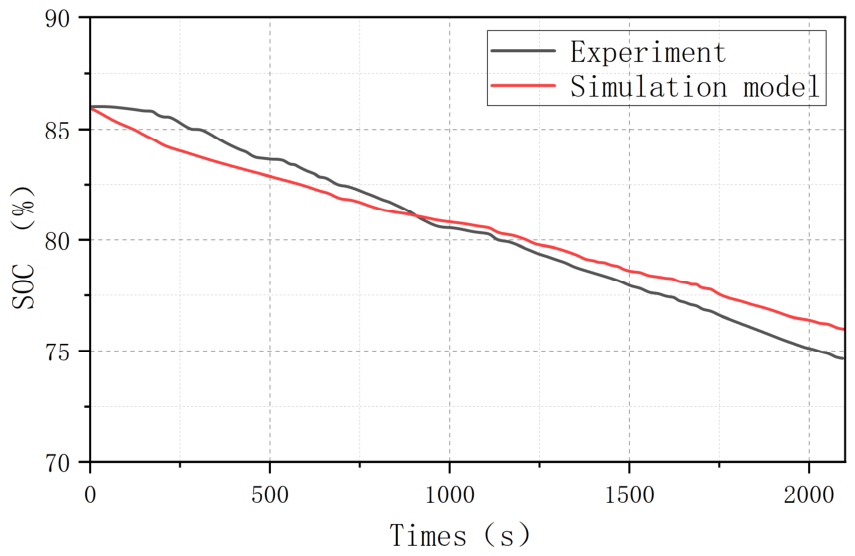
The winter low-temperature test begins at −17 °C with a driving speed of 72 km/h. The battery starts at 8 °C with an 86% SOC, which decreases to 74.55% after 2100 s.
In the test, the battery temperature rises from 8 °C to 11 °C, and then drops to 10 °C after 300 s, as depicted in Figure 8. The simulation results align with the observed trend in the test data. Figure 9 illustrates a 7% SOC consumption error in the simulation data compared to the actual vehicle test. Figure 8 presents a comparison between the temperatures of actual vehicles and simulated batteries under winter low-temperature conditions, while Figure 9 contrasts the state of charge (SOC) of actual vehicles with simulations in similar winter conditions.

3.2.3. Bench Test Error Summary

These error magnitudes are comparable to those reported in similar experimental validation studies of heat pump-based thermal management systems [31,32], and the heat transfer correlations employed (Gnielinski [30], Shah [31], Dittus–Boelter [32], Chen [33], Kim–Bullard [34]) have been extensively validated in their original publications.
Temperature measurements were acquired using PT100 resistance temperature detectors with an accuracy of ±0.15 °C, installed at the battery module surface, coolant inlet/outlet, and cabin air vents. The refrigerant mass flow rate was measured using a Coriolis mass flow meter with an accuracy of ±0.15% of the reading. All sensor signals were logged at a sampling rate of 1 Hz via a dedicated data acquisition system.
Table 5 summarizes the bench test verification errors. All the mean relative errors are within acceptable engineering tolerances, confirming the model’s suitability for subsequent control strategy simulation. As listed in Table 6, the error metrics of vehicle-level battery temperature validation are summarized.
Although the overall prediction accuracy is satisfactory for system-level evaluation, several transient operating points exhibit larger local deviations. These deviations are mainly caused by compressor switching transients, refrigerant redistribution within the heat exchanger after valve actuation, and coupled thermal inertia effects between the refrigerant loop and the coolant circuit. At moments when the compressor switches on or off, or when the electronic expansion valve undergoes a rapid opening change, the refrigerant mass flow and the heat transfer rate can deviate transiently from the quasi-steady-state assumptions used in the model. These localized discrepancies do not fundamentally affect the relative comparison of control strategies on the same calibrated platform, but they indicate directions for future model refinement.

3.3. Performance Analysis Under NEDC Driving Cycle

To assess the effectiveness of various control strategies, we compared the impacts of three representative thermal management operating modes—high-speed cruise (Mode 1), waste heat recovery (Mode 2), and natural heat dissipation (Mode 3)—as defined in Table 2, under the NEDC driving cycle. The simulation conditions were pre-set to fixed working scenarios to isolate the effect of each mode. All comparisons presented in this section were obtained on the experimentally calibrated simulation platform described in Section 3.2. Because the vehicle-level SOC validation indicates a non-negligible absolute prediction error, the following discussion emphasizes relative trends rather than treating the simulated absolute energy values as direct vehicle-level measurements.

3.3.1. Cabin Temperature Control

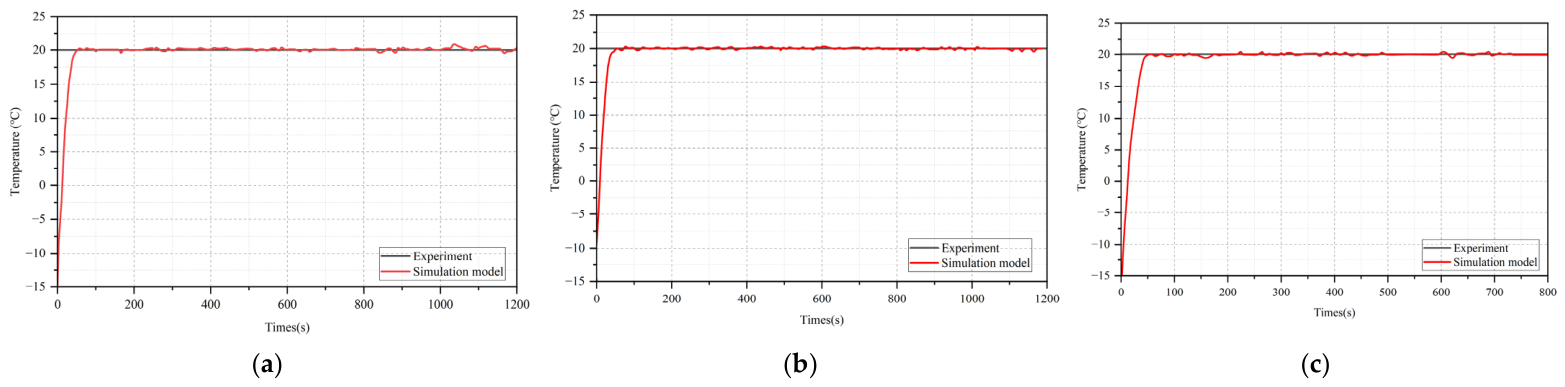
Figure 10 shows the temperature changes in the passenger compartment in three tests under the NEDC condition. In the first 40 s, the temperature increased rapidly in all scenarios. By the third 300 s, the temperature reached 20 °C and was stable. The lowest temperature change occurred during the high-speed cruise mode, followed by the waste heat recovery mode, and the largest change occurred in the natural heat dissipation mode. The temperature rise overshoot in high-speed cruise mode was 0.35 °C, lower than 0.51 °C in waste heat recovery mode, and 0.59 °C in natural heat dissipation mode.
Table 7 provides a summary of the discrepancies between the passenger compartment temperature and the target temperature across three different modes. For the NMPC strategy, the mean absolute error (MAE) was 0.95, the mean square error (MSE) was 15.93, and the root mean square error (RMSE) was 3.99.
Note that the MAE was used as the design objective in the SSA fitness function (Equation (12)). The MSE and RMSE are reported here as supplementary diagnostic metrics: the RMSE penalizes larger deviations more heavily and can reveal occasional large overshoot events that are critical for passenger comfort and battery safety even when the average error is small.

3.3.2. Battery Temperature Control

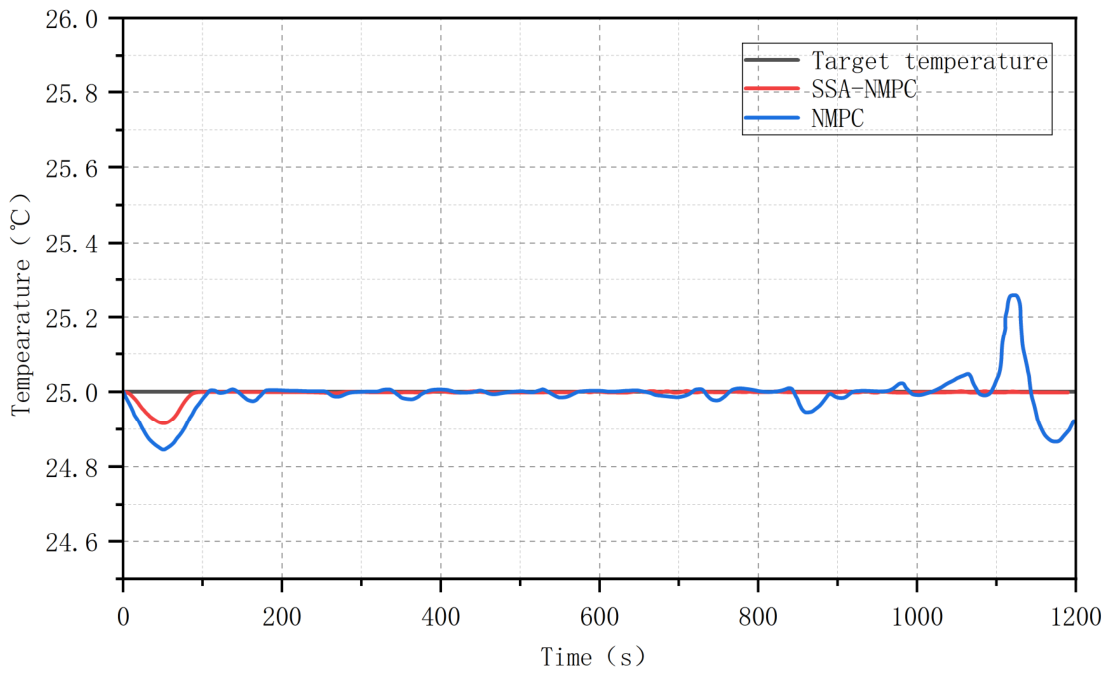
Figure 11 shows changes in battery temperature under two conditions during the NEDC. At high speeds, the battery temperature is close to 25 °C but not significantly fluctuating. Under the most intense conditions (1000 to 1200 s), the maximum temperature fluctuation under the NMPC strategy is 0.26 °C, whereas the SSA-NMPC strategy maintains a more stable battery temperature. These results indicate that the predictive controller maintains battery thermal regulation within a narrow temperature band. The reduced overshoot is mainly attributed to the predictive coordination of the compressor speed and the electronic expansion valve opening: the NMPC anticipates the battery thermal load from the upcoming driving profile and adjusts the heating or cooling capacity proactively, rather than reacting to a temperature deviation after it occurs. This avoids unnecessary compressor actuation and reduces the overshoot that typically arises from threshold-based switching.
The three curves correspond to the baseline rule-based FSMC, the unoptimized NMPC, and the SSA-NMPC strategies. Around 300 s, the thermal management system enters a mode transition stage as the cabin/battery temperature approaches the control threshold. Compared with the baseline strategy, the SSA-NMPC controller provides a smoother transition after this point, with smaller temperature fluctuation and reduced overshoot. This indicates that the predictive controller can anticipate the upcoming thermal load and coordinate the compressor, expansion valve, and coolant pump more effectively during the switching process.
Table 8 summarizes the battery temperature tracking errors for all three strategies. The SSA-NMPC case yields the smallest MAE (0.037 °C), MSE (0.0042 °C2), and RMSE (0.076 °C), which are lower than those of both the baseline FSMC and the unoptimized NMPC, indicating that the SSA-tuned weights improve battery temperature regulation.

3.3.3. Energy Consumption Analysis

Figure 12 illustrates the selection of each driving mode and the associated energy consumption under NEDC conditions. The SSA-NMPC strategy achieves an energy saving of 6.31% under high-speed cruising compared to the baseline rule-based control strategy simulated on the same calibrated model platform. Under the mild NEDC, savings are more modest and within model uncertainty; a detailed analysis focuses on extreme operating scenarios where thermal management loads are greatest.
It should be noted that a non-negligible SOC prediction deviation was observed in the vehicle-level validation (Section 3.2), reflecting systematic deviations between the simulation model and the physical vehicle. However, when control strategies are compared on the same simulation platform, such systematic deviations largely cancel out in a relative comparison. Therefore, the reported relative energy savings—although derived from a model with known accuracy limitations—remain indicative of the proposed strategy’s potential. Reducing the model’s absolute error through further experimental calibration is an important direction for future work. For this reason, the 6.31% saving should be interpreted as a model-based relative improvement rather than a directly measured vehicle-level energy-saving value.

3.4. Performance Analysis Under CLTC-P Driving Cycles

Both the NEDC and CLTC-P cycles were adopted. The CLTC-P cycle better represents actual driving behavior in China, for control-strategy comparison. Under the CLTC-P condition, two control strategies, baseline rule-based control and the SSA-NMPC strategy, were assessed. The simulation conditions included an ambient temperature of 35 °C (700 W/m2) in summer and −7 °C in winter. The battery control target was set according to the corresponding thermal condition: cooling was activated near 35 °C in summer, whereas the winter heating target was 15 °C.

3.4.1. Summer Cooling Conditions

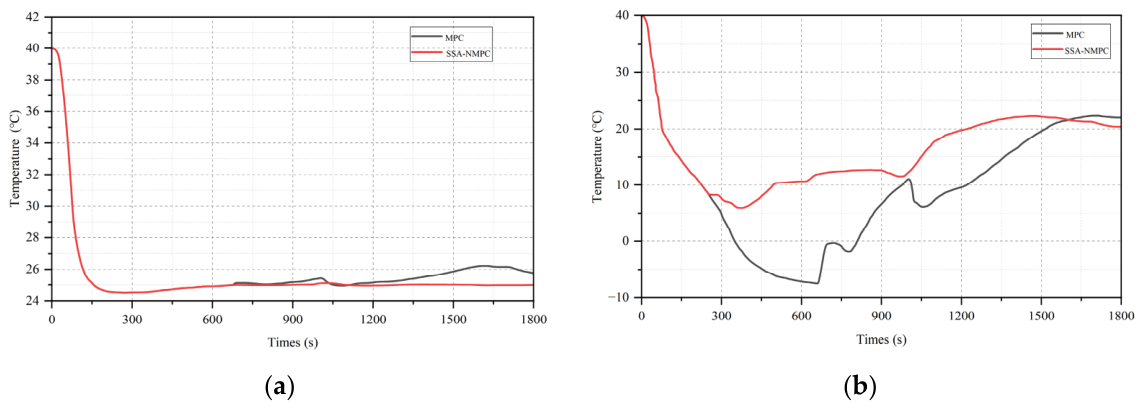
Figure 13 compares passenger compartment temperatures under two control strategies during summer cooling. Under baseline rule-based control, the cabin temperature increases after 900–1000 s and again near 1200 s. In contrast, under the SSA-NMPC strategy, the cabin temperature stabilizes around 25 °C.
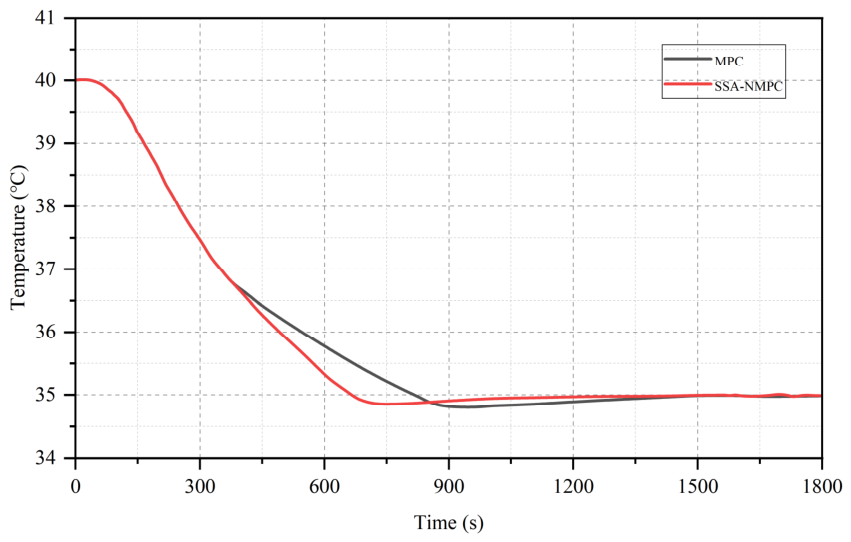
Figure 14 illustrates the comparison of battery temperatures under summer conditions. With the SSA-NMPC strategy, the battery temperature decreases more swiftly, achieving the target temperature of 35°C a full 200 s sooner than with baseline rule-based control. This results in a 22% reduction in cooling time.
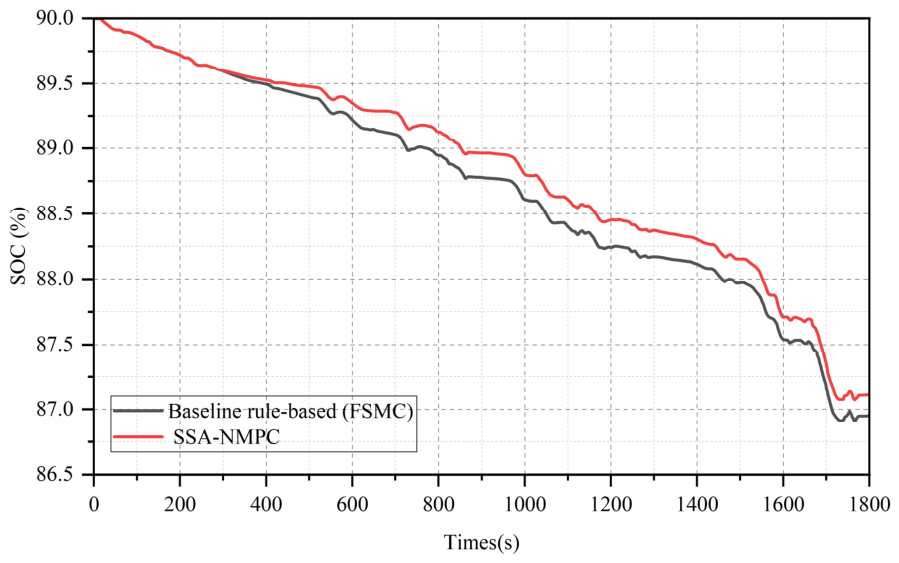
Figure 15 illustrates the SOC consumption for the two control strategies. The SSA-NMPC strategy demonstrates lower SOC consumption, achieving a 6.7% reduction in energy use compared to the baseline rule-based control.

3.4.2. Heating Operation Mode in Winter

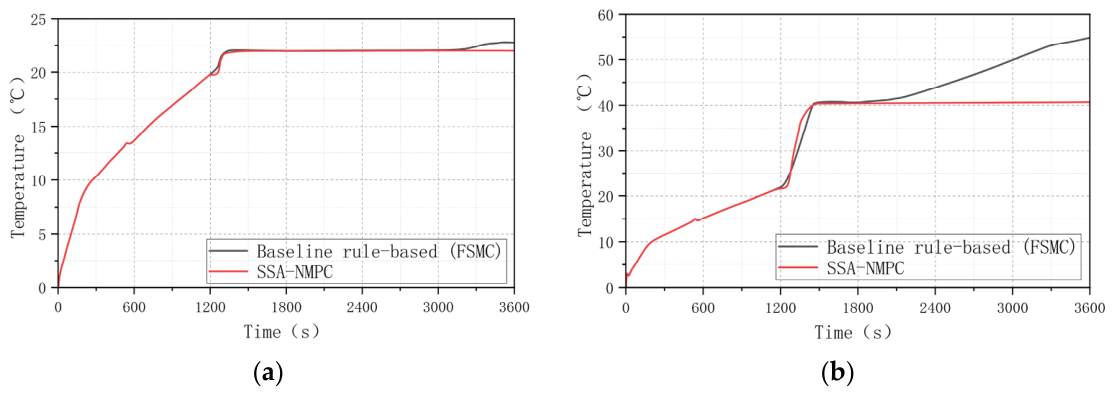
Figure 16 compares the passenger compartment temperature with two control strategies for winter heating conditions. Under baseline rule-based control (FSMC), the cabin temperature approaches a steady state after approximately 300 s. In contrast, under the SSA-NMPC strategy, the cabin temperature stabilizes around 22 °C. Figure 16a and Figure 16b show the temperature of the cabin and air outlet, respectively.
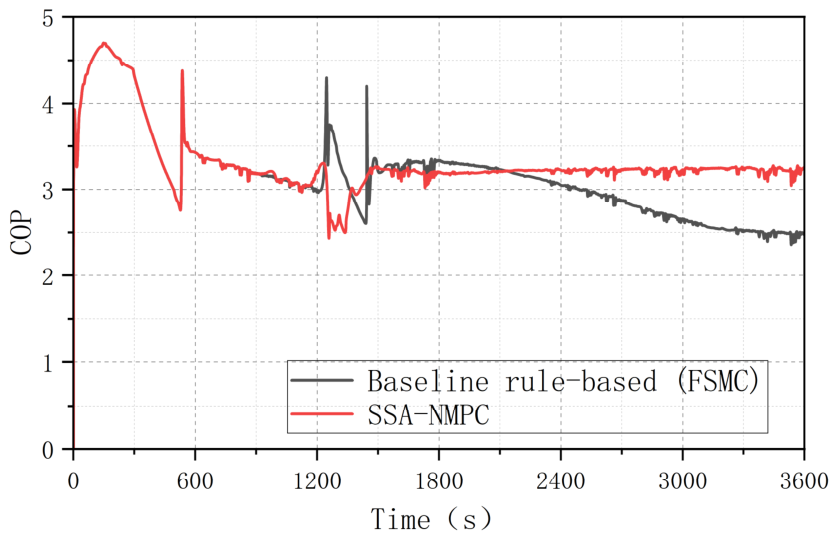
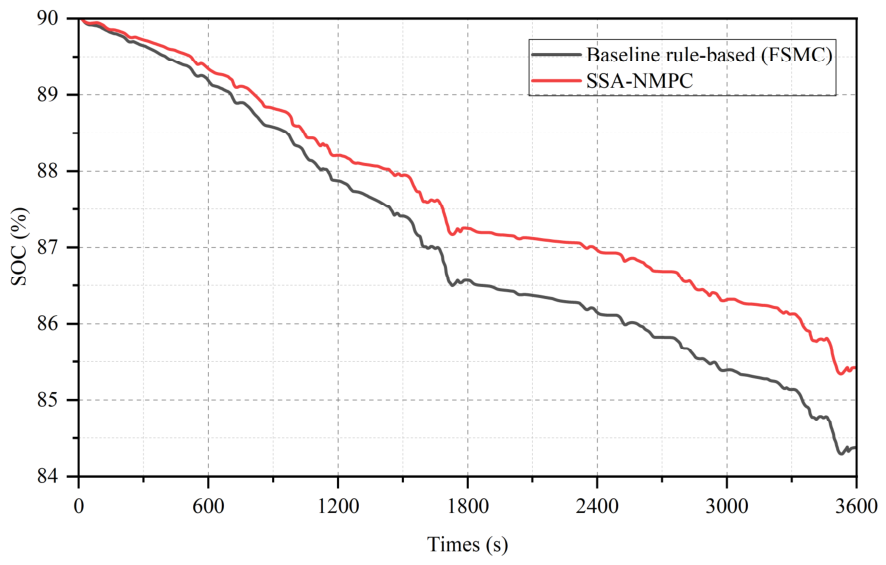
Figure 17 illustrates the system’s coefficient of performance (COP) during winter conditions. The COP for the SSA-NMPC strategy is consistently higher, indicating more efficient operation of the heat pump system. As shown in Figure 18, the SSA-NMPC strategy’s SOC consumption is 19.6% lower compared to that of the baseline rule-based control under the investigated CLTC-P winter conditions.
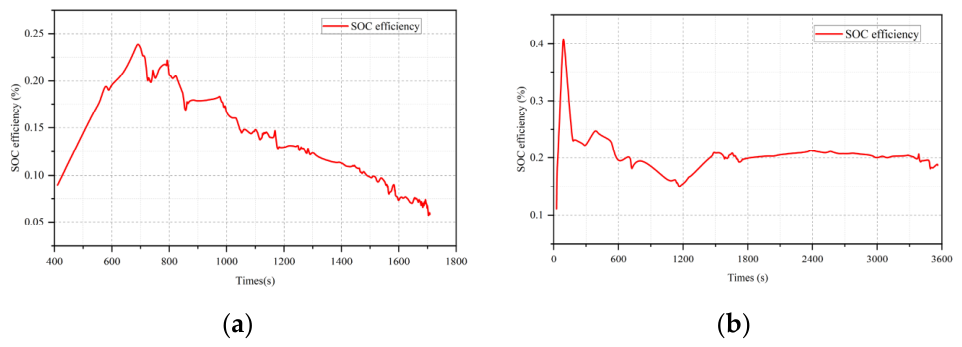
To quantitatively assess the energy efficiency of the proposed controller, we define two SOC-based efficiency metrics. Figure 19a shows the cumulative SOC efficiency under summer cooling, which exhibits fluctuations reflecting transient coordination of the compressor and pump. Figure 19b presents the cumulative SOC efficiency under winter heating, which gradually increases and stabilizes above 15%, indicating consistent energy savings over the entire driving cycle.

3.5. Discussion of Limitations

Although the proposed SSA-NMPC strategy shows improved performance under demanding thermal conditions, several limitations should be noted. First, the vehicle-level validation currently includes representative summer and winter cases rather than a full repeatability campaign. Additional tests under multiple initial SOC levels, ambient temperatures, and driving profiles are needed to quantify uncertainty and robustness. Second, the motor thermal subsystem is treated as a boundary heat source for waste heat recovery rather than as a fully resolved thermal model. Therefore, the scope of the present work should be described as cabin and battery thermal regulation with consideration of motor waste heat utilization, rather than comprehensive three-subsystem optimization. Third, battery degradation is not modeled. The thermal management strategy is evaluated under the assumption of a fresh battery; its interaction with SOH-dependent heat generation and aging acceleration remains unexplored in this work. Fourth, SSA is used for offline weight tuning based on its reported convergence benefits, but direct application-specific benchmarking against GA, PSO, and other optimizers would further strengthen the algorithmic justification. Finally, the vehicle-level energy savings reported in this work may contribute to extended driving range and reduced charging frequency under the investigated operating conditions. However, these results cannot be directly extrapolated to determine charging station numbers, locations, charger types (e.g., fast vs. slow), or fleet dispatch strategies. Such infrastructure-level planning would require a separate multi-scale framework that couples vehicle energy consumption, routing behavior, charging decisions, and grid constraints [12]. The present work does not solve the charging-location or infrastructure-planning problem; it provides a vehicle-level energy-saving module that could, in future work, be coupled with route- and infrastructure-level optimization models.

4. Conclusions

In this study, we developed an SSA-NMPC strategy for the integrated thermal management of battery electric vehicles. The proposed framework couples a heat pump refrigerant cycle, cabin thermal dynamics, and a battery electro-thermal model, while the motor is considered a boundary heat source for waste heat recovery. The model was calibrated and validated using bench and vehicle-level tests, with mean relative errors of 4.76% for the refrigerant mass flow rate, 4.30% for heating capacity, and 10.67% for cooling capacity. Vehicle-level summer and winter tests further confirmed acceptable agreement between the experimental and simulated SOC trends.
Under the NEDC-based high-load assessment, the SSA-NMPC strategy maintained cabin temperature overshoot within 0.35 °C and battery temperature fluctuation within 0.26 °C, while reducing thermal management energy consumption by 6.31% under high-speed cruising compared with the baseline rule-based strategy. Under the CLTC-P cycle, the proposed controller reduced the battery cooling time by 22% in summer and lowered SOC consumption by 19.6% in winter, mainly because the predictive coordination of the compressor, valves, and coolant pumps improved heat pump operating efficiency and avoided unnecessary thermal actuation.
The results indicate the potential of predictive multi-objective control to improve cabin comfort, battery thermal regulation, and thermal management energy efficiency under the investigated demanding operating conditions. The resulting extension of driving range and reduction in charging frequency are quantified at the vehicle level only; no claims are made regarding optimal charging station deployment or grid-level infrastructure planning. However, the experimental validation remains limited to representative vehicle-level cases, and the motor thermal dynamics are simplified. Future work will include repeatability tests, uncertainty quantification, the direct benchmarking of SSA against GA and PSO for the same control problem, and the integration of the vehicle-level energy model into route- and charging-demand simulations to evaluate the broader impact on charging behavior and infrastructure utilization.
Image Source Statement: All figures in this manuscript are original work created by the authors, unless otherwise explicitly noted. The simulation results (Figure 5, Figure 10, Figure 11, Figure 12, Figure 13, Figure 14, Figure 15, Figure 16, Figure 17 and Figure 18) were generated from the authors’ experimentally calibrated Amesim/MATLAB model. The experimental data (Figure 6, Figure 7, Figure 8 and Figure 9) were obtained from vehicle tests conducted by the authors at Jiangsu University. No figure has been copied or directly adapted from any previously published paper without permission. The raw data and plotting scripts are available from the corresponding author upon reasonable request.

Author Contributions

Conceptualization, G.Y. and C.P.; Methodology, G.Y. and C.P.; Software, G.Y., G.X. and Z.J.; Validation, G.Y. and G.X.; Formal analysis, G.Y.; Investigation, G.Y.; Resources, G.Y., J.W. and Z.J.; Data curation, G.Y.; Writing—original draft, G.Y.; Writing—review & editing, G.Y., G.X., J.W. and Z.J.; Visualization, G.Y.; Supervision, G.X., C.P., J.W. and Z.J.; Project administration, C.P.; Funding acquisition, C.P. All authors have read and agreed to the published version of the manuscript.

Funding

This research received no external funding.

Data Availability Statement

The original contributions presented in this study are included in the article. Further inquiries can be directed to the corresponding author.

Conflicts of Interest

The authors declare no conflict of interest.

References

  1. Hwang, F.S.; Confrey, T.; Reidy, C.; Picovici, D.; Callaghan, D.; Culliton, D.; Nolan, C. Review of Battery Thermal Management Systems in Electric Vehicles. Renew. Sustain. Energy Rev. 2024, 192, 114171. [Google Scholar] [CrossRef]
  2. Wang, M.; Dong, B.; Liang, K.; Wang, L.; Liu, R.; Mi, G. Influence of Thermal Management Strategy on Driving Range of Pure Electric Vehicle During Cold Start in Winter. J. Refrig. 2021, 42, 60–66. [Google Scholar] [CrossRef]
  3. Akkuş, F.; Işık, M.Z. A Review of Thermal Management Systems of Lithium-Ion Batteries Used in Electric Vehicles. J. Traffic Transp. Eng. (Engl. Ed.) 2025, 12, 1763–1783. [Google Scholar] [CrossRef]
  4. Zhao, Y.; Zhang, X.; Yang, B.; Cai, S. A Review of Battery Thermal Management Systems Using Liquid Cooling and PCM. J. Energy Storage 2024, 76, 109836. [Google Scholar] [CrossRef]
  5. Xu, L.; Wang, S.; Xi, L.; Li, Y.; Gao, J. A Review of Thermal Management and Heat Transfer of Lithium-Ion Batteries. Energies 2024, 17, 3873. [Google Scholar] [CrossRef]
  6. Hu, S.; Yao, M.; Zhu, B.; Yan, Z.; Zhang, N. Adaptive Real-Time Control Strategy for Extended-Range Electric Vehicles Considering Battery Temperature Maintenance and Cabin Thermal Comfort in Low-Temperature Environments. Int. J. Heat Mass Transf. 2025, 240, 126662. [Google Scholar] [CrossRef]
  7. Min, H.; Zhang, Z.; Sun, W.; Min, Z.; Yu, Y.; Wang, B. A Thermal Management System Control Strategy for Electric Vehicles under Low-Temperature Driving Conditions Considering Battery Lifetime. Appl. Therm. Eng. 2020, 181, 115944. [Google Scholar] [CrossRef]
  8. He, L.; Jing, H.; Zhang, Y.; Li, P.; Gu, Z. Review of Thermal Management System for Battery Electric Vehicle. J. Energy Storage 2023, 59, 106443. [Google Scholar] [CrossRef]
  9. Wang, W.; Ren, J.; Yin, X.; Qiao, Y.; Cao, F. Energy-Efficient Operation of the Thermal Management System in Electric Vehicles via Integrated Model Predictive Control. J. Power Sources 2024, 603, 234415. [Google Scholar] [CrossRef]
  10. Zhao, Y.; Dan, D.; Zheng, S.; Wei, M.; Xie, Y. A Two-Stage Eco-Cooling Control Strategy for Electric Vehicle Thermal Management System Considering Multi-Source Information Fusion. Energy 2023, 267, 126606. [Google Scholar] [CrossRef]
  11. Ma, Q.; Ma, Y.; Gao, J.; Chen, H. Optimal Economic Integrated Thermal Management of Battery and Cabin for Connected Electric Vehicles Considering Battery Degradation. eTransportation 2026, 27, 100540. [Google Scholar] [CrossRef]
  12. Dai, C.; Lin, W.; Li, S.; Chen, X.; Song, W.; Feng, Z.; Kuznik, F. NSGA-II Optimization-Assisted Model Predictive Control Strategy for Electric Vehicle Thermal Management Systems. Energy Storage Sci. Technol. 2025, 14, 2200–2214. [Google Scholar] [CrossRef]
  13. Grden, L.; Cvok, I.; Deur, J. Nonlinear Model Predictive Control of an Electric Vehicle Heat Pump System for Improved Energy Efficiency. In Proceedings of the 20th Conference on Sustainable Development of Energy, Water and Environment Systems, Dubrovnik, Croatia, 5–10 October 2025. [Google Scholar]
  14. Liang, K.; Zhang, Y.; Wang, W.; Gao, C.; Chen, H.; Li, K.; Zhou, X.; Chen, B.; Cao, Y.; Wang, W.; et al. Performance Analysis and Multi-Objective Optimization of Refrigerant-Based Integrated Thermal Management System for Electric Vehicles. Appl. Therm. Eng. 2024, 244, 122707. [Google Scholar] [CrossRef]
  15. Jia, Z. Research on Control Strategy of Electric Vehicle Battery Liquid Cooling System Based on Model Prediction. Master’s Thesis, Jiangsu University, Zhenjiang, China, 2024. [Google Scholar]
  16. Li, X.; Guo, L.; Wang, S. MSSSA: A Multi-Strategy Enhanced Sparrow Search Algorithm for Global Optimization. Swarm Evol. Comput. 2023, 79, 101316. [Google Scholar] [CrossRef]
  17. Shao, X.; Yu, J.; Li, Z.; Yang, X.; Sundén, B. Energy-Saving Optimization of the Parallel Chillers System Based on a Multi-Strategy Improved Sparrow Search Algorithm. Heliyon 2023, 9, e21012. [Google Scholar] [CrossRef]
  18. Li, D.; Hu, Q.; Jiang, W.; Dong, H.; Song, Z. Integrated Power and Thermal Management for Enhancing Energy Efficiency and Battery Life in Connected and Automated Electric Vehicles. Appl. Energy 2025, 396, 126213. [Google Scholar] [CrossRef]
  19. Quintana, C.L.; Climent, L.; Arbelaez, A. A Robust Optimization Framework for eBus Charging Infrastructure Planning. J. Heuristics 2026, 32, 12. [Google Scholar] [CrossRef]
  20. Wei, F.; Feng, Y.; Shi, X.; Hou, K. Improved Sparrow Search Algorithm with Adaptive Multi-Strategy Hierarchical Mechanism for Global Optimization and Engineering Problems. Clust. Comput. 2025, 28, 215. [Google Scholar] [CrossRef]
  21. Ren, Y.; Lu, H.; Zhang, N.; Wu, X. Towards the Optimal Leverage of Dynamic Performance and Vibrational Cost: A Novel Nonlinear Control Strategy for Thermal Management in the Fuel-Cell System. Energy 2025, 335, 138141. [Google Scholar] [CrossRef]
  22. Xu, C.; Long, T. Research on Control Strategy of Electric Vehicle Heat Pump Air Conditioning System in Low Temperature Environment. In Proceedings of the 33rd Chinese Control and Decision Conference (CCDC), Kunming, China, 22–24 May 2021; pp. 7433–7437. [Google Scholar] [CrossRef]
  23. Zhang, X.; Gao, C.; Gao, Q.; Gao, Y. Experimental Study on an Integrated Thermal Management System for Electric Vehicle with Collaborative Control. Appl. Therm. Eng. 2024, 240, 122249. [Google Scholar] [CrossRef]
  24. Yadav, P.; Jinadasa, L.; Wray, A.; Petrovich, S.; Georgiou, M.; Ebrahimi, K. Battery Electric Vehicle Thermal Management System Modelling and Validation. Thermo 2026, 6, 4. [Google Scholar] [CrossRef]
  25. Xie, Y.; Ou, J.; Li, W.; Li, K.; Liu, J.; Liu, Z.; Zhou, D.; Li, J. An Intelligent Eco-Heating Control Strategy for Heat-Pump Air Conditioning System of Electric Vehicles. Appl. Therm. Eng. 2022, 216, 119126. [Google Scholar] [CrossRef]
  26. Lei, S.; Zhao, Z.; Cui, Z.; Xin, S. Performance Studies of an Innovative Hybrid Integrated Thermal Management System Based on CO2 Heat Pump for Electric Vehicles. Int. Commun. Heat Mass Transf. 2026, 171, 110070. [Google Scholar] [CrossRef]
  27. Wang, T. Energy Saving Potential Analysis of Waste Heat Recovery for Electric Vehicles under Low Temperature Operating Conditions. J. Refrig. 2025, 47, 51–60. [Google Scholar] [CrossRef]
  28. Zhang, Y.; Zhao, D.; Wu, L.; He, L.; Huang, J.; Zhao, Y. Multi-Objective Optimization under the Mixed Utilization Strategy of Heat Pump and Electric Drive Waste Heat of Electric Vehicles. Appl. Therm. Eng. 2025, 259, 124900. [Google Scholar] [CrossRef]
  29. Bhattacharyya, S.; Li, K.; Dinh, Q.T. Mode-Selecting Nonlinear Model Predictive Control for Enhanced Thermal Management in Electric Refrigerated Vans. In Proceedings of the 2025 IEEE/AIAA Transportation Electrification Conference and Electric Aircraft Technologies Symposium (ITEC + EATS), Anaheim, CA, USA, 18–20 June 2025; pp. 1–6. [Google Scholar] [CrossRef]
  30. Gnielinski, V. New Equations for Heat and Mass Transfer in Turbulent Flow in Pipes and Channels. Int. J. Heat Mass Transf. 1976, 19, 159–167. [Google Scholar] [CrossRef]
  31. Shah, M.M. A General Correlation for Heat Transfer during Film Condensation inside Pipes. Int. J. Heat Mass Transf. 1979, 22, 547–556. [Google Scholar] [CrossRef]
  32. Dittus, F.W.; Boelter, L.M.K. Heat Transfer in Automobile Radiators of the Tubular Type. Univ. Calif. Publ. Eng. 1930, 2, 443–461. [Google Scholar] [CrossRef]
  33. Chen, J.C. Correlation for Boiling Heat Transfer to Saturated Fluids in Convective Flow. Ind. Eng. Chem. Process Des. Dev. 1966, 5, 322–329. [Google Scholar] [CrossRef]
  34. Kim, M.H.; Bullard, C.W. Air-Side Thermal Hydraulic Performance of Multi-Louvered Fin Aluminum Heat Exchangers. Int. J. Refrig. 2002, 25, 390–400. [Google Scholar] [CrossRef]
  35. Bernardi, D.; Pawlikowski, E.; Newman, J. A General Energy Balance for Battery Systems. J. Electrochem. Soc. 1985, 132, 5–12. [Google Scholar] [CrossRef]
  36. Fan, S. Modeling of Thermal Management System for Electric Vehicles and Research on Battery Temperature Control Strategy in Winter. Master’s Thesis, South China University of Technology, Guangzhou, China, 2022. [Google Scholar]
  37. Du, C.; Sun, J.; Li, W.; Ren, W. Integrated Design of Thermal Management System for Pure Electric Vehicles and Research on Multi-Level Fuzzy Control Strategy. Automot. Technol. 2025, 2, 17–25. [Google Scholar] [CrossRef]
Figure 1. Structure diagram of the thermal management system.
Energies 19 02687 g001
Figure 2. Various operation modes of the thermal management system. (a) Cabin and battery heating mode. (b) Battery waste heat recovery mode. (c) Natural heat dissipation mode of the battery.
Energies 19 02687 g002aEnergies 19 02687 g002b
Figure 3. Discretized one-dimensional heat transfer representation of the heat exchanger used in the present model.
Energies 19 02687 g003
Figure 4. Diagram of the logical relationships among the threshold values within the vehicle’s comprehensive thermal management system.
Energies 19 02687 g004
Figure 5. Vehicle speed profiles under the CLTC-P and NEDC driving cycles. (a) CLTC-P driving cycle; (b) New European Driving Cycle (NEDC).
Energies 19 02687 g005
Figure 6. Vehicle-test and simulation comparison of battery temperature under the representative high-temperature summer validation condition (ambient temperature, 40 °C; vehicle speed, 138 km/h).
Energies 19 02687 g006
Figure 7. Comparison of the state of charge (SOC) between an actual vehicle and a simulated battery under high-temperature conditions during the summer.
Energies 19 02687 g007
Figure 8. Vehicle-test and simulation comparison of battery temperature under the representative low-temperature winter validation condition (ambient temperature, −17 °C; vehicle speed, 72 km/h).
Energies 19 02687 g008
Figure 9. Comparison of the state of charge (SOC) between an actual vehicle and a simulated battery under low-temperature winter conditions.
Energies 19 02687 g009
Figure 10. Cabin temperature variation under NEDC driving condition. (a) High-speed cruise; (b) waste heat recovery; (c) natural heat dissipation.
Energies 19 02687 g010
Figure 11. Battery temperature variation under NEDC driving condition.
Energies 19 02687 g011
Figure 12. Operating mode selection and total thermal management energy consumption under the NEDC driving cycle, comparing experiment results and model results.
Energies 19 02687 g012
Figure 13. Comparison of passenger cabin temperatures in summer with different compressor control strategies. (a) Passenger cabin temperatures; (b) passenger cabin air outlet temperatures.
Energies 19 02687 g013
Figure 14. Battery temperature evolution under summer cooling conditions (CLTC-P cycle, control to 35 °C) for baseline rule-based control versus the proposed SSA-NMPC strategy.
Energies 19 02687 g014
Figure 15. Comparison of SOC consumption under CLTC-P summer cooling condition between baseline rule-based control and SSA-NMPC strategy.
Energies 19 02687 g015
Figure 16. Comparison of passenger cabin temperatures in winter with different compressor control strategies. (a) Passenger cabin temperatures; (b) passenger cabin air outlet temperatures.
Energies 19 02687 g016
Figure 17. Comparison of COP in winter with different compressor control strategies.
Energies 19 02687 g017
Figure 18. SOC trajectories of the baseline rule-based controller and the proposed SSA-NMPC controller under the CLTC-P summer cooling condition.
Energies 19 02687 g018
Figure 19. SOC efficiency indicators under CLTC-P driving cycles. (a) Cumulative SOC efficiency (ηinst) during summer cooling; (b) Cumulative SOC efficiency (ηcum) during winter heating.
Energies 19 02687 g019
Table 1. Structural parameters of the primary components in the thermal management system.
ComponentParametersNumerical ValuesUnits
CompressorDisplacement161cc
CondenserLength × Width × Height685 × 475 × 16mm
EvaporatorLength × Width × Height295 × 272 × 38mm
Expansion valveCross-sectional area2.14mm2
Plate heat exchangerLength × Width × Height150 × 76 × 2.5mm
Heat sinkLength × Width × Height320 × 275 × 16mm
Table 2. (a) Vehicle thermal management system operating modes. (b) Summary of NMPC parameters.
(a)
Operating ModeTemperatureCompressor or PTCElectronic Expansion Valve OpensGlobe Valve OpenPump OpenFour-Way Valve ReversingThree-Way Valve Reversing
1. Cabin coolingTcab ≥ 25 °C
15 °C < Tbat < 35 °C
Compressor1, 21, 2
2. Battery coolingTamb ≥ 25 °C
Tcab < 25 °C
Tbat > 35 °C
Compressor42
3. Parallel cooling of cabin and batteryTamb ≥ 25 °C
Tcab ≥ 25 °C
Tbat > 35 °C
Compressor1, 2, 41, 22
4. Heat pump air conditioning to heat the cabinTamb > −10 °C
Tcab < 25 °C
Compressor333
5. Heat pump air conditioning to heat the batteryTamb > −10 °C
Tbat < 15 °C
Compressor332, 31
6. PTC to heat the cabinTamb ≤ −10 °C
Tcab < 25 °C
PTC1, 23
7. PTC to heat the batteryTamb ≤ −10 °C
Tbat < 15 °C
PTC1, 22, 31
8. Motor waste heat10 °C ≤ Tbat < 15 °C
Tmw > Tbat + 5 °C
Tcab > 25 °C
1, 21
9. Heat radiator to dissipate battery heatTamb < 25 °C
Tbat > 35 °C
1, 212
10. Heat radiator to dissipate motorTm > 90 °C12
(b)
ParameterSymbolValue
Prediction horizonNp12
Control horizonNc4
Sampling intervalTs1 s
Battery temperature weight (J1)ω1SSA-optimized
Temperature uniformity weight (J2)ω2SSA-optimized
Energy consumption weight (J3)ω3SSA-optimized
Compressor speed constraint≤6000 rpm
EXV opening constraint5–95%
Battery temperature constraint25–45 °C
Cabin temperature constraint20–28 °C
Table 3. Key specifications of the test vehicle.
ParameterValueUnit
Vehicle typeCompact electric passenger car
Curb weight1650kg
Battery typeLithium iron phosphate (LFP)
Battery system nominal voltage345.6V
Battery system total energy54.3kWh
Motor typePermanent magnet synchronous
Motor peak power60kW
Thermal management systemHeat pump-based integrated system
RefrigerantR134a
Table 4. Summary of experimental test conditions.
ParameterSummer, High TemperatureWinter, Low Temperature
Ambient temperature40 °C−17 °C
Driving speed138 km/h72 km/h
Initial battery temperature33.5 °C8 °C
Initial SOC75.35%86%
Target cabin temperature25 °C22 °C
Target battery temperature≤35 °C≥15 °C
Test duration2100 s2100 s
Terminal SOC (test)66.00%74.55%
Table 5. Bench test verification error summary.
MetricMAEMax Absolute ErrorMean Relative Error (%)
Refrigerant mass flow rate (g/s)1.262.344.76
Heating capacity (kW)0.210.484.30
Cooling capacity (kW)0.430.8910.67
Table 6. Vehicle-level battery temperature validation error metrics.
MetricValue
MAE0.20 °C
RMSE0.29 °C
Maximum absolute error0.50 °C
Standard deviation0.22 °C
Table 7. Cabin temperature error metrics under the NMPC strategy (NEDC conditions).
ProjectMAEMSERMSE
NMPC0.9515.933.99
Table 8. Battery temperature error under various control strategies in NEDC conditions.
ProjectMAEMSERMSE
FSMC (Baseline rule-based)0.210.0890.298
NMPC0.0620.00980.099
SSA-NMPC0.0370.00420.076
Disclaimer/Publisher’s Note: The statements, opinions and data contained in all publications are solely those of the individual author(s) and contributor(s) and not of MDPI and/or the editor(s). MDPI and/or the editor(s) disclaim responsibility for any injury to people or property resulting from any ideas, methods, instructions or products referred to in the content.