1. Introduction
Reliability and durability of electrical equipment are critical factors that determine the stability of modern electric power systems. Electrical machines, transformers, cables, and other components of electrotechnical complexes operate under continuously changing electrical and environmental stresses that can significantly affect their technical condition and service life. In recent years, the rapid growth of nonlinear loads, power electronic converters, renewable energy sources, and distributed generation facilities has led to a noticeable deterioration in power quality (PQ) indices in many electrical networks. As a result, disturbances such as voltage sags, harmonic and interharmonic distortion, voltage fluctuations, and load unbalance have become increasingly common in modern power supply systems.
An additional factor complicating the operating conditions of modern power supply systems is the development of hybrid energy complexes based on renewable energy sources and energy storage systems, including hydrogen technologies, as well as photovoltaic generation, with the widespread use of bifacial photovoltaic panels characterized by a wide variety of rated parameters and design solutions. For such complexes, operating-mode control algorithms and energy flow coordination become particularly important, which further increases the requirements for PQ and the operational stability of electrical equipment [
1,
2,
3].
Despite the growing number of studies devoted to specific aspects of PQ and insulation degradation in electrical equipment, a comprehensive analysis linking the deterioration of power quality indices with reliability models and predictive maintenance approaches remains insufficiently developed. Existing studies generally focus either on the effects of individual disturbances on equipment operation or on the development of reliability modeling methods without explicitly accounting for PQ. In this regard, there is a need for a systematic review that combines the analysis of PQ disturbances, insulation degradation mechanisms in electrical equipment, and reliability assessment models.
The aim of this study is to provide a comprehensive review of the influence of PQ and operating conditions on the technical condition and reliability of electrical equipment. The article analyzes the mechanisms through which PQ disturbances affect insulation degradation processes, considers existing approaches to reliability assessment modeling, and examines modern monitoring and diagnostic methods based on data analysis and machine learning techniques. In addition, the paper proposes an integrated conceptual framework that links PQ disturbances with equipment degradation processes, reliability models, and predictive maintenance strategies.
The objects of the study are power transformers, cable lines, and asynchronous motors of industrial enterprises operated under conditions of deviations in power quality indicators. The subject of the study is the mechanisms of accelerated aging of insulation and related thermal, electrical, and mechanical stresses, as well as methods for assessing, monitoring, and predicting the reduction in the service life of these objects under the influence of harmonic and interharmonic components, voltage unbalance, voltage dips, overvoltages, overloads, and related operating factors. The study is based on the hypothesis that deterioration in power quality indicators leads to an increase in additional losses, local overheating, and accelerated accumulation of insulation damage, while the combined consideration of power quality parameters, load conditions, ambient temperature, and humidity makes it possible to assess the remaining service life of equipment more accurately than the traditional scheduled maintenance approach.
The main results and contributions of this review are as follows:
A systematic analysis of published studies on the influence of PQ disturbances on insulation degradation mechanisms in electrical equipment, including transformers, electrical machines, cables, and power lines, has been carried out;
A comparative review of approaches to reliability assessment modeling used to determine equipment service life has been performed, including thermal aging models, statistical reliability models, and methods for predicting remaining useful life;
Modern methods for monitoring and diagnosing electrical equipment based on machine learning and intelligent condition monitoring systems have been analyzed;
Key scientific challenges and promising directions for further research related to the integration of PQ analysis into reliability assessment methods and predictive maintenance of power system equipment have been identified.
The obtained results may contribute to the development of comprehensive reliability assessment approaches that account for PQ and enable more effective implementation of condition-based maintenance strategies in modern electric power systems.
2. Methodology
This study applies a systematic approach to the analysis of scientific literature devoted to the influence of PQ on the technical condition and reliability of electrical equipment. The review procedure was structured in accordance with the general logic of systematic literature review reporting, including identification, screening, eligibility assessment, and final inclusion of sources, following the PRISMA 2020 recommendations [
4]. The research methodology is based on the principles of a systematic literature review and includes the stages of searching, screening, analyzing, and structuring scientific publications.
The search for scientific publications was conducted in leading international bibliographic databases: Scopus, Web of Science, IEEE Xplore, and ScienceDirect.
The selection of these databases was determined by their high level of coverage of scientific journals in the fields of electric power engineering, reliability of technical systems, and diagnostics.
The search for publications was carried out using combinations of keywords reflecting the main research areas. The search queries included power quality, harmonics, voltage sag, voltage fluctuation, power system disturbances, equipment aging, transformer insulation aging, electrical equipment reliability, remaining useful life, predictive maintenance, and machine learning diagnostics.
The following inclusion criteria were applied to form the final sample of publications:
Publications in peer-reviewed scientific journals;
Studies focused on the influence of PQ on degradation processes or the reliability of electrical equipment;
Studies containing analytical models, experimental investigations, or diagnostic methods;
Publications written in English;
Articles published predominantly in the period 2021–2026.
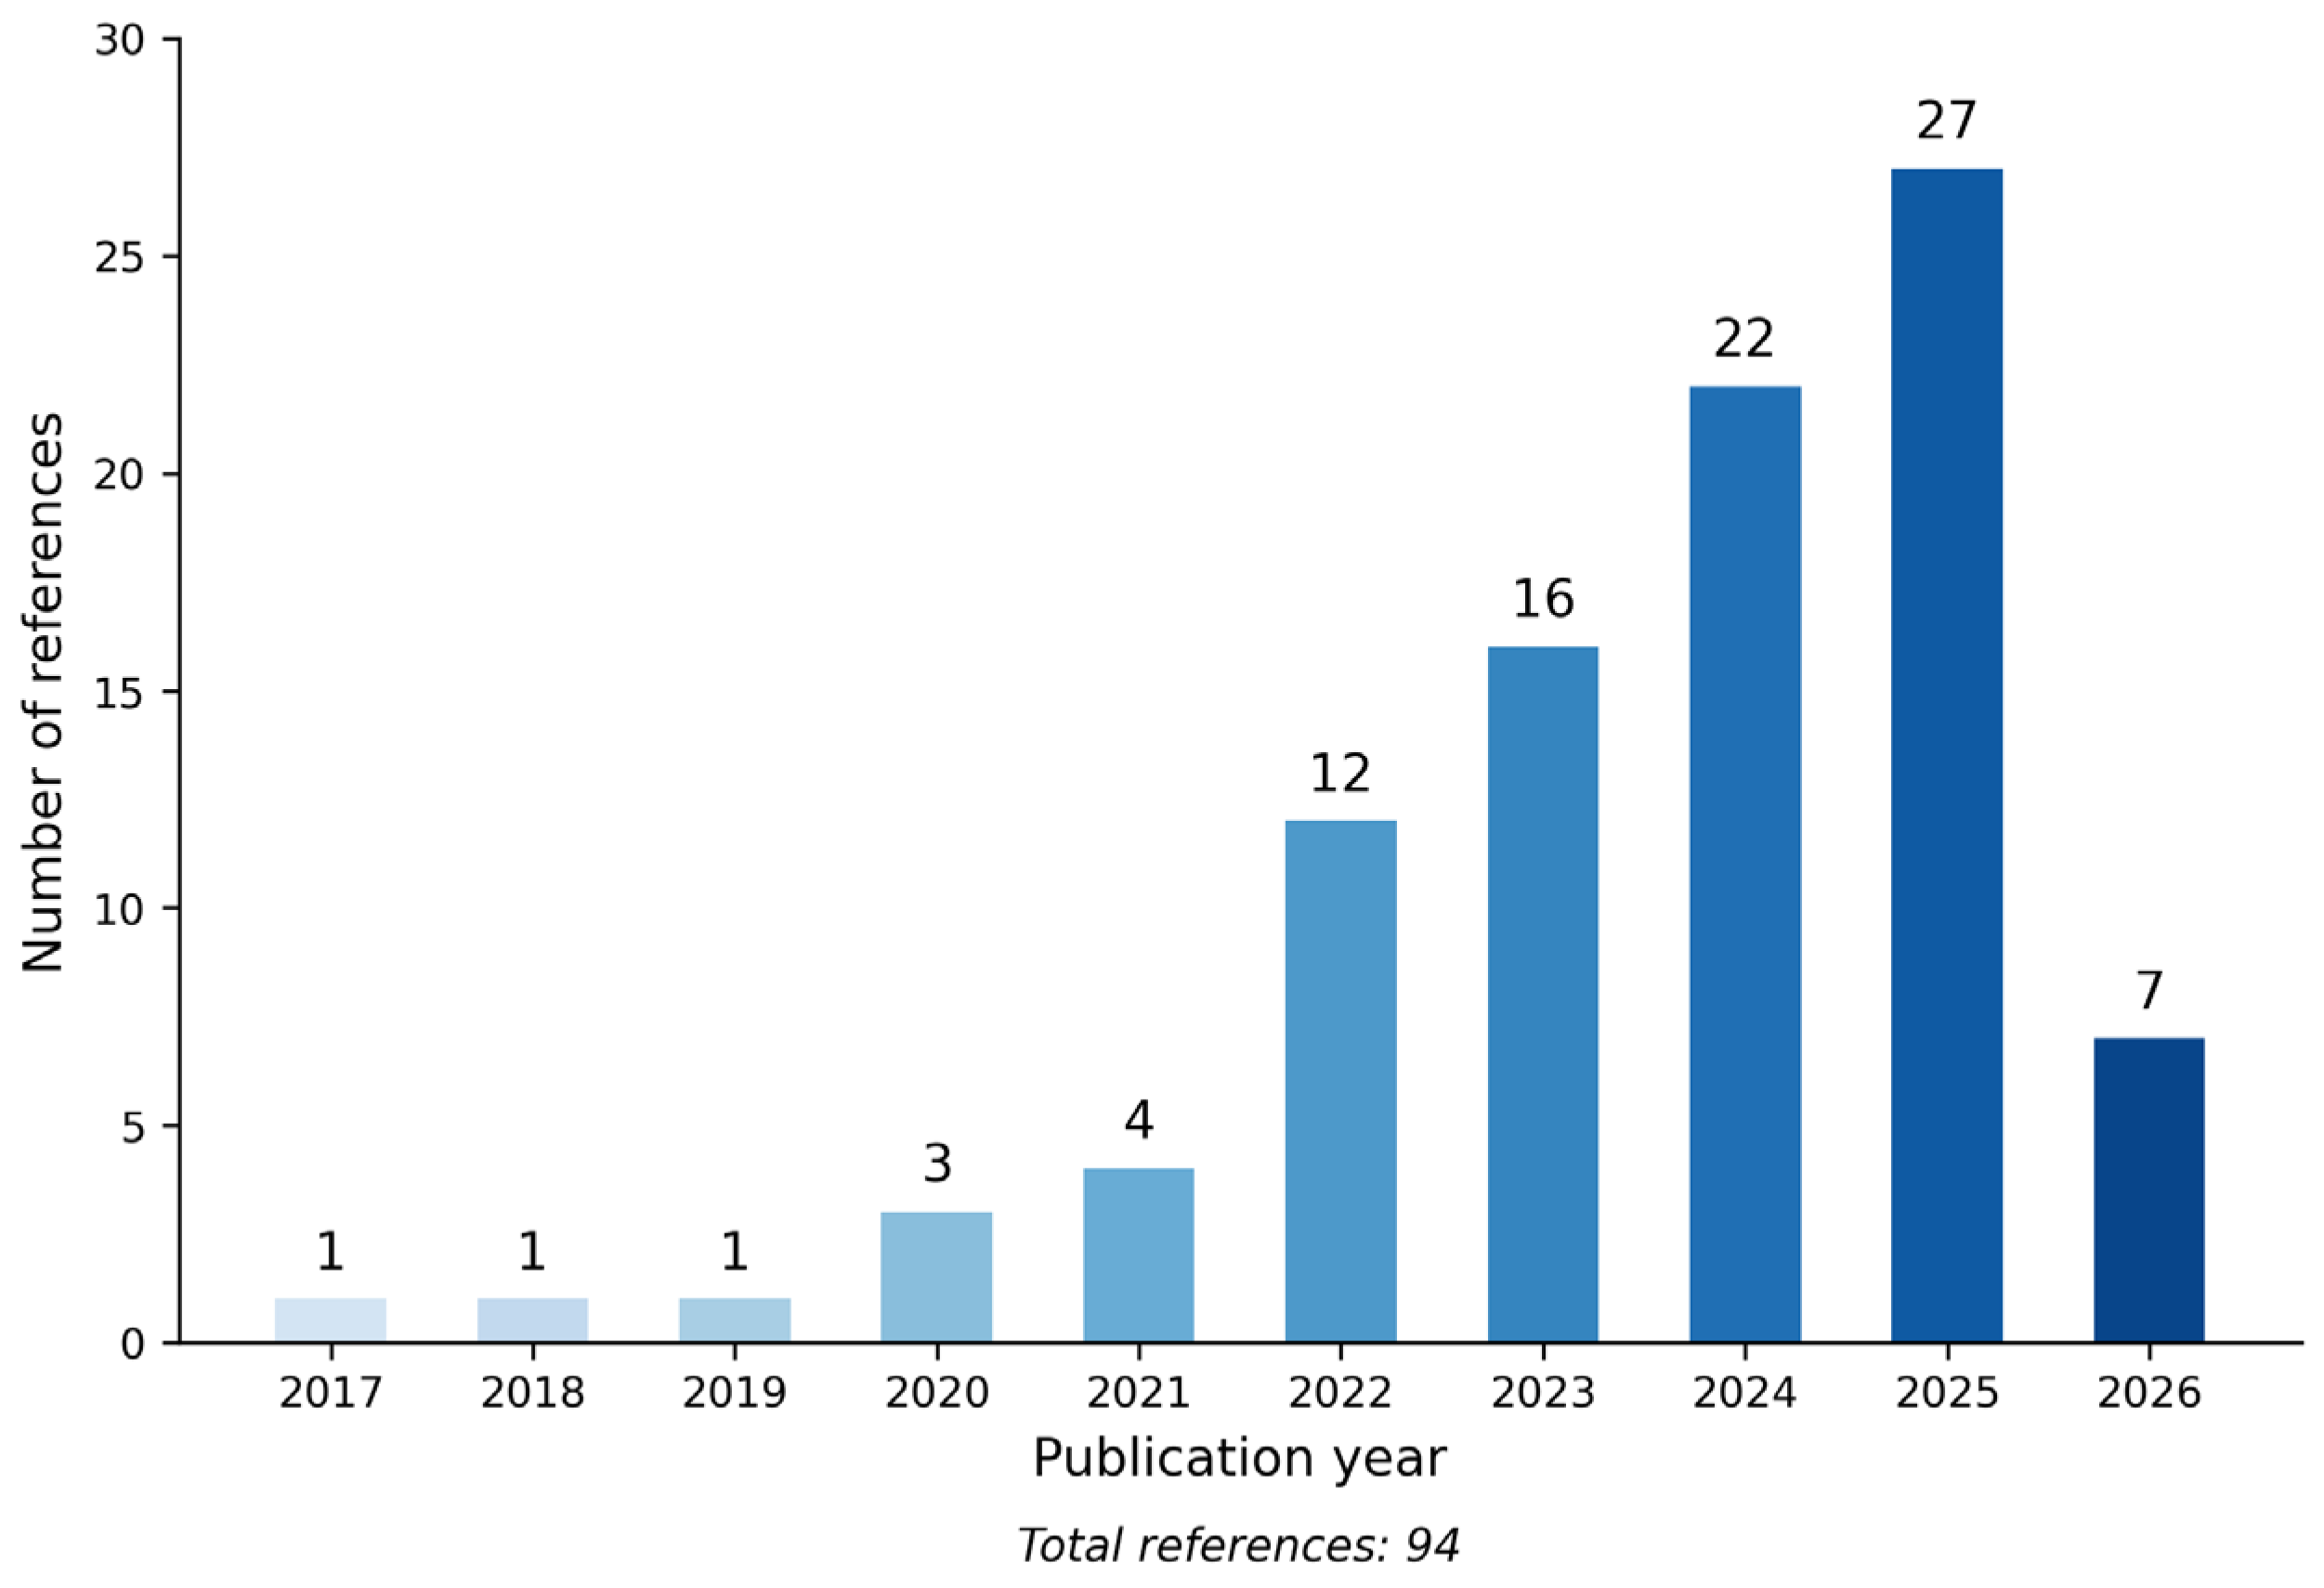
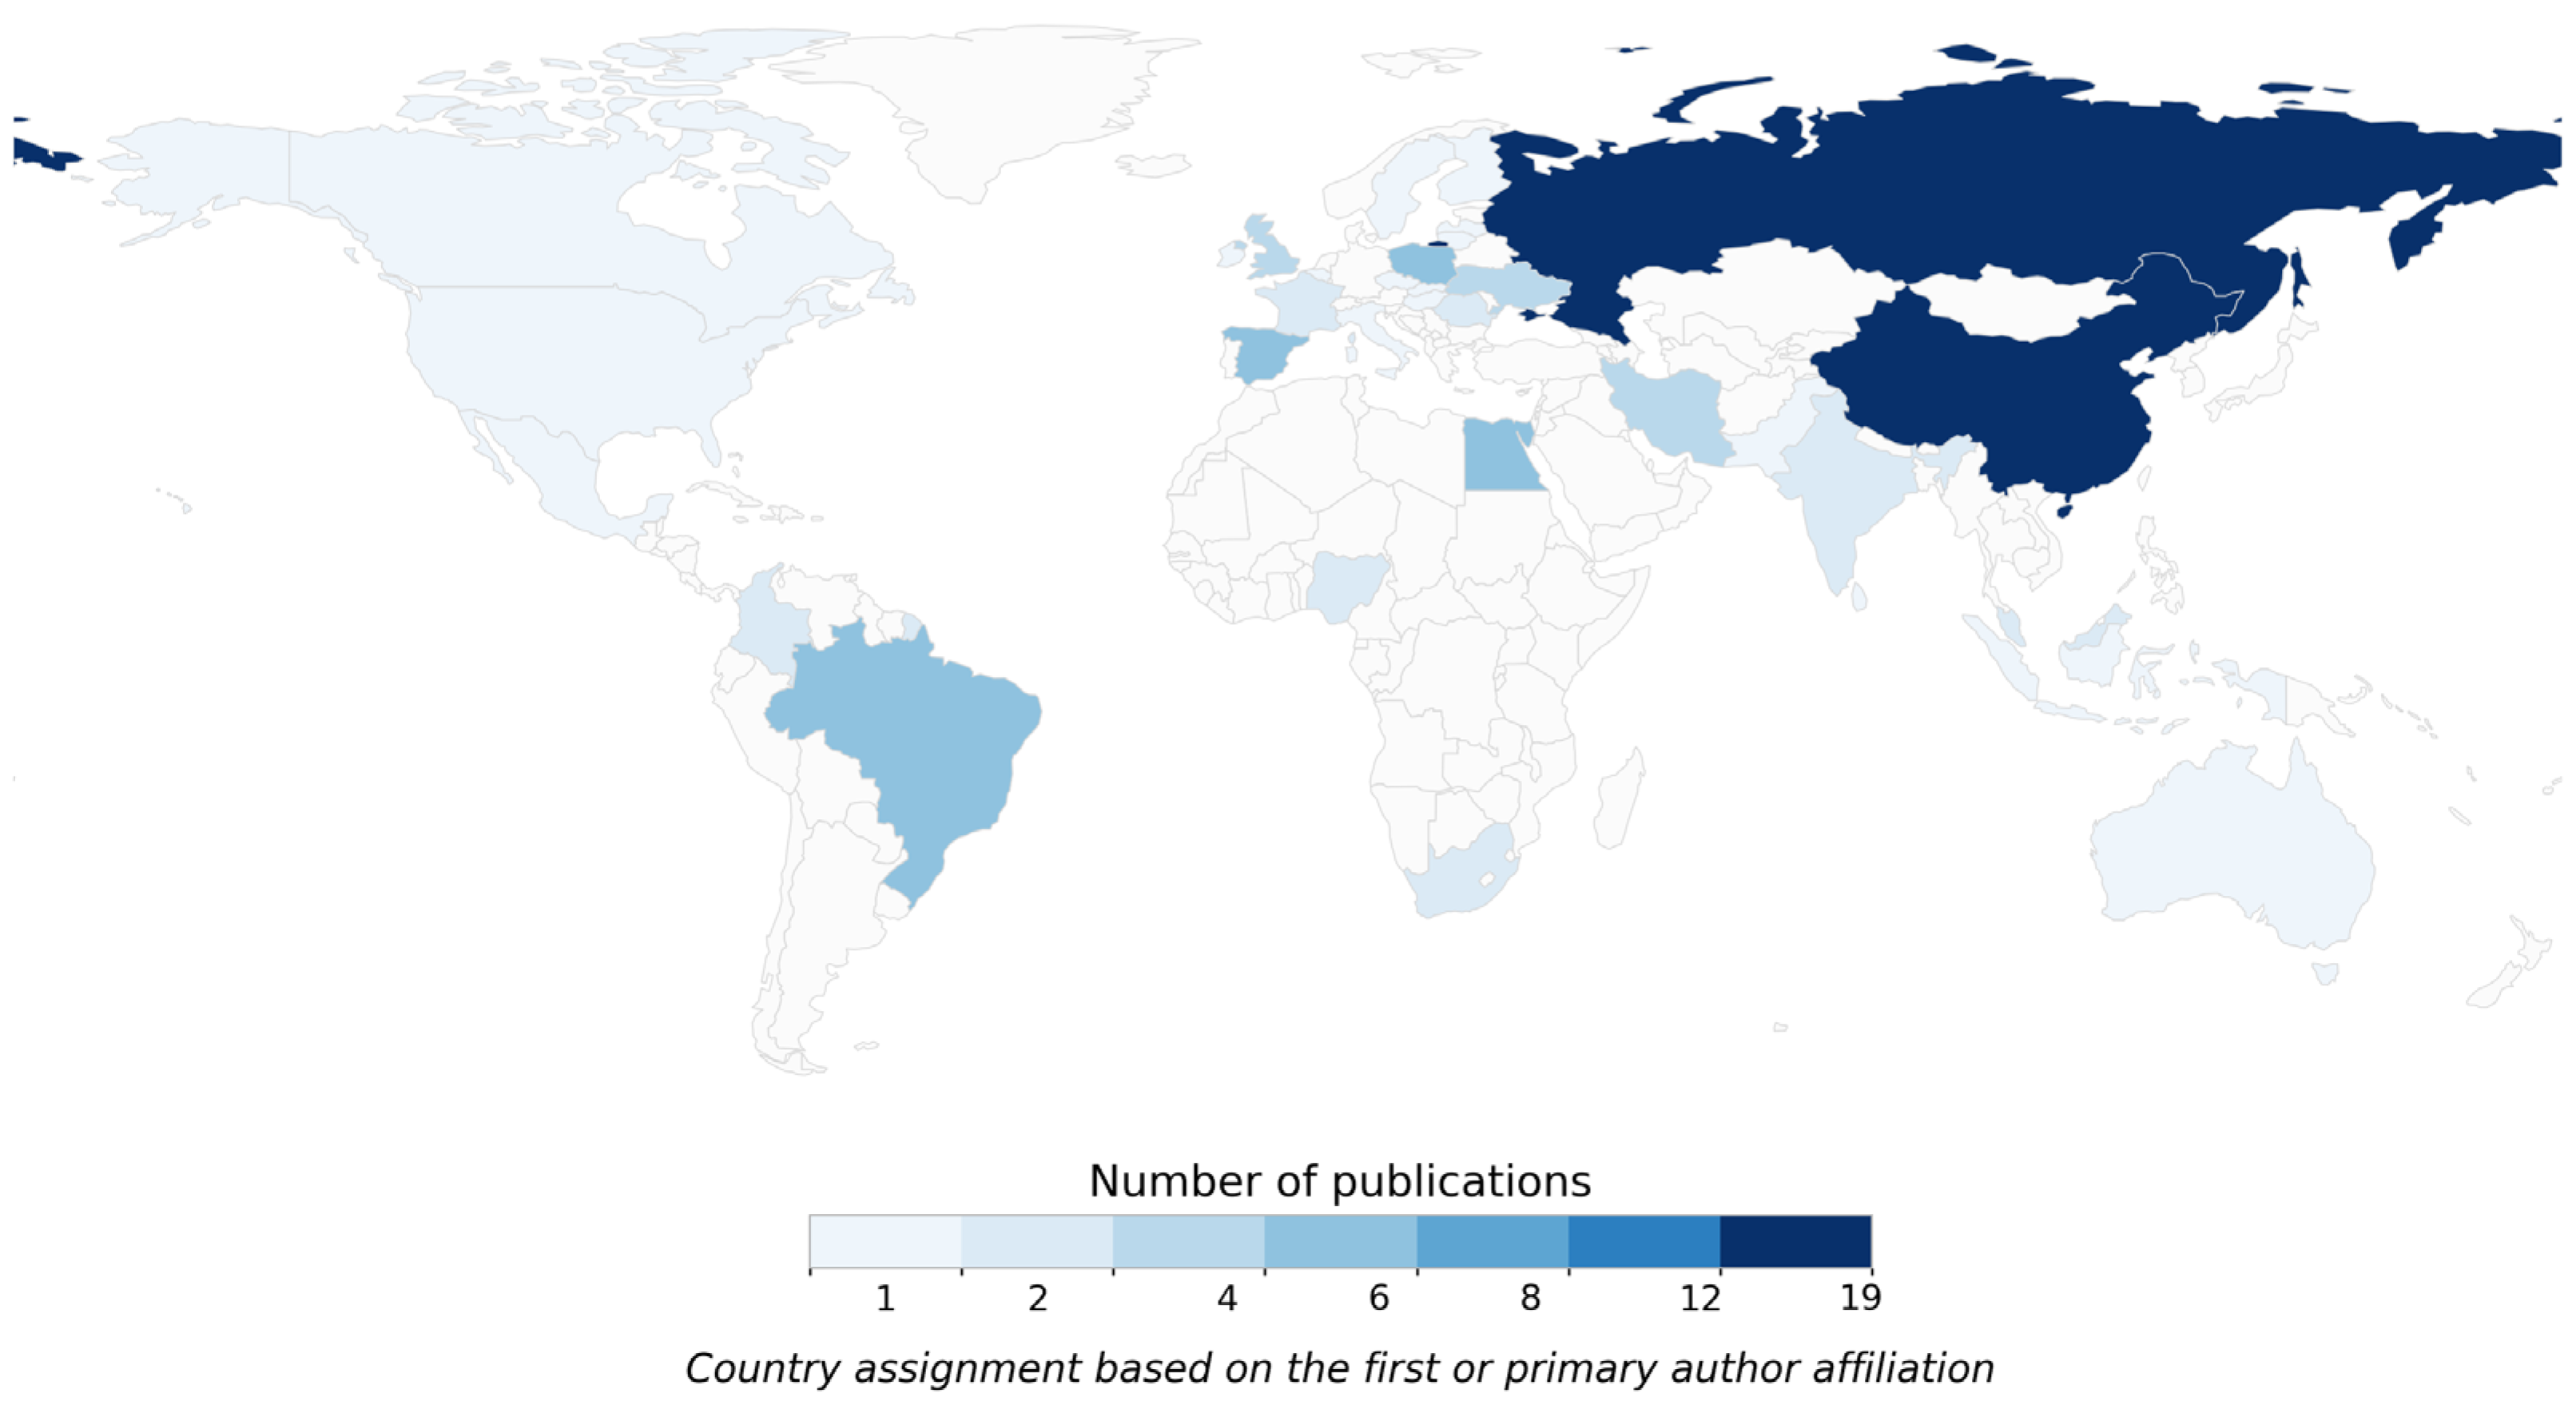
Figure 1 and
Figure 2 show the distribution of sources by publication year and by country, respectively.
The exclusion criteria included:
Studies not related to electrical equipment;
Articles focused exclusively on power quality without analyzing its impact on equipment;
Publications without analytical or quantitative analysis;
Duplicate studies.
At the first stage, an initial search was conducted using the selected keywords, which resulted in the identification of more than 300 publications.
At the second stage, a preliminary analysis of the titles and abstracts of the articles was performed. Publications that did not correspond to the research topic were excluded.
At the third stage, the full texts of the selected publications were analyzed to assess their scientific relevance and compliance with the inclusion criteria.
As a result of the sequential selection process, a final sample of 94 scientific papers and 3 standards was formed. These sources most comprehensively reflect current research trends in the field of the influence of PQ on the degradation and reliability of electrical equipment.
Bibliometric Analysis Using VOSviewer
To complement the systematic review, a bibliometric analysis of the selected scientific publications was carried out using VOSviewer (version 1.6.20, Centre for Science and Technology Studies, Leiden University, Leiden, The Netherlands). This tool was applied to visualize relationships between the most frequent research terms and to identify thematic clusters within the reviewed literature. The bibliometric dataset was formed from the final sample of scientific articles included in the review, while standards and methodological documents were not used for keyword mapping.
The analysis was based on co-occurrence of keywords extracted from the titles, abstracts, and author keywords of the selected publications. Before visualization, similar terms were normalized in order to reduce fragmentation of the map. For example, terms such as “power quality” and “power quality disturbances”, “hot-spot temperature” and “hotspot temperature”, as well as “remaining useful life” and “RUL” were unified. General-purpose words that do not carry thematic significance were excluded from the analysis.
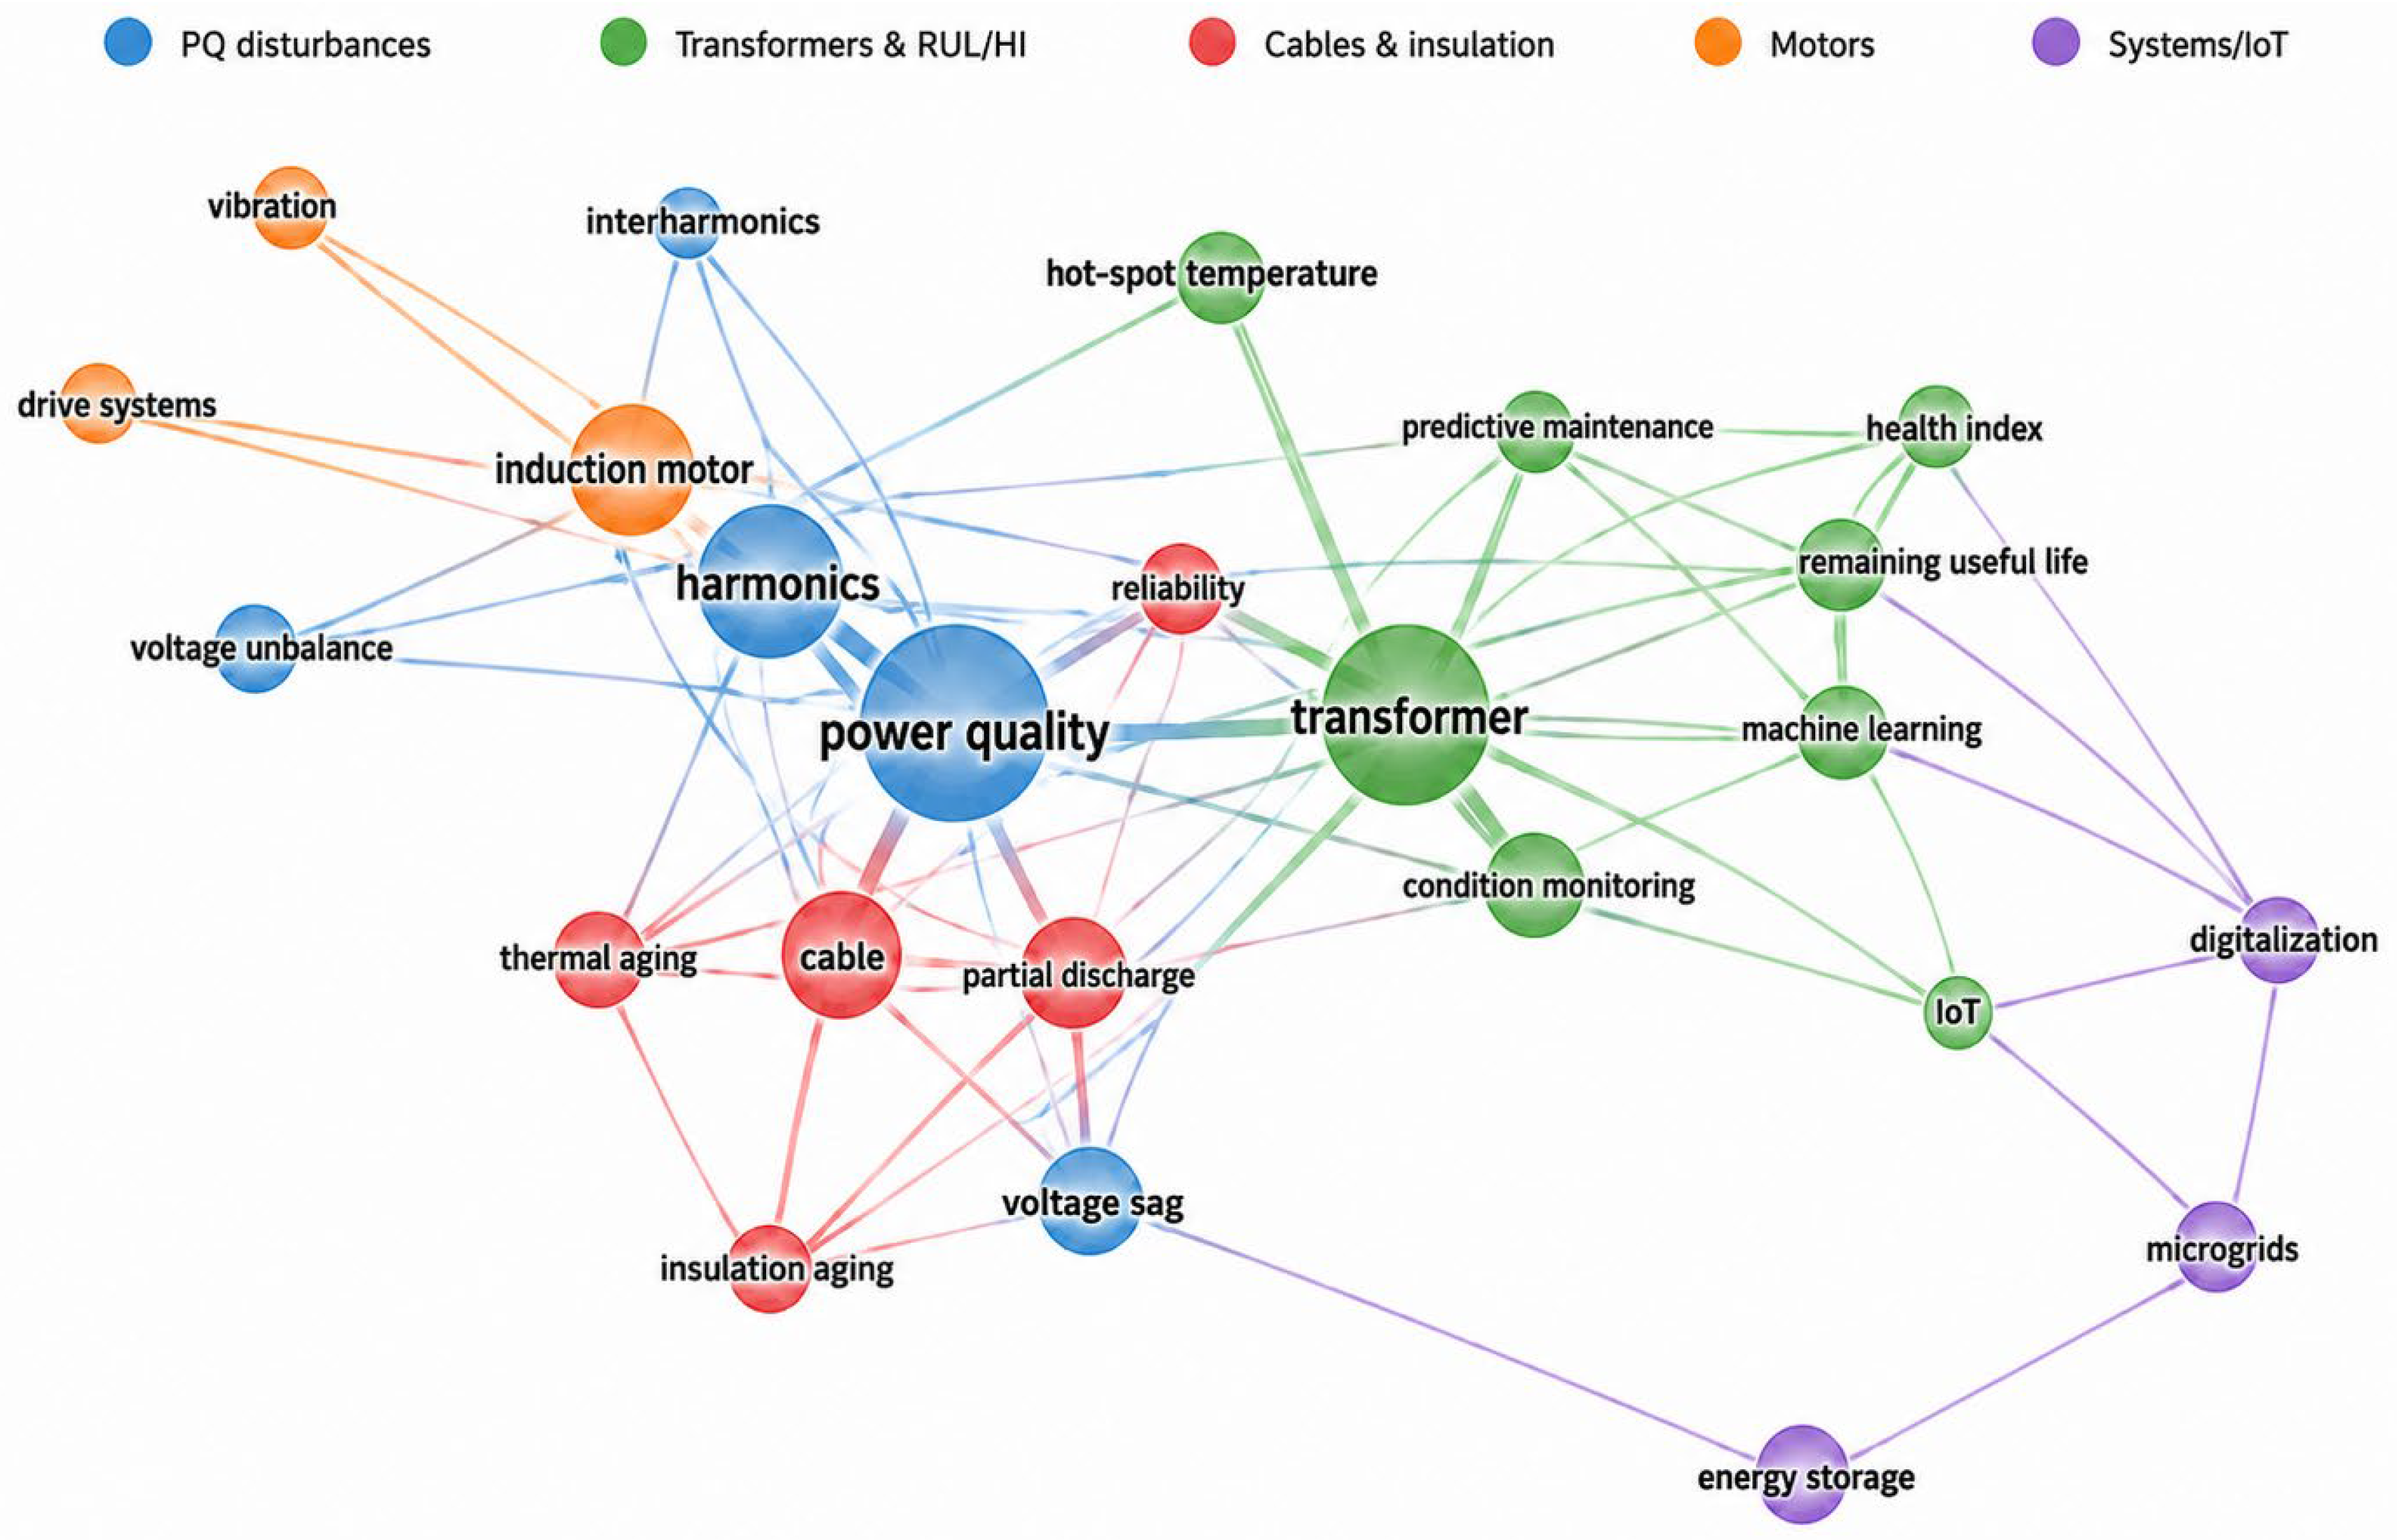
The co-occurrence map was generated using the full counting method. A minimum occurrence threshold was applied to include only sufficiently frequent terms in the final visualization. The resulting network made it possible to identify the main scientific clusters related to power quality disturbances, transformers and remaining useful life assessment, cable insulation degradation and partial discharge, induction motor reliability, and digital monitoring technologies including IoT and machine learning.
Figure 1 and
Figure 2 show the temporal and geographical distribution of the selected sources, while
Figure 3 presents the keyword co-occurrence network obtained from the bibliometric analysis.
To identify the main directions of current research, a bibliometric analysis of the selected publications was additionally performed. The analysis included:
Distribution of publications by year;
Analysis of keywords and thematic clusters of the studies;
Identification of the most cited studies and the main scientific research areas.
The bibliometric analysis made it possible to identify the main research trends related to the study of the influence of PQ on the reliability of electrical equipment, as well as the most actively developing scientific areas.
A separate group of studies is specifically devoted to the assessment of hot-spot temperature as a key predictor of insulation aging. Recent reviews systematize direct measurement methods, calculation models, and typical sources of uncertainty in transformer hot-spot temperature assessment [
5].
The selected publications were analyzed across several main thematic areas:
Classification of power quality disturbances and their physical mechanisms of impact on electrical equipment;
Analysis of insulation degradation processes and thermal aging of equipment;
Analysis of diagnostic methods and condition monitoring techniques for electrical equipment;
Investigation of modern methods for predicting the remaining useful life of equipment.
Based on the analysis of the publications, the main patterns of the influence of power quality indices on aging processes and the reliability of electrical equipment were identified. The obtained results were systematized by equipment type and by the type of power quality deterioration, which made it possible to form an integrated understanding of the relationship between electrical network operating conditions and equipment wear processes.
3. Influence of Power Quality Indices on the Technical Condition of Electrical Equipment
Power quality indices are among the key external factors determining the technical condition, degradation rate, and reliability of electrical equipment. In industrial power supply systems, harmonic distortion, voltage fluctuations, voltage sags, load surges, and voltage unbalance affect equipment through interrelated electrical, thermal, electromagnetic, and mechanical mechanisms. These disturbances increase RMS currents and additional losses, intensify hot-spot temperature rise, accelerate insulation aging, generate torque pulsations and vibration, and may reduce the permissible loading capability and service life of transformers, induction motors, cable lines, and overhead power lines. This section analyzes the main mechanisms through which PQ disturbances affect different types of electrical equipment and formalizes their relationship with thermal aging models, degradation factors, reliability functions, and remaining useful life assessment.
3.1. Harmonic Distortion and Its Consequences
One of the key factors reducing the reliability of modern electrical equipment is current harmonic distortion, which is caused by the widespread use of power electronics, converter equipment, and distributed generation sources. Converter transformers are particularly sensitive to the effects of harmonics, as they operate under increased current and thermal loading conditions.
Harmonic components arise due to the operation of nonlinear loads, including variable-frequency drives, power electronic devices, and power supplies, and distort the current waveform from an ideal sinusoid. This deviation leads to additional losses in the windings and magnetic cores of transformers and electrical machines, increases insulation temperature, and reduces the service life of equipment [
6].
In industrial power supply systems, the negative effects of harmonics can be intensified by network resonance conditions. It has been shown that the combined operation of active filters and capacitive elements under such conditions may deteriorate compensation performance. Therefore, filter tuning should take into account the amplitude–frequency characteristic of the network impedance and the location of resonance frequencies [
7].
3.1.1. Power Transformers
Experimental studies have shown that the presence of harmonic currents can significantly increase the hot-spot temperature of transformers, in some cases by up to 35% compared with sinusoidal current. This accelerates thermal aging of the insulation and reduces equipment service life [
8].
The analysis also reveals a relationship between the vibration characteristics of transformer windings and the harmonic content: as the proportion of harmonic currents increases, vibration acceleration grows according to a power-law dependence, indicating an additional mechanical load on structural components [
9].
Electrothermal models of the effect of harmonics on distribution transformers confirm that an increase in the level of harmonic distortion accelerates the attainment of the hot-spot temperature and increases the accelerated insulation aging factor, leading to a reduction in the remaining useful life of the equipment [
10].
Accounting for the nonlinear distribution of losses across core limbs and winding turns, as well as convective heat transfer in oil ducts, leads to a significantly more accurate estimation of hot-spot temperature. At the same time, an increase in the current harmonic distortion factor shows a reproducible rise in hot-spot temperature, confirmed by measurements using fiber-optic sensors [
11].
The current including harmonic components can be represented as follows [
6]:
where
is the instantaneous current, A;
is the amplitude of the fundamental harmonic, A;
is the angular frequency, rad/s;
is time, s;
is the relative content of the harmonic component, dimensionless; and
is the harmonic order. The parameters
and
are dimensionless.
The total harmonic distortion is defined as follows [
6]:
where
is the total harmonic distortion, %;
is the amplitude of the
-th harmonic component, A; and
is the amplitude of the fundamental harmonic, A.
An increase in
, in turn, leads to an increase in the root mean square current:
where
is the total root mean square current, A;
is the root mean square value of the fundamental harmonic, A.
Due to the increase in the root mean square current, the losses in the transformer windings also increase and can be expressed as follows:
where
is the copper loss in the transformer windings, W, and
is the winding resistance at temperature
, Ω.
Considering the temperature dependence of resistance [
11]:
where
is the winding resistance at the reference temperature
, Ω;
is the temperature coefficient of resistance, 1/°C;
is the winding temperature, °C; and
is the reference temperature °C.
Thus, the following positive feedback loop is formed, as shown in
Figure 4.
To assess the influence of harmonic distortion in the network on a transformer, a multiphysics model combining electromagnetic, thermal, hydrodynamic, and mechanical processes can be applied. This approach makes it possible to account not only for the electromagnetic forces arising from harmonic currents, but also for temperature effects that significantly influence the mechanical properties of winding materials [
11,
12].
This approach made it possible to establish that, when a power transformer operates in a network with a high content of harmonic currents, an increase in the harmonic current share leads to a rise in the hot-spot temperature of the windings. In this case, the temperature dependence on harmonic content follows a power-law relationship, whereas its dependence on harmonic frequency is exponential. The temperature increase changes the elastic modulus of copper and redistributes mechanical stresses in the windings. As a result, the maximum stresses shift toward the oil duct regions and propagate from local overheating zones to the central parts of the windings.
Based on the simulation results, it was found that the hot-spot temperature increases according to a power-law relationship with harmonic content [
12]:
and its dependence on harmonic frequency follows an exponential relationship [
12]:
where
is the hot-spot temperature, °C;
is the relative harmonic content;
is an empirical exponent;
is the harmonic frequency, Hz, and
is an empirical coefficient characterizing the sensitivity of hot-spot temperature to harmonic frequency, Hz
−1. The parameters
and
are dimensionless.
It should be noted that the coefficients m and c in Equations (6) and (7) should be treated as empirical and design-dependent parameters rather than universal constants. At present, the available literature does not provide generally accepted reference ranges that can be reliably transferred across different transformer designs, cooling systems, and insulation materials. Therefore, from a practical point of view, these coefficients should be determined by calibration against laboratory tests, heat-run tests, or validated multiphysics models supplemented by field data. Such an interpretation is more scientifically justified than assigning pseudo-universal numerical ranges to these parameters.
The maximum mechanical stress acting on the copper windings of a power transformer can be expressed as follows [
12]:
where
is the maximum mechanical stress, Pa;
is an empirical exponent, dimensionless.
In this case, accounting for the temperature dependence of the elastic modulus of copper significantly changes the distribution of mechanical stresses. Ignoring the thermal effect leads to a systematic underestimation of the influence of mechanical stresses.
As a result, for reliability assessment of electrical equipment, the obtained temperature dependencies are often linked to the two-parameter Weibull distribution:
where
is the reliability function;
is the operating time, h;
is the scale parameter, h; and
is the shape parameter, dimensionless.
The Weibull model is used in this review as a probabilistic representation of time-to-failure behavior. In this interpretation, the shape parameter β reflects the failure-rate pattern over time, while the scale parameter η represents the characteristic life of the equipment population under the considered operating conditions. This model is most appropriate when failure statistics or condition-linked lifetime proxies are available. In practical applications, Weibull parameters are typically calibrated using historical failure records, censored datasets, or regression-based fitting to diagnostic and operational data.
Based on the generalization of thermal and mechanical models describing the influence of harmonics and the probabilistic description of failures using the Weibull distribution, the relationship between harmonic components and the parameters of the Weibull model can be represented through a degradation factor [
11,
12]:
where
is the scale parameter under harmonic distortion, h;
is the scale parameter under sinusoidal operating conditions, h;
are the temperature degradation the mechanical stress degradation factors, caused by the presence of harmonic components and cannot take values greater than 1.
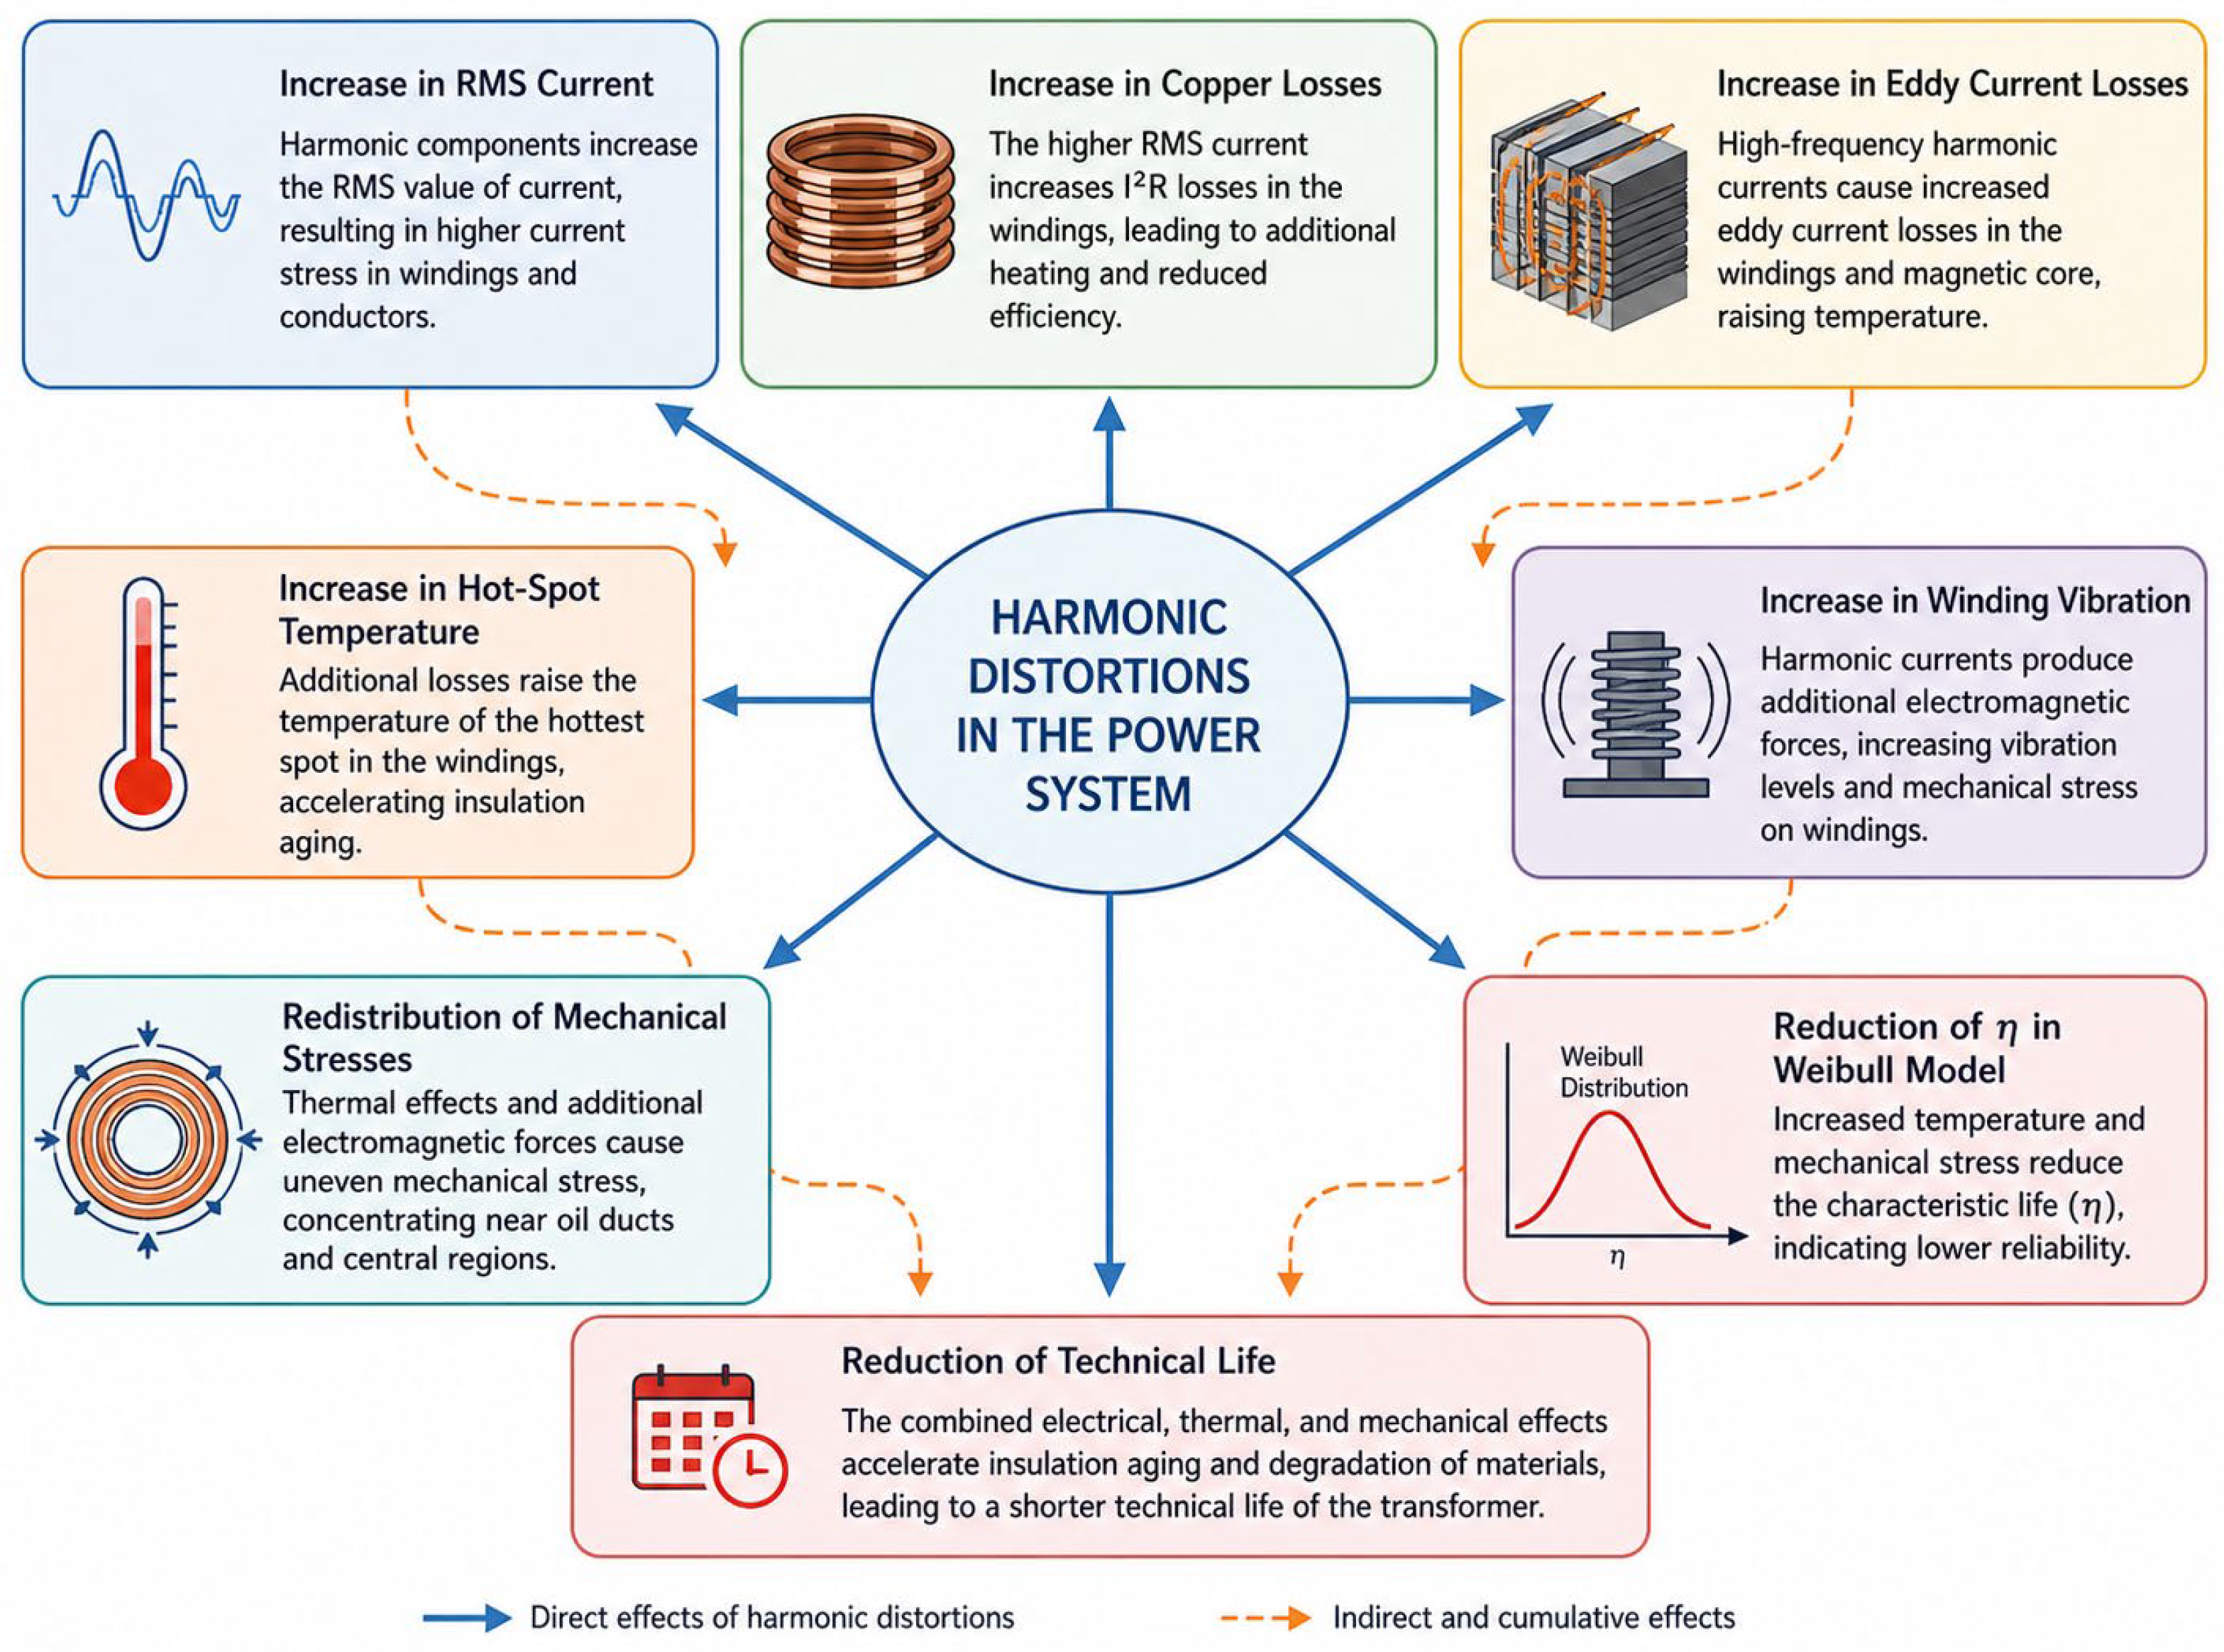
Thus, harmonic distortion has a dual negative effect. The direct electromagnetic effect is associated with an increase in dynamic forces in the windings due to additional current components, whereas the indirect thermal effect is associated with temperature rise and changes in the mechanical properties of materials, leading to stress redistribution and an increase in stress magnitude.
Figure 5 shows the main mechanisms through which harmonic distortion affects the technical condition of a power transformer.
The main effects of harmonic components in the network on power transformers can be summarized as follows: high-frequency harmonic currents lead to a temperature rise and a nonuniform distribution of mechanical stresses in transformer windings; hot spots are formed mainly in the upper parts of the windings, with temperature increasing according to a power-law dependence on harmonic frequency and harmonic content; mechanical stresses shift closer to the oil ducts between the windings and become concentrated in the central regions; maximum stresses increase according to a power-law relationship with increasing harmonic content, especially on the valve-side winding of the transformer [
12].
Another study confirms that voltage harmonic distortion has a significant effect on the loading capability and thermal operating conditions of power transformers, especially those operating in systems with nonlinear loads. The study shows that the voltage total harmonic distortion factor (THD
V) affects the spectrum of the consumed current and changes the harmonic loss factor
FHL which leads to an increase in winding eddy-current losses and a reduction in the maximum permissible load. In this case, the dependence of load losses on harmonic composition is determined by the following expression [
13,
14]:
where
is the load loss in per-unit values,
is the load current in per-unit values,
is the harmonic loss factor, and
is the rated winding eddy-current loss in per-unit values.
The permissible current decreases in proportion to the increase in harmonic components. At high THD
V values, the reduction in the maximum permissible load can reach 10–15%, which directly affects the service life of the insulation and accelerates aging processes [
13]. The conventional IEEE C57.110 methodology [
14], which assumes a quadratic dependence of eddy-current losses on frequency, overestimates losses in large-cross-section conductors because it neglects the skin effect. A modern interpretation of short-circuit parameters assumes their frequency dependence, which makes the classical assumption that transformer short-circuit resistance is independent of harmonics limited and requires a more accurate identification of losses at higher harmonics [
15]. A refined model that accounts for the frequency dependence of skin depth makes it possible to correct the calculation of the harmonic loss factor
FHL* and increase the estimated permissible load by approximately 2% [
15]. This is of practical importance for the design and modernization of transformers operating under elevated harmonic distortion levels.
A practice-oriented approach makes it possible to calculate losses and short-circuit parameters while accounting for actual phase-specific THD
i profiles and current unbalance. This enables a transition from abstract derating to the assessment of losses and overheating under an actual daily load profile [
16].
Assessment of power losses caused by harmonic currents is useful not only for analyzing service life and justifying derating, but also for evaluating energy efficiency and excess losses during transformer operation in networks with a high share of nonlinear loads [
17].
In addition to operational and power-quality-related factors, the choice of core material may also influence the thermal behavior of transformers. Fe-based nanocrystalline soft magnetic materials can be regarded as a promising core option because their high saturation capability and low hysteresis losses may potentially reduce no-load losses and core heating. However, the reviewer-cited studies mainly address compact inductive power transfer applications and the mitigation of gap losses in tape-wound nanocrystalline cores rather than the long-term service life of industrial power transformers. In addition, the broader soft-magnetic materials literature indicates that low-loss magnetic performance must be balanced against mechanical robustness and stress sensitivity, since mechanical constraints may adversely affect magnetic behavior. Therefore, within the scope of the present review, nanocrystalline cores are more appropriately considered as a promising materials-engineering direction with potential indirect benefits for thermal reliability, rather than as an already validated universal solution for extending the service life of industrial power transformers [
18,
19].
3.1.2. Induction Motors
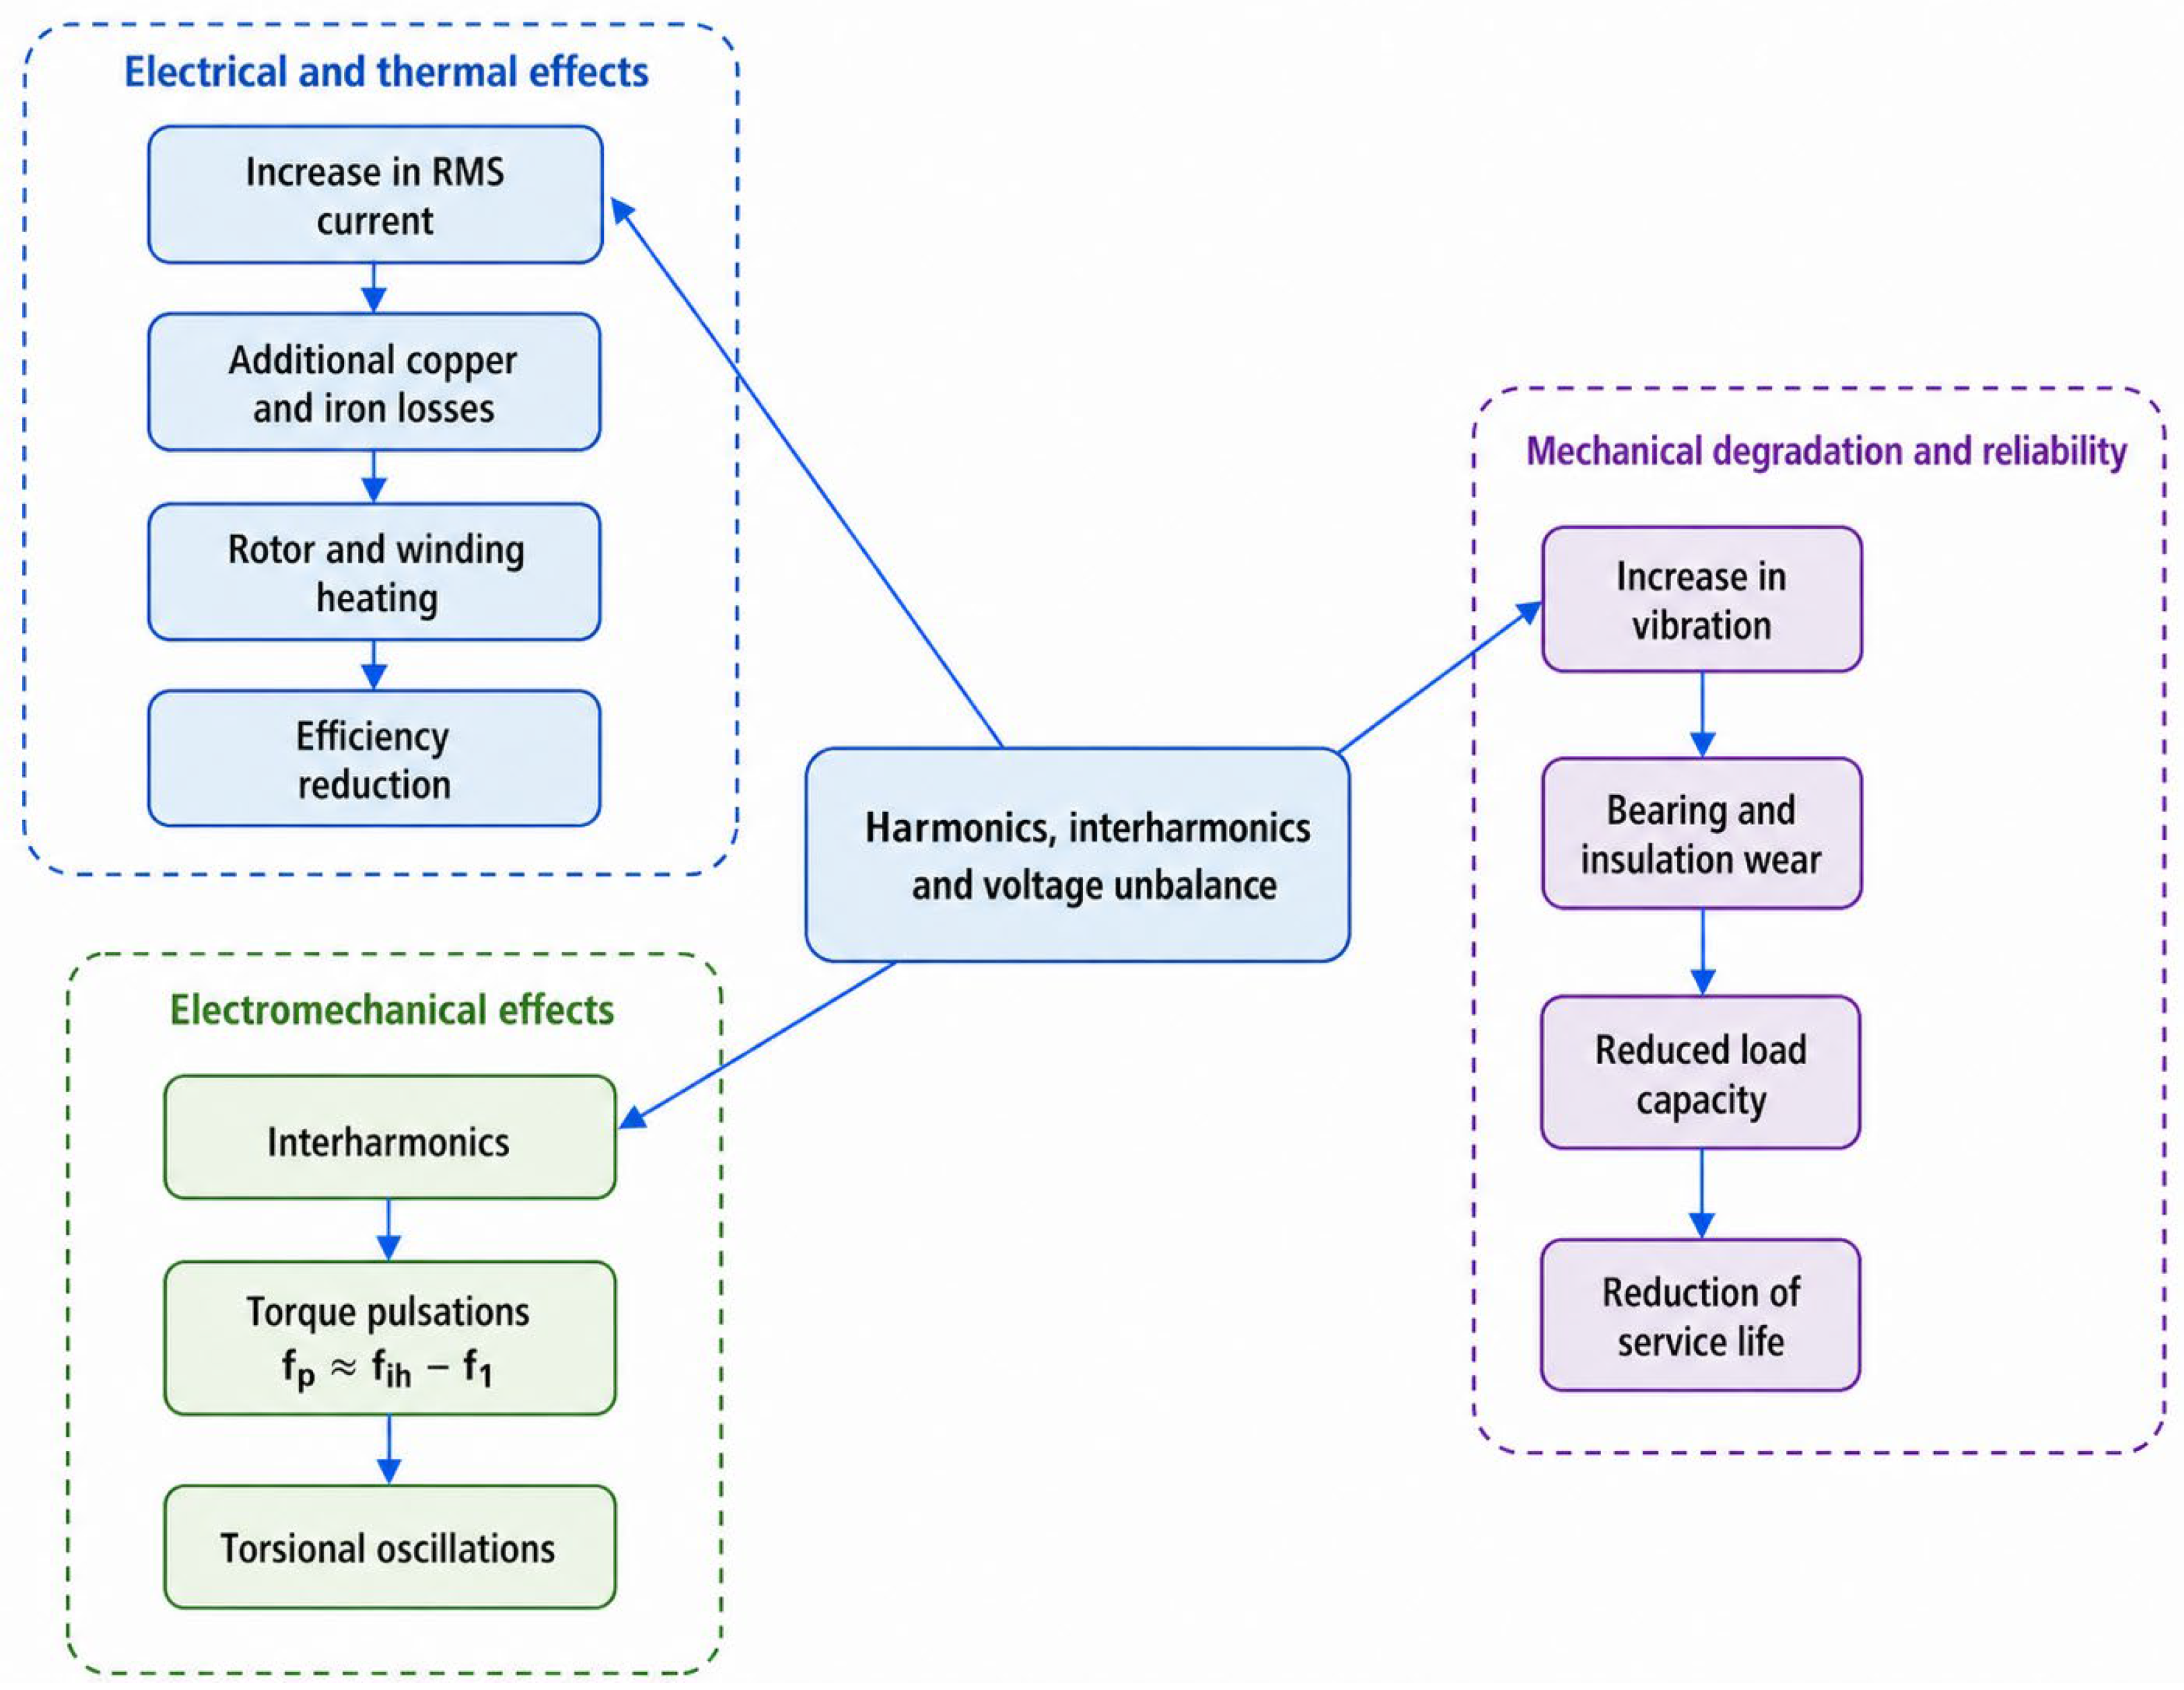
An increase in the levels of harmonic, interharmonic, and subharmonic voltage and current components also significantly changes the operating conditions of induction motors. In contrast to idealized sinusoidal supply, the actual voltage waveform causes additional electrical losses, an increase in RMS current, higher winding temperatures and local hot spots, as well as electromagnetic torque pulsations and vibration. Higher-order harmonic components increase eddy-current and stray losses, while interharmonics generate low-frequency torque oscillations that can excite resonances due to the occurrence of torsional torques. The combination of harmonics and voltage unbalance further increases negative-sequence currents and mechanical loading. As a result, a complex effect is formed that involves the thermal, electromagnetic, and mechanical subsystems of the motor, leading to accelerated insulation aging, increased bearing wear, and a reduction in permissible loading capability [
20].
Even interharmonic levels of about 1%, which are typical of real networks, can cause unacceptable vibration and dangerous torque pulsations in induction motors. In the presence of interharmonics at a frequency of approximately 85 Hz, the maximum vibration velocity may reach 5.59 mm/s, which corresponds to zone D according to ISO 20816-1 (international standard evaluates the vibration of rotating machinery based on vibration velocity measured on the machine housing) [
21], and zone D corresponds to a level that may lead to machine damage [
22]. At interharmonic frequencies of approximately 51, 60 and 110 Hz vibration levels may exceed the limits of zone C, which is considered unsatisfactory for long-term continuous operation. Electromagnetic torque pulsations caused by interharmonics may reach approximately 20% of the rated torque. The frequency of torque and speed pulsations under interharmonic distortion is close to the difference between the interharmonic frequency
and the fundamental frequency
[
22]:
where
is the frequency of torque and speed pulsations, Hz;
is the interharmonic frequency, Hz; and
is the fundamental frequency, Hz.
The combined effect of harmonics and voltage unbalance further intensifies negative-sequence currents, increases rotor heating, and accelerates bearing wear. At VUF ≈ 5% and THD
V ≈ 20% the efficiency reduction may exceed 3 percentage points relative to the rated value [
23]. Moreover, it has been shown that combined power quality disturbances can increase the total motor losses by more than 60%, even when power quality standards are formally satisfied. According to the reported study, harmonic distortion can reach high levels, which leads to an increased risk of electrical equipment failure across different industrial sectors [
24]. A generalized diagram of the influence of harmonics, interharmonics, and voltage unbalance on thermal, electromagnetic, and mechanical processes in an induction motor is shown in
Figure 6.
The effects of harmonics are further intensified under simultaneous voltage unbalance and may manifest themselves both as electrical losses and as mechanical effects on the shaft. In addition, the motor parameters themselves can be used as a data source for assessing voltage unbalance in the network [
25,
26,
27].
Modern approaches to motor condition assessment involve the integration of PQ parameters into aggregated health indices. In [
28], a health index (HI) is proposed that accounts for harmonics, voltage unbalance, and voltage deviations using weighting factors, including 1.15 for harmonics and 1.4 for voltage unbalance. This makes it possible to quantitatively link PQ parameters with wear risk. In addition, the effectiveness of active and hybrid harmonic compensation in variable-frequency drive systems has been demonstrated for reducing overheating and torque pulsations [
29,
30].
3.1.3. Cable Power Lines
While the influence of harmonics on electrical machines and transformers has been actively studied, the impact of non-sinusoidal operating conditions on cable power lines has long been considered mainly in terms of power losses. Recent studies show that harmonic currents have a complex effect on the thermal operating conditions of conductors, electromagnetic field distribution, network resonance characteristics, and, consequently, the service life of insulation and the long-term reliability of power lines.
Refined thermal models of underground cables take into account mutual heating between phase conductors and the neutral conductor, as well as the possible formation of a “dry zone” in the soil. Under harmonic current conditions, this leads to an additional temperature rise and requires a reassessment of the current-carrying capacity of the cable line [
31].
In networks with distributed cable parameters, there is a risk of resonant amplification of individual harmonics, which can lead to local overvoltages and an increase in
in individual branches [
32].
This problem becomes particularly relevant in networks with a high share of underground cable sections, where the frequency-dependent parameters of the line differ significantly from those of overhead lines, which may lead to the amplification of individual voltage harmonic components.
In the presence of harmonic components, the root mean square current is determined as follows [
33,
34]:
and the active losses in the cable conductor are given by [
33,
34]:
where
is the active loss in the cable conductor, W, and
is the frequency-dependent conductor resistance, Ω.
In the above formula, the resistance is frequency-dependent due to the skin effect [
33]
where
is the skin depth, m;
is the electrical resistivity of the conductor material, Ω·m; and
is the magnetic permeability of the conductor material, H/m.
As the skin depth δ decreases, the effective resistance increases:
which leads to additional conductor heating at higher harmonic frequencies.
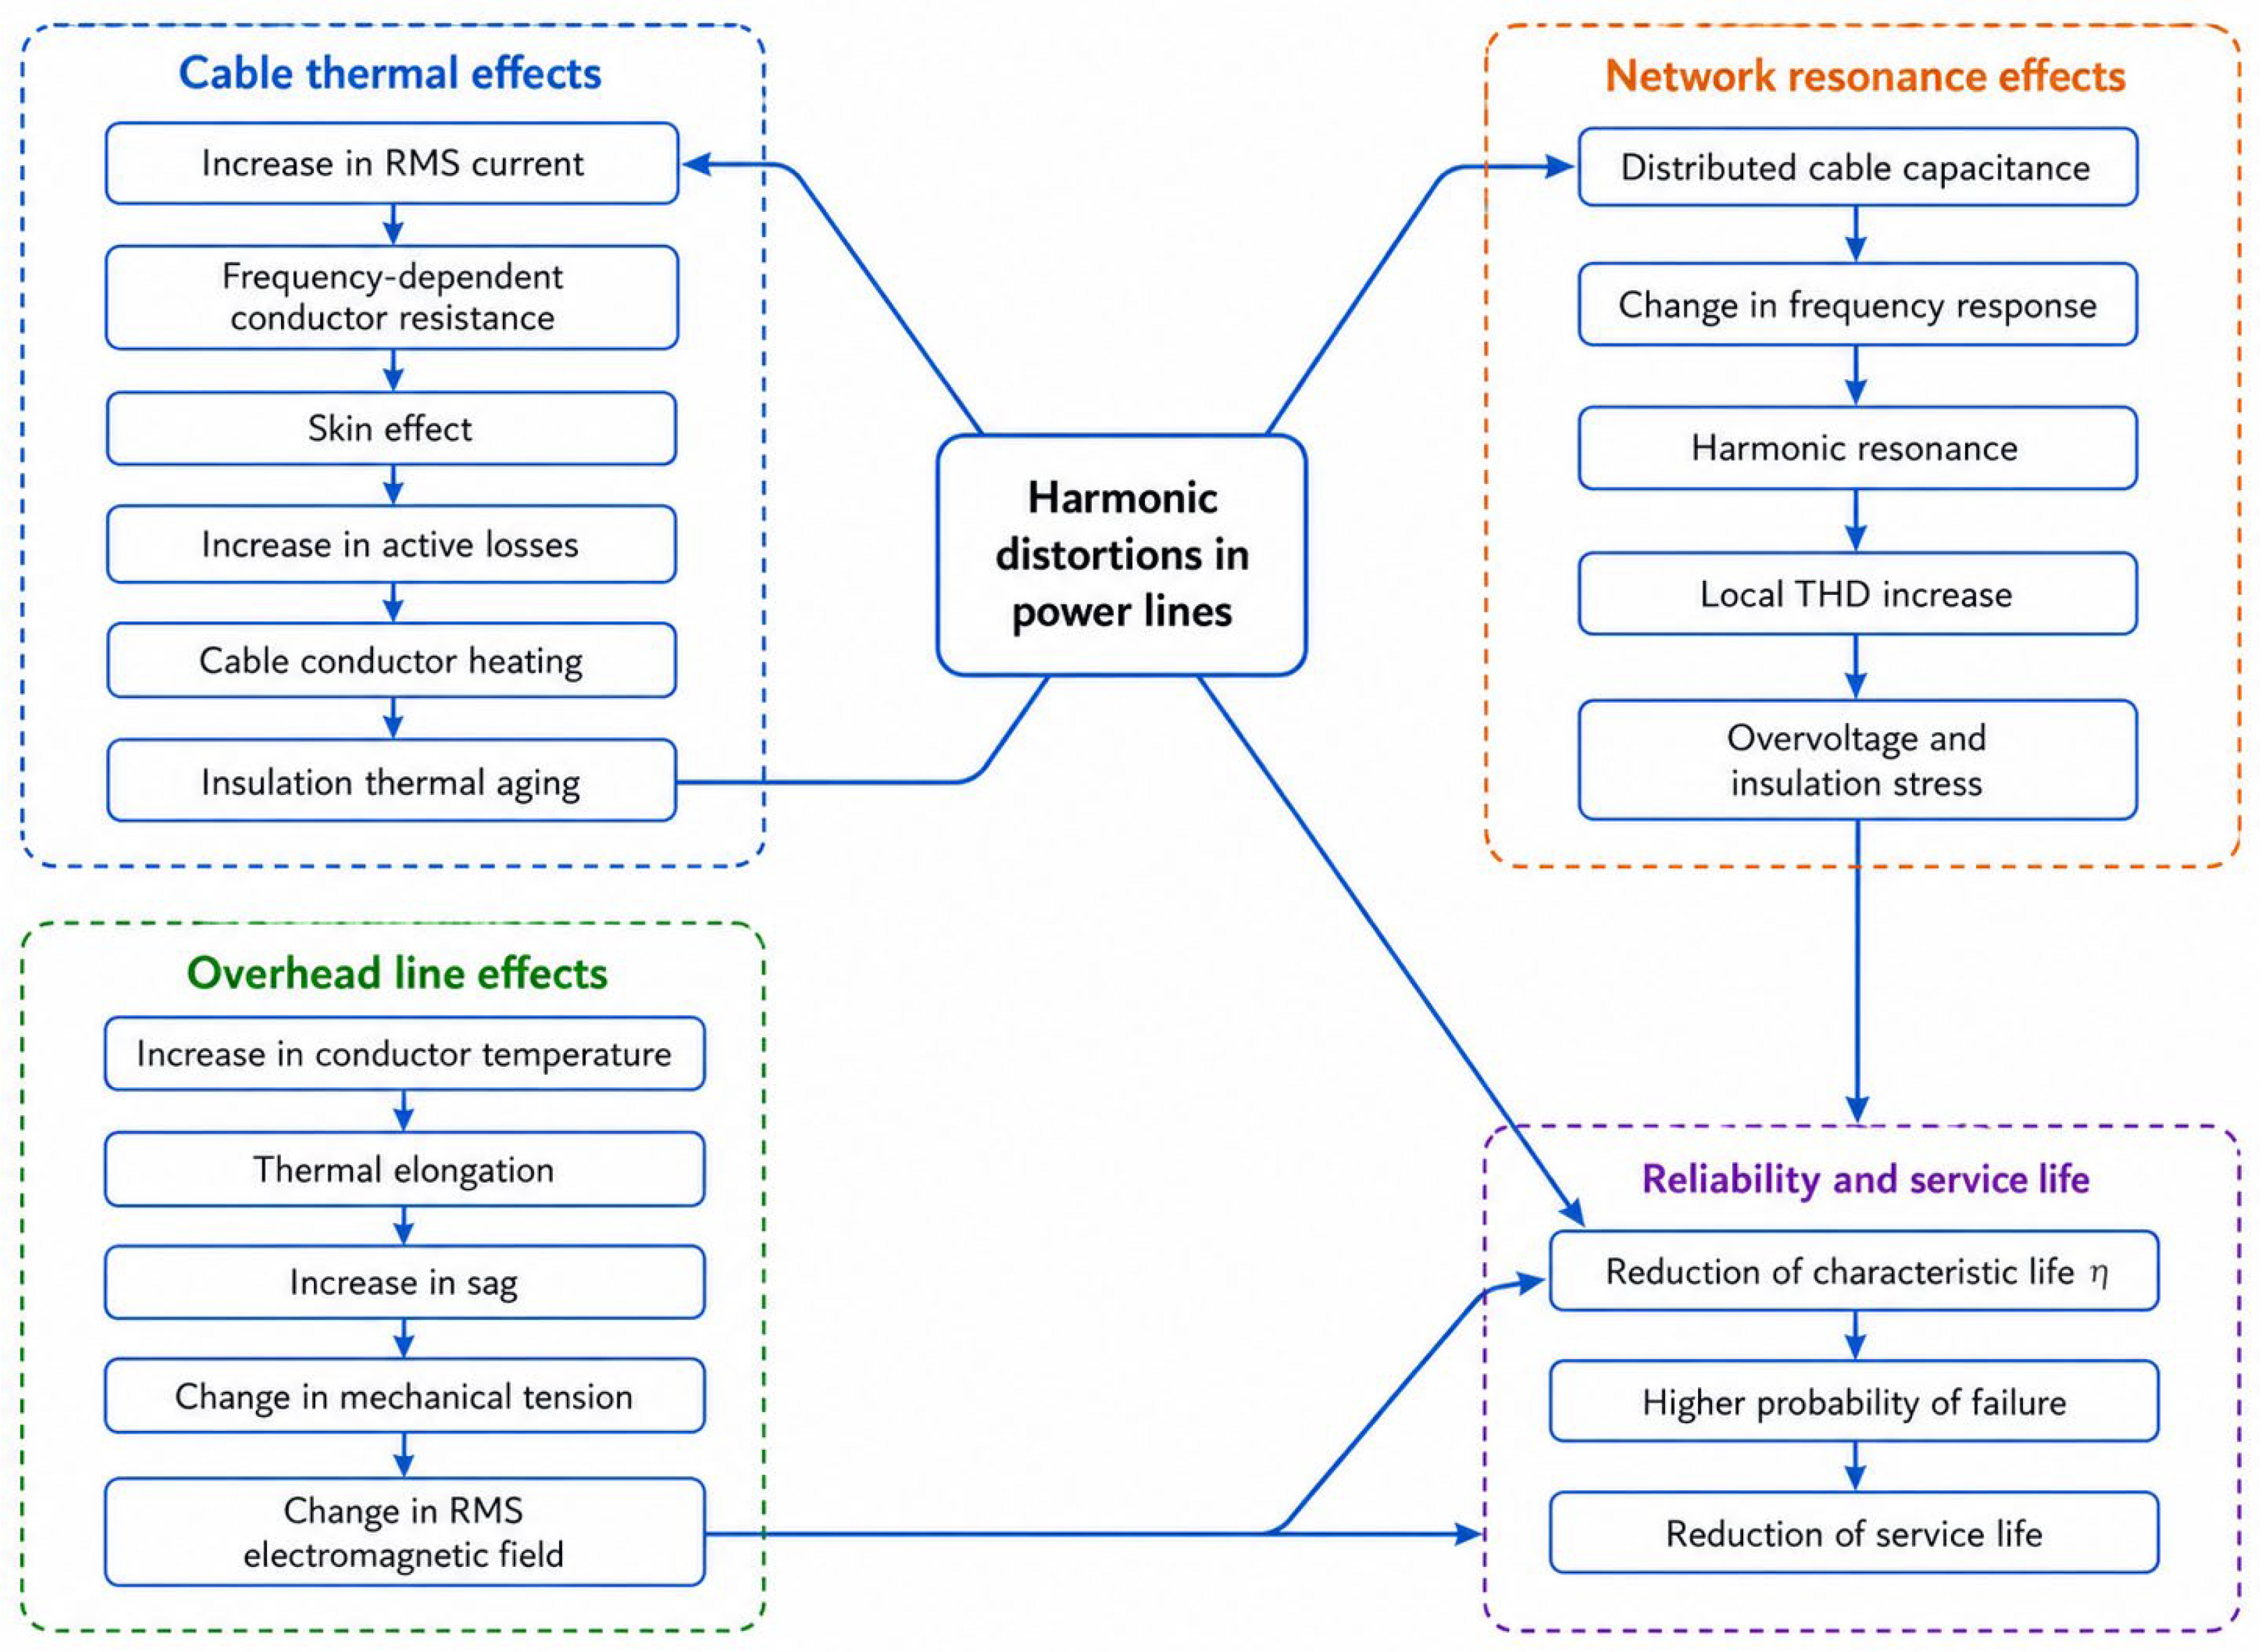
The diagram showing the influence of harmonic components on the condition of cable and overhead power lines is presented in
Figure 7.
Experimental measurements of the skin effect in the harmonic frequency range, from tens to hundreds of hertz, confirm that the increase in the active resistance of a conductor is determined not only by frequency but also by conductor temperature. This is fundamentally important for the correct calculation of additional I
2R losses and thermal operating conditions under non-sinusoidal currents [
33].
In the presence of harmonic currents, active losses in a cable line increase by 8–15% compared with sinusoidal operating conditions, the temperature of the surface layers of the conductor rises by 4–7 °C and a pronounced radial nonuniformity of temperature distribution in the conductor is observed. Even when the
level complies with IEC standards, the calculated hot-spot temperature may be exceeded, leading to accelerated insulation aging [
34].
Insulation life can be determined by thermal aging and described using the Arrhenius model [
35,
36]:
where
is the expected insulation life, h;
is a pre-exponential constant, h;
is a parameter related to the activation energy of the insulation material, K; and
is the absolute hot-spot temperature, K.
The acceleration of insulation aging is determined by the aging acceleration factor [
35,
37]:
where
is the aging acceleration factor, dimensionless, and
is the reference temperature, K.
An increase in temperature by 6 °C can reduce the service life of cable insulation by a factor of 1.5–2. Thus, during long-term operation, this is reflected in a decrease in the characteristic life parameter
in the probabilistic failure model described by the reliability function [
35,
38]:
where
is the reliability function, dimensionless.
The Arrhenius model is used to describe thermally activated insulation aging. Its physical meaning is that the aging rate increases nonlinearly with temperature because the underlying degradation processes are temperature dependent. This model is appropriate for oil-paper and polymeric insulation when thermal stress is a dominant degradation driver. In practice, its parameters are calibrated using accelerated aging tests, material-specific lifetime experiments, or field-validated thermal-aging datasets, and their transferability between insulation systems should be treated with caution.
In addition, underground cables have significant distributed capacitance. An increase in the share of cable sections changes the frequency response of the network and may lead to resonant amplification of voltage harmonics, local
exceedance by 20–40% relative to the calculated values and to a reduction in the network hosting capacity for higher-order harmonics. Conventional assessment methods based on the standard IEC 61000-3-6 may underestimate harmonic levels in networks with a high share of cable lines, creating an additional risk of overheating and insulation breakdown [
39].
Case studies of underground cables show that nonlinear loads increase the harmonic content of the current and lead to measurable changes in the temperature profile of both the cable and the surrounding soil under cyclic loading. This should be taken into account when assessing the permissible current-carrying capacity [
40].
For overhead power lines, the main mechanism of the influence of harmonic components is an increase in thermal losses and conductor temperature, which, in turn, affects line sag and changes the mechanical stress state of the span [
41]:
where
is the change in span length, m;
is the coefficient of linear thermal expansion, 1/°C;
is the initial span length, m; and
is the temperature rise, °C.
The presence of harmonic components in overhead power lines also changes the RMS value of the electromagnetic field around the line. At a
level of approximately 10%, the contribution of harmonics to the total electromagnetic field value can reach 5–8%, which is important from the standpoint of electromagnetic compatibility [
41].
The failure probability of power transformers can be formalized through the parameterization of the Weibull model based on digital operational data, which facilitates the transition to stochastic risk assessment and maintenance prioritization [
38].
Based on insulation thermal aging models [
35,
36] and the probabilistic description of failures using the Weibull distribution [
38], the thermal effect can be linked to service life as follows:
where
is the temperature sensitivity coefficient of the insulation material, 1/°C.
Taking into account the mechanisms considered above, it can be concluded that harmonic distortion affects line reliability through accelerated thermal aging of cable insulation, increased active losses and reduced permissible current loading, intensified resonance phenomena in networks with a high share of cable lines, changes in the mechanical condition of overhead power lines, and a higher probability of local overheating and shield damage. As a result, harmonic distortion may reduce the characteristic life parameter and accelerate the transition of equipment into the wear-out failure region (β > 1). This multifaceted effect of harmonics justifies the need to include power quality analysis in condition assessment models for cable and overhead power lines, as well as in risk-based maintenance strategies.
It should be noted that subharmonic oscillations typical of networks with power electronic equipment can intensify partial discharge activity. This means that, when assessing the service life of insulation, it is important to consider not only harmonics that are integer multiples of 50 Hz, but also high-frequency components.
A significant number of studies have also been devoted to this topic. Some of the most relevant findings are summarized below:
In [
42], it was shown that, at a load of 300 MVA the presence of harmonics increases the transformer hot-spot temperature from 68.28 °C to 87.36 °C, that is, by more than 28%;
In [
43], it was established that harmonics distort the phase-resolved partial discharge (PRPD) patterns in solid insulation, thereby accelerating its degradation;
In [
35], a harmonic anomaly feature analysis method was proposed, which makes it possible to detect cable insulation defects at an early stage based on harmonic spectra.
Thus, harmonic distortion is one of the most significant factors contributing to degradation and reduction in the service life of the electrical equipment considered, including transformers, cable lines, and induction motors.
3.2. Voltage Fluctuations and Voltage Sags
Voltage fluctuations and short-term voltage sags are among the most common power quality disturbances in industrial and distribution networks. Under conditions involving a high share of power electronic devices, switching processes, and emergency operating modes, such events may occur repeatedly throughout the equipment service period. Unlike harmonic distortion, which mainly produces a quasi-stationary thermal effect, voltage sags cause pronounced transients in the electrical and mechanical subsystems of an induction motor, accompanied by abrupt changes in electromagnetic torque, increased currents, and dynamic overloads.
From the physical standpoint, a reduction in supply voltage leads to a decrease in electromagnetic torque, an increase in slip, and a disruption of the balance between electromagnetic torque and load torque. When the voltage is restored, peak currents and torque oscillations occur, producing additional thermal and mechanical loading. Repeated events of this type create cyclic thermomechanical stress, accelerating winding insulation aging and bearing wear [
44]. Although power quality standards are mainly focused on ensuring equipment operability in the short term, the influence of repeated voltage sags on the long-term service life of induction motors remains insufficiently formalized in engineering reliability assessment methods.
Recent studies on the dynamics of induction machines under voltage sags demonstrate that the depth and duration of the event critically determine the nature of transients, the possibility of speed recovery, and the magnitude of recovery currents. This makes it possible to consider voltage sags as a factor of accelerated thermal and mechanical aging that affects the service life parameter in probabilistic failure models. This section analyzes the mechanisms through which voltage fluctuations affect induction motors, considers quantitative results from experimental and simulation studies, and formalizes the relationship between voltage sag parameters and reduced operational reliability.
A significant contribution to understanding the influence of voltage sags on the operational reliability of induction motors was made in [
44], which analyzes the dynamic response of a three-phase induction motor under voltage sags of different depths and durations, followed by voltage recovery and re-acceleration. Based on a dq-model, the study provides a detailed analysis of motor dynamics during short-term voltage reductions with depths of 0.9–0.5 of the rated voltage and different durations. It is shown that, after voltage recovery, significant transient stator currents occur, with amplitudes that may exceed the rated current by a factor of 2–4. This results in a short-term but intense increase in copper losses and local overheating of the windings. At the same time, pronounced oscillations of electromagnetic torque are observed [
44]:
where
is the electromagnetic torque, N·m;
is the number of pole pairs, dimensionless;
are the stator flux linkages along the d- and q-axes, Wb; and
are the stator current components along the d- and q-axes, A.
These oscillations can generate impact mechanical loads on the shaft and bearing units. It has been established that, at a voltage sag depth of approximately 0.5 Un and sufficient sag duration, the motor may fail to recover its rated speed and may enter a high-slip, high-current operating mode, thereby producing additional thermal loading.
Although [
44] does not provide a direct calculation of service life reduction, the presented results make it possible to formalize the following logical degradation chain (
Figure 8):
Taking into account the Arrhenius model, even repeated short-term overheating events can lead to a reduction in insulation service life and a decrease in the characteristic life parameter of the Weibull distribution. This indicates the potential influence of voltage fluctuations and voltage sags on the long-term reliability of induction motors.
In the context of assessing the influence of voltage sags on the reliability of cable and overhead power lines, the study [
45] is of particular interest. It analyzes the propagation of voltage sags in distribution networks and evaluates their relationship with power supply reliability indices, namely
and
. Unlike studies focused on the physical aging of insulation, this work considers the system level and establishes a statistical relationship between the frequency of power quality events and network failure indices. The authors model different types of short circuits and analyze the depth and propagation area of voltage sags depending on the network topology and line type, cable or overhead. Reliability is assessed using the standard
and
indices, defined as follows [
45]:
where
is the system average interruption frequency index, interruptions/customer;
is the system average interruption duration index, h/customer;
is the number of customers interrupted during the
-th event, customers;
is the total number of customers served, customers;
is the number of interruption events, dimensionless; and
is the duration of the
-th interruption, h.
The correlation analysis performed by the authors showed that an increase in the frequency of voltage sags is accompanied by an increase in
and
values, indicating a decrease in power supply reliability. It was established that voltage sag propagation depends on the network configuration and line parameters, while incorrect placement of power quality recorders may lead to an underestimation of the number of events and, consequently, to a distorted reliability assessment. Although the study does not include a direct model of physical degradation of cable insulation or overhead line conductors, the obtained results make it possible to form a system-level logical chain, at the power system level, indicating that the frequency of voltage sags can be used as an indirect indicator of deterioration in the condition of network elements (
Figure 9).
Thus, voltage sags should be considered not only as short-term power quality deviations, but also as a statistical factor affecting the operational reliability of cable and overhead power lines at the power system level.
3.3. Influence of Load Surges
Modern distribution and industrial power systems are characterized by an increasing share of variable and pulsed loads, which leads to significant power fluctuations and short-term equipment overloads. In contrast to the conventional operating mode with a relatively smooth daily load profile, new types of consumers, including fast electric vehicle charging systems, high-power industrial process complexes, electric arc furnaces, and cyclically operated units, generate sharp load surges and increased peak values of the loading factor [
46].
The transformer hot-spot temperature
can be determined as follows [
5,
37,
47]:
where
is the hot-spot temperature, °C;
is the ambient temperature, °C;
is the top-oil temperature rise over ambient temperature, °C; and
is the additional hot-spot temperature rise in the winding, °C.
The accelerated insulation aging factor can be calculated using the Arrhenius model as follows [
37,
47]:
where
is the accelerated insulation aging factor, dimensionless.
Based on this value, the equivalent insulation aging factor over the calculation interval can be determined as follows [
37,
47]:
where
is the equivalent insulation aging factor over the calculation interval, dimensionless;
is the accelerated insulation aging factor at the
-th time interval, dimensionless;
is the duration of the
-th time interval, h; and
is the number of time intervals, dimensionless.
Then, the loss of service life over the considered period is estimated as follows [
37,
47]:
where
is the loss of life, dimensionless;
is the duration of the considered period, h; and
is the nominal transformer service life, h.
The hot-spot temperature model links loading and ambient conditions to the local thermal stress experienced by transformer insulation. The accelerated aging factor expresses the instantaneous increase in thermal aging rate, while aggregates this effect over a variable loading period and quantifies the corresponding loss of insulation life relative to nominal service conditions. These models are especially useful under nonstationary loading regimes. In engineering practice, they are calibrated or verified using loading guides, heat-run tests, oil and winding temperature measurements, and synchronized operational data.
Sharp changes in the operating conditions of consumer electrical equipment, accompanied by peak loads and rapid current fluctuations, have a significant effect on the thermal regime and long-term reliability of distribution transformers. Peak loads and sharp load surges produce maximum values of hot-spot temperature and, consequently, accelerate insulation degradation [
37].
Similar conclusions were obtained in [
47], where the authors showed that dynamic load fluctuations lead to a significant increase in the aging acceleration factor when the nominal loading factor
K is exceeded. At
K > 1 the hot-spot temperature increases nonlinearly, which sharply increases the accelerated insulation aging factor
and reduces the expected service life. The study demonstrated that even short-term overloads repeated within a daily cycle produce a cumulative aging effect that can substantially reduce the operational life of the transformer.
Thus, load surges form the degradation chain shown in
Figure 10.
Unlike uniform overload, dynamic load peaks create repeated thermal cycles that increase mechanical stresses in the insulation and accelerate aging processes. The studies considered confirm that transformer reliability analysis in modern networks should take into account not only the average loading level, but also the amplitude and frequency of short-term load surges, especially under conditions of the growth of pulsed loads.
The growth of pulsed loads shifts the problem from gradual service life reduction to the area of operational disturbances, since sustained and repeated overloads increase the hot-spot temperature (HST) and may cause protection operation events. Therefore, along with remaining service life assessment, it is important to analyze transformer vulnerability metrics based on loading and thermal indices [
48,
49,
50].
Load surges increase thermal instability in dry-type transformers, while harmonic filtering can reduce winding temperature by 6–8% [
9]. AI-based short-term forecasting models can not only predict such surges, but also analyze their causes, thereby reducing the probability of equipment failures.
3.4. Power Quality Disturbance Mitigation Strategies and Their Relationship with Equipment Service Life Extension
In addition to analyzing the mechanisms of equipment degradation under the influence of power quality disturbances, it is advisable to consider practical strategies for mitigating such impacts. From an engineering perspective, their effectiveness should be assessed not only by the improvement of power quality indicators, but also by their ability to reduce thermal, electrical, and mechanical stresses on equipment, which determine the rate of insulation aging and resource consumption.
Table 1 presents a comparison of the main mitigation strategies, their quantitative effects, degradation mitigation mechanisms, and relationship with equipment service life.
It should be noted that, for filtering and compensation devices, their influence on equipment service life is mostly indirect in most studies and is manifested through a reduction in , additional losses, hot-spot temperature, torque pulsations, and the number of repeated transient processes. At the same time, for load scheduling strategies, particularly controlled electric vehicle charging, the literature has already demonstrated a direct effect in the form of a reduced loss of life and an increased expected service life of distribution transformers.
Based on the results of this section, it can be concluded that load surges are one of the factors accelerating transformer insulation aging, since short-term overloads lead to an increase in hot-spot temperature and in the accelerated insulation aging factor. Unlike uniform loading, repeated peak-load conditions cause cumulative service life loss in electrical equipment, which depends not only on the overload magnitude, but also on its duration and frequency. These findings indicate the need to account for the dynamic load profile when assessing the remaining service life of transformers and planning measures for managing their technical condition.
3.5. Coupled Influence of Multiple Power Quality Disturbances on Equipment Aging and Reliability
In real industrial power systems, electrical equipment is rarely exposed to a single isolated disturbance. Instead, harmonics, voltage unbalance, voltage sags, dynamic overloading, and environmental stress often act simultaneously or sequentially, forming coupled degradation conditions that differ from the simplified single-disturbance cases typically considered in the literature. As a result, the actual aging trajectory of insulation systems is determined by the cumulative and interacting action of thermal, electrical, mechanical, and environmental stresses rather than by one PQ index alone.
For transformers, the coupled action of harmonic distortion, voltage unbalance, overloads, and ambient conditions is especially important, since these factors jointly affect hot-spot temperature, equivalent aging factor, and loss of life. In practice, harmonic currents increase stray and eddy-current losses, unbalance shifts the thermal field between phases, and load variability modifies the duration and severity of thermal excursions. Thus, transformer reliability should be interpreted through a combined thermal-stress framework rather than through a single disturbance descriptor.
For induction motors, harmonics, interharmonics, voltage unbalance, and voltage sags should be considered as interacting stressors. Their combined action increases copper and iron losses, generates torque pulsations and vibration, and produces repeated thermal cycles during sag recovery and re-acceleration. This means that the degradation of windings and bearings is governed by coupled electromechanical stress rather than by harmonic distortion or voltage sag alone.
For cable lines and network sections with significant cable penetration, harmonic distortion may interact with resonance effects, cyclic thermal loading, and environmental stress. This coupling leads to nonuniform conductor heating, accelerated insulation aging, and possible distortion of the network harmonic response. Accordingly, cable reliability assessment should incorporate both electrical stress and the surrounding thermal environment, especially under nonstationary loading conditions.
Thus, for practical reliability assessment, PQ disturbances should be treated as interacting stressors whose combined action determines the actual degradation trajectory of electrical equipment.
3.6. Influence of Circuit Topology and Energy Storage Components on PQ Disturbance Propagation
PQ disturbances should not be treated as independent external factors because their severity and propagation depend strongly on circuit topology, network impedance, grounding configuration, cable length, transformer connection group, converter control strategy, and the presence of energy storage components. Harmonic voltage distortion, for example, is formed by the interaction between nonlinear load currents and frequency-dependent network impedance. Therefore, the same nonlinear load may produce different
levels in radial, meshed, cable-dominated, or converter-dominated networks [
15].
Energy storage systems can both mitigate and intensify PQ disturbances. On the one hand, battery energy storage systems, supercapacitors, and SMES devices can provide fast voltage support, reduce voltage sag depth, smooth load peaks, and limit transformer loss of life. On the other hand, their power electronic interfaces may introduce switching harmonics, supraharmonics, resonance interactions with passive filters, and control-induced oscillations. Therefore, topology-aware PQ assessment should include not only the disturbance source, but also the impedance path between the source and sensitive equipment [
32].
In networks with a high share of underground cables, distributed capacitance shifts resonance frequencies and may increase harmonic hosting limitations. In networks with capacitor banks, passive filters, and converter-connected storage, parallel or series resonance may amplify individual harmonic components. For this reason, PQ-based reliability assessment should include impedance-frequency analysis, harmonic hosting capacity assessment, and dynamic simulation of converter and storage operation.
4. Influence of Power System Operating Conditions on Electrical Equipment at Industrial Enterprises
Industrial enterprises are characterized by complex technological processes in which abnormal operating conditions and emergency situations may arise due to electrical, technological, and anthropogenic factors. For example, the specific features of oil and gas enterprises are determined not only by the characteristics of electricity consumption and equipment operating conditions but also by the overall technological complexity of the production cycle, including geological exploration and production processes that define the reliability requirements for energy infrastructure [
53,
54].
For energy-intensive industrial processes, the stability of the technological process is closely related to the stability of the power operating mode. This is especially characteristic of electrolysis processes, where operating efficiency and stability depend on the parameters of current, magnetic, and control effects, while stability disturbances lead to higher energy consumption and reduced production efficiency [
55].
For mining enterprises, additional importance is attached to technological processes that have a pronounced impact on the production and environmental conditions. In particular, in open-pit coal mines, mass blasting is a source of the most intense short-term emissions of pollutants, and their quantitative assessment requires the use of calculation methods followed by verification using field observation data. This broadens the understanding of the operating environment in which the engineering infrastructure of industrial enterprises functions [
56].
A number of studies note that nonstandard operating conditions contribute to the development of emergency situations, which is reflected in the technical condition of equipment. Analysis of enterprise operating conditions makes it possible not only to identify the causes of PQ deterioration, but also to determine key measures for improving operational reliability.
Production factors, such as load dynamics, generation modes, and the operating characteristics of power installations, play a significant role in shaping electricity consumption patterns. The interaction of different agents within an electrotechnical complex affects the accuracy of short-term forecasting of energy generation and consumption. Such multifactor analysis provides a basis for developing recommendations for optimizing equipment operation.
Under unbalanced operating conditions and harmonic distortion levels of up to 15% in distribution networks, up to 10–15% of total losses may be attributed specifically to distortion and unbalance. For example, in the oil and gas sector, these losses are intensified by the cyclic operation of pumps, compressors, and drilling rigs.
To analyze the influence of production operating conditions, it is reasonable to distinguish three typical states of the power system: normal, emergency, and transient.
In the normal operating mode, voltage and current parameters remain within permissible limits; however, even minor fluctuations can generate additional losses.
The emergency operating mode is accompanied by sharp load surges and voltage sags. Simultaneous starting of multiple pump motors can cause a significant voltage drop in the network, negatively affecting the operation of sensitive equipment. It has been established that the dynamic response of induction motors to voltage sags is characterized, after voltage recovery, by peak currents exceeding the rated values by several times, as well as by significant electromagnetic torque oscillations, which create mechanical and thermal stress in the machine [
52].
Sharp Load Surges and Voltage Sags
At a
level of 34% the transformer hot-spot temperature may exceed 140 °C, leading to accelerated insulation aging and emergency shutdown [
57].
The transient operating mode is characterized by changes in the technological process and redistribution of power flows. Modern approaches based on equipment mission-profile analysis make it possible to account for variable operating loads in reliability assessment [
58]. In this case, the equipment failure probability can be related to changes in the service life parameter of the Weibull distribution.
When transitioning from one operating mode to another, for example, during a change in the technological process, a dynamic redistribution of energy flows occurs. Machine learning-based models make it possible to predict such transient processes and mitigate their negative effects on equipment.
During changes in the technological process, dynamic energy redistribution occurs. It has been found that harmonic phase angles under transient operating conditions can form local overheating zones in transformers, thereby increasing the risk of failure.
For a clearer understanding of the differences between operating modes, a comparative
Table 2 is provided below.
It can be concluded that the operating modes of industrial power systems directly determine the nature of their impact on electrical equipment. Under normal operating conditions, permissible operational loads prevail, whereas dynamic, emergency, and transient modes are accompanied by load surges, voltage sags, increased harmonic distortion, and redistribution of power flows. These factors lead to higher thermal and mechanical loads, accelerated insulation aging, increased losses, and a higher probability of failure. Thus, when assessing the technical condition of equipment, it is necessary to consider not only steady-state network parameters, but also the frequency, duration, and depth of deviations that occur under actual production operating conditions.
5. Technical Condition of Electrical Equipment
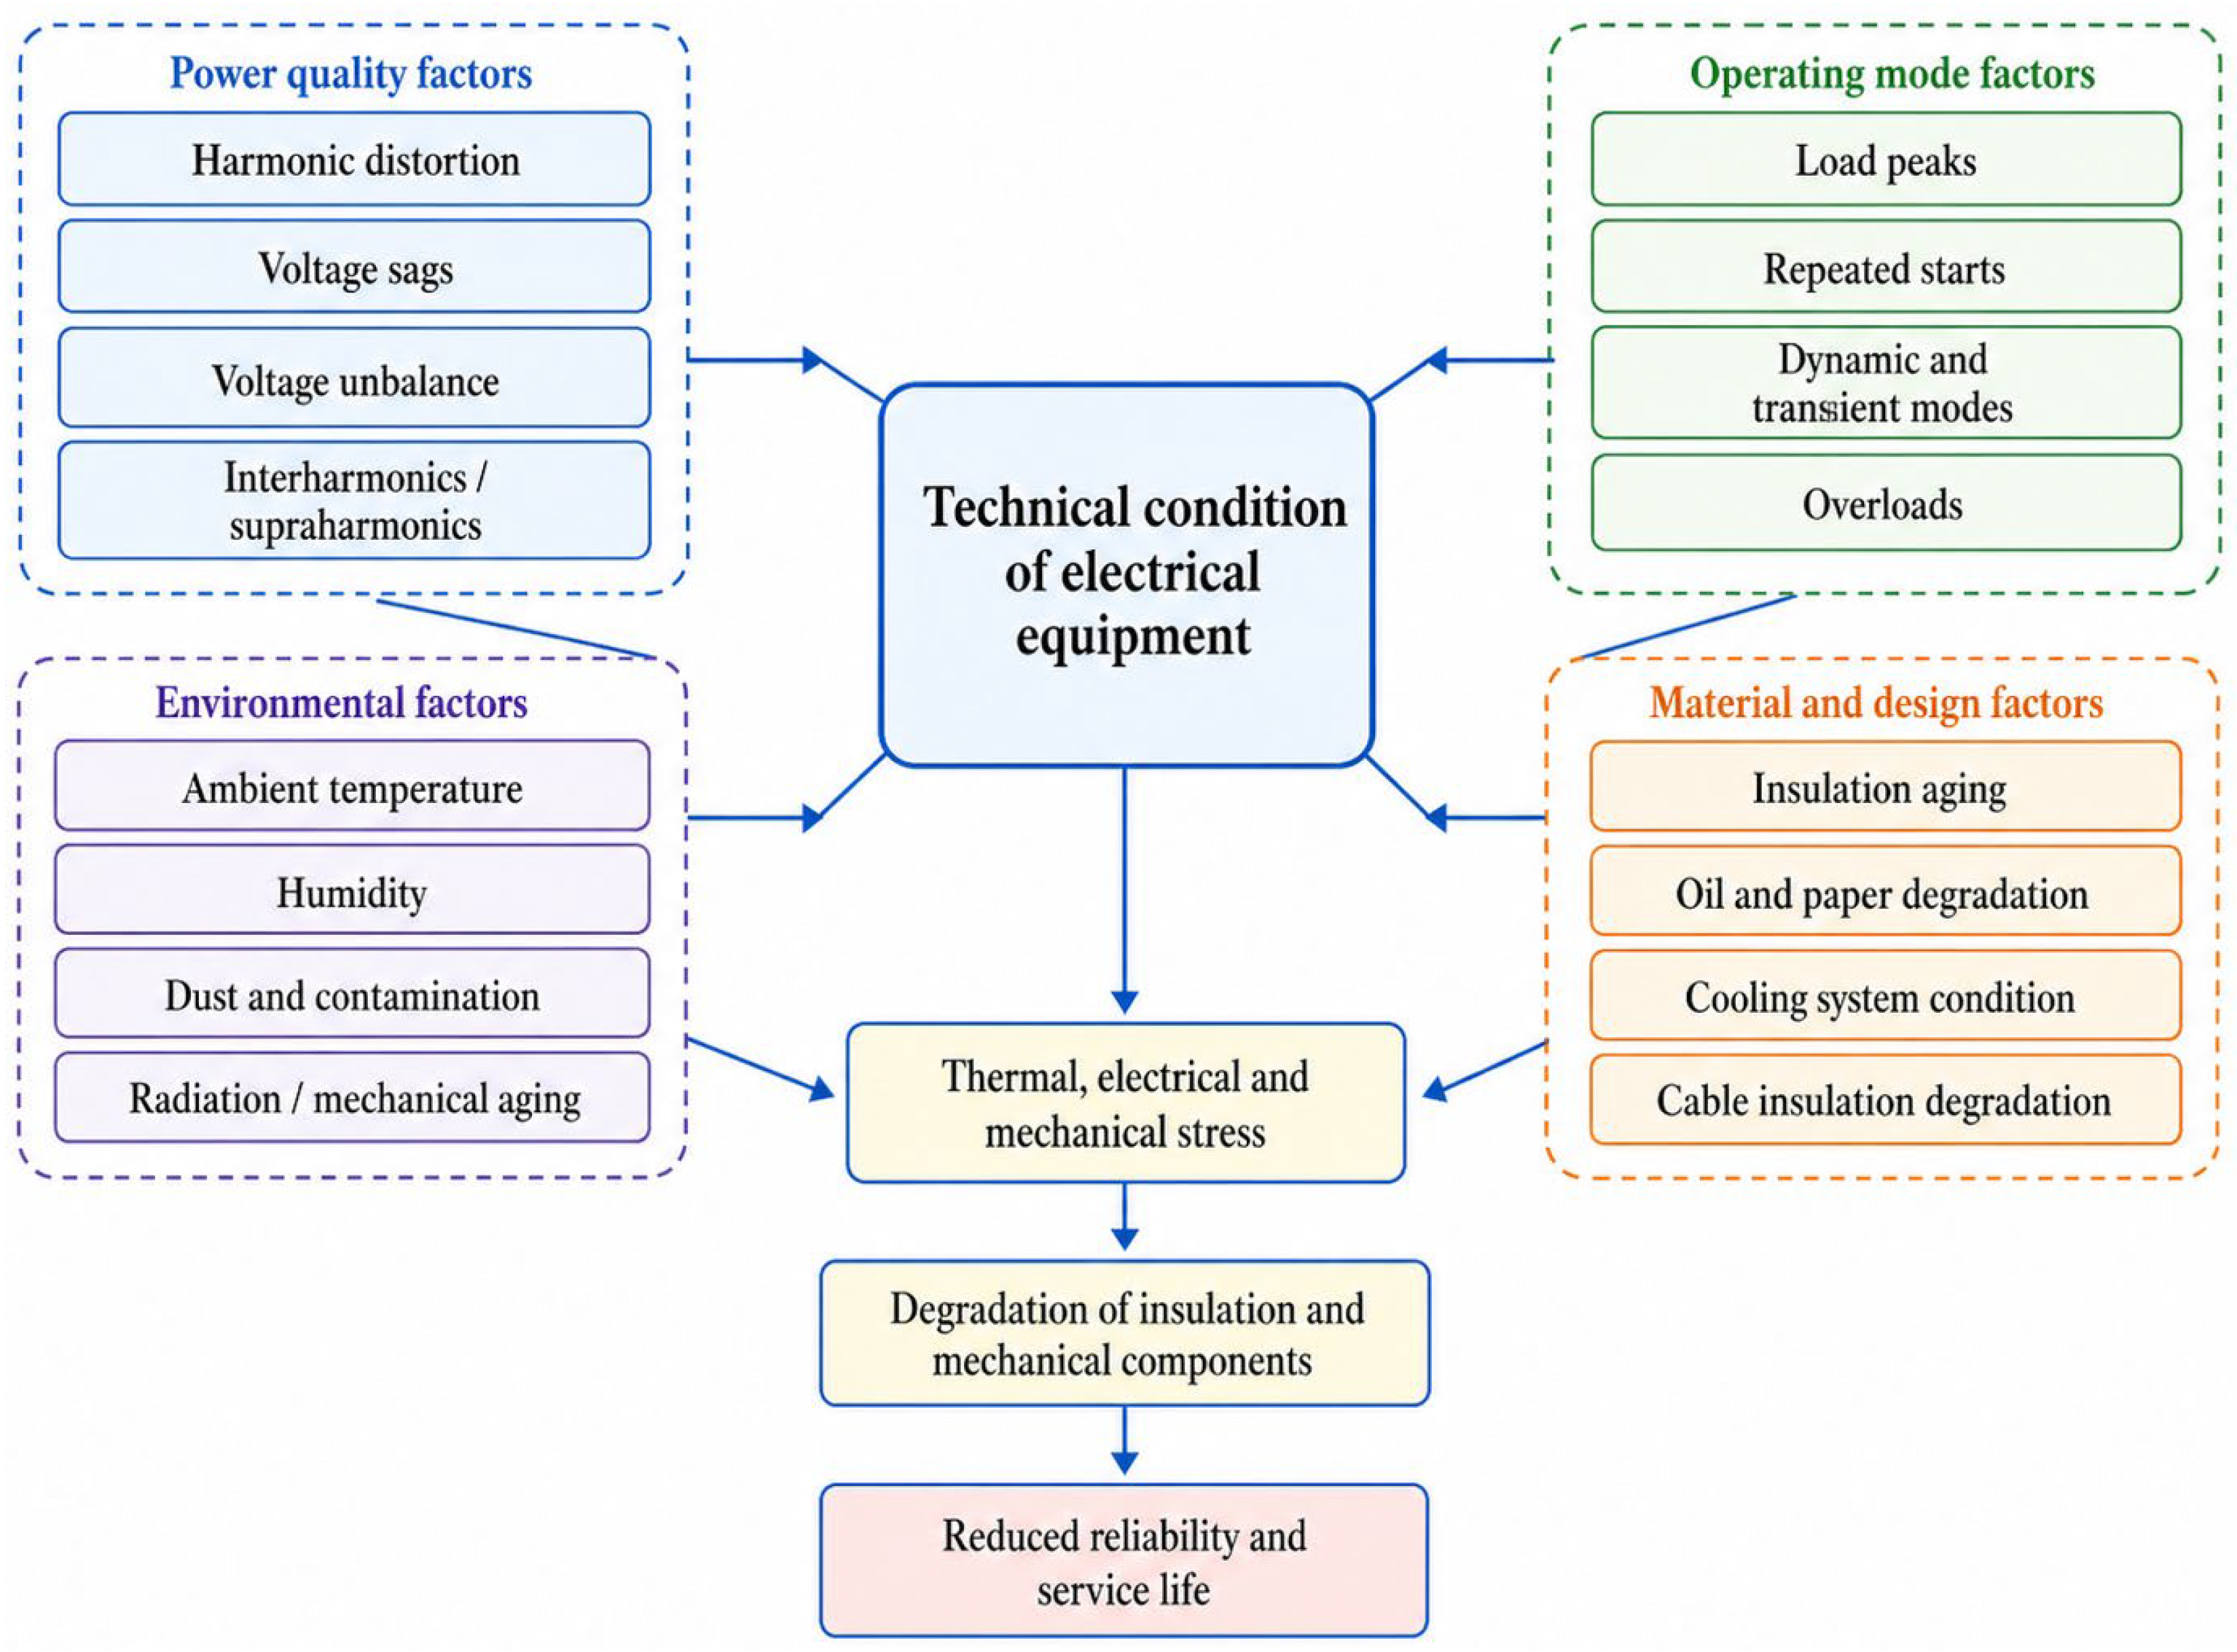
The technical condition of electrical equipment is formed under the combined influence of power quality, operating conditions, environmental factors, and the aging of insulating and structural materials. Unlike isolated diagnostic parameters, the actual condition of transformers, induction motors, cable lines, and switching devices reflects the cumulative effect of electrical, thermal, mechanical, and climatic stresses. In industrial power systems, this interaction becomes especially important because nonlinear loads, voltage disturbances, load surges, and harsh operating environments can accelerate degradation processes and reduce equipment reliability. This section summarizes the main groups of factors affecting equipment condition and analyzes how power quality disturbances contribute to insulation aging, increased losses, mechanical stress, and failure risk.
5.1. Factors Affecting the Technical Condition of Equipment
The technical condition of electrical equipment is determined by a combination of electrical, thermal, mechanical, and operational factors. In modern industrial power systems, the greatest influence is exerted by power quality, load dynamics, environmental conditions, and the condition of insulating materials and cooling systems. The structure of the main groups of factors affecting the technical condition of electrical equipment is shown in
Figure 11.
5.1.1. Power Quality
As highlighted in
Section 3, harmonic distortion, voltage sags, and phase unbalance create additional thermal and mechanical loading on induction motors, transformers, and cable lines.
At high
levels, the hot-spot temperature may increase by 10–20%, which significantly accelerates insulation aging [
11,
42,
59]. A number of studies have shown that, under non-sinusoidal current conditions, the permissible loading of transformers should be reduced, that is, derating should be applied, since additional losses may reach [
59,
60].
Under three-phase unbalance, the position of the winding hot spot may become non-fixed with respect to phase, which requires either multipoint measurement or reconstruction of the hot-spot temperature based on indirect indicators [
61].
The insulation resistance of a cable decreases according to the Arrhenius law as a function of aging temperature. Even a temperature increase of 6–8 °C can double the aging rate [
35]. Continuous exposure to high temperatures and mechanical vibrations leads to deterioration of the dielectric properties of insulating materials, which may cause premature equipment failure.
Accelerated thermal aging of cellulose, or oil-paper, insulation is reflected in the degradation of polymer structure indicators, which can be used as one of the diagnostic indicators of winding insulation aging [
62].
The service life and reliability of insulating materials, including oil, should be assessed using accelerated aging tests followed by parameterization of a lifetime model, which improves the validity of failure forecasts and maintenance planning [
63].
For induction motors, harmonics and unbalance cause increased iron and copper losses, as well as increased vibration and torque pulsations, leading to accelerated bearing wear and insulation degradation [
64].
5.1.2. Sharp Load Surges and Dynamic Operating Modes
Load surges cause short-term overloads of transformers and drives. Accounting for variable loads and climatic factors makes it possible to significantly refine the service life prediction of distribution transformers. Repeated short-term overloads cause cumulative service life loss [
36].
For induction motors, simultaneous starting of multiple motors and voltage sags lead to peak currents exceeding rated values by a factor of 2–4. In transient operating modes, significant torque oscillations occur, generating mechanical stress [
65].
5.1.3. Environmental Conditions
Although the main focus of this study is on electrical operating conditions, accelerated insulation aging in real operation is determined by their combined action with environmental factors. For transformer oil-paper insulation, not only harmonic distortion and overloading are important, but also ambient temperature, humidity, and moisture accumulation in cellulose: during aging, water and acids accelerate the reduction in the degree of polymerization, while dynamic lifetime models change significantly when real load profiles, ambient temperature, and paper moisture are taken into account. For cable insulation, the combined action of thermal, electrical, mechanical, and environmental stresses is also fundamental, since it leads to a reduction in dielectric strength, thermal stability, and mechanical integrity. Accordingly, when assessing lifetime, it is reasonable to speak of the cumulative damage principle: lifetime is consumed not by an individual event, but by the time integral of the combined thermoelectric and environmental stress [
62].
Extreme climatic conditions, including low temperatures, high humidity, and dust, deteriorate the thermal operating conditions of equipment. Cable insulation resistance and the degradation of cellulose materials depend exponentially on the aging temperature.
For polymeric XLPE/CSPE cables, it has been established that radiation–mechanical aging leads to deterioration of dielectric characteristics and a reduction in breakdown strength [
66].
5.2. Analysis of the Consequences of the Influence of Power Quality on the Technical Condition of Electrical Equipment
As part of the study, failures of electrical equipment at industrial enterprises were analyzed while taking into account the influence of various factors. In particular, it is noted that voltage sags and load surges lead to the following problems [
67]:
Damage to induction motor windings due to temperature rise and repeated starting currents;
Deterioration of transformer insulation due to an increase in hot-spot temperature;
Increased losses and accelerated aging of cables under harmonic distortion;
Distortion of partial discharge diagnostics in the presence of harmonics;
Accelerated degradation of arc-quenching chambers in switching devices under overvoltage conditions.
Thus, the technical condition of electrical equipment is formed under the influence of a complex set of factors, including power quality, load dynamics, climatic conditions, and the condition of insulating materials. Modern monitoring and predictive diagnostic methods make it possible to account for these factors. However, the integration of thermal models, statistical methods, and machine learning remains an urgent task for improving the operational reliability of equipment in industrial environments.
6. Modern Technologies for Monitoring and Predicting Equipment Technical Condition
Modern technologies for monitoring and predicting the technical condition of electrical equipment provide the basis for the transition from scheduled maintenance to predictive and risk-based operation. Unlike traditional inspection, which is based on periodic measurements, modern systems enable continuous data collection on operating parameters, temperature, vibration, partial discharges, insulation condition, and power quality indices.
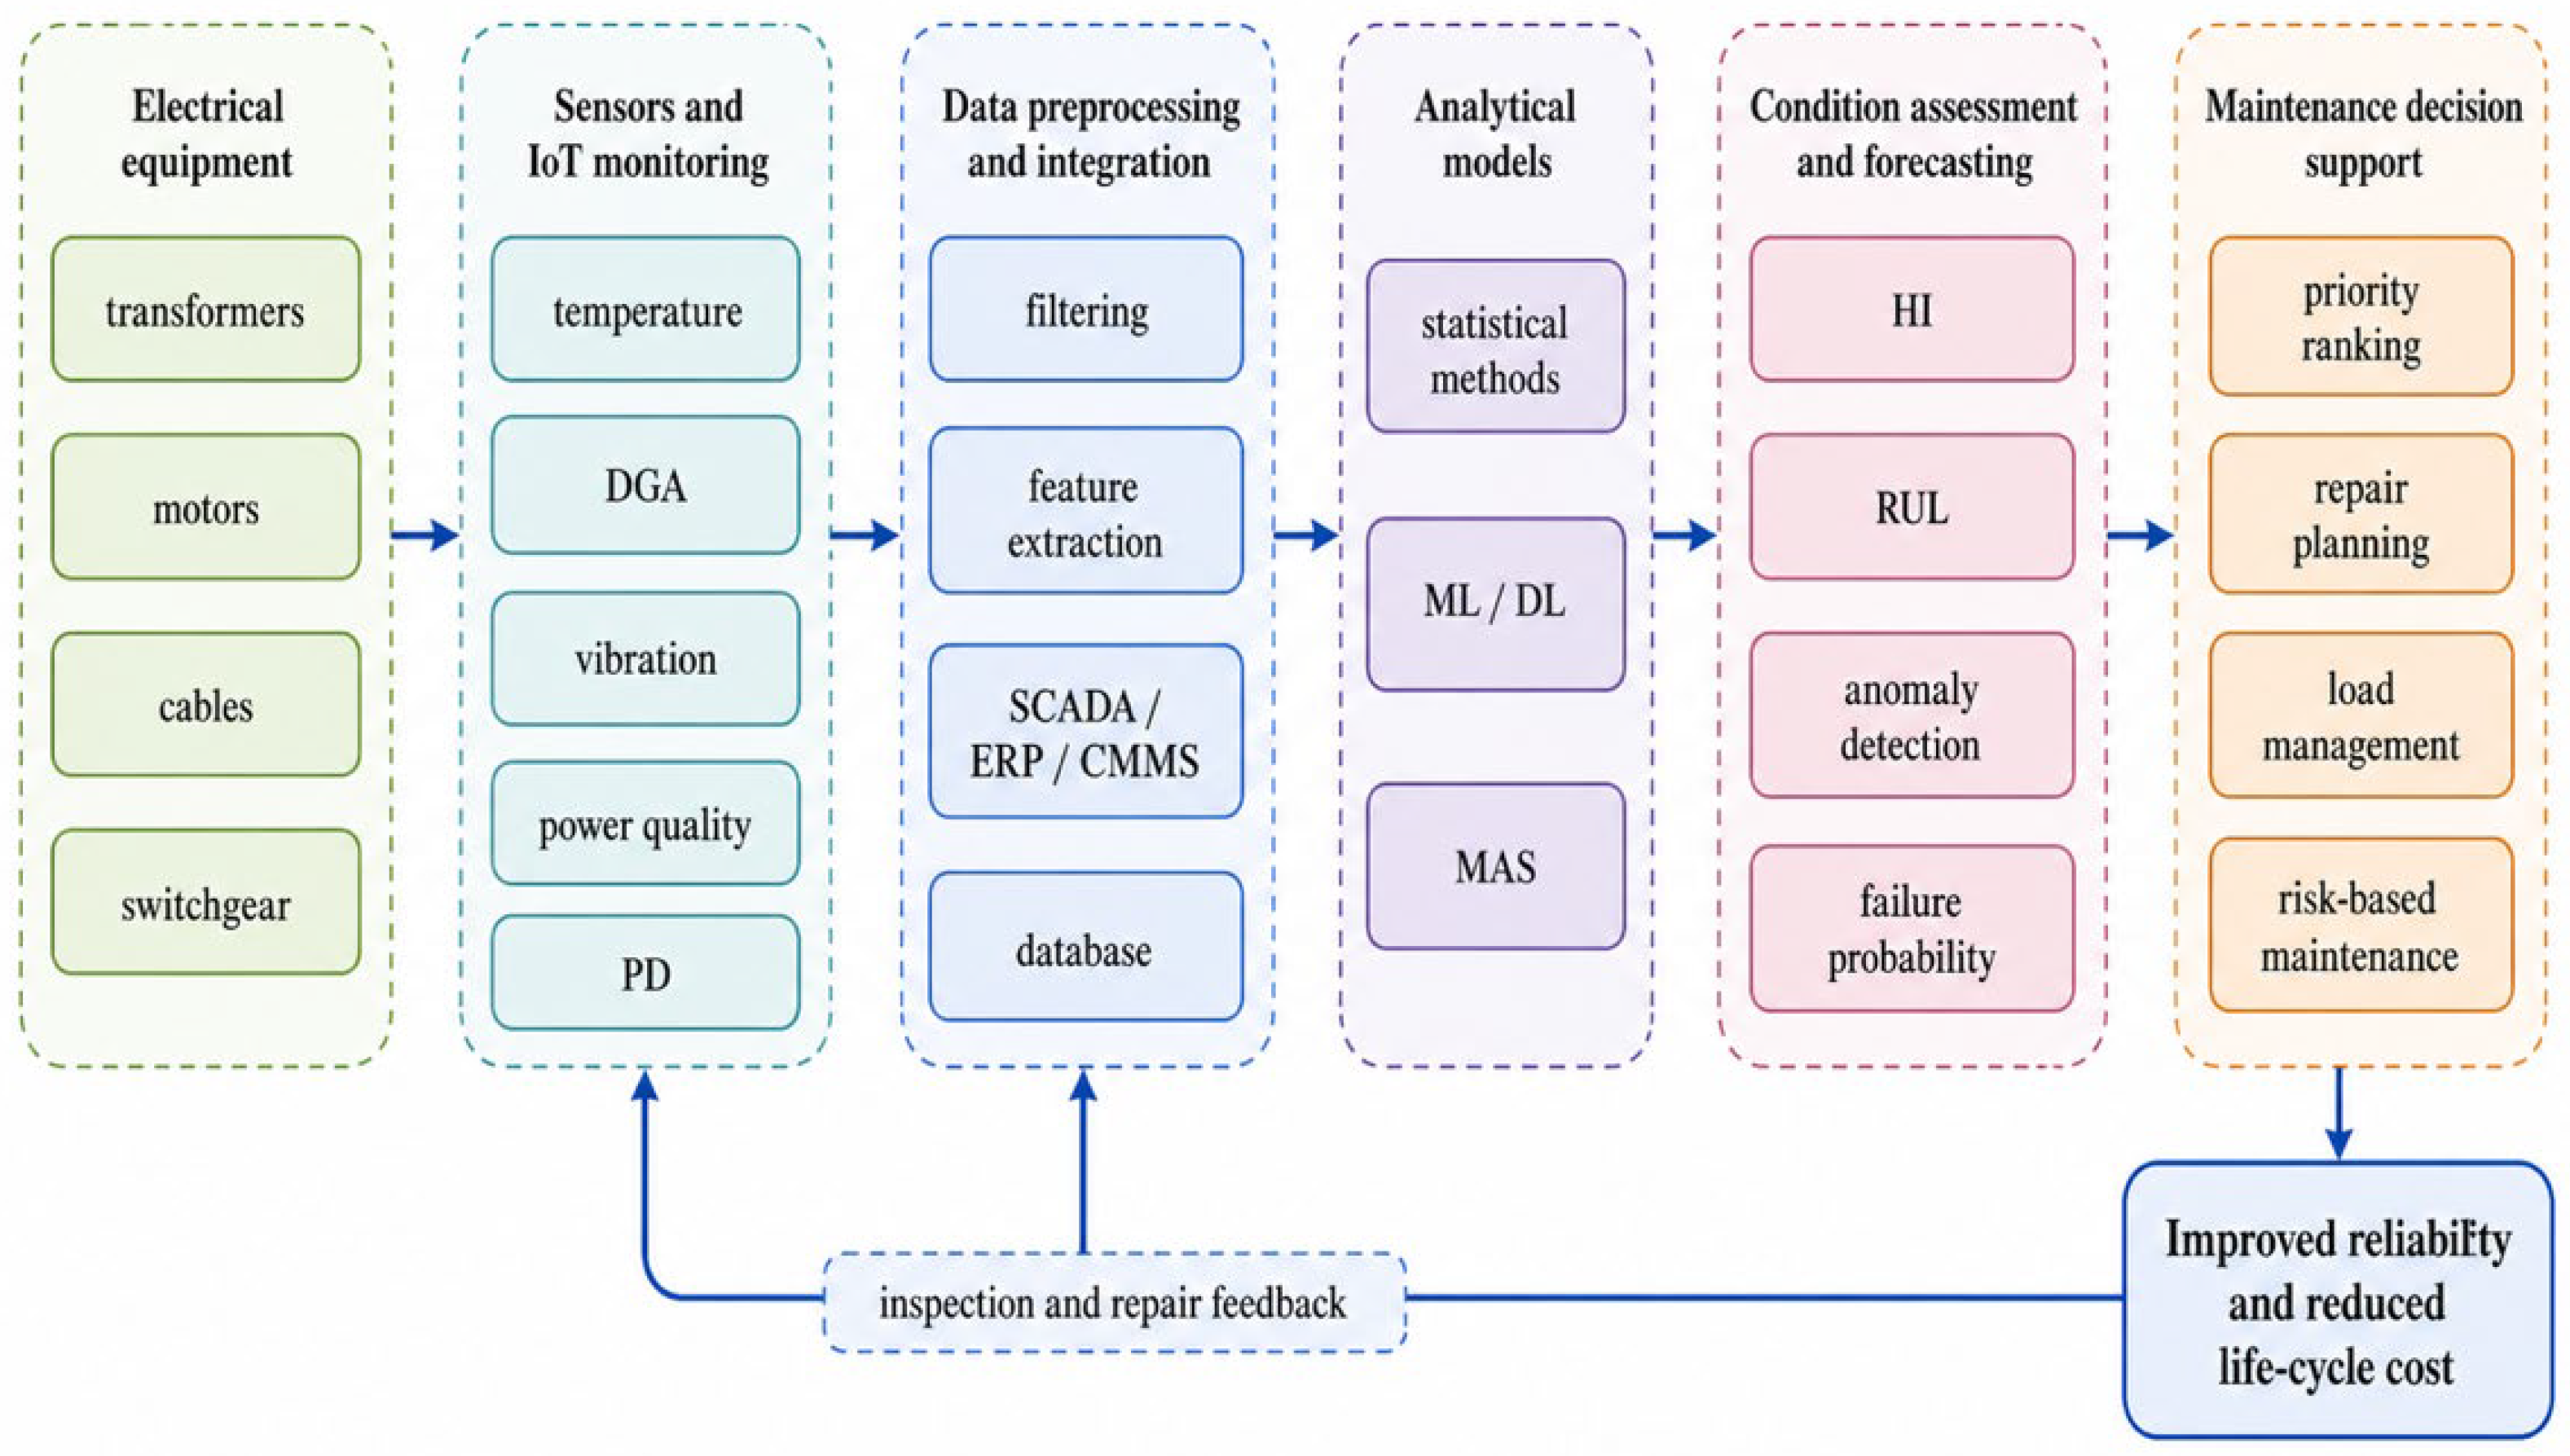
Processing such data requires the integration of IoT monitoring, statistical control methods, machine learning algorithms, multi-agent models, and predictive analytics tools. As a result, a unified digital loop is formed, in which equipment data pass through the stages of acquisition, preprocessing, diagnostic feature extraction, condition assessment, remaining useful life prediction, and maintenance decision support.
An integrated framework for monitoring, diagnostics, prediction, and maintenance decision support for electrical equipment is shown in
Figure 12.
6.1. Challenges in Diagnostics and Monitoring
Despite the high level of development of monitoring technologies, diagnosing the technical condition of equipment remains a complex task. A number of studies emphasize the need to apply predictive diagnostic methods using real-time data.
6.1.1. Internet of Things (IoT) Monitoring
Real-time transmission of equipment condition data makes it possible to respond promptly to changes in operating conditions. Such systems can record parameters in real time, but in the presence of harmonics and unbalance, the data may be distorted. Modern transformer and cable monitoring systems use IoT architectures for real-time data transmission. This makes it possible to monitor winding temperature, dissolved gas concentration in oil, vibration, and the harmonic composition of currents. However, the presence of harmonics and unbalance may distort measurements, as noted in the analysis of partial discharges [
68].
For practical implementation of IoT- and machine learning-based predictive monitoring, it is important to specify not only the monitored variables but also the corresponding sensor types and data acquisition rates. Since different degradation mechanisms evolve on different time scales, the required sampling frequency depends on the monitored phenomenon, ranging from low-rate thermal measurements to high-frequency acquisition of vibration and partial discharge signals.
Table 3 summarizes typical sensor classes, monitored parameters, and representative sampling requirements reported in the literature [
69,
70].
As shown in
Table 3, the required data acquisition rate strongly depends on the monitored degradation mechanism. Slow thermal and load-related variables are typically sufficient for health index estimation and remaining useful life prediction, whereas vibration, partial discharge, and waveform-based PQ analysis require significantly higher temporal resolution. This distinction is important when selecting machine learning architectures, storage infrastructure, and edge-versus-cloud processing strategies.
6.1.2. Statistical Data Analysis and Control Method
The application of statistical process control (SPC) methods makes it possible to reduce the number of false alarms, improve diagnostic accuracy, and detect deviations from normal operating conditions.
6.1.3. Machine Learning
The use of machine learning algorithms for processing large volumes of data makes it possible to generate equipment condition forecasts with increased accuracy. In [
71], neural-network-based methods for detecting voltage sags while accounting for physical constraints of the system are proposed.
6.1.4. Alternating Intelligence (AI)-Based Diagnostics
Analysis of PD patterns under harmonic voltage conditions shows that a single metric is insufficient: the spectral composition and phase relationships of harmonics create additional modulation of PD event images and distributions, which is critical for automated expert systems.
Methods for quantitatively separating dielectric loss components and extracting the contribution of PD losses under harmonic distortion of high-voltage waveforms show a strong dependence of these losses on the phase angles of harmonics [
72].
6.2. Application of the Multi-Agent Approach
Multi-agent systems (MAS) are among the most promising tools for modeling complex electrotechnical complexes. This approach represents individual enterprise subsystems, including generation, transformation, drive units, cable lines, and switching devices, as autonomous agents that exchange information in real time. A multi-agent architecture makes it possible to account for load dynamics, voltage fluctuations, the influence of climatic factors, and the mutual influence of equipment.
A number of recent studies have shown that integrating data from different subsystems improves the accuracy of short-term network operating condition forecasting and anomaly detection. For example, physics-informed and constraint-driven neural-network models for voltage sag detection demonstrate a significant increase in algorithm robustness to noise and distortion.
Multi-agent logic is especially effective in describing transient operating conditions, where a change in the state of one element causes cascading effects in the system. In a generalized form, this logic can be represented as a dynamic system of interacting states:
where
—is the state of the
-th agent at time
;
—is the state update function of the
-th agent;
is the interaction function describing the influence of the
-th agent on the
-th agent; and
is the state of the
-th agent at time
.
Multi-agent models make it possible to account for the interaction of all enterprise subsystems. This approach provides more accurate forecasts of voltage fluctuations and load conditions.
The application of MAS improves the accuracy of forecasting voltage fluctuations and load operating modes, as confirmed by studies in the field of intelligent power systems.
6.3. Machine Learning for Operating Mode Forecasting
A systematic review in the field of real-time analysis identifies typical pipelines for PQ detection and classification, including preprocessing, feature extraction, classifier or neural-network implementation, and online validation. It also shows which performance metrics are most appropriate for operational scenarios [
73].
Machine learning algorithms are widely used to analyze large volumes of data obtained from monitoring systems. In particular, the use of explainable artificial intelligence methods makes it possible not only to predict future changes in power system parameters, but also to interpret the influence of different factors on the resulting models. This enables timely corrective actions to prevent emergency situations [
74].
The most commonly used methods include Artificial Neural Networks (ANNs), Support Vector Machines (SVMs), Random Forest (RF), Convolutional Neural Networks (CNNs), and Long Short-Term Memory (LSTM) networks [
73,
75,
76].
Table 4 presents a critical comparison of machine learning algorithms for predictive monitoring of electrical equipment.
For PQ disturbance classification and predictive monitoring tasks, recent reviews and comparative studies indicate that hybrid deep-learning architectures such as CNN-LSTM often outperform standalone CNN or LSTM models in transient and multi-scale classes of disturbances. However, this advantage is achieved at the cost of substantially higher requirements for training data volume, labeling quality, and computational resources. Therefore, for industrial diagnostic applications, the key recommendation should not be formulated in terms of which architecture is universally superior, but rather in terms of which architecture is most appropriate for a given data representation, prediction horizon, and computational constraint [
77].
From a methodological perspective, the comparison of several AI models within a unified forecasting framework is essential, since it allows the researcher to evaluate not only predictive accuracy, but also robustness under different scenarios and data conditions. Such a benchmarking approach is also relevant for electrical equipment monitoring tasks, where the choice of model should account for the structure of time-series data, operating variability, and the intended real-time application [
78].
LSTM architectures have shown high efficiency in analyzing time series of transformer and motor parameters. In studies on transformer diagnostics based on partial discharge and temperature data, defect classification accuracy of up to 99% has been achieved through comprehensive signal processing. LSTM models effectively predict the development of insulation defects and local overheating [
79]:
where
is the hidden state at time step
;
is the hidden state at the previous time step;
is the input signal at time step
;
are weight matrices;
is the bias vector.
For non-invasive monitoring of load operating modes, NILM approaches are promising, as they make it possible to determine equipment states from an aggregated active power signal without installing additional measurement channels [
80].
Modern machine learning methods are applied not only to diagnostics of power equipment, but also to the modeling of complex industrial processes, where hidden nonlinear relationships between technological parameters must be identified [
81].
Recent studies also emphasize the need to apply explainable artificial intelligence (XAI) models, which make it possible to interpret the contribution of individual factors, such as temperature, , and vibration, to the final prediction. This is especially important for energy enterprises, where management decisions require technical justification.
An additional direction in the development of intelligent operating mode analysis is the identification and classification of electrical loads based on electricity consumption time series. A recent study on mining enterprises proposed an approach based on singular value decomposition, which makes it possible to decompose time series of outgoing feeders and identify characteristic load patterns of aggregated consumer groups. This approach is of practical interest for demand-side management, energy efficiency improvement, and the development of decision support systems in power supply systems of industrial enterprises [
82].
6.4. Examples of Monitoring System Implementation
IoT-based monitoring systems are widely used in the power industry. A review of IoT architectures for transformers shows that modern solutions include hot-spot temperature sensors, dissolved gas analysis (DGA) sensors, vibration sensors, and harmonic analysis. A systematic review of transformer IoT monitoring identifies typical architectures and indicates key implementation barriers, including cybersecurity, sensor reliability, and data quality.
The power measurement error in industrial motor monitoring systems usually does not exceed ±5%, which makes it possible to detect deviations in operating conditions in a timely manner.
Integration of monitoring with ERP and maintenance management systems makes it possible to optimize repair schedules and move from scheduled preventive maintenance to a predictive maintenance strategy.
A promising direction is non-invasive transformer monitoring, which makes it possible to identify signs of internal defects without structural intervention and without taking the equipment out of service. This is especially valuable for critical units [
83].
For power cables, multiparameter online monitoring is actively developing, including temperature, sheath currents, dielectric losses, and other indicators. However, the key challenges remain the long-term reliability of sensors and measurement noise immunity [
84].
For underground medium-voltage networks, fiber-optic multiparameter monitoring systems are also applicable, as they make it possible to combine temperature, mechanical, and electrical indicators into a unified monitoring system [
85].
6.5. Data-Driven Diagnostics and Predictive Analytics
To improve reliability and optimize equipment operation, predictive analytics methods are used, including the collection and analysis of sensor data. In recent transformer PHM studies,
prediction is considered a central element of maintenance optimization, since the objective is to schedule the right maintenance action for the right asset at the right time while reducing the risk of unplanned outages [
86].
estimation can be performed based on a thermal model and a HI [
87]:
where
is the remaining useful life, h;
is the critical operating time corresponding to the limiting technical condition, h;
is the failure rate at time
, 1/h; and
is the integration variable, h.
For predicting the
of transformers under multiscale operating factors, hybrid time-series architectures are used to improve feature fusion and adaptation to variable operating conditions [
87].
For practical estimation of hot-spot temperature under dynamic loads, soft-sensing approaches based on neuro-fuzzy models are applied. These approaches make it possible to approximate nonlinear relationships between operating conditions and the thermal response of a transformer [
88].
ML algorithms make it possible to dynamically correct the parameter η based on the current thermal regime and PQ indices [
87]. Big data analysis makes it possible to predict equipment overheating 24 h before a critical value is reached. Integration of monitoring with corporate management systems makes it possible to link
forecasts with maintenance plans, reducing the risk of emergency failures and optimizing costs. For practical HI models, data imbalance is typical, since there are few examples of “poor” condition. Therefore, oversampling methods, such as SMOTE-based approaches, can significantly improve the quality of ML-based condition prediction [
89]. Transformer HI is considered an aggregated indicator of the survivability and condition of an equipment fleet, integrating test and monitoring results into a unified scale for asset management [
90].
To implement risk-based maintenance of power units, it is promising to use integrated priority indicators that combine the HI, consumed technical resource, and failure risk level. For example, for power units of captive power plants, it has been shown that using only the HI does not provide sufficiently justified equipment ranking, whereas the joint consideration of technical condition, consumed technical resource, and failure risk makes it possible to develop more justified maintenance and repair programs under resource constraints [
91].
Modern DL architectures and generative data augmentation methods are used for PRPD pattern recognition, increasing the robustness of defect classification under variable measurement conditions [
92].
Bayesian DL approaches make it possible not only to predict the failure rate using DGA data, but also to generate confidence intervals for the forecast, which is important for risk-based decision making and maintenance planning [
93].
To move from qualitative degradation analysis to quantitative asset management, PQ indicators should be linked to operating parameters and service-life indicators through a multi-level evaluation framework. The first level includes measured PQ indicators, such as voltage deviation,
, VUF, voltage sag depth and duration, flicker, and transient overvoltages. The second level includes equipment operating parameters, such as RMS current, load factor, hot-spot temperature, vibration velocity, partial discharge activity, and insulation resistance. The third level includes service-life indicators, such as aging acceleration factor, equivalent aging factor, loss of life, health index, remaining useful life, and failure probability. This structure makes it possible to convert power quality deviations into measurable degradation and maintenance indicators. The proposed threshold-based evaluation framework is summarized in
Table 5.
Modern monitoring and forecasting technologies enable the transition to a predictive operation model for electrical equipment. The integration of multi-agent systems, IoT monitoring, machine learning methods, and big data analytics provides improved diagnostic accuracy, a reduction in false alarms, early detection of overheating and defects, and optimization of maintenance schedules. This is especially relevant for industrial enterprises with highly dynamic loads and nonstandard operating conditions.
7. Recommendations for Managing the Technical Condition of Equipment
Based on the analysis of recent studies in the fields of insulation thermal aging, dynamic operating conditions, harmonic distortion, and predictive diagnostics, a set of recommendations can be formulated to improve the reliability of electrical equipment at industrial enterprises.
7.1. Implementation of Integrated Monitoring Systems
Recent studies confirm that the transition from periodic inspection to continuous monitoring significantly reduces the risk of sudden equipment failures [
83,
84,
85]. IoT-based monitoring systems for transformers and cable lines make it possible to monitor hot-spot temperature, dissolved gases, vibration parameters, and the harmonic spectrum. A systematic review of IoT architectures has shown that the integration of temperature sensors and load analysis can reduce the uncertainty of remaining useful life estimation by 15–20% compared with conventional methods. Considering the exponential dependence of accelerated aging on temperature, temperature monitoring is a key factor in service life management [
69]. Recommendation: implementation of integrated systems combining temperature monitoring, PQ monitoring, and vibration diagnostics.
7.2. Application of Short-Term Forecasting Systems
It is important to implement methods for forecasting electricity generation and consumption using explainable artificial intelligence, which makes it possible to minimize risks associated with voltage fluctuations and load surges [
73,
80,
82]. Neural networks make it possible to predict voltage sags with high robustness to noise. For load and temperature time series, LSTM models are effective. The use of short-term forecasting over a 24–48 h horizon makes it possible to prevent overheating of dry-type transformers, redistribute load, and adjust generation modes [
99].
7.3. Optimization of Enterprise Operating Conditions
Dynamic load peaks multiply the accelerated aging factor of transformers. When the loading factor K > 1, the temperature increases nonlinearly. The main recommendations include limiting peak loads, staged starting of large motors, reactive power compensation, and implementation of adaptive load control systems [
37,
47,
100].
7.4. Systematic Predictive Diagnostics
The application of prognostic methods for assessing equipment condition, such as remaining useful life estimation and vibration analysis, makes it possible to perform maintenance and repair activities in a timely manner and prevent failures. RUL estimation methods enable the transition from scheduled preventive maintenance to a predictive maintenance model.
7.5. Integration of Analytical Data into the Management Strategy
Integration of monitoring system data with enterprise information flows makes it possible to make operational decisions based on the analysis of actual operating conditions, thereby improving energy efficiency and equipment reliability. Accounting for load and weather conditions in the maintenance model makes it possible to optimize repair schedules. Integration of monitoring with ERP systems makes it possible to synchronize production conditions and maintenance, reduce unplanned downtime, and minimize emergency shutdowns [
91,
95,
96].
Improving the reliability of electrical equipment requires an integrated approach that includes:
Continuous monitoring;
Forecasting based on ML and XAI;
Thermal modeling and aging assessment;
Adaptive load management;
Integration of analytics into the enterprise strategy.
Recent studies confirm that the combination of IoT, multi-agent models, and machine learning methods can significantly reduce failure probability and extend equipment service life under dynamic industrial operating conditions.
Integrating the equipment HI into life-cycle cost analysis and digital asset management tasks makes it possible to justify predictive maintenance and equipment modernization strategies not only technically, but also economically [
101].
7.6. Step-by-Step Transition from Conventional Maintenance to IoT-Driven Predictive Maintenance at Industrial Enterprises
Recommended implementation sequence for an industrial facility may be summarized as follows:
Asset inventory and criticality ranking.
At the first stage, the most critical transformers, cable lines, and motors should be identified, especially those associated with high failure consequences and a pronounced history of overloads, harmonic distortion, or voltage sags.
Deployment of monitoring devices.
Critical nodes should be equipped with temperature, current, and voltage sensors, THD/VUF measurement devices, oil and moisture sensors, and, where required, vibration and PD monitoring channels.
Development of a unified data platform.
Data should be synchronized in time, separated into slow trends and high-frequency events, and transferred to a SCADA, edge, or IoT infrastructure supported by a clearly defined cybersecurity policy.
Implementation of hybrid analytics.
At the initial stage, rule-based indicators based on standards and thermal models should be introduced. Subsequently, these tools should be supplemented by ML models for health index estimation and remaining useful life prediction.
Linking analytics to maintenance actions.
For each equipment class, predefined decision rules should be established, including load redistribution, filtering, drying, repair, replacement, or operating restrictions.
Pilot implementation and scaling.
The system should first be validated at a pilot site and then scaled to the entire facility with monitoring of key performance indicators, including THD, hot-spot temperature, loss of life, number of emergency outages, and maintenance costs.
Such a staged transition makes it possible to move from fragmented diagnostic practice to an integrated predictive maintenance framework in which power quality indices, operating conditions, and equipment degradation indicators are jointly considered in asset management decisions.
8. Discussion
The results of this review show that power quality disturbances and nonstandard operating conditions should be considered not only as short-term operational problems, but also as long-term degradation factors affecting the technical condition and reliability of electrical equipment. Harmonic distortion, voltage sags, load surges, and voltage unbalance change the electrical, thermal, and mechanical stress patterns in transformers, induction motors, cable lines, and overhead power lines. These effects lead to increased losses, higher hot-spot temperatures, accelerated insulation aging, vibration growth, torque pulsations, and a reduction in service life.
From the perspective of the working hypothesis of this review, the findings confirm that PQ indices can be integrated into equipment condition assessment models and reliability models. In particular, harmonic distortion can be linked to additional losses, temperature rise, and a decrease in the Weibull scale parameter η, while load surges can be related to the accelerated aging factor , equivalent aging factor , and loss of life . This indicates that PQ disturbances can be interpreted as measurable external factors that modify the degradation rate of electrical equipment.
8.1. Relationship with Previous Studies
The findings are consistent with previous studies showing that harmonic distortion increases RMS currents, winding losses, eddy-current losses, and hot-spot temperatures in transformers. Earlier works also confirm that the presence of harmonics changes the distribution of electromagnetic forces and mechanical stresses in transformer windings. The results reviewed in this paper extend these conclusions by showing that the influence of harmonics should be considered jointly through thermal, electromagnetic, and mechanical mechanisms rather than through additional losses alone.
For induction motors, the reviewed studies confirm that harmonics, interharmonics, and voltage unbalance can lead to increased losses, torque pulsations, vibration, and bearing wear. The presence of interharmonics is especially important because even low interharmonic levels can generate vibration velocities corresponding to hazardous operating zones according to ISO 20816-1. This supports the conclusion that PQ disturbances may affect not only the electrical efficiency of motors but also their mechanical integrity and long-term reliability.
For cable and overhead power lines, the results show that non-sinusoidal conditions affect not only active power losses but also conductor temperature, insulation aging, electromagnetic field levels, resonance behavior, and mechanical sag. This broadens the traditional interpretation of harmonic effects on lines and supports the need to include PQ analysis in cable thermal rating, insulation lifetime assessment, and risk-based maintenance planning.
8.2. Implications for Reliability Assessment and Maintenance Planning
The analysis demonstrates that the reliability assessment of electrical equipment should account for the dynamic interaction between PQ disturbances, operating modes, and degradation mechanisms. Traditional approaches based only on periodic inspection or average loading conditions may underestimate the actual degradation rate, especially in industrial power systems with nonlinear loads, fast load changes, and frequent transient events.
A key implication is that maintenance planning should move from time-based maintenance to condition-based and risk-based maintenance. This requires the integration of PQ monitoring, thermal models, vibration diagnostics, partial discharge analysis, and remaining useful life estimation. The use of health indices, Weibull-based reliability models, and RUL prediction methods can provide a more objective basis for ranking equipment by maintenance priority.
The results also show that short-term forecasting is important for preventing overloads and thermal stress. Forecasting load surges, voltage fluctuations, and temperature growth over a 24–48 h horizon can help operators redistribute load, adjust generation schedules, reduce the risk of protection operation, and prevent accelerated insulation aging.
8.3. Quantitative Interpretation of PQ Impact on System Reliability and RUL
The influence of power quality on system reliability should be interpreted not only qualitatively, but also through quantitative degradation and reliability indicators. In this review, PQ disturbances are considered as measurable stress factors that change the degradation rate of electrical equipment and, consequently, affect the remaining useful life, failure probability, and system-level reliability indices. For transformers, the most direct quantitative chain is formed as follows: harmonic distortion, voltage unbalance, and load surges increase RMS current and additional losses; these losses increase the hot-spot temperature; the hot-spot temperature increases the aging acceleration factor and equivalent aging factor; accumulated thermal aging increases the loss of life and reduces RUL. In probabilistic terms, this degradation can be represented by a reduction in the Weibull scale parameter η or by an increase in the failure rate λ(t).
For induction motors, the quantitative influence of PQ disturbances is expressed through additional copper and iron losses, torque pulsations, vibration velocity, thermal cycles, and derating. Harmonics and voltage unbalance increase negative-sequence currents and thermal losses, while voltage sags followed by re-acceleration may cause recovery currents several times higher than the rated current. These effects do not always lead to immediate failure, but they increase cumulative thermal and mechanical damage, reduce the permissible operating margin, and accelerate the transition from normal operation to the wear-out region of the reliability curve.
For cable lines, PQ impact should be quantified through the increase in RMS current, frequency-dependent conductor resistance, additional active losses, conductor temperature rise, insulation resistance degradation, and partial discharge activity. In cable-dominated networks, the effect is additionally influenced by distributed capacitance and resonance conditions, which may amplify selected harmonic components. As a result, the same harmonic current source may produce different thermal and reliability consequences depending on network topology and cable penetration.
A fair comparison of different architectures and applications reported in the literature requires converting heterogeneous results into comparable reliability-oriented indicators. Direct comparison of
reduction in one study, voltage sag mitigation in another study, and machine learning prediction accuracy in a third study is methodologically incorrect because these indicators describe different stages of the degradation chain. A more consistent approach is to compare the relative change in loss of life, remaining useful life, aging acceleration factor, failure probability, or system reliability indices. This is consistent with modern RUL assessment logic, where model-based, data-driven, and hybrid methods are distinguished depending on the availability of physical degradation models, historical data, and monitoring features [
102]. For transformer-oriented studies, the most suitable comparison indicators are Δ
, Δ
, Δ
, Δ
, and Δ
. For motor-oriented studies, the comparison should be based on additional losses, derating factor, vibration severity, torque pulsation amplitude, and expected thermal damage. For cable-oriented studies, the comparison should be based on conductor temperature rise, insulation resistance degradation, partial discharge intensity, and expected lifetime reduction.
At the system level, PQ disturbances should be separated into two groups. Quasi-stationary disturbances, such as harmonics, voltage unbalance, and long-term voltage deviation, mainly affect reliability through cumulative degradation and reduction. Event-based disturbances, such as voltage sags, interruptions, and transient overvoltages, affect reliability through event frequency, event duration, affected load, and conditional probability of equipment malfunction or failure. This distinction makes it possible to connect equipment-level degradation indicators with system-level indices such as and . Thus, a PQ-aware reliability assessment framework should combine equipment-level aging models with network-level reliability indices.
Therefore, the quantitative impact of PQ on reliability can be represented as a multi-level chain: PQ disturbance severity → electrical and thermal stress → aging acceleration or mechanical degradation → reduction in or Weibull scale parameter → increase in failure probability → deterioration of system reliability indices. Such an interpretation provides a common basis for comparing radial networks, cable-dominated networks, converter-dominated systems, industrial microgrids, and hybrid systems with energy storage. It also avoids the direct comparison of incomparable indicators and supports a more objective evaluation of PQ mitigation strategies from the standpoint of reliability and service-life extension.
8.4. Role of IoT, Machine Learning, and Multi-Agent Systems
Modern monitoring technologies provide the technical basis for implementing predictive maintenance strategies. IoT systems make it possible to continuously collect data on temperature, vibration, dissolved gases, harmonic composition, partial discharges, and load parameters. However, the reliability of such systems depends on sensor accuracy, data quality, cybersecurity, and the ability to process large volumes of heterogeneous data.
Machine learning methods can improve fault classification, anomaly detection, and RUL prediction. LSTM, CNN, RF, SVM, ANN, and Bayesian deep learning models are especially promising for time-series analysis, PRPD pattern recognition, voltage sag detection, and failure rate prediction. At the same time, explainable artificial intelligence is needed to justify decisions in industrial power systems, where maintenance and operating decisions must be technically interpretable.
Multi-agent systems are also promising for modeling industrial power systems because they can represent generation units, transformers, drives, cable lines, switching devices, loads, and environmental factors as interacting agents. This approach is especially useful for transient and emergency modes, where a change in one subsystem can cause cascading effects in other parts of the electrotechnical complex.
8.5. Practical Implications for Industrial Enterprises
For industrial enterprises, the main practical conclusion is that PQ control should be treated as part of asset management rather than as a separate power engineering task. Poor power quality can accelerate equipment aging, reduce service life, increase maintenance costs, and increase the probability of emergency shutdowns.
The following practical measures can be highlighted:
Continuous monitoring of PQ, temperature, vibration, and insulation condition;
Implementation of harmonic filtering and compensation devices;
Control of load peaks and staged starting of large motors;
Integration of monitoring systems with ERP and maintenance management systems;
Use of short-term forecasting for load and temperature control;
Application of health indices and RUL models for maintenance prioritization.
These measures can improve energy efficiency, reduce unplanned downtime, extend equipment service life, and support the transition to predictive and risk-based maintenance.
8.6. Limitations of the Review
Despite the broad range of studies analyzed, several limitations should be noted. First, many existing studies focus on individual disturbances, such as harmonics, voltage sags, or load fluctuations, whereas real industrial systems are usually exposed to a combination of several PQ disturbances. Second, the quantitative relationship between PQ indices and reliability model parameters, such as the Weibull scale parameter η and shape parameter β, is still insufficiently formalized. Third, available datasets often contain limited information on rare failures and poor technical condition classes, which complicates the training of machine learning models.
Overall, the reviewed studies confirm that PQ disturbances and dynamic operating conditions have a significant and multifactorial influence on the technical condition of electrical equipment. The degradation of transformers, induction motors, cable lines, and overhead power lines is formed through the combined action of electrical, thermal, mechanical, and environmental factors. The integration of PQ analysis into condition assessment, RUL prediction, and risk-based maintenance strategies is required to improve the reliability and efficiency of industrial power systems.
In addition, the relative sensitivity of different equipment classes to individual PQ indices remains insufficiently quantified and requires dedicated multiparametric analysis based on synchronized field data.
9. Recommended Directions for Future Research
Taking into account the identified limitations and the results of the review, future research should be focused on the development of an integrated methodology linking power quality (PQ) indices, operating conditions, degradation mechanisms, and reliability indicators of electrical equipment. Such a methodology is especially relevant for industrial power supply systems operating under variable load profiles, nonlinear loads, harsh environmental conditions, and limited redundancy. In this context, the most promising research directions are presented below.
A separate direction of future research should be the quantitative assessment of the sensitivity of different classes of electrical equipment to individual power quality indices. At the current stage, there is no sufficient basis for identifying a single universally dominant indicator for all types of equipment, since for transformers the key channel of accelerated aging is the increase in hot-spot temperature under the influence of harmonics and overloading, for induction motors it is the combined effect of voltage unbalance, voltage sags, and repeated thermal cycles, and for cables it is the increase in losses and conductor temperature under non-sinusoidal current conditions. Therefore, future studies should focus on the development of a multiparametric sensitivity model in which the contributions of THD, voltage sag depth and duration, voltage unbalance factor, loading, ambient temperature, and humidity will be assessed separately for each class of electrical equipment on the basis of synchronized field data.
9.1. Development of a PQ-Based Reliability Assessment Methodology
A key direction for future research is the development of a numerical methodology for assessing reliability indicators of power supply systems while accounting for operating modes and PQ indices. This methodology should make it possible to compare alternative configurations of power supply systems not only by installed capacity and redundancy but also by their expected influence on the degradation rate and failure probability of electrical equipment.
This approach would make it possible to move from a qualitative statement that poor power quality reduces equipment reliability to a quantitative assessment of how specific PQ disturbances modify the probability of failure and the rate of service life consumption.
9.2. Classification of PQ Disturbances by Degradation Mechanism
Further research should include a structured classification of PQ disturbances according to their physical impact on equipment. It is reasonable to divide PQ disturbances into two groups.
The first group includes quasi-stationary disturbances, such as harmonic distortion, voltage unbalance, and voltage or frequency deviations. These disturbances should be considered through additional losses, heating, insulation degradation, and accelerated aging.
The second group includes event-based disturbances, such as voltage sags, interruptions, overvoltages, and impulse overvoltages. These disturbances should be described through an “event dose”, including frequency, depth, duration, severity, and the conditional probability of failure during or after the event.
Such a classification will make it possible to combine continuous degradation models and event-based risk models within a unified reliability assessment framework.
9.3. Integration of Physical Aging Models and Statistical Reliability Models
A promising direction is the development of hybrid reliability models that combine physics-based aging models and statistical failure models. Physics-based models provide interpretability and can be used even when failure statistics are limited. Statistical models, including proportional hazard models and Weibull models with covariates, can describe the direct relationship between PQ indices and failure probability when sufficient operational data are available.
This direction is important because industrial datasets often contain limited failure statistics, while physical models alone may not fully account for rare event-based mechanisms. A hybrid approach can provide a balance between interpretability, accuracy, and practical applicability.
9.4. Experimental and Field Validation
An important direction for future research is experimental and field validation of the proposed methodology. Laboratory tests should be designed for transformers, induction motors, and cable samples under controlled harmonic distortion, voltage sags, overvoltages, and load surges. These tests should be used to calibrate thermal models, aging models, and PQ-to-risk conversion functions.
Field validation should include PQ monitoring, load recording, thermal measurements, diagnostic data, and failure or maintenance logs from real industrial facilities. For oil and gas enterprises, this is especially important because their power supply systems often operate in remote areas, under severe climatic conditions, and with high requirements for uninterrupted operation.
The validation stage should make it possible to determine the limits of applicability of the methodology, quantify prediction uncertainty, and compare calculated reliability indicators with actual operational data.
9.5. Digitalization, Artificial Intelligence, and Decision Support
Further research should examine the influence of digitalization, artificial intelligence, and machine learning on the optimization of industrial power system management. AI-based methods should be used not only for forecasting technical condition, but also for explaining the contribution of individual factors, such as harmonics, temperature, vibration, voltage sags, and load dynamics, to the final risk estimate. Future decision support systems should combine: IoT monitoring; PQ monitoring; diagnostic data; ML and XAI models; multi-agent models; reliability models; maintenance databases; enterprise resource planning systems. Such systems can provide an integrated digital environment for managing equipment condition, reliability, and maintenance decisions.
Thus, the key future research direction is the development and validation of an integrated methodology for assessing the reliability of industrial power supply systems while accounting for PQ indices and operating modes. This methodology should connect physical degradation mechanisms, statistical reliability models, digital monitoring, machine learning, and economic decision-making.
The expected result is a practical tool for selecting and justifying power supply development options for industrial enterprises, especially oil and gas facilities operating in remote and severe climatic conditions. Such an approach can improve the objectivity of reliability assessment, reduce the risk of emergency shutdowns, optimize maintenance planning, and increase the service life of electrical equipment.
9.6. Research Bottlenecks and Data Gaps
Despite recent progress, several bottlenecks continue to limit the transition from qualitative correlation analysis to quantitatively reliable predictive maintenance models. These include the lack of synchronized field datasets combining PQ waveforms, loading, temperature, diagnostics, and failure history, the scarcity of long-term run-to-failure observations, class imbalance in fault datasets, weak transferability of models between sites and asset populations, and the absence of widely accepted benchmark datasets and unified evaluation metrics for AI-based comparison. In addition, controlled experiments addressing coupled PQ disturbances are still limited, which complicates the calibration of multiparametric lifetime models.
A feasible technical route for future work should include five main stages. First, a pilot set of critical assets should be selected. Second, synchronized field data should be acquired, combining PQ measurements, thermal variables, diagnostic signals, and maintenance records. Third, laboratory tests and heat-run experiments should be used to calibrate thermal and aging models. Fourth, hybrid physics-informed and data-driven models should be identified and supplemented with uncertainty assessment. Fifth, the methodology should be validated on a pilot site and then scaled to the full asset population together with maintenance decision rules and KPI monitoring.
The next practical milestone in this field is the creation of synchronized benchmark datasets and pilot-validated hybrid reliability models for each equipment class, enabling a justified transition from descriptive review findings to deployable decision-support systems.
10. Conclusions
The review showed that power quality indices and operating conditions at industrial enterprises have a complex and interrelated effect on the technical condition of electrical equipment. Harmonic distortion leads to an increase in RMS currents, higher active and eddy-current losses, increased hot-spot temperatures, and accelerated insulation aging. Voltage sags and transient operating conditions cause peak currents and electromagnetic torque pulsations, creating additional thermomechanical loading on induction motors and transformers. Load surges generate repeated thermal cycles that contribute to cumulative degradation of insulating materials.
The analysis demonstrated that the relationship between power quality parameters and equipment reliability can be formalized using thermal aging models and probabilistic distributions such as the Weibull distribution. This makes it possible to quantitatively assess the influence of harmonic components and dynamic overloads on the reduction in the characteristic service life parameter.
Modern monitoring and predictive diagnostic technologies, including IoT systems, multi-agent models, and machine learning algorithms, provide the basis for the transition to a risk-based operation strategy. The integration of data on load conditions, temperature, vibration, and harmonic composition into a unified analytical platform can significantly improve the accuracy of remaining useful life assessment and reduce the probability of sudden failures.
Thus, improving the technical condition of electrical equipment requires an integrated approach that combines technical, organizational, and analytical measures, as well as the inclusion of power quality indices in equipment condition assessment models.
From a practical perspective, the transition from conventional maintenance to predictive maintenance should be implemented in a staged manner, including asset criticality ranking, deployment of monitoring devices, creation of a unified data platform, introduction of hybrid analytics, linkage of diagnostics to maintenance actions, and pilot-based scaling to the entire facility.