Article

Economic Feasibility Evaluation of CO2 Huff-and-Puff for Enhanced Recovery in Low-Productivity Coalbed Methane Wells


1
State Key Laboratory of Geomechanics and Geotechnical Engineering Safety, Institute of Rock and Soil Mechanics, Chinese Academy of Sciences, Wuhan 430071, China
2
University of Chinese Academy of Sciences, Beijing 100049, China
*
Author to whom correspondence should be addressed.
Energies 2026, 19(11), 2658; https://doi.org/10.3390/en19112658 (registering DOI)
Submission received: 2 May 2026 / Revised: 25 May 2026 / Accepted: 28 May 2026 / Published: 31 May 2026

Abstract

CO2 enhanced coalbed methane recovery (CO2-ECBM) using huff-and-puff technology has attracted increasing attention as a promising approach to enhance the productivity of low-productivity coalbed methane (CBM) wells while simultaneously enabling CO2 storage. However, the economic feasibility of this method and the optimal soaking time remains unclear. In this study, an economic evaluation model for CO2 huff-and-puff CBM projects was developed based on the discounted cash flow method, incorporating key factors such as CBM price, government subsidies, carbon trading price, CH4 separation cost, and CO2 purchase and injection costs. Three representative scenarios were designed to evaluate the impacts of policy support and market conditions. The effects of CO2 injection volume and soaking time on net cash flow (NCF), net present value (NPV), and dynamic payback period (DPP) were systematically investigated. The results indicate that CO2 huff-and-puff is economically viable for enhancing CBM recovery. Increasing CO2 injection volume markedly improves CH4 production and project revenue, but also leads to higher initial investment and a longer payback period. The economic performance exhibits a non-monotonic dependence on soaking time, with an optimal range that maximizes NPV. Specifically, the optimal soaking time ranges from 30 to 60 days for injection volumes up to 2000 t, and from 60 to 90 days for higher injection volumes. External economic factors exert a strong influence on project performance: higher carbon trading prices and lower CO2 purchase costs markedly improve profitability, while government subsidies effectively increase net returns and shorten the payback period. In the absence of subsidies, higher injection volumes are required to maintain economic viability. Overall, this study provides a comprehensive economic evaluation framework for CO2 huff-and-puff CBM projects, identifies key operational and economic parameters for optimizing project performance, and offers theoretical support for field-scale applications. Nevertheless, the economic evaluation is based on deterministic numerical simulation results and simplified market assumptions. Long-term operational risks and geological heterogeneity are not explicitly considered, which may limit the applicability of the results under field conditions.

1. Introduction

The intensification of the greenhouse effect has led to a continuous rise in global temperatures, posing significant challenges to ecological stability and sustainable development [1,2]. In 2020, China proposed the “dual-carbon” goals, which aim to promote carbon emission reduction, establish a clean and low-carbon energy system, and actively address global climate change [3,4]. As a high-quality clean energy resource, the efficient development and utilization of coalbed methane (CBM) can not only optimize the national energy structure and ensure energy supply security [5], but also contribute to reducing greenhouse gas emissions and facilitating the achievement of carbon peak and carbon neutrality targets [6]. However, the current CBM industry faces significant challenges. On the one hand, China possesses abundant CBM resources with substantial potential for large-scale development [7]. On the other hand, a considerable proportion of CBM wells are characterized by low-productivity, and the widespread issue of low single-well production severely constrains the efficient exploitation of CBM resources [8]. CO2 enhanced CBM recovery (CO2-ECBM) is an effective technology that improves CBM production while enabling CO2 storage through injection into coal seams [9,10,11]. This approach not only enhances CBM recovery and mitigates the low productivity of wells [12], but also contributes to reducing greenhouse gas emissions via geological storage of CO2, thereby achieving a synergistic effect between energy production and environmental protection [13]. Therefore, CO2-ECBM provides important technical support for the sustainable development of the CBM industry and the realization of the “dual-carbon” goals.
As a specific implementation of CO2-ECBM, the CO2 huff-and-puff technique enhances CBM recovery by directly injecting CO2 into low-productivity CBM wells without the need for additional injection wells. Compared with conventional CO2 displacement methods, this technique features simpler operational procedures and shorter cycle times. To date, two field pilot tests of CO2 huff-and-puff have been conducted in China, where CO2 injection was used to displace adsorbed CH4 in the coal matrix. After a designated soaking period, the wells were reopened for production, and both tests demonstrated increased CBM production [14,15]. In addition, a small-scale CO2 huff-and-puff test was carried out in Canada, with a cumulative CO2 injection of 180 tons over 12 cycles. Although the initial CH4 production rate decreased after well reopening, long-term numerical simulations indicated that CO2 huff-and-puff ultimately enhanced CH4 recovery by 13.2% [16]. Bhowmik and Dutta [17] conducted laboratory-scale CO2 huff-and-puff experiments using different coal samples. In their study, the samples were first saturated with adsorbed CH4, followed by multiple injection–production cycles to simulate CO2 injection and CH4 recovery. The results showed that CO2 was preferentially adsorbed onto the coal matrix, while CH4 underwent preferential desorption during the production stage. In our previous work, a numerical model was developed to evaluate the performance of large-scale CO2 huff-and-puff in low-productivity CBM wells. The results demonstrated that this technique can enhance gas production while simultaneously enabling CO2 storage in coal seams [8]. Existing studies indicate that CO2 huff-and-puff technology has considerable potential to improve the productivity of low-productivity CBM wells. However, existing studies have mainly focused on production enhancement mechanisms, gas transport behavior, and CO2 storage performance, whereas limited attention has been paid to the economic optimization of operational parameters for field-scale deployment. Although soaking time has been widely investigated from the perspective of gas production performance, its impacts on project profitability, capital recovery efficiency, and investment risk under varying injection strategies, market conditions, and policy environments remain poorly understood. Moreover, most previous studies adopted deterministic economic assumptions and rarely considered the sensitivity of project economics to fluctuations in CBM price, operating cost, CO2 injection cost, and gas processing expenditure. Consequently, a systematic techno-economic framework integrating operational parameter optimization, discounted cash flow analysis, and economic sensitivity evaluation for low-productivity CBM wells has not yet been fully established. This limitation restricts reliable investment decision-making and the large-scale commercial deployment of CO2 huff-and-puff technology.
Numerous studies have developed economic models for CBM projects and conducted systematic evaluations of their economic feasibility. Among the available methodologies, the discounted cash flow (DCF) method has been widely adopted for the economic assessment of CBM development projects, as it effectively captures key economic indicators such as net present value (NPV), cash flow, and payback period. Dai et al. [18] applied the DCF method to establish an economic evaluation model for deep CBM, systematically analyzing the economic performance of development projects. Their sensitivity analysis identified CBM price, production rate, and project cost as the primary factors influencing project economics, thereby providing a theoretical basis for risk management in deep CBM development. Sander and Connell [19] also employed the DCF method to evaluate a CO2-ECBM project in Australia, incorporating uncertainty analysis to examine the effects of various physical parameters on project performance. Li and Zhang [20] proposed a novel economic evaluation approach based on unit technical cost theory and applied it to optimize well type selection for CBM wells, achieving improved efficiency and accuracy compared with conventional methods. Yang and Qin [21] adopted a combined quantitative and qualitative framework and developed an economic system evaluation model based on the analytic hierarchy process. A case study demonstrated that this approach can provide quantitative insights and practical guidance for CBM projects. Overall, although existing research has diversified the methodological approaches to economic modeling, the discounted cash flow method remains the dominant framework for evaluating the economics of CBM development. In addition, several studies have established economic evaluation models specifically for CO2-ECBM projects to assess their feasibility and profitability. Wong et al. [22] developed a simplified economic model for a CO2-enhanced CBM recovery project based on a pilot test in the Qinshui Basin, demonstrating preliminary economic viability with a rate of return exceeding 12%. Fang and Shen [23] constructed an economic evaluation model for CO2 and N2-enhanced CBM recovery that incorporates factors such as CO2 capture cost, carbon pricing, and initial investment. Coupled with a neural network model, they further optimized key operational parameters, including well spacing, injection pressure, and CO2 injection proportion. Robertson [24] investigated the feasibility of utilizing flue gas in a CO2-ECBM project in the Powder River Basin and found that the cost of CO2 separation from flue gas constitutes the primary economic constraint, identifying the threshold separation cost required for profitability. Hernandez et al. [25] analyzed the economics of enhanced CBM recovery using CO2–N2 mixtures and suggested that higher CBM prices or carbon credit incentives could significantly improve project returns. In summary, most existing economic evaluation studies of CO2-ECBM projects have primarily focused on continuous CO2 displacement processes, while the economic characteristics of CO2 huff-and-puff operations have received far less attention. Existing studies rarely incorporate the coupled effects of injection volume, soaking time, carbon trading incentives, market volatility, and operational cost uncertainty into a unified economic assessment framework. In particular, the sensitivity of project profitability and discounted payback period to variations in key economic parameters has not been systematically quantified. Consequently, there is still a lack of systematic economic guidance for optimizing CO2 huff-and-puff strategies in low-productivity CBM wells.
To address these gaps, this study develops an integrated techno-economic evaluation framework for CO2 huff-and-puff enhanced CBM recovery in low-productivity wells based on numerical simulation results from our previous work. Unlike previous studies that mainly emphasized production enhancement or conventional CO2 displacement economics, this work systematically couples operational parameter optimization with discounted cash flow analysis to evaluate project profitability, capital recovery efficiency, and investment risk. The model incorporates key economic factors, including CBM price, government subsidies, carbon trading price, CH4 separation cost, and CO2 purchase and injection costs. The effects of different injection strategies on project economics are comprehensively analyzed under multiple external economic scenarios. Particular emphasis is placed on the economic optimization of soaking time by jointly evaluating net present value, net cash flow, and discounted payback period under varying injection volumes. Furthermore, sensitivity analysis is conducted to quantify the impacts of fluctuations in CBM price, operating cost, CO2 injection cost, and CH4 separation cost on project economics, thereby revealing the dominant economic factors controlling project feasibility and investment risk. The results provide practical guidance for field-scale deployment and economic decision-making of CO2 huff-and-puff technology in low-productivity CBM wells.

2. Methodology

2.1. CO2 Huff-and-Puff Simulation

The economic evaluation conducted in this study was based on the CH4 production and CO2 storage results obtained from our previous numerical simulation study. A concise summary of the numerical simulation methodology is provided below.
A mathematical model was developed to simulate the CO2 huff-and-puff process based on several fundamental assumptions, including dual-porosity media, ideal gas behavior, and Darcy flow. The numerical model was established according to geological conditions representative of the southern Qinshui Basin in China. The simulated coal seam dimensions were 200 m × 200 m × 5 m, with a burial depth of 500 m and a well spacing of 200 m. Key reservoir parameters included an initial fracture permeability of 10 mD, matrix porosity of 0.05, fracture porosity of 0.02, and reservoir pressure of 2.2 MPa. All geological parameters were determined based on field measurements and laboratory experimental data. The CO2 huff-and-puff simulation process consisted of four stages: conventional CBM production, CO2 injection, CO2 soaking, and subsequent well reopening for production. CO2 was injected at a constant rate of 50 t/d under different total injection volumes ranging from 1000 to 3000 t, followed by soaking periods varying from 5 to 120 days.
The CH4 production data used in the economic evaluation were directly obtained from the numerical simulation outputs, including cumulative CH4 production enhancement under different injection and soaking schemes. The CO2 storage amount was estimated from the numerical simulation results based on the mass balance between injected CO2, produced CO2, and retained CO2 within the coal seam during the huff-and-puff process. The retained CO2 was considered as the effective geological storage amount for subsequent economic assessment.

2.2. Economic Evaluation Model

2.2.1. Economic Evaluation Indicators

With the progressive commissioning of commercial CBM projects, the economic evaluation of such developments has continued to advance. Commonly applied methods include DCF, data envelopment analysis, and integrated approaches that combine quantitative and qualitative techniques [26]. Among these, the DCF method remains the primary tool for CBM project evaluation and is widely recognized as a mature and robust approach for economic assessment [27,28]. As a dynamic evaluation approach, it enables investors to estimate the potential return on investment. In this study, the economic performance of the CO2 huff-and-puff project is assessed using two key indicators derived from the DCF framework: NPV and payback period.
As a dynamic evaluation indicator, NPV represents the cumulative sum of the present values obtained by discounting the NCF of each cash cycle to the initial construction phase, using either the industry benchmark rate of return or a predetermined discount rate. The calculation formula is given in [29,30]:
NPV = t = 0 T NCF t 1 + i 0 t = t = 0 T ( CI CO ) t 1 + i 0 t
where NCFt is the net cash flow of the CBM development project in the t-th time period; CI is cash inflow; CO is cash outflow; i0 is the discount rate; t is the time index; and T is the project evaluation period.
The payback period is defined as the minimum time required for the cumulative net revenues generated by a project to recover its total initial investment cost [31]. It is commonly classified into the simple payback period (SPP) and the discounted payback period (DPP). The DPP is calculated based on the NCF of each period, whereas the SPP directly uses the undiscounted future NCF [32]. In this study, the DPP is adopted, and its calculation formula is given as follows [33,34]:
NPV = t = 0 DPP ( CI CO ) t 1 + i 0 t = 0

2.2.2. Economic Evaluation Parameters

Based on the formulations of NPV and payback period derived from the discounted cash flow method, the establishment of an economic evaluation model for CO2 huff-and-puff stimulation projects depends primarily on quantifying the cash inflows and outflows in each time period. For CO2 huff-and-puff enhanced CBM recovery projects, cash inflows mainly include carbon trading revenue associated with CO2 storage, revenue from CBM production, and government subsidies. Cash outflows mainly comprise operating costs, CO2 procurement costs, CO2 injection costs, CH4 separation costs, and other related expenditures. The values of the cost and revenue parameters used in the economic model for CO2 huff-and-puff enhanced CBM recovery are presented in Table 1, followed by a detailed description of each parameter.
  • CBM price. The price of CBM is influenced by regional factors, market conditions, and relevant policies. According to a document issued by the Ministry of Finance (MOF) in 2007, the ex-factory price of CBM is determined through negotiations between suppliers and buyers under market oriented principles. In this model, the CBM price is assumed to be 0.21 USD/m3 at the ex-factory level [35]. During CBM production and sales, a certain degree of gas loss is unavoidable, and not all produced CBM can be converted into marketable gas. Based on typical CBM production practices and considering gas losses during CH4 and CO2 separation, the commercial gas ratio is assumed to be 95% in this study [36]. The CBM sales revenue, denoted as Sm, can be calculated as follows:
S m = Q m × J m × L m
where Qm is the CBM production volume; Jm is the CBM price; and Lm is the commercial gas ratio of CBM.
2.
Government subsidy income. To promote enterprise participation in CBM development and utilization, China has continuously refined its subsidy policy framework. In 2016, the MOF issued a policy that increased the fixed financial subsidy for CBM production from 0.028 USD/m3 to 0.042 USD/m3 [37]. In 2025, the MOF announced the removal of the fixed subsidy scheme of 0.042 USD/m3 and introduced a tiered incentive mechanism based on the principle of higher production receiving greater subsidies. In this study, a subsidy level of 0.042 USD/m3 is adopted as a reference value to evaluate the impact of government support on CO2 huff-and-puff stimulation projects. The government subsidy income for CBM projects, denoted as Sb, can be calculated using the following formula:
S b = Q m × B m × L m
where Bm is the government subsidy standard for CBM.
3.
Carbon trading price. The carbon trading price is defined as the transaction price per tonne of CO2 emission reduction in the carbon market and represents an important source of revenue for CBM projects. This price is influenced by multiple factors, including market supply and demand, macroeconomic conditions, adjustments in the national energy structure, and government policies aimed at achieving the “dual carbon” targets. In 2025, the carbon trading price ranged from 7.17 to 13.59 USD/t [38]. As the timelines for carbon peaking and carbon neutrality approach, and with continued policy support for improving carbon market mechanisms and quota management, carbon prices are expected to show significant upward potential. To examine the impact of carbon trading price on the economic performance of CBM projects, this study adopts a price range of 7.14 to 18.21 USD/t in the model [23]. Accordingly, the carbon trading revenue, denoted as Sₜ, can be calculated using the following equation:
S t = F t × J t
where Ft stands for the CO2 storage volume, and Jt represents the carbon trading price.
4.
Operating costs. The operating costs of CBM projects mainly include expenditures for equipment maintenance, field monitoring, utility consumption such as water and electricity, and routine operation and maintenance. These costs are incurred continuously throughout the production phase of the project. Based on benchmark parameters reported by China United Coalbed Methane Co., Ltd. (Beijing, China), the operating cost of the CO2-ECBM project in this study is assumed to be 5742.30 USD/a [39].
5.
CO2 purchase cost. The CO2 purchase cost is typically the dominant cost component in CBM projects involving CO2 injection [43]. A review of CO2 sourcing from different emission streams indicates a price range of 28 to 111 USD/t [40]. With ongoing improvements in gas separation technologies, this cost is expected to decrease further in the future. In the present model, the CO2 purchase cost is assumed to range from 19.61 to 46.22 USD/t [23].
6.
CO2 injection cost. During the CO2 injection phase, existing surface facilities at low-productivity wells can be retrofitted to convert production wells into injection wells, thereby enabling CO2 injection into coal seams. The injection cost, including both capital and operating expenditures, is estimated to range from 3.50 to 4.20 USD/t for CO2-ECBM projects. With continued technological advancement and large-scale deployment, this cost is projected to decrease to approximately 1.40 USD/t by 2060 [42]. Taking the CO2-ECBM project in the Panzhuang Block, Shanxi Province, as an example, the project operates 492 injection wells with an annual injection volume of about 2 million tonnes, corresponding to an average injection cost of approximately 2.76 USD/t [41]. Accordingly, the CO2 injection cost in the present model is set at 2.80 USD/t.
7.
CH4 separation cost. Following the soaking period in the CO2 huff-and-puff process, production is resumed. Due to the use of a shared wellbore for both injection and production, the produced gas consists of a CO2–CH4 mixture, necessitating CH4 separation. The main separation technologies for CO2–CH4 mixtures include chemical absorption, adsorption, and emerging membrane-based methods [44]. The cost of CH4 separation is approximately 0.018 USD/m3 [23].
8.
Discount rate. A discount rate of 10% was adopted in this study based on the benchmark rate commonly used in CBM-related investment projects in China, and is consistent with values recommended by the National Development and Reform Commission (NDRC). This value reflects the time value of money and investment risk in CO2 huff-and-puff projects.

2.3. Economic Evaluation Scenario Design

For CO2-ECBM projects, economic performance depends not only on the extent of CH4 production enhancement but also on the combined effects of various external economic factors. Among these, the carbon trading price directly determines the revenue derived from carbon emission reductions, while the CO2 purchase cost represents a major expenditure that substantially influences overall project economics. In addition, government subsidies for CBM extraction can partially alleviate the financial burden on enterprises. Therefore, based on the ranges of carbon trading prices and CO2 purchase costs defined in the previous section, this study establishes three representative scenarios to further evaluate variations in project economics under different external conditions, as follows:
  • Baseline scenario (Scenario 1): The carbon trading price is set at its average value of 12.68 USD/t, the CO2 purchase cost is assumed to be its median value of 32.91 USD/t, and a government subsidy for CBM extraction of 0.042 USD/m3 is included. This scenario represents the baseline under current policy and market conditions, reflecting project profitability in a relatively realistic economic environment.
  • Policy absence scenario (Scenario 2): The carbon trading price and CO2 purchase cost are kept the same as in Scenario 1, while the government subsidy for CBM extraction is excluded. This scenario is designed to evaluate changes in project economics in the absence of policy support.
  • Optimal external conditions scenario (Scenario 3): The carbon trading price is set at its maximum value of 18.21 USD/t, the CO2 purchase cost is assumed to be its minimum value of 19.61 USD/t, and a government subsidy for CBM extraction of 0.042 USD/m3 is included. This scenario represents a favorable future context characterized by higher carbon prices, lower CO2 purchase costs, and continued policy support, and is used to assess the economic potential of the project under optimal external conditions.
By comparing the economic performance of different CO2 injection schemes across these three scenarios, the combined effects of policy, market conditions, and technical costs on the economic benefits of CO2 huff-and-puff for enhancing CH4 recovery can be more comprehensively evaluated, thereby providing a basis for investment decision-making and policy formulation.

3. Results and Discussion

3.1. Characteristics of Project NCF Under Different Scenarios

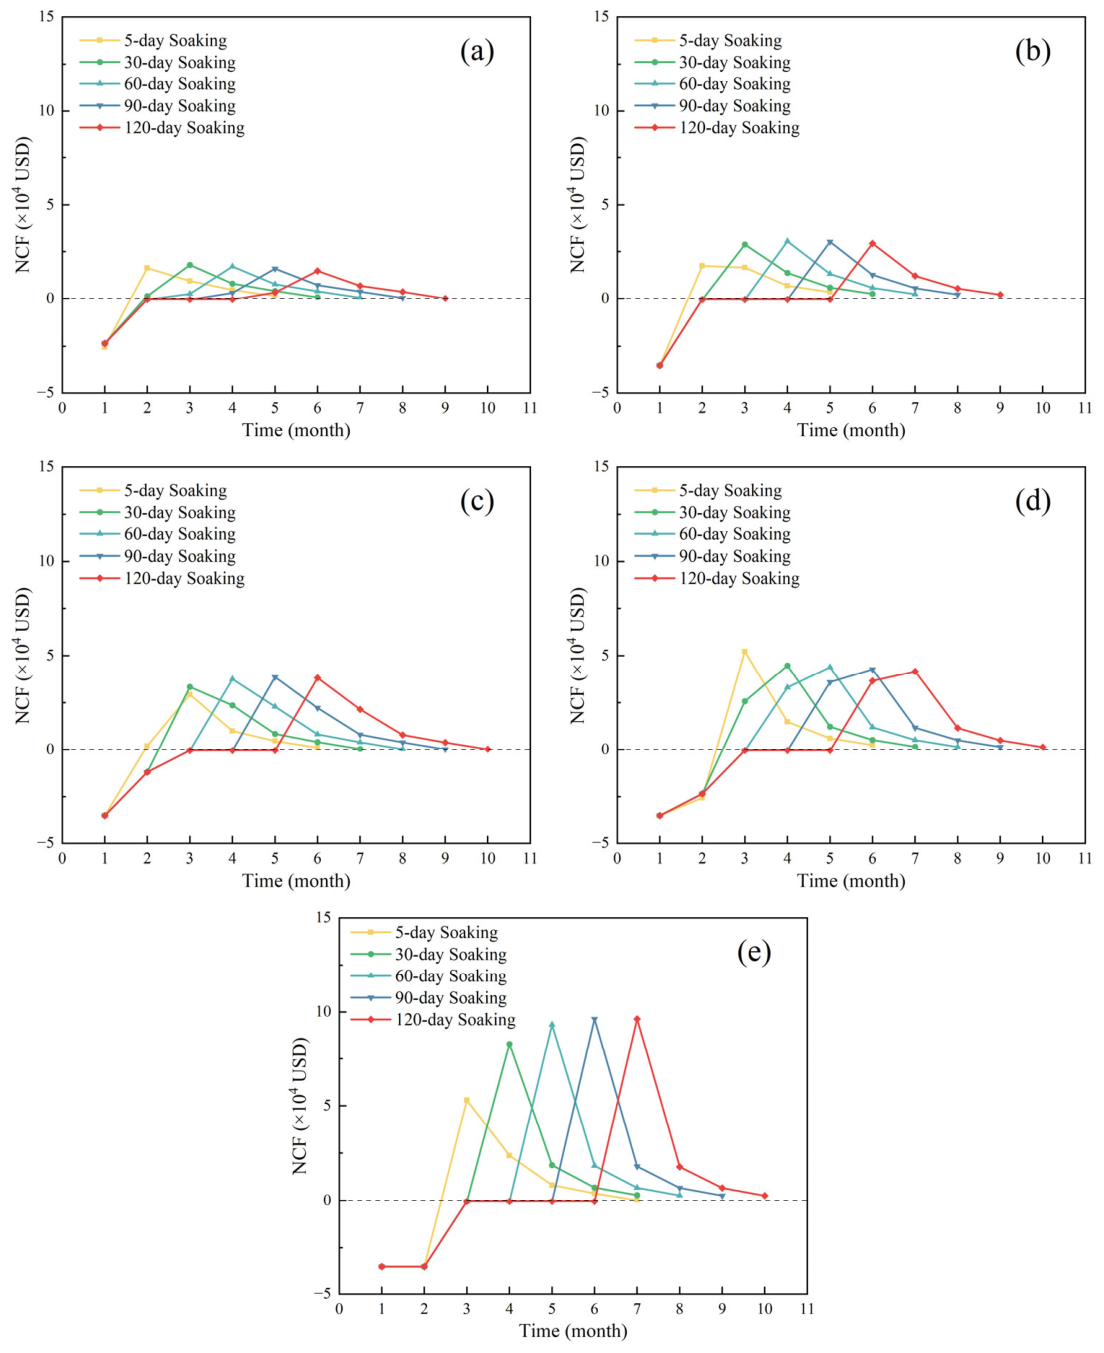
NCF represents the difference between cash inflows and outflows over a specified period and is used to quantify changes in project capital during operation. Figure 1 presents the variation in NCF of the CBM project under different CO2 injection volumes and soaking times in Scenario 1. In general, the initial stage of the project corresponds to the CO2 injection phase, during which no revenue is generated; consequently, the NCF remains negative. In addition, higher injection volumes lead to increased cash expenditures. Regardless of the CO2 injection volume or soaking time, the project reaches its maximum net expenditure in the first month. When the CO2 injection volume is 1000 t, the maximum net expenditure under different soaking conditions is 25,504 USD. As the injection volume increases to 1500 t or higher, the first month consists solely of CO2 injection without any production, and the net expenditure rises to 35,042 USD, representing an increase of 37.40%. These results indicate that larger CO2 injection volumes impose greater capital pressure during the early stage of the project.
After completion of the injection phase, the project enters the soaking stage. During this period, operating costs continue to be incurred, and the NCF remains negative; however, in the absence of further CO2 injection, expenditures are lower than those in the injection phase. Once the soaking stage concludes and production resumes, CH4 output increases, resulting in a gradual rise in cash inflows and a transition of the NCF from negative to positive. Meanwhile, the peak NCF increases progressively with higher CO2 injection volumes. Specifically, when the injection volume is 1000 t, the maximum NCF is 17,855 USD, whereas it rises to 96,246 USD at an injection volume of 3000 t, representing an increase of 439.04%. In the later stage of production, as CH4 output declines and revenues decrease, the monthly NCF correspondingly decreases.
For a given CO2 injection volume, the timing of the NCF peak is progressively delayed with increasing soaking time. At lower injection volumes, the influence of soaking time on the NCF peak is relatively limited. However, when the injection volume reaches 3000 t, the NCF peak shows a pronounced increase with extended soaking duration. Specifically, for an injection volume of 3000 t, increasing the soaking time from 5 days to 120 days raises the NCF peak from 52,941 USD to 96,246 USD, corresponding to an increase of 81.80%. These results indicate that longer soaking durations are required at higher injection volumes to achieve greater economic returns.
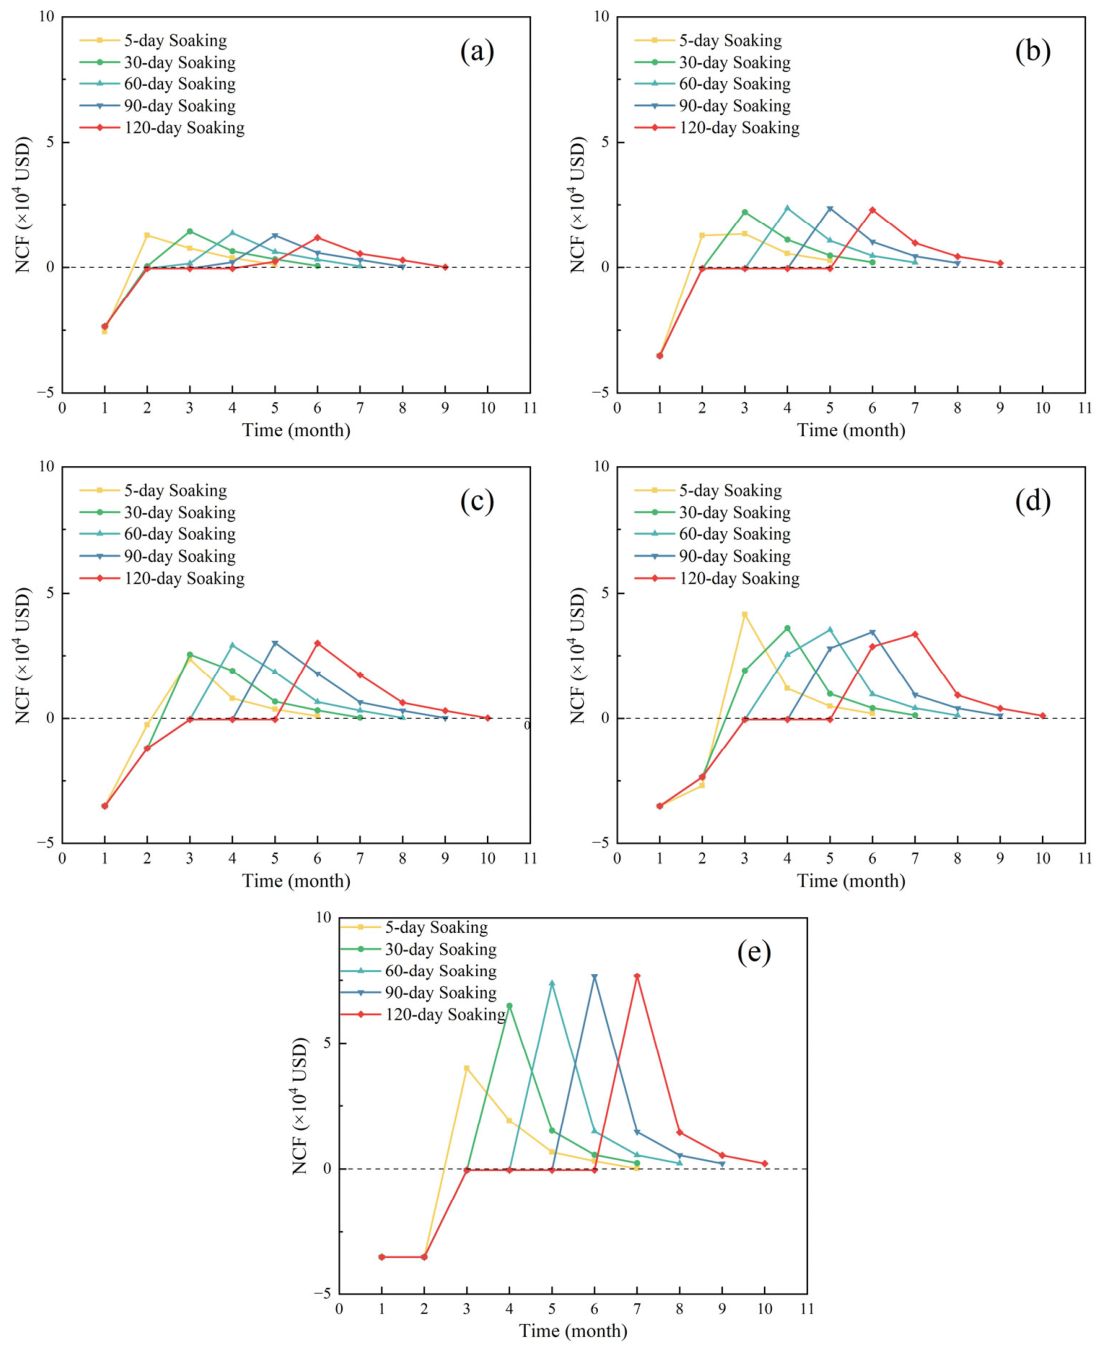
Figure 2 presents the variations in NCF under Scenario 2, where government subsidies for CBM extraction are excluded. Compared with Scenario 1, the temporal evolution of NCF remains unchanged, indicating that subsidy removal does not affect the fundamental cash flow dynamics of the project. However, the absence of subsidies leads to a systematic reduction in cash inflows during the production stage, resulting in lower NCF values across all operating conditions.
Specifically, when the CO2 injection volume is 1000 t, the maximum NCF across different soaking times reaches 14,258 USD, representing a decrease of 20.15% compared with Scenario 1. When the injection volume increases to 3000 t, the maximum NCF is 76,793 USD, which is 20.21% lower than that in Scenario 1. The reduction ratio remains nearly constant across different injection volumes. These results indicate that the removal of government subsidies directly reduces project cash inflows. Although increasing the CO2 injection volume enhances gas production and expands the scale of cash inflow, the absence of subsidies still weakens the overall economic returns, thereby reducing project profitability.
In terms of soaking time, its influence on NCF remains consistent with Scenario 1. At lower injection volumes, NCF is relatively insensitive to soaking duration after well reopening, whereas at higher injection volumes, longer soaking periods further enhance post-production NCF. This reflects the increasing importance of sufficient CO2–CH4 interaction time under large injection conditions.
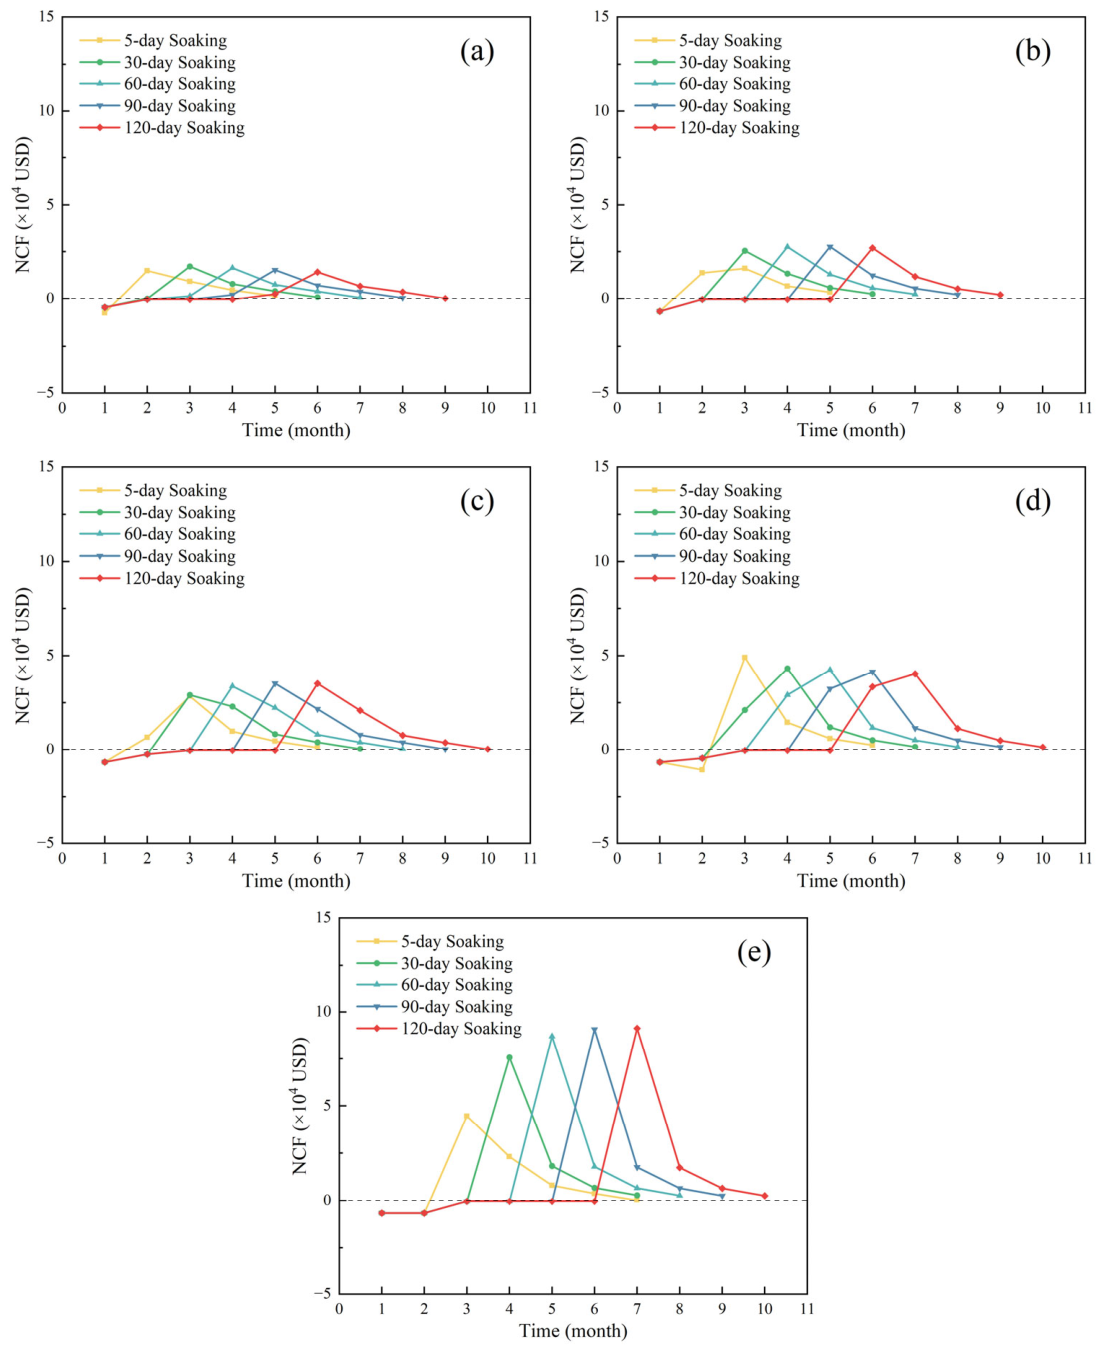
Figure 3 illustrates the variations in NCF of the CBM project under different CO2 injection volumes and soaking times for Scenario 3. When the CO2 injection volume is 1000 t, the maximum net expenditure across different soaking conditions is 7633 USD, representing a reduction of 70.07% compared with Scenario 1. As the injection volume increases to 3000 t, the maximum net expenditure decreases to 6779 USD, which is 80.65% lower than that in Scenario 1. The cash outflow during the CO2 injection stage in Scenario 3 is significantly lower than those in Scenarios 1 and 2, indicating that favorable external conditions can effectively alleviate the initial financial burden of the project.
In the later stage of CBM production, the NCF under Scenario 3 is slightly lower than that under Scenario 1. It should be noted that NCF only reflects the cash inflow and outflow within the current production period. Prior to well reopening, the injected CO2 remains entirely within the coal seam and is therefore regarded as effectively stored. Under this condition, Scenario 3 generates higher carbon trading revenue than Scenario 1 because of its higher carbon trading price.
However, after the well is reopened for CBM production, a portion of the injected CO2 is gradually produced back together with CH4, resulting in a reduction in the effective CO2 storage amount. In the economic model, this reduction in stored CO2 corresponds to a decrease in carbon storage revenue, which can be interpreted as an effective cash outflow during the production stage. Since Scenario 3 adopts a higher carbon trading price, the economic loss associated with CO2 back-production is correspondingly greater than that in Scenario 1. Consequently, although Scenario 3 benefits from higher carbon storage revenue during the injection stage, the reduction in storage-related revenue during the later production stage becomes more pronounced, leading to a slightly lower NCF compared with Scenario 1.
Quantitative analysis indicates that the difference in NCF between the two scenarios under various operating conditions remains within 20%, which is substantially smaller than the difference observed during the CO2 injection stage. These results demonstrate that the influence of carbon trading price and CO2 purchase cost on project NCF is primarily concentrated during the CO2 injection stage.

3.2. Characteristics of Project NPV Under Different Scenarios

Based on the analysis of NCF variation patterns under different scenarios presented in the previous section, this section further examines the variation characteristics of the NPV of the CBM project from the perspective of overall economic performance. NPV is a key indicator for evaluating project profitability, as it reflects the total economic return over the project lifecycle by discounting future cash flows to a common reference time.
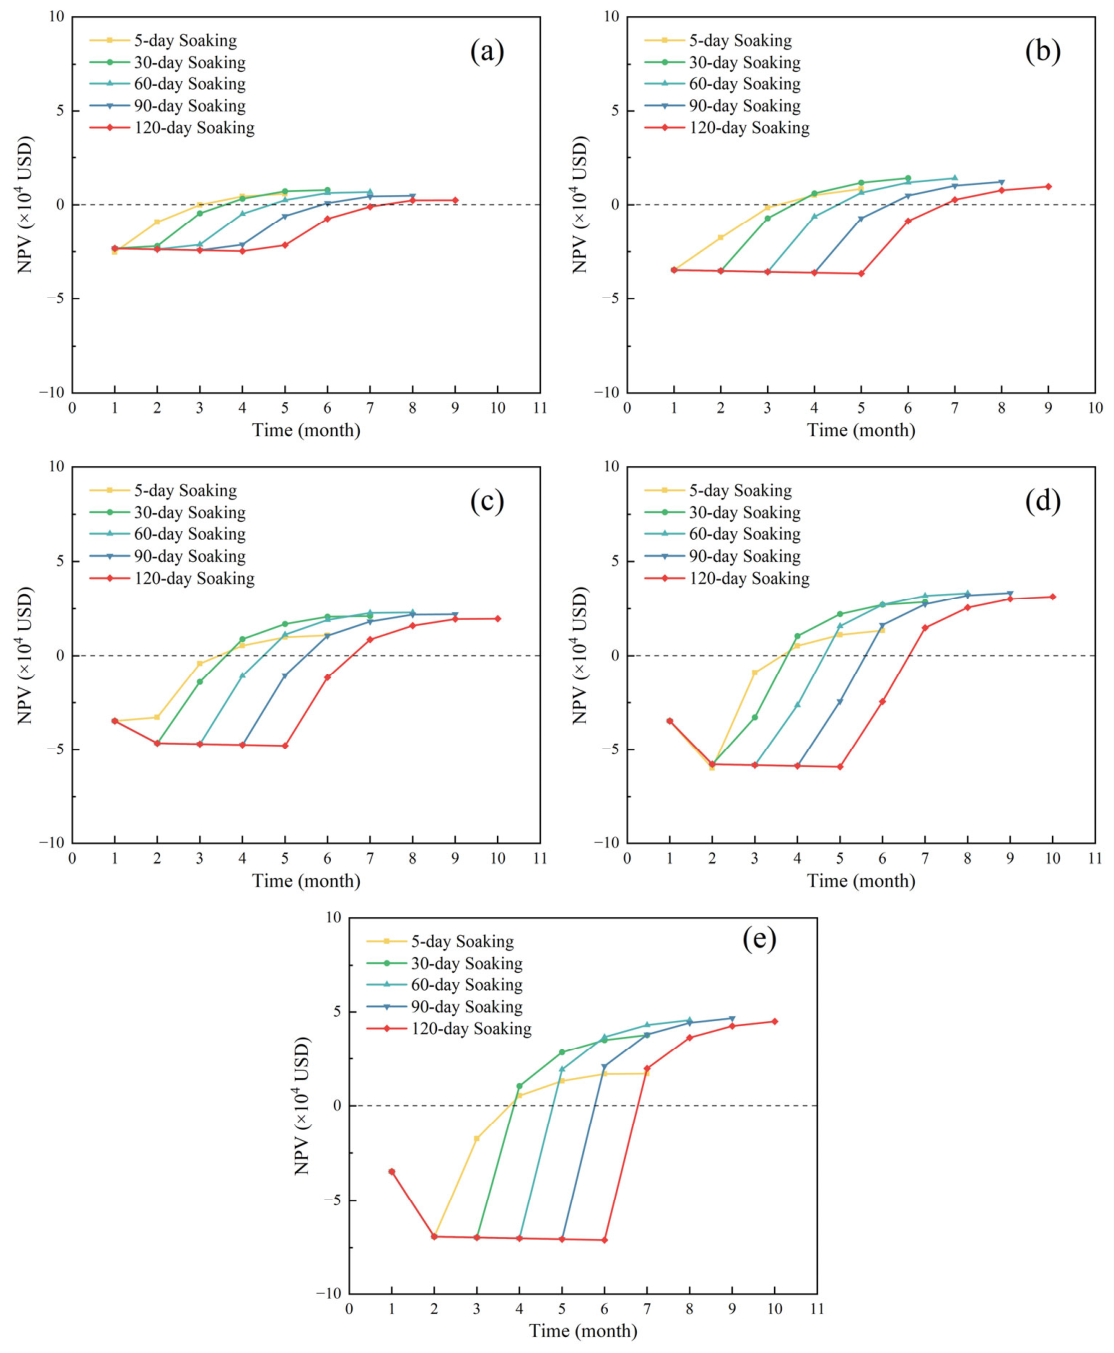
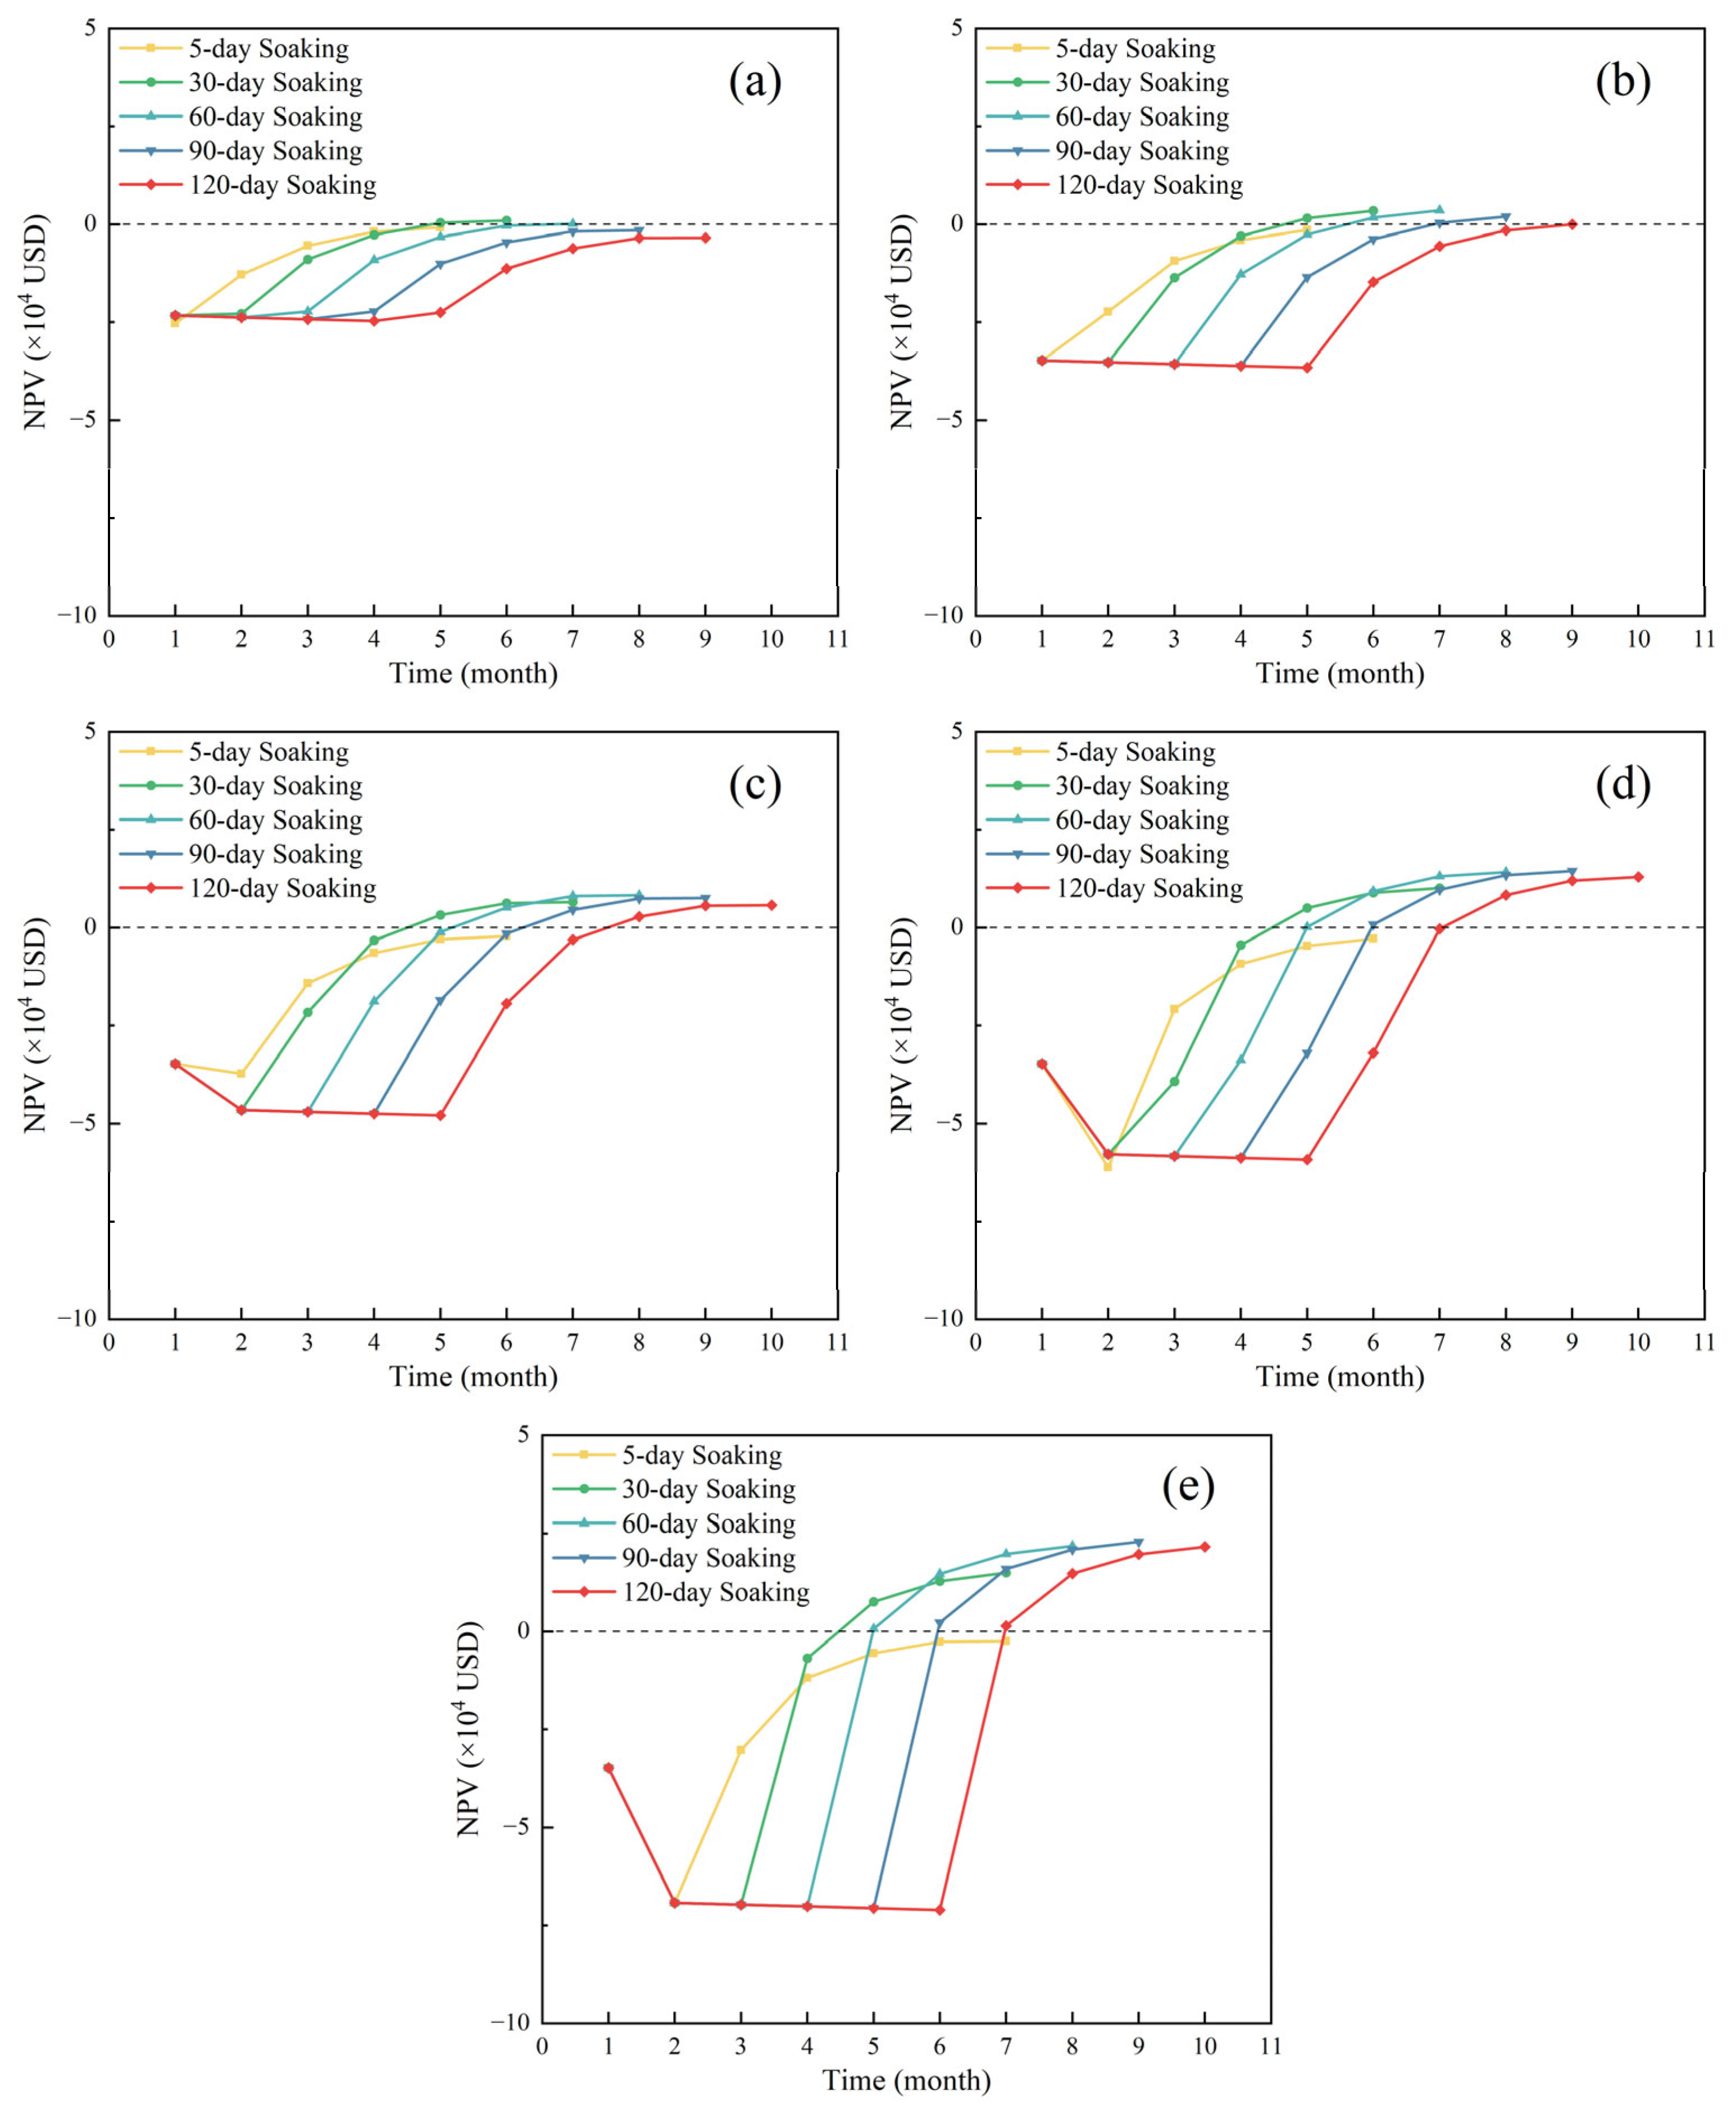
Figure 4 illustrates the variation in NPV of the CBM project under Scenario 1 for different CO2 injection volumes and soaking times. Overall, NPV remains negative during the CO2 injection and soaking stages, primarily due to the absence of significant cash inflow, while substantial expenditures are incurred, including CO2 purchase, injection costs, and routine operating expenses. The NPV reaches its minimum during the late soaking stage, indicating that the project experiences its highest financial pressure at this point. Following well reopening after the soaking stage, CBM production increases markedly, resulting in a rapid rise in NPV. The revenues generated from CBM extraction progressively offset the costs incurred during the earlier CO2 injection and soaking stages. In the late production stage, as CBM output declines, the growth rate of cash flow slows, and the NPV gradually stabilizes.
Further analysis is conducted to evaluate the effects of soaking time and CO2 injection volume on NPV during the early soaking stage. Prolonging the soaking time increases operating costs during this period, leading to a continuous decline in the minimum NPV under different soaking time schemes. Therefore, excessively long soaking durations are economically unfavorable in the early investment stage and intensify cash flow pressure. CO2 injection volume also exerts a significant influence on NPV. At an injection volume of 1000 t, the minimum NPV is −25,280 USD, whereas it decreases to −71,050 USD when the injection volume increases to 3000 t, which is 2.81 times larger in magnitude. The minimum NPV declines monotonically with increasing CO2 injection volume, as higher injection volumes require greater expenditures for CO2 purchase and injection. This result indicates that increasing the injection volume substantially elevates the upfront investment cost.
Following the soaking stage, the project enters the CH4 production phase. A higher CO2 injection volume results in a more pronounced increase in NPV during this stage, consistent with previously reported CH4 production trends under varying injection volumes [8]. Increased CO2 injection enhances CH4 recovery, thereby accelerating NPV growth. In addition, CO2 injection volume also affects the project duration. A lower CO2 injection volume results in a shorter project cycle. When the CO2 injection volume is 1000 t, the project duration ranges from 5 to 9 months; when the CO2 injection volume increases to 3000 t, the project duration extends to 7 to 10 months. Therefore, although a higher CO2 injection volume yields greater economic returns, it also leads to a noticeable increase in the overall project duration.
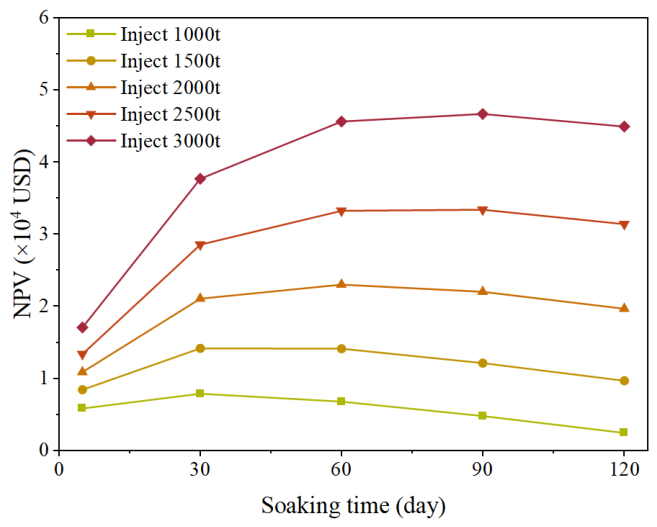
Figure 5 presents the variation in the maximum NPV of the CBM project under different CO2 injection volumes and soaking times for Scenario 1. The maximum NPV initially increases and then decreases with increasing soaking time. When the CO2 injection volume does not exceed 2000 t, the maximum NPV is attained at a soaking time of 30 to 60 days. Under relatively low injection volumes, injected CO2 can approach adsorption equilibrium within a shorter soaking period. The majority of CO2–CH4 competitive adsorption and CH4 desorption occurs during the injection stage and early soaking stage, after which the displacement rate gradually stabilizes. Therefore, extending the soaking time beyond 60 days provides only limited additional CH4 desorption and recovery enhancement, while the prolonged soaking period increases operating costs and delays gas production, thereby reducing the project NPV.
For CO2 injection volumes greater than 2000 t, the optimal soaking time extends to 60 to 90 days, and a longer soaking duration is required to achieve the maximum NPV. Higher injection volumes result in a larger amount of free CO2 accumulating within the fracture system and near-wellbore region, requiring additional time for CO2 diffusion from fractures into the coal matrix. The elevated pore pressure generated by high-volume injection enhances the concentration gradient between fractures and matrix pores, promoting deeper CO2 penetration and more extensive competitive adsorption with CH4. During this process, CO2 continuously replaces adsorbed CH4 due to its stronger adsorption affinity for coal, while the reduction in CH4 partial pressure further promotes CH4 desorption from the coal matrix. Meanwhile, the permeability evolution during soaking also influences the optimal soaking duration. In the early soaking stage, continued CH4 desorption and matrix shrinkage can temporarily improve permeability and facilitate gas migration. However, as CO2 adsorption gradually dominates, coal matrix swelling becomes increasingly significant, leading to permeability reduction and slower gas transport. Consequently, excessively long soaking periods reduce the effectiveness of additional CO2–CH4 displacement while prolonging production interruption. From an economic perspective, excessively long soaking periods not only provide limited additional improvement in gas displacement efficiency, but also increase operational costs due to prolonged well soaking time and delayed production recovery, thereby reducing overall project profitability. Therefore, for high CO2 injection volumes, a soaking time of 60 to 90 days provides a balance between sufficient CO2 diffusion–adsorption equilibrium and acceptable permeability loss, resulting in the optimal economic performance.
A further analysis of the impact of soaking time on NPV indicates that, at a CO2 injection volume of 1000 t, extending the soaking time from 5 days to the optimal 30 days increases the maximum NPV from 5826 USD to 7885 USD, representing an improvement of 35.34%. When the CO2 injection volume is 3000 t, prolonging the soaking time from 5 days to the optimal 90 days raises the maximum NPV from 17,045 USD to 46,653 USD, corresponding to an increase of 173.70%. These results demonstrate that an appropriate extension of soaking time can noticeably enhance the economic performance of CBM projects, particularly under high CO2 injection volumes.
As the CO2 injection volume increases, the gas production rate after well reopening rises markedly. The resulting growth in CBM sales revenue drives a continuous increase in the maximum NPV. At the optimal soaking time, the maximum NPV at an injection volume of 3000 t is 5.92 times that at 1000 t, indicating a substantial improvement in economic returns. Although higher CO2 injection volumes incur greater costs for CO2 purchase and injection in the early stage, leading to relatively low short-term NPV and increased financial pressure, a lifecycle perspective shows that the additional revenue generated from enhanced gas production is sufficient to offset the initial investment and significantly improve project profitability in the later stage.
Figure 6 presents the variations in NPVs of the CBM project under Scenario 2 as functions of CO2 injection volume and soaking time. The overall trend of NPV in Scenario 2 is generally consistent with that observed in Scenario 1. However, unlike Scenario 1, Scenario 2 excludes government subsidies for CBM, resulting in reduced cash inflows during the CH4 production stage and consequently lower overall revenues.
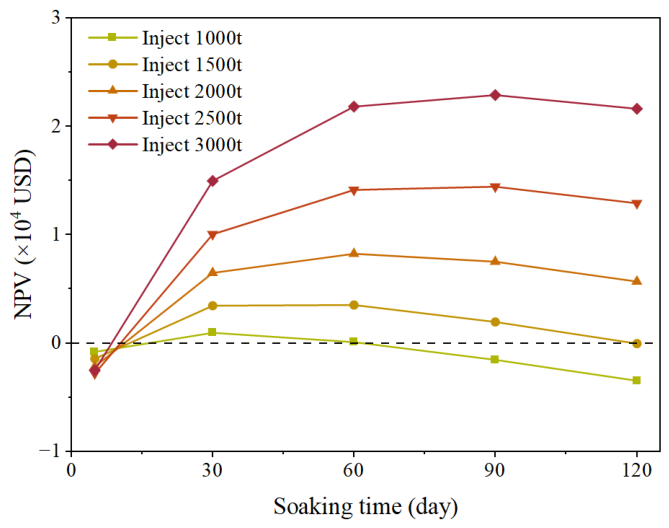
Figure 7 illustrates the variations in the maximum NPV of the CBM project under different CO2 injection volumes and soaking times for Scenario 2. The NPV in Scenario 2 is markedly lower than that in Scenario 1, indicating that government subsidies exert a substantial influence on the economic performance of CBM projects. Consistent with Scenario 1, the maximum NPV for different schemes initially increases and subsequently decreases with prolonged soaking time, while it increases with rising CO2 injection volume. In terms of optimal soaking time, the absence of government subsidies has no significant effect on its selection, and the optimal soaking time remains consistent with that in Scenario 1.
A notable difference from Scenario 1 is that, under short soaking time conditions, the NPV corresponding to different CO2 injection volumes remains low, and none of the schemes achieve profitability. As the soaking time is extended, the NPV under all operating conditions transitions from negative to positive, thereby enabling profitability. This indicates that, in the absence of government subsidies, the selection of an appropriate soaking time is particularly critical. Furthermore, in Scenario 2, when the CO2 injection volume is 1000 t or 1500 t, the project fails to generate substantial returns regardless of the soaking time adopted. Thus, without government subsidies, CO2 injection volume becomes a key determinant of project performance, and schemes with higher injection volumes should be prioritized to enhance production from low-productivity CBM wells.
A comparison of NPVs across different CO2 injection volumes shows that the maximum NPV is 952 USD at an injection volume of 1000 t, whereas it increases to 22,871 USD at 3000 t, representing a 24.02-fold increase. The improvement in project revenue under high injection volumes remains highly significant, and the disparity in NPV among different injection volumes is further amplified compared with Scenario 1. This suggests that, in the absence of government subsidies, the economic advantage of high-injection schemes becomes more pronounced. Meanwhile, even when government subsidies are available, adopting a high CO2 injection volume remains an effective strategy for enhancing the NPV of CBM projects.
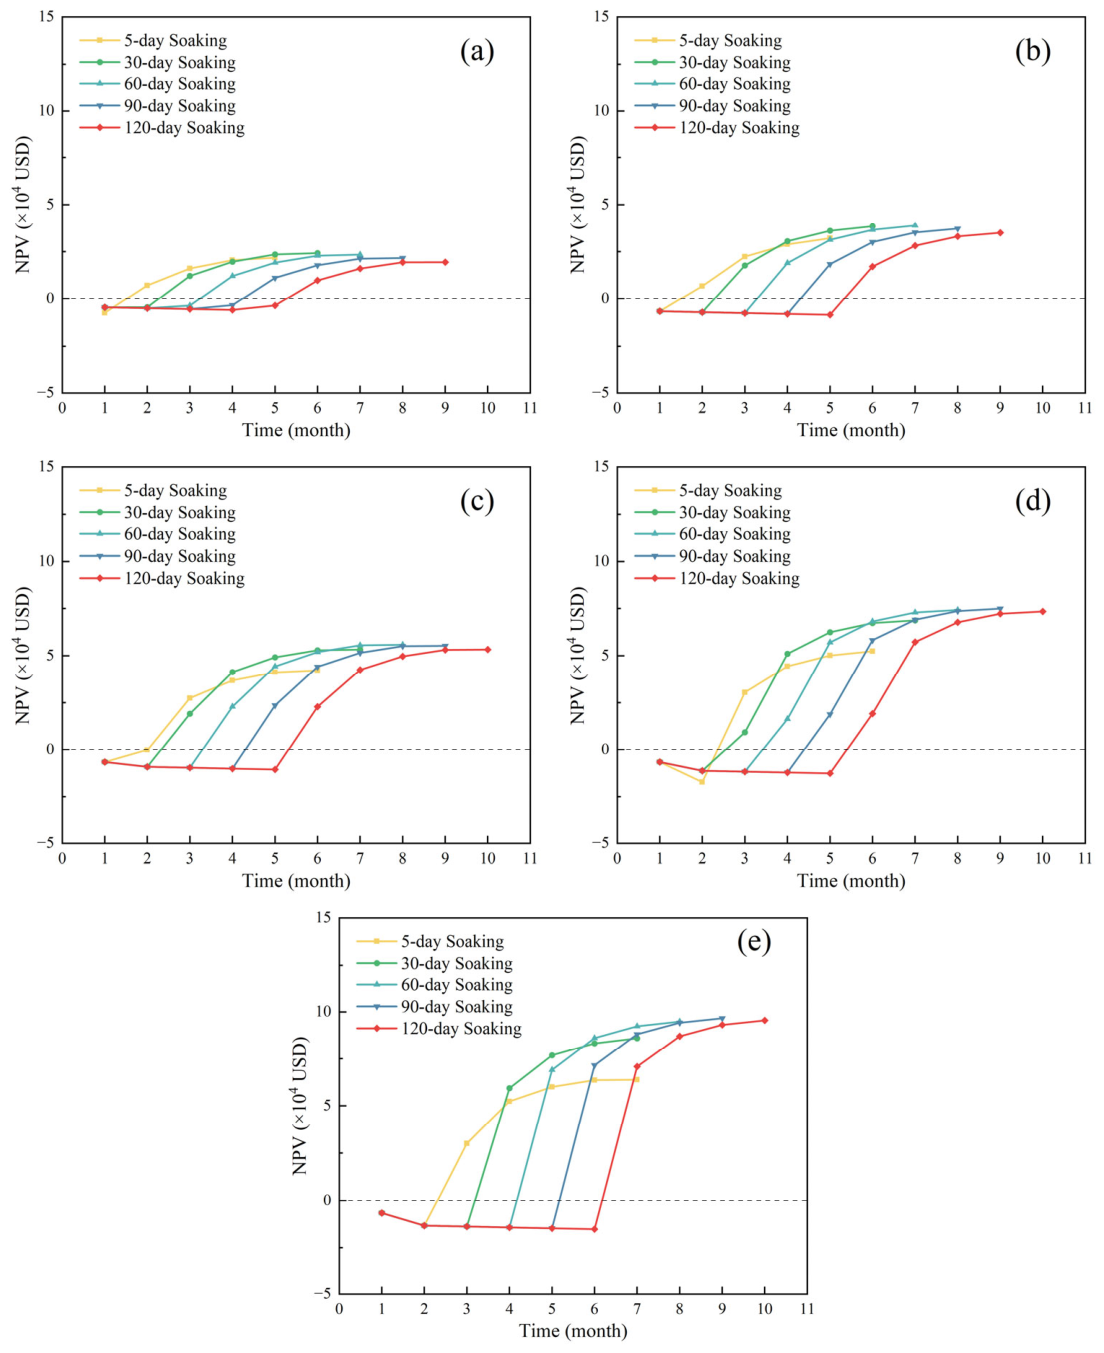
Figure 8 illustrates the variations in the NPVs of CBM projects under Scenario 3 for different CO2 injection volumes and soaking times. Under this scenario, no pronounced negative NPVs are observed during the CO2 injection and soaking stages. The minimum NPV across all operating conditions is −17,367 USD, which is substantially higher than the corresponding values in Scenario 1 and Scenario 2. Under such favorable external conditions, CBM projects exhibit strong overall investment attractiveness.
Consistent with Scenario 1 and Scenario 2, NPV increases continuously once production resumes after the soaking period, with a growth rate markedly higher than that in the two aforementioned scenarios. As the CO2 injection volume increases, the NPV rises rapidly following well reopening, with a growth rate significantly exceeding that observed at lower injection volumes. This behavior is attributed to the enhanced CH4 production associated with higher CO2 injection volumes after well restart, which generates greater NCF and thereby accelerates the increase in project NPV.
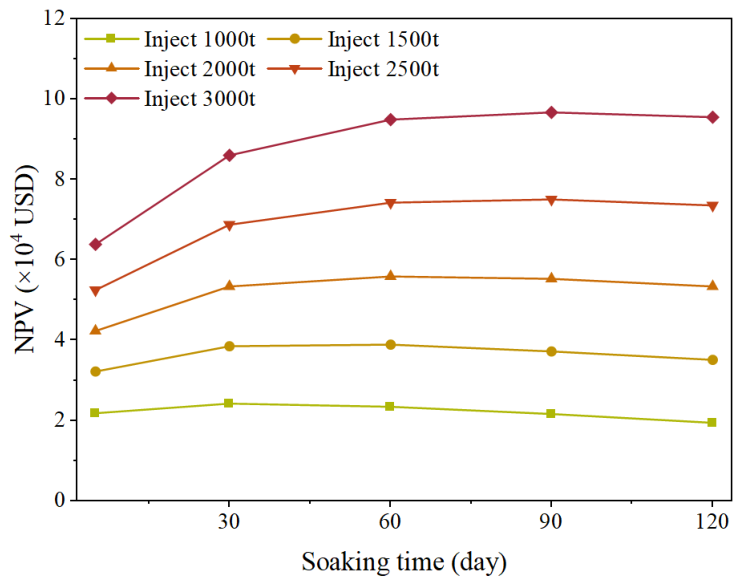
Figure 9 illustrates the variation in the maximum NPV of the CBM project under different CO2 injection volumes and soaking times in Scenario 3. The effects of soaking time and CO2 injection volume on the maximum NPV are consistent with those observed in Scenario 1 and Scenario 2.
Analysis of the effect of soaking time on project NPV indicates that, at relatively low CO2 injection volumes, soaking time exerts only a minor influence on the maximum NPV, and the optimal economic return can be achieved with a shorter soaking period. In contrast, at higher injection volumes, extending the soaking time significantly enhances the project NPV, although a longer soaking duration is required to reach the optimum. The optimal soaking time in Scenario 3 remains consistent with that in Scenario 1 and Scenario 2. Specifically, at CO2 injection volumes of 1000 t and 3000 t, increasing the soaking time from 5 days to the optimal value raises the maximum NPV from 21,793 USD and 63,782 USD to 24,202 USD and 96,597 USD, respectively, corresponding to increases of 11.05% and 51.45%. Compared with Scenario 1, the influence of soaking time on NPV is noticeably reduced, indicating that under favorable external conditions, the sensitivity of NPV to soaking time is weakened. In terms of CO2 injection volume, the maximum NPV at 3000 t is 1.51 times that at 1000 t, and the impact of injection volume on NPV is attenuated relative to both Scenario 1 and Scenario 2.
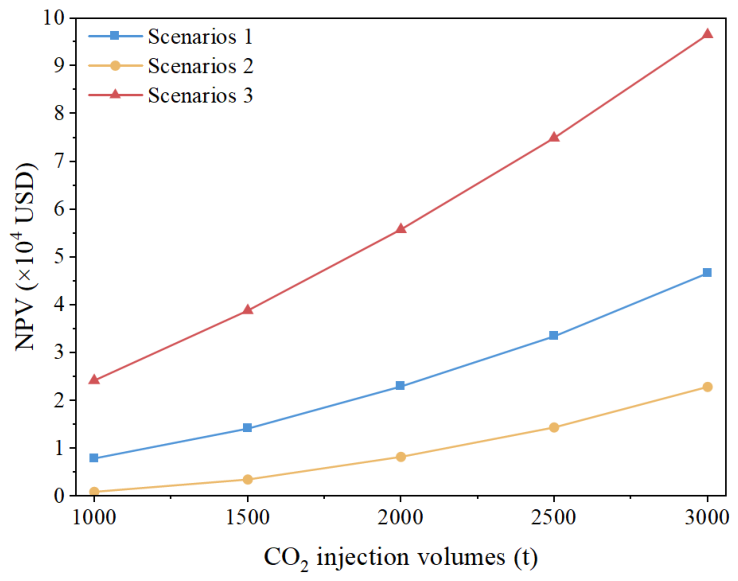
To further quantify the differences in economic performance of the CBM project across scenarios, Figure 10 presents the variation in the maximum NPV at the optimal soaking time as a function of CO2 injection volume. Under all scenarios, NPV increases monotonically with CO2 injection volume, reaching its maximum at 3000 t. The NPV in Scenario 3 is substantially higher than that in Scenario 1 and Scenario 2, indicating that favorable external conditions markedly enhance project profitability. At a CO2 injection volume of 1000 t, the maximum NPV at the optimal soaking time in Scenario 3 is 3.07 times that in Scenario 1. When the injection volume increases to 3000 t, the corresponding value in Scenario 3 is 2.07 times that in Scenario 1, indicating that the gap between the two scenarios narrows at higher injection volumes.
Compared with carbon trading prices and CO2 purchase costs, government subsidies exert a relatively moderate influence on the economic performance of the CBM project. At a CO2 injection volume of 1000 t, the CBM project employing CO2 huff-and-puff in Scenario 2 is only marginally profitable, whereas the NPV in Scenario 1, which includes government subsidies, reaches 7885 USD. When the CO2 injection volume increases to 3000 t, the NPV in Scenario 2 is 50.98% lower than that in Scenario 1, amounting to less than half of the latter. At low injection volumes, the economic viability of the project is fragile and highly dependent on policy support, and government subsidies can substantially improve project returns. However, the negative impact of removing subsidies diminishes with increasing injection volume, suggesting that the additional revenue from enhanced CBM production can partially offset the absence of government subsidies as CO2 injection volume increases.

3.3. Characteristics of Project DPP Under Different Scenarios

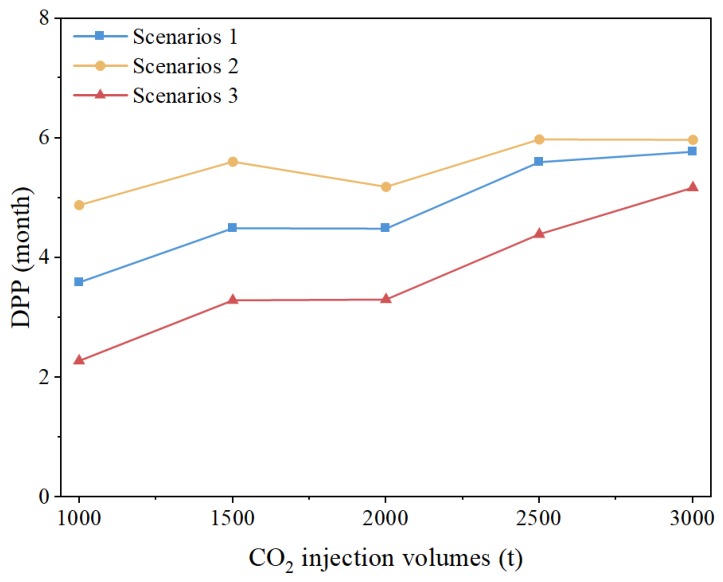
The DPP directly reflects the payback rate of invested capital and serves as a key indicator for evaluating the duration of capital occupation in a project. Figure 11 presents the variation in DPP with CO2 injection volume under different scenarios at the optimal soaking time. Overall, DPP exhibits an increasing trend with rising CO2 injection volume across all scenarios. This is primarily because a larger injection volume prolongs the CO2 injection stage and correspondingly extends the soaking time required to achieve optimal performance. The extended soaking period delays the onset of well reopening and subsequent production, thereby postponing cash inflows and resulting in an overall increase in DPP. However, under Scenarios 1 and 3, the DPP at an injection volume of 2000 t does not show a significant increase compared with that at 1500 t, and Scenario 2 even exhibits a slight decrease. This behavior results from the identical optimal soaking time of 60 days for both injection volumes, whereas the higher injection volume generates greater CH4 production and partially improves late-stage NCF.
Scenario 2, which excludes government subsidies for CBM, exhibits a longer DPP than the other scenarios, indicating a slower capital recovery rate and a prolonged capital occupation period, thereby increasing investment risk. At a CO2 injection volume of 1000 t, the DPP in Scenario 2 is 36.07% longer than that in Scenario 1, demonstrating that government subsidies significantly enhance capital recovery efficiency under low injection volume conditions. As the injection volume increases to 3000 t, the difference between the two scenarios decreases to 3.43%, suggesting that the influence of government subsidies on DPP diminishes with increasing injection volume.
Scenario 3, representing optimal external economic conditions, shows a markedly lower DPP than Scenarios 1 and 2. Due to the high carbon trading price and low CO2 procurement cost, the project avoids prolonged and substantial cash outflows in the early stage. Subsequent production following well reopening generates strong cash inflows, accelerating capital recovery and significantly shortening the DPP. At an injection volume of 1000 t, the DPP in Scenario 3 is 36.48% and 53.31% lower than those in Scenarios 1 and 2, respectively. When the injection volume increases to 3000 t, the corresponding reductions decrease to 10.39% and 13.36%, and the inter-scenario differences in DPP become considerably smaller than those at 1000 t. Overall, Scenario 3 achieves the shortest DPP, highlighting that high carbon trading prices and low CO2 procurement costs significantly improve capital recovery efficiency, reduce investment risk, and enhance the economic attractiveness of CBM projects.
Nevertheless, the results also reveal a pronounced tradeoff between long-term project profitability and capital recovery risk. Although larger CO2 injection volumes generally lead to higher NPVs and superior long-term economic returns, they simultaneously prolong the DPP because of the extended injection and soaking periods prior to production recovery. A longer DPP implies that invested capital remains tied up for an extended duration, thereby increasing project exposure to market uncertainty, operational variability, and potential policy fluctuations. From the perspective of practical project implementation, operators with stronger financial capability and greater risk tolerance may prefer high-injection-volume strategies to maximize long-term economic benefits. In contrast, more risk-averse operators may favor relatively lower injection volumes with shorter DPPs, even at the expense of reduced NPVs, in order to achieve faster capital turnover and lower investment uncertainty. Therefore, the optimal CO2 injection strategy should not be determined solely on the basis of maximum NPV, but should instead comprehensively consider capital recovery efficiency and the investor’s risk tolerance under different economic conditions.

3.4. Sensitivity Analysis of Economic Parameters

Previous sections evaluated the economic feasibility of CO2 huff-and-puff projects under three different scenarios from the perspectives of NCF, NPV, and DPP, while further examining the effects of government subsidy policies and external economic conditions on project profitability. However, in the preceding analyses, the CBM price, operating cost, CO2 injection cost, and CH4 separation cost were assumed to be fixed parameters. In practical applications, these economic parameters are inherently uncertain throughout project implementation. Among them, the CBM price is strongly affected by market supply–demand dynamics and energy policies, with the current market price ranging from approximately 0.14 to 0.25 USD/m3 [18,45]. Operating costs primarily include field management, equipment operation, and maintenance expenses, all of which may vary with project scale and operational conditions. The CO2 injection cost is closely associated with injection equipment performance, injection strategies, and the geological characteristics of coal reservoirs. Meanwhile, the CH4 separation cost may also differ depending on the separation technology and processing capacity employed. In addition, all of these economic parameters are influenced by the scale of the CBM project and the number of production wells.
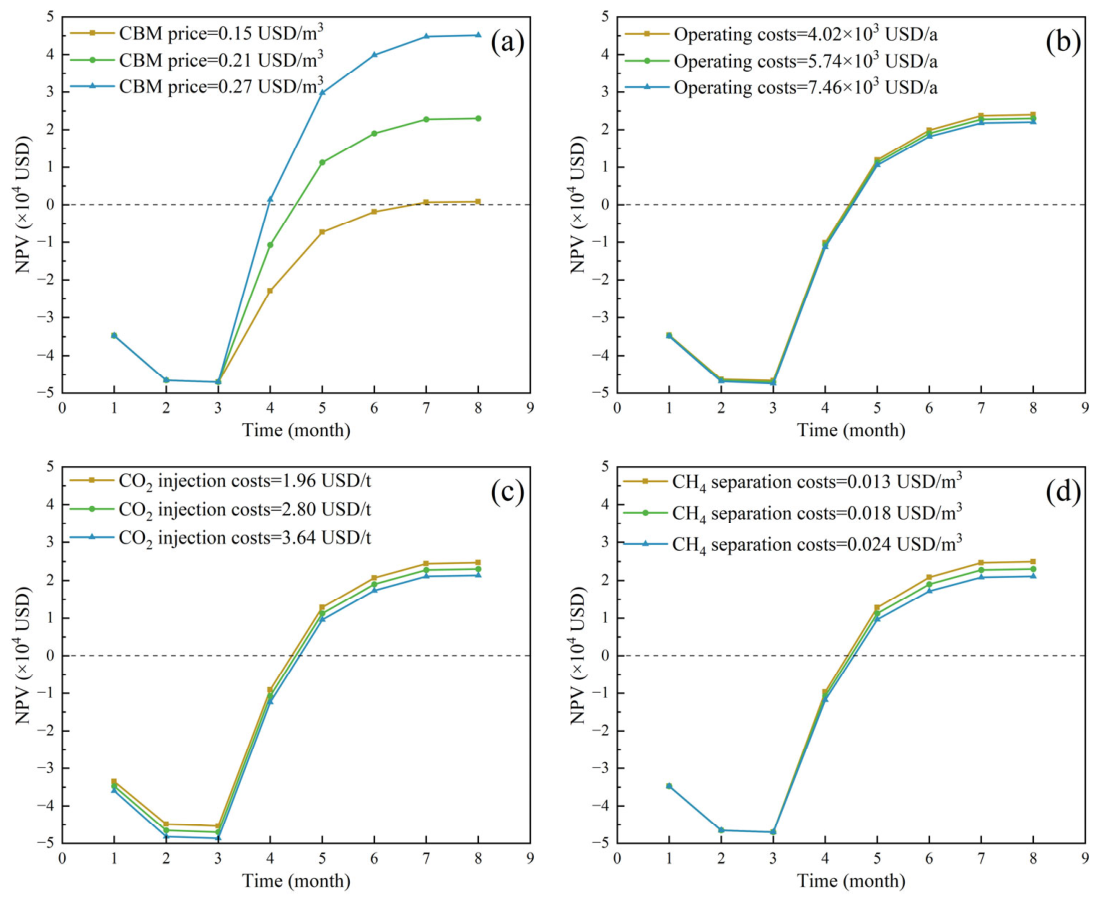
Therefore, to further comprehensively evaluate the economic feasibility of the CO2 huff-and-puff CBM project, the case with a CO2 injection volume of 2000 t and a soaking time of 60 days was selected as the baseline scenario for sensitivity analysis. Under the condition that the total injection volume and soaking time remained unchanged, each of the above economic parameters was independently increased and decreased by 30% to investigate its influence on project economics. This approach effectively isolates the impact of individual economic parameters and quantitatively evaluates their respective contributions to variations in project NPV.
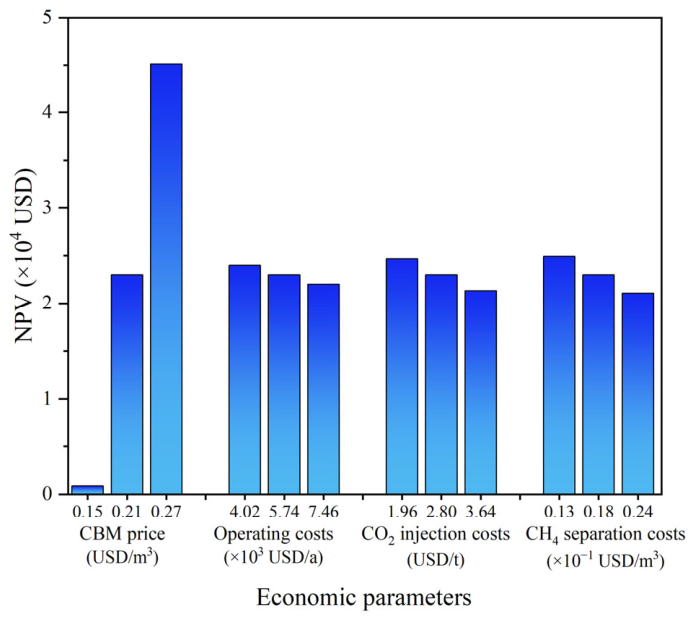
Figure 12 illustrates the variations in project NPV under different economic parameters. It can be observed that the CBM price exerts the greatest influence on project NPV. As the CBM price increases, the cash inflow generated from gas sales rises substantially, thereby markedly improving project profitability. When the CBM price decreases by 30% to 0.15 USD/m3, the project NPV declines to nearly zero, indicating that the CO2 huff-and-puff project can hardly achieve economic profitability under low gas price conditions. This result demonstrates that the economic viability of the CO2 huff-and-puff project is highly dependent on the market price of CBM. In comparison, fluctuations in operating cost, CO2 injection cost, and CH4 separation cost exhibit relatively smaller impacts on project NPV. Increases in these cost-related parameters mainly enlarge project cash outflows, thereby reducing the final NPV.
Different economic parameters influence project economics at different production stages. Operating cost affects economic performance throughout the entire project lifecycle because it is continuously incurred during production and maintenance operations. The CO2 injection cost primarily affects project economics during the injection stage and mainly influences the initial capital investment. In contrast, the CBM price and CH4 separation cost mainly affect economic performance after methane production resumes following the soaking stage, since both parameters are directly associated with gas sales revenue and gas processing expenditure.
Figure 13 presents the variations in the maximum NPV of the CBM project under different economic parameters. Among all investigated factors, the CBM price remains the dominant parameter affecting project profitability. When the CBM price increases by 30%, the maximum NPV rises significantly from 22,998 USD to 45,136 USD, nearly doubling the project return. In comparison, the effects of operating cost, CO2 injection cost, and CH4 separation cost on the maximum NPV are considerably smaller. A 30% increase in operating cost decreases the maximum NPV from 22,998 USD to 22,012 USD, while equivalent increases in CO2 injection cost and CH4 separation cost reduce the maximum NPV to 21,334 USD and 21,079 USD, respectively. Overall, although cost-related parameters negatively affect project profitability, their impacts are substantially weaker than that of the CBM price. These results indicate that improving methane recovery efficiency and maintaining favorable gas market conditions are more critical for enhancing the economic feasibility of CO2 huff-and-puff projects than merely reducing individual operational expenditures.
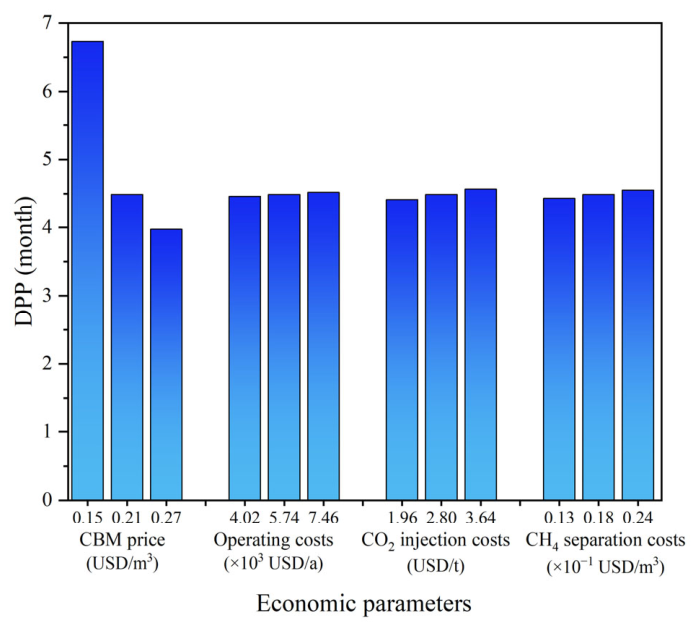
Figure 14 illustrates the variations in the DPP of CBM projects under different economic parameters. Compared with NPV, DPP more directly reflects the project recovery efficiency and investment risk of the CO2 huff-and-puff project. Overall, the DPP exhibits the highest sensitivity to CBM price, whereas operating cost, CO2 injection cost, and CH4 separation cost have relatively limited impacts on the project payback period.
Specifically, when the CBM price decreases by 30%, the DPP increases from 4.49 months to 6.73 months, indicating a substantial extension of the investment recovery period. This is mainly because the reduction in CBM price directly lowers the cash inflow generated from methane sales, thereby slowing the capital recovery rate. In contrast, when the CBM price increases by 30%, the DPP decreases markedly to 3.97 months, demonstrating that favorable gas market conditions can significantly accelerate project payback and improve the economic attractiveness of the CO2 huff-and-puff project. These results further confirm that the profitability and investment risk of the project are highly dependent on CBM prices.
Compared with CBM price, the influences of operating cost, CO2 injection cost, and CH4 separation cost on DPP are considerably smaller. When the operating cost decreases and increases by 30%, the DPP changes only from 4.46 months to 4.52 months. Similarly, the DPP varies from 4.41 to 4.56 months under fluctuations in CO2 injection cost, and from 4.43 to 4.55 months under variations in CH4 separation cost. Although increases in these cost parameters slightly prolong the investment recovery period by increasing project cash outflow, their impacts remain limited compared with the dominant effect of CBM price.
Overall, the sensitivity analysis demonstrates that CBM price is the dominant factor controlling the capital recovery efficiency of CO2 huff-and-puff projects, while variations in cost-related parameters exert relatively minor influences on the project payback period. Therefore, maintaining stable and favorable CBM market conditions is critical for reducing investment risk and improving the economic feasibility of CO2 huff-and-puff CBM projects.
Although the present study employed deterministic sensitivity analysis to evaluate the influence of key economic parameters, future studies should further incorporate probabilistic uncertainty quantification methods, such as Monte Carlo simulation and stochastic sensitivity analysis, to comprehensively characterize the impacts of market volatility, policy fluctuations, and production uncertainty on project economics. In addition, although the economic evaluation framework developed in this study was based on numerical simulation results calibrated using representative geological conditions and experimental data, future work should further incorporate detailed operational and economic datasets from field-scale CO2 huff-and-puff pilot projects to improve model validation and enhance practical applicability.

4. Conclusions

This study establishes an economic evaluation framework for CO2 huff-and-puff enhanced CBM recovery based on the discounted cash flow method. The effects of CO2 injection volume, soaking time, and external economic factors on NCF, NPV, and DPP are systematically investigated. The main conclusions are as follows:
  • CO2 huff-and-puff technology demonstrates promising economic potential for improving gas recovery from low-productivity CBM wells while simultaneously enabling CO2 storage. Although increasing CO2 injection volume substantially improves long-term project profitability through enhanced CH4 production, it also increases early-stage investment pressure and prolongs capital recovery. Therefore, practical implementation should balance long-term economic return with investment risk and financing capability.
  • The economic performance of CO2 huff-and-puff projects is strongly controlled by external market and policy conditions. Favorable carbon trading prices, low CO2 procurement costs, and government subsidies markedly improve project profitability and shorten the discounted payback period. Sensitivity analysis further indicates that CBM price is the key factor controlling both project profitability and capital recovery efficiency, highlighting the importance of stable gas market conditions for commercial deployment.
  • Soaking time optimization plays a critical role in maximizing project economics. The results indicate that the optimal soaking time increases with CO2 injection volume because higher injection volumes require longer periods for CO2 diffusion, competitive adsorption, and CH4 desorption within the coal matrix. From an engineering perspective, the recommended soaking time ranges identified in this study provide practical guidance for soaking management and operational design in field-scale applications.
  • The results further suggest that high-injection-volume strategies are more advantageous under unfavorable external economic conditions or in the absence of government subsidies, as the additional CH4 production can partially offset reduced policy and market benefits. However, such strategies also involve longer payback periods and greater exposure to economic uncertainty, indicating that injection strategy selection should comprehensively consider both profitability and investment risk.
  • Although the present study provides a systematic economic assessment framework for CO2 huff-and-puff enhanced CBM recovery, the analysis was based on deterministic simulation results and simplified economic assumptions. Future studies should further incorporate probabilistic uncertainty analysis, geological heterogeneity, and field-scale operational data to improve model validation and enhance the applicability of the proposed framework under practical reservoir conditions.

Author Contributions

Conceptualization, C.Y.; funding acquisition, Z.F.; investigation, C.Y.; methodology, C.Y.; project administration, Z.F.; supervision, Z.F.; validation, C.Y.; writing—original draft preparation, C.Y.; writing—review and editing, Z.F. All authors have read and agreed to the published version of the manuscript.

Funding

This research was funded by the Hubei Provincial Technological Innovation Program, grant number 2025BCB042.

Data Availability Statement

Data is contained within the article.

Conflicts of Interest

The authors declare no conflict of interest.

References

  1. Wang, C.; Zhang, Q.; Tang, S.; Wu, C. Supercritical CO2 adsorption behavior in deep coal seams of the Qinshui Basin: Model, Mechanisms, and implications for geological storage. Fuel 2026, 413, 138229. [Google Scholar] [CrossRef]
  2. Song, Y.; Zou, Q.; Su, E.; Zhang, Y.; Sun, Y. Changes in the microstructure of low-rank coal after supercritical CO2 and water treatment. Fuel 2020, 279, 118493. [Google Scholar] [CrossRef]
  3. Lyu, X.; Yang, K.; Fang, J. Utilization of resources in abandoned coal mines for carbon neutrality. Sci. Total Environ. 2022, 822, 153646. [Google Scholar] [CrossRef]
  4. Fang, H.; Sang, S.; Wang, Z.; Guo, J.; Liu, H.; Xu, H.; Chen, R. Numerical analysis of temperature effect on CO2 storage capacity and CH4 production capacity during the CO2-ECBM process. Energy 2024, 289, 130022. [Google Scholar] [CrossRef]
  5. Moore, T.A. Coalbed methane: A review. Int. J. Coal Geol. 2012, 101, 36–81. [Google Scholar] [CrossRef]
  6. Hao, C.; Cheng, Y.; Wang, L.; Liu, H.; Shang, Z. A novel technology for enhancing coalbed methane extraction: Hydraulic cavitating assisted fracturing. J. Nat. Gas Sci. Eng. 2019, 72, 103040. [Google Scholar] [CrossRef]
  7. Wang, J.; Chen, Y.; Yao, H.; Li, H.; Wang, C. Study on directed modification mechanism of surface functional groups of anthracite by supercritical CO2 for improved adsorption. Fuel 2025, 386, 134196. [Google Scholar] [CrossRef]
  8. Yang, C.; Fang, Z.; Shen, S.; Wang, H. Enhancing Recovery of Low-Productivity Coalbed Methane Wells in Medium-Shallow Reservoirs by CO2 Huff-and-Puff. Separations 2025, 12, 314. [Google Scholar] [CrossRef]
  9. Ye, L.; Li, X.; Jia, C.; Du, J.; Sun, H. Experimental and numerical investigation of coal strain and permeability evolution during CO2-ECBM: Effects of injection pressure and confining pressure. Fuel 2026, 412, 138068. [Google Scholar] [CrossRef]
  10. Huang, Q.; Shen, J.; Zhang, B.; Zhao, G.; Cheng, M.; Cai, Y.; Li, C. Real-time monitoring of coalbed methane production network following liquid CO2 injection in a low-efficiency well network: Response to gas and water production characteristics. Energy 2023, 285, 129488. [Google Scholar] [CrossRef]
  11. Fang, Z.; Yang, C.; Wang, R. Monitoring technologies for CO2 storage in coal seams and enhanced coalbed methane recovery: A review of field applications. Fuel Process. Technol. 2025, 276, 108274. [Google Scholar] [CrossRef]
  12. Gao, C.; Liu, D.; Vandeginste, V.; Cai, Y.; Sun, F. Effects of CO2 injection pressure and confining pressure on CO2-enhanced coalbed methane recovery: Experimental observations at various simulated geological conditions. Chem. Eng. J. 2024, 483, 149207. [Google Scholar] [CrossRef]
  13. Zhang, X.; Ranjith, P.G. Experimental investigation of effects of CO2 injection on enhanced methane recovery in coal seam reservoirs. J. CO2 Util. 2019, 33, 394–404. [Google Scholar] [CrossRef]
  14. Wong, S.; Law, D.; Deng, X.H.; Robinson, J.; Kadatz, B.; Gunter, W.D.; Ye, J.P.; Feng, S.L.; Fan, Z.Q. Enhanced coalbed methane and CO2 storage in anthracitic coals-Micro-pilot test at South Qinshui, Shanxi, China. Int. J. Greenh. Gas Control 2007, 1, 215–222. [Google Scholar] [CrossRef]
  15. Liu, S.; Huang, F.; Du, R.; Chen, S.; Guan, Y.; Liu, Y.; Wang, T. Progress and typical case analysis of demonstration projects of the geological sequestration and utilization of CO2. Coal Sci. Technol. 2023, 51, 158–174. [Google Scholar] [CrossRef]
  16. Mavor, M.J.; Gunter, W.D.; Robinson, J.R. Alberta Multiwell Micro-Pilot Testing for CBM Properties, Enhanced Methane Recovery and CO2 Storage Potential. In Proceedings of the SPE Annual Technical Conference and Exhibition, Houston, TX, USA, 26–29 September 2004. [Google Scholar] [CrossRef]
  17. Bhowmik, S.; Dutta, P. Investigation into the Methane Displacement Behavior by Cyclic, Pure Carbon Dioxide Injection in Dry, Powdered, Bituminous Indian Coals. Energy Fuels 2011, 25, 2730–2740. [Google Scholar] [CrossRef]
  18. Dai, Y.; Xu, F.; Wang, F.; Ma, P.; Yang, Y.; Yun, J.; Xu, J.; Sun, X.; Cheng, S.; Li, Y. Economic evaluation and investment decision-making process of deep coalbed methane exploration and development projects. Coal Sci. Technol. 2025, 53, 47–59. [Google Scholar] [CrossRef]
  19. Sander, R.; Connell, L.D. A probabilistic assessment of enhanced coal mine methane drainage (ECMM) as a fugitive emission reduction strategy for open cut coal mines. Int. J. Coal Geol. 2014, 131, 288–303. [Google Scholar] [CrossRef]
  20. Li, S.; Zhang, B. Research of Coalbed Methane Development Well-Type Optimization Method Based on Unit Technical Cost. Sustainability 2016, 8, 843. [Google Scholar] [CrossRef]
  21. Yang, Y.; Qin, Y. Study on system models of the coal-bed methane project economy evaluation and its application. J. China Coal Soc. 2004, 29, 254–256. [Google Scholar] [CrossRef]
  22. Wong, S.; Macdonald, D.; Andrei, S.; Gunter, W.D.; Deng, X.; Law, D.; Ye, J.; Feng, S.; Fan, Z.; Ho, P. Conceptual economics of full scale enhanced coalbed methane production and CO2 storage in anthracitic coals at South Qinshui basin, Shanxi, China. Int. J. Coal Geol. 2010, 82, 280–286. [Google Scholar] [CrossRef]
  23. Fang, Z.; Shen, S. Optimizing enhanced coalbed methane recovery in thick lignite formations: An integrated technical and economic evaluation. Results Eng. 2025, 27, 106733. [Google Scholar] [CrossRef]
  24. Robertson, E.P. Economic analysis of carbon dioxide sequestration in powder river basin coal. Int. J. Coal Geol. 2009, 77, 234–241. [Google Scholar] [CrossRef]
  25. Hernandez, G.A.; Bello, R.O.; McVay, D.A.; Ayers, W.B.; Rushing, J.A.; Ruhl, S.K.; Hoffmann, M.F.; Ramazanova, R.I. Evaluation of the Technical and Economic Feasibility of CO2 Sequestration and Enhanced Coalbed-Methane Recovery in Texas Low-Rank Coals. In Proceedings of the SPE Gas Technology Symposium, Calgary, AB, Canada, 15–18 May 2006. [Google Scholar] [CrossRef]
  26. Yang, Y.; Li, Y.; Qin, Y. Research progress in economic evaluation theories and methods of CBM projects. Nat. Gas Ind. 2022, 42, 186–192. [Google Scholar] [CrossRef]
  27. Dhir, R.; Dern, R.R., Jr.; Mavor, M.J. Economic and Reserve Evaluation of Coalbed Methane Reservoirs. J. Pet. Technol. 1991, 43, 1424–1518. [Google Scholar] [CrossRef]
  28. Wu, Y.; Pan, Z.; Zhang, D.; Lu, Z.; Connell, L.D. Evaluation of gas production from multiple coal seams: A simulation study and economics. Int. J. Min. Sci. Technol. 2018, 28, 359–371. [Google Scholar] [CrossRef]
  29. Luo, D.; Xia, L. An economic evaluation method of coalbed methane resources during the target selection phase of exploration. Pet. Sci. 2015, 12, 705–711. [Google Scholar] [CrossRef]
  30. Luo, D.; Dai, Y. Economic evaluation of coalbed methane production in China. Energy Policy 2009, 37, 3883–3889. [Google Scholar] [CrossRef]
  31. Yang, Y.; Tong, L.; Liu, Y.; Guo, W.; Wang, L.; Qiu, Y.; Ding, Y. A novel integrated system of hydrogen liquefaction process and liquid air energy storage (LAES): Energy, exergy, and economic analysis. Energy Convers. Manag. 2023, 280, 116799. [Google Scholar] [CrossRef]
  32. Tavakolan, M.; Mostafazadeh, F.; Jalilzadeh Eirdmousa, S.; Safari, A.; Mirzaei, K. A parallel computing simulation-based multi-objective optimization framework for economic analysis of building energy retrofit: A case study in Iran. J. Build. Eng. 2022, 45, 103485. [Google Scholar] [CrossRef]
  33. Dong, X.; Sun, D.; Wang, C.; Shen, Q. Energy, exergy, economic, and environmental (4E) analyses and optimization of a novel coalbed methane liquefaction-distillation process for LNG production using regenerative cryocoolers. Appl. Therm. Eng. 2026, 285, 129314. [Google Scholar] [CrossRef]
  34. Mi, X.; Liu, R.; Cui, H.; Memon, S.A.; Xing, F.; Lo, Y. Energy and economic analysis of building integrated with PCM in different cities of China. Appl. Energy 2016, 175, 324–336. [Google Scholar] [CrossRef]
  35. Yang, G.; Wang, Z.; Chen, T.; Peng, R. Optimization of coalbed methane well completion using multiple objective decision method. Spec. Oil Gas Reserv. 2013, 20, 32–35. [Google Scholar] [CrossRef]
  36. Li, W.; Shen, J.; Wang, Y.; Huang, Q.; Cao, Y. Identification method of deep coal-measure gas co-production layer combinations and its effect evaluation. Acta Pet. Sin. 2024, 45, 844–854. [Google Scholar] [CrossRef]
  37. Fan, L.; Wang, B.; Song, X. An authority-enterprise equilibrium differentiated subsidy mechanism for promoting coalbed methane extraction in multiple coal seams. Energy 2023, 263, 125541. [Google Scholar] [CrossRef]
  38. Wang, K.; Chen, L. Review and Outlook of Global and China’s Carbon Markets (2026); Center for Energy & Environmental Policy Research: Beijing, China, 2026. [Google Scholar]
  39. Zhou, F.; Hou, W.; Allinson, G.; Wu, J.; Wang, J.; Cinar, Y. A feasibility study of ECBM recovery and CO2 storage for a producing CBM field in Southeast Qinshui Basin, China. Int. J. Greenh. Gas Control 2013, 19, 26–40. [Google Scholar] [CrossRef]
  40. Rubin, E.S.; Davison, J.E.; Herzog, H.J. The cost of CO2 capture and storage. Int. J. Greenh. Gas Control 2015, 40, 378–400. [Google Scholar] [CrossRef]
  41. Zhang, X.; Xu, M.; Wei, S.; Fan, J. Tech-economic evaluation of CO2 enhanced coalbed methane recovery technology—A case study of China. Energy Proc. 2020, 13, 7482–7484. [Google Scholar] [CrossRef]
  42. Zhao, X.; Xiao, J.; Hou, J.; Wu, J.; Lyu, X.; Zhang, J.; Liu, Y. Economic and scale prediction of CO2 capture, utilization and storage technologies in China. Pet. Explor. Dev. 2023, 50, 751–764. [Google Scholar] [CrossRef]
  43. Tian, Y.; Liu, S.; Zhang, H.; Mo, H.; Wang, D.; Sang, S.; Wang, J.; Wang, W.; Zheng, S. Multi-scale source-sink matching and transportation route optimization for geologic CO2 sequestration of industrial CO2 stationary sources in Jiangsu Province. Coal Sci. Technol. 2026, 54, 38–51. [Google Scholar] [CrossRef]
  44. Guo, H.; Wei, J.; Ma, Y.; Deng, J.; Yi, S.; Wang, B.; Deng, L.; Jiang, X.; Dai, Z. Facilitated transport membranes for CO2/CH4 separation—State of the art. Adv. Membr. 2022, 2, 100040. [Google Scholar] [CrossRef]
  45. Zhang, B.; Du, F.; Zhang, H.; Wei, C. Selection of favorable areas for coalbed methane development based on economic benefit evaluation: A case study of Yangjiapo block in eastern margin of Ordos Basin. Reserv. Eval. Dev. 2024, 14, 933–941. [Google Scholar] [CrossRef]
Figure 1. Variation in NCF with different CO2 injection volumes and soaking times under Scenario 1 ((ae) represent CO2 injection volumes of 1000 t, 1500 t, 2000 t, 2500 t, and 3000 t, respectively).
Energies 19 02658 g001
Figure 2. Variation in NCF with different CO2 injection volumes and soaking times under Scenario 2 ((ae) represent CO2 injection volumes of 1000 t, 1500 t, 2000 t, 2500 t, and 3000 t, respectively).
Energies 19 02658 g002
Figure 3. Variation in NCF with different CO2 injection volumes and soaking times under Scenario 3 ((ae) represent CO2 injection volumes of 1000 t, 1500 t, 2000 t, 2500 t, and 3000 t, respectively).
Energies 19 02658 g003
Figure 4. Variation in NPV with different CO2 injection volumes and soaking times under Scenario 1 ((ae) represent CO2 injection volumes of 1000 t, 1500 t, 2000 t, 2500 t, and 3000 t, respectively).
Energies 19 02658 g004
Figure 5. Variation in the maximum NPV with different CO2 injection volumes and soaking times under Scenario 1.
Energies 19 02658 g005
Figure 6. Variation in NPV with different CO2 injection volumes and soaking times under Scenario 2 ((ae) represent CO2 injection volumes of 1000 t, 1500 t, 2000 t, 2500 t, and 3000 t, respectively).
Energies 19 02658 g006
Figure 7. Variation in the maximum NPV with different CO2 injection volumes and soaking times under Scenario 2.
Energies 19 02658 g007
Figure 8. Variation in NPV with different CO2 injection volumes and soaking times under Scenario 3 ((ae) represent CO2 injection volumes of 1000 t, 1500 t, 2000 t, 2500 t, and 3000 t, respectively).
Energies 19 02658 g008
Figure 9. Variation in the maximum NPV with different CO2 injection volumes and soaking times under Scenario 3.
Energies 19 02658 g009
Figure 10. Variation in the maximum NPV with different CO2 injection volumes at the optimal soaking time under different scenarios.
Energies 19 02658 g010
Figure 11. Variation in DPP corresponding to the optimal soaking time under different scenarios with CO2 injection volume.
Energies 19 02658 g011
Figure 12. Variation in NPV of the CBM project under different economic parameters: (a) CBM price, (b) Operating costs, (c) CO2 injection costs, (d) CH4 separation costs.
Energies 19 02658 g012
Figure 13. Variation in the maximum NPV of the CBM project under different economic parameters.
Energies 19 02658 g013
Figure 14. Variation in the DPP of the CBM project under different economic parameters.
Energies 19 02658 g014
Table 1. Parameters used in the economic model.
ParametersValueUnit
RevenueCBM price0.21 [35]USD/m3
Commercial ratio of CBM95% [36]-
Government subsidy0.042 [37]USD/m3
Carbon trading price7.14–18.21 [23,38]USD/t
ExpenditureOperating costs5742.30 [39]USD/a
CO2 purchase costs19.61–46.22 [23,40]USD/t
CO2 injection costs2.80 [41,42]USD/t
CH4 separation costs0.018 [23]USD/m3
OtherDiscount rate10% [20]-
Disclaimer/Publisher’s Note: The statements, opinions and data contained in all publications are solely those of the individual author(s) and contributor(s) and not of MDPI and/or the editor(s). MDPI and/or the editor(s) disclaim responsibility for any injury to people or property resulting from any ideas, methods, instructions or products referred to in the content.