Experimental Study of the Effect of Different Influencing Factors on the Interaction of CO2, Water, and Basalt


 , ,
, ,
Abstract
1. Introduction
2. Design of Experiments
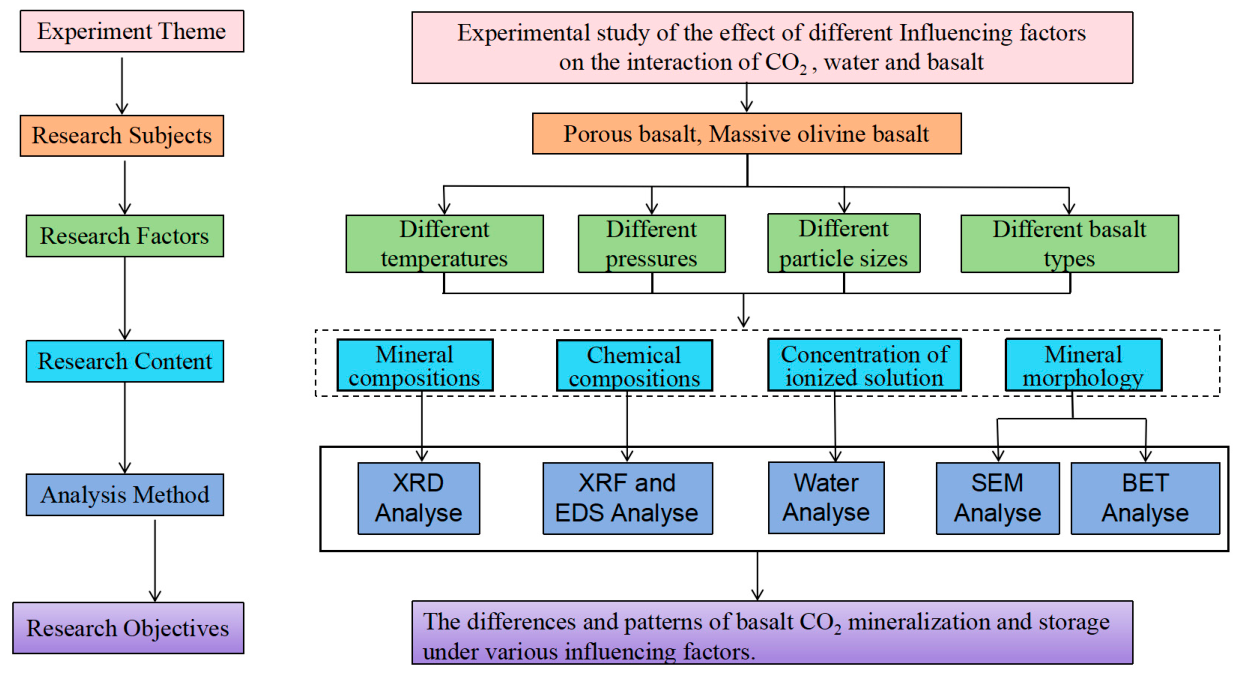
2.1. Experimental Technical Route
2.2. Experimental Samples
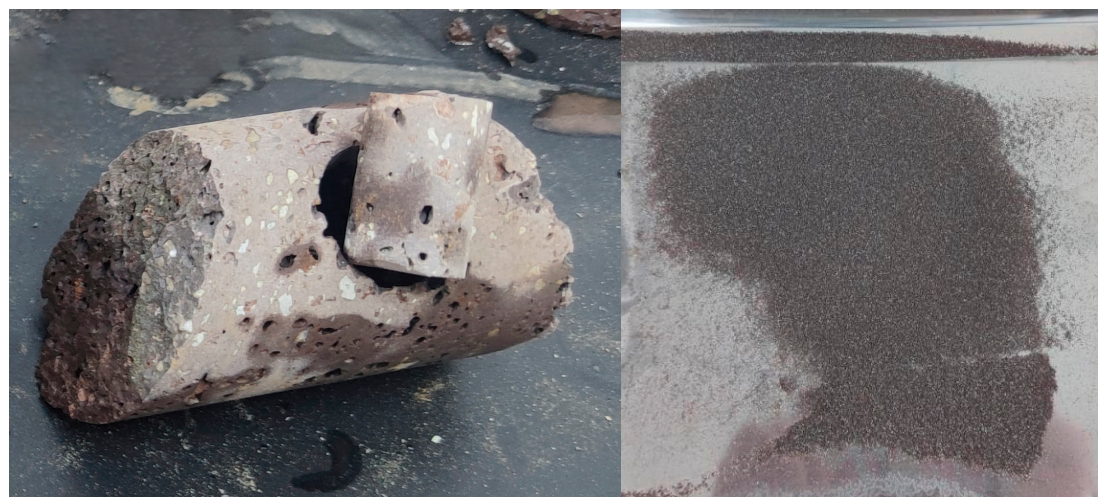
2.2.1. Porous Basalt
- (1)
- Petrological characteristics of the samples
- (2)
- The mineral and chemical compositions of the sample
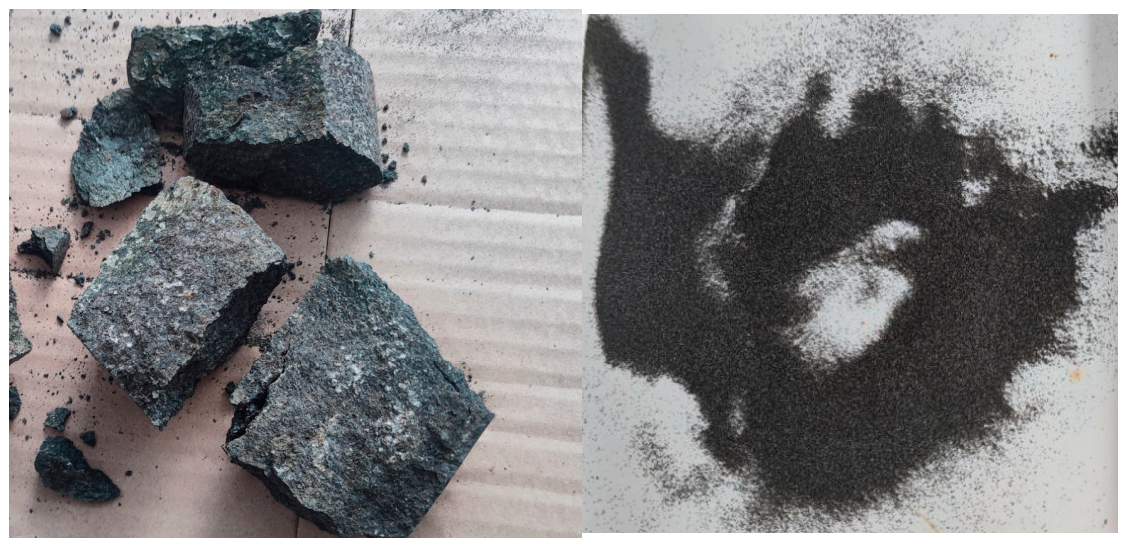
2.2.2. Massive Olivine Basalt
- (1)
- Petrological characteristics of the samples
- (2)
- The mineral and chemical compositions of the sample
2.3. Experimental Scheme
- (1)
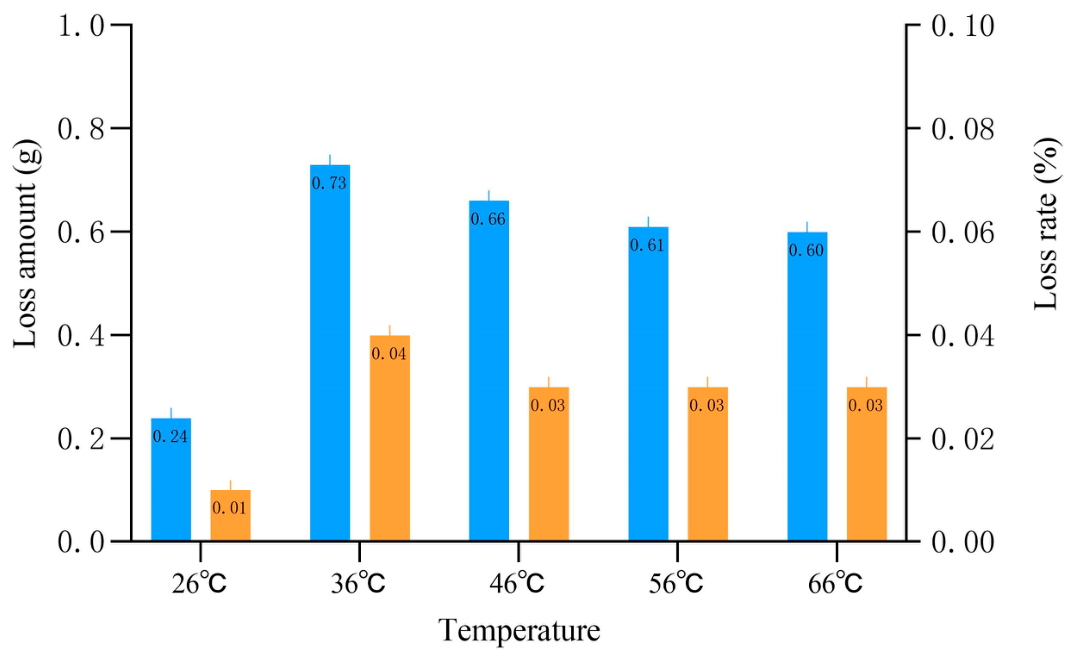
- Porous basalt samples at 5 MPa pressure, pH 8, and particle size range of 60–65 mesh (0.25–0.3 mm) at temperatures of 26, 36, 46, 56, and 66 °C.
- (2)
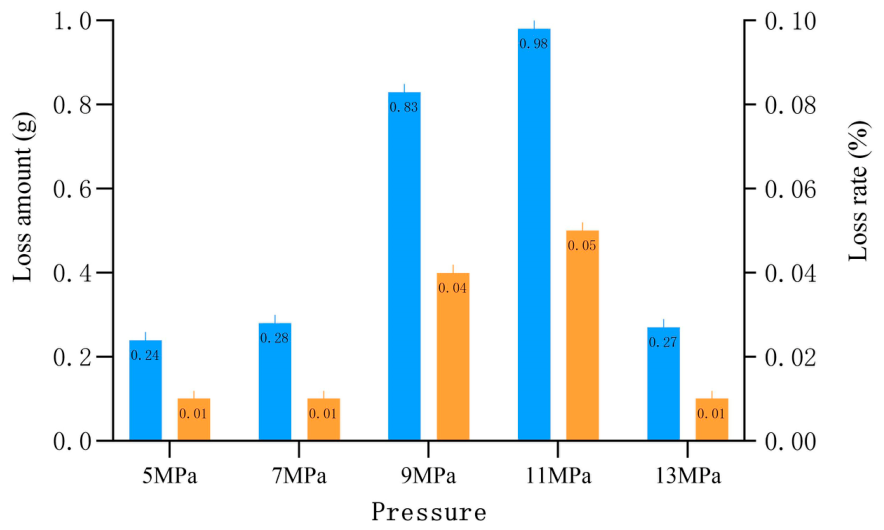
- Porous basalt samples with particle size range of 60–65 mesh (0.25–0.3 mm) at 26 °C, pH 8, and pressures of 5, 7, 9, 11, and 13 MPa.
- (3)
- Porous basalt samples at 26 °C, 5 MPa, pH 8, and particle size range of 60–65 mesh (0.25–0.3 mm), 30–35 mesh (0.6–0.65 mm), and 16–18 mesh (1.0–1.25 mm).
- (4)
- Massive olivine basalt and pore basalt at 26 °C, 5 MPa, pH 8, and particle size range of 60–65 mesh (0.25–0.3 mm).
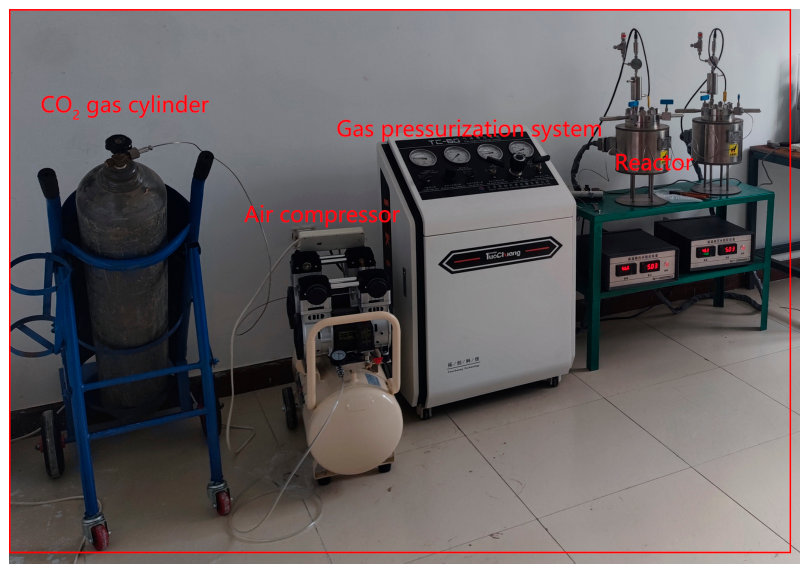
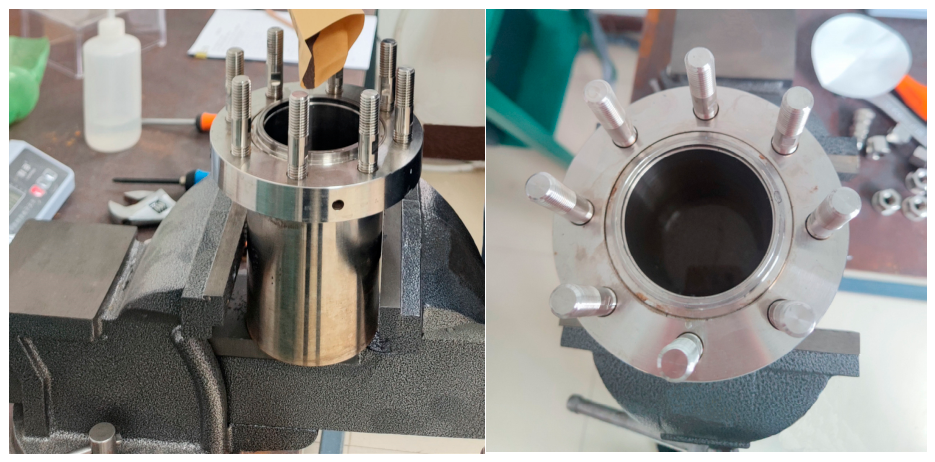
2.4. Experimental Apparatus
2.5. Analysis of Testing Methods
2.6. Experimental Procedure
2.6.1. Blank Control Experiment
2.6.2. CO2–Water–Basalt Interaction Experiments
- (1)
- The rock was ground into particles of different sizes according to the experimental protocol, then washed with purified water at 105 °C for 24 h, and dried for subsequent use.
- (2)
- Prior to the experiment, 300 mL of purified water was added to the reactor. The rock sample (solid-to-liquid ratio 1:15) was weighed, and 20 g of the sample was then sealed in the reactor.
- (3)
- The reactor air compressor was turned on and CO2 was introduced. The CO2–water–rock reaction experiment was performed according to the pre-set experimental protocol. The temperature and pressure were maintained under relatively stable conditions throughout the 15-day experiment.
- (4)
- After the reaction was completed, the reactor was opened to retrieve the rock samples and reaction solution.
- (5)
- After sampling, the rock specimens were rinsed with purified water, dried at 105 °C for 24 h, and weighed.
- (6)
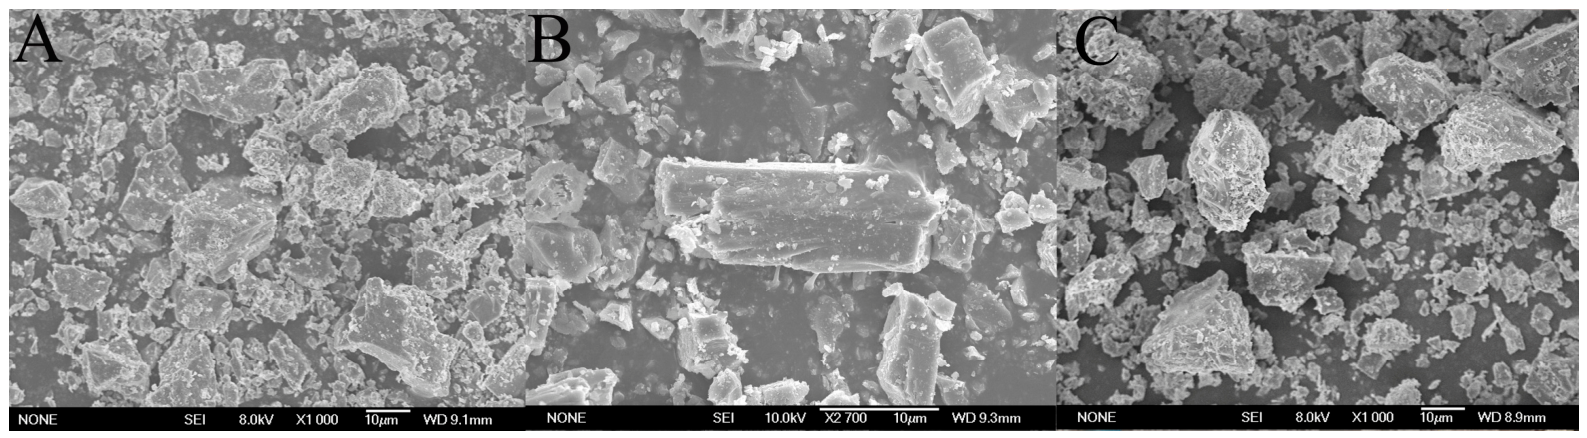
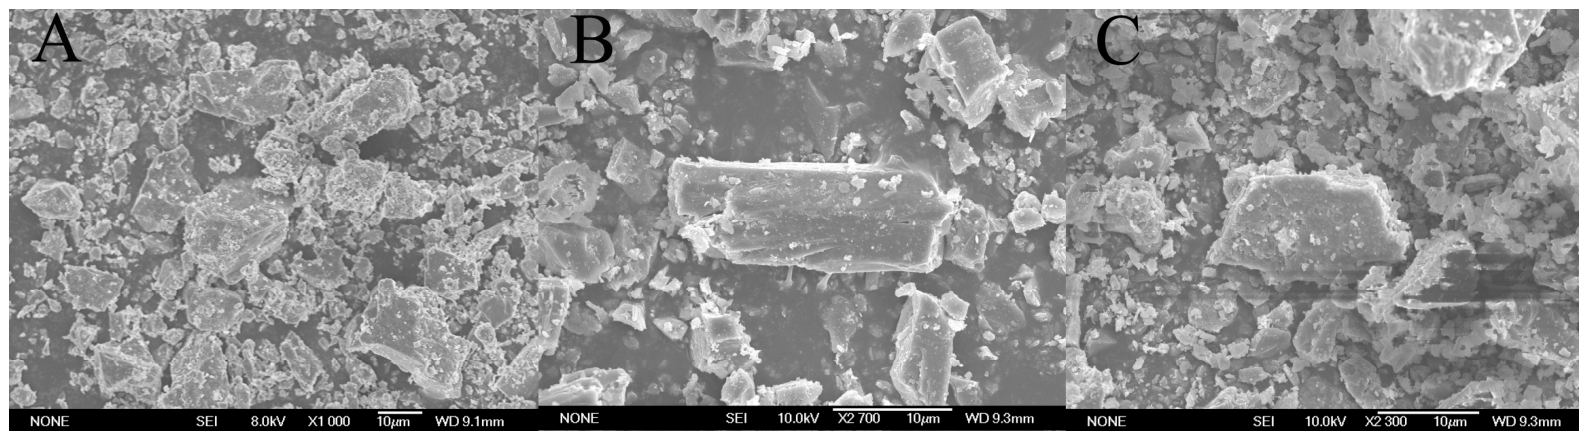
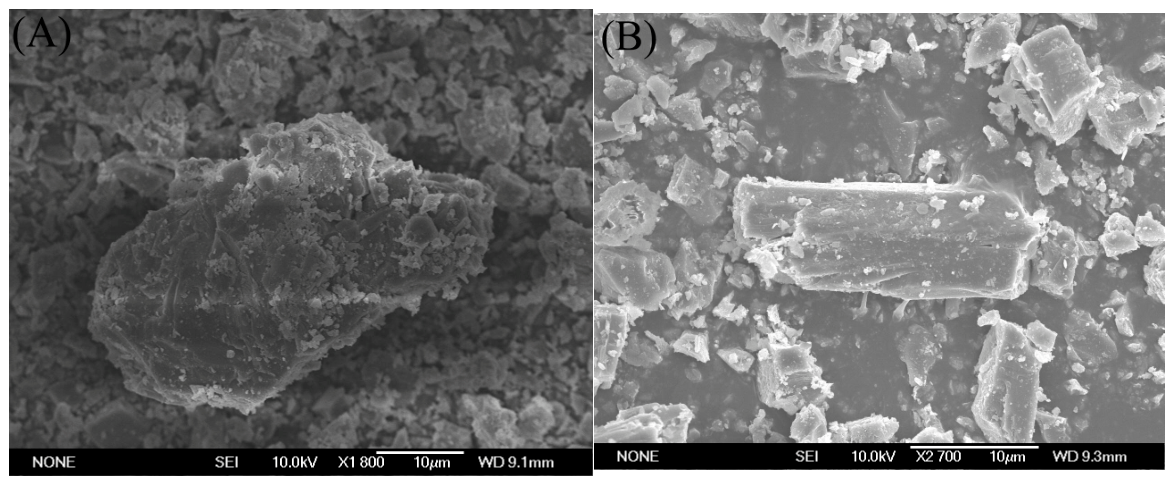
- The rock samples and reaction solutions were tested. XRD was employed to identify the mineral types that had disappeared or had formed, while EDX and XRF spectroscopy were utilized to confirm the mineral types and their primary chemical compositions. SEM was used to observe the mineral morphology of the rock samples. The particle aperture size of the samples were analyzed using a specific surface area and pore size analyzer. The residual solution after the reaction was transferred to a solution bottle and the changes in pH before and after the reaction were recorded using a pH meter. The chemical composition of the solution was determined through ultraviolet spectrophotometry and mass spectrometry.
3. Data Analysis of Experiments
3.1. Effect of Temperature on CO2–Water–Basalt Reaction Experiments
3.1.1. Changes in Sample Mass and Loss Rate
3.1.2. Changes in Mineral Composition of Samples
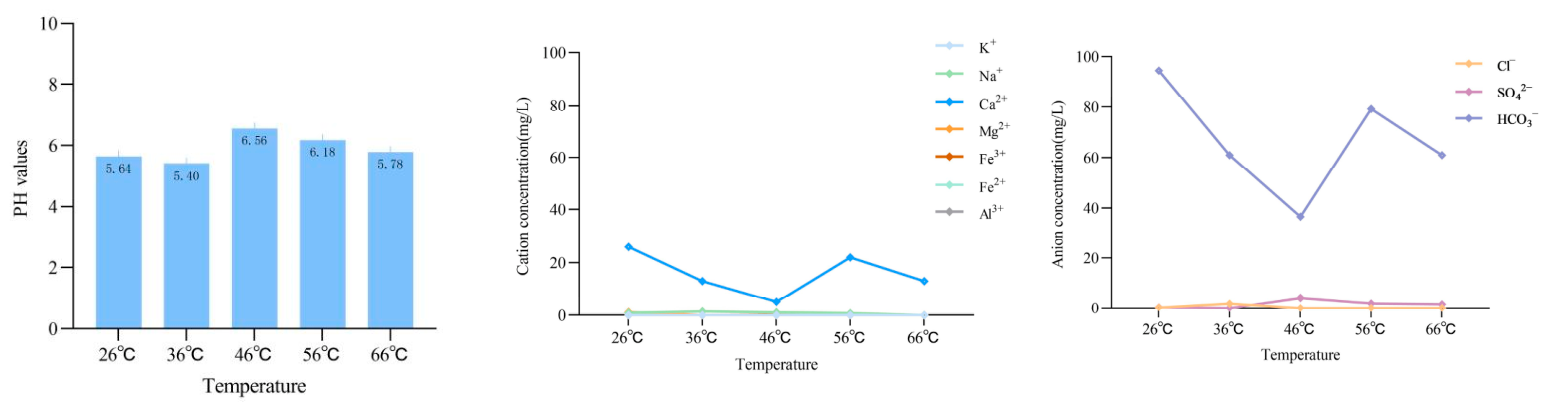
3.1.3. Changes in the Concentration of Ionized Solution and pH Value
3.1.4. Changes in Particle Aperture Size
3.2. Geothermal and Hydrogeological Characteristics
3.2.1. Changes in Sample Mass and Loss Rate
3.2.2. Changes in Mineral Composition of Samples
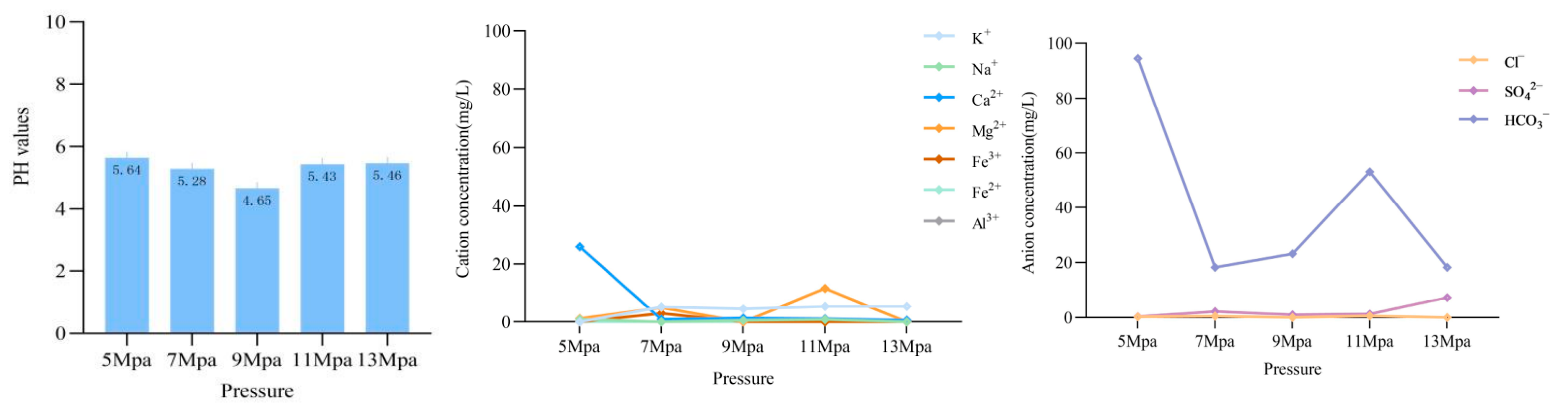
3.2.3. Changes in the Concentration of Ionized Solution and pH Value
3.2.4. Changes in Particle Aperture Size
3.3. Effect of Particle Size on CO2–Water–Basalt Reaction Experiment
3.3.1. Changes in Sample Mass and Loss Rate
3.3.2. Changes in Mineral Composition of Samples
3.3.3. Changes in Concentration of Ionized Solution and the pH Value
3.3.4. Changes in Particle Aperture Size
3.4. Effect of Different Types of Basalt on CO2–Water–Rock Interaction Experiments
3.4.1. Changes in Sample Mass and Loss Rate
3.4.2. Changes in Mineral Composition of Samples
3.4.3. Changes in Concentration of Ionized Solution and pH Value
3.4.4. Changes in Particle Aperture Size
4. Conclusions, Limitations, and Prospects
4.1. Conclusions
- (1)
- The transverse permeability of both porous basalt and massive olivine basalt was greater than that of the vertical permeability, and both the transverse and vertical porosity of the porous basalt were greater than those of massive olivine basalt The main mineral components of both types of basalt are the same: plagioclase, calcite, pyroxene, pyrite, quartz, and clay minerals. Because the filling material in the pore or almond structure usually includes secondary minerals such as calcite, quartz, and zeolite, the porous basalt contained the higher calcite content. The massive basalt contained a higher mass percentage of Fe and Mg, and the mass percentage of Ca was higher in the porous basalt.
- (2)
- According to the experimental data, the carbonate minerals formed in the porous basalt after the experiment were mainly calcite (CaCO3), with a small amount of hydrated magnesium carbonate minerals such as magnesite [Mg5(CO3)4(OH)2·4H2O], anhydrite [Mg5(CO3)4(OH)2·5H2O], and magnesite hydrate [MgCO3·3H2O].
- (3)
- The experimental CO2–water–basalt reaction under four different conditions found that calcite mineral began to form in basalt above 36 °C, and carbonate mineral was most abundant at 66 °C, accompanied by a small amount of hydrated magnesium carbonate mineral. When different pressures were applied at 26 °C, the original calcite minerals primarily exhibited a gradually greater dissolution trend as the pressure was increased. A small amount of hydrated magnesium carbonate mineral was generated at pressures above 7 MPa, and a small amount of calcite was formed at 13 MPa. For different particle sizes, the dissolution degree was most pronounced at 30–35 mesh. The dissolution reaction was more intense in porous basalt than in massive olivine basalt.
4.2. Limitations
- (1)
- There were few basalt types investigated in the CO2–water–basalt experiments, and no experiments were conducted on basalt rich in calcium, magnesium, and iron and that free from filling impurities.
- (2)
- The results of the four groups of CO2–water–basalt experiments, which were carried out by controlling the variables, failed to reflect the results of the mixed changes of temperature, pressure, particle size, and basalt type, with the conditions of 26 °C, 5 MPa and 60–65 mesh granular porous basalt as the benchmark.
- (3)
- Based on the mineral mass loss and changes in mineral composition, it is impossible to calculate a quantitative estimate of CO2 storage capacity due to the excessive number of variables.
4.3. Prospects
Author Contributions
Funding
Data Availability Statement
Acknowledgments
Conflicts of Interest
References
- Zhao, Y.; Li, J.; Yang, P.; Shen, S.; Wang, D.; Dong, X.; Zhu, R. Evaluation on of geological suitability for CO2 storage in salty aquifers in the East China Sea Shelf Basin. Mar. Geol. Quat. Geol. 2023, 43, 129–139. [Google Scholar]
- Bachu, S. Sequestration of CO2 in geological media: Criteria and approach for site selection in response to climate change. Energy Convers. Manag. 2000, 41, 953–970. [Google Scholar] [CrossRef]
- Lu, P.; Bai, Y.; Liu, W.; Chen, X.; Zheng, H.; Liu, J.; Chen, Y.; Gao, J. Optimization of favorable areas for carbon dioxide geological storage in Majiagou Formation in Ordos Basin. Geol. Rev. 2021, 67, 816–827. [Google Scholar]
- Zhang, L.; Wen, R.; Geng, S.; Shi, X.; Hao, Y.; Ren, S. Mineral trapping of CO2 in basalt rock: Progress and key issues. J. Chem. Eng. Chin. Univ. 2022, 36, 173–480. [Google Scholar] [CrossRef]
- Liu, P.; Yang, W.; Zhang, J.; Sun, H.R.; Cui, Z.X. Prospects for emission reduction technologies under carbon neutral targets. Mod. Chem. Ind. 2021, 41, 6–10. [Google Scholar]
- Liao, Z.; Yang, J.; Zhong, X.; Liu, Y.; Zhang, J. Review on Research Progress of Carbon Dioxide Geological Sequestration Technology. Chin. J. Undergr. Space Eng. 2024, 20, 497–507. [Google Scholar]
- Han, G.; Zhang, M.; Bao, L. Thoughts on the technology development and standard construction of CCUS. China Acad. J. Electron. Publ. House 2013, 29, 28–31. [Google Scholar]
- Wang, S.; Tian, H.; Zhao, X.; Yan, Y.; Yang, X.; Wang, X. Assessment of the Geological Storage Potential and Suitability of CO2 in the Deep Saline Aquifers in the Northwest Plain of Shandong Province, China. Energies 2024, 17, 6387. [Google Scholar] [CrossRef]
- Li, F.; Zhang, Y.; Zhang, X.; Zheng, C.; Li, X.; Hu, L.; Peng, H. Suitability evaluation method of CO2 geological sequestration in deep saline aquifers. J. Glaciol. Geocryol. 2014, 36, 649–660. [Google Scholar]
- Bachu, S.; Adams, J.J. Sequestration of CO2 in geological media in response to climate change: Capacity of deep saline aquifers to sequester CO2 in solution. Energy Convers. Manag. 2003, 44, 3151–3175. [Google Scholar] [CrossRef]
- Shuklar, R.; Ranjith, P.; Haque, A.; Choi, X. A review of studies on CO2 sequestration and caprock integrity. Fuel 2010, 89, 2651–2664. [Google Scholar] [CrossRef]
- Zhang, H.; Wen, D.; Li, Y.; Zhang, J.Q.; Lu, J.C. Conditions for CO2 geological sequestration in China and some suggestions. Geol. Bull. China 2005, 24, 1107–1110. [Google Scholar]
- Gao, Z.; Xia, C.; Liao, S.; Yu, X.; Liu, M.; Li, P.; Liang, X.; Dai, Q.; Huang, X. Progress of Methods for Assessing CO2 Mineralization Storage Potential in Basaltn. Geol. J. China Univ. 2023, 29, 66–75. [Google Scholar]
- Liu, Y.; Liao, Z.; Ding, H.; Gan, Q.; Fang, H.; Luo, Y.; Chen, Q. Research progress on the CO2 mineralization mechanism and evolution of the physical properties of basalt. J. Chengdu Univ. Technol. (Sci. Technol. Ed.) 2024, 51, 975–988. [Google Scholar]
- Li, W.; Chen, J.; Jia, L.; Ma, B.; Chen, Y.; Sun, J. Research progress of CO2 geological sequestration in basaltsn. Geol. Rev. 2022, 68, 648–657. [Google Scholar]
- Gislason, S.R.; Sigurdardottir, H.; Aradottir, E.S.; Oelkers, E.H. A brief history of CarbFix: Challenges and victories of the project’s pilot phase. Carbon Nat. Eng. Process. 2018, 146, 103–114. [Google Scholar] [CrossRef]
- Schwartz, M. Can CO2 sequestration in basalt efficiently reduce greenhouse gas emission? Environ. Technol. 2020, 43, 1082–1092. [Google Scholar] [CrossRef]
- Ratouis, T.M.P.; Snaebjōrnsdóttir, S.; Voigt, M.; Sigfússon, B.; Gunnarsson, G.; Aradóttir, E.S.; Hjörleifsdóttir, V. Carbfix2: A transport model of long-term CO2 and H2S injection into basaltic rocks at Hellisheidi, SW-Iceland. Int. J. Greenh. Gas. Control 2022, 114, 103586. [Google Scholar] [CrossRef]
- Matter, J.M.; Kelemen, P.B. Permanent storage of carbon dioxide in geological reservoirs by mineral carbonation. Nat. Geosci. 2009, 2, 837–841. [Google Scholar] [CrossRef]
- Zhou, D.; Xia, C.; Li, P.; Liang, X. CO2 mineralization storage in basalt (II): Storage conditions, site selections and challenges on Leizhou Peninsula, Guangdong Province, South China. Earth Sci. 2025, 50, 569–584. [Google Scholar]
- McGrail, B.P.; Schaef, H.T.; Ho, A.M.; Chien, Y.; Dooley, J.J.; Davidson, C.L. Potential for Carbon Dioxide Sequestration in Flood Basalts. J. Geophys. Res. Solid Earth 2006, 111, B12201. [Google Scholar] [CrossRef]
- IEAGHG. Geological Storage of CO2 in Basalts. In IEA Greenhouse Gas R&D Programme 2011/TR2; IEAGHG: Cheltenham, UK, 2011; p. 18. [Google Scholar]
- IEAGHG. Review of CO2 Storage in Basalts. In IEA Greenhouse Gas R&D Programme 2017-TR2; IEAGHG: Cheltenham, UK, 2017; p. 27. [Google Scholar]
- Gislason, S.R.; Oelkers, E.H. Carbon Storage in Basalt. Science 2014, 344, 373–374. [Google Scholar] [CrossRef]
- Snæbjörnsdóttir, S.Ó.; Wiese, F.; Fridriksson, T.; Ármansson, H.; Einarsson, G.M.; Gislason, S.R. CO2 Storage Potential of Basaltic Rocks in Iceland and the Oceanic Ridges. Energy Procedia 2014, 63, 4585–4600. [Google Scholar] [CrossRef]
- Zhou, D.; Xia, C.; Li, P.; Liang, X. CO2 mineral storage in basalt (I): Technology and application conditions. Chin. J. Environ. Eng. 2024, 11, 2708–2718. [Google Scholar]
- Zhang, M.; Ye, H.; Bao, Q.; Liu, Q.; Jing, T.; Yuan, H.; Zhao, W.; Wang, X.; Xian, C. Review on key parameters and storage capacity potential assessment for in-situ carbon mineralization site. Chem. Ind. Eng. Prog. 2024, 43, 1492–1505. [Google Scholar]
- Wang, X.; Wu, B.; Shi, X.; Ye, Z.; Wei, B.; Wang, G.; A, V.; Huang, K.; Yang, Z. Advances and prospects of research on in situ CO2 mineralization storage in basalts. Coal Geol. Explor. 2026, 54, 247–263. [Google Scholar] [CrossRef]
- Qiu, T.; Zeng, L.; Shen, T. Progresses on carbon sequestration through carbonation of mafic-ultramafic rocks. Geol. Surv. China 2021, 8, 20–32. [Google Scholar]
- Snæbjörnsdóttir, S.Ó.; Sigfússon, B.; Marieni, C.; Goldberg, D.; Gislason, S.R.; Oelkers, E.H. Carbon dioxide storage through mineral carbonation. Nat. Rev. Earth Environ. 2020, 1, 90–102. [Google Scholar] [CrossRef]
- Turvey, C.C.; Wilson, S.; Hamilton, J.L.; Tait, A.W.; McCutcheon, J.; Beinlich, A.; Fallon, S.J.; Dipple, G.M.; Southam, G. Hydrotalcites and hydrated Mg-carbonates as carbon sinks in serpentinite mineral wastes from the Woodsreef chrysotile mine, New South Wales, Australia: Controls on carbonate mineralogy and efficiency of CO2 air capture in mine tailings. Int. J. Greenh. Gas. Control 2018, 79, 38–60. [Google Scholar] [CrossRef]
- Wang, C. Study on the mechanism of carbon dioxidewater-rock reaction solidification and sequestration. China Acad. D. Electron. Publ. House 2022. [Google Scholar]



| Serial Number | Identifier | Lithology | Length/cm | Diameter/cm | Permeability/mD | Porosity (%) |
|---|---|---|---|---|---|---|
| 1 | YX01 (V) | Porous basalt | 4.108 | 2.426 | 1.5979 | 15.61 |
| 2 | YX01 (H) | Porous basalt | 3.646 | 2.400 | 4.0904 | 19.90 |
| Basalt Type | Quartz Content (%) | Calcium Feldspar Content (%) | Calcite Content (%) | Pyroxene Content (%) | Pyrite Content (%) | Clay Mineral Content (%) |
|---|---|---|---|---|---|---|
| Porous basalt | 0.8 | 60 | 25.2 | 7.7 | 1.4 | 4.9 |
| Oxide content (%) | SiO2 | Fe2O3 | Al2O3 | CaO | K2O | Na2O |
| Porous basalt | 50.89 | 8.66 | 14.95 | 9.55 | 3.73 | 3.69 |
| Elemental mass percentage (wt%) | O | Si | C | Al | Ca | Na |
| Porous basalt | 45.5 | 20.7 | 12.1 | 12.0 | 5.3 | 3.3 |
| Serial Number | Identifier | Lithology | Length/cm | Diameter/cm | Permeability/mD | Porosity (%) |
|---|---|---|---|---|---|---|
| 1 | YX07 (V) | Massive olivine basalt | 4.812 | 2.422 | 1.4793 | 14.61 |
| 2 | YX07 (H) | Massive olivine basalt | 4.133 | 2.416 | 4.9148 | 12.95 |
| Basalt Type | Quartz Content (%) | Calcium Feldspar Content (%) | Calcite Content (%) | Pyroxene Content (%) | Pyrite Content (%) | Clay Mineral Content (%) |
|---|---|---|---|---|---|---|
| Massive olivine basalt | / | 88.5 | 2.0 | / | / | 9.5 |
| Oxide content (%) | SiO2 | Fe2O3 | Al2O3 | CaO | K2O | Na2O |
| Massive olivine basalt | 47.29 | 13.22 | 14.29 | 8.79 | 0.90 | 3.16 |
| Elemental mass percentage (wt%) | O | Si | C | Al | Ca | Na |
| Massive olivine basalt | 44.53 | 12.48 | 25.43 | 3.69 | 1.12 | 0.43 |
| Group Number | Serial Number | Basalt Type | Experimental Condition |
|---|---|---|---|
| 1 | 1 | Porous basalt | 26 °C, 5 MPa, pH 8, particle size range 60–65 mesh |
| 2 | 36 °C, 5 MPa, pH 8, particle size range 60–65 mesh | ||
| 3 | 46 °C, 5 MPa, pH 8, particle size range 60–65 mesh | ||
| 4 | 56 °C, 5 MPa, pH 8, particle size range 60–65 mesh | ||
| 5 | 66 °C, 5 MPa, pH 8, particle size range 60–65 mesh | ||
| 2 | 6 | Porous basalt | 26 °C, 5 MPa, pH 8, particle size range 60–65 mesh |
| 7 | 26 °C, 7 MPa, pH 8, particle size range 60–65 mesh | ||
| 8 | 26 °C, 9 MPa, pH 8, particle size range 60–65 mesh | ||
| 9 | 26 °C, 11 MPa, pH 8, particle size range 60–65 mesh | ||
| 10 | 26 °C, 13 MPa, pH 8, particle size range 60–65 mesh | ||
| 3 | 11 | Porous basalt | 26 °C, 5 MPa, pH 8, particle size range 16–18 mesh |
| 12 | 26 °C, 5 MPa, pH 8, particle size range 30–35 mesh | ||
| 13 | 26 °C, 5 MPa, pH 8, particle size range 60–65 mesh | ||
| 4 | 14 | Porous basalt | 26 °C, 5 MPa, pH 8, particle size range 60–65 mesh |
| 15 | Massive olivine basalt | 26 °C, 5 MPa, pH 8, particle size range 60–65 mesh |
| Instrument Name | Instrument Model | Test Content |
|---|---|---|
| X-ray fluorescence spectrometer (XRD) | Smart Lab SE X-ray diffractometer (Thermo Fisher Scientific Inc., Shanghai, China) | Granular composition of sample particles |
| Plasma emission spectrometer (XRF) | Thermo Fisher Scientific iCAP 7000 Series Plasma Emission Spectrometer (CIQTEK Co., Ltd., Hefei, China) | Component of sample particle oxide |
| Desk scanning electron microscope (SEM) | Cold Field Emission Scanning Electron Microscope JSM-6700F (JEOL Ltd., Tokyo, Japan) | Microstructure of sample particles |
| Energy spectrometer (EDX) | X-ray energy spectrometer (accessory for scanning electron microscopy) (JEOL Ltd., Tokyo, Japan) | Elemental composition of sample particles |
| Burette | Tianke glass (Tianjin Tianke Glass Instrument Manufacturing Co., Ltd., Tianjin, China) | Ca2+, Mg2+, CO32−, HCO3− Ion concentration |
| Ion chromatograph | ECo IC (Metrohm China Ltd., Beijing, China) | Cl−, SO42−, Ion concentration |
| Ultraviolet spectrophotometer | SPECORD5OPLUS (Analytik Jena AG, Beijing, China) | Fe3+, Fe2+ Ion concentration |
| Atomic absorption spectrophotometer | A3AFG-12 (Beijing Puxi General Instrument Co., Ltd., Beijing, China) | K+, Na+, Ion concentration |
| Inductively Coupled Plasma-Emission Mass Spectrometer | iCAP RQ (Thermo Fisher Scientific Inc., Shanghai, China) | Al3+ Ion concentration |
| PH meter | PHS-3C pH meter (INESA SCIENTIFIC INSTRUMENT CO., LTD., Shanghai, China) | PH of the solution |
| Specific Surface Area and Pore Size Analyzer | 3H-2000PS2 (BeiShiDe Instrument Technology (Beijing) Co., Ltd., Beijing, China) | Particle aperture size |
| Group Number | Serial Number | Reaction Medium | Experimental Condition |
|---|---|---|---|
| 1 | 1 | Purified water (Wahaha) | 26 °C, 5 Mpa |
| 2 | 36 °C, 5 Mpa | ||
| 3 | 46 °C, 5 Mpa | ||
| 4 | 56 °C, 5 Mpa | ||
| 5 | 66 °C, 5 Mpa | ||
| 2 | 1 | Purified water (Wahaha) | 26 °C, 5 Mpa |
| 2 | 26 °C, 7 Mpa | ||
| 3 | 26 °C, 9 Mpa | ||
| 4 | 26 °C, 11 Mpa | ||
| 5 | 26 °C, 13 Mpa |
| Temperature | Pressure | Mass (g) | Loss Amount | Loss Rate | |
|---|---|---|---|---|---|
| (°C) | (Mpa) | Before the Experiment | After the Experiment | (g) | (%) |
| 26 | 5 | 20.05 | 19.81 | 0.24 | 1.20 |
| 36 | 20.08 | 19.35 | 0.73 | 3.64 | |
| 46 | 20.06 | 19.4 | 0.66 | 3.29 | |
| 56 | 20.04 | 19.43 | 0.61 | 3.04 | |
| 66 | 20.01 | 19.41 | 0.6 | 3.00 | |
| Temperature | Quartz (%) | Anorthite (%) | Calcite (%) | Pyroxene (%) | Common Pyrite (%) | Clay Mineral (%) |
|---|---|---|---|---|---|---|
| Before the experiment | 0.8 | 60 | 25.2 | 7.7 | 1.4 | 4.9 |
| 26 °C | / | 78.8 | 6.7 | 5.4 | 2.5 | 6.6 |
| 36 °C | 0.8 | 80.3 | 4.3 | 5 | 3.7 | 5.9 |
| 46 °C | 0.8 | 82.3 | 4 | 4.1 | 2.4 | 6.4 |
| 56 °C | 0.8 | 74.2 | 4.4 | 11.1 | 1.8 | 7.7 |
| 66 °C | 1 | 65.7 | 20.4 | 5.6 | 1.9 | 5.4 |
| Temperature | SiO2 (%) | Fe2O3 (%) | Al2O3 (%) | CaO (%) | K2O (%) | MgO (%) | Na2O (%) | TiO2 (%) | P2O5 (%) | MnO (%) |
|---|---|---|---|---|---|---|---|---|---|---|
| Before the experiment | 50.89 | 8.66 | 14.95 | 9.55 | 3.73 | 1.85 | 3.69 | 1.32 | 0.6 | 0.11 |
| 26 °C | 56.95 | 7.57 | 19.2 | 5.24 | 3.6 | 1.45 | 3.5 | 1.31 | 0.6 | 0.05 |
| 36 °C | 56.49 | 7.32 | 18.95 | 4.73 | 3.48 | 1.37 | 3.38 | 1.27 | 0.6 | 0.04 |
| 46 °C | 53.33 | 7.65 | 19.54 | 5.34 | 3.61 | 1.49 | 3.57 | 1.32 | 0.62 | 0.05 |
| 56 °C | 52.74 | 7.79 | 20.16 | 5.31 | 3.69 | 1.48 | 3.66 | 1.35 | 0.61 | 0.05 |
| 66 °C | 51.65 | 7.78 | 17.87 | 8.46 | 3.84 | 1.76 | 3.84 | 1.41 | 0.66 | 0.1 |
| Temperature | O (%) | Si (%) | C (%) | Al (%) | Ca (%) | Na (%) | Fe (%) | K (%) | Mg (%) | Ti (%) | Mn (%) |
|---|---|---|---|---|---|---|---|---|---|---|---|
| Before the experiment | 45.5 | 20.7 | 12.1 | 12.0 | 5.3 | 3.3 | 0.6 | 0.4 | 0.3 | / | / |
| 26 °C | 55.74 | 8.81 | 24.8 | 2.80 | 2.38 | 1.35 | 1.02 | 0.10 | 2.85 | 0.14 | / |
| 36 °C | 38.62 | 21.95 | 18.93 | 10.08 | 4.96 | 3.18 | 1.32 | 0.65 | 0.32 | / | / |
| 46 °C | 50.76 | 28.36 | / | 10.26 | 0.44 | 4.47 | 0.27 | 5.10 | / | 0.34 | / |
| 56 °C | 50.2 | 16.9 | 17.3 | 4.1 | 0.9 | 1.0 | 3.0 | 1.3 | 5.3 | / | / |
| 66 °C | 53.1 | 0.3 | 19.9 | 0.2 | 25.7 | / | 0.3 | / | / | / | 0.5 |
| Analysis Project | 26 °C | 36 °C | 46 °C | 56 °C | 66 °C | |
|---|---|---|---|---|---|---|
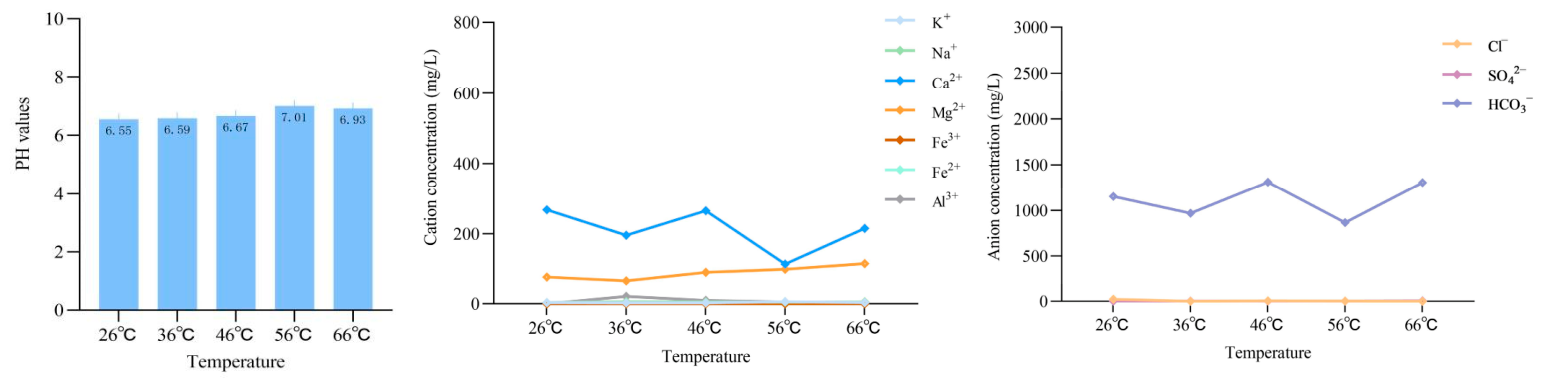
| Cation concentration (mg/L) | K+ | 3.66 | 3.15 | 3.25 | 6.18 | 3.47 |
| Na+ | 3.48 | 6.01 | 5.34 | 5.11 | 5.35 | |
| Ca2+ | 268.54 | 196.59 | 265.53 | 114.73 | 215.43 | |
| Mg2+ | 78.25 | 67.92 | 91.73 | 100.54 | 116.64 | |
| Fe3+ | <0.08 | <0.08 | <0.08 | <0.08 | <0.08 | |
| Fe2+ | <0.08 | <0.08 | <0.08 | <0.08 | <0.08 | |
| Al3+ | 0.04 | 21 | 9.50 | 5.58 | 0.01 | |
| anion concentration (mg/L) | Cl− | 23.88 | 1.8 | 7.26 | 3.74 | 0.93 |
| SO42− | 3.36 | 2.54 | 3.34 | 3.24 | 7.47 | |
| HCO3− | 1156.33 | 970.83 | 1313.46 | 869.54 | 1308.88 | |
| CO32− | / | / | / | / | / | |
| TDS | 959 | 763 | 1033 | 668 | 1004 | |
| PH value | 6.55 | 6.59 | 6.67 | 7.01 | 6.93 | |
| Temperature | Before the Experiment | 26 °C | 36 °C | 46 °C | 56 °C | 66 °C |
|---|---|---|---|---|---|---|
| Particle aperture size/nm | 24.6929 | 33.7079 | 37.5877 | 34.8477 | 33.5583 | 24.8513 |
| Temperature (°C) | Pressure (Mpa) | Mass (g) | Loss Amount (g) | Loss Rate (%) | |
|---|---|---|---|---|---|
| Before the Experiment | After the Experiment | ||||
| 26 | 5 | 20.05 | 19.81 | 0.24 | 0.01 |
| 7 | 20.07 | 19.79 | 0.28 | 0.01 | |
| 9 | 20.00 | 19.17 | 0.83 | 0.04 | |
| 11 | 19.98 | 19.00 | 0.98 | 0.05 | |
| 13 | 20.00 | 19.73 | 0.27 | 0.01 | |
| Pressure | Quartz (%) | Anorthite (%) | Calcite (%) | Pyroxene (%) | Common Pyrite (%) | Clay Mineral (%) |
|---|---|---|---|---|---|---|
| Before the Experiment | 0.8 | 60 | 25.2 | 7.7 | 1.4 | 4.9 |
| 5 Mpa | / | 78.8 | 6.7 | 5.4 | 2.5 | 6.6 |
| 7 Mpa | 1.8 | 79.6 | 5.1 | 5 | 2.2 | 6.3 |
| 9 Mpa | 0.7 | 80.3 | 7.1 | 4.7 | 2.5 | 4.7 |
| 11 Mpa | / | 91.4 | 4.5 | / | / | 4.1 |
| 13 Mpa | / | 92.4 | 1.6 | / | / | 6.0 |
| Pressure | SiO2 (%) | Fe2O3 (%) | Al2O3 (%) | CaO (%) | K2O (%) | MgO (%) | Na2O (%) | TiO2 (%) | P2O5 (%) | MnO (%) |
|---|---|---|---|---|---|---|---|---|---|---|
| Before the Experiment | 50.89 | 8.66 | 14.95 | 9.55 | 3.73 | 1.85 | 3.69 | 1.32 | 0.6 | 0.11 |
| 5 Mpa | 56.95 | 7.57 | 19.2 | 5.24 | 3.6 | 1.45 | 3.5 | 1.31 | 0.6 | 0.05 |
| 7 Mpa | 56.23 | 7.66 | 19.47 | 4.8 | 3.62 | 1.36 | 3.51 | 1.35 | 0.64 | 0.04 |
| 9 Mpa | 51.96 | 8.32 | 19.76 | 6.13 | 3.65 | 1.59 | 3.57 | 1.38 | 0.61 | 0.07 |
| 11 Mpa | 54.32 | 7.28 | 15.02 | 8.36 | 3.37 | 1.26 | 4.46 | 1.28 | 0.59 | 0.11 |
| 13 Mpa | 62.38 | 6.03 | 13.01 | 5.04 | 3.03 | 0.90 | 4.07 | 1.16 | 0.55 | 0.05 |
| Pressure | O (%) | Si (%) | C (%) | Al (%) | Ca (%) | Na (%) | Fe (%) | K (%) | Mg (%) | Ti (%) |
|---|---|---|---|---|---|---|---|---|---|---|
| Before the Experiment | 45.5 | 20.7 | 12.1 | 12.0 | 5.3 | 3.3 | 0.6 | 0.4 | 0.3 | / |
| 5 Mpa | 38.62 | 21.95 | 18.93 | 10.08 | 4.96 | 3.18 | 1.32 | / | 0.32 | / |
| 7 Mpa | 52.63 | 17.81 | 12.65 | 9.18 | 2.18 | 3.82 | 0.5 | 1.23 | / | / |
| 9 Mpa | 56.38 | 14.98 | 14.11 | 7.62 | 1.58 | 3.91 | 0.39 | 0.93 | / | 0.11 |
| 11 Mpa | 64.29 | 12.41 | 11.41 | 1.50 | 0.75 | / | 7.57 | 0.11 | 1.94 | / |
| 13 Mpa | 61.47 | 18.84 | / | 17.37 | 0.10 | / | 1.07 | 0.90 | 0.27 | / |
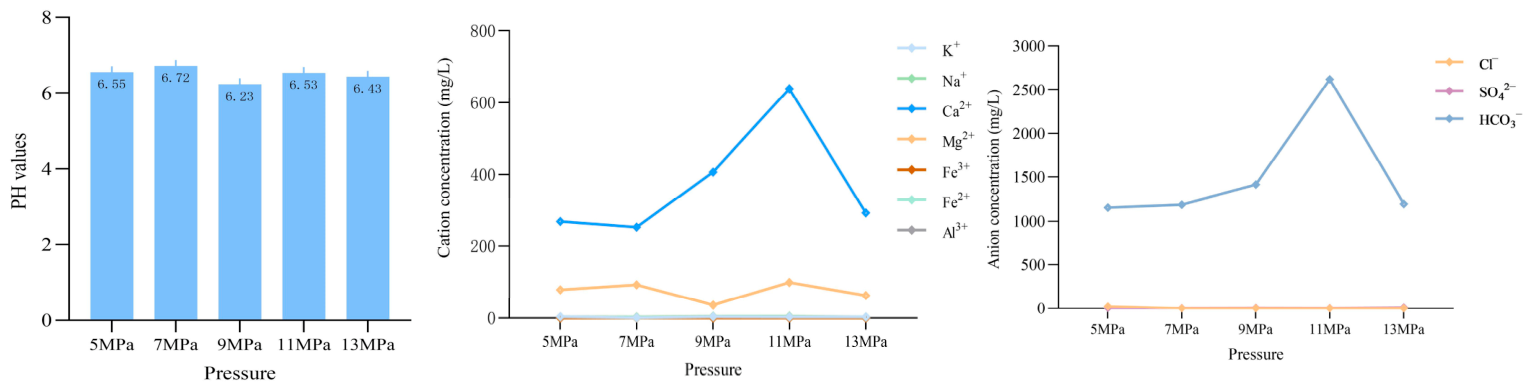
| Analysis Project | 5 Mpa | 7 Mpa | 9 Mpa | 11 Mpa | 13 Mpa | |
|---|---|---|---|---|---|---|
| Cation concentration (mg/L) | K+ | 3.66 | 0.68 | 3.36 | 3.06 | 3.26 |
| Na+ | 3.48 | 3.1 | 4.78 | 4.87 | 3.28 | |
| Ca2+ | 268.54 | 252.5 | 406.81 | 638.78 | 292.58 | |
| Mg2+ | 78.25 | 92.34 | 35.36 | 98.72 | 62.57 | |
| Fe3+ | <0.08 | <0.08 | <0.08 | <0.08 | <0.09 | |
| Fe2+ | <0.08 | <0.08 | <0.08 | <0.08 | <0.08 | |
| Al3+ | 0.04 | 0.04 | <0.01 | <0.01 | 0.04 | |
| anion concentration (mg/L) | Cl− | 23.88 | 1.3 | 1.18 | 2.36 | 1.58 |
| SO42− | 3.36 | 3.24 | 5.7 | 2.56 | 11.3 | |
| HCO3− | 1156.33 | 1188.64 | 1412.61 | 2623.86 | 1195.99 | |
| CO32− | / | / | / | / | / | |
| TDS | 959 | 956 | 1163 | 2062 | 973 | |
| pH value | 6.55 | 6.72 | 6.23 | 6.53 | 6.43 | |
| Pressure | Before the Experiment | 5 Mpa | 7 Mpa | 9 Mpa | 11 Mpa | 13 Mpa |
|---|---|---|---|---|---|---|
| Particle aperture size/nm | 24.6929 | 33.7079 | 34.6216 | 37.6706 | 39.4143 | 36.6208 |
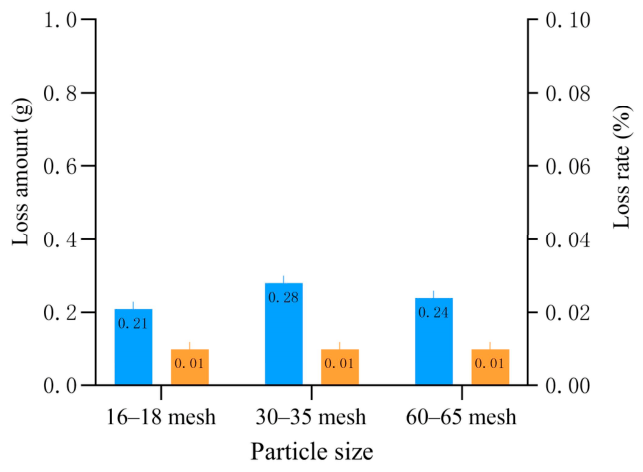
| Temperature (°C) | Pressure (Mpa) | Particle Size (Mesh) | Mass (g) | Loss Amount (g) | Loss Rate (%) | |
|---|---|---|---|---|---|---|
| Before the Experiment | After the Experiment | |||||
| 26 | 5 | 16–18 mesh (1–1.25mm) | 20.03 | 19.82 | 0.21 | 0.01 |
| 30–35 mesh (0.6–0.65mm) | 20.06 | 19.78 | 0.28 | 0.01 | ||
| 60–65 mesh (0.25–0.3mm) | 20.05 | 19.81 | 0.24 | 0.01 | ||
| Particle Size | Quartz (%) | Anorthite (%) | Calcite (%) | Pyroxene (%) | Common Pyrite (%) | Clay Mineral (%) |
|---|---|---|---|---|---|---|
| Before the experiment | 0.8 | 60 | 25.2 | 7.7 | 1.4 | 4.9 |
| 16–18 mesh | / | 81.9 | 3.6 | 5.8 | 2.5 | 6.2 |
| 30–35 mesh | / | 82.9 | 4.4 | 3.1 | 2.9 | 6.7 |
| 60–65 mesh | / | 78.8 | 6.7 | 5.4 | 2.5 | 6.6 |
| Particle Size | SiO2 (%) | Fe2O3 (%) | Al2O3 (%) | CaO (%) | K2O (%) | MgO (%) | Na2O (%) | TiO2 (%) | P2O5 (%) | MnO (%) |
|---|---|---|---|---|---|---|---|---|---|---|
| Before the experiment | 50.89 | 8.66 | 14.95 | 9.55 | 3.73 | 1.85 | 3.69 | 1.32 | 0.6 | 0.11 |
| 16–18 mesh | 56.59 | 7.53 | 19.14 | 4.41 | 3.48 | 1.39 | 3.43 | 1.33 | 0.6 | 0.04 |
| 30–35 mesh | 56.82 | 7.62 | 19.47 | 4.57 | 3.6 | 1.37 | 3.58 | 1.37 | 0.62 | 0.04 |
| 60–65 mesh | 56.95 | 7.57 | 19.2 | 5.24 | 3.6 | 1.45 | 3.5 | 1.31 | 0.6 | 0.05 |
| Particle Size | O (%) | Si (%) | C (%) | Al (%) | Ca (%) | Na (%) | Fe (%) | K (%) | Mg (%) | Ti (%) |
|---|---|---|---|---|---|---|---|---|---|---|
| Before the experiment | 45.5 | 20.7 | 12.1 | 12.0 | 5.3 | 3.3 | 0.6 | 0.4 | 0.3 | / |
| 16–18 mesh | 53.86 | 11.73 | 23.44 | 4.80 | 0.84 | 3.18 | 0.47 | 1.08 | 0.6 | |
| 30–35 mesh | 55.17 | 14.80 | 11.68 | 6.41 | 2.54 | 2.98 | 2.75 | 2.63 | 0.64 | 0.41 |
| 60–65 mesh | 55.74 | 8.81 | 24.8 | 2.80 | 2.38 | 1.35 | 1.02 | 0.10 | 2.85 | 0.14 |
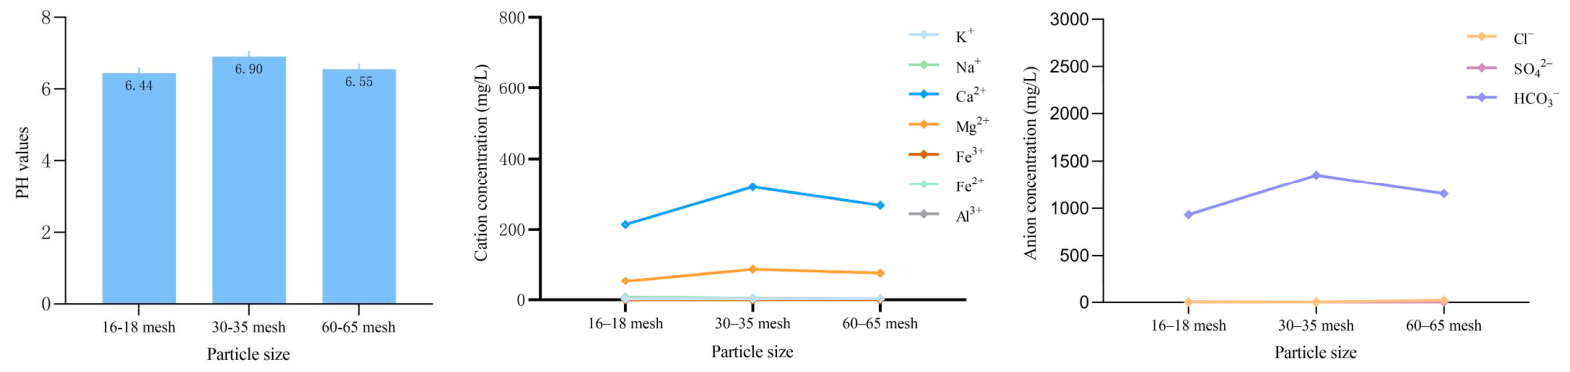
| Analysis Project | 16–18 Mesh (1–1.25 mm) | 30–35 Mesh (0.6–0.65 mm) | 60–65 Mesh (0.25–0.3 mm) | |
|---|---|---|---|---|
| Cation concentration (mg/L) | K+ | 2.89 | 3.02 | 3.66 |
| Na+ | 7.34 | 4.31 | 3.48 | |
| Ca2+ | 214.43 | 320.64 | 268.54 | |
| Mg2+ | 54.68 | 89.3 | 78.25 | |
| Fe3+ | <0.08 | <0.08 | <0.08 | |
| Fe2+ | <0.08 | <0.08 | <0.08 | |
| Al3+ | <0.01 | 0.02 | 0.04 | |
| anion concentration (mg/L) | Cl− | 4.1 | 2.88 | 23.88 |
| SO42− | 5.8 | 3.02 | 3.36 | |
| HCO3− | 933.61 | 1354.64 | 1156.33 | |
| CO32− | / | / | / | |
| TDS | 758 | 956 | 959 | |
| PH value | 6.44 | 6.9 | 6.55 | |
| Particle Size | Before the Experiment | 16–18 Mesh (1–1.25 mm) | 30–35 Mesh (0.6–0.65 mm) | 60–65 Mesh (0.25–0.3 mm) |
|---|---|---|---|---|
| Particle aperture size/nm | 24.6929 | 33.5079 | 37.3995 | 33.7079 |
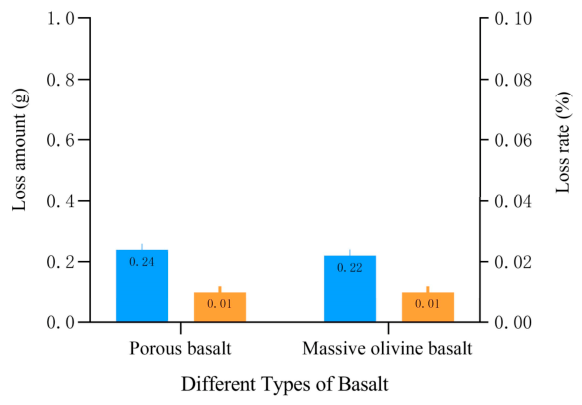
| Basalt Type / | Temperature (°) | Pressure (Mpa) | Mass (g) | Loss Amount (g) | Loss Rate (%) | |
|---|---|---|---|---|---|---|
| Before the Experiment | After the Experiment | |||||
| Porous basalt | 26 | 5 | 20.05 | 19.81 | 0.24 | 0.01 |
| Massive olivine basalt | 19.52 | 19.30 | 0.22 | 0.01 | ||
| Basalt Types | Quartz (%) | Anorthite (%) | Calcite (%) | Pyroxene (%) | Common Pyrite (%) | Clay Mineral (%) |
|---|---|---|---|---|---|---|
| Massive olivine basalt before the experiment | / | 88.5 | 2.0 | / | / | 9.5 |
| After the experiment with massive olivine basalt | / | 92.2 | 1.1 | / | / | 6.7 |
| Porous basalt before the experiment | 0.8 | 60 | 25.2 | 7.7 | 1.4 | 4.9 |
| After the experiment with porous basalt | / | 78.8 | 6.7 | 5.4 | 2.5 | 6.6 |
| Basalt Types | SiO2 (%) | Fe2O3 (%) | Al2O3 (%) | CaO (%) | K2O (%) | MgO (%) | Na2O (%) | TiO2 (%) | P2O5 (%) | MnO (%) |
|---|---|---|---|---|---|---|---|---|---|---|
| Before the experiment with massive olivine basalt | 47.29 | 13.22 | 14.29 | 8.79 | 0.90 | 7.27 | 3.16 | 1.60 | 0.21 | 0.15 |
| After the experiment with massive olivine basalt | 46.66 | 14.42 | 13.65 | 8.28 | 0.91 | 7.26 | 2.99 | 1.67 | 0.20 | 0.15 |
| Before the experiment with porous basalt | 50.89 | 8.66 | 14.95 | 9.55 | 3.73 | 1.85 | 3.69 | 1.32 | 0.6 | 0.11 |
| After the experiment with porous basalt | 56.95 | 7.57 | 19.2 | 5.24 | 3.6 | 1.45 | 3.5 | 1.31 | 0.6 | 0.05 |
| Basalt Types | O (%) | Si (%) | C (%) | Al (%) | Ca (%) | Na (%) | Fe (%) | K (%) | Mg (%) | Ti (%) |
|---|---|---|---|---|---|---|---|---|---|---|
| Massive olivine basalt before the experiment | 62.38 | 9.14 | 15.75 | 2.58 | 0.30 | / | 1.36 | / | 8.50 | / |
| After the experiment with massive olivine basalt | 57.48 | 13.18 | 12.27 | 3.48 | 0.39 | / | 3.50 | / | 9.70 | / |
| Porous basalt before the experiment | 45.5 | 20.7 | 12.1 | 12.0 | 5.3 | 3.3 | 0.6 | 0.4 | 0.3 | / |
| After the experiment with porous basalt | 55.74 | 8.81 | 24.8 | 2.80 | 2.38 | 1.35 | 1.02 | 0.10 | 2.85 | 0.14 |
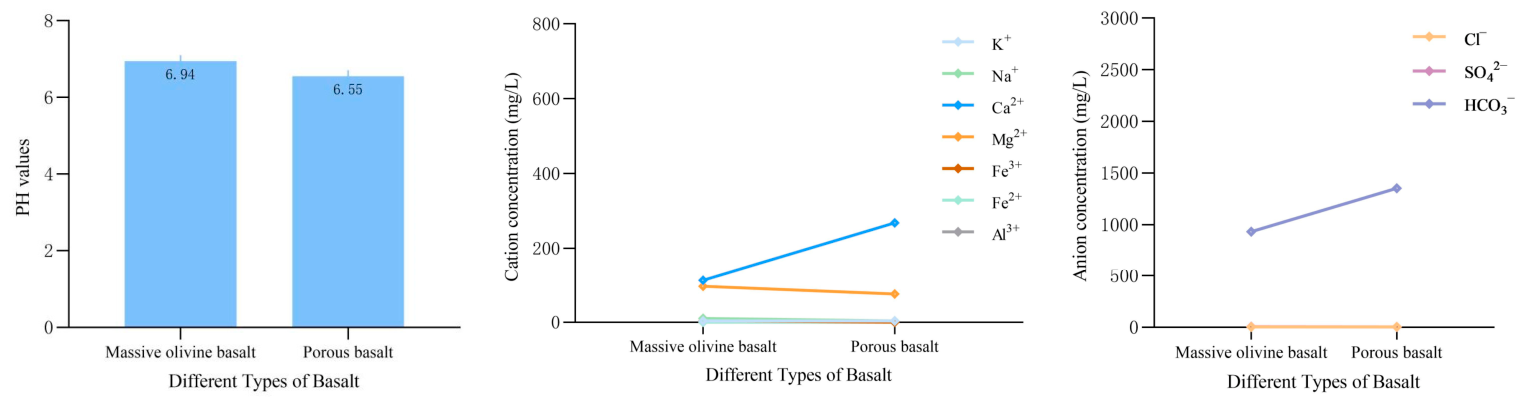
| Analysis Project | Porous Basalt | Massive Olivine Basalt | |
|---|---|---|---|
| Cation concentration (mg/L) | K+ | 3.39 | 3.66 |
| Na+ | 10.37 | 3.48 | |
| Ca2+ | 115.23 | 268.54 | |
| Mg2+ | 99.02 | 78.25 | |
| Fe3+ | 4.31 | <0.08 | |
| Fe2+ | 0.09 | <0.08 | |
| Al3+ | <0.01 | 0.04 | |
| Anion concentration (mg/L) | Cl− | 1.46 | 23.88 |
| SO42− | 6.53 | 3.36 | |
| HCO3− | 896.99 | 1156.33 | |
| CO32− | / | / | |
| TDS | 689 | 959 | |
| PH value | 6.94 | 6.55 | |
| Basalt Type | Massive Olivine Basalt Before the Experiment | After the Experiment with Massive Olivine Basalt | Porous Basalt Before the Experiment | After the Experiment with Porous Basalt |
|---|---|---|---|---|
| Particle aperture size/nm | 4.0616 | 4.2529 | 24.6929 | 33.5079 |
Disclaimer/Publisher’s Note: The statements, opinions and data contained in all publications are solely those of the individual author(s) and contributor(s) and not of MDPI and/or the editor(s). MDPI and/or the editor(s) disclaim responsibility for any injury to people or property resulting from any ideas, methods, instructions or products referred to in the content. |
© 2026 by the authors. Licensee MDPI, Basel, Switzerland. This article is an open access article distributed under the terms and conditions of the Creative Commons Attribution (CC BY) license.
Share and Cite
Wang, S.; Tian, H.; Liu, S.; Wang, X.; Liu, X.; Zhao, X. Experimental Study of the Effect of Different Influencing Factors on the Interaction of CO2, Water, and Basalt. Energies 2026, 19, 2591. https://doi.org/10.3390/en19112591
Wang S, Tian H, Liu S, Wang X, Liu X, Zhao X. Experimental Study of the Effect of Different Influencing Factors on the Interaction of CO2, Water, and Basalt. Energies. 2026; 19(11):2591. https://doi.org/10.3390/en19112591
Chicago/Turabian StyleWang, Shihao, Hailong Tian, Shuai Liu, Xuepeng Wang, Xueqiang Liu, and Xincun Zhao. 2026. "Experimental Study of the Effect of Different Influencing Factors on the Interaction of CO2, Water, and Basalt" Energies 19, no. 11: 2591. https://doi.org/10.3390/en19112591
APA StyleWang, S., Tian, H., Liu, S., Wang, X., Liu, X., & Zhao, X. (2026). Experimental Study of the Effect of Different Influencing Factors on the Interaction of CO2, Water, and Basalt. Energies, 19(11), 2591. https://doi.org/10.3390/en19112591