Article

A Complete Impedance-Based Characterization of a High-Frequency Transformer in Triple Active Bridge Converters for EV Onboard Chargers


by
Ali Arshad
,
Giuseppe Bossi
* and
Alfonso Damiano
Department of Electrical and Electronic Engineering, University of Cagliari, 09123 Cagliari, Italy
*
Author to whom correspondence should be addressed.
Energies 2026, 19(11), 2547; https://doi.org/10.3390/en19112547
Submission received: 24 March 2026 / Revised: 8 May 2026 / Accepted: 19 May 2026 / Published: 25 May 2026
(This article belongs to the Section F3: Power Electronics)

Abstract

This paper proposes an experimental methodology for the systematic determination of the equivalent circuit parameters of three winding high frequency transformers (3W-HFTs) for modeling the electrical behavior and the power losses of triple active bridge (TAB) power converters intended for onboard electric vehicle charging applications. For modeling the 3W-HFTs, a comprehensive lumped element equivalent circuit is adopted, and its electrical and electromagnetic parameters are determined through a structured sequence of open-circuit and short-circuit measurements performed over a wide frequency range from 20 Hz to 13 MHz using a precision impedance analyzer to thoroughly investigate impedance resonance behavior, while wide-bandgap power electronic devices are employed. The comparison between the lumped element impedance model and the measured impedance responses demonstrates strong agreement in terms of both magnitude and phase across the frequency range under study. Furthermore, the comparison of simulation results and experimental measurements performed on a TAB prototype under both open-circuit and load operating conditions validates the 3W-HFT electrical characteristics and the estimation of TAB’s power losses distribution. The close consistency between experimental results and simulation outcomes confirms the effectiveness of the proposed characterization approach.

1. Introduction

High-frequency transformers (HFTs) play a central role in multi active bridge (MAB) power conversion systems. In recent years, MAB-based architectures have attracted increasing attention due to their flexibility and suitability for emerging electrified applications, particularly onboard chargers (OBCs) for electric vehicles (EVs) and integrated multi-port power conversion systems [1,2]. In the context of triple active bridges (TAB), employing a single three-winding high-frequency transformer (3W-HFT) enables compact three-port converter realizations, thereby reducing component count and improving system level integration [3,4]. In these systems, the transformer does not necessarily operate as a tightly coupled magnetic device. Instead, a controlled amount of leakage inductance is intentionally retained to regulate power transfer and to facilitate soft-switching conditions. Consequently, the transformer must be modeled according to its actual electromagnetic behavior rather than assuming an ideally coupled structure [5,6]. Nevertheless, accurate modeling of 3W-HFT represents a challenging task. In TAB applications, parasitic capacitances in the transformer may cause high-frequency ringing phenomena, which can significantly affect switching transitions, converter efficiency, and electromagnetic compatibility. Therefore, the precise identification of leakage inductances and parasitic capacitances is essential for predicting current stress, dynamic behavior, and power transfer capability [7,8].
The lumped element equivalent circuit model, and especially the π lumped topology, is widely adopted for high frequency applications. By incorporating inter winding and winding-to-ground capacitances, it provides a tractable yet physically meaningful representation of the dominant electromagnetic effects, including leakage flux paths, magnetizing behavior, and electrostatic coupling mechanisms [8,9,10,11]. This approach enables the model to accurately reproduce the externally observable impedance behavior of the transformer under boundary conditions relevant to TAB converter operation, which is particularly suitable for converter-oriented analysis where the terminal electrical characteristics govern system performance [12]. The parameters of such equivalent circuit models can be identified using impedance-based characterization (IBC), which relies on frequency-domain measurements performed under open-circuit (IBC-OC) and short-circuit (IBC-SC) conditions. These measurements allow the dominant magnetic and electrical parameters to be extracted directly from terminal impedance responses without requiring detailed knowledge of the internal transformer geometry [11,13]. This aspect is particularly important in industrial practice, where transformers are often supplied as manufactured devices and detailed information regarding internal winding arrangements is typically unavailable. Since geometry-based analytical models or electromagnetic simulations cannot be readily implemented under these consitions, measurement-based identification techniques become essential, allowing accurate transformer models to be derived directly from externally measurable electrical quantities such as terminal voltages, currents, and impedance responses [14,15].
A wide frequency range is required for impedance measurements since the behavior of transformers cannot be captured accurately by measurements restricted to the converter’s switching frequency region. In fact, fast switching transitions generated by modern wide-bandgap devices, such as SiC-based bridges, together with small dead-time intervals and stray capacitances, excite ringing effects and high-frequency loss mechanisms that extend well into the MHz range in practical converters. In particular, under open-circuit conditions typical of IBC-OC, high-frequency resonance peaks arise from the interaction between the magnetizing inductance and the equivalent stray capacitance observed at the excited port. The stray capacitance does not correspond to a simple algebraic sum of physical capacitances but rather represents an effective quantity determined by nodal voltage division, displacement current return paths, and distributed electrostatic coupling. To reproduce this behavior in reduced-order models, capacitance partitioning techniques are commonly employed to map distributed electrostatic networks into physically consistent lumped capacitances [16,17]. In addition, the attenuation of resonance peaks observed in impedance measurements is governed by several loss mechanisms, including dielectric losses in insulation materials, skin and proximity effects in the windings, and frequency-dependent core losses [18,19]. In order to reproduce the measured damping behavior, an effective series resistance (ESR) is introduced in the stray capacitance branches of the equivalent circuit model. Under short-circuit conditions typical of IBC-SC, on the other hand, the magnetizing branch is effectively suppressed, thereby emphasizing leakage inductances, winding resistances, and inter-winding capacitive coupling paths. This measurement configuration provides leakage parameters that are representative of the actual electrical behavior of the multi-winding transformer under converter operating conditions. IBC measurements operate under low-voltage excitation conditions (LVEC), typically applying voltage levels of approximately 1 V or lower. Under these conditions, the transformer core operates within a limited region of the magnetization curve. As a result, the incremental magnetizing inductance can be considered approximately constant. Consequently, the magnetizing inductance extracted through impedance measurements corresponds to a small-signal parameter. Therefore, it may not fully represent the transformer behavior under practical converter operating conditions [20,21]. To address this limitation, time-domain measurements under realistic converter operating voltages are considered in tandem. In this case, the transformer is excited under high-voltage excitation conditions (HVEC). Under HVEC, the magnetic core is driven closer to its nominal flux density. This enables the observation of nonlinear magnetic phenomena, such as permeability variation and incipient saturation [20,22].
This work presents an impedance-based characterization methodology for an industrial 3W-HFT used in TAB converters for EV onboard charging applications. The proposed approach combines parameter identification under LVEC and HVEC. This combined approach enables consistent transformer characterization aligned with the actual converter behavior, enabling coherent extraction of leakage inductances, magnetizing parameters, and parasitic capacitances. Concurrently, TAB experimental and simulation results are compared and both electrical behavior and power losses distribution estimation are validated.
The main contributions of this paper can be summarized as follows: (i) the application of impedance-based characterization to a 3W-HFT specifically operating within a TAB converter, addressing converter-oriented modeling requirements; (ii) the combined use of low-voltage excitation conditions (LVEC) for parameter identification and high-voltage excitation conditions (HVEC) for large-signal compensation, enabling improved representation of the transformer under realistic operating conditions; (iii) the experimental validation of both electrical behavior and power-loss distribution, providing a comprehensive assessment of the model accuracy at the converter level. The remainder of the paper is organized as follows. Section 2 presents the transformer impedance modeling framework. Section 3 describes the impedance-based characterization and parameter identification methodology. Section 4 reports the experimental and simulation results obtained on a TAB prototype equipped with the investigated transformer along with power losses distribution estimation. Finally, Section 5 summarizes the main conclusions of the study.

2. Transformer Impedance Modeling

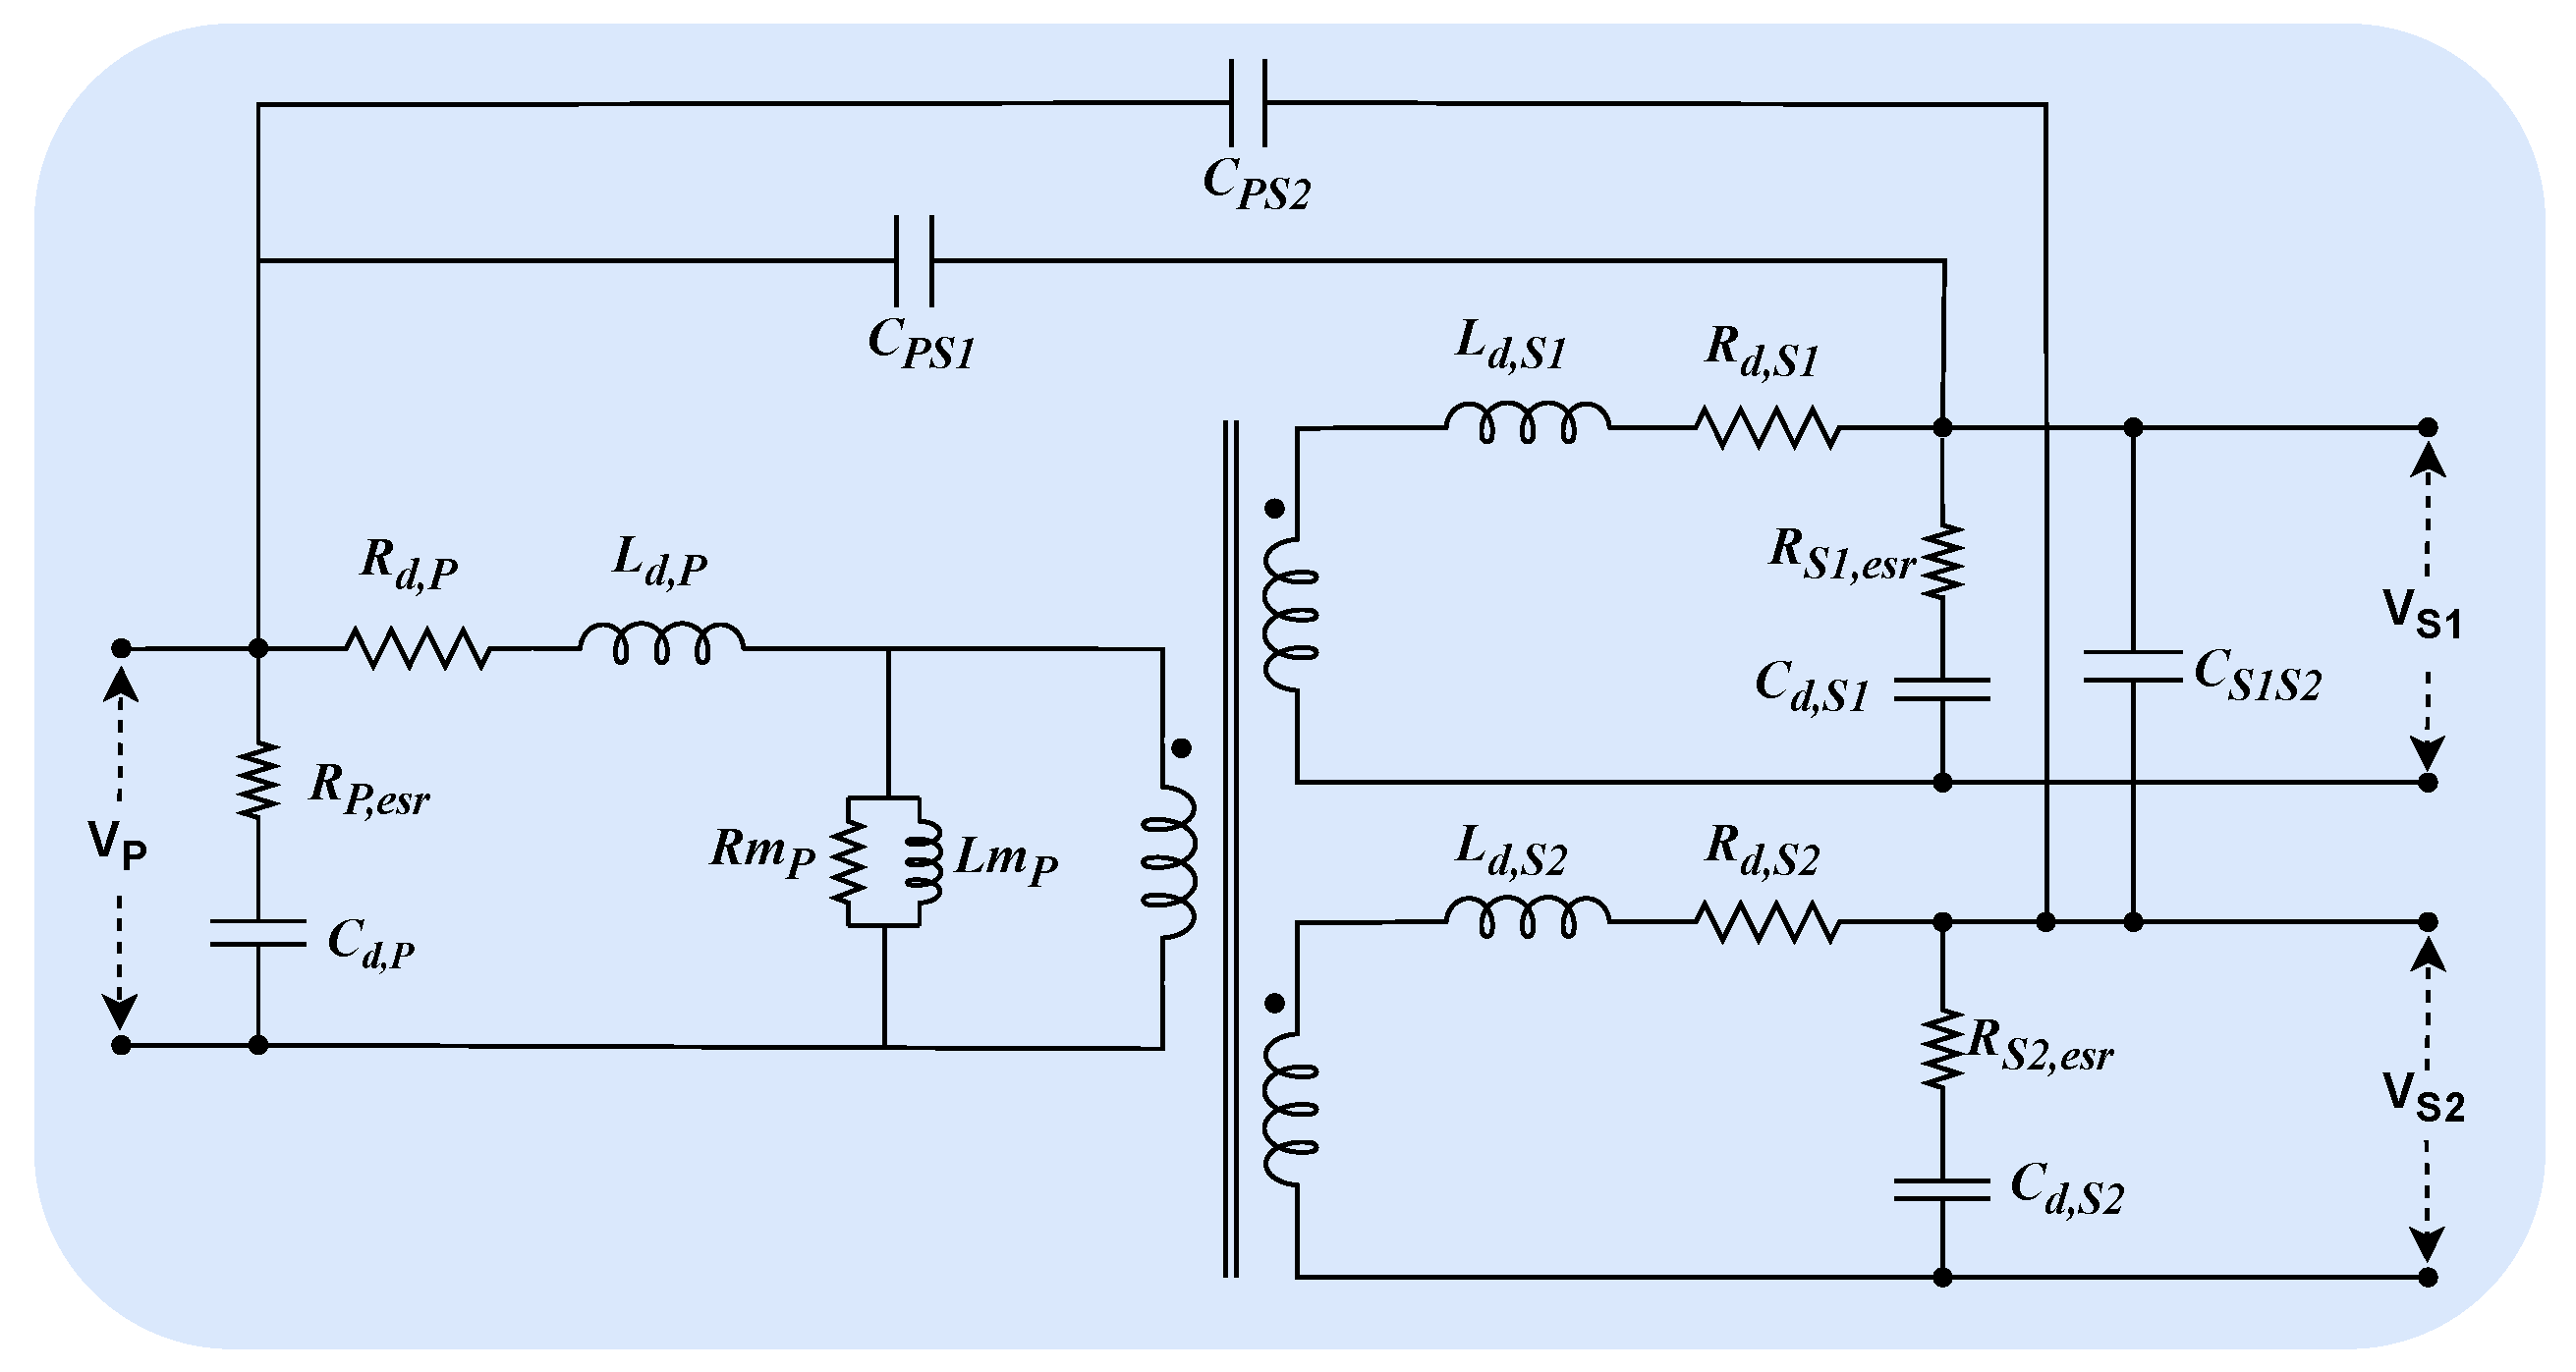
The lumped-element equivalent circuit π model of the 3W-HFT is illustrated in Figure 1. It consists of one primary port (P) and two secondary ports ( S 1 and S 2 ), characterized by the turns ratios n S 1 and n S 2 , respectively. The magnetizing branch, referred to the primary side, is represented by the magnetizing inductance L m , P in parallel with the core-loss resistance R m , P , which jointly describe magnetic energy storage and core-loss mechanisms within the transformer core.
Each winding is represented by a series leakage inductance L d , h and an ohmic resistance R d , h ( h = P , S 1 , S 2 ), which account for leakage flux paths and copper losses, respectively. Electrostatic effects are incorporated through winding-to-ground stray capacitances C d , h associated with each port, while capacitive coupling between windings is modeled through inter-winding capacitances C j , h ( j = P , S 1 , S 2 ; j h ).
From Figure 1 the equivalent impedance expressions corresponding to the IBC-OC and IBC-SC measurement configurations are derived.

2.1. Open-Circuit Impedance Modeling of the Transformer

The IBC-OC impedance characterization is performed by exciting one port of the 3W-HFT at a time under LVEC while keeping the remaining ports externally open. Under these boundary conditions, the measurement primarily reveals the magnetizing behavior of the transformer together with the influence of the stray capacitances associated with the windings. In this configuration, the current flowing through the excited port is mainly determined by the magnetizing branch and by the displacement currents associated with the transformer stray capacitances. As a result, the IBC-OC measurement provides direct information on the magnetizing inductance and on the equivalent capacitive network observed at the excited port.
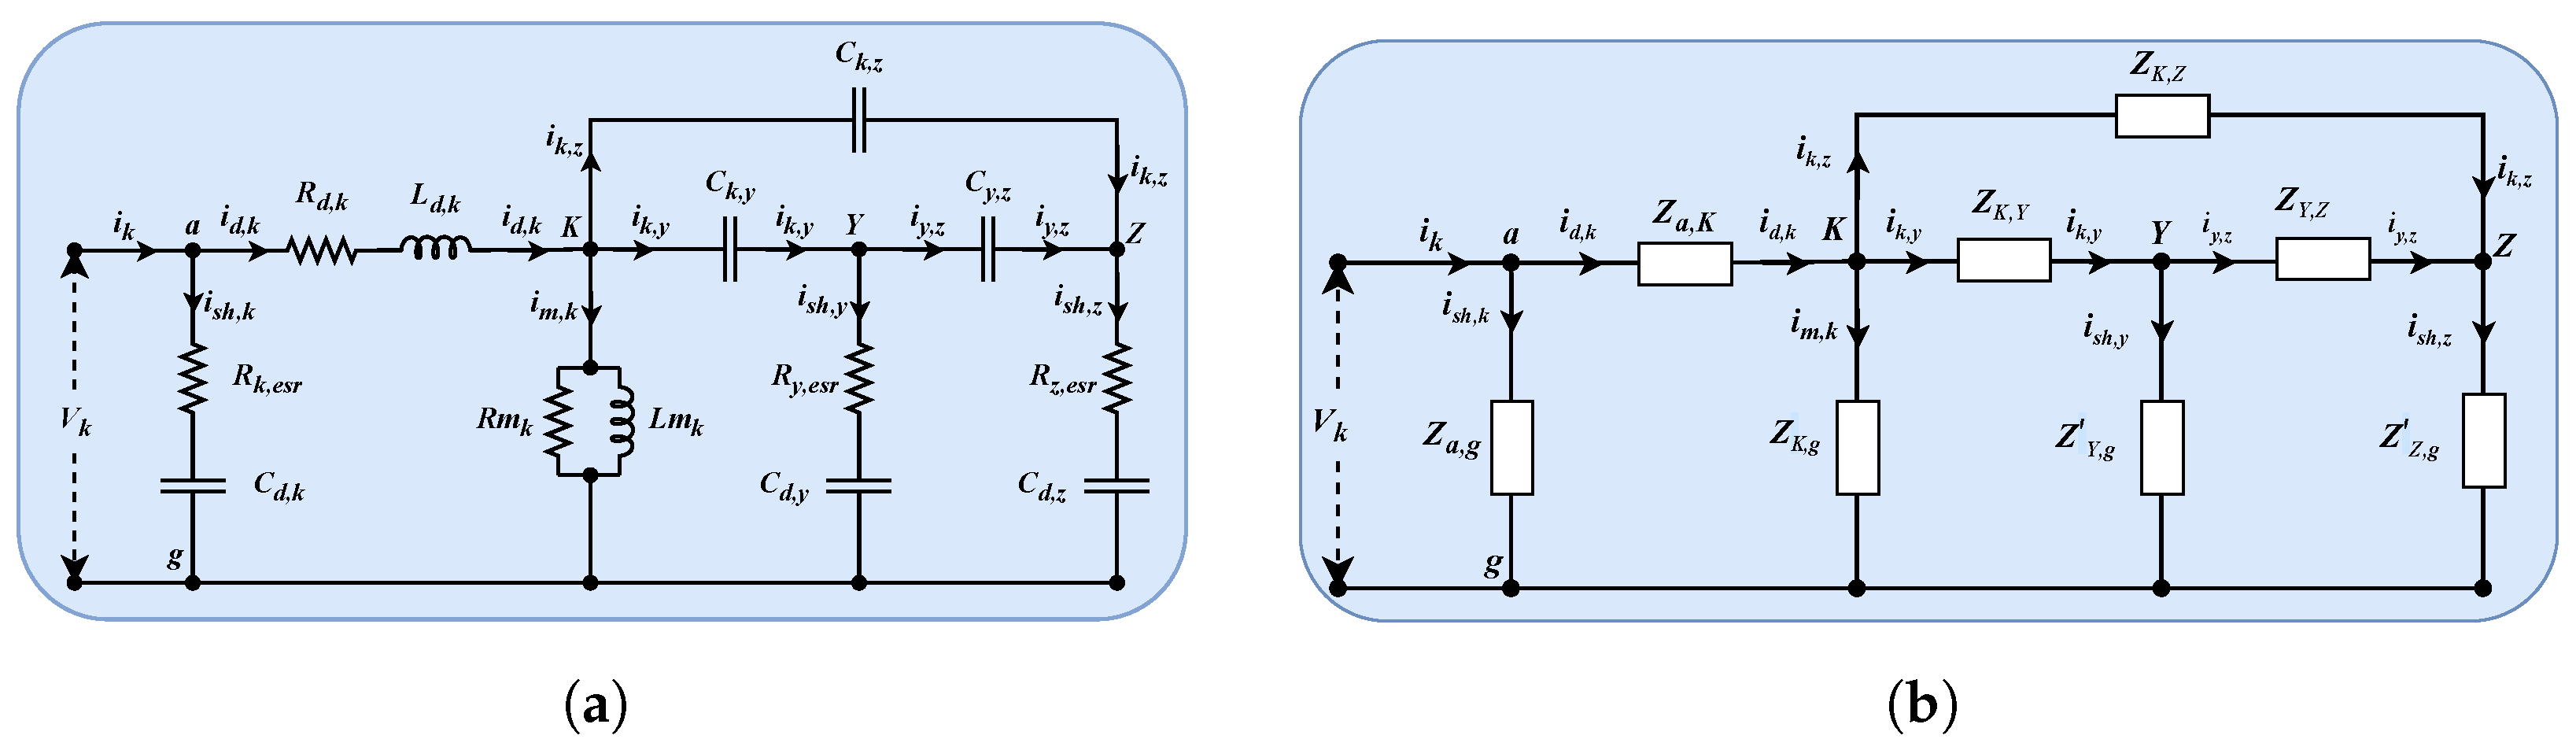
The lumped equivalent circuit assumed for the 3W-HFT is shown in Figure 2a, where the k-th port ( k = P , S 1 , S 2 ) is excited while the remaining ports are left open. The other two ports are denoted by y and z ( y , z = P , S 1 , S 2 ; y k , z ; z y , k ). The definition of the k-th port open-circuit admittance Y k , OC ( s ) is given by (1).
Y k , OC ( s ) = i k V k , k { P , S 1 , S 2 } .
The lumped elements referred to the k-th side are grouped into specific impedances as shown in Figure 2b. In particular, the following elements are identified: the series leakage impedance Z a , K ( s ) between nodes a and K (2); the port shunt parasitic impedance Z a , g ( s ) between terminal a and ground g (3); the magnetizing impedance between node K and ground g, Z K , g ( s ) (4); the y and z shunt parasitic impedances Z Y , g ( s ) (5) and Z Z , g ( s ) referred to the k-th side (6); and the inter-winding electrostatic coupling impedances Z K , Y ( s ) (7), Z K , Z ( s ) (8) and Z Y , Z ( s ) (9).
Z a , K ( s ) = R d , k + s L d , k
Z a , g ( s ) = 1 + s R k , esr C d , k s C d , k
Z K , g ( s ) = R m , k + s L m , k s R m , k L m , k
Z Y , g ( s ) = 1 + s R y , esr C d , y s C d , y
Z Z , g ( s ) = 1 + s R z , esr C d , z s C d , z
Z K , Y ( s ) = 1 s C k , y
Z K , Z ( s ) = 1 s C k , z
Z Y , Z ( s ) = 1 s C y , z
In order to identify Y k , OC ( s ) , the current i k must be determined. Applying Kirchhoff’s current law (KCL) to the nodes K, Y, and Z yields (10).
i d , k + i m , k + i k , y + i k , z = 0 i y , k + i s h , y + i y , z = 0 i z , k + i s h , z + i z , y = 0
By assuming node g at zero potential (i.e., V ˜ g = 0 ), the current contributions referred to nodes K, Y, and Z are expressed in (11), (12), and (13), respectively.
i d , k = ( V ˜ K V ˜ a ) Y a , K ( s ) i m , k = V ˜ K Y k , g ( s ) i k , y = ( V ˜ K V ˜ Y ) Y K , Y ( s ) i k , z = ( V ˜ K V ˜ Z ) Y K , Z ( s )
i y , k = ( V ˜ Y V ˜ K ) Y K , Y ( s ) i s h , y = V ˜ Y Y y , g ( s ) i y , z = ( V ˜ Y V ˜ Z ) Y Y , Z ( s )
i z , k = ( V ˜ Z V ˜ K ) Y K , Z ( s ) i s h , z = V ˜ Z Y z , g ( s ) i z , y = ( V ˜ Z V ˜ Y ) Y Y , Z ( s )
where V ˜ denotes the potential value at the corresponding node. By substituting (11)–(13) into (10) and rearranging the resulting expressions, the nodal admittance matrix associated with the excited port k, denoted as A k ( s ) , can be obtained. Therefore, (10) can be rewritten in a compact matrix form as
A k ( s ) V K V Y V Z = Y a , K V a 0 0 .
The matrix A k ( s ) is defined element-wise as
A k ( s ) = a 11 a 12 a 13 a 21 a 22 a 23 a 31 a 32 a 33 ,
with the coefficients given by
a 11 = Y a , K + Y K , Y + Y K , Z + Y K , g ; a 12 = Y K , Y ; a 13 = Y K , Z ; a 21 = Y K , Y ; a 22 = Y K , Y + Y Y , g + Y Y , Z ; a 23 = Y Y , Z ; a 31 = Y K , Z ; a 32 = Y Y , Z ; a 33 = Y K , Z + Y Z , g + Y Y , Z .
The evaluation of V ˜ K from (14) with respect to V ˜ Y and V ˜ Z allows the equivalent circuit between node K and ground to be simplified. Therefore, the current i k can be obtained by applying Kirchhoff’s current law to node a in Figure 2. The resulting expression is given in (17)
i k = ( V ˜ a V ˜ K ) Y a , K + V ˜ a Y a , g .
Under the hypothesis V ˜ a = 1 V in LVEC and substituting (17) into (1), the open-circuit admittance becomes
Y k , OC ( s ) = 1 V ˜ K Y a , K ( s ) + Y a , g ( s ) ,
where V ˜ K is obtained from (14).

2.2. Short-Circuit Impedance Modeling of the Three-Winding Transformer

The IBC-SC impedance characterization is performed by exciting one winding of the 3W-HFT while externally shorting one of the remaining windings. Under this boundary condition, the magnetizing branch can be neglected due to the low-impedance path imposed by the shorted winding. Consequently, the measured impedance response is mainly governed by leakage-related impedances together with the electrostatic couplings among the windings. This configuration is therefore suitable for identifying the leakage inductances, winding resistances, and inter-winding capacitive couplings that dominate the transformer behavior when the magnetizing branch is effectively bypassed.
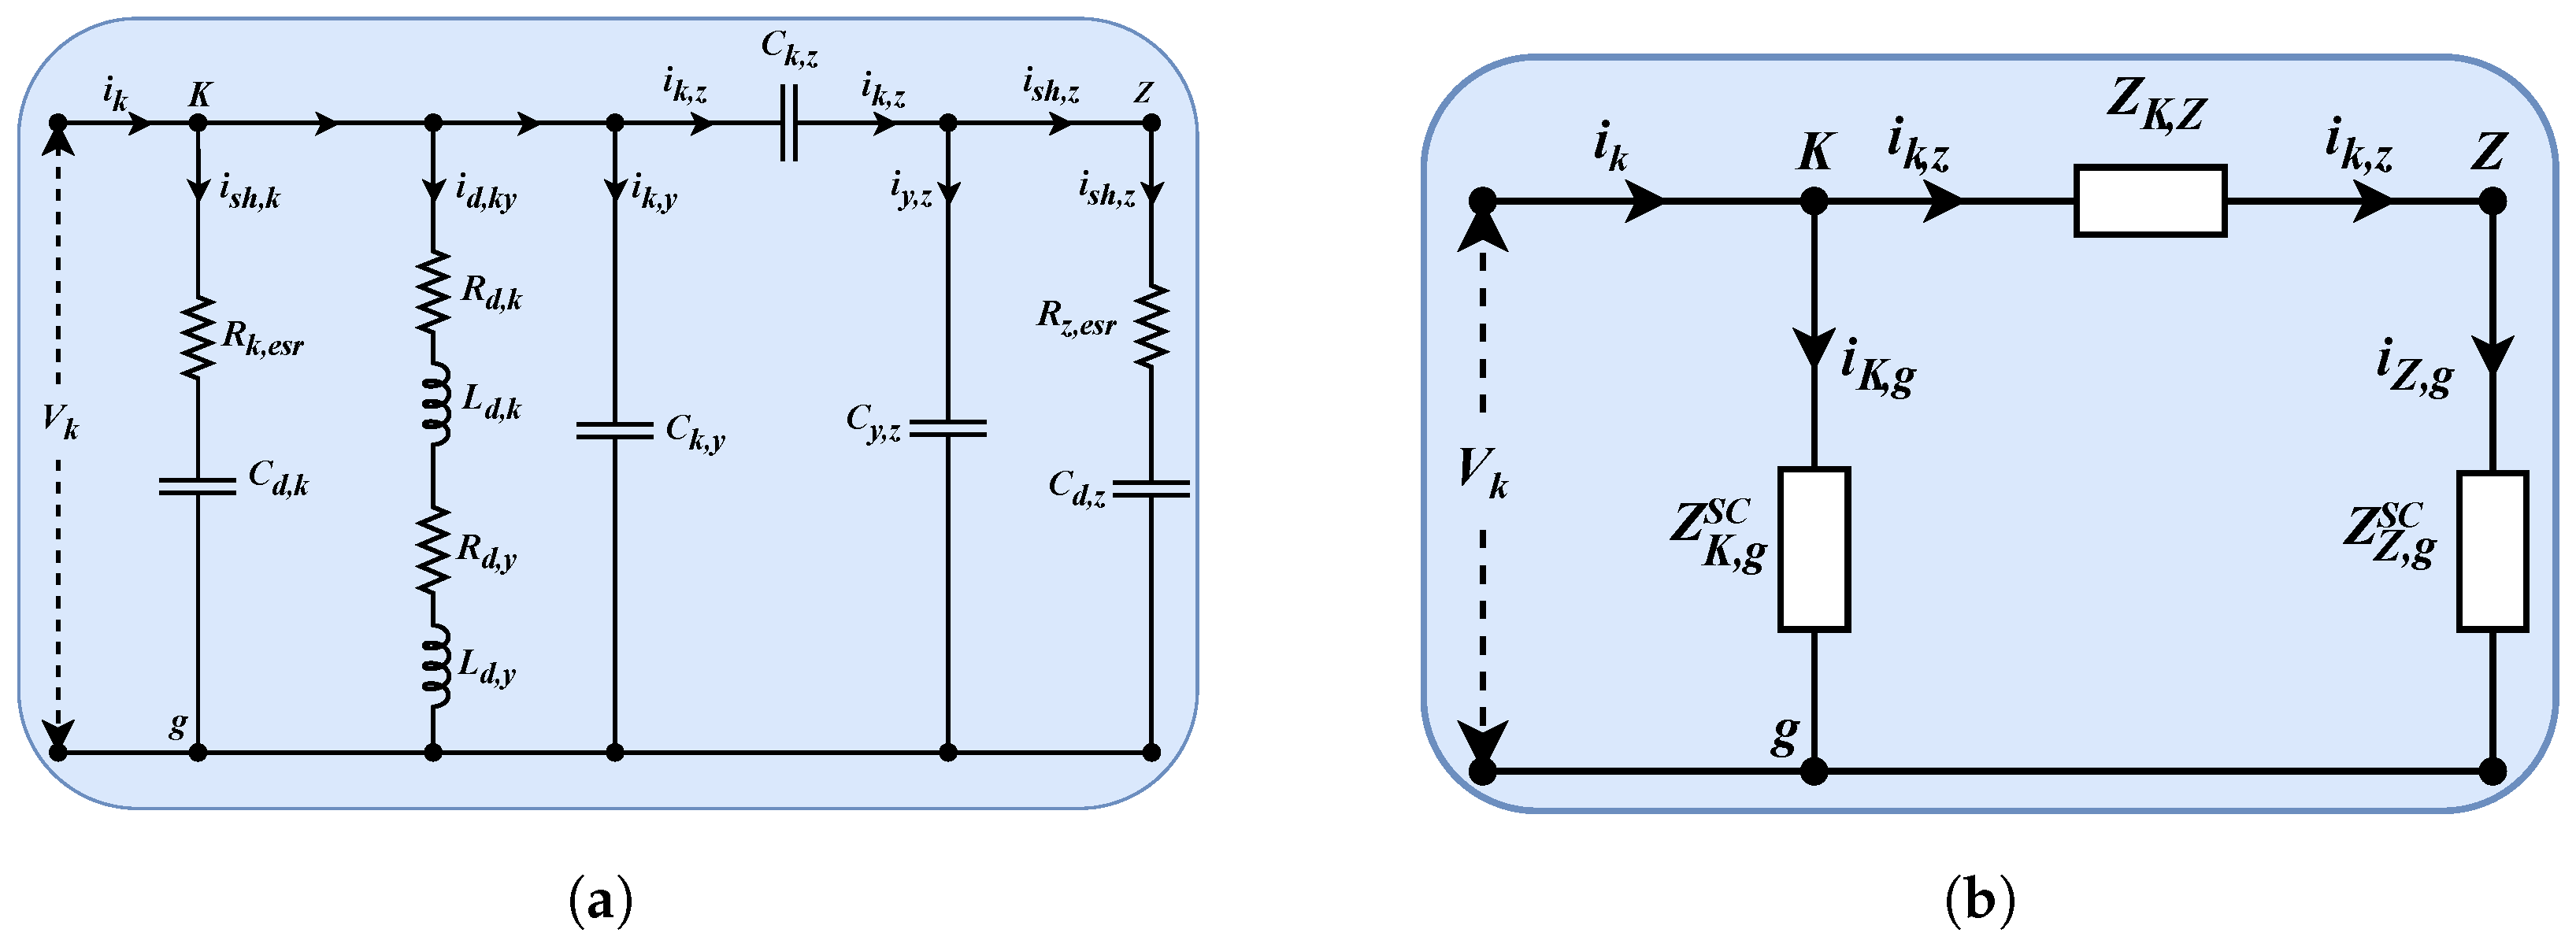
Figure 3a shows the generalized lumped-element equivalent circuit adopted for the IBC-SC analysis. In particular, the k-th port is excited under LVEC, while winding y is externally shorted and winding z remains open. The resulting equivalent network highlights the leakage inductances, winding resistances, and inter-winding capacitances governing the transformer impedance response under short-circuit conditions. Under this boundary condition, the elements connected to the shorted winding are collapse to ground, allowing the generalized circuit to be reduced to the simplified impedance network shown in Figure 3b. The corresponding impedance formulations are given in (19) to (20).
Y K , g S C ( s ) = 1 Z a , g ( s ) + 1 Z a , k y ( s ) + 1 Z K , Y ( s ) ,
Y Z , g S C ( s ) = 1 Z Y , Z ( s ) + 1 Z Z , g ( s ) ,
where Z a , k y ( s ) is defined as
Z a , k y ( s ) = R d , k + R d , y + s L d , k + L d , y .
The IBC-SC impedance is obtained by determining the current i k . The application of nodal analysis to nodes Z and K leads to the following expression
i k = V ˜ K Y Z , g S C ( s ) + Y K , Z ( s ) Y K , Z 2 ( s ) Y K , Z ( s ) + Y Z , g S C ( s ) ,
and the corresponding short-circuit admittance becomes
Y k , SC ( s ) = Y Z , g S C ( s ) + Y K , Z ( s ) Y K , Z 2 ( s ) Y K , Z ( s ) + Y Z , g S C ( s ) .
These analytical expressions establish a direct relationship between the measured short-circuit impedance response and the parameters of the equivalent circuit, enabling the extraction of physically meaningful leakage and coupling parameters from the IBC-SC measurements. It should be noted that the short-circuit modeling assumption neglecting the magnetizing branch is valid primarily in the operative frequency region of the 3W-HFT, where the leakage impedance dominates due to the low-impedance path created by the shorted winding. Far beyond operative frequencies, parasitic capacity effects and inter-winding coupling could affect the modelling. Therefore, the proposed modeling represents a first order approximation. The validity of this assumption is enforced by the MAB design criteria that requires the use of a multi-winding high-frequency transformer that is characterised by leakage inductances negligible with respect to the magnetising one.

3. Impedance-Based Characterisation (IBC)

The impedance-based characterisation (IBC) is employed to identify the magnetizing inductance and the dominant parasitic elements of the investigated 3W-HFT by combining laboratory measurements and frequency-domain analysis. The transformer under test operates at a rated switching frequency of 25 kHz and comprises two secondary windings with turns ratios of 1:0.5 and 1:0.25, denoted as S 1 and S 2 , respectively. The prototype is designed for an input voltage of 700 V and a total power rating of 20 kW, equally shared between the two secondary ports, i.e., 10 kW per port.
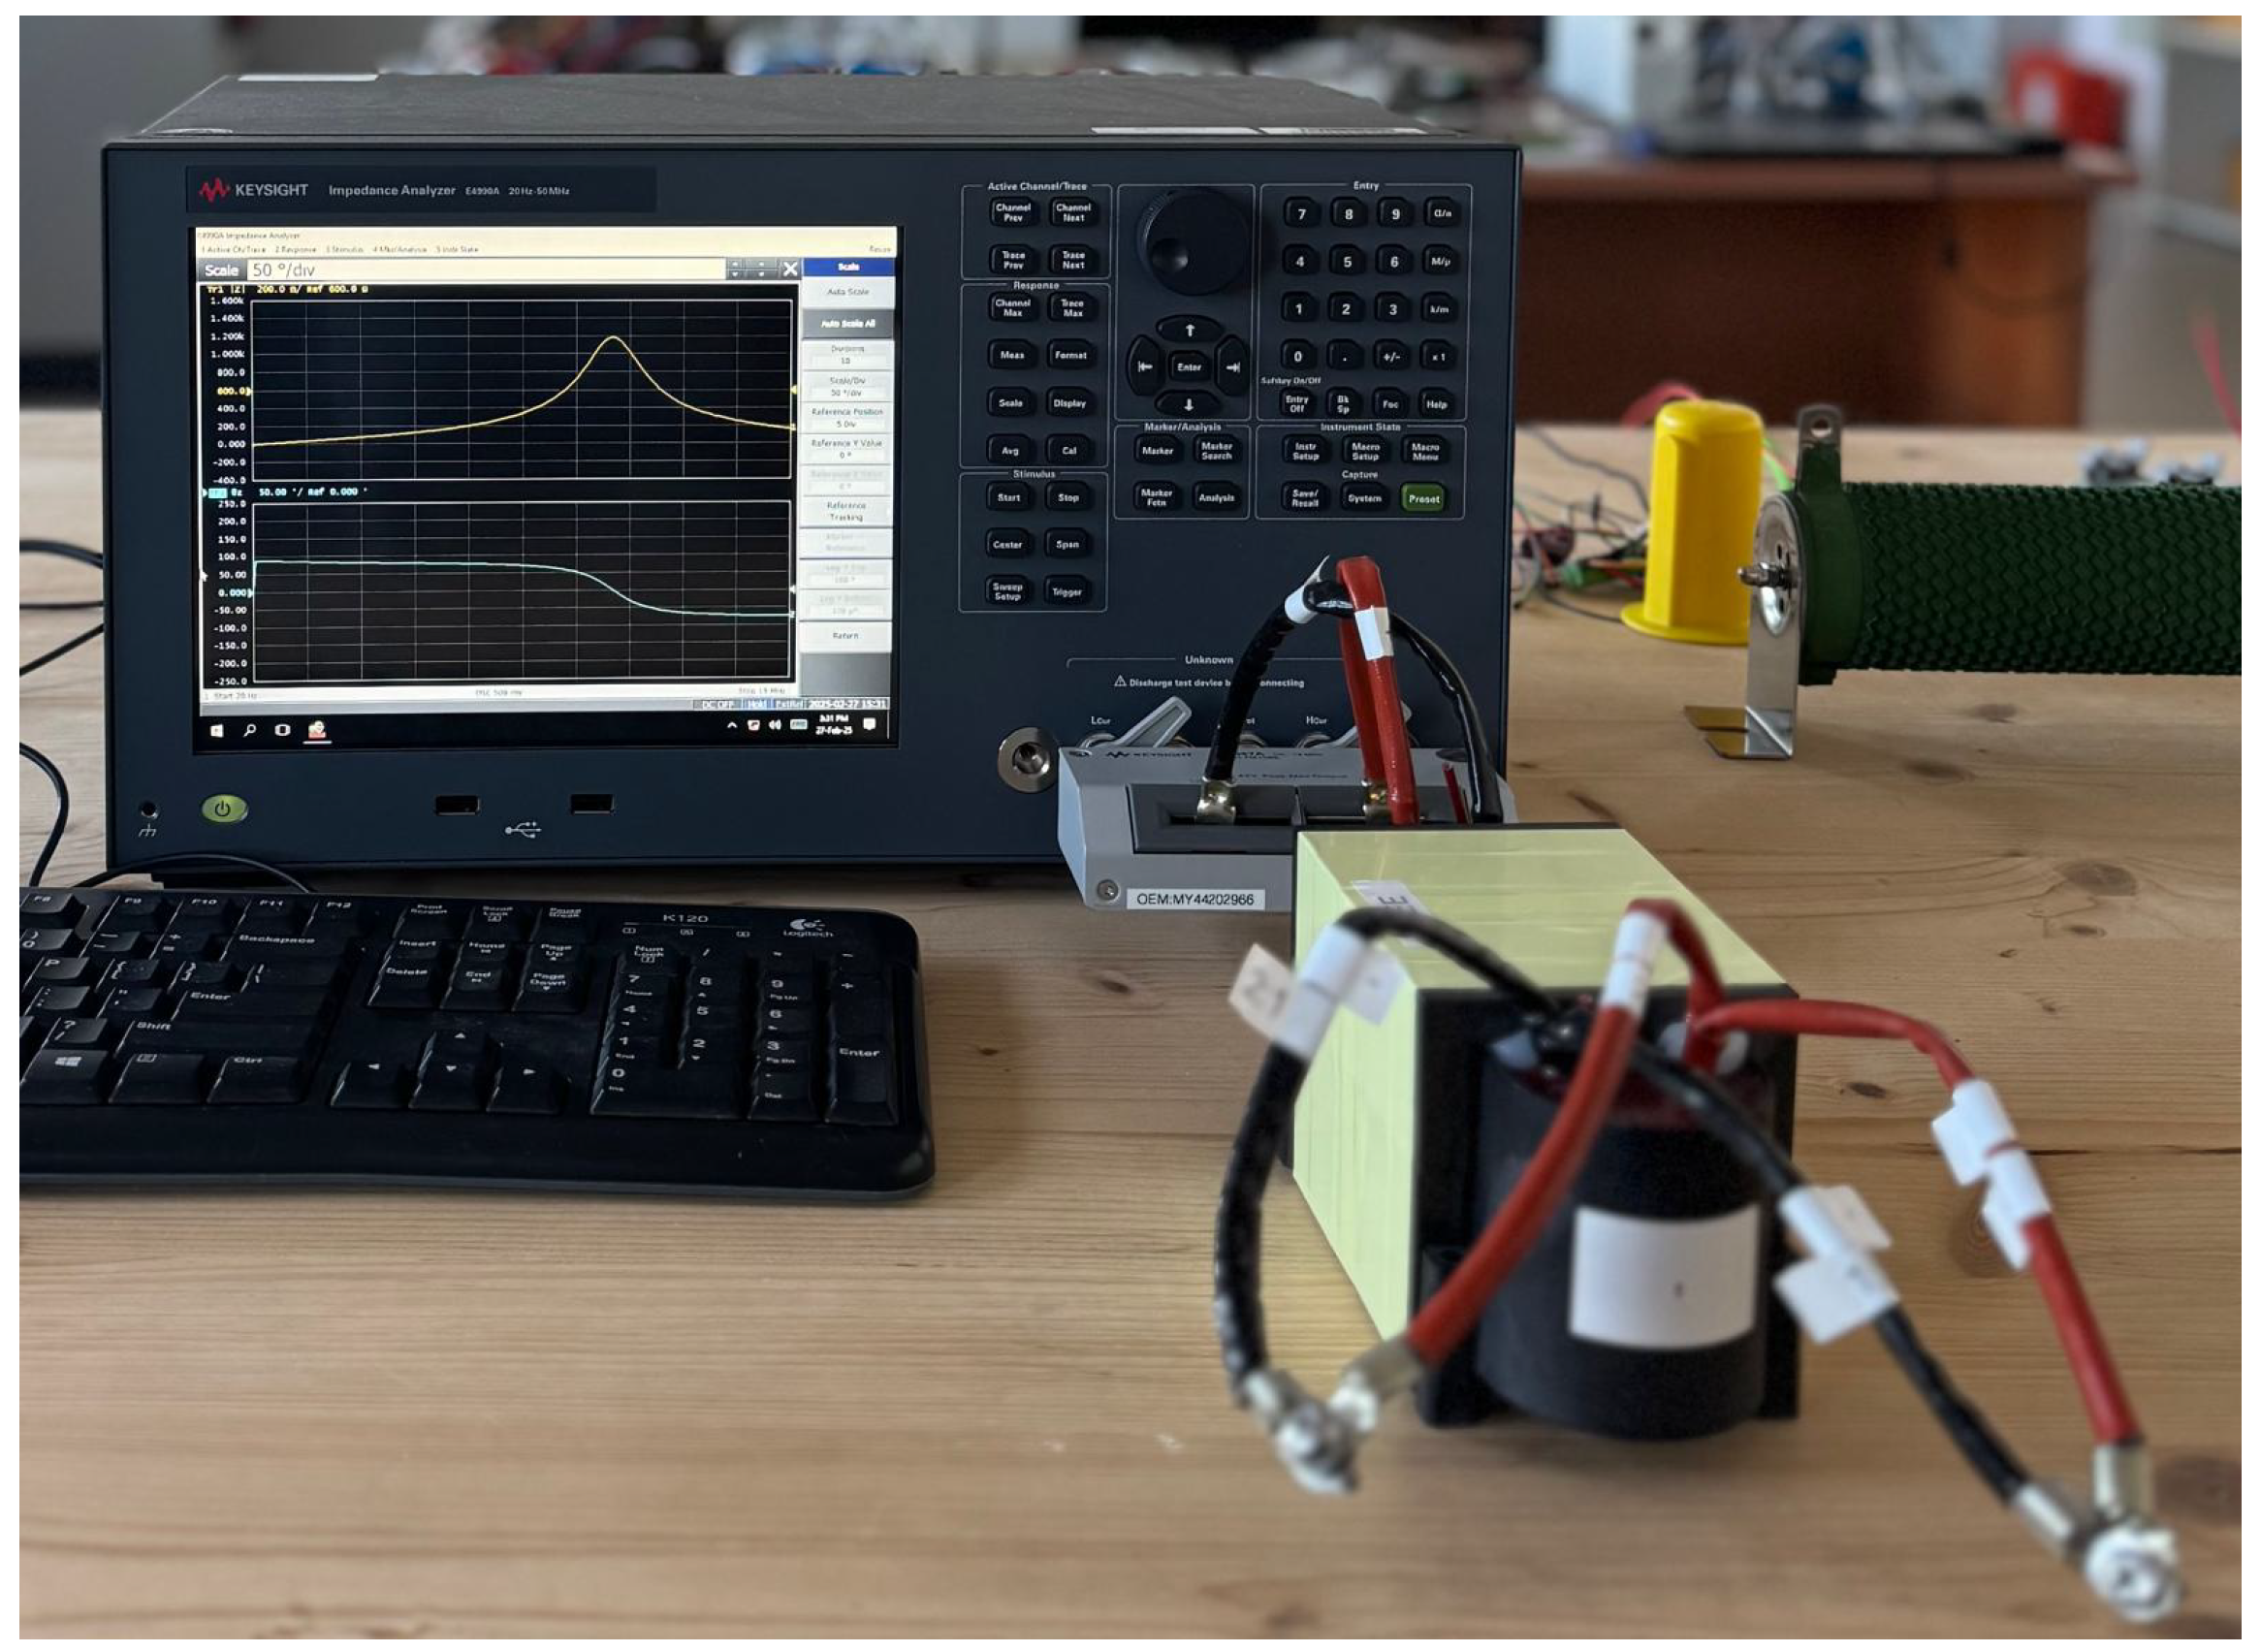
The Keysight E4990A precision impedance analyzer, shown in Figure 4, is employed to perform impedance measurements over a wide frequency range from 20 Hz to 13 MHz. All measurements are performed under LVEC, using an excitation voltage of approximately 1 V. Prior to the measurements, the analyzer is calibrated using standard open/short/load compensation procedures in order to ensure measurement accuracy and repeatability.
The transformer parameters obtained through the proposed IBC procedure are summarized in Table 1. In the following subsections, the extraction procedure is described extensively and the resulting parameters are validated through comparison between modeled and measured open-circuit and short-circuit impedances.

3.1. Open-Circuit Impedance-Based Characterization (IBC-OC)

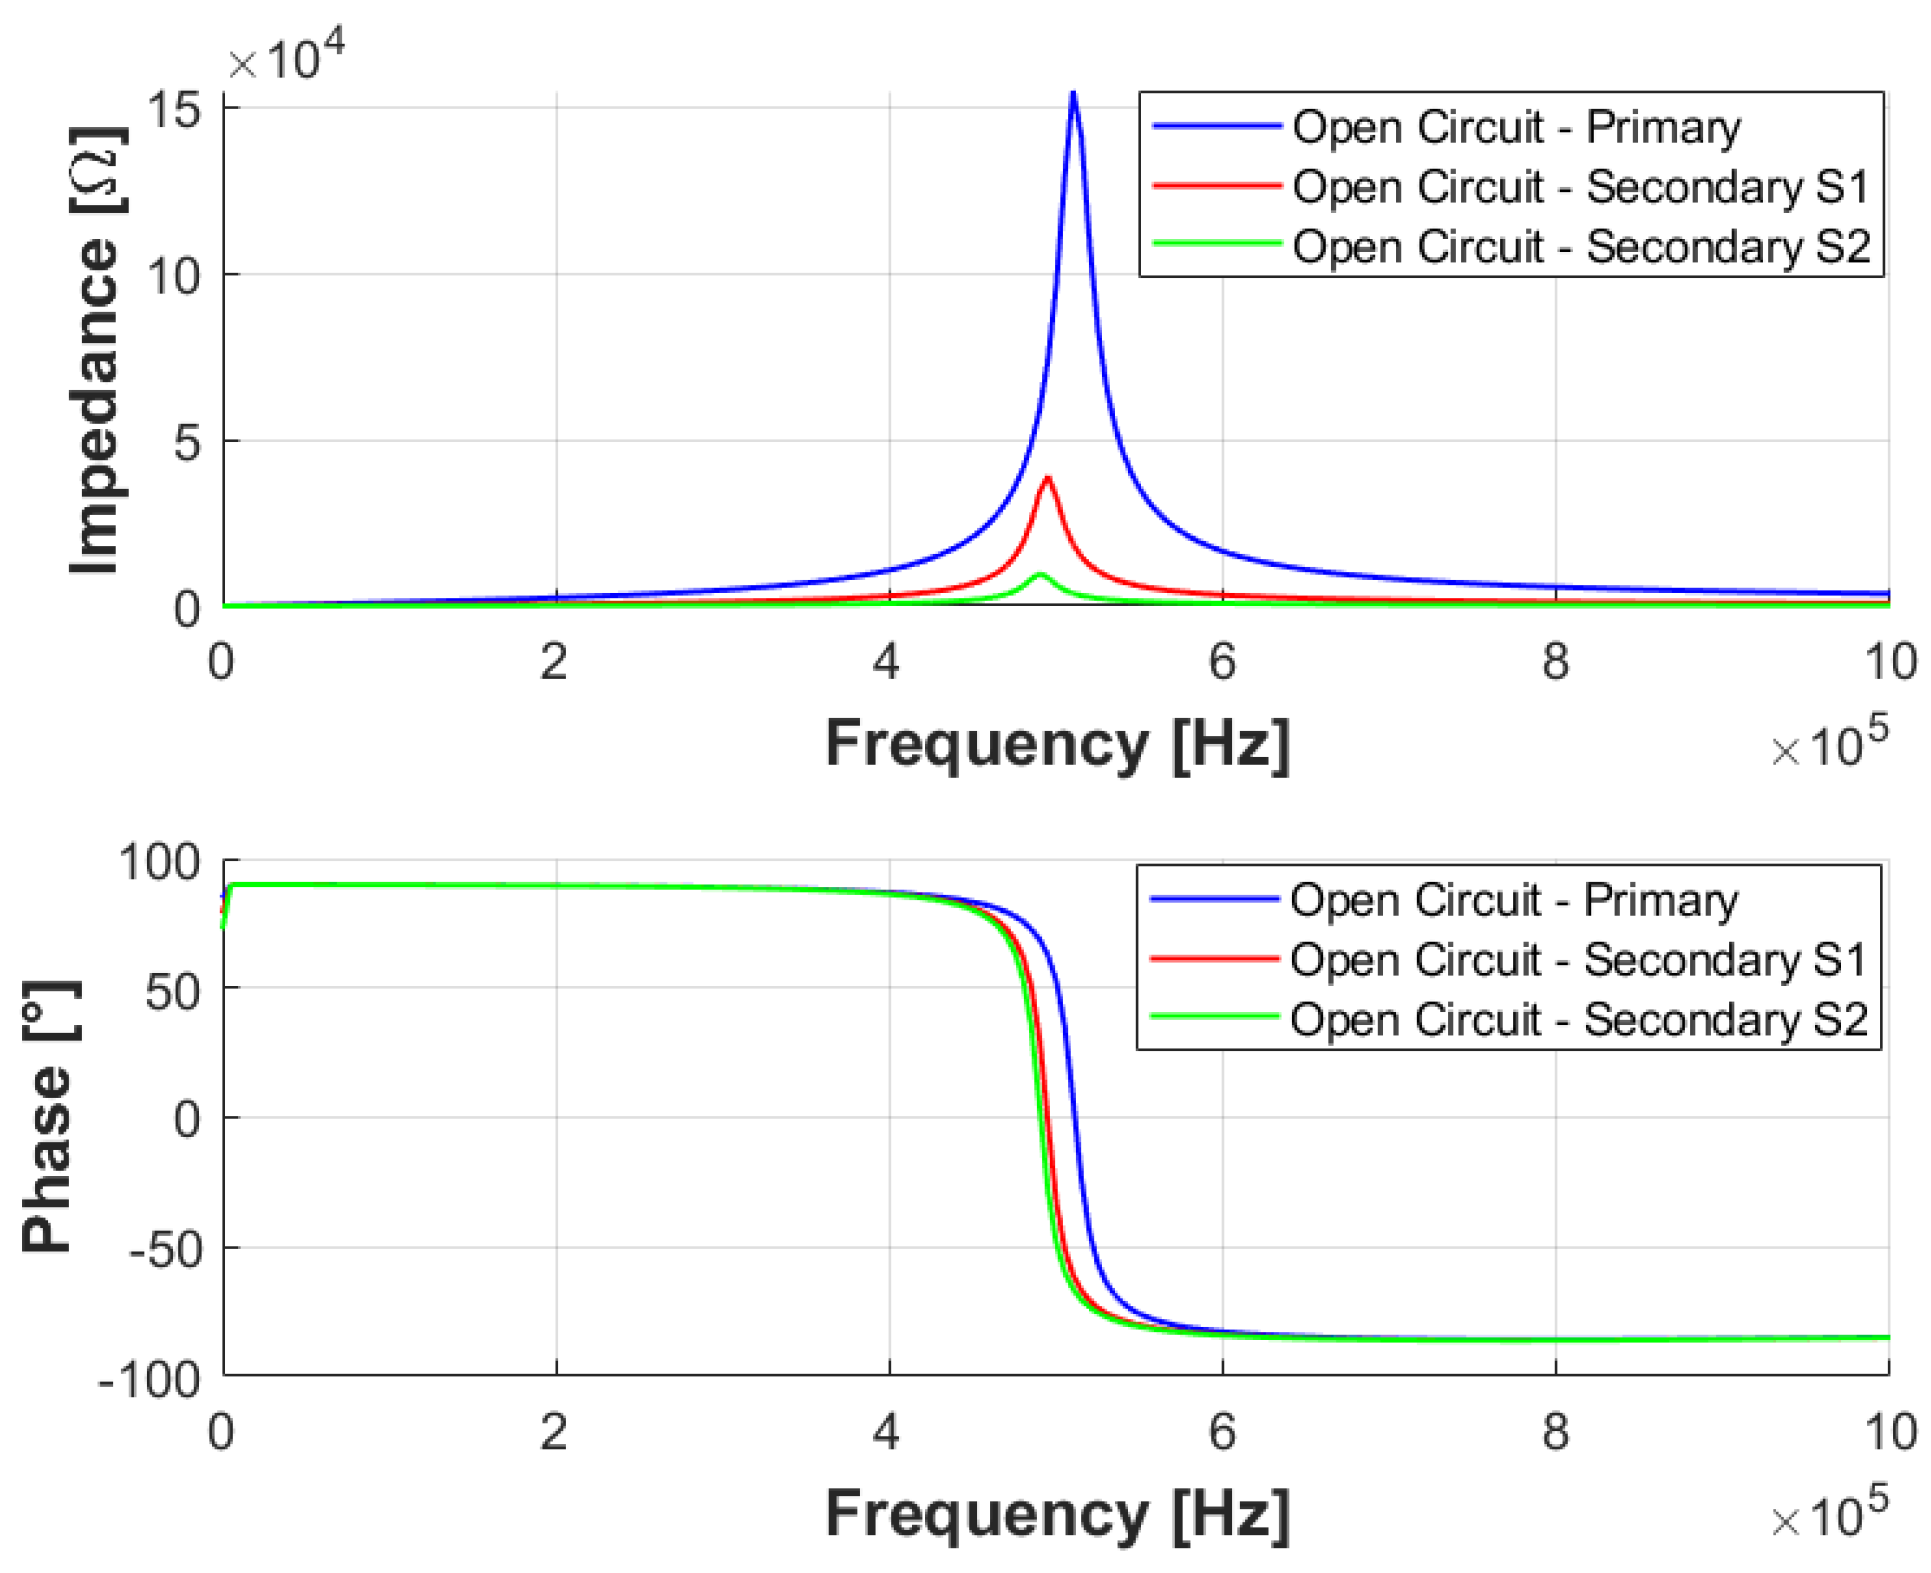
The Figure 5 shows the impedance measurements Z k , OC ( f ) when IBC-OC is performed. The impedance magnitude is shown to change with respect to the excited port, i.e., the port at which the LVEC is applied. The self-resonance frequencies f 0 , k ( k = P , S 1 , S 2 ) found in the first place for each open-circuit configuration are identified from the peak of the measured impedance magnitudes | Z k , OC | ( f ) . The values of f 0 , k are established at 511 kHz, 495 kHz, and 490 kHz, for f 0 , P , f 0 , S 1 and f 0 , S 2 , respectively. The value of f 0 , k primarily depends on the interaction between the magnetizing inductance, L m , k , and the equivalent capacitance, C eq , k , at the excited port.
The magnetizing inductance L m , k constitutes the predominant inductive effect, particularly at the transformer nominal operating frequency, i.e., 25 kHz. It is therefore directly measured using the impedance analyzer at the rated operating frequency of the transformer. Given f 0 , k and the corresponding magnetizing inductance values L m , k , the equivalent input stray capacitance is obtained as
C eq , k = 1 ( 2 π f 0 , k ) 2 L m , k , k { P , S 1 , S 2 } .
The quantity C eq , k represents the aggregated contribution of all capacitive paths electrically connected to the k-th excited winding, including both winding-to-ground and inter-winding components. To decouple the different contributions embedded in the open-circuit resonance response, a linear capacitance partitioning model is adopted and expressed as
C eq , P C d , P + α ( C P , S 1 + C P , S 2 ) C eq , S 1 C d , S 1 + α ( C P , S 1 + C S 1 , S 2 ) C eq , S 2 C d , S 2 + α ( C P , S 2 + C S 1 , S 2 ) ,
where the coefficient α represents an electrostatic participation factor accounting for the partial contribution of inter-winding capacitances to the resonance frequency f 0 , k . From a physical standpoint, the equivalent capacitance extracted from the open-circuit resonance is mainly determined by the capacitive elements that are electrically closer to the excited winding. The winding-to-ground capacitances directly connected to the excited port dominate the measured resonance behavior, whereas inter-winding contributions are scaled by the participation factor α . Capacitances associated with remote windings influence the response only indirectly through higher-order coupling paths and are therefore partially masked in the open-circuit configuration [13,23].
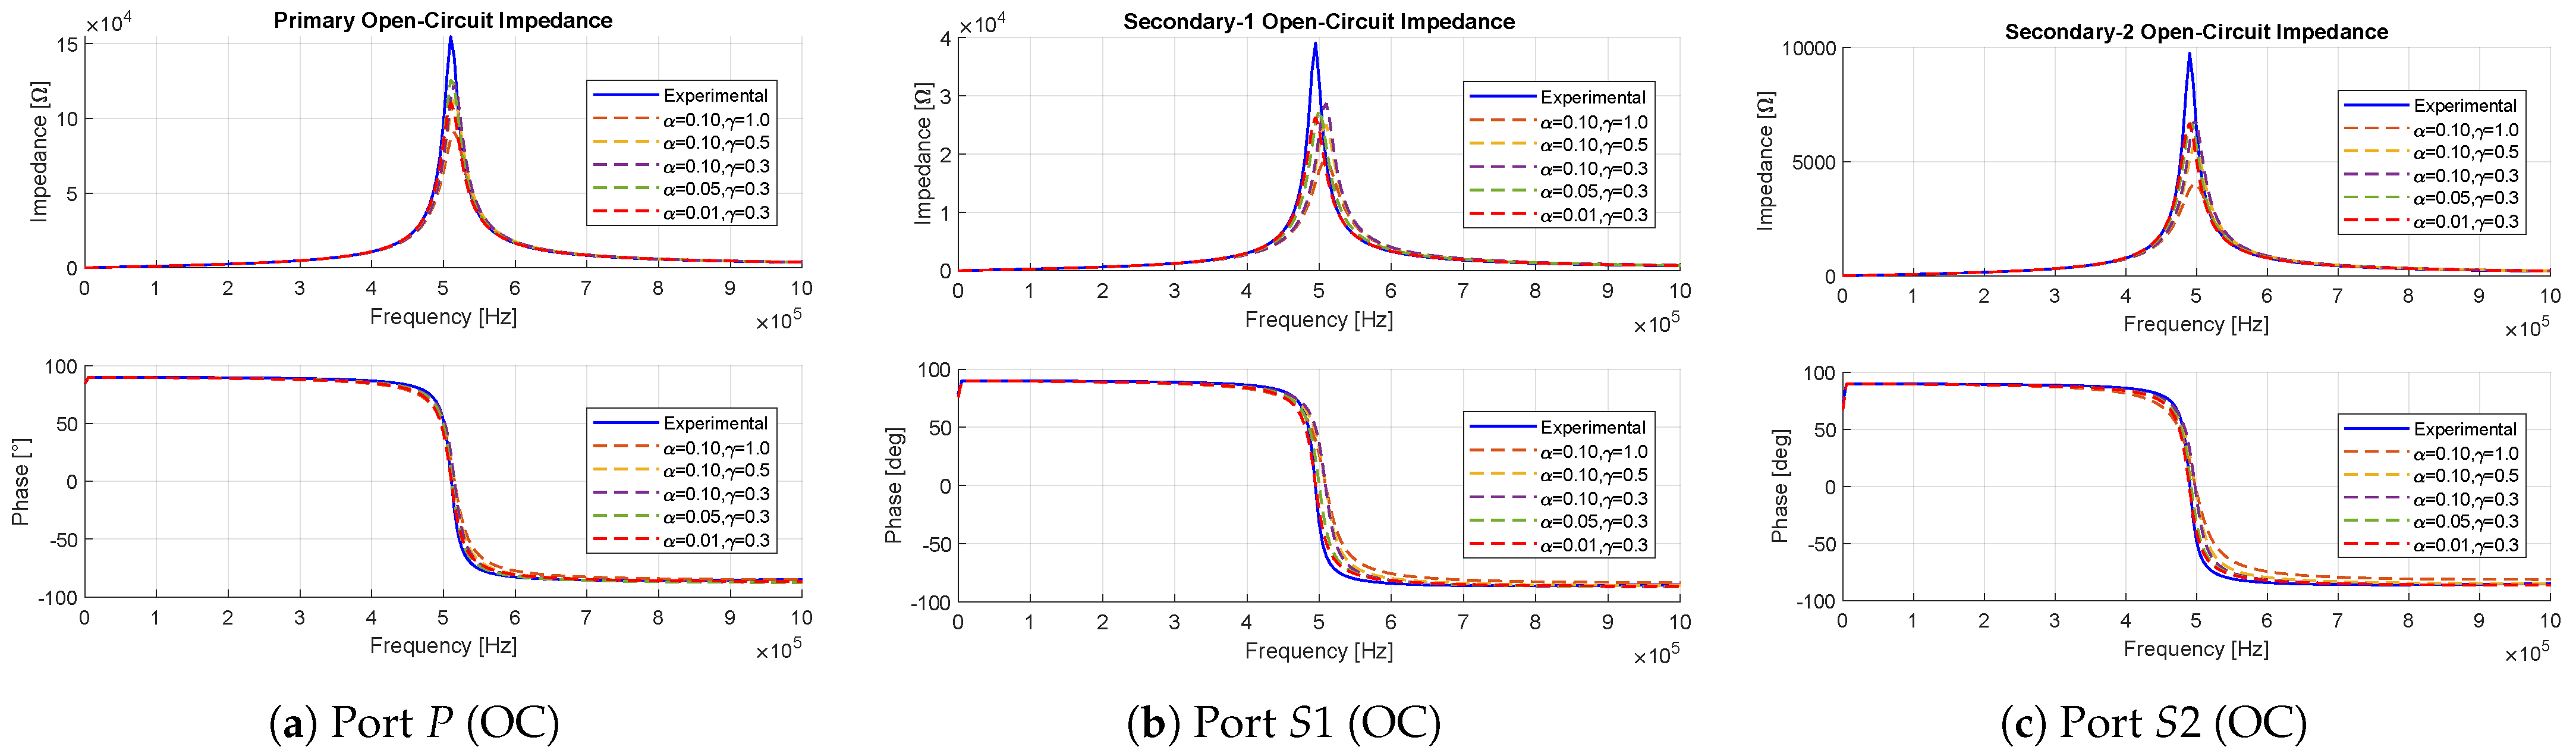
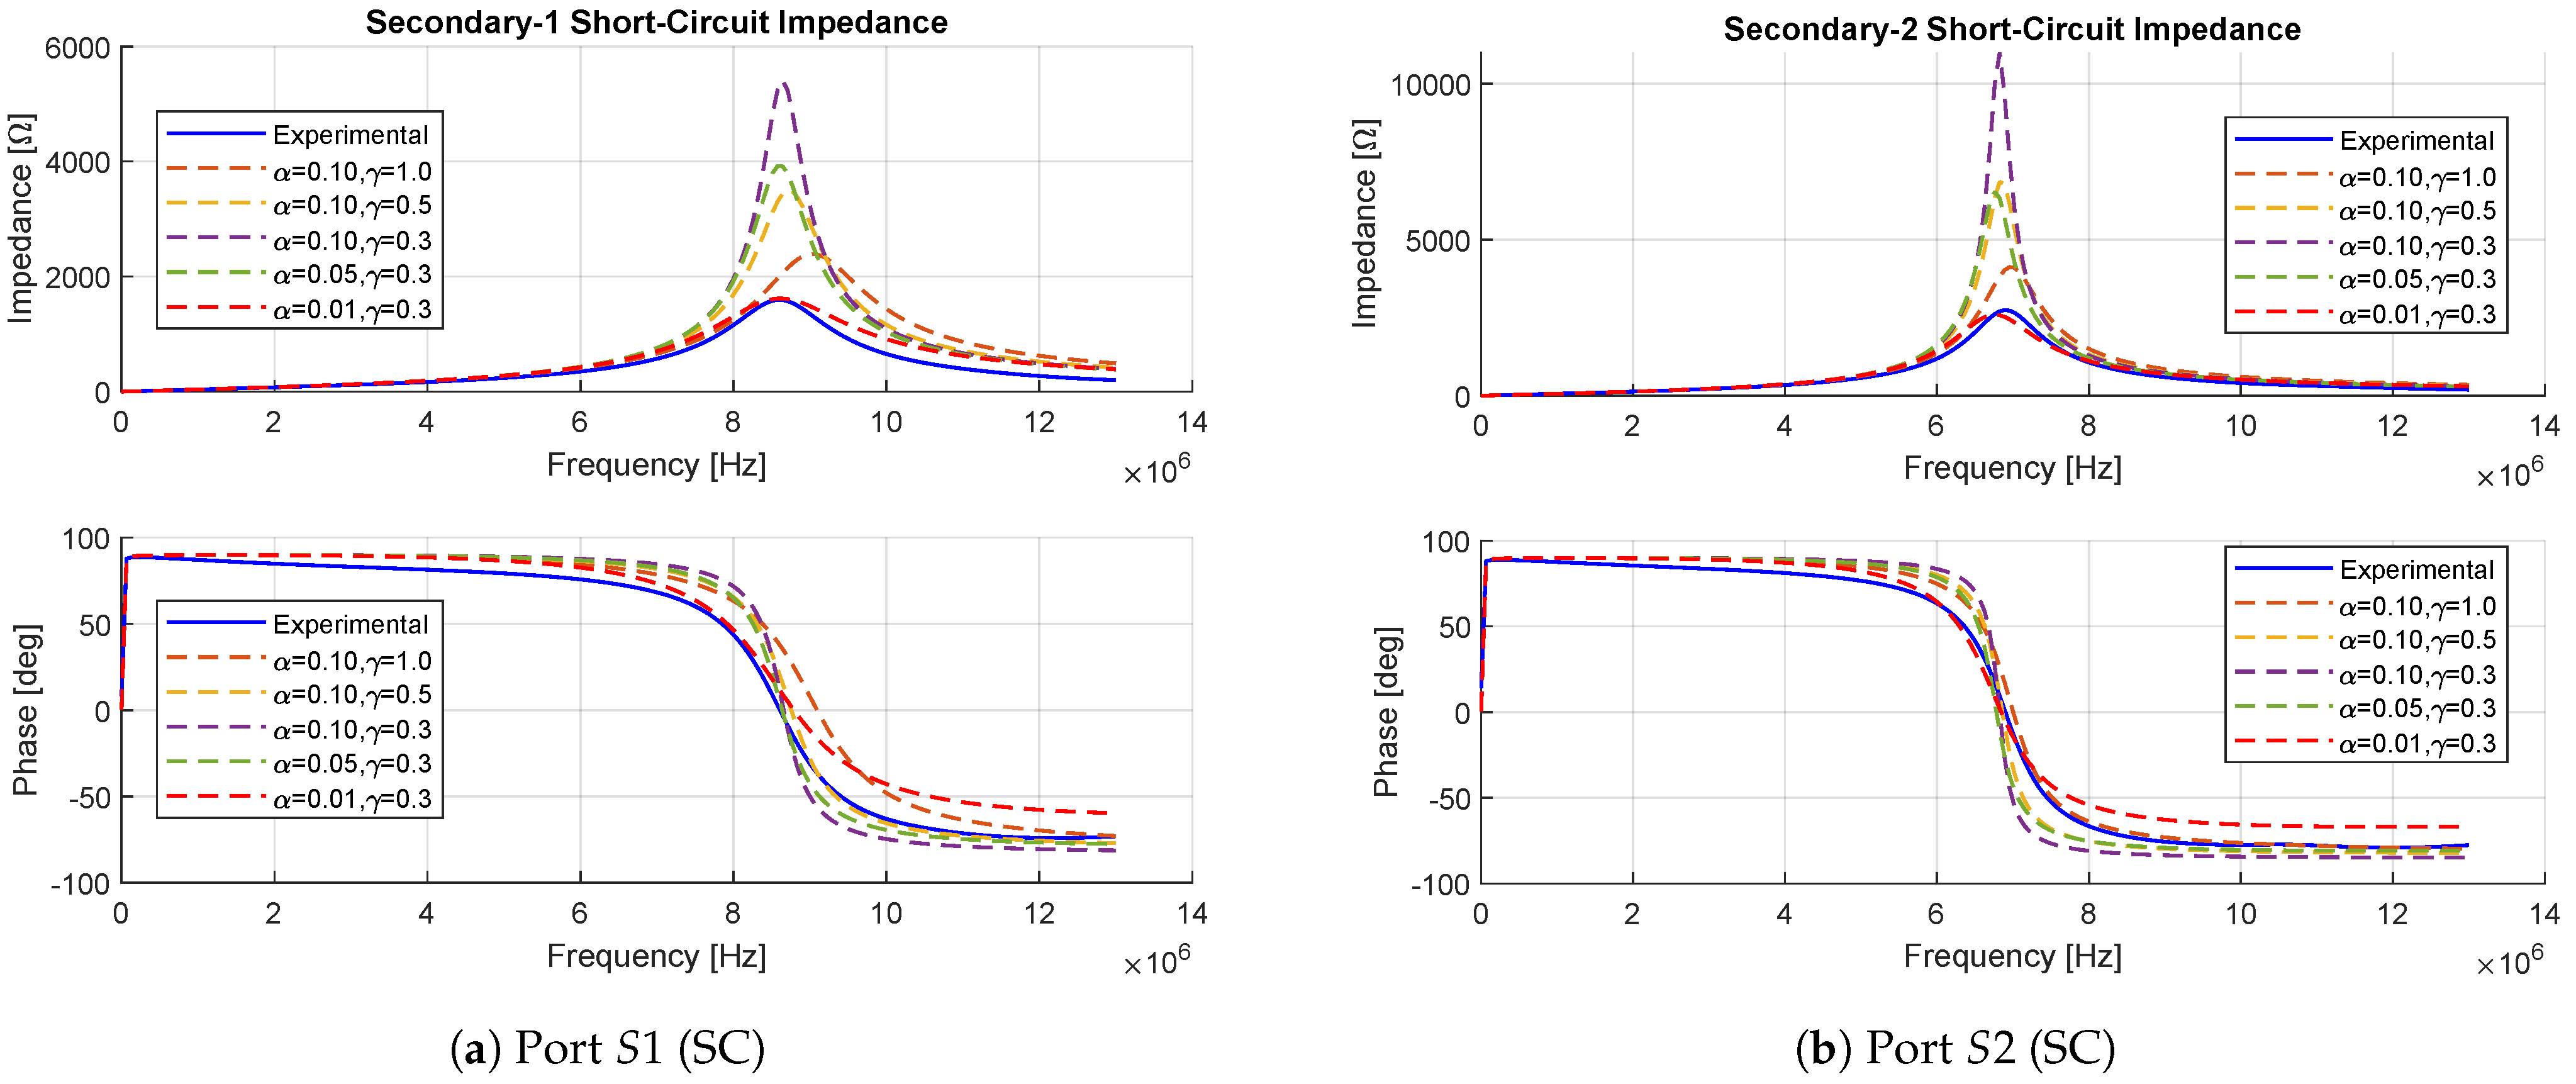
From a capacitance-decomposition perspective, the value of α must be constrained to ensure physically meaningful results. In particular, when α > 0.1 , the inter-winding contributions are overestimated, leading to negative values in one or more self-capacitance terms, which is nonphysical. Therefore, α is restricted to α 0.1 to preserve the physical consistency of the extracted parameters. Within this physically admissible region, the influence of α on the impedance response is assessed through a sensitivity analysis. In this study, α is varied within the interval 0.01 α 0.1 to evaluate its impact on the capacitance decomposition and impedance fitting. It is observed that increasing α enhances the contribution of inter-winding capacitances, resulting in higher and sharper resonance peaks, while lower values lead to smoother impedance profiles with reduced coupling effects. The corresponding sensitivity results are reported in Figures 9 and 10, where the baseline configuration is compared with representative values of α . These results confirm that α governs the strength of inter-winding coupling in the model. Based on this analysis, a lower value of α within the admissible region (close to α = 0.01 ) provides the best agreement with the measured impedance response in terms of magnitude and phase, while still ensuring physically consistent capacitance values. Similar sensitivity to electrostatic parameter allocation has been reported in broadband and impedance-based modeling studies of multi-winding transformers [15,17]. Consequently, the proposed approach enables reliable capacitance extraction suitable for both impedance-domain analysis and subsequent time-domain simulation of multi-active-bridge converter systems.
With regard to the impedance magnitude shown in Figure 5, it is assumed that the peak value at f 0 , k is heavily dependent on the iron-loss resistance R m , k , in accordance with the open-circuit equivalent model shown in Figure 2. For this reason, its value is given as
R m , k Z oc , f 0 , k .
The R m , k represents the key element to model the transformer losses in the TAB converter modeling.

3.2. ESR Identification

The ESR damping elements are denoted as R P , esr , R S 1 , esr , and R S 2 , esr for the P, S 1 , and S 2 ports, respectively. They are determined empoying the resonance quality factor Q k . The quality factor is extracted from the measured impedance magnitude using the half-power bandwidth method. Let | Z k , OC | pk denote the peak impedance magnitude at f 0 , k . The corresponding 3 dB level is defined as
| Z k , OC | 3 dB = | Z k , OC | pk 2 .
The frequencies f 1 , k and f 2 , k are identified such that | Z k , OC | ( f 1 , k ) | Z k , OC | 3 dB and | Z k , OC | ( f 2 , k ) | Z k , OC | 3 dB . Accordingly, the quality factor is computed as
Q k = f 0 , k f 2 , k f 1 , k , k { P , S 1 , S 2 } ,
by following the standard resonance analysis procedure.
Assuming that the dominant damping contribution around the self-resonant frequency is mainly associated with the shunt capacitive branch of the excited port, the loss tangent formulation yields the following first-order approximation of the equivalent series resistance:
R esr , k ( 0 ) 1 ω 0 , k C eq , k Q k , ω 0 , k = 2 π f 0 , k ,
which is commonly employed for resonance based damping identification in high frequency transformer models [24]. Hence, the resulting quality factors Q P , Q S 1 and Q S 2 are equal to 20.44, 19.80 and 19.60, respectively, while R P , esr ( 0 ) , R S 1 , esr ( 0 ) and R S 2 , esr ( 0 ) assume the respective values of 263.09 Ω , 66.05 Ω and 16.51 Ω . The results are summarised in Table 1.
These values provide a physically grounded first order estimation of the resonance damping and ensure consistency with the measured 3 dB bandwidth and broadband impedance behavior [15]. The values of R P , esr ( 0 ) , R S 1 , esr ( 0 ) and R S 2 , esr ( 0 ) primarily capture localized losses near the self resonant frequency and do not adequately represent the distributed and frequency dependent loss mechanisms governing broadband transformer impedance responses, such as dielectric losses and winding related effects [19,24,25]. As a consequence, the direct use of R esr , k ( 0 ) over a wide frequency range leads to an overestimation of the damping effect, resulting in reduced resonance peak magnitudes and noticeable discrepancies with the measured impedance responses, particularly under short-circuit conditions. To compensate for this limitation, a broadband correction factor γ is introduced to scale the ESR values and effectively account for the distributed nature of losses that are not captured by the resonance-based formulation. The corrected ESR is expressed as
R k , esr = γ R k , esr ( 0 ) , 0 < γ 1 ,
A sensitivity analysis of γ is carried out by comparing the modeled impedance responses with experimental results for different values of the scaling factor, as illustrated in Figures 9 and 10. It is observed that decreasing γ reduces the effective damping, leading to higher and sharper resonance peaks as well as improved phase alignment around the resonance frequency. Based on this analysis, a value of γ = 0.3 is selected, as it provides the best agreement between the measured and modeled impedance responses in both magnitude and phase over the investigated frequency range. It is important to note that this correction is introduced to improve impedance matching, whereas the original ESR values ( γ = 1 ) are retained in converter-level simulations to preserve the physically derived loss characteristics.

3.3. Short-Circuit Impedance-Based Characterization (IBC-SC)

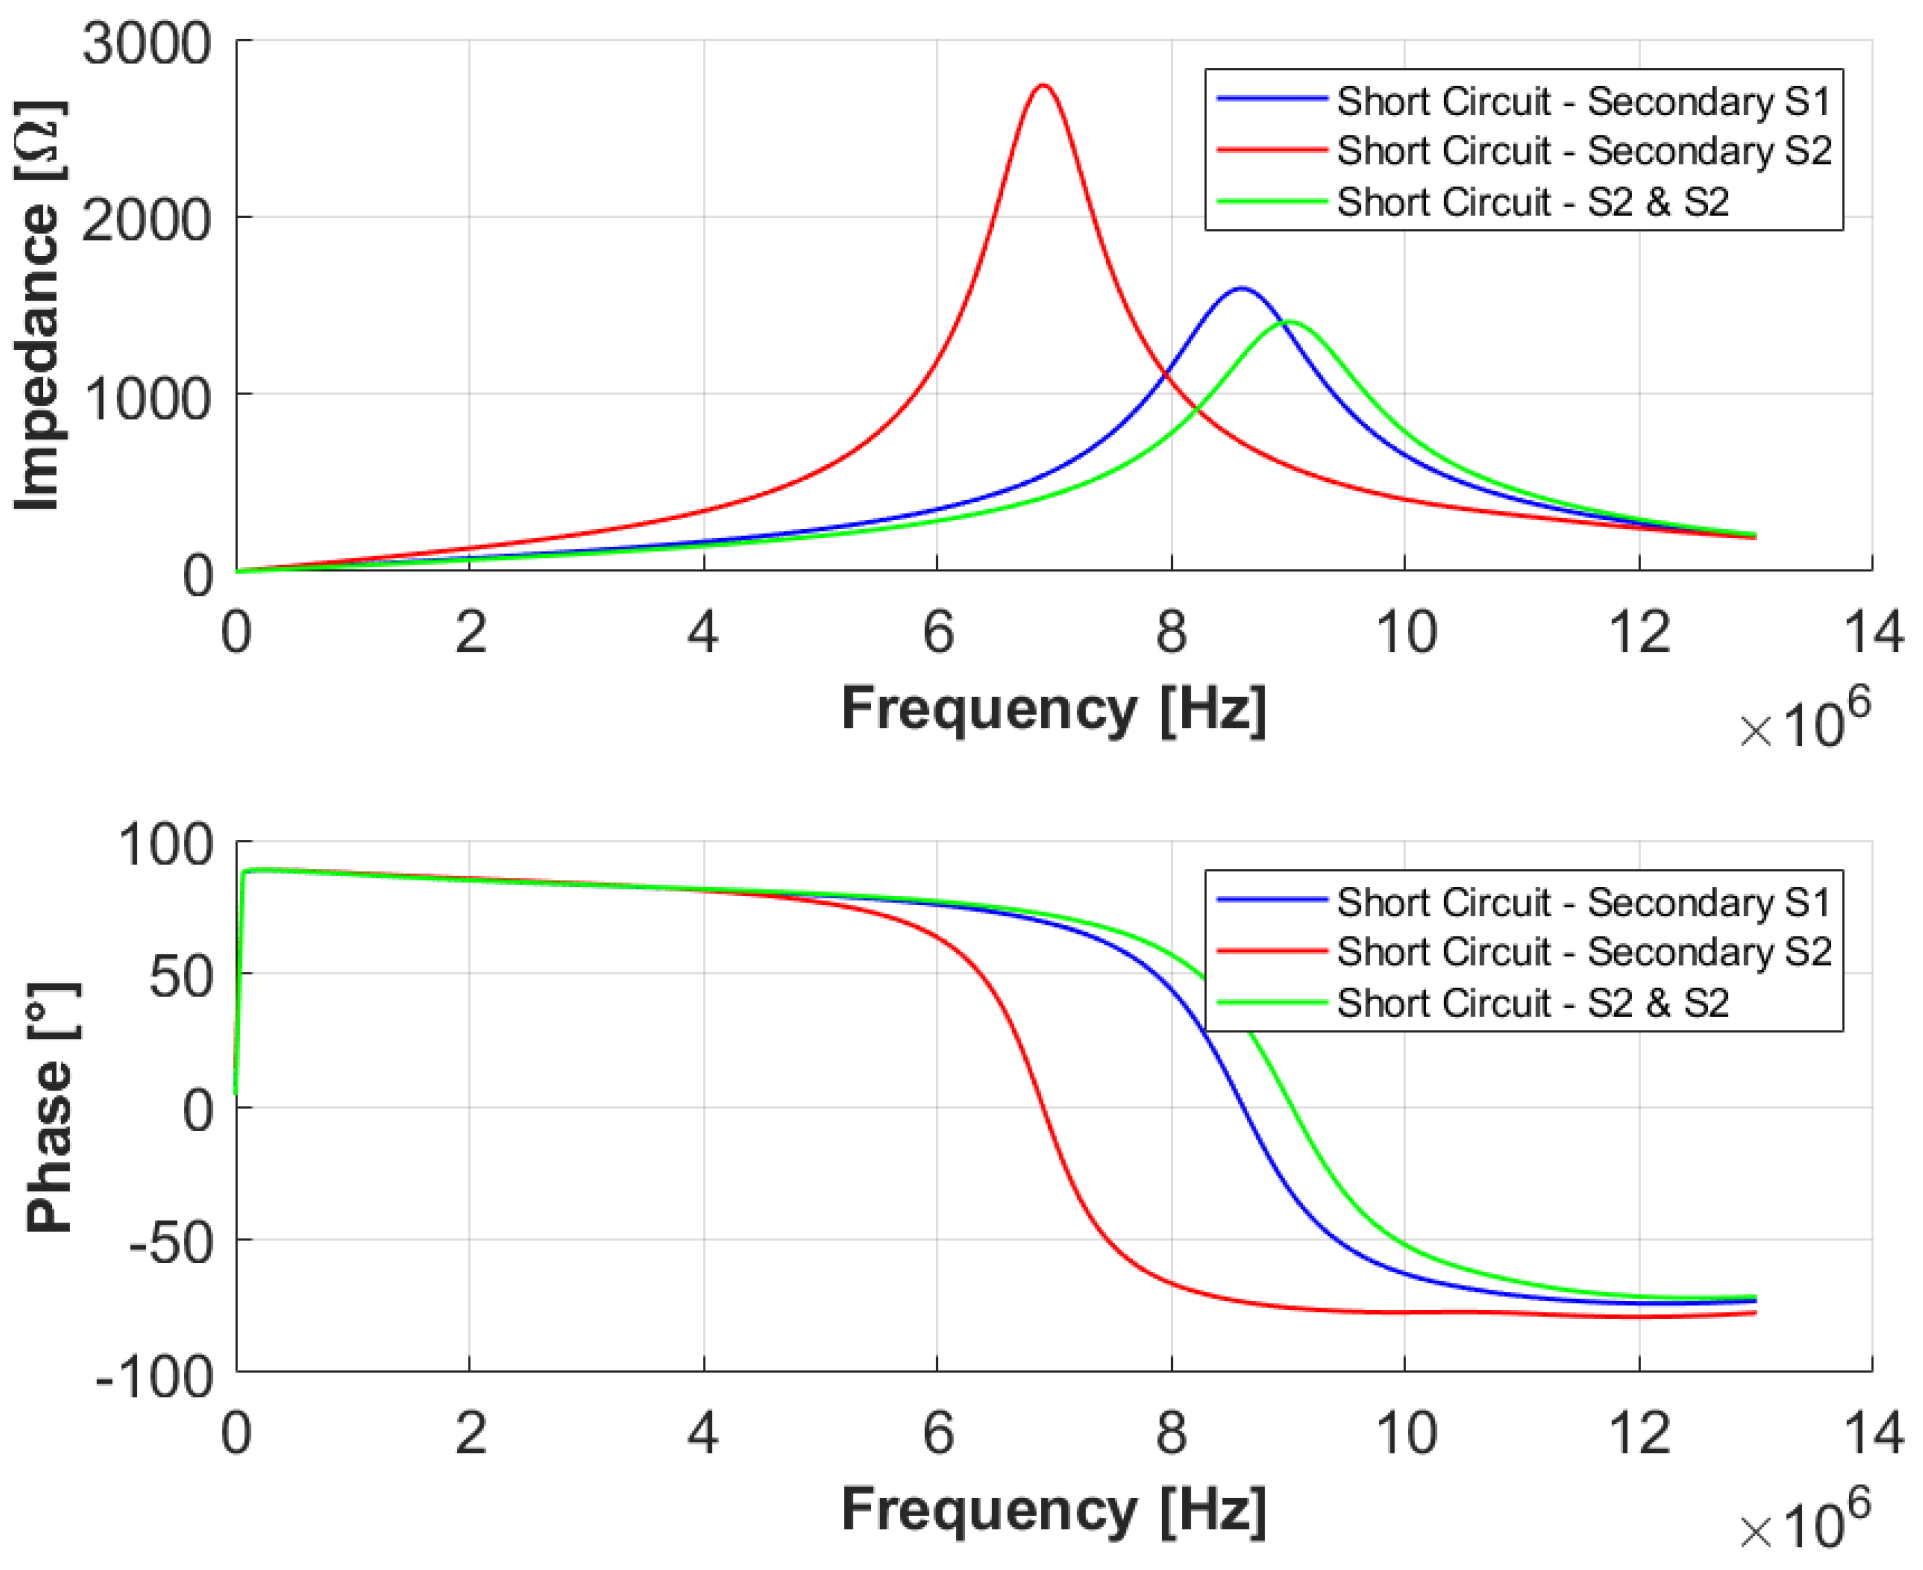
The Figure 6 displays the impedance measurements Z k , SC ( f ) when IBC-SC is performed. Similarly to | Z k , OC | ( f ) , | Z k , SC | ( f ) is shown to change with respect to the excited port, i.e., the port at which the LVEC is applied.
To capture the leakage behavior under operating conditions, two dedicated short-circuit measurements are adopted. The first measurement is used to identify leakage inductances and winding resistances, whereas the second measurement enables the extraction of the inter-winding capacitances.

3.3.1. Leakage Inductances and Winding Resistances Identification

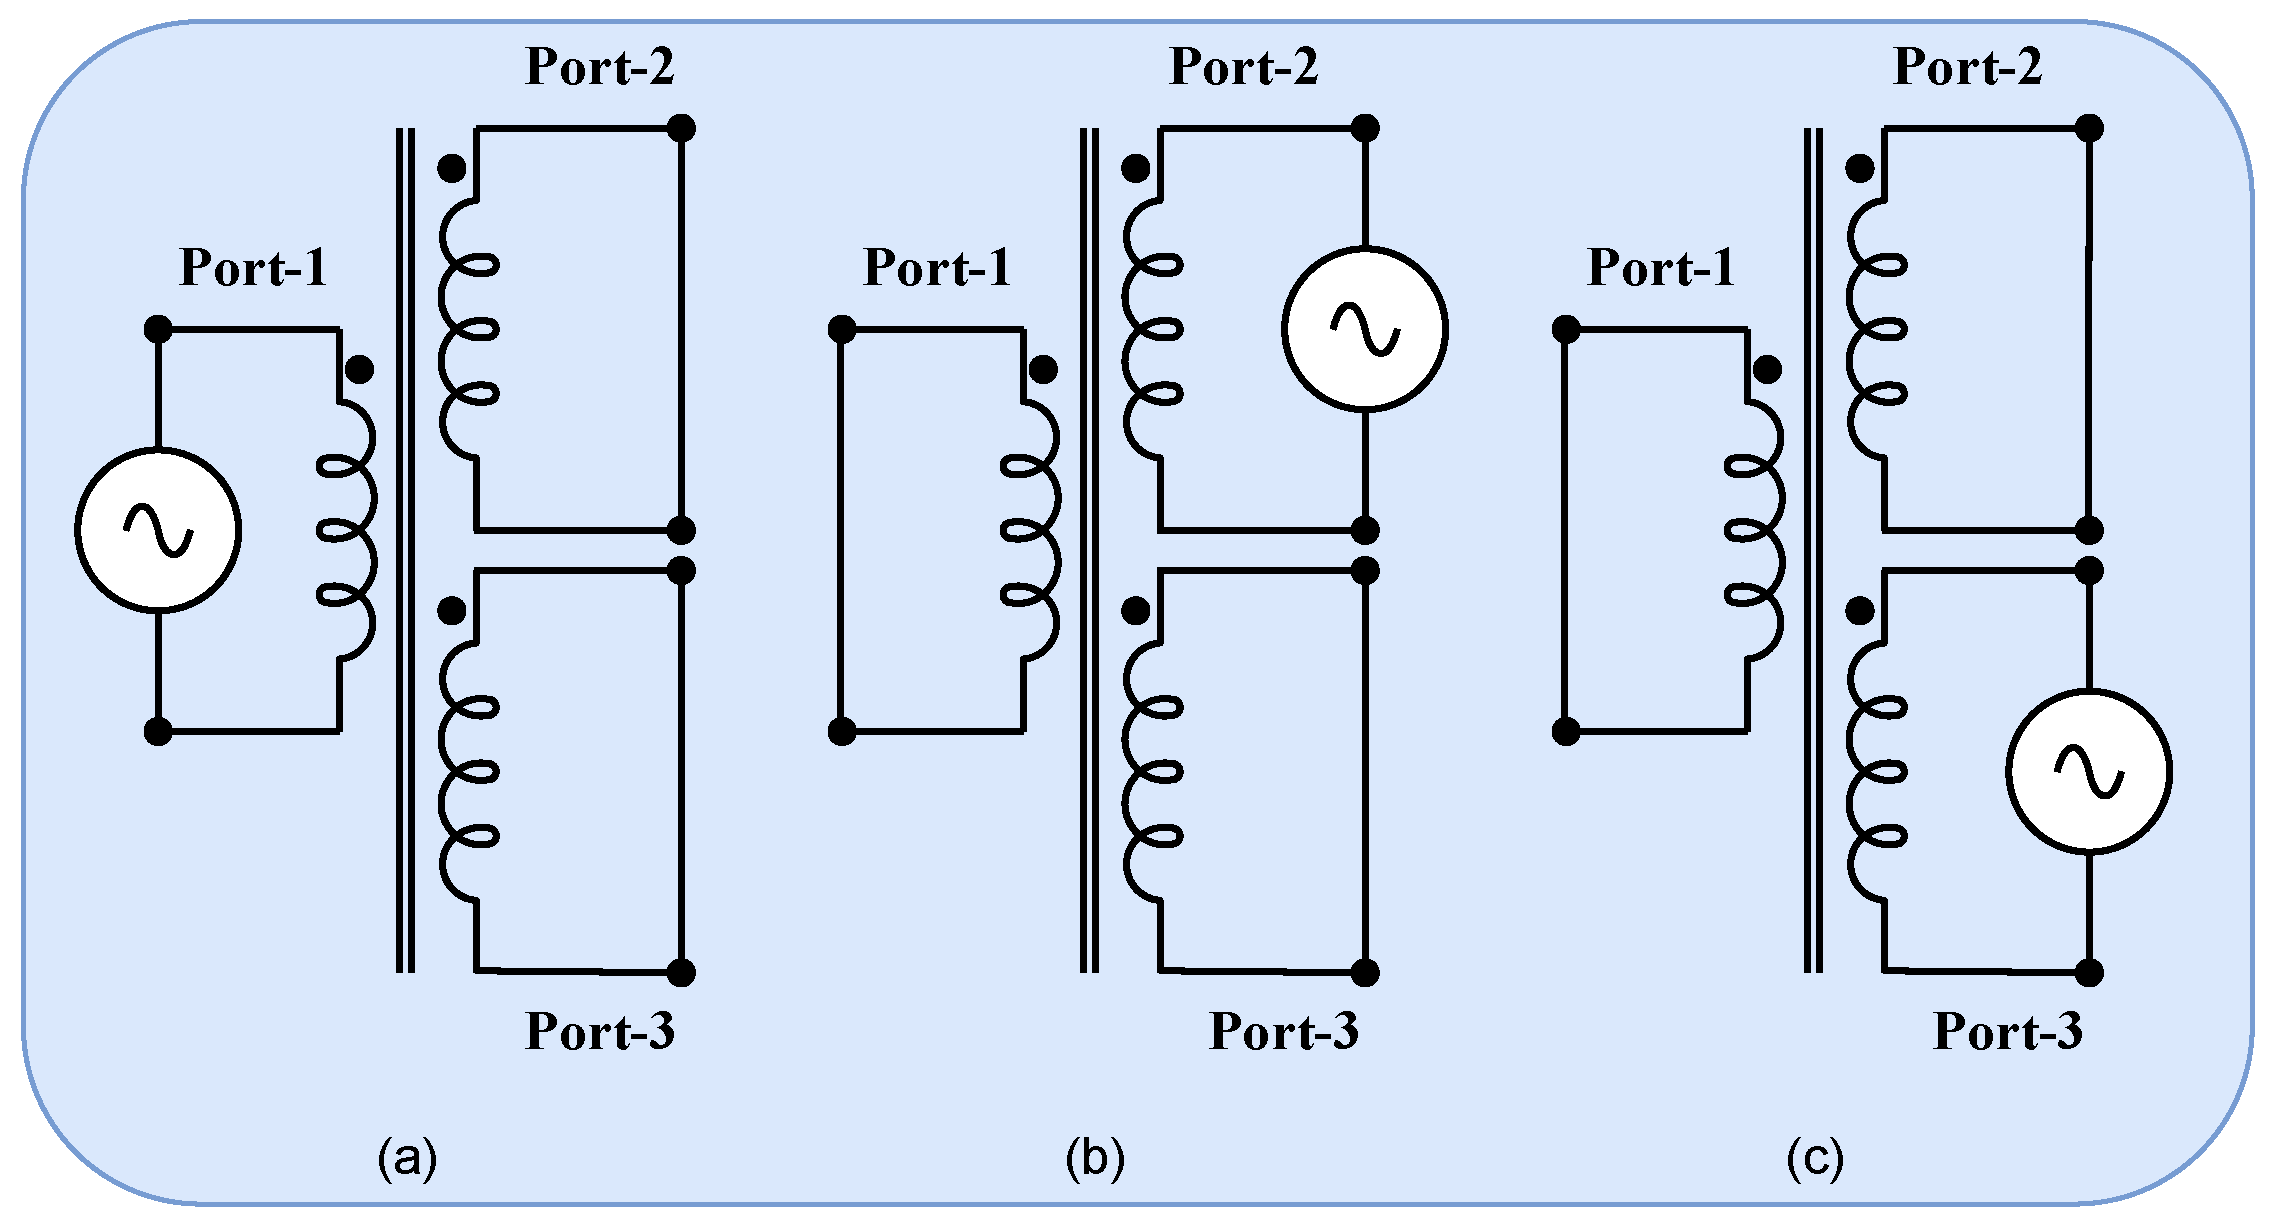
In the first measurement, the 3W-HFT is configured as illustrated in Figure 7. Unlike conventional short-circuit tests used for single-winding transformers, the proposed configuration simultaneously excites the k-th port while the remaining ports y and z are short-circuited.
The measured short-circuit responses provide the equivalent inductances L sc and resistances R sc for each test configuration. By solving the system of equations in (30), the leakage inductances L d , P , L d , S 1 , and L d , S 2 are extracted, where superscripts ′, ′′, and ′′′ denote quantities referred to the ports P, S 1 , and S 2 , respectively. These parameters strongly influence the frequency-dependent behavior of the transformer and therefore play a key role in determining power transfer capability, soft-switching conditions, and impedance matching in high-frequency TAB converters.
L d , P + L d , S 2 L d , S 1 L d , S 1 + L d , S 2 = L sc L d , S 1 + L d , S 2 L d , P L d , P + L d , S 2 = L sc n S 1 L d , S 2 + L d , S 1 L d , P L d , P + L d , S 1 = L sc n S 2 ,
In an analogous manner, a second system of equations reported in (31) is used to extract the winding resistances R d , P , R d , S 1 , and R d , S 2 from the measured short-circuit resistances.
R d , P + R d , S 2 R d , S 1 R d , S 1 + R d , S 2 = R sc R d , S 1 + R d , S 2 R d , P R d , P + R d , S 2 = R sc n S 1 R d , S 2 + R d , S 1 R d , P R d , P + R d , S 1 = R sc n S 2 ,

3.3.2. Inter-Winding Capacitance Identification

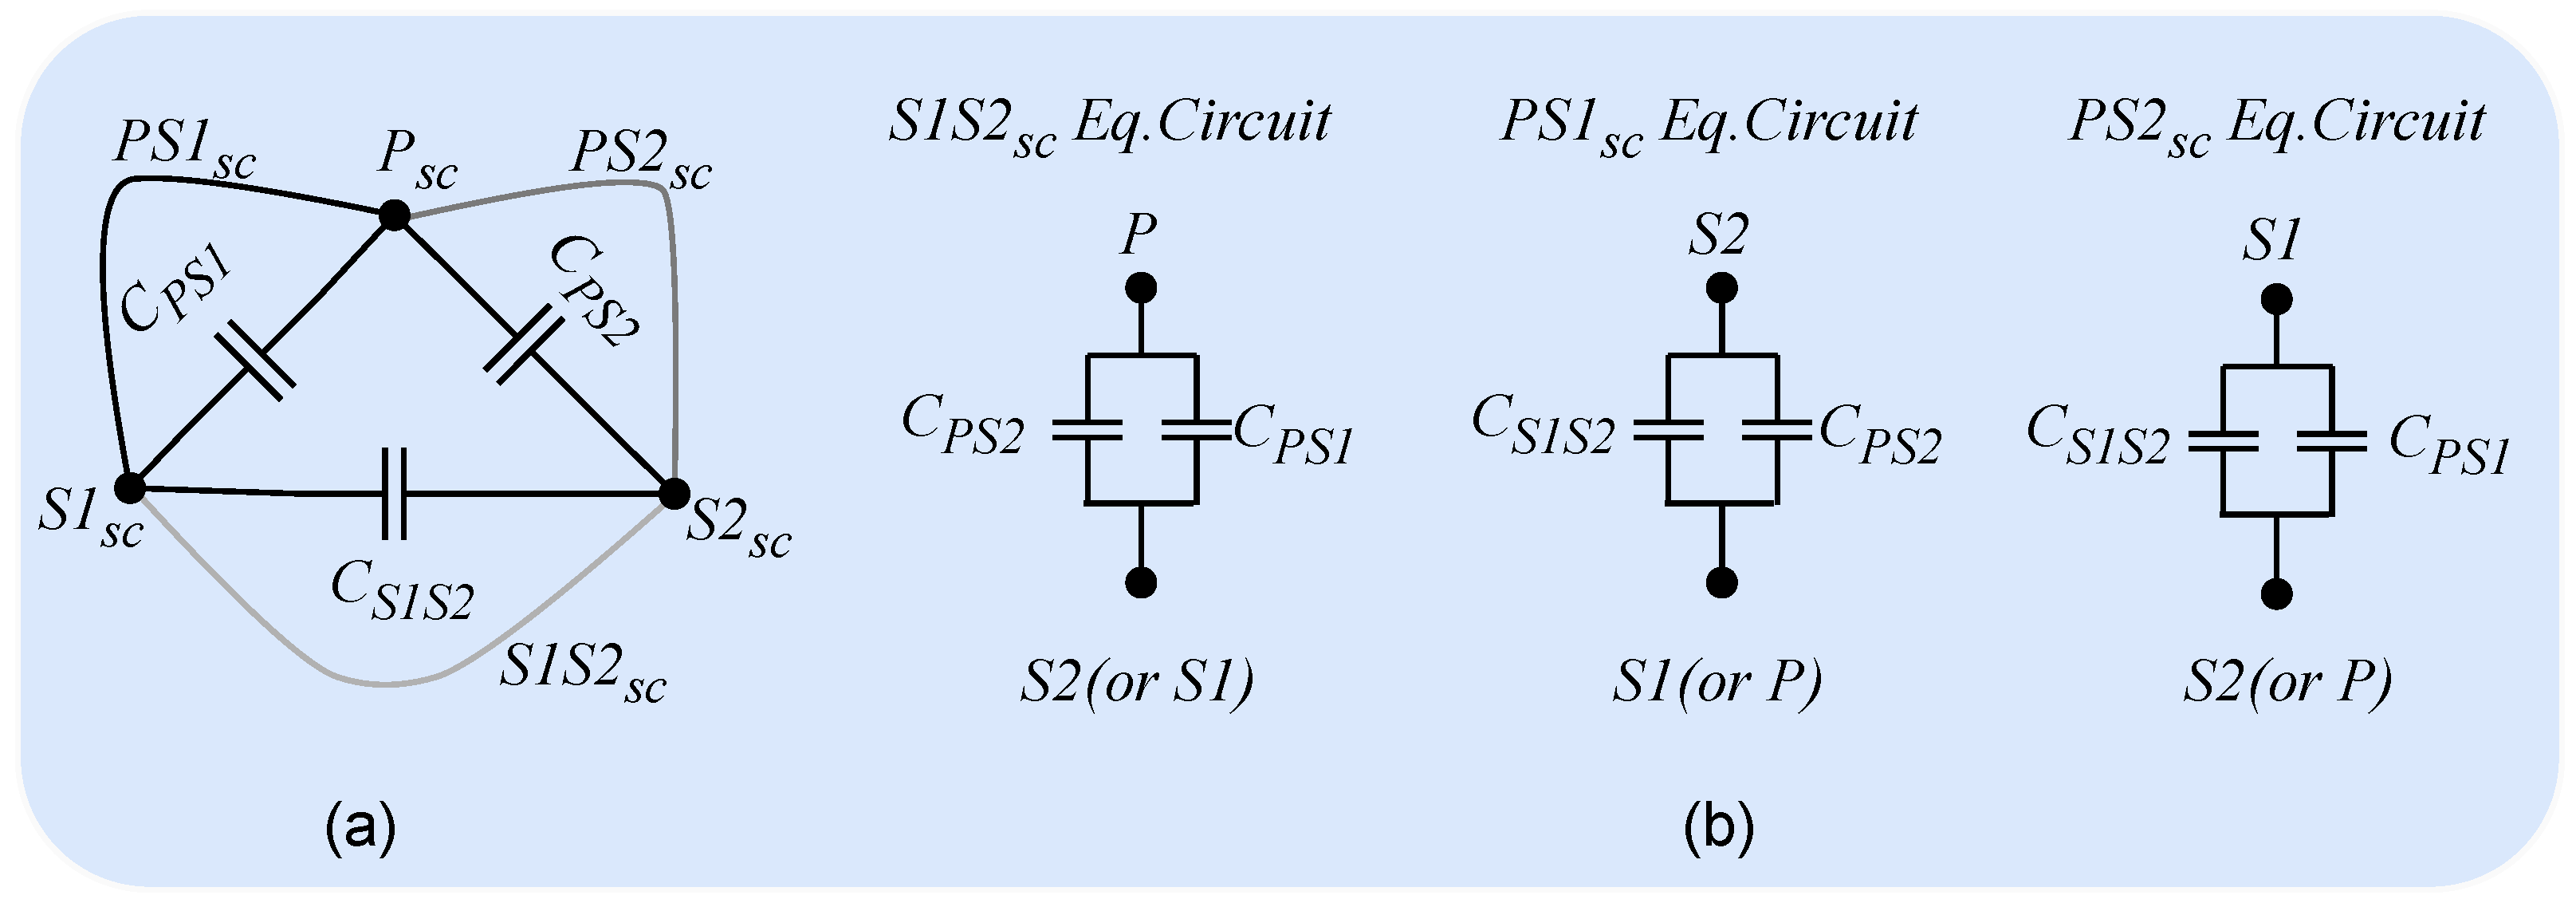
The inter-winding capacitances of the 3W-HFT are identified by short circuiting each winding of the transformer to form the nodes P sc , S 1 sc , and S 2 sc as illustrated in Figure 8.
In turn, by shorting two nodes at a time and exciting the two resulting nodes together as a bipole, the parallel electrostatic coupling between windings can be directly observed. This measurement configuration enables the dominant electrostatic coupling paths among the windings to be isolated while suppressing the influence of winding-to-ground capacitances. Under these boundary conditions, the measured capacitance corresponds to the equivalent capacitance resulting from the parallel combination of the inter-winding capacitive paths connected to the excited node. The resulting relationships are given in (32)
C P , S 1 + C P , S 2 = C S 1 , S 2 sc C P , S 2 + C S 1 , S 2 = C P , S 1 sc C P , S 1 + C S 1 , S 2 = C P , S 2 sc .
Solving this linear system yields the three inter-winding capacitances C P , S 1 , C P , S 2 , and C S 1 , S 2 . These capacitances are essential for accurately reproducing the high-frequency impedance characteristics of the transformer and for predicting resonant behavior in TAB converter operation.

3.4. Impedance Analysis Validation

The measured impedance responses have been compared with those obtained from the IBC-OC and IBC-SC models using the parameters summarized in Table 1 and resorting to (18) and (23), respectively. This comparison enables the accuracy of the proposed impedance-based characterization methodology to be assessed over the entire investigated frequency range. The IBC-OC validation results are reported in Figure 9a, Figure 9b, and Figure 9c for ports P, S 1 , and S 2 , respectively. The comparison highlights a strong agreement between the measured and modeled impedance responses in terms of both magnitude and phase characteristics. In particular, the resonance frequencies f 0 , k are accurately reproduced by the proposed model, confirming the validity of the IBC-OC identification procedure for the 3W-HFT. The IBC-SC impedance responses are shown in Figure 10a and Figure 10b for ports S 1 and S 2 , respectively. A good agreement between the measured and modeled impedance responses is observed across the investigated frequency range, confirming the validity of the leakage inductances, winding resistances, and inter-winding capacitances identified through the proposed IBC-SC procedure.
Figure 9. Sensitivity analysis of open-circuit impedance response under variation of α and γ for ports: (a) port P, (b) port S 1 , and (c) port S 2 .
Energies 19 02547 g009
Figure 10. Sensitivity analysis of short-circuit impedance response (IBC-SC) under variation of α and γ for ports S1 and S2.
Energies 19 02547 g010
Overall, the results demonstrate that the proposed impedance-based characterization methodology provides a consistent representation of the transformer electrical behavior under both open-circuit and short-circuit boundary conditions. This validates the suitability of the extracted parameters for subsequent converter-level simulations and system-level analysis of TAB-based power conversion architectures.

4. Experimental and Simulation Results

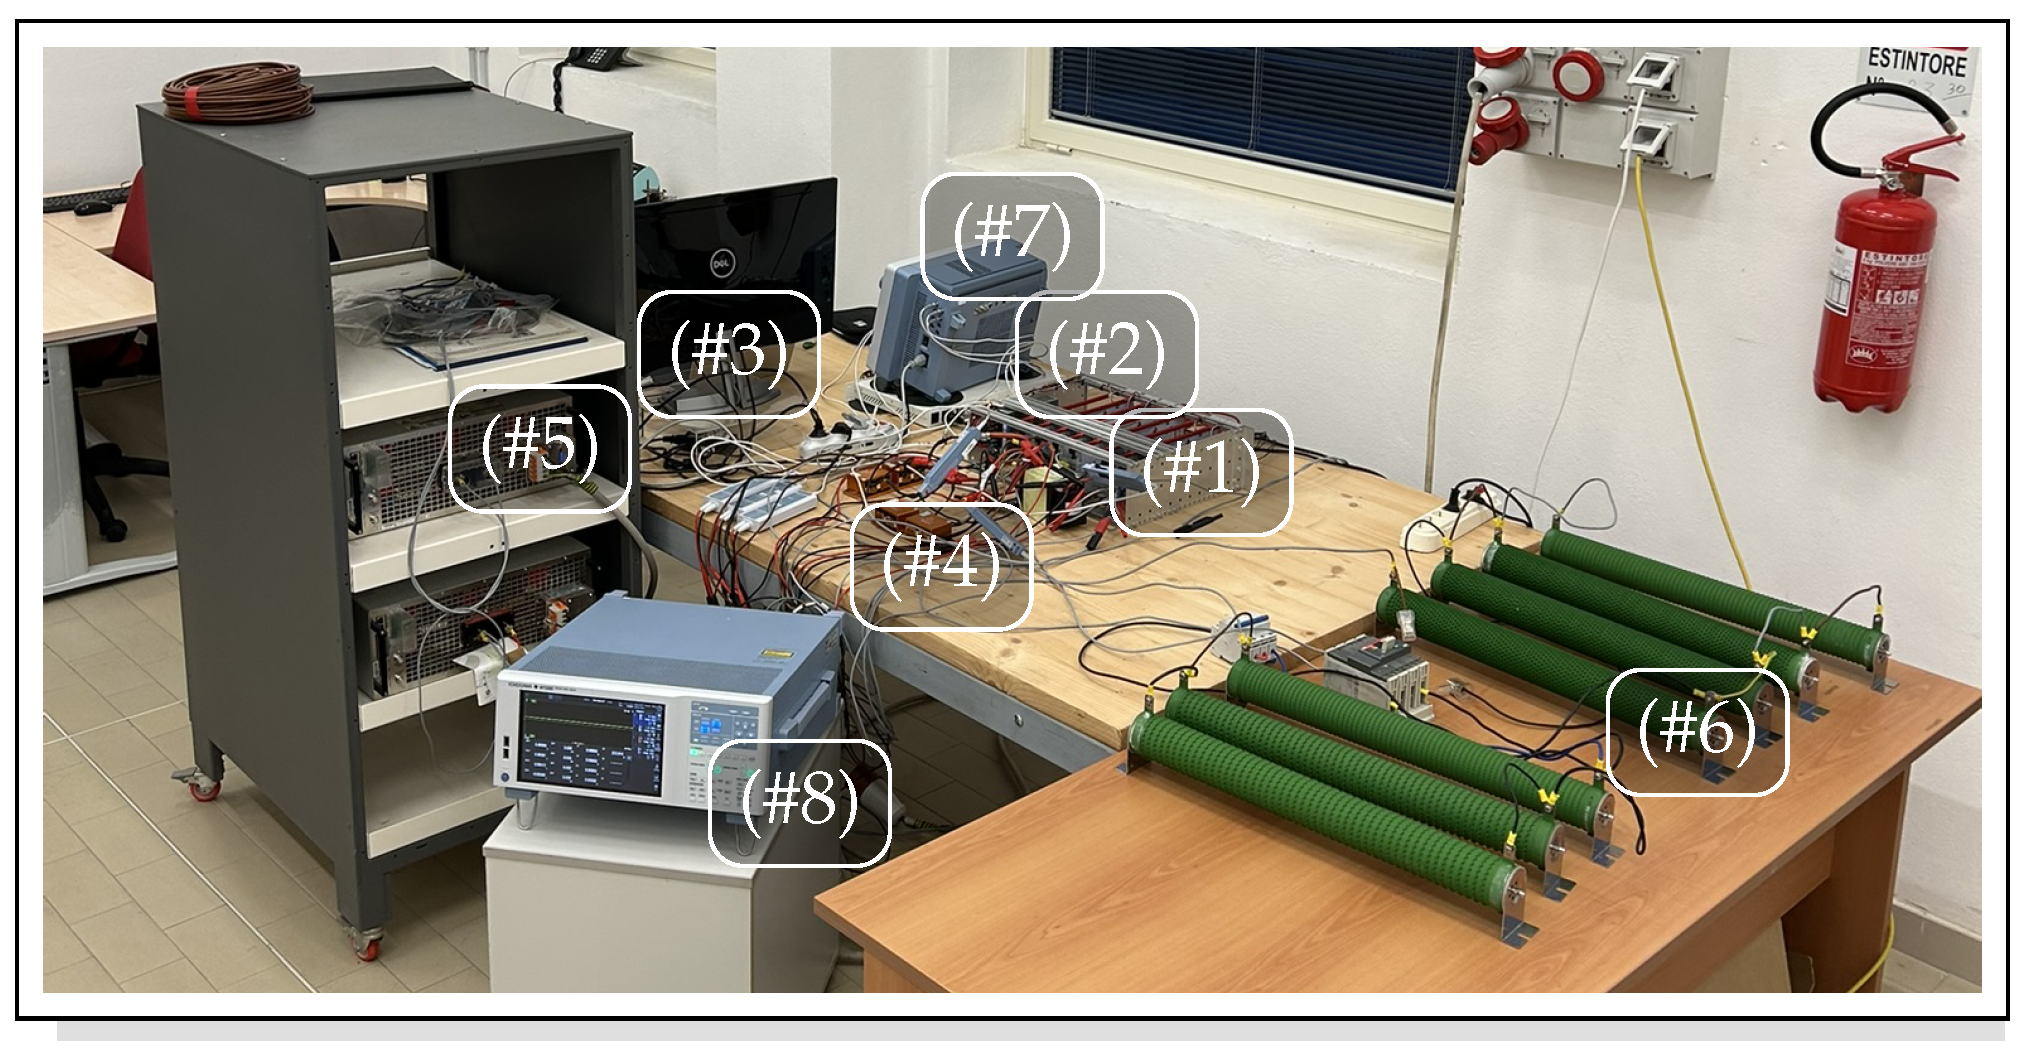
The transformer model is experimentally validated on a TAB converter application. The complete test bench setup picture is shown in Figure 11. The prototype involves six half-bridge boards Imperix PEB8024 equipped with SiC MOSFETs (#1) and an Imperix B-Box RCP 3.0 rapid prototyping controller (#2). The main characteristics of the PEB8024 and the SiC MOSFETs are reported in Table 2 and Table 3. The use of SiC devices are specifically suited for transformer testing since they enable fast switching transitions and reduced conduction losses, thereby providing high-quality voltage waveforms and improving the repeatability of the experimental characterization. The control algorithm was developed on Matlab/Simulink and compiled directly onto the controller (#3). The TAB magnetic compartment comprises the 3W-HFT under test and two distinct high-frequency inductors positioned on S 1 and S 2 , respectively (#4). The inductor on S 1 is characterized by 100 μ H and 0.2 Ω , while the one on S 2 has 25 μ H and 0.1 Ω . Their parameters have been experimentally determined by RLC meter measurement at 25 kHz. The DC power supply EA PS 10750-120 furnishes the TAB input voltage and current (#5), while two resistor benches were connected to the output ports (#6). In particular, S 1 and S 2 feed 100 Ω and 8.5 Ω , respectively, to establish significant power conditions. A Yokogawa DLM5058HD oscilloscope with its voltage and current probes is employed to acquire the data for signal frequencies up to 100 MHz (#7). Lastly, a power analyzer, Yokogawa WT5000, is employed for power measurements and efficiency evaluation.
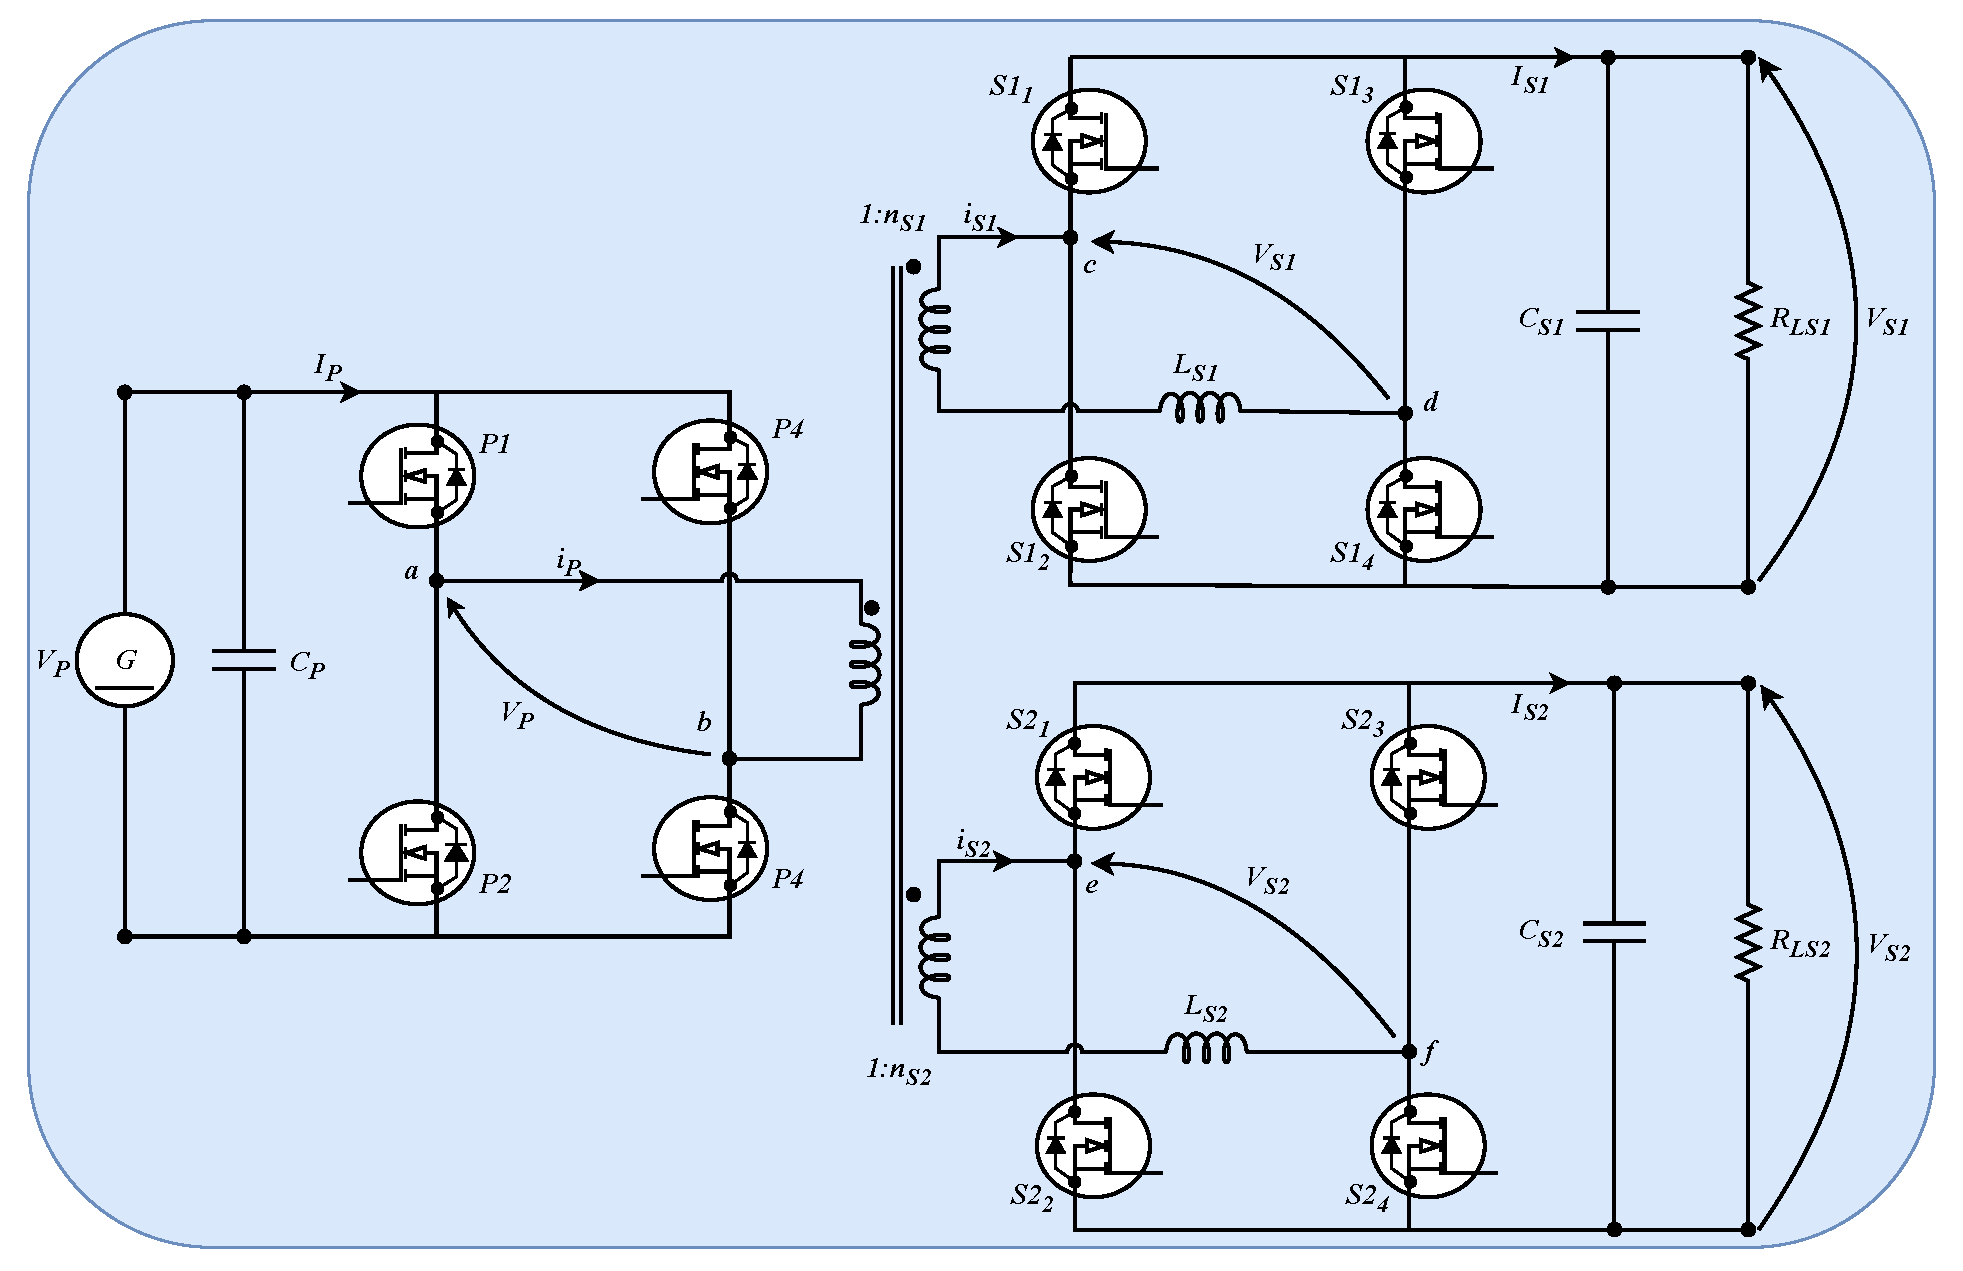
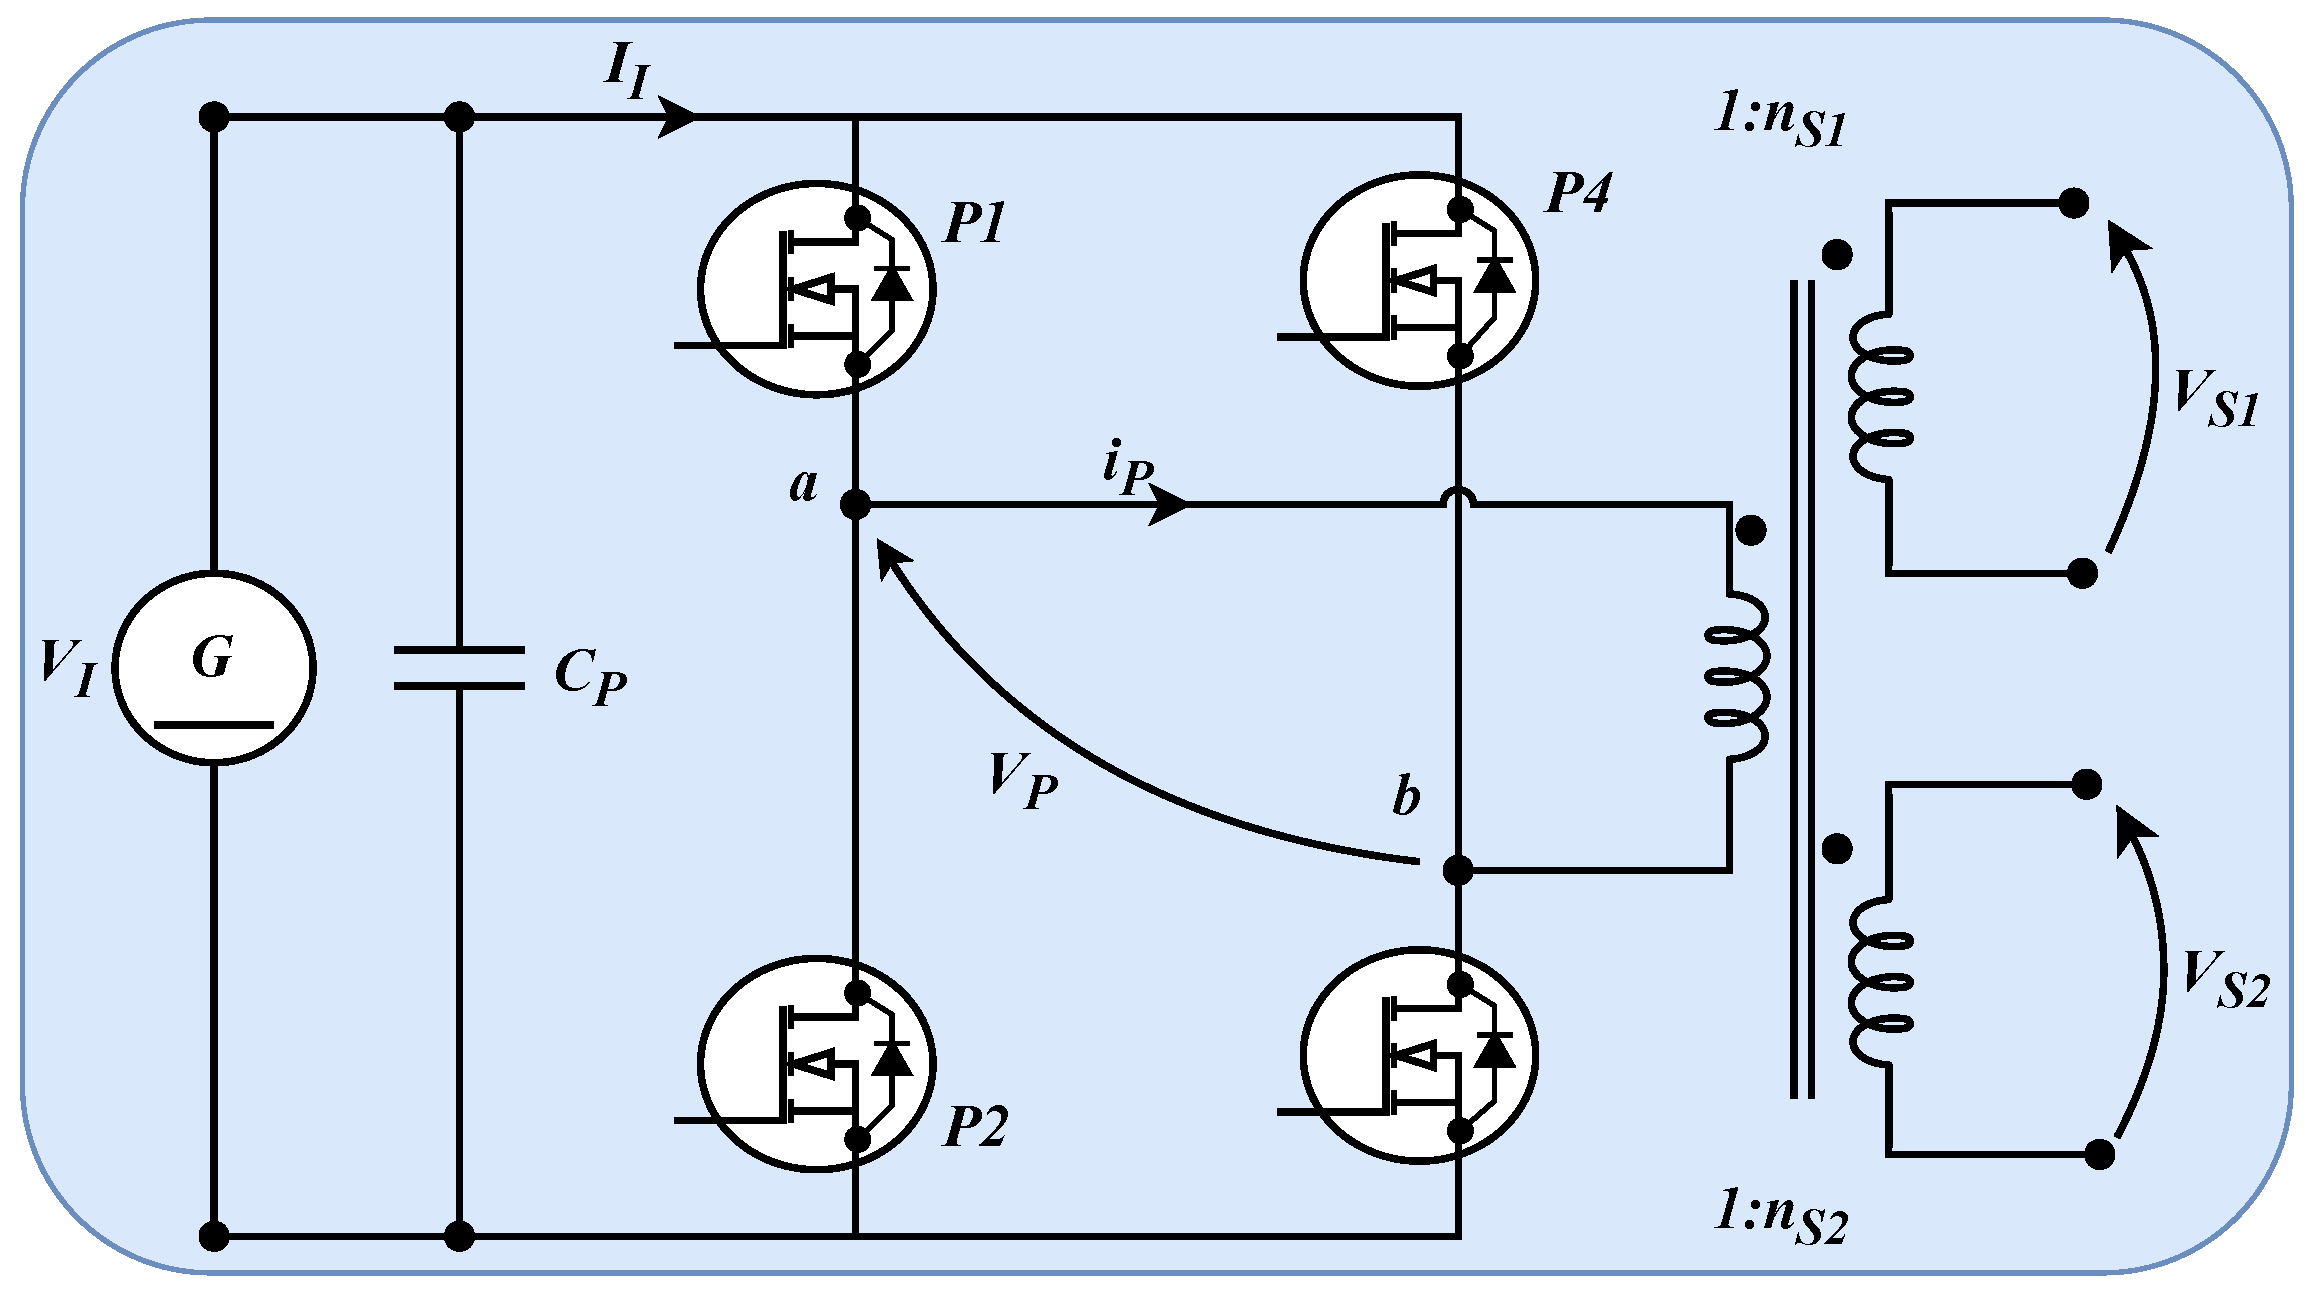
All measurements were performed using calibrated instruments within their specified accuracy ranges. Repeated measurements confirmed consistent results with negligible variation. The main accuracy specifications are reported in Table 4. The simulation study reproduces the transformer and TAB models in the PLECS environment. Therefore, the circuital model of Figure 12 has been reproduced, while the control strategy is sourced by the same Matlab/Simulink algorithm of the experimental setup to ensure consistency.

4.1. High Voltage Transformer Parameter Compensation

The transformer magnetizing behavior under high-voltage excitation conditions (HVEC) is governed primarily by the intrinsic magnetic core properties, which differ from the LVEC employed during impedance-based characterization. Under HVEC, the magnetic energy storage mechanism is shared by the magnetic core, and therefore, unlike under LVEC, the magnetization process is not port-dependent. Consequently, the stray capacitance decomposition must be recomputed using a single magnetizing inductance associated with the input port P. By applying (24), using L m , P as the reference magnetizing inductance for all three ports, the updated self-capacitances C d , k are obtained. The resulting values are reported in Table 1 as C d , k core , while the inter-winding capacitances identified through IBC-SC measurements remain unchanged. Furthermore, the magnetization parameters identified under LVEC do not fully capture the transformer behavior under realistic converter operating conditions. In contrast, HVEC drives the magnetic core closer to its nominal flux density, thereby revealing magnetic behaviors at which is associated a different magnetizing inductance during actual TAB operation. This condition also increases the effective core-loss contribution of the transformer. For this reason, the parameters L m , P and R m , P are compensated to account for these effects.
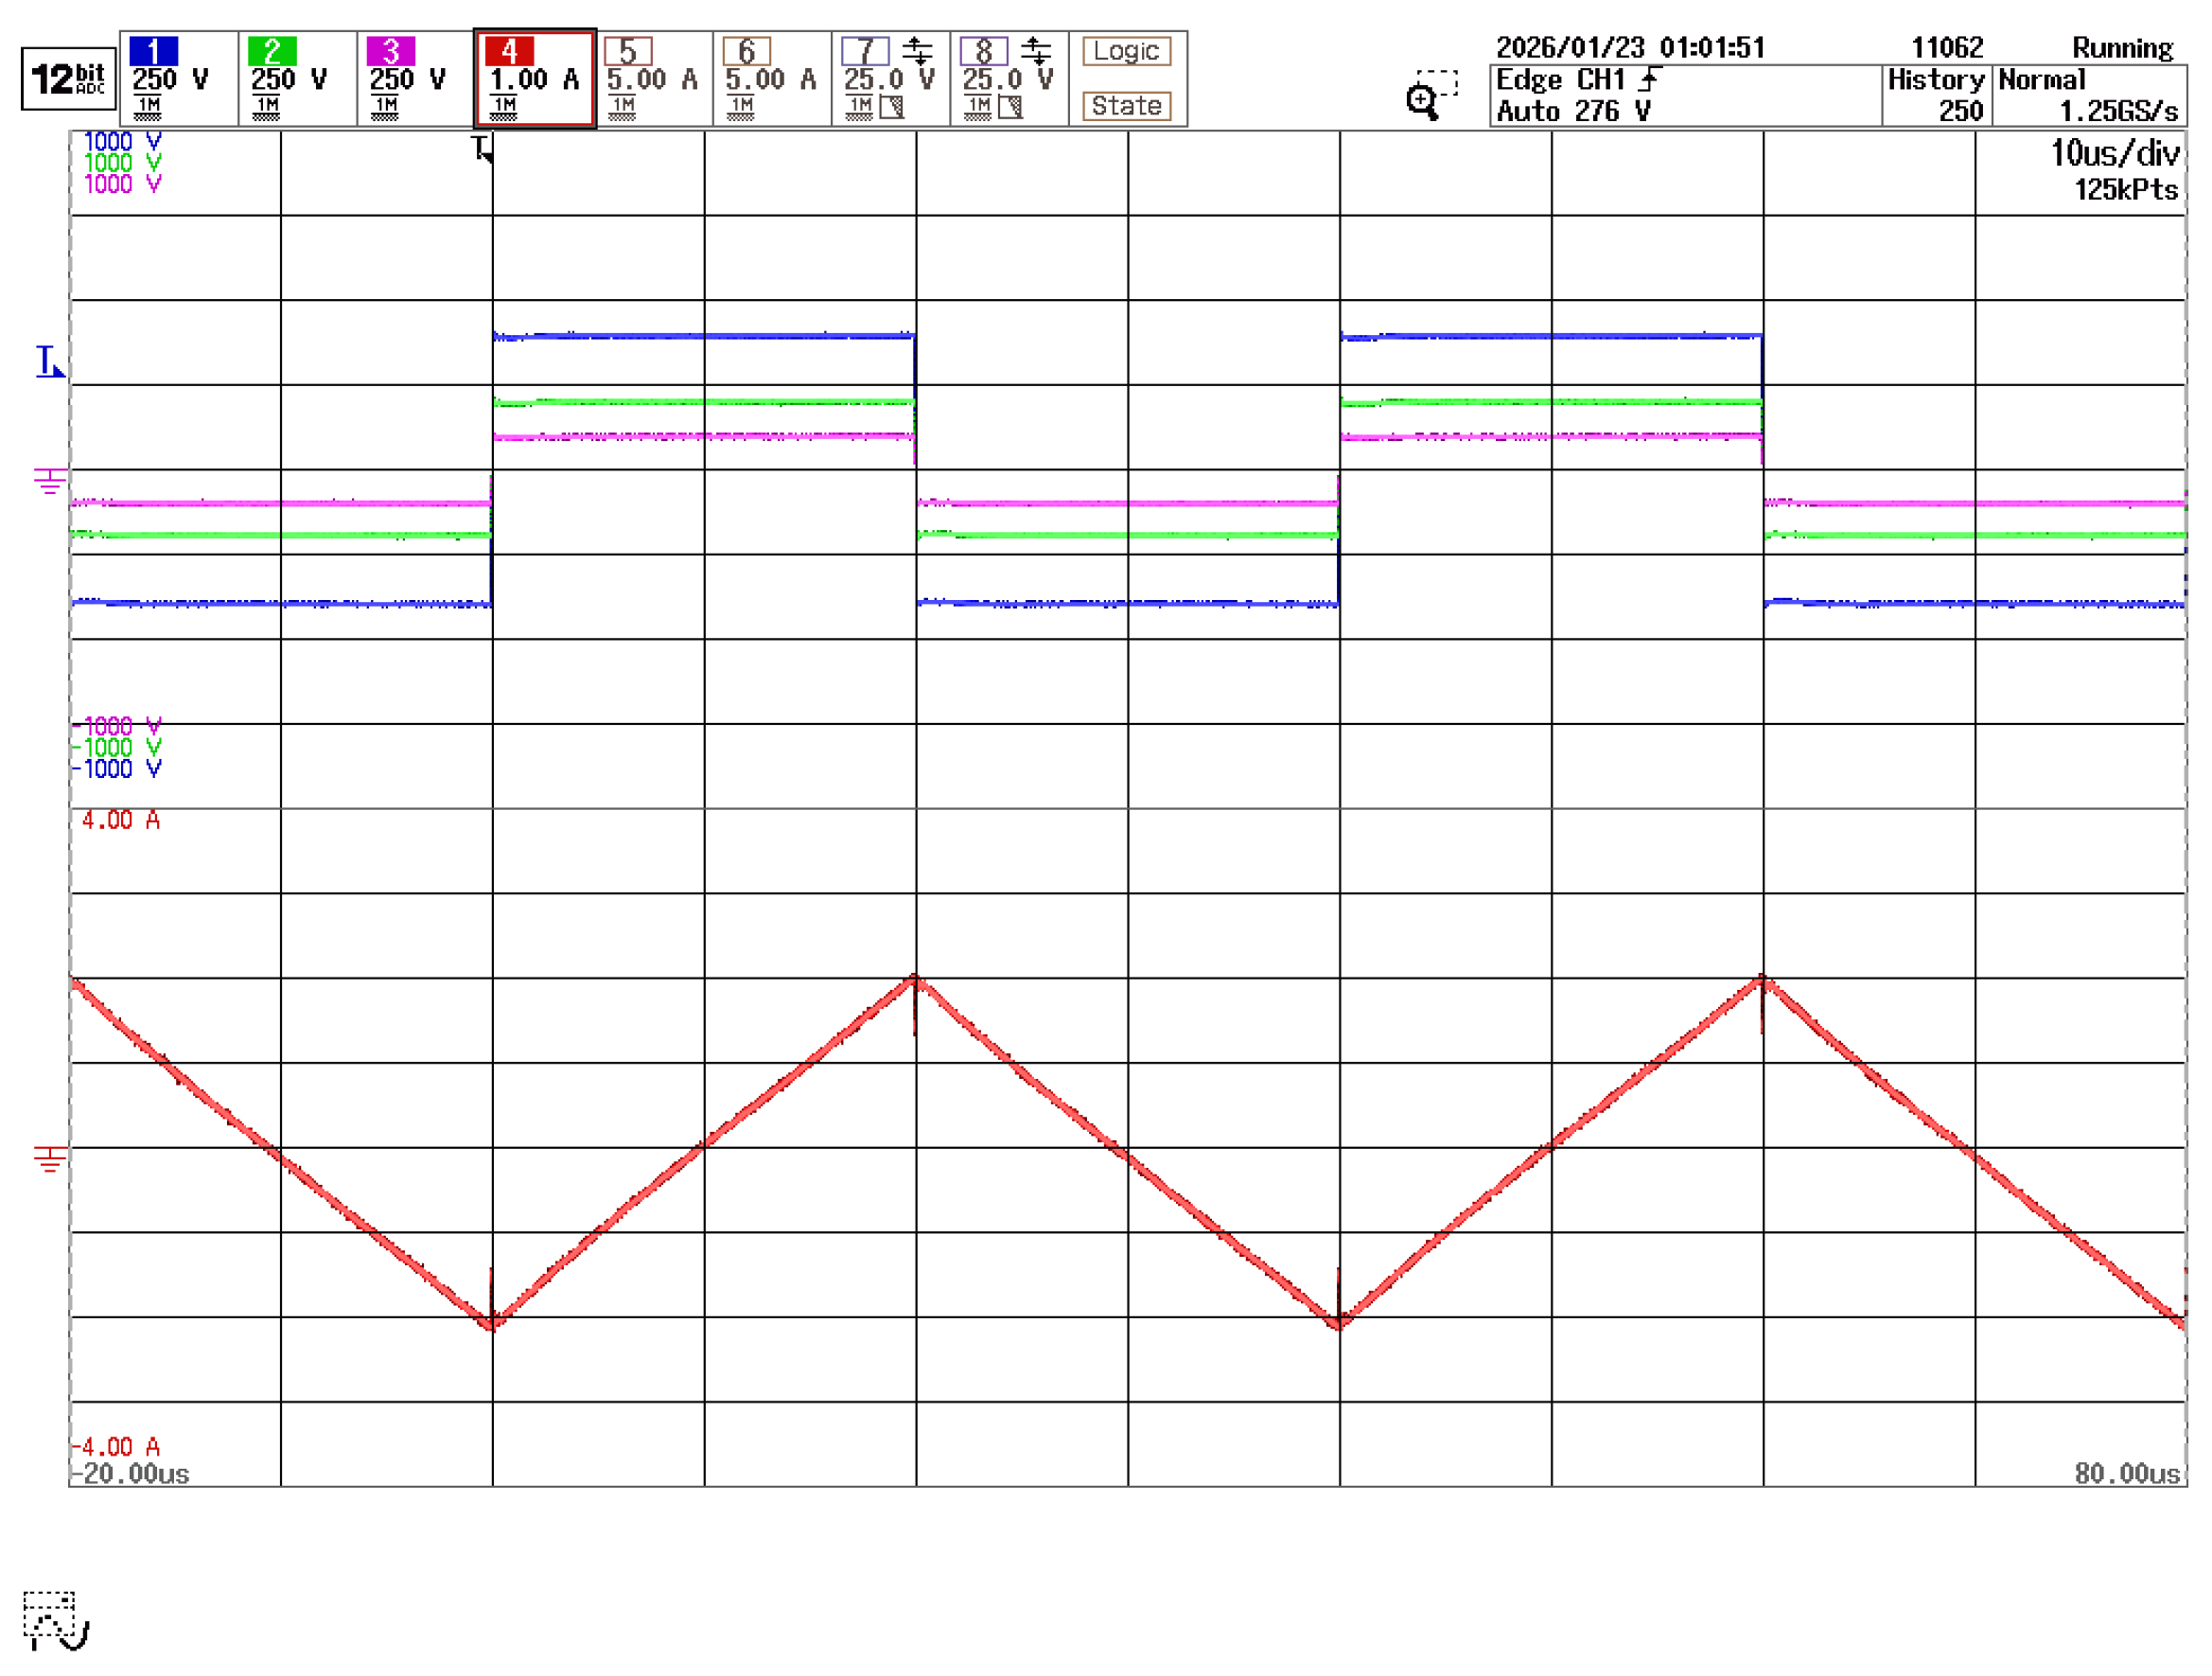
In order to determine the compensation, a square-wave voltage of 400 V at 25 kHz is applied to port P using the H-bridge converter. The corresponding measured voltage and current waveforms are reported in Figure 13. The operating conditions are selected to ensure that the transformer operates under representative power-converter conditions. The power absorbed during open-circuit excitation is P O C , H V E C = 22.5 W. The magnetizing inductance under HVEC, denoted as L m , H V E C , is extracted directly from the measured voltage and current waveforms shown in Figure 13, by evaluating the slope of the magnetizing current according to
V P = L m , H V E C d i P d t .
As a result, while the magnetizing inductance obtained under LVEC is approximately L m , P = 1.7 mH (see Table 1), the compensated magnetizing inductance under HVEC becomes L m , H V E C = 2.0 mH.
At the same time, the core-loss resistance under HVEC, R m , H V E C , is determined by matching the power absorption of the system. Accordingly, the compensated core-loss resistance assumes the value R m , P = 7.5 k Ω . Finally, the ESR damping elements adopted under HVEC correspond to the previously identified values R P , esr ( 0 ) , R S 1 , esr ( 0 ) , and R S 2 , esr ( 0 ) , preserving the physically grounded first-order damping estimation obtained from the impedance-based analysis. This ensures consistency with the measured 3 dB impedance behavior.

4.2. Model Validation

The 3W-HFT model, properly compensated under HVEC conditions, is validated under realistic operating conditions. Both a high-voltage open-circuit test and a full TAB converter test are conducted to verify the magnetization behavior and the influence of parasitic electrical elements. Moreover, TAB power losses are estimated based on experimental power and efficiency measurements.

4.2.1. Large-Signal Open-Circuit Validation

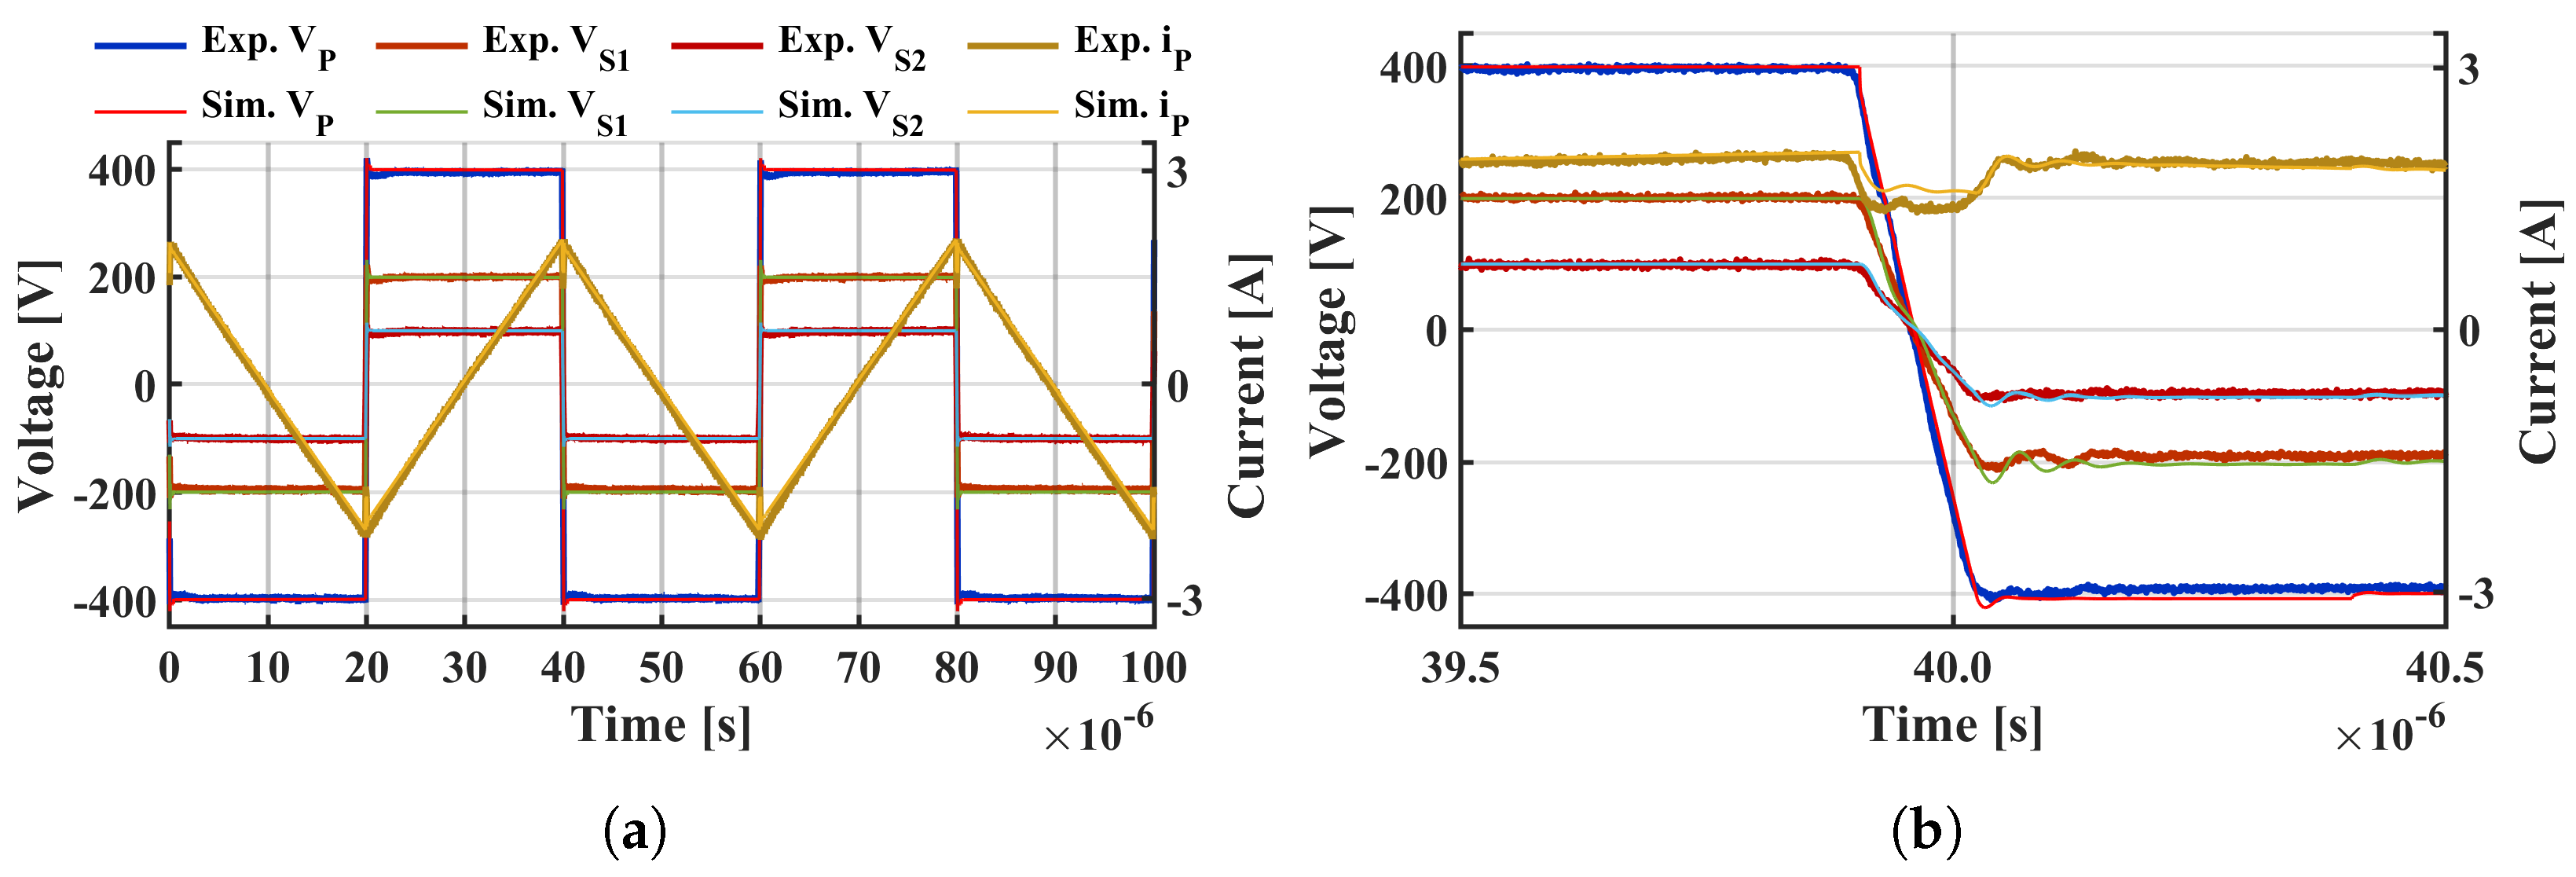
The open-circuit test performed on port P is used to experimentally validate the transformer parameters and the associated power absorption. A bipolar square-wave voltage of 400 V at a switching frequency of 25 kHz is generated by a single-phase H-bridge converter. In parallel, the PLECS simulation model is developed according to the schematic shown in Figure 14. The comparison between experimental and simulated waveforms is presented in Figure 15a,b. In particular, Figure 15a demonstrates the accurate reproduction of the primary magnetizing current and terminal voltages, while Figure 15b highlights the transient comparison during the converter dead-time interval of 250 ns. The results confirm that the proposed transformer model successfully captures the switching dynamics dominated by parasitic capacitances and displacement currents.
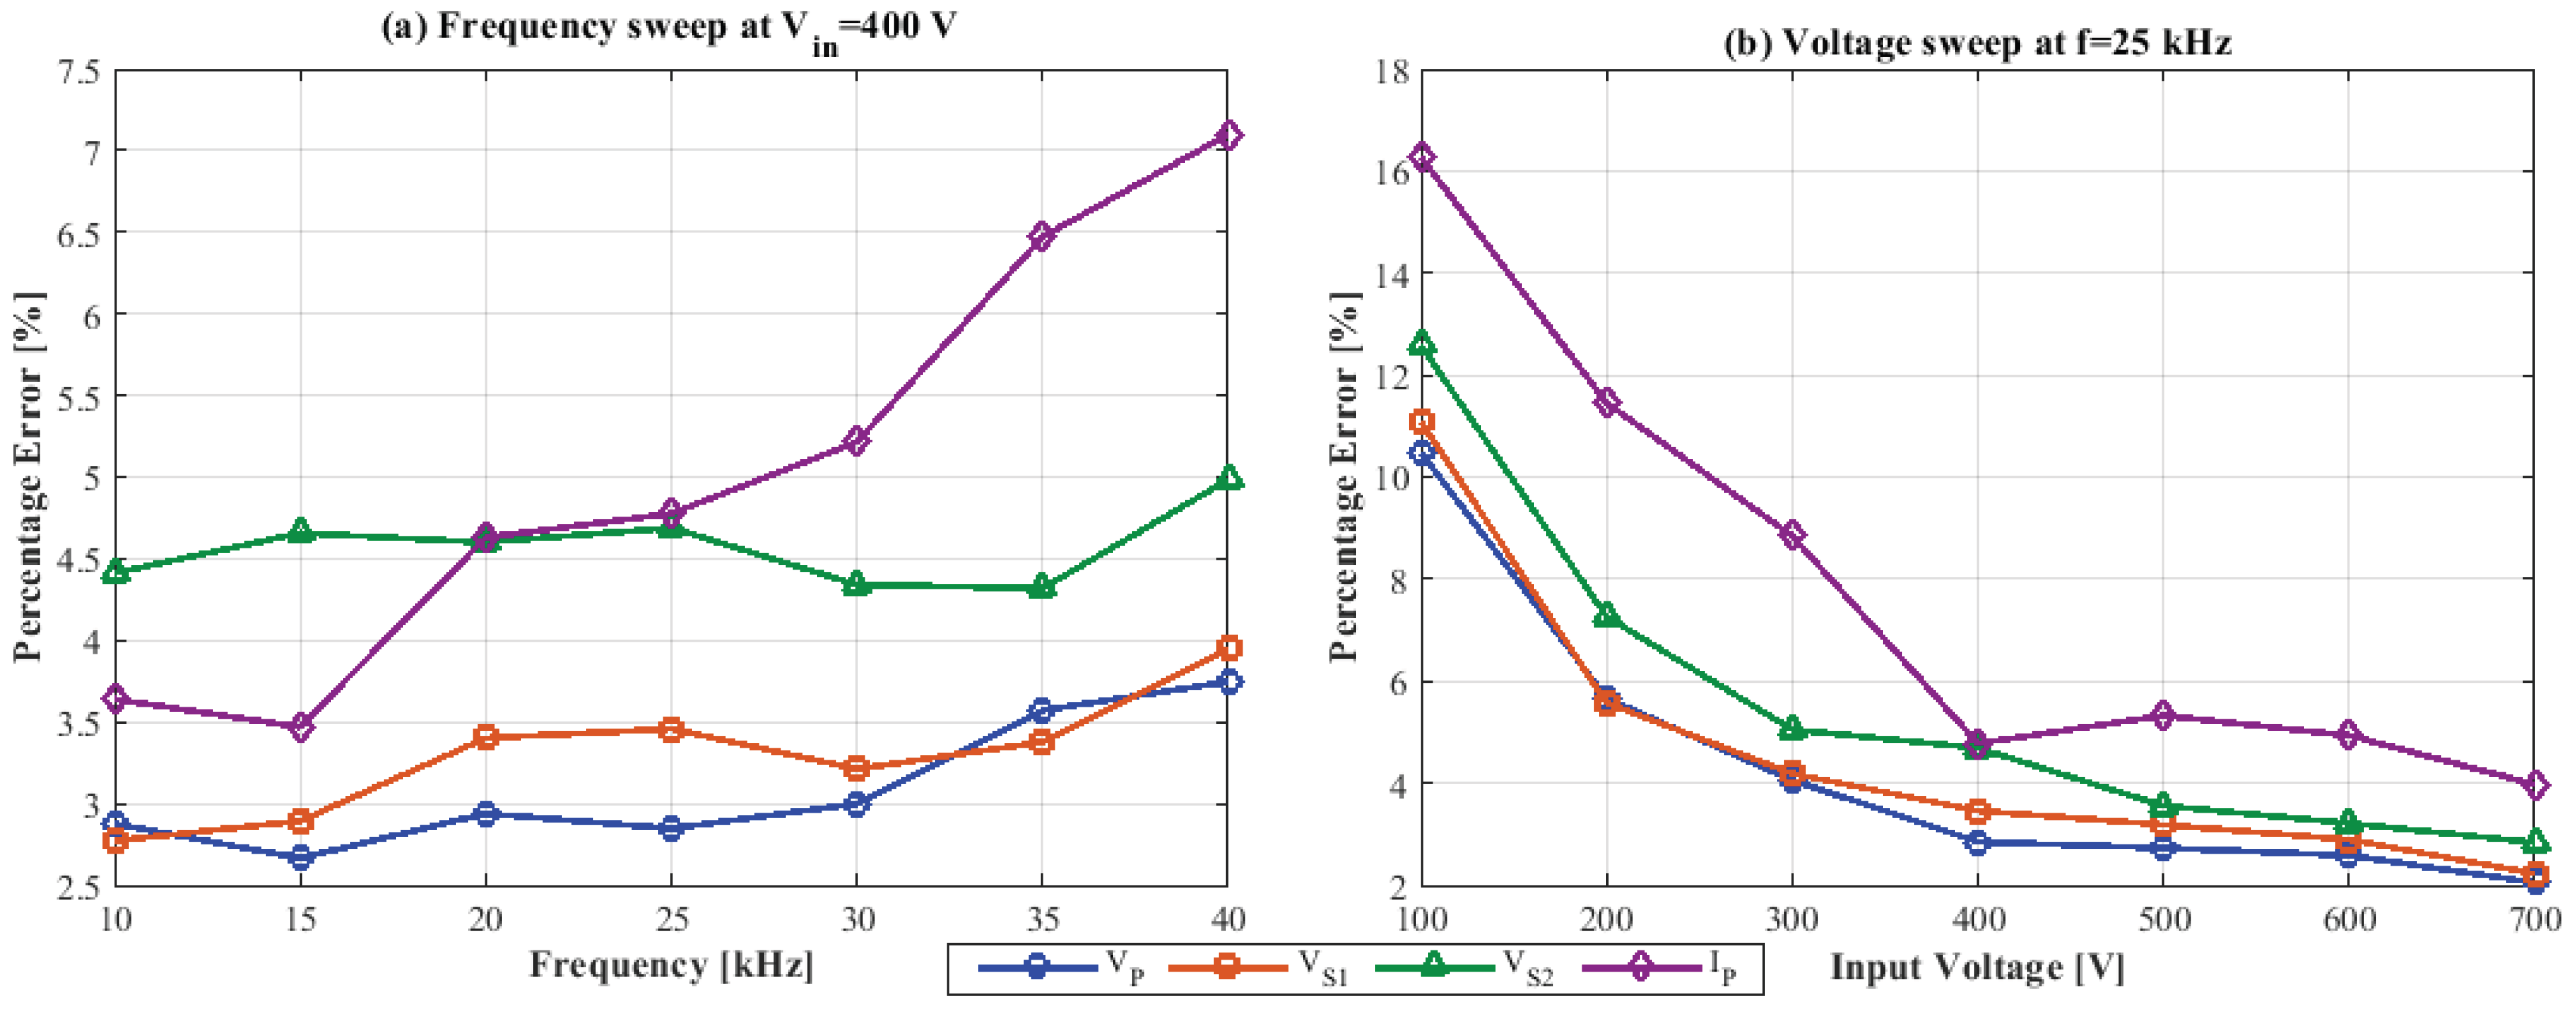
Additionally, the HVEC transformer model has been tested under various operating conditions to evaluate its accuracy in estimation. In particular, voltage and frequency ranges of 100 V to 700 V and 10 kHz to 40 kHz have been considered. Figure 16 displays the mean absolute percentage error (MAPE) for both the estimated voltage, V P , V S 1 , V S 2 , and current, I P , during transitioning conditions, i.e., the same time span as in Figure 15b. Figure 16a shows the MAPE evolution with respect to the frequency sweep when V P is set to 400 V. As expected, I P estimation is more accurate below the reference frequency of 25 kHz, where it presents higher amplitudes. Concurrently, voltage estimation is lower than 5% across the entire frequency range. In Figure 16b the MAPE varies concerning the voltage sweep when the switching frequency is 25 kHz. Notably, the MAPE is below 5% when V P is set to 400 V and remains consistent up to 700 V. Therefore, the results confirm that the proposed HVEC model maintains satisfactory agreement with experimental measurements over a broad operating range.
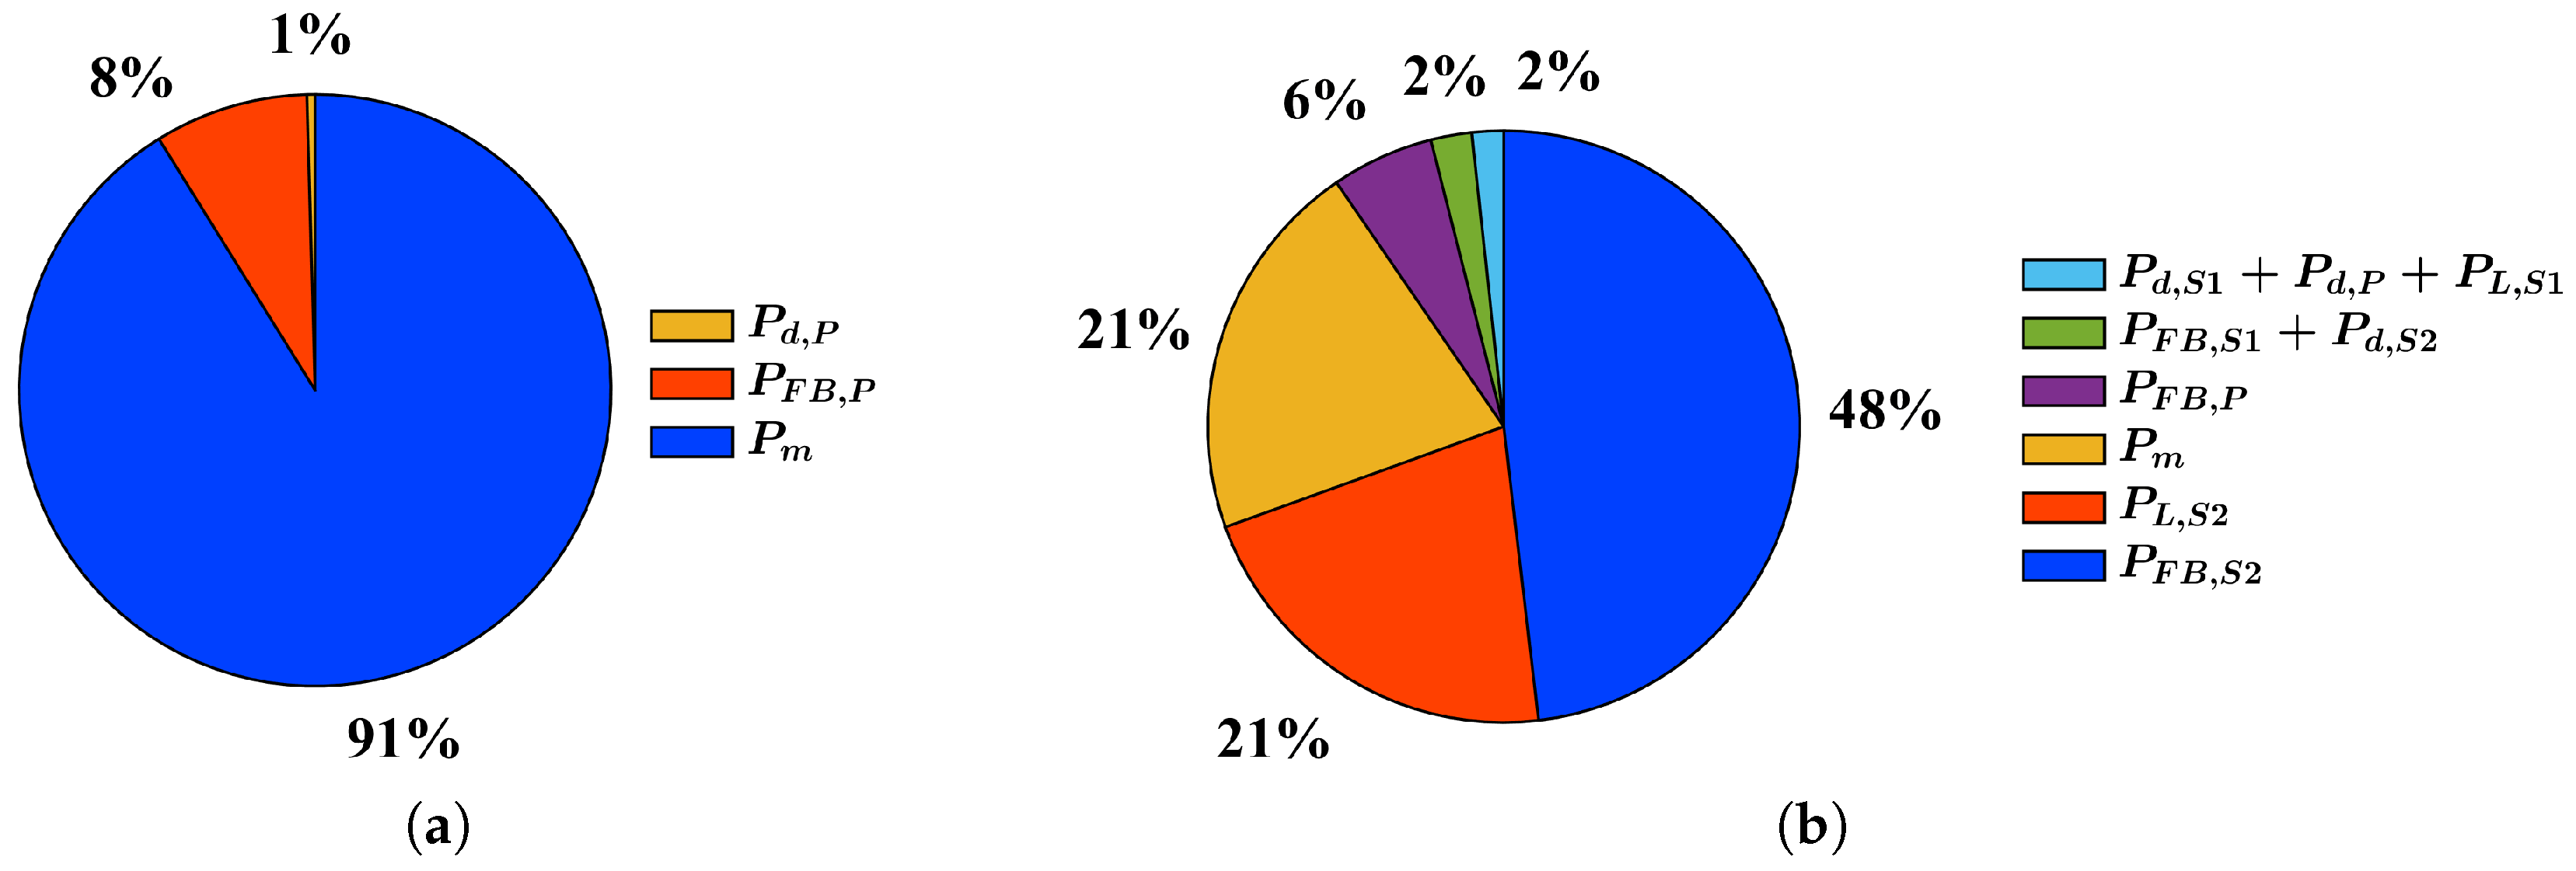
The power absorbed by the converter under PLECS simulation is of 22.6 W, which confirms the experimental result. Table 5 and Figure 17a show the loss estimation result. As expected, Figure 17a highlights that the majority of losses (91%) are due to the 3W-HFT. The remaining parts of the losses are distributed between the H-bridge on P (8%) and the winding losses (1% or less). Therefore, it is evident that the H-bridge is responsible for the majority of power losses after the transformer.

4.2.2. Full TAB Validation

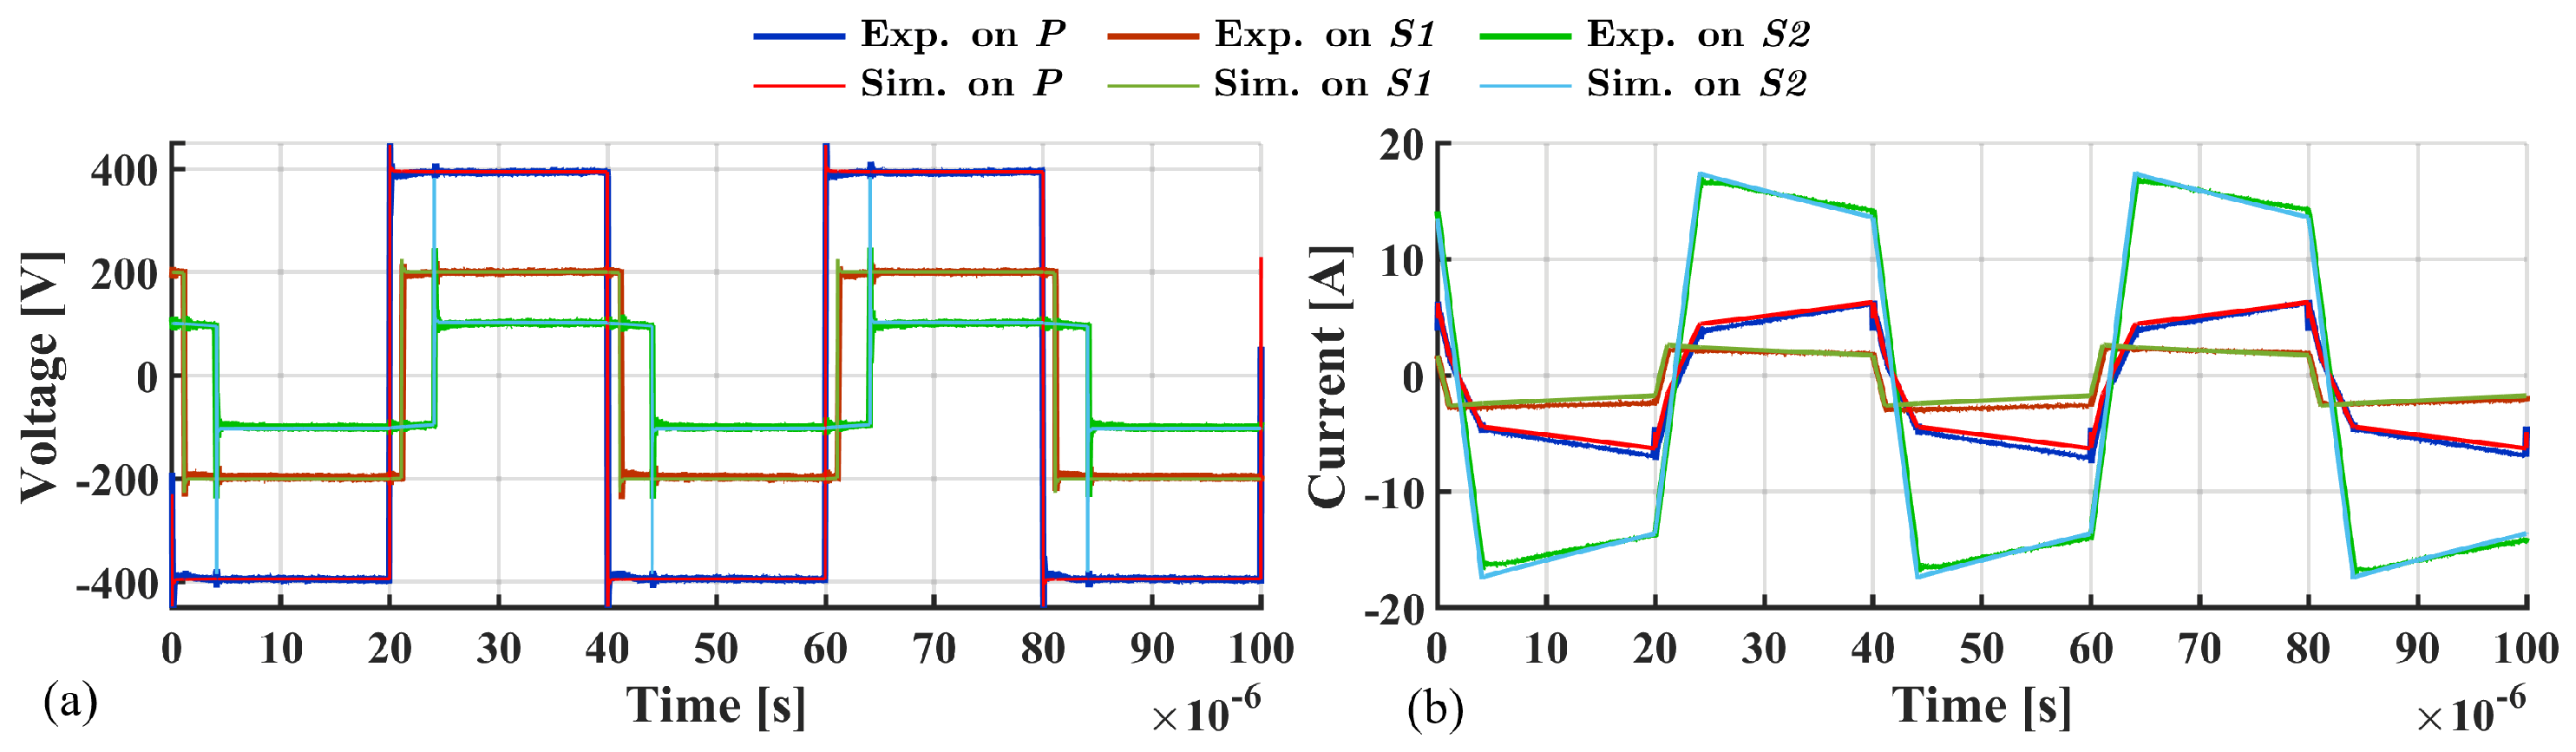
The full TAB has been assembled complying with Figure 12. Experimental tests and simulations have been carried out to verify the model accuracy under significant load conditions. The specific operating requirements of the targeted TAB application are 400 V on the input voltage and 25 kHz switching frequency, aligned with the intended converter-level use case. Figure 18 shows the experimental and simulated voltage and current waveforms while Table 6 reports the power supplied and absorbed by the loads placed on the TAB DC-links S 1 and S 2 . While testing, the TAB controller fixes the output voltage at 200 V and 100 V on S 1 and S 2 , respectively, in compliance with 3W-HFT turn ratios n S 1 and n S 2 . Placing the external leakage inductances on S 1 and S 2 ensures hardware decoupling between S 1 and S 2 , avoiding unpredictable circulating currents inside the 3W-HFT. This feature causes the TAB voltage to be controlled independently on S 1 and S 2 by the controller [5]. The experimental measurements show a good match with the simulation results, and the efficiency is established at about 94.3%. The estimation of the power losses are reported in Table 5 and Figure 17b. The overall input and output powers, as well as the efficiency, are directly obtained from experimental measurements using a high precision power analyzer. In addition, the HVEC open-circuit test provides the power absorbed by the transformer, which is attributed to the core-loss component. The remaining loss contributions reported in Table 5, including winding copper losses, external inductor losses, and switching device losses, are derived from the proposed model using the identified parameters and simulated current values under full TAB operating conditions. Notably, the 3W-HFT loss contributions represent the third major one. In fact, the first and the second major losses are on the H-bridge and the external leakage inductor on S 2 , respectively. This is due to the high current values flowing in S 2 . This aspect must be taken into account when designing the converter, and appropriate semiconductor devices must be selected accordingly.

5. Conclusions

This paper presented a systematic and experimentally validated methodology for the characterization of a three-winding high-frequency transformer based on a lumped-element equivalent circuit that captures both electromagnetic and electrostatic phenomena over a wide frequency range. The extracted parameters were first validated in the frequency domain, showing a close agreement between measured and simulated impedance magnitude and phase responses under both open-circuit and short-circuit test configurations. In particular, the proposed impedance-based characterization accurately captures the resonance behavior associated with stray capacitances and leakage inductances. Furthermore, the combination of low-voltage excitation (LVEC) parameter identification and high-voltage excitation (HVEC) compensation enables an improved representation of the transformer under realistic operating conditions. It has been shown that the use of HVEC-based magnetizing parameters significantly improves the agreement between simulated and experimental current waveforms compared to LVEC-based values. The resulting model was then implemented in a PLECS-based time-domain simulation framework and validated against experimental open-circuit excitation tests and full TAB operation performed using a SiC-based H-bridge converter operating at 400 V input voltage and 25 kHz of switching frequency. The strong correspondence between simulated and measured voltage and current waveforms confirms the capability of the proposed model to accurately reproduce the effects of stray capacitances and displacement currents during voltage commutation, which are critical in high-frequency multi-port converter operation. Finally, the comparison between measured and estimated input/output power demonstrates the accuracy of the proposed loss estimation approach, confirming the validity of the model also in terms of power-loss distribution under realistic TAB operating conditions. Overall, the proposed methodology provides a reliable and practical framework for the characterization and modeling of multi-winding high-frequency transformers in converter-oriented applications.

Author Contributions

Conceptualization, A.A., G.B. and A.D.; methodology, A.A., G.B. and A.D.; software, A.A. and G.B.; validation, A.A., G.B. and A.D.; formal analysis, A.A., G.B. and A.D.; investigation, A.A. and G.B.; resources, A.D.; data curation, A.A. and G.B.; writing—original draft preparation, A.A. and G.B.; writing—review and editing, G.B. and A.D.; visualization, A.A. and G.B.; supervision, G.B. and A.D.; project administration, A.D.; funding acquisition, A.D. All authors have read and agreed to the published version of the manuscript.

Funding

This study was carried out within the MOST—Sustainable Mobility National Research Center and received funding from the European Union Next-GenerationEU (National Recovery and Resilience Plan (NRRP)—Mission 4 Component 2, Investment 1.4, D.D. 1033 17/06/2022, CN00000023).

Institutional Review Board Statement

Not applicable.

Informed Consent Statement

Not applicable.

Data Availability Statement

Data supporting the reported results are available from the corresponding author upon reasonable request.

Acknowledgments

The authors wish to thank the staff of Sardegna Ricerche “Piattaforma Energie Rinnovabili” and specifically Carla Sanna and Malgorzata Gawronska for their active support.

Conflicts of Interest

The authors declare no conflict of interest.

Abbreviations

3W-HFTThree-Winding High-Frequency Transformer
TABTriple Active Bridge
IBCImpedance-Based Characterization
IBC-OCOpen-Circuit Impedance-Based Characterization
IBC-SCShort-Circuit Impedance-Based Characterization
LVECLow-Voltage Excitation Conditions
HVECHigh-Voltage Excitation Conditions
OCOpen Circuit
SCShort Circuit
ESREffective Series Resistance
OBCOnboard Charger
EVElectric Vehicle
MABMulti-Active Bridge
HFTHigh-Frequency Transformer

References

  1. Pradhan, R.; Keshmiri, N.; Emadi, A. On-Board Chargers for High-Voltage Electric Vehicle Powertrains: Future Trends and Challenges. IEEE Open J. Power Electron. 2023, 4, 189–207. [Google Scholar] [CrossRef]
  2. Yu, G.; Choi, S. An Effective Integration of APM and OBC With Simultaneous Operation and Entire ZVS Range for Electric Vehicle. IEEE Trans. Power Electron. 2021, 36, 10343–10354. [Google Scholar] [CrossRef]
  3. Chakraborty, S.S.; Dey, S.; Hatua, K. Design of a Three-Winding Transformer for Power Decoupling of a Three-Port Series Resonant Converter for an Integrated On-Board EV Charger. IEEE Trans. Power Electron. 2023, 38, 14262–14273. [Google Scholar] [CrossRef]
  4. Deb, S.; Pramanick, S.K. Investigation of Leakage Inductance in Three-Winding Transformer for Three-Port Integrated Onboard Chargers. In Proceedings of the 2024 IEEE Transportation Electrification Conference and Expo (ITEC), Chicago, IL, USA, 19–21 June 2024; pp. 1–6. [Google Scholar]
  5. Bossi, G.; Buccella, C.; Cecati, C.; Simonetti, F.; Damiano, A. A Battery-Based Auxiliary Power System for an All-Electric Aircraft: A Novel Converter Configuration. IEEE Trans. Ind. Appl. 2025, 61, 9493–9505. [Google Scholar] [CrossRef]
  6. Rahrovi, B.; Mehrjardi, R.T.; Ehsani, M. On the Analysis and Design of High-Frequency Transformers for Dual and Triple Active Bridge Converters in More Electric Aircraft. In Proceedings of the 2021 IEEE Texas Power and Energy Conference (TPEC), College Station, TX, USA, 2–5 February 2021; pp. 1–6. [Google Scholar]
  7. Alam, M.D.; Mahinur Rahman, M.; Husain, I.; Lukic, S. Circulating Power and Winding Current Minimization in a Triple Active Bridge DC-DC Converter with Optimized Leakage Inductance Design. In Proceedings of the 2024 IEEE Applied Power Electronics Conference and Exposition (APEC), Long Beach, CA, USA, 25–29 February 2024; pp. 474–480. [Google Scholar]
  8. Byun, H.J.; Park, J.M.; Yi, J.; Won, C.Y. Zero-Voltage-Switching Analysis Model of the Triple-Active-Bridge Converter. Energies 2023, 16, 7763. [Google Scholar] [CrossRef]
  9. Chattopadhyay, R.; Juds, M.A.; Ohodnicki, P.R.; Bhattacharya, S. Modelling, design and analysis of three limb high frequency transformer including transformer parasitics, for SiC Mosfet based three port DAB. In Proceedings of the IECON 2016—42nd Annual Conference of the IEEE Industrial Electronics Society, Florence, Italy, 23–26 October 2016; pp. 4181–4186. [Google Scholar]
  10. Arshad, A.; Bossi, G.; Damiano, A. A Three-Winding High-Frequency Transformer Characterization for Multi-Active Bridge Design. In Proceedings of the IECON 2025—51st Annual Conference of the IEEE Industrial Electronics Society, Madrid, Spain, 14–17 October 2025; pp. 1–7. [Google Scholar]
  11. Guillod, T.; Krismer, F.; Kolar, J.W. Magnetic equivalent circuit of MF transformers: Modeling and parameter uncertainties. Electr. Eng. 2018, 100, 2261–2275. [Google Scholar] [CrossRef]
  12. Gawrylczyk, K.M.; Banaszak, S. Recent Developments in the Modelling of Transformer Windings. Energies 2021, 14, 2798. [Google Scholar] [CrossRef]
  13. Yoon, Y.; Son, Y.; Cho, J.; Jang, S.; Kim, Y.G.; Choi, S. High-Frequency Modeling of a Three-Winding Power Transformer Using Sweep Frequency Response Analysis. Energies 2021, 14, 4009. [Google Scholar] [CrossRef]
  14. Gómez-Luna, E.; Candelo-Becerra, J.E.; Vasquez, J.C. A New Method for Complex Impedance Measurement of Power Transformers via a Continuous Wavelet Transform. Energies 2024, 17, 6056. [Google Scholar] [CrossRef]
  15. Liu, Y.; Li, C.; Guo, Z.; Ren, F.; Liu, F.; Fu, Y.; Zhu, Y.; Wang, X. Broadband Modelling of Power Transformers for Sweep Frequency Impedance Studies on Winding Short-Circuit Faults. Electronics 2023, 12, 4068. [Google Scholar] [CrossRef]
  16. Lu, H.Y.; Zhu, J.G.; Hui, S. Experimental determination of stray capacitances in high frequency transformers. IEEE Trans. Power Electron. 2003, 18, 1105–1112. [Google Scholar] [CrossRef]
  17. De Grève, Z.; Deblecker, O.; Lobry, J. Numerical Modeling of Capacitive Effects in HF Multiwinding Transformers—Part II: Identification Using the Finite-Element Method. IEEE Trans. Magn. 2013, 49, 2021–2024. [Google Scholar] [CrossRef]
  18. Guillod, T.; Färber, R.; Krismer, F.; Franck, C.M.; Kolar, J.W. Computation and analysis of dielectric losses in MV power electronic converter insulation. In Proceedings of the 2016 IEEE Energy Conversion Congress and Exposition (ECCE), Milwaukee, WI, USA, 18–22 September 2016; pp. 1–8. [Google Scholar]
  19. Olowu, T.O.; Jafari, H.; Peirano, I.; Mahmoudi, M.; Sarwat, A. Parasitic Parameter Analysis of High Frequency Transformer for Series Resonant Converter with Experimental Validation. In Proceedings of the 2021 IEEE Transportation Electrification Conference & Expo (ITEC), Chicago, IL, USA, 16–18 June 2021; pp. 15–19. [Google Scholar]
  20. Herrera Portilla, W. Analysis of the non-linear behaviour of the magnetisation inductance during the frequency response test of a transformer. IET Sci. Meas. Technol. 2019, 13, 1186–1193. [Google Scholar] [CrossRef]
  21. Bossi, G.; Arshad, A.; Damiano, A. Comparative Analysis of Three-Winding High-Frequency Transformer Parameter Estimation Methodologies. In Proceedings of the 2025 International Conference on Clean Electrical Power (ICCEP), Villasimius, Italy, 24–26 June 2025; pp. 956–961. [Google Scholar]
  22. Canal, T.; Zgainski, F.X.; Renouard, V.L. Determination of the saturation curve of power transformers by processing transient measurements. Electr. Power Syst. Res. 2021, 195, 107153. [Google Scholar] [CrossRef]
  23. Nasirpour, F.; Heidary, A.; Niasar, M.G.; Lekić, A.; Popov, M. High-frequency transformer winding model with adequate protection. Electr. Power Syst. Res. 2023, 223, 109637. [Google Scholar] [CrossRef]
  24. Leibl, M.; Ortiz, G.; Kolar, J.W. Design and Experimental Analysis of a Medium-Frequency Transformer for Solid-State Transformer Applications. IEEE J. Emerg. Sel. Top. Power Electron. 2017, 5, 110–123. [Google Scholar] [CrossRef]
  25. Lan, Y.; Yang, L.; Zhang, X.; Chen, Q.; Zheng, Z. Calculation Model of Parasitic Capacitance for High-Frequency Inductors and Transformers. IEEE Access 2023, 11, 143182–143189. [Google Scholar] [CrossRef]
Figure 1. π lumped transformer topology of the 3W-HFT.
Energies 19 02547 g001
Figure 2. Generalized open-circuit equivalent model of the 3W-HFT: (a) lumped equivalent circuit; (b) impedance equivalent circuit.
Energies 19 02547 g002
Figure 3. Generalized short-circuit equivalent model of the 3W-HFT: (a) lumped equivalent circuit; (b) simplified impedance equivalent circuit.
Energies 19 02547 g003
Figure 4. Measurement setup including the Keysight E4990A precision impedance analyzer and the 3W-HFT under test.
Energies 19 02547 g004
Figure 5. Measured open-circuit impedance magnitude and phase of the transformer windings.
Energies 19 02547 g005
Figure 6. Measured short-circuit impedance magnitude and phase of the transformer windings.
Energies 19 02547 g006
Figure 7. Short-circuit (a) k = P , S 1 and S 2 in short-circuit; (b) k = S 1 , P and S 2 in short-circuit; (c) k = S 2 , S 1 and P in short-circuit.
Energies 19 02547 g007
Figure 8. Capacitance measurement setup for the three-winding transformer: (a) configuration for identifying C P S 1 , C P S 2 , and C S 1 S 2 ; (b) equivalent inter-winding capacitance measurement topology.
Energies 19 02547 g008
Figure 11. Picture of the TAB test bench (#1) TAB’s full bridges; (#2) Imperix B-Box RCP 3.0 controller; (#3) PC for Matlab/Simulink coding; (#4) 3W-HFT and external inductors; (#5) DC power supply PS 10750-120; (#6) Resistors load, (#7) Oscilloscope Yokogawa DLM5058HD; (#8) Power analyser Yokogawa WT5000.
Energies 19 02547 g011
Figure 12. TAB topology.
Energies 19 02547 g012
Figure 13. Measured voltage (blue, green and violet) and current (red) waveforms during open-circuit transformer excitation at 25 kHz.
Energies 19 02547 g013
Figure 14. Schematic of the open-circuit experimental test bench and PLECS simulation topology.
Energies 19 02547 g014
Figure 15. Comparison between experimental and simulated transformer voltage and current waveforms under HVEC open-circuit excitation conditions: (a) 100 μ s time span; (b) zoom of the dead-band region.
Energies 19 02547 g015
Figure 16. MAPE based accuracy evaluation of the proposed HVEC model under different operating conditions: (a) frequency sweep at V i n = 400 V and (b) voltage sweep at f = 25 kHz.
Energies 19 02547 g016
Figure 17. Estimation of the power losses distribution: (a) HVEC open-circuit test; (b) Full TAB test.
Energies 19 02547 g017
Figure 18. Comparison between experimental and simulated transformer voltage and current waveforms under full TAB test conditions (a) voltage waveforms; (b) current waveforms.
Energies 19 02547 g018
Table 1. Extracted lumped equivalent circuit parameters of the investigated 3W-HFT.
ParameterSymbolValue
Leakage Inductances
Primary leakage inductance L d , P 3.0537 μ H
Secondary-1 leakage inductance L d , S 1 0.7178 μ H
Secondary-2 leakage inductance L d , S 2 0.4092 μ H
Magnetizing Inductances (OC, Port Dependent)
Primary magnetizing inductance L m , P 1.6749 mH
Secondary-1 magnetizing inductance L m , S 1 0.4205 mH
Secondary-2 magnetizing inductance L m , S 2 0.1051 mH
Series Winding Resistances
Primary leakage resistance R d , P 19.75 m Ω
Secondary-1 leakage resistance R d , S 1 13.45 m Ω
Secondary-2 leakage resistance R d , S 2 5.57 m Ω
Core-Loss Resistances
Primary core-loss resistance R m , P 147 k Ω
Secondary-1 core-loss resistance R m , S 1 37.2 k Ω
Secondary-2 core-loss resistance R m , S 2 9.71 k Ω
Self Stray Capacitances (Port Dependent)
Primary stray capacitance C d , P O C 52.32 pF
Secondary-1 stray capacitance C d , S 1 O C 240.39 pF
Secondary-2 stray capacitance C d , S 2 O C 997.97 pF
Self Stray Capacitances (Unified L m )
Primary stray capacitance (core) C d , P c o r e 52.32 pF
Secondary-1 stray capacitance (core) C d , S 1 c o r e 56.28 pF
Secondary-2 stray capacitance (core) C d , S 2 c o r e 57.36 pF
Inter-Winding Capacitances
Primary–Secondary-1 capacitance C P S 1 2.692 pF
Primary–Secondary-2 capacitance C P S 2 2.884 pF
Secondary-1–Secondary-2 capacitance C S 1 S 2 2.746 pF
Capacitor ESR (Resonance Damping)
Primary ESR R P , e s r 263.57 Ω
Secondary-1 ESR R S 1 , e s r 66.17 Ω
Secondary-2 ESR R S 2 , e s r 16.58 Ω
Table 2. Half-bridge module rating.
ParameterSymbolValueUnit
DC rated voltage U D C 800V
DC maximum continuous current I D C max 24ARMS
DC maximum pulsed current I D C pulsed 80A
Reference switching frequency f s w 25kHz
DC-link capacitance C D C 260 μ F
Table 3. SiC MOSFET electrical characteristics.
ParameterSymbolValueUnit
Drain–source voltage U d s 1200V
Continuous drain current I D SiC 24A
Reference switching frequency f s w 25kHz
On-state resistance R d s o n 88m Ω
Turn-on switching energy E o n s w 265 μ J
Turn-off switching energy E o f f s w 135 μ J
Table 4. Measurement instruments and accuracy specifications.
Instrument ModelAccuracy
Impedance AnalyzerKeysight E4990A ± 0.045 % (typ.), ± 0.08 % (spec.)
OscilloscopeYokogawa DLM5058HD ± 1 % (typ.)
Power AnalyzerYokogawa WT5000 ± 0.03 % (power, 50/60 Hz)
DC Power SupplyEA PS 10750-120 0.05 % FS (voltage), ≤ 0.1 % FS (current)
Table 5. Power losses estimation for HVEC open-circuit test and full TAB test.
Power Comp.Loss. Estim. HVEC OCLoss. Estim. Full TAB
P m 20.6 W20.6 W
P d , P 0.1 W0.6 W
P d , S 1 /0.1 W
P d , S 2 /1.1 W
P L , S 1 /1.0 W
P L , S 2 /21.0 W
P F B , P 1.9 W5.5 W
P F B , S 1 /1.1 W
P F B , S 2 /47.3 W
Table 6. Comparison of experimental measurement and simulation estimation of power and efficiency into the TAB.
Power Comp.Exp. Meas.Sim. Estim.Estim. Error
P I 1675 W1682 W0.42%
P O , S 1 398.5 W399.7 W0.30%
P O , S 2 1181 W1184 W0.25%
η T A B 94.3%94.2%0.10%
Disclaimer/Publisher’s Note: The statements, opinions and data contained in all publications are solely those of the individual author(s) and contributor(s) and not of MDPI and/or the editor(s). MDPI and/or the editor(s) disclaim responsibility for any injury to people or property resulting from any ideas, methods, instructions or products referred to in the content.