Article

Modelling and Simulation of a Resilient and Straightforward Energy Management System for a DC Microgrid in a Cruise Ship Firezone

by
Rafika El Idrissi
,
Robert Beckmann
*,
Saikrishna Vallabhaneni
,
Frank Schuldt
and
Karsten von Maydell
Institute of Networked Energy Systems, German Aerospace Center (DLR), Carl-von-Ossietzky-Straße 15, 26129 Oldenburg, Germany
*
Author to whom correspondence should be addressed.
Energies 2026, 19(11), 2512; https://doi.org/10.3390/en19112512
Submission received: 26 February 2026 / Revised: 17 April 2026 / Accepted: 20 May 2026 / Published: 23 May 2026
(This article belongs to the Topic Marine Energy)

Abstract

This paper presents a practical and communication-independent energy management system (EMS) for a DC microgrid supply within the firezone of a cruise ship. The proposed approach prioritizes operational reliability and fault tolerance under emergency conditions, where communication availability and control complexity should be minimized. The proposed DC microgrid integrates photovoltaic systems (PVs), fuel cell systems (FCs), and lithium-iron-phosphate (LFP) battery energy storage systems (BESSs), coordinated through a rule-based EMS combined with droop-controlled converters. The electrical topology considered in this study is a collaborative development of the project consortium of the publicly funded project Sustainable DC Systems (SuSy), featuring a novel configuration with two independent horizontal busbars for the Cabin Area Distribution (CAD) and Technical Area Distribution (TAD). The EMS can manage two operational scenarios: (i) regular operation, with two decentralized droop controls where power generation is distributed among all generators based on their respective capacities, and a power curtailment strategy is applied to prevent overcharging of BESSs; and (ii) irregular operation, where a fault on one of the vertical busbars triggers the use of reserved battery storage capacity on both sides of the ship and activates load-shedding to ensure continued operation of critical loads and sustain grid functionality. The effectiveness of the proposed architecture is validated through detailed MATLAB/Simulink simulations. Under regular conditions, the EMS achieves stable voltage regulation, balanced power sharing, and efficient energy curtailment. During fault conditions, the battery storage on both sides successfully supports the critical loads. The fuel cells are operated in power-controlled mode effectively up to their full rated 6 k W capacity while the DC bus voltage stabilization is ensured by the battery energy storage systems. These results validate the proposed EMS as a robust and low-complexity solution for maritime DC microgrids, offering stable voltage regulation, effective load prioritization, and resilient operation of critical loads.

1. Introduction

The shipping industry serves as the backbone of global commerce, not only by enabling the large-scale movement of goods but also by offering transport and leisure experiences to millions of passengers worldwide. In particular, the cruise industry has become a significant segment within maritime transportation, combining international travel and tourism. However, the environmental impact of shipping cannot be overlooked. According to the Fourth International Maritime Organization (IMO) Greenhouse Gas (GHG) Study (2020) [1], maritime transport was responsible for approximately 2.89% of global anthropogenic GHG emissions in 2018. Without mitigation measures, these emissions could increase to 90–130% above 2008 levels by 2050.
The maritime sector has traditionally relied on diesel-powered vessels, contributing heavily to air pollution and climate change [2]. Recognizing this, the IMO adopted a revised emissions reduction strategy in 2023. This framework aims to cut annual GHG emissions from ships by at least 20%—and ideally by 30%—by 2030, with a more ambitious target of up to 80% by 2040, compared to 2008 levels [3]. As a result, the urgent need to reduce emissions has driven researchers to explore alternative cleaner energy solutions for the maritime industry. One promising solution is the integration of renewable energy sources (RES) with energy storage, which can meet energy demand and reduce the environmental footprint [4,5].
The adoption of DC distribution systems is also gaining momentum due to their ability to effectively manage power distribution and to integrate RES technologies [6]. The adoption of DC microgrid architectures, incorporating both DC sources and loads, holds significant advantages for maritime applications. Recent studies have emphasized the advantages of DC shipboard microgrids in terms of efficiency, integration of renewable sources, and simplified power conversion, particularly for all-electric and hybrid marine vessels [7,8]. Additionally, onboard DC distribution systems offer easy integration of various types of RES and avoid frequency constraints and power synchronization issues, enabling independent control of each generator set across a variable speed range, typical in AC distribution systems [9].
Over recent decades, numerous research studies and commercial projects have focused on DC distribution systems for ships, including tugs, river boats, and demonstrators equipped with RES [10,11,12]. Simmonds [13] investigated the benefits and motivations for adopting DC distribution systems in naval vessels. Furthermore, DC systems are also explored for military ships, especially in the USA, with support from funding initiatives by the Office of Naval Research [14]. In 2015, Siemens launched offshore support vessels equipped with DC power systems known as “Edda Ferd” [15]. These vessels offer the advantage of fuel savings through the integration of battery technology. Given the growing interest in DC distribution systems, this paper explores their application in the context of cruise ships. These ships are typically divided into distinct areas referred to as firezones, with each zone consisting of multiple floors known as decks.
Despite the many benefits offered by DC distribution systems, integrating different energy sources and coordinating between them can lead to complex power flows. Therefore, an energy management system (EMS) is essential [16]. The EMS plays a key role in ensuring an effective and safe supply of power from distributed generators to the loads, especially under complex load fluctuations. It also prevents circulating currents, overstress, and stability issues [17,18,19]. However, decentralized and droop-based control strategies remain attractive for safety-critical DC microgrids due to their inherent robustness and reduced dependence on communication infrastructure, despite limited global optimality [20,21].
The main concerns of the EMS are voltage regulation and accurate current sharing among parallel energy sources. Several research articles have addressed energy management techniques aimed at enhancing microgrid reliability [22,23,24]. For instance, Ref. [25] proposed a multi-variable optimal energy management strategy for standalone DC microgrids, employing a non-linear model predictive control (NMPC) algorithm. This method aims to support constant current and constant voltage charging regimes to prolong battery lifespan. Additionally, Ref. [26] presented an EMS for a hybrid energy source-based standalone marine microgrid. The proposed technique is based on optimal power source scheduling to reduce operating and maintenance costs. Furthermore, Ref. [27] investigated an EMS approach focused on fuel consumption, fault compensation, and emissions, employing a variable-speed paradigm with diesel engine (DE)-driven permanent magnet synchronous generators (PMSG), replacing the traditional fixed-speed model. Moreover, Ref. [28] introduced a hierarchical power-sharing control method to enhance the efficiency of DC shipboard microgrids. Although various EMS solutions have been proposed for shipboard and DC microgrids [7,8,20], limited attention has been paid to communication-independent EMS designs specifically tailored for cruise ship firezones under emergency conditions.
In recent years, fault diagnosis in shipboard power systems has increasingly moved towards adopting intelligent frameworks based on machine learning and other data-driven approaches. Methods based on deep learning, graph-based models, and multi-physics analysis have shown strong potential in detecting and classifying faults under complex and dynamic operating conditions [29,30]. These approaches can improve fault detection accuracy and enable earlier identification of most abnormal conditions highlighted in [23], which is particularly important for safety-critical maritime applications. However, in practical applications, fault detection is not always instantaneous, and delays or false alarms may occur due to measurement noise, model uncertainty, or communication limitations. Such imperfections can influence the downstream EMS, especially during emergency situations where rapid and reliable actions such as load shedding or source reconfiguration are required.
To address this, the EMS proposed in this work adopts a simple and rule-based structure with a focus on robustness and predictable operation. The decentralized droop control and predefined thresholds allow the system to maintain stable performance even in the presence of delayed or imperfect fault signals. In particular, the reliance on local control actions reduces sensitivity to communication delays, while conservative load prioritization ensures that critical loads remain supplied despite potential false alarms. This provides an inherent level of fault tolerance at the control level and supports a reliable physical response of the system under uncertain diagnostic conditions.
This study investigates the application of EMS strategies to improve the reliability of shipboard DC microgrids, as part of the Sustainable DC-Systems (SuSy) project. Further information on the SuSy project’s background, development, and applications can be found in [31], which provides a thorough examination of the project’s outcomes and implications. The EMS framework is tailored for implementation within the firezones of a cruise ship, where power supply is carried out by two main generators (MGs), one located on the port side and one on the starboard side. To optimize energy efficiency and reduce fuel consumption, we integrate DC-based distributed generators, including photovoltaic systems (PVs), fuel cell systems (FCs), and lithium-iron-phosphate (LFP) battery energy storage systems (BESSs), into the system. The BESSs are designed to ensure system resilience during various operating conditions, thereby enhancing the overall performance of the shipboard power system.
The main novelty of this work lies in the integration of a fully decentralized EMS within a firezone DC microgrid architecture that is communication-independent during faults, enabling coordinated operation of multiple energy sources under both normal and fault conditions without relying on centralized supervision.
This article is organized as follows: Section 2 presents the system description. Section 3 presents the dynamic modeling of power architectures in the DC grid. Section 4 describes the implemented EMS. Section 5 presents the simulation results. Finally, Section 6 and Section 7 outline the paper’s discussion, conclusion, and future work.

2. System Description

2.1. DC Distribution System of the Considered Cruise Ship

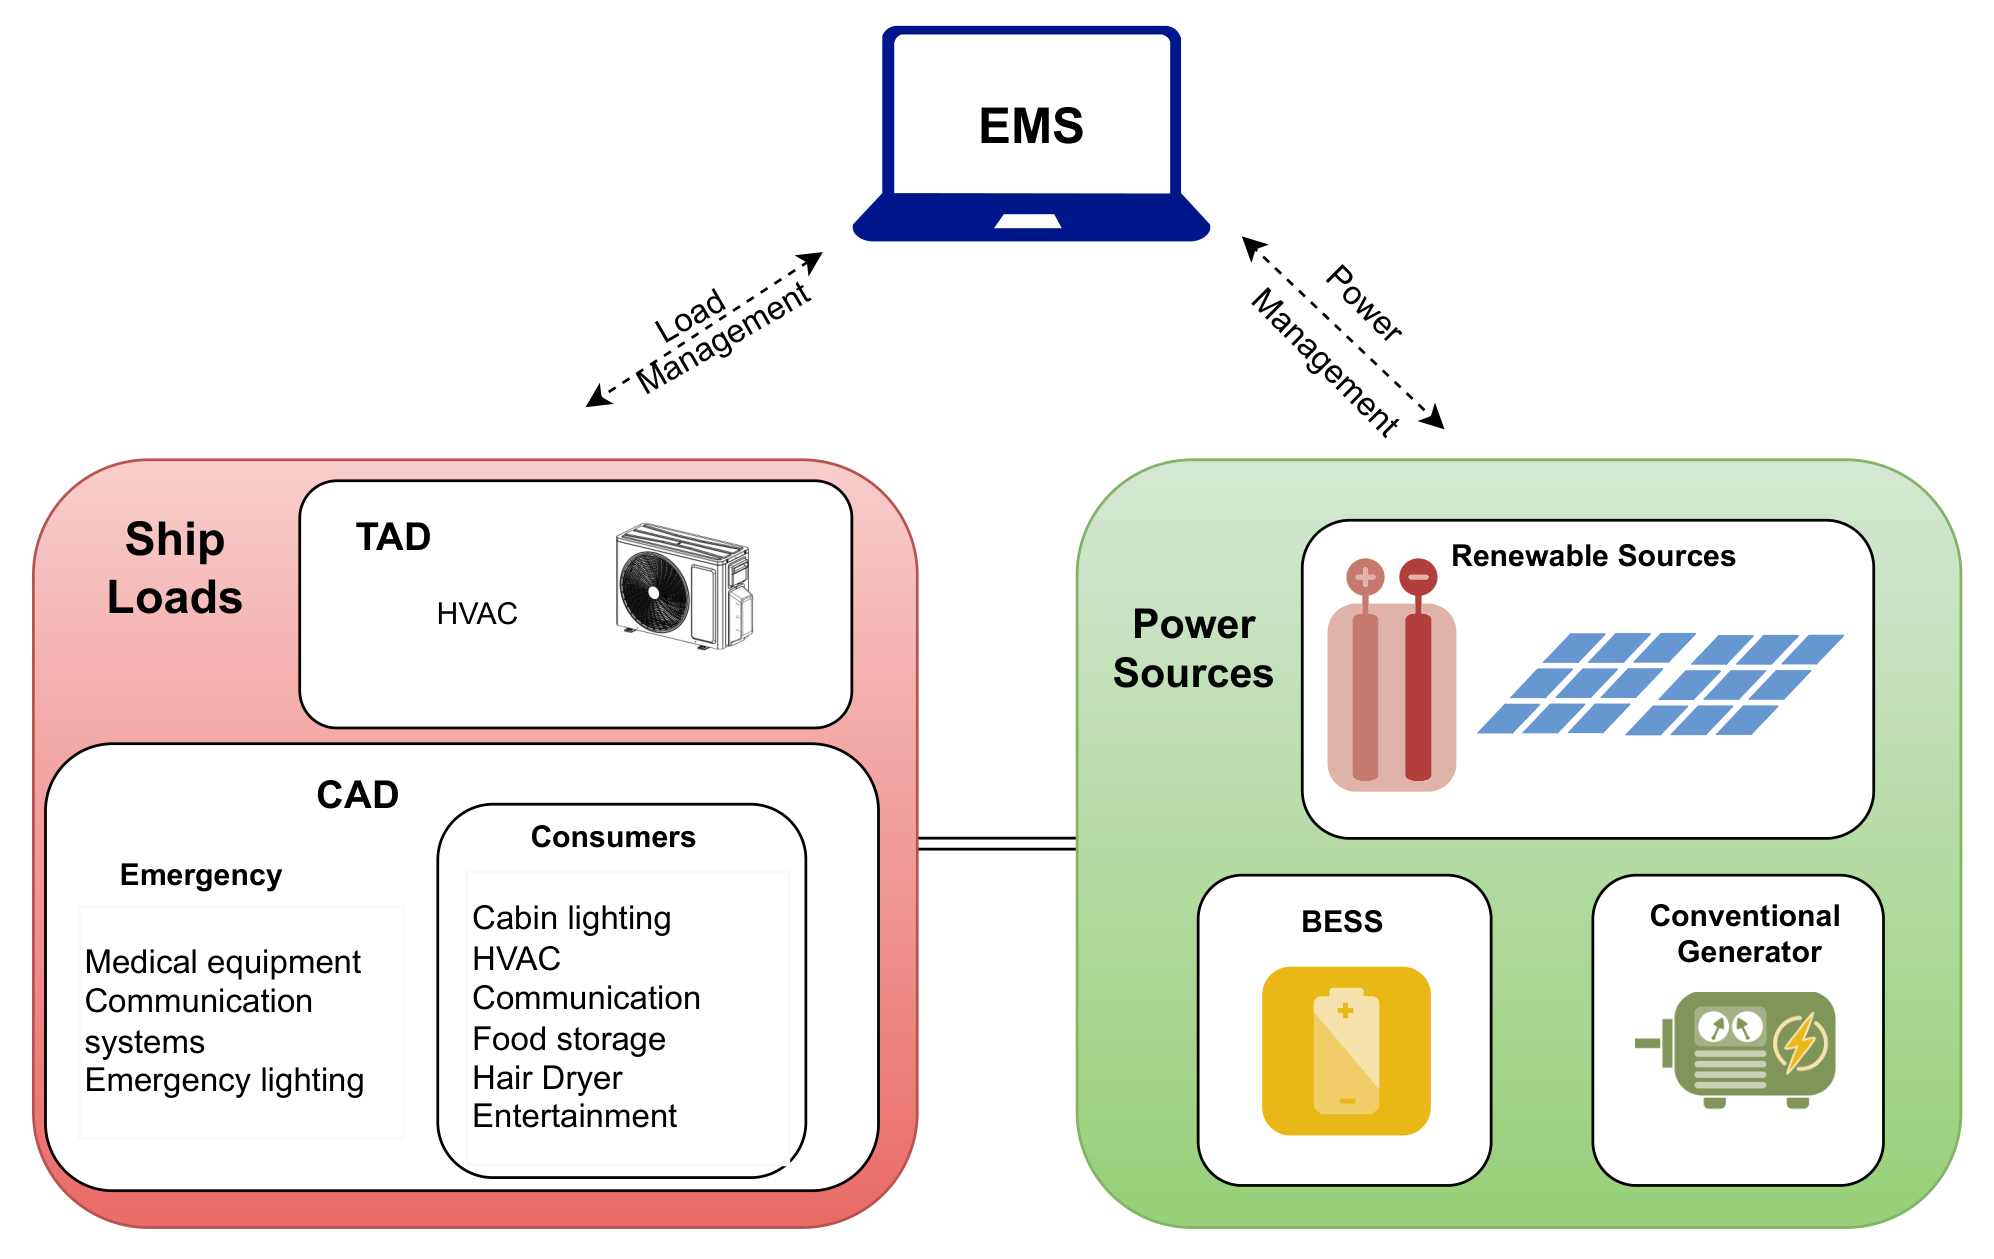
Figure 1 illustrates an overview of the DC distribution systems within the cruise ship. The structure consists of different energy sources, including the MGs and integrated RES in this research. Power sources supply both critical and non-critical loads with distinct operational priorities, including essential components for environmental conditioning, such as heating, ventilation, and air conditioning (HVAC) systems, food storage, entertainment systems, and lighting. Medical equipment, communication systems, and emergency lighting are classified as emergency loads. The EMS plays a pivotal role as an intermediary, facilitating coordination about load sharing between the energy sources. It also ensures optimal power flow, stability, and efficient operation of the ship’s electrical system. The DC microgrid for the ship also includes power converters, transmission lines, and other components that support the integration of the energy sources.

2.2. Considered Grid Topology of the Energy System

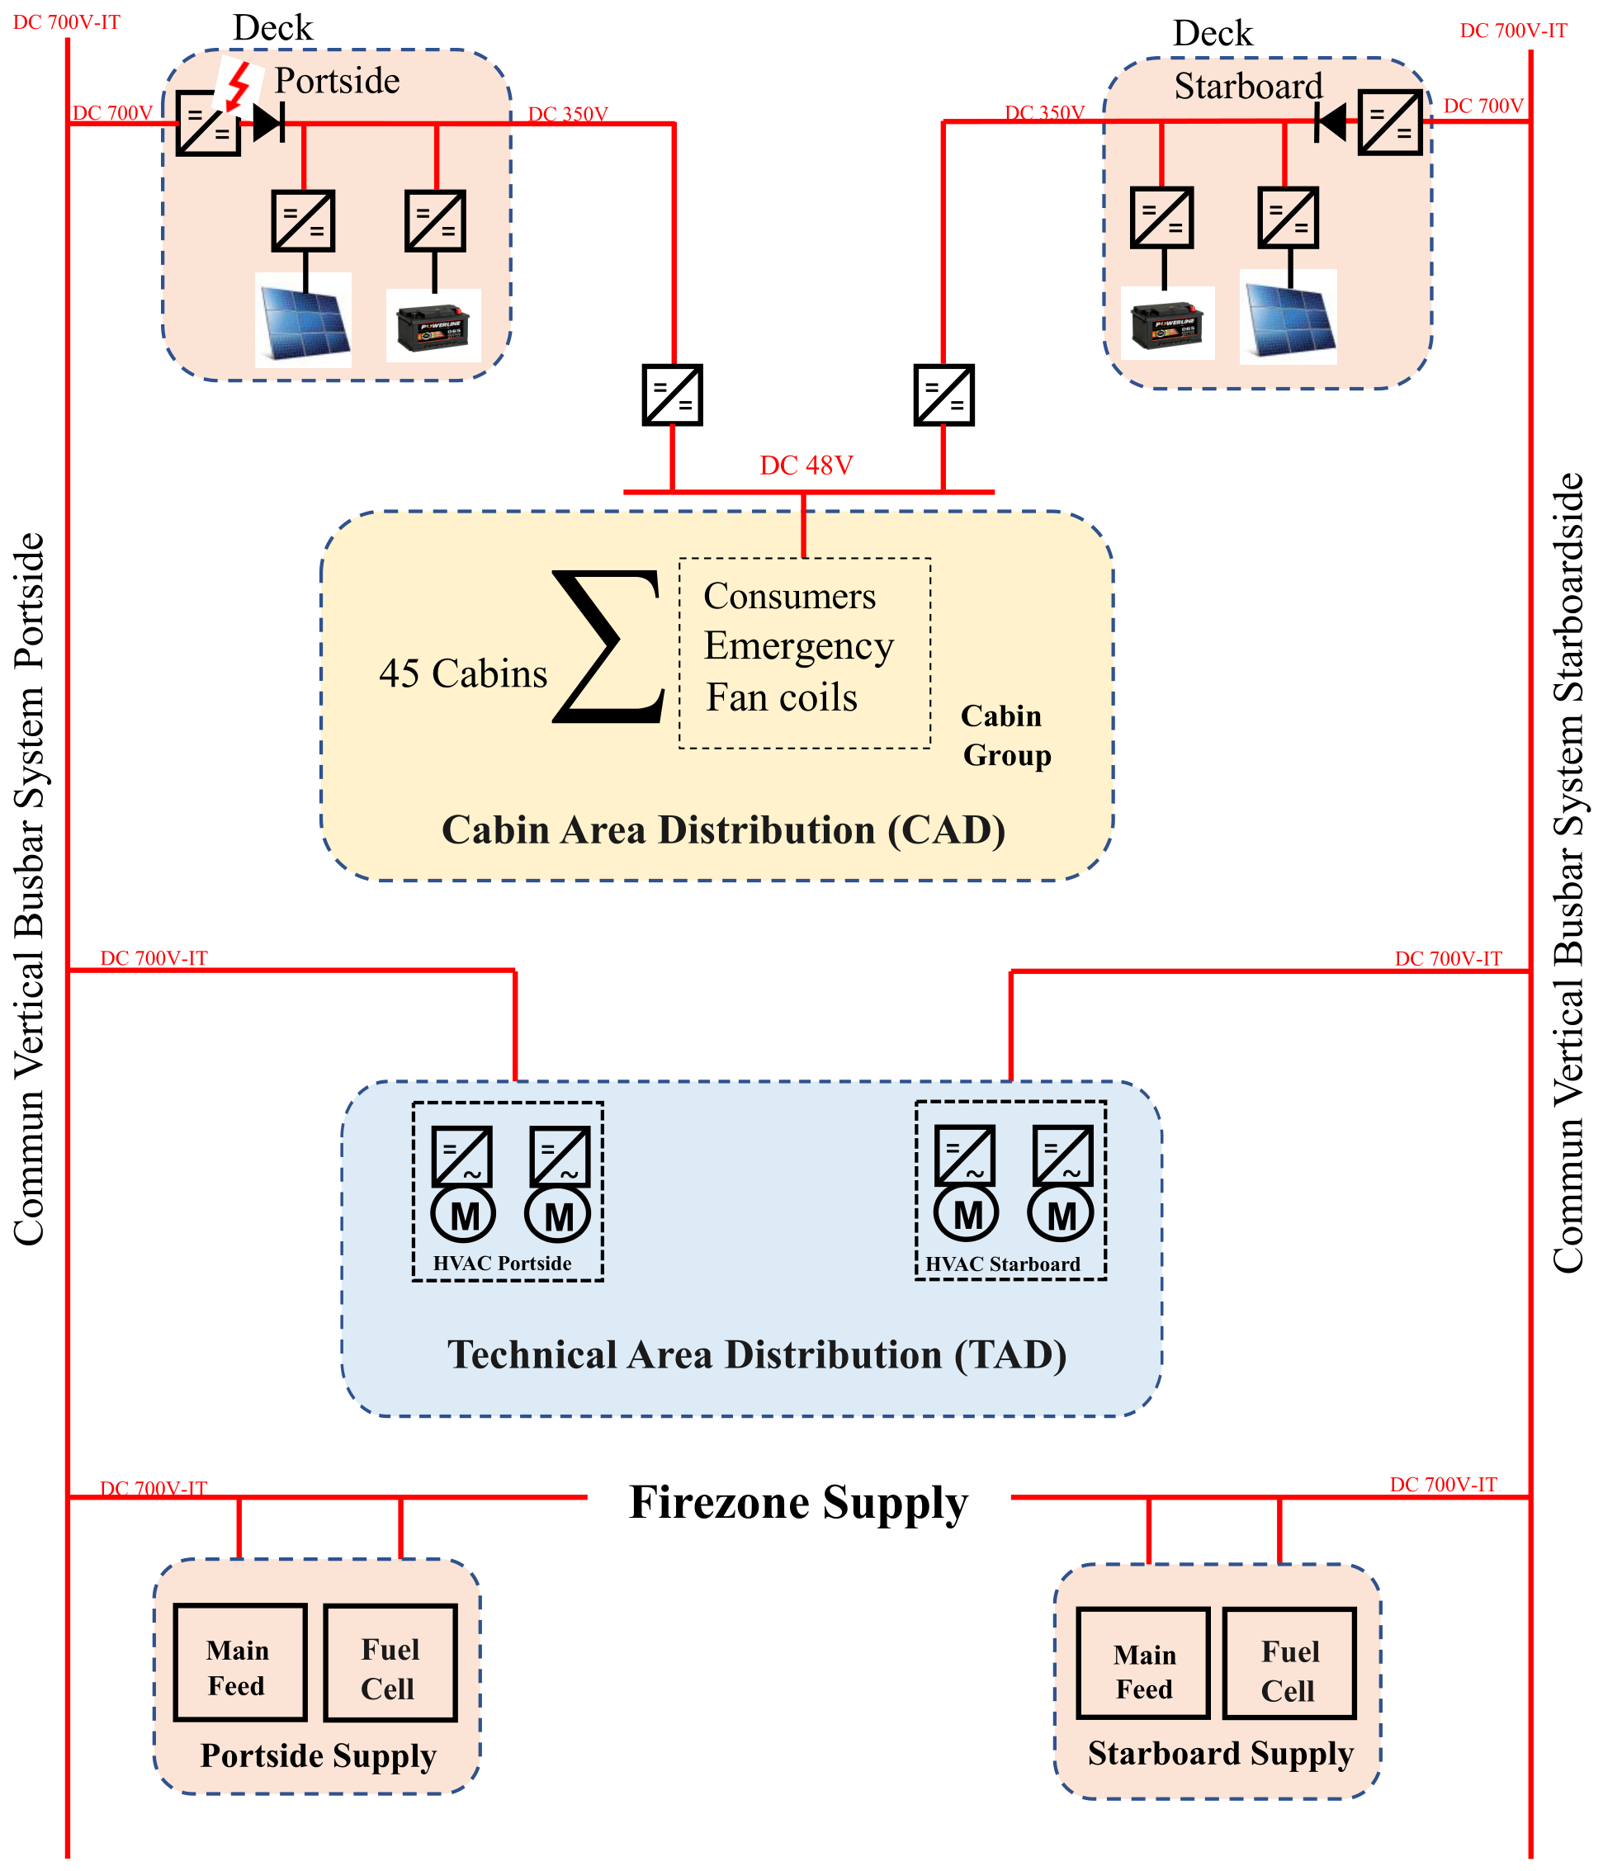
The entire ship is divided into multiple sections, referred to as firezones, for structural and operational management. Each firezone is composed of multiple floors, with each individual floor referred to as a deck. Within each firezone, two distribution areas exist: the cabin area distribution (CAD) and the technical area distribution (TAD). The topology considered in this study, developed collaboratively within the SuSy project, is based on a simplified electrical schematic of a cruise ship firezone, as illustrated in Figure 2, which serves as the basis for all subsequent considerations in this study.
The TAD supplies critical systems for environmental conditioning, such as HVAC. In contrast, the CAD contains the electrical infrastructure and consumer loads that supply power to both passenger and crew cabins. These two areas are supplied by separate busbars. Each side of the TAD is connected directly to a vertical busbar operating at 700 V DC. Meanwhile, the CAD operates at a nominal voltage of 350 V DC via isolated DC/DC converters, and power is supplied through two independent horizontal busbars—each fed by a different vertical busbar. The horizontal busbars are separated to ensure redundancy in the event of a failure.
Different power sources are strategically placed on the port and starboard sides of the ship to feed the firezone’s distribution systems. The primary power system comprises two MGs, two FCs, two PV arrays, and two BESS units. The MGs and FCs supply the vertical busbars, while the PV and BESS units are connected to the horizontal busbars on each side of the firezone. In this study, only one deck of the firezone is simulated, which is assumed to contain 45 aggregated cabins. These cabins receive power at 48 V DC through two independent DC/DC step-down converters with a conversion ratio of 350 V /48 V . Each converter is supplied from the respective horizontal busbar by the two vertical busbars on both sides of the ship.
Each distribution area in the firezone is equipped with its own decentralized droop control system, enabling independent operation in the event of failure in system communication. If a fault occurs on the input side of a DC/DC converter connected to one of the vertical busbars, the converter shuts down and disconnects the connected horizontal busbar from the faulty vertical busbar. In this scenario, the CAD continues to be powered by both horizontal busbars and the remaining vertical busbar, ensuring continued operation. To maintain system stability during this fault condition, the BESS capacity is strategically designed and sized to maintain the voltage on the horizontal busbar. In the case of a total blackout, where both vertical busbars fail, all loads within the CAD are supported exclusively by the horizontal busbars. In either blackout scenario, the CAD control unit sends a signal over the communication bus to the cabin control system, which then disables all non-essential loads, maintaining power supply only to the emergency loads.

3. Dynamic Modeling of the Power System

This section presents the dynamic model of the power system under investigation. The dynamic modeling approach uses average models for the entire system, thus avoiding the complexity of simulating intricate control algorithms and semiconductor switching components, such as diodes and transistors, within the converters. The system represents a deck within a scaled-down representation of a firezone on a cruise ship, consisting of 45 aggregated cabins. These cabins are distributed as follows: 14 cabins on the starboard side, 14 cabins on the port side, each featuring a balcony with PV panels mounted on the railings on both sides, and 17 inside cabins that are also part of the deck layout. Note that “deck firezone” in this context does not refer to an actual cruise ship deck but to a representative scaled-down energy system that includes components typically found within a firezone. This allows for a focused analysis of power dynamics without considering the complexities of a complete firezone.
The considered deck firezone is connected to the vertical busbar on the starboard side and the vertical busbar on the port side of the firezone. These busbars are fed by two MGs and two FCs, each represented as an ideal voltage source with a rated output of 700 V DC. The details and modeling approaches for the remaining elements of the deck firezone are provided in the following subsections.

3.1. Fuel Cell System

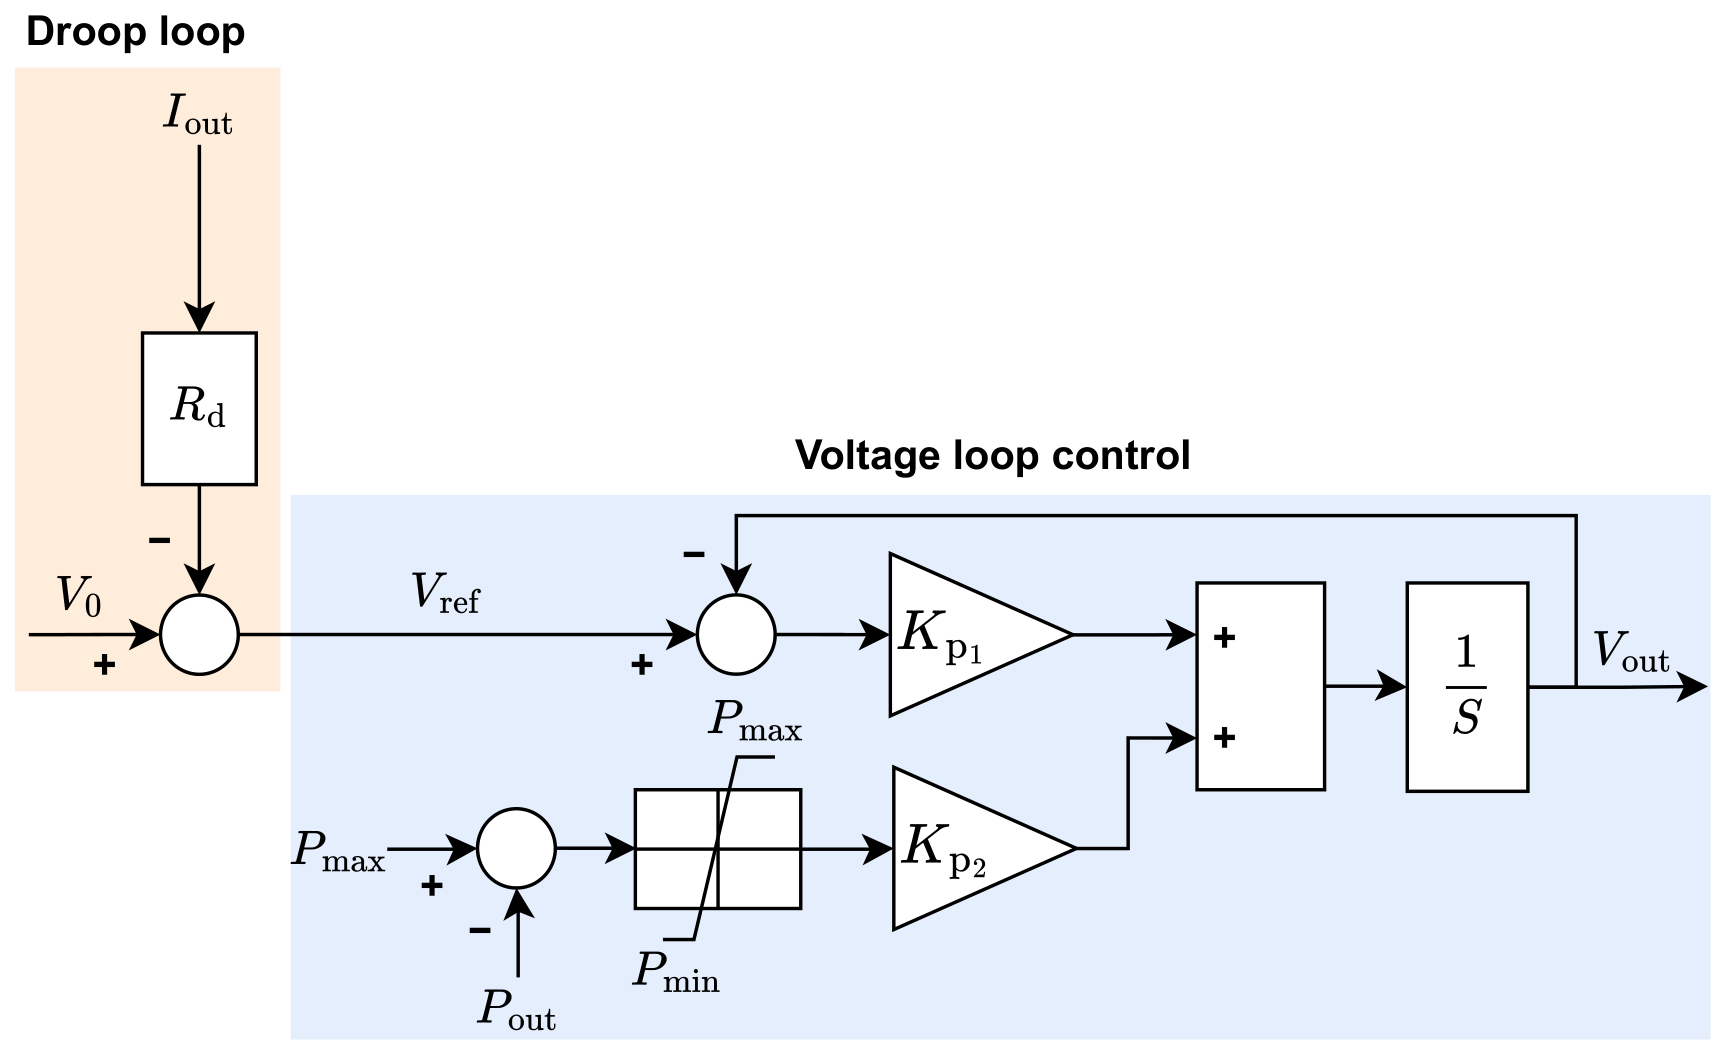
The fuel cell systems share the power supply with the MGs on each side of the firezone. For this study, fuel cell systems are operated in slow power-controlled mode, where their output is constrained by rated capacity and EMS-defined power references, neglecting internal electro-chemical effects. This limitation is implemented through a control system illustrated in Figure 3. The primary objective of the control system is to regulate the bus voltage so that the FC system’s power output is effectively constrained. The control system comprises a droop loop, which generates a reference voltage ( V ref ) based on the measured FC’s output current ( I out ), and a voltage loop, which adjusts the bus voltage ( V out ) to track the reference voltage. In cases where the output power exceeds the maximum allowable power ( P max ), the voltage loop adjusts the bus voltage to reduce it until the output power reaches P max again. V 0 is no load voltage setpoint and R d is droop resistance. This modeling approach represents a simplified version of realistic operation of fuel cells in hybrid maritime DC microgrids, where batteries perform peak shaving and transient support while fuel cells provide steady-state power contribution.

3.2. Photovoltaic System

The PV panels are mounted on the balcony railings of each deck on both sides of the ship to reduce the fuel consumption of the MGs and FCs. An array of six series-connected and four parallel-connected units was installed, covering a total area of 40 m2. A 60-cell Mono Perc shingled module-based PV panel has been adopted in this research. This particular module was chosen for its ability to deliver high efficiency of 19.6% and maximum power output of 340 W . Shingled solar cell interconnection has gained significant attention in recent years. It can improve efficiency by 8–10% compared to classical PV modules due to lower resistive losses and increased surface area [32]. Moreover, solar modules based on shingle interconnection have the advantage of shading tolerance [33]. Table 1 shows the electrical characteristics of the considered PV module.
In this study, the PV panels are modeled as a current source using a simplified model that considers fundamental factors to calculate the output power ( P pv ). This simplified representation is sufficient for system-level analysis, where the focus is on power flow and energy management rather than detailed semiconductor behavior. The parameters considered in this model include solar irradiation ( E irr ), PV module surface area ( S Module ), the number of series-connected modules ( N s ), the number of parallel-connected modules ( N p ), PV module efficiency ( η Module ), and converter efficiency ( η conv ). The P pv is estimated by combining these parameters as follows:
P pv = E irr · S Module · N s · N p · η Module · η conv
The PV output current ( I pv ) is subsequently calculated as:
I pv = P pv V horibus
where V horibus is the horizontal bus voltage.

3.3. Battery Energy Storage

The BESSs are implemented to support the intermittent RES power supply. The battery pack consists of 200 LFP cells in series with 12 parallel strings, providing balanced energy storage capacity. Each LFP cell has a nominal capacity of 150 A h and operates within a voltage range of 2.5–3.65 V. The key electrical parameters of the battery pack, including the open-circuit voltage and internal resistance as functions of the state of charge (SOC), are summarized in Table 2. These parameters were obtained from experimental measurements conducted in the laboratory and are used to accurately characterize the battery behavior.
During system operation, the SOC of the battery is continuously measured and maintained within predefined limits for safe and reliable operation. In this study, the allowable SOC range is 40–80%. In addition, both charging and discharging currents are constrained within specific minimum and maximum limits, i min and i max respectively, to prevent overcharging, deep discharging, and thermal stress. The battery system is modeled in the Simscape battery table-based block in MATLAB/Simulink R2020b which is a widely adopted approach for BESS simulation. This model enables an accurate representation of the charging and discharging dynamics by incorporating the experimentally obtained voltage and resistance characteristics.

3.4. DC/DC Converter

In the assumed power system, all power sources are connected via DC/DC converters, which are arranged in parallel to share the load and facilitate power flow between the sources. To address the circulating current issue that arises from voltage differences between the sources, a virtual resistance-based voltage source model is employed for the converters. This droop control approach is necessary to equalize the load current shared by each converter and mitigate the effect of circulating currents [24,34].
The control law governing the converter output voltage, taking into account the virtual resistance, is expressed as:
V out = V ref R d · I d
where V out is the output voltage of the converter, V ref is the reference value for the DC bus voltage, R d is the virtual resistance assigned to the converter, and I d is the output current of the converter. The converter output current flows in both directions. Its relationship is given by:
I out = V in · I n V out
where V in and I n are the input voltage and current, respectively. To prevent reverse current flow and ensure unidirectional current flow, a diode is incorporated into the design to block any potential backflow of current to the vertical bus system. A remaining challenge is determining the optimal value of the virtual resistance ( R d ) for each converter. The method for calculating this virtual resistance is detailed in Section 4.3.

4. Energy Management System

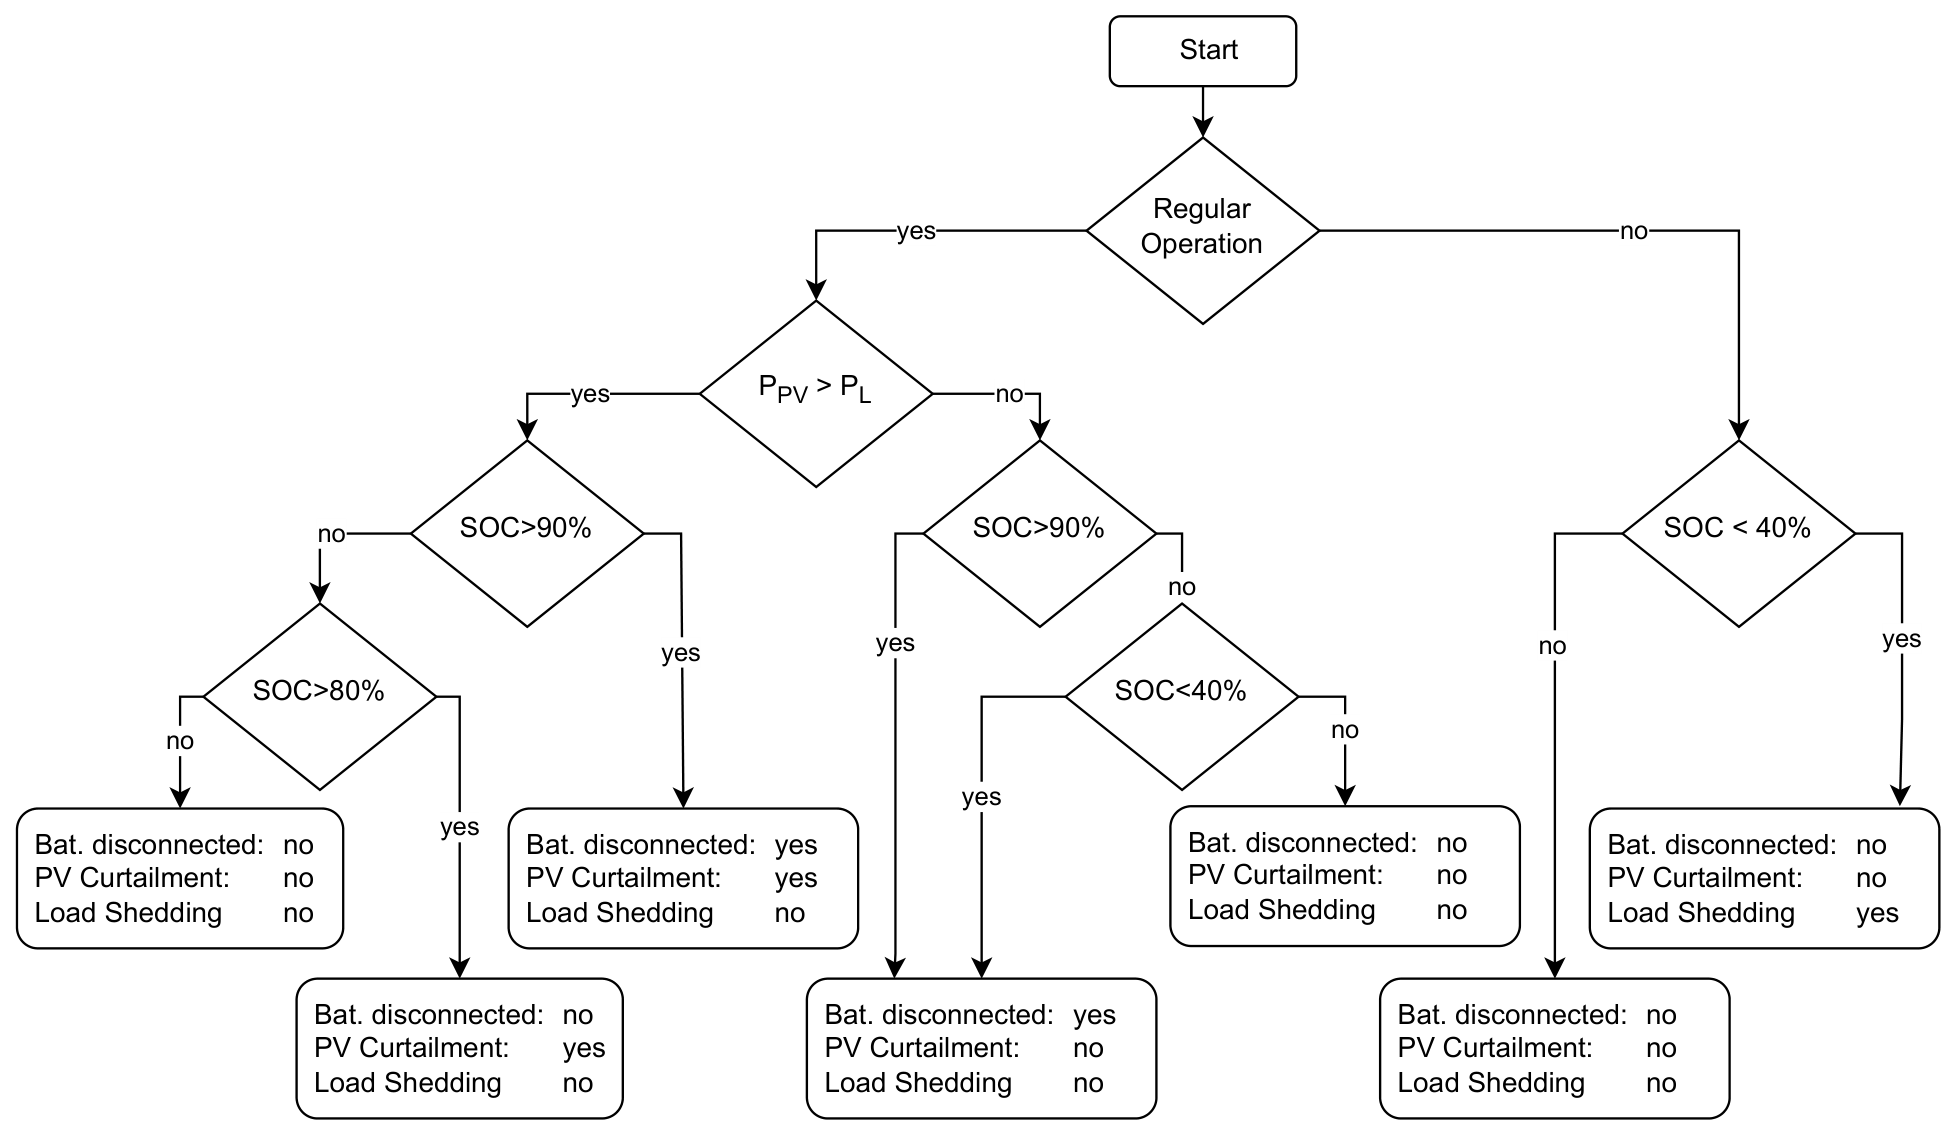
The EMS in this study provides a structured rule-based control strategy for managing power flow within the cruise ship’s firezone DC microgrid. The EMS optimizes the utilization of distributed energy sources under both regular and irregular conditions. This design choice is motivated by the safety-critical nature of ship firezones, where transparency, low computational burden, and independence from communication infrastructure are prioritized over global optimality. Figure 4 depicts the EMS decision-making flowchart, which guides power allocation and energy storage behavior based on real-time system states. The flowchart distinguishes between two primary operational modes:

4.1. Normal Operation Control Strategy

During regular operation:
  • If PV power ( P pv ) exceeds the total load demand ( P load ):
    The surplus power is initially stored in the BESSs, depending on the current SOC.
    If the BESSs are fully charged (i.e., SOC ≥ 80%), any excess PV power is curtailed to avoid overcharging. The upper threshold of 80% is selected to prevent overcharging and enable faster PV curtailment decisions, thereby improving system responsiveness and battery health.
  • If P pv is insufficient to meet P load :
    The BESS discharges to supplement the PVs. The discharging is limited to 40% of the battery’s reserve capacity (SOC ≥ 40%). This threshold is selected to preserve sufficient battery reserve capacity for emergency operation during critical fault conditions. This value represents a compromise between battery lifetime considerations and the requirement to maintain guaranteed power availability for critical loads.
    If the battery is outside its safe SOC range (SOC ≤ 40% or SOC ≥ 90%), it is disconnected to prevent over-discharge or overcharge.

4.2. Irregular Operation Control Strategy

When a fault occurs in one of the MGs:
  • The EMS immediately checks battery availability and activates the load shedding mechanism.
    The battery uses its reserve capacity (i.e., SOC ≤ 40%) to continue supplying power to critical loads.
    The battery is sized to maintain voltage stability on the affected busbar during the fault period.
Load shedding ensures that only emergency or critical loads (e.g., lighting, communications, alarms) remain powered during the fault. Once the fault is cleared, the EMS resumes regular operation by reconnecting the BESSs and restoring normal load allocation.

4.3. Droop Control

Droop control is a widely employed parallel scheme that does not rely on feedback mechanisms. Its popularity stems from its simplicity and effectiveness in distributed power systems, where it enables linear voltage and current regulation [35]. A key advantage of droop control is its ability to achieve adjustable voltage and current sharing among parallel converters, thereby facilitating balanced power distribution. To realize this benefit, accurate calculation of the droop coefficients is essential. In this work, a straightforward approach for regulating voltage and current sharing is adopted.
As explained earlier, each parallel converter employs virtual resistance to regulate its output voltage according to the individual load. Based on Equation (3), the output voltage expression at the terminal of each converter is:
V out , i = V ref , i R d , i · I d , i
The output current of each converter is expressed as follows: I d , i = P i V out , i , hence:
V out , i = V ref , i P i V out , i · R d , i
The share of a single source in the total power is expressed as x i = P i P i and the droop voltage is calculated as V droop = V ref , i V out , i , with:
V out , i = V ref , i ( x i · P i ) V out , i · R d , i
The droop coefficient at each converter is as follows:
R d , i = V out , i · V droop x i · P i
By adjusting the voltage droop coefficient, the load power can be accurately distributed among the existing parallel sources.

4.4. PV Curtailment

PV curtailment refers to the intentional reduction of power output from solar panels during periods of high energy production, typically when the grid cannot absorb all the generated power. This phenomenon occurs when the load demand is low and the BESSs are fully charged, resulting in an excess of renewable energy. Curtailment is necessary to ensure reliable grid operation and prevent potential stability issues that may arise from excessive power injection into the grid. By limiting the output power, PV curtailment helps to balance supply and demand, ensuring that the system operates within safe and controlled boundaries [36].
Mathematically, the curtailed power can be represented as:
P curtailment = P pvmax No curtailment min ( P load , P pv ) Under curtailment
where P curtailment represents the curtailable power, P pvmax is the maximum available PV power, P load is the load demand, and P pv is the actual PV power output. During periods of no curtailment, the PVs operate at their maximum capacity P pvmax . However, when the grid requires curtailment, the power output is reduced to match the minimum value between the load demand P load and the actual PV power output P pv .

5. Simulation Results

This section presents the simulation results used to evaluate the performance of the proposed EMS under both normal and fault conditions. The analysis focuses on power sharing, voltage stability, and system response to disturbances.
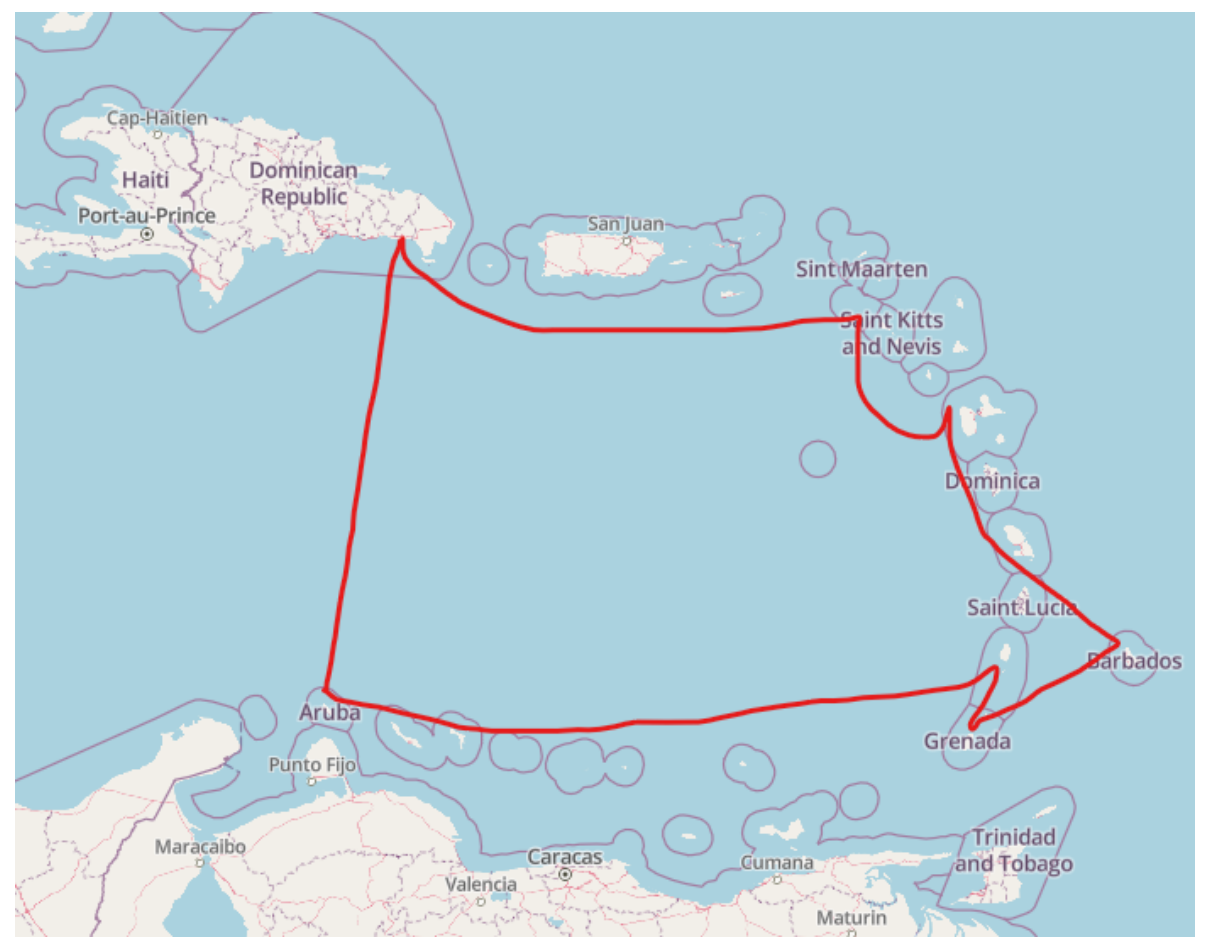
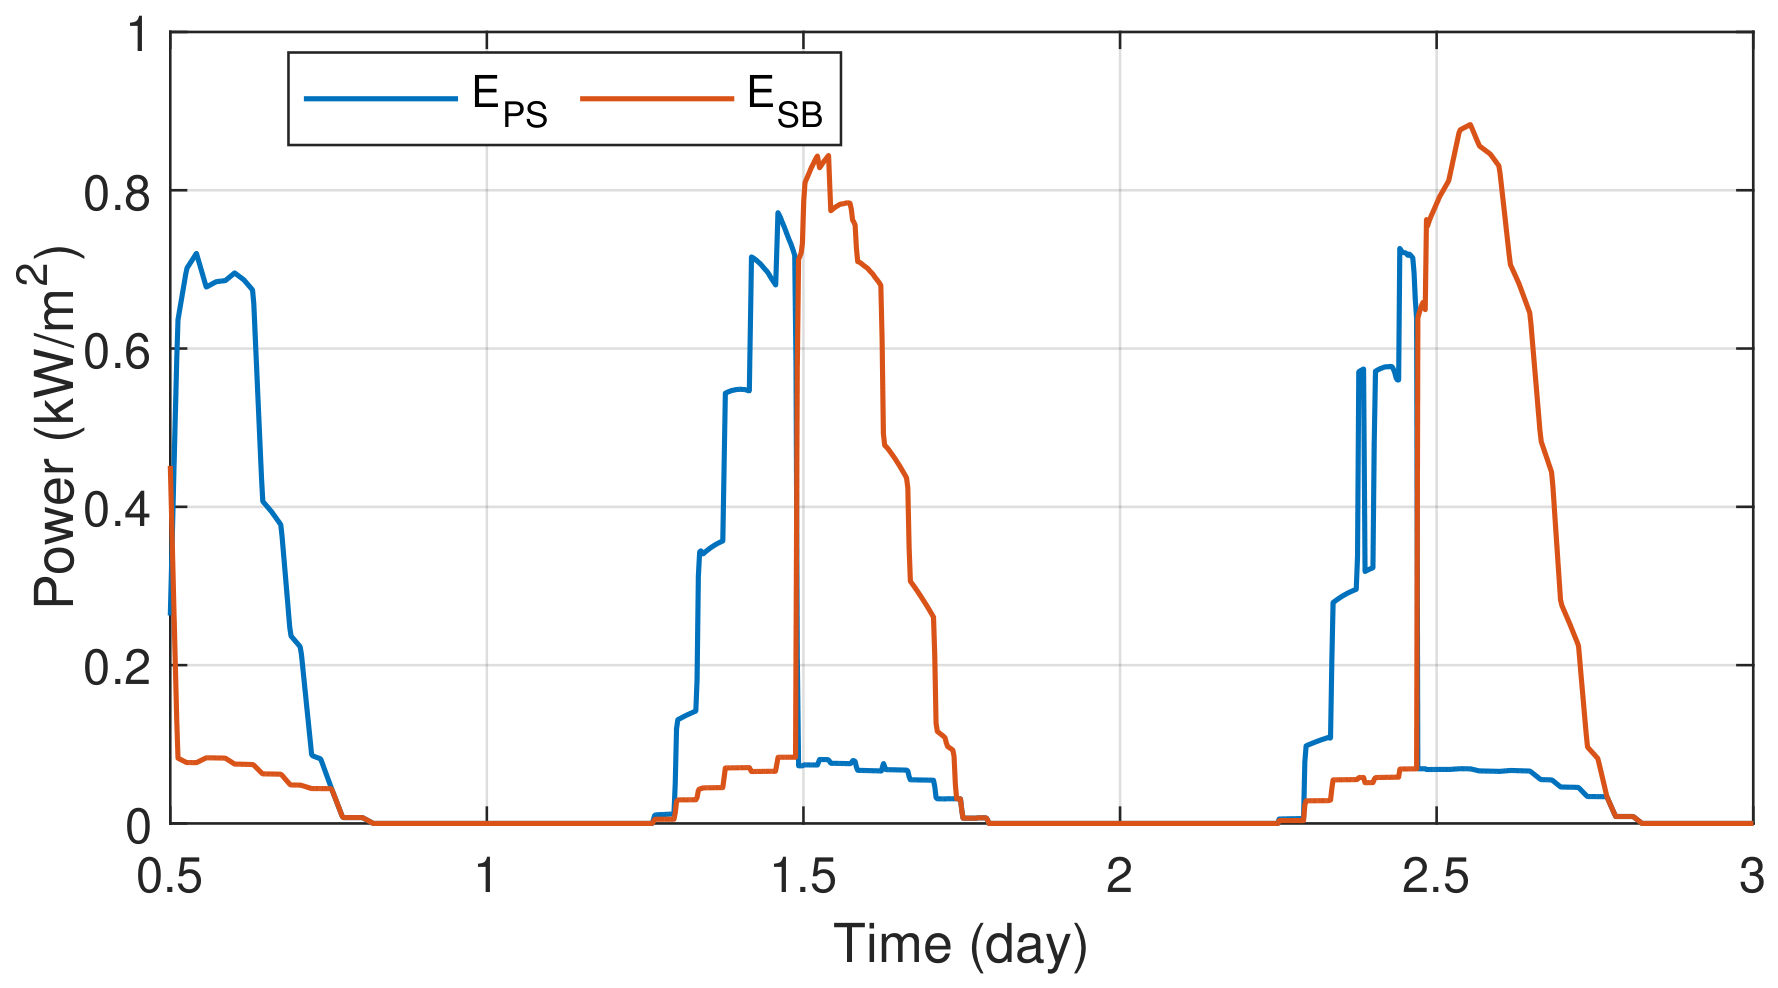
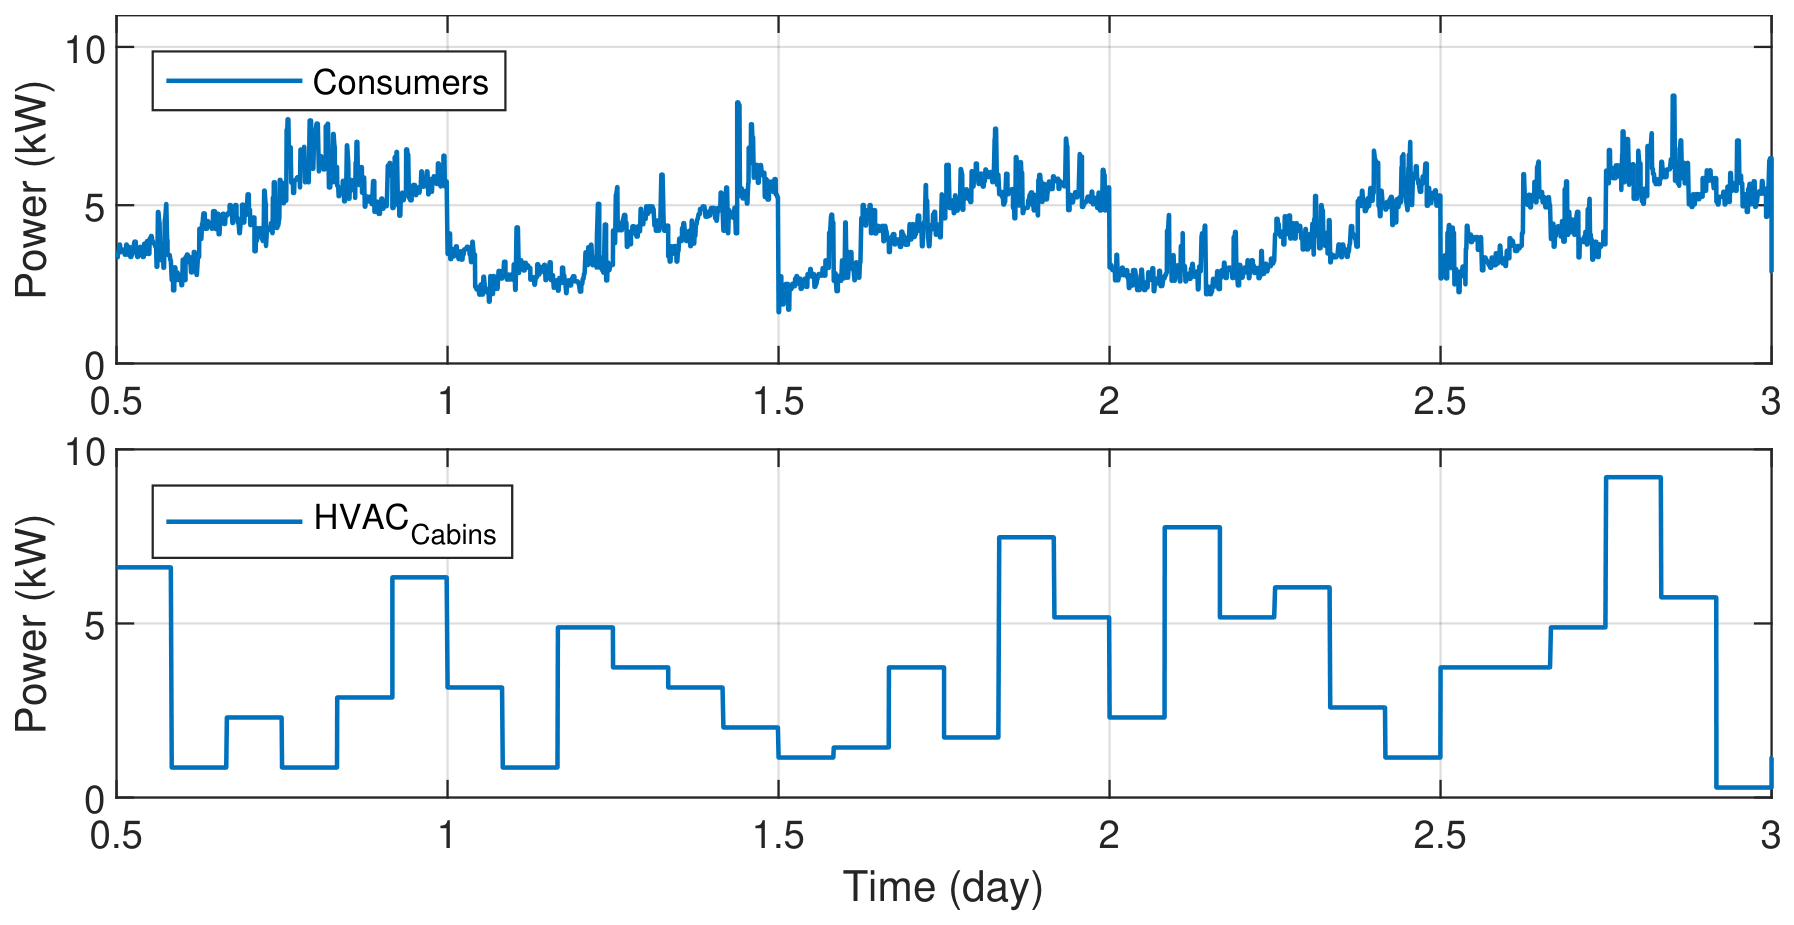
To evaluate EMS performance, we scaled the PV and BESS generation capacity. Throughout this section, we differentiate between the nominal system and the scaled-up system to analyze the effects of increased PV capacity on the overall performance. The key input variables for our dynamic simulation model include solar irradiance and load power. Figure 5 shows the cruise route used for data collection. In Figure 6, the solar irradiation profile was derived by interpolating data obtained from the Copernicus meteorological services [37] across the 15-day course of a Caribbean cruise, accounting for solar energy received on both sides of the ship equipped with PV panels. The difference between port and starboard irradiance profiles arises from the ship orientation and trajectory, which affects the incident solar angle on each side. The total load demand for the considered deck firezone was modeled using a bottom-up approach developed by Schwager [38]. The resulting load profile time series, representing the total electricity demand of 45 cabins (including cabin loads and fan-coil units), is depicted in Figure 7. Emergency loads are also incorporated, with a constant power demand of 1.9   k W within the CAD. Additionally, the HVAC system in the TAD is assumed to have a continuous power demand of 6.3   k W per side of the firezone.
This section is organized in two parts. First, a load flow analysis is conducted using real data from the system, providing a baseline understanding of its operational characteristics. Next, the analysis is repeated using the scaled system, allowing for an evaluation of the proposed EMS under various operational conditions and scenarios.

5.1. Initial Load Flow Analysis

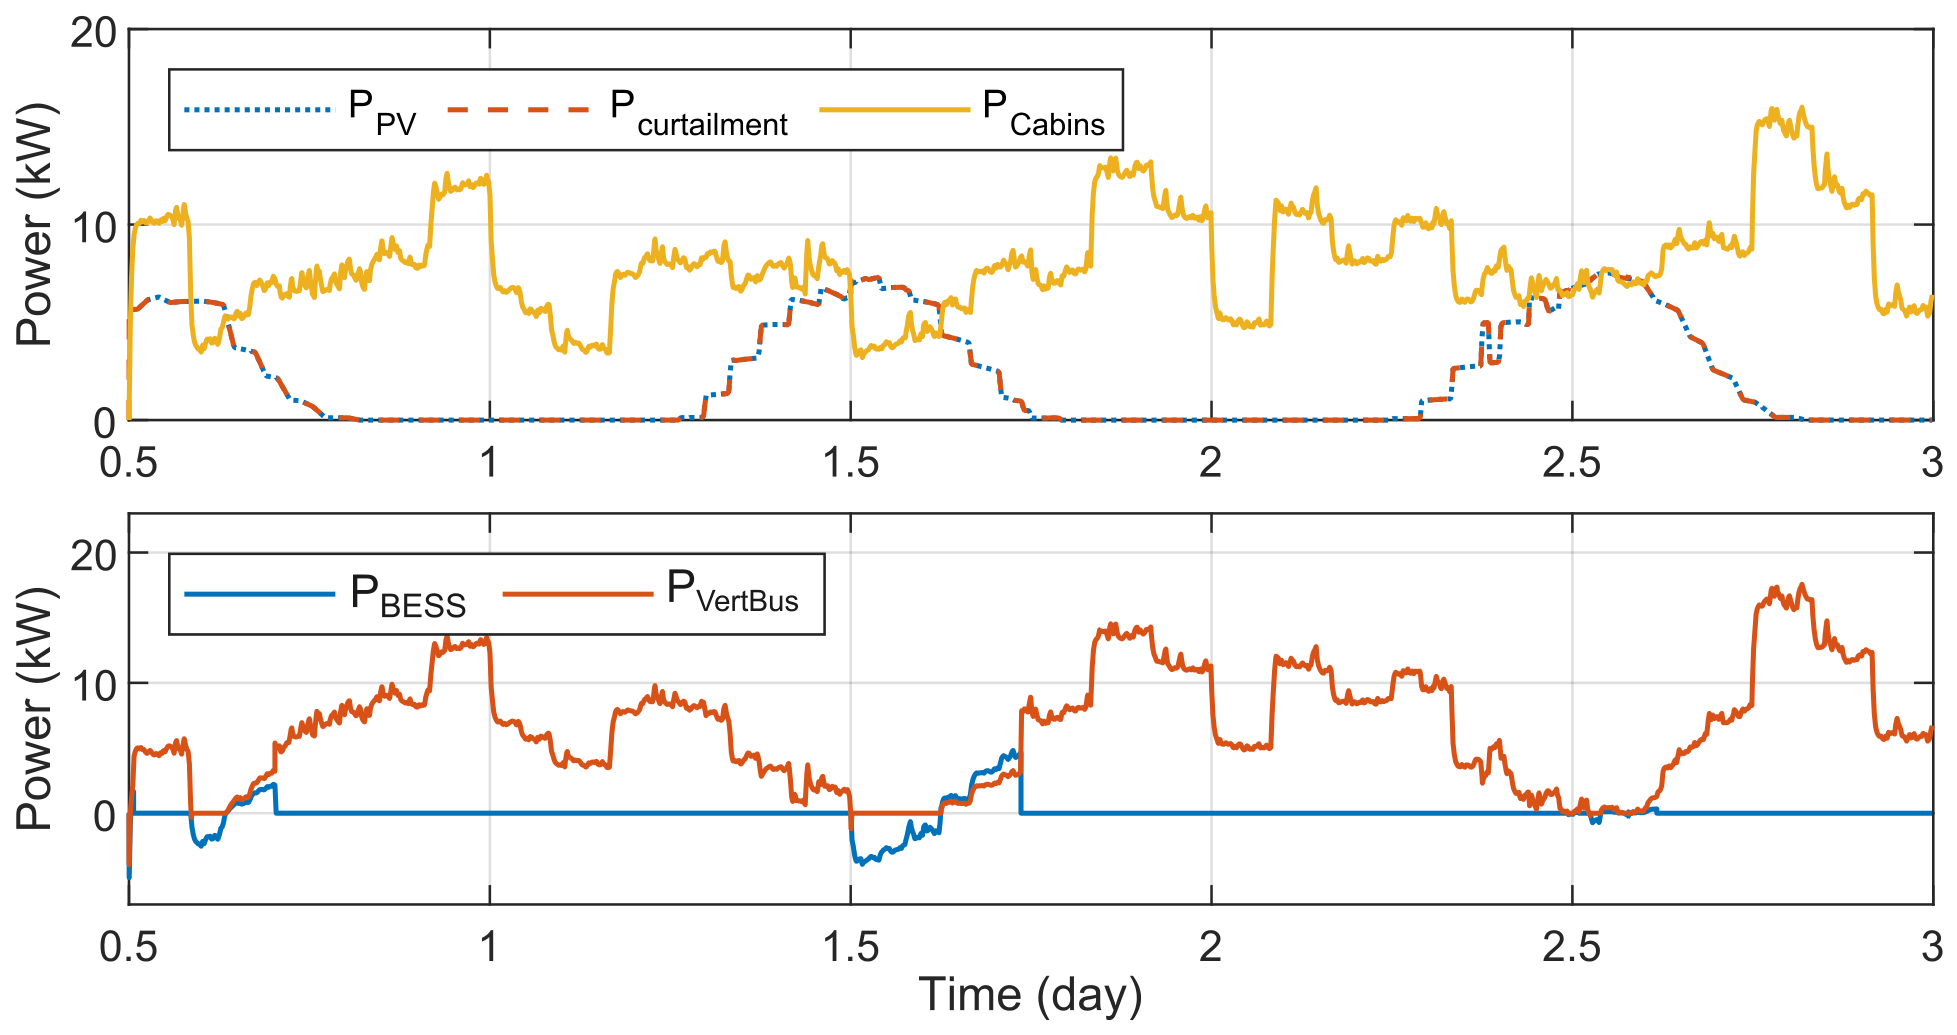
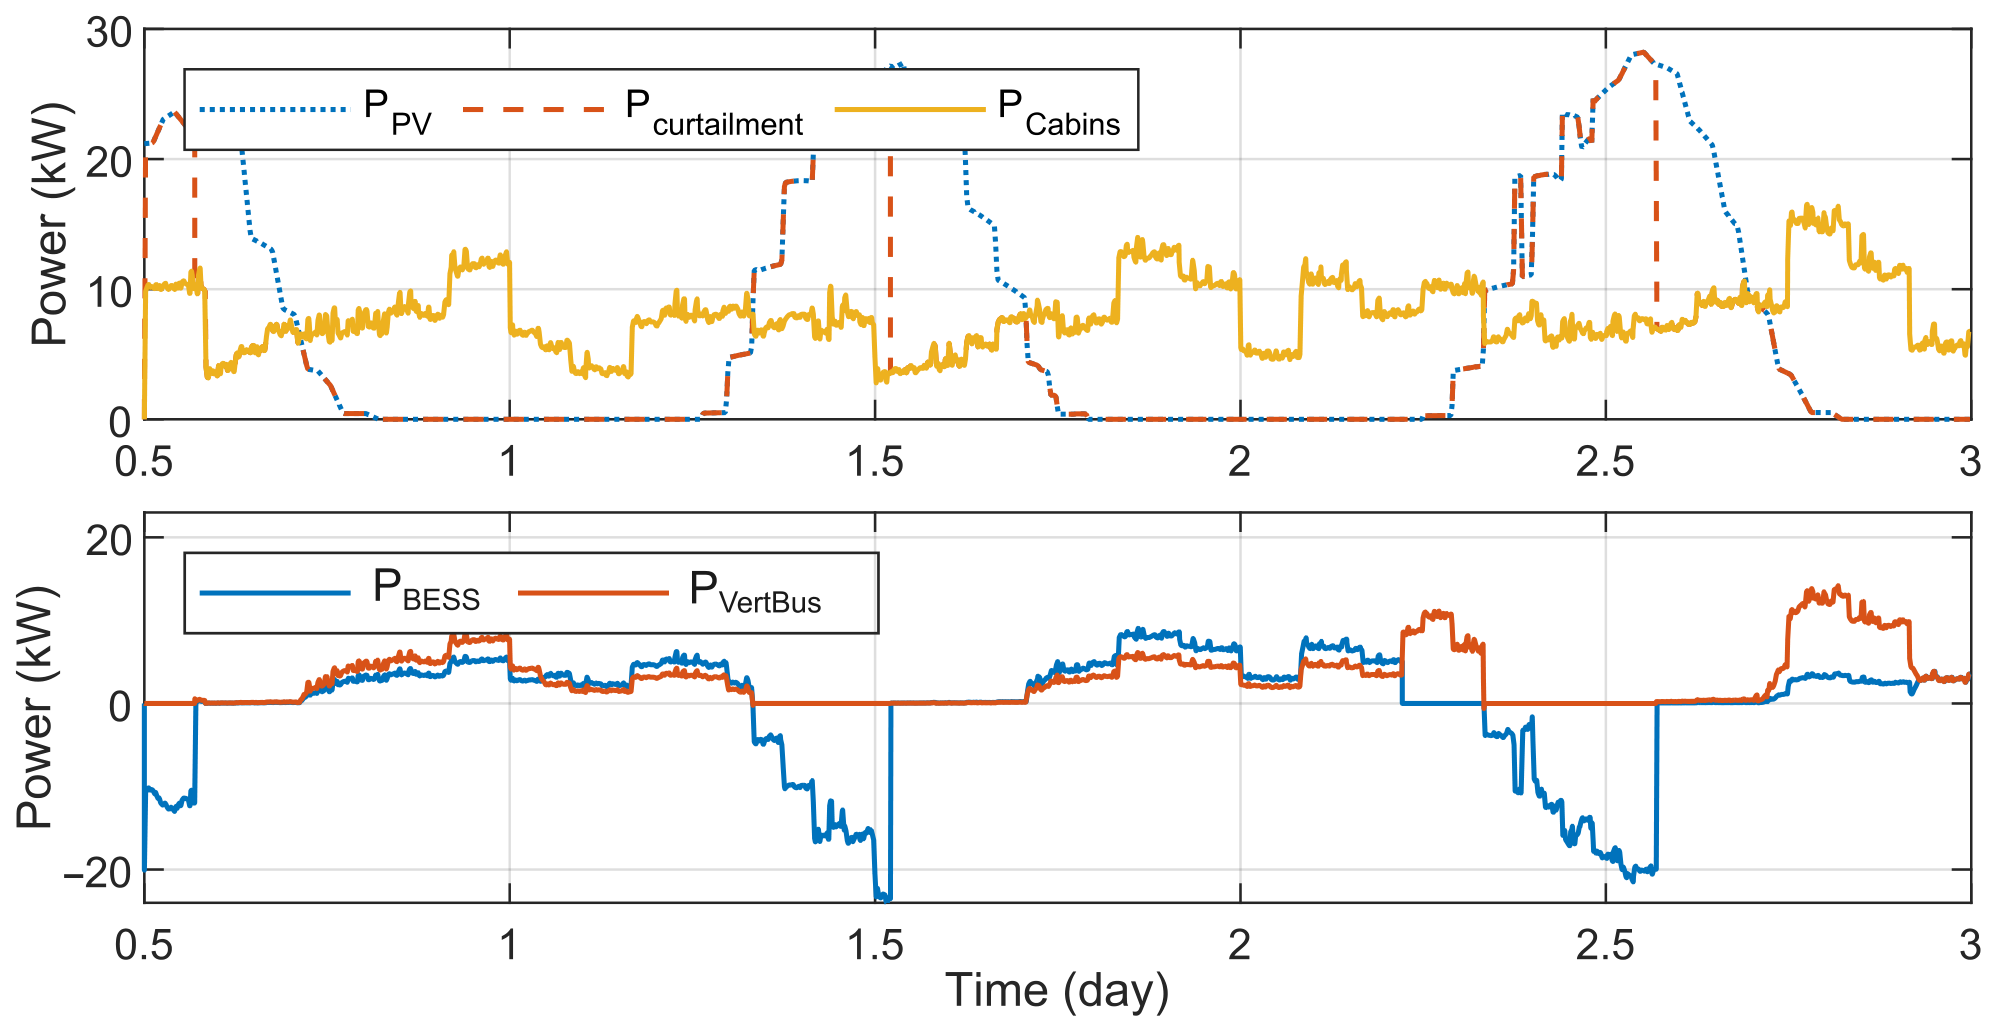
The results confirm that the EMS operates correctly under normal conditions. PV generation is prioritized, and excess energy is stored in the BESS when available. The remaining demand is supplied through coordinated power sharing between the BESS and vertical busbars, ensuring stable operation. Figure 8 illustrates the system behavior in normal operation, where PV curtailment is effectively inactive as the batteries are not fully charged. Under these conditions, the total load demand is met through power sharing between the vertical busbars and the BESS.

5.2. Load Flow Analysis on the Scaled System

The scaled PV system has a peak power increased from 8.2   k W to 30.6   k W on each side. The scaling up was achieved by increasing the number of parallel-connected PV modules from 4 to 15 and the BESS capacity by 15% on each side, starting from an initial SOC of 70%. The simulations covered both regular and irregular operation modes of the ship. In this context, irregular operation refers to a major failure in the power system that triggers the activation of an emergency mode, initiating specific recovery procedures.

5.2.1. Regular Operation

During the regular operation phase, simulations were performed using the scaled PVs and increased battery capacity over a three-day period. These simulations demonstrate various scenarios envisioned within the EMS approach, showcasing its ability to efficiently distribute load demand according to predefined power ratios within the firezone. The results highlight the effective utilization of the BESSs for load sharing while maintaining some stored capacity for emergency situations. Additionally, the simulations showcase the power curtailment process when the PV output exceeds the load demand.
Technical Area Distribution
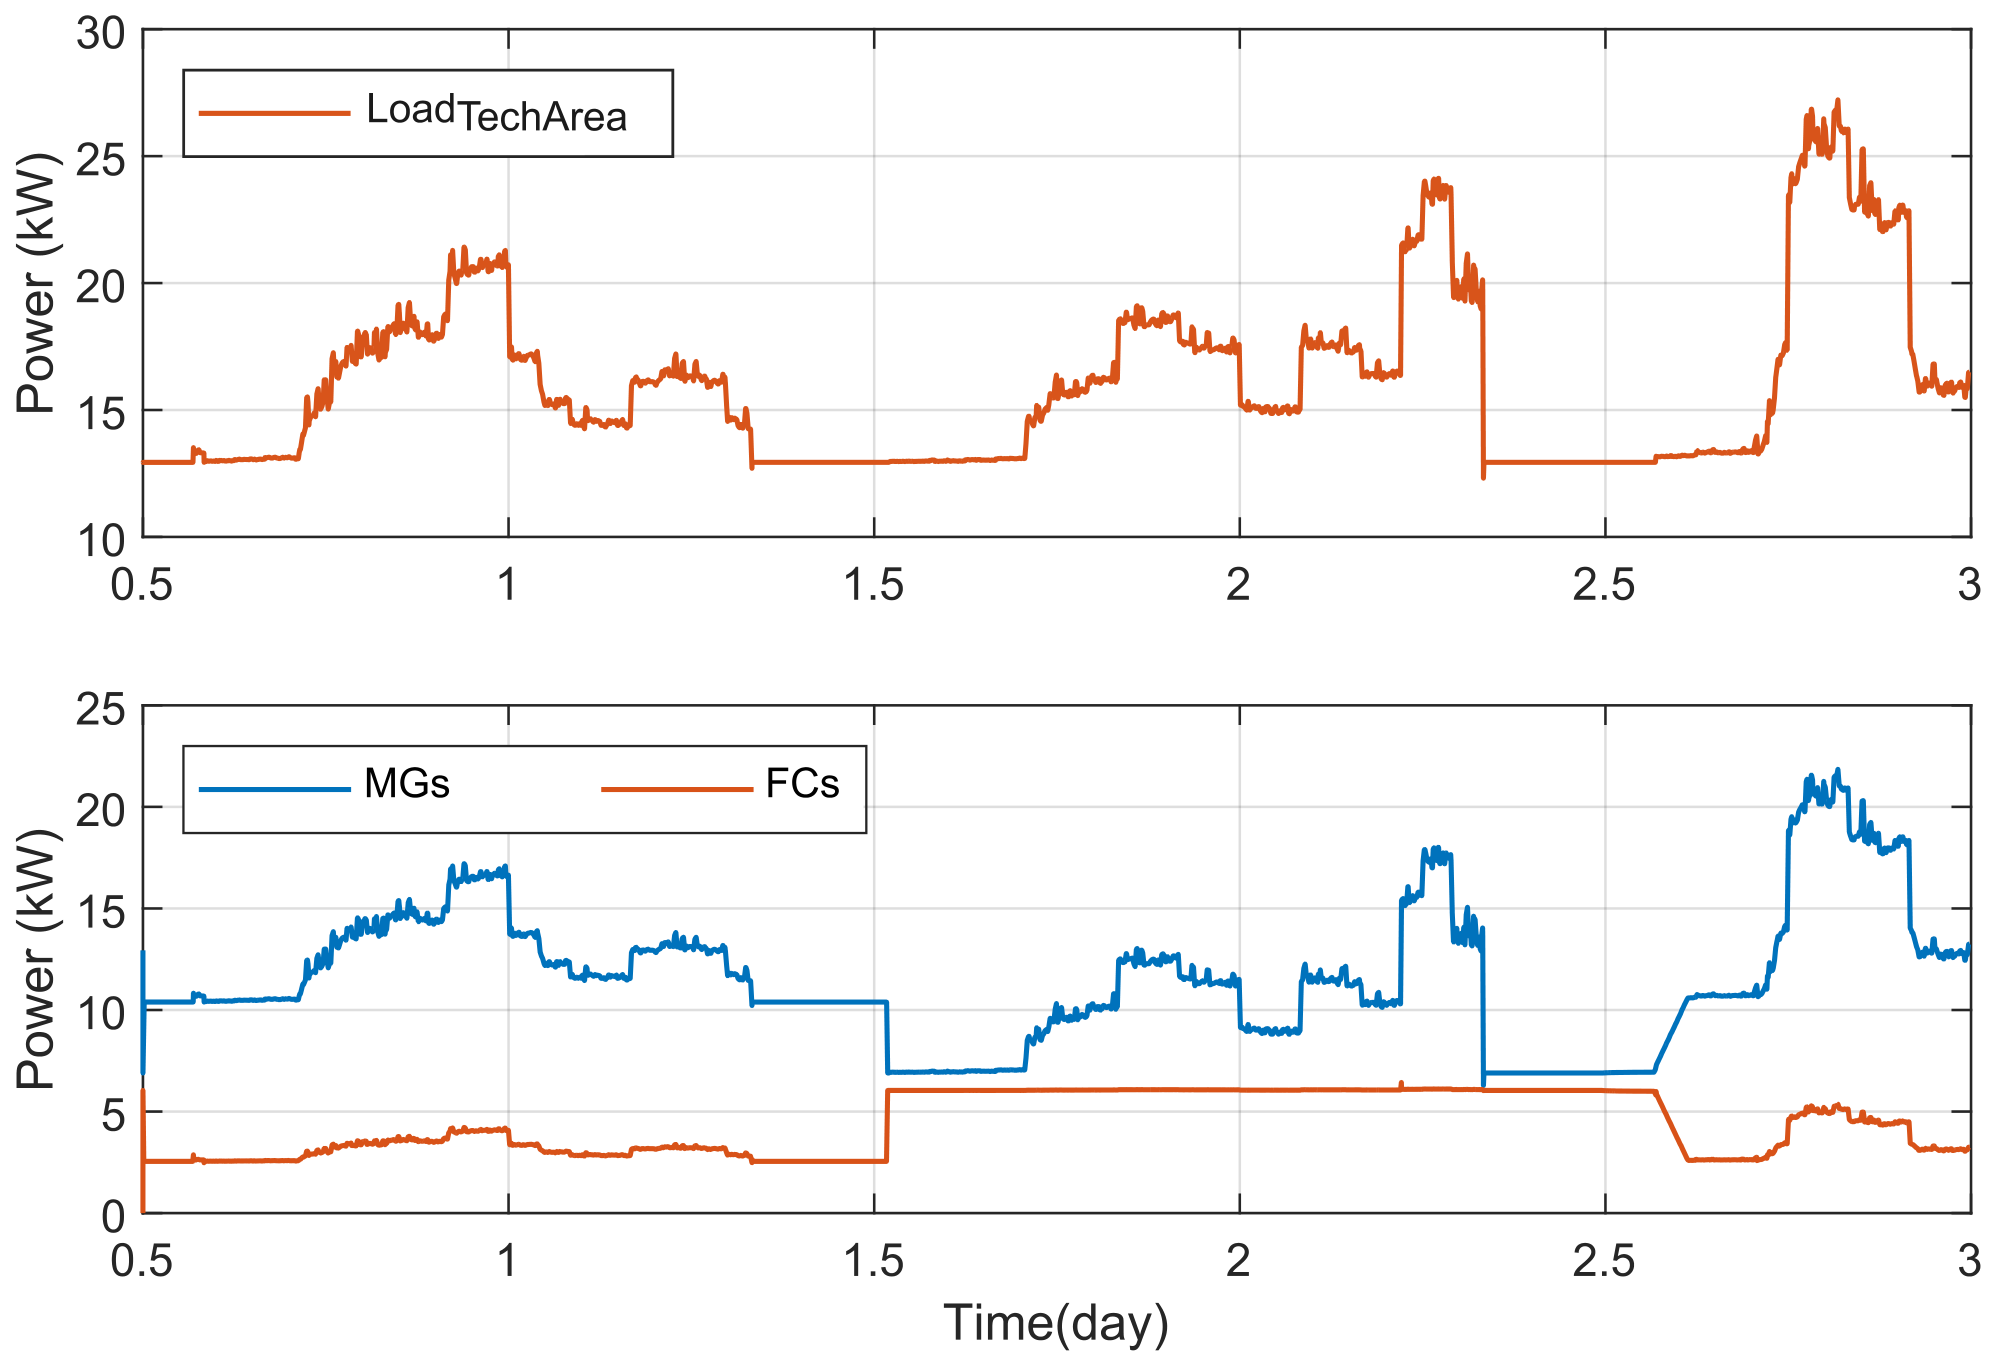
In the TAD, droop control ensures proportional power sharing between fuel cells and main generators. When fuel cells reach their capacity limits, the main generators compensate for the remaining demand, confirming correct controller behavior. As shown in Figure 9 the system successfully tracks the setpoint power-sharing ratios on the first and last days. On the second day, the FCs hit their 6 kW capacity limit, preventing the target 90% share from being met; however, the MGs effectively compensated for the remaining demand, confirming correct controller behavior.
Cabin Area Distribution
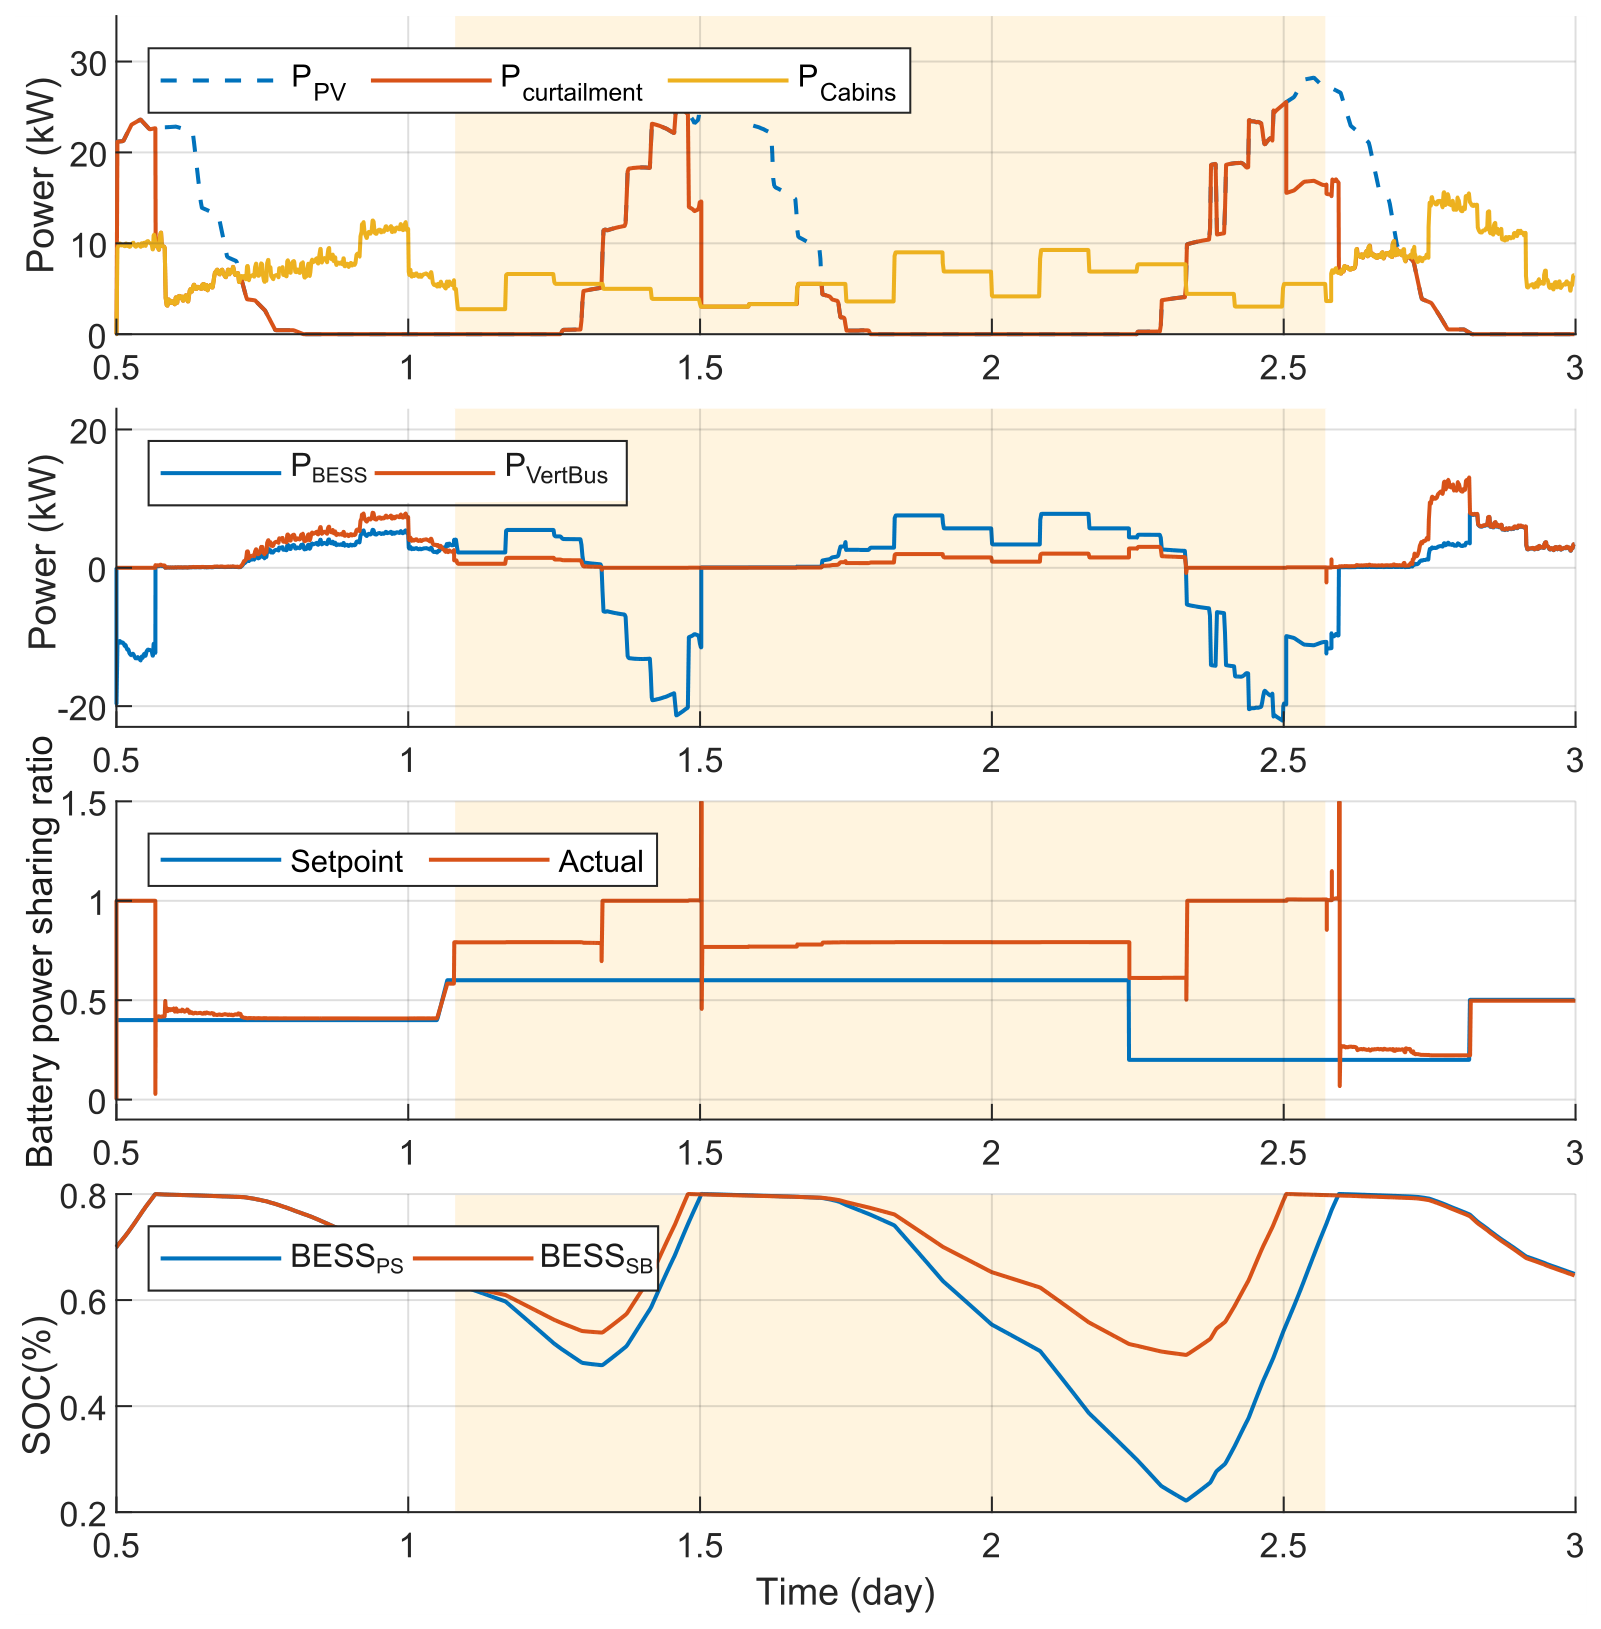
In the CAD, power is supplied by PVs, BESSs, and vertical busbars. Figure 10 summarizes the total load power demand, power supplied by the BESSs and vertical bus systems, power sharing ratio between the BESSs and vertical busbar systems, and BESS SOC on both sides of the firezone. During high PV generation, excess energy is stored in the BESS until the SOC limit is reached, after which PV curtailment is activated. When PV generation decreases, the EMS ensures balanced power sharing between the BESS and vertical busbars. Once the minimum SOC threshold is reached, the BESS is disconnected and the vertical busbars supply the full load. This demonstrates effective energy balancing and reserve management.
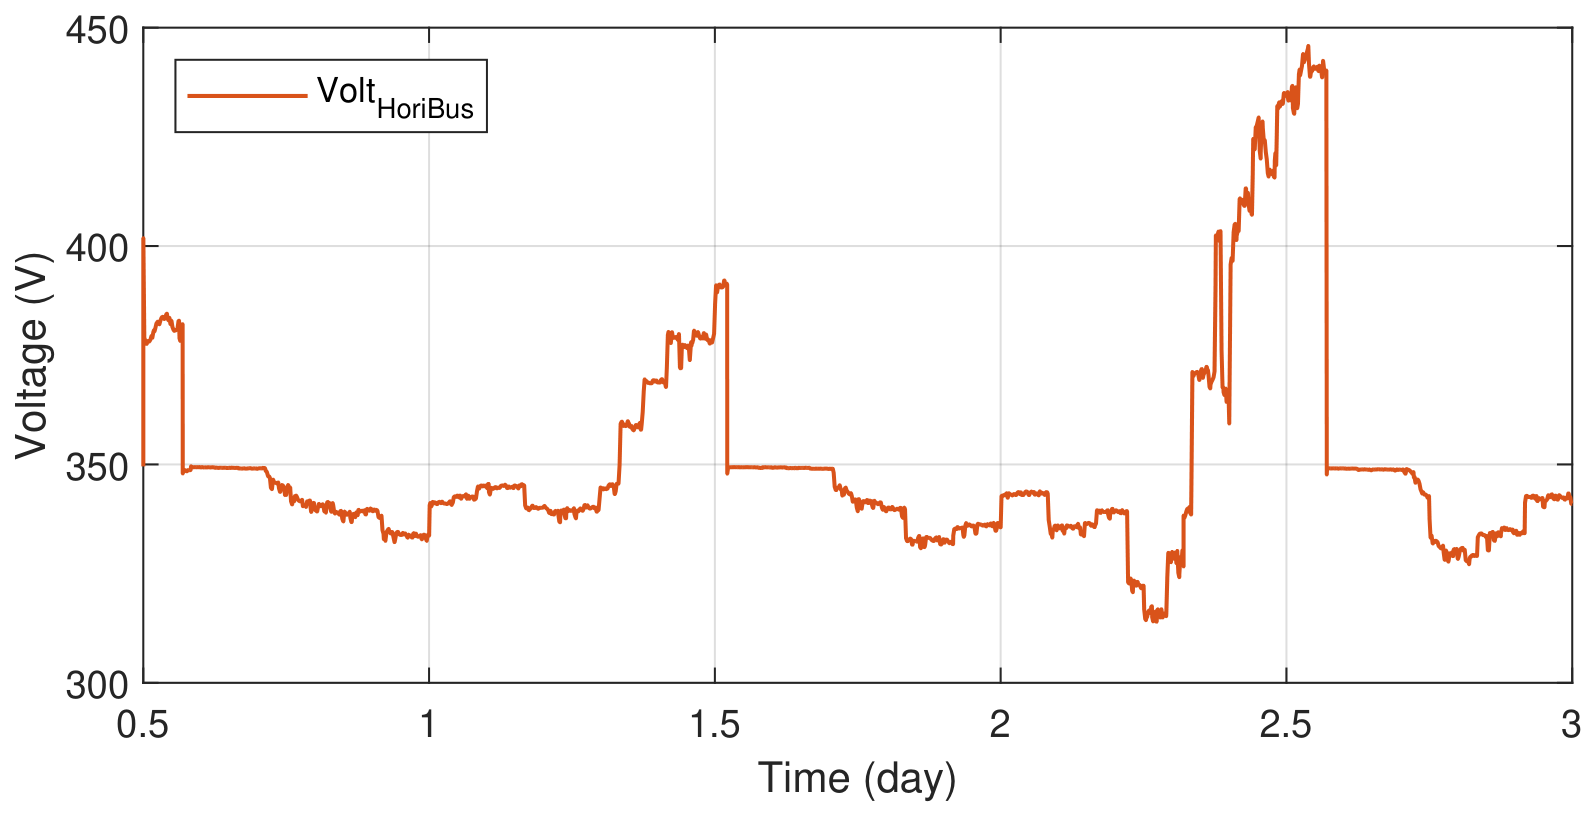
Figure 11 shows the horizontal bus voltage during the entire simulation period. As expected, the voltage increases when PV power generation increases and when the BESSs start to charge. In particular, the voltage is steady at 350 V when PV generation is active and no power is supplied from the remaining sources.

5.2.2. Irregular Operation

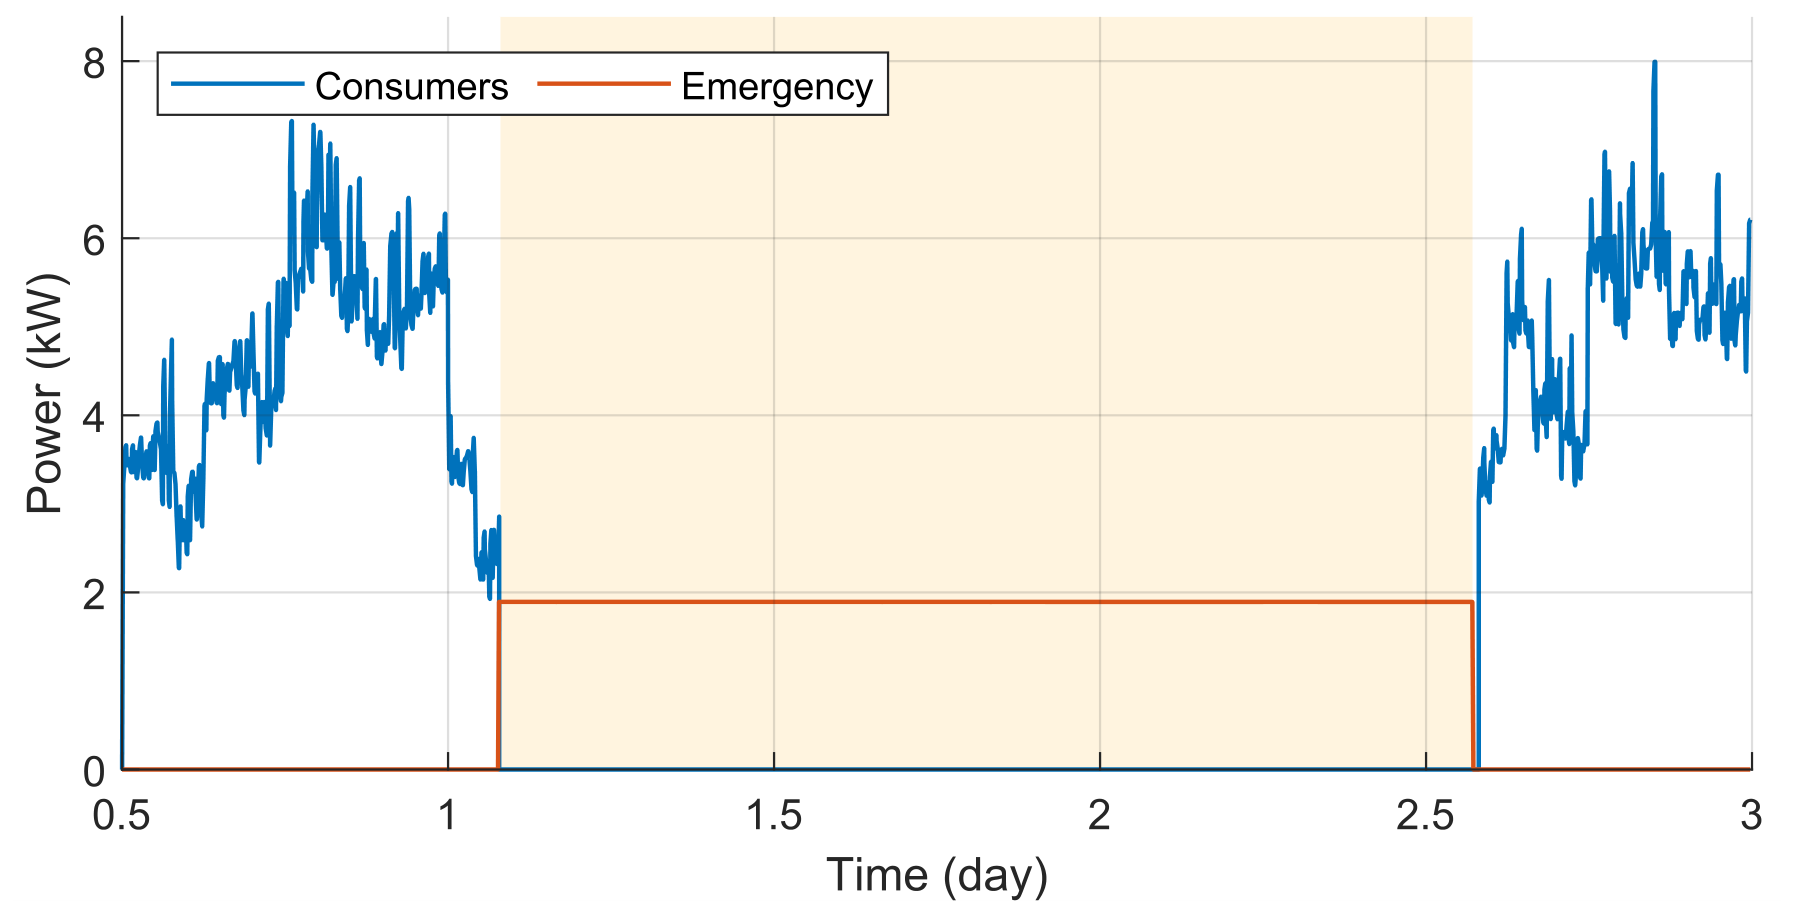
The following results demonstrate the EMS’s resilience under fault conditions. The simulation begins with normal operation of both vertical busbars. The initial 12 h of the simulation coincide with the peak PV power. However, in the early hours of the second day, a fault is introduced on the LV side of the converter on the port-side horizontal bus system (Table 3), causing it to shut down while the starboard-side system continues to operate normally. This converter fault persists for approximately 36 h till the middle of the third day, and its duration is clearly marked in the plotted results. During this time, a load shedding mechanism is activated, prioritizing emergency loads in the CAD area as shown in Figure 12, and the TAD continues to be supplied by the vertical busbar on the starboard side.
Cabin Area Distribution
Following the port-side converter fault, the port-side BESS autonomously assumes 100% of the load to maintain voltage stability, as seen in the SOC subplot of Figure 13. This contrasts with the starboard side, which continues to receive support from the vertical busbar. The results confirm that the reserved battery capacity is effectively utilized to sustain critical loads during isolation.
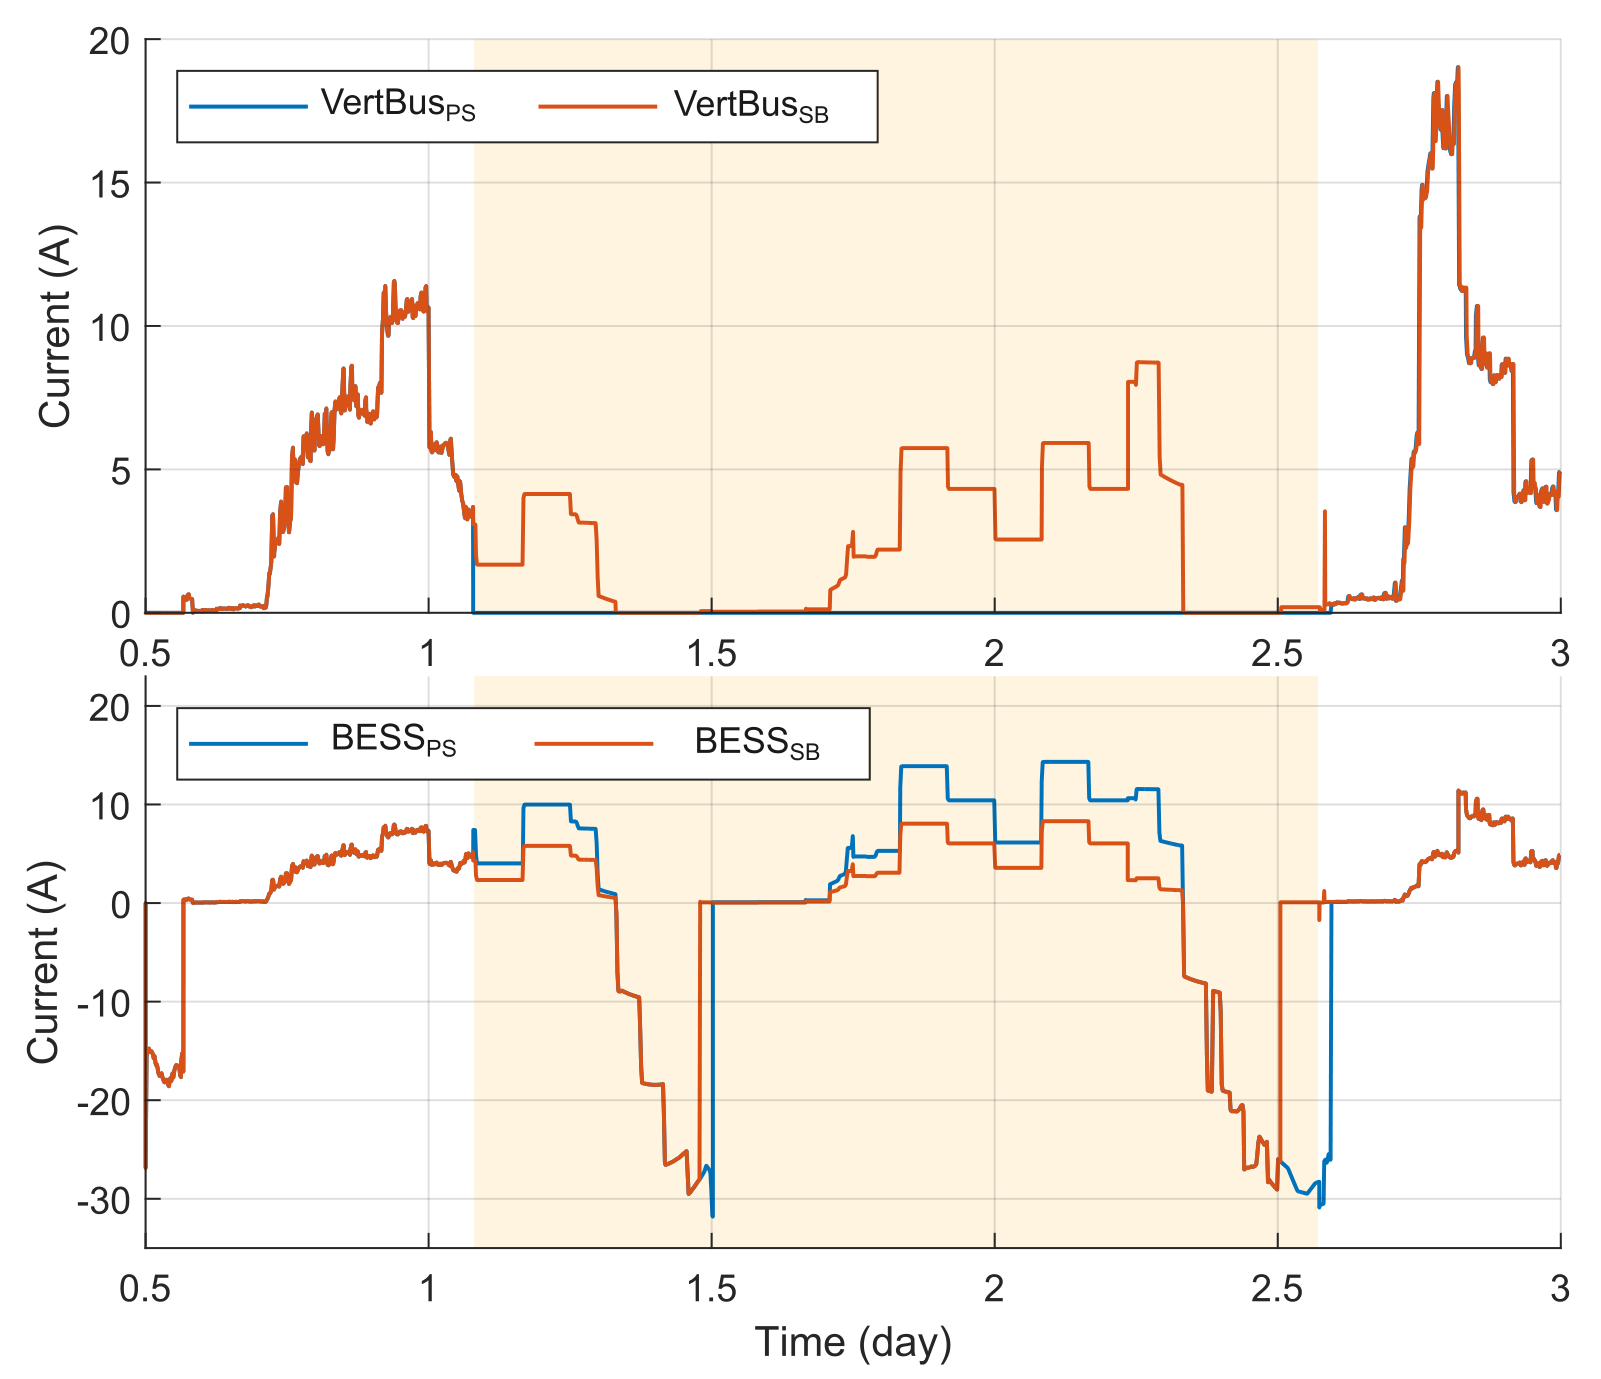
Figure 14 illustrates the current contribution from the power sources within the CAD. Initially, the vertical bus systems and BESSs share the load equally. However, when the fault occurs, the current of the portside vertical bus system drops to zero, and the portside BESS takes over, supplying the entire current demand on that side.
Technical Area Distribution
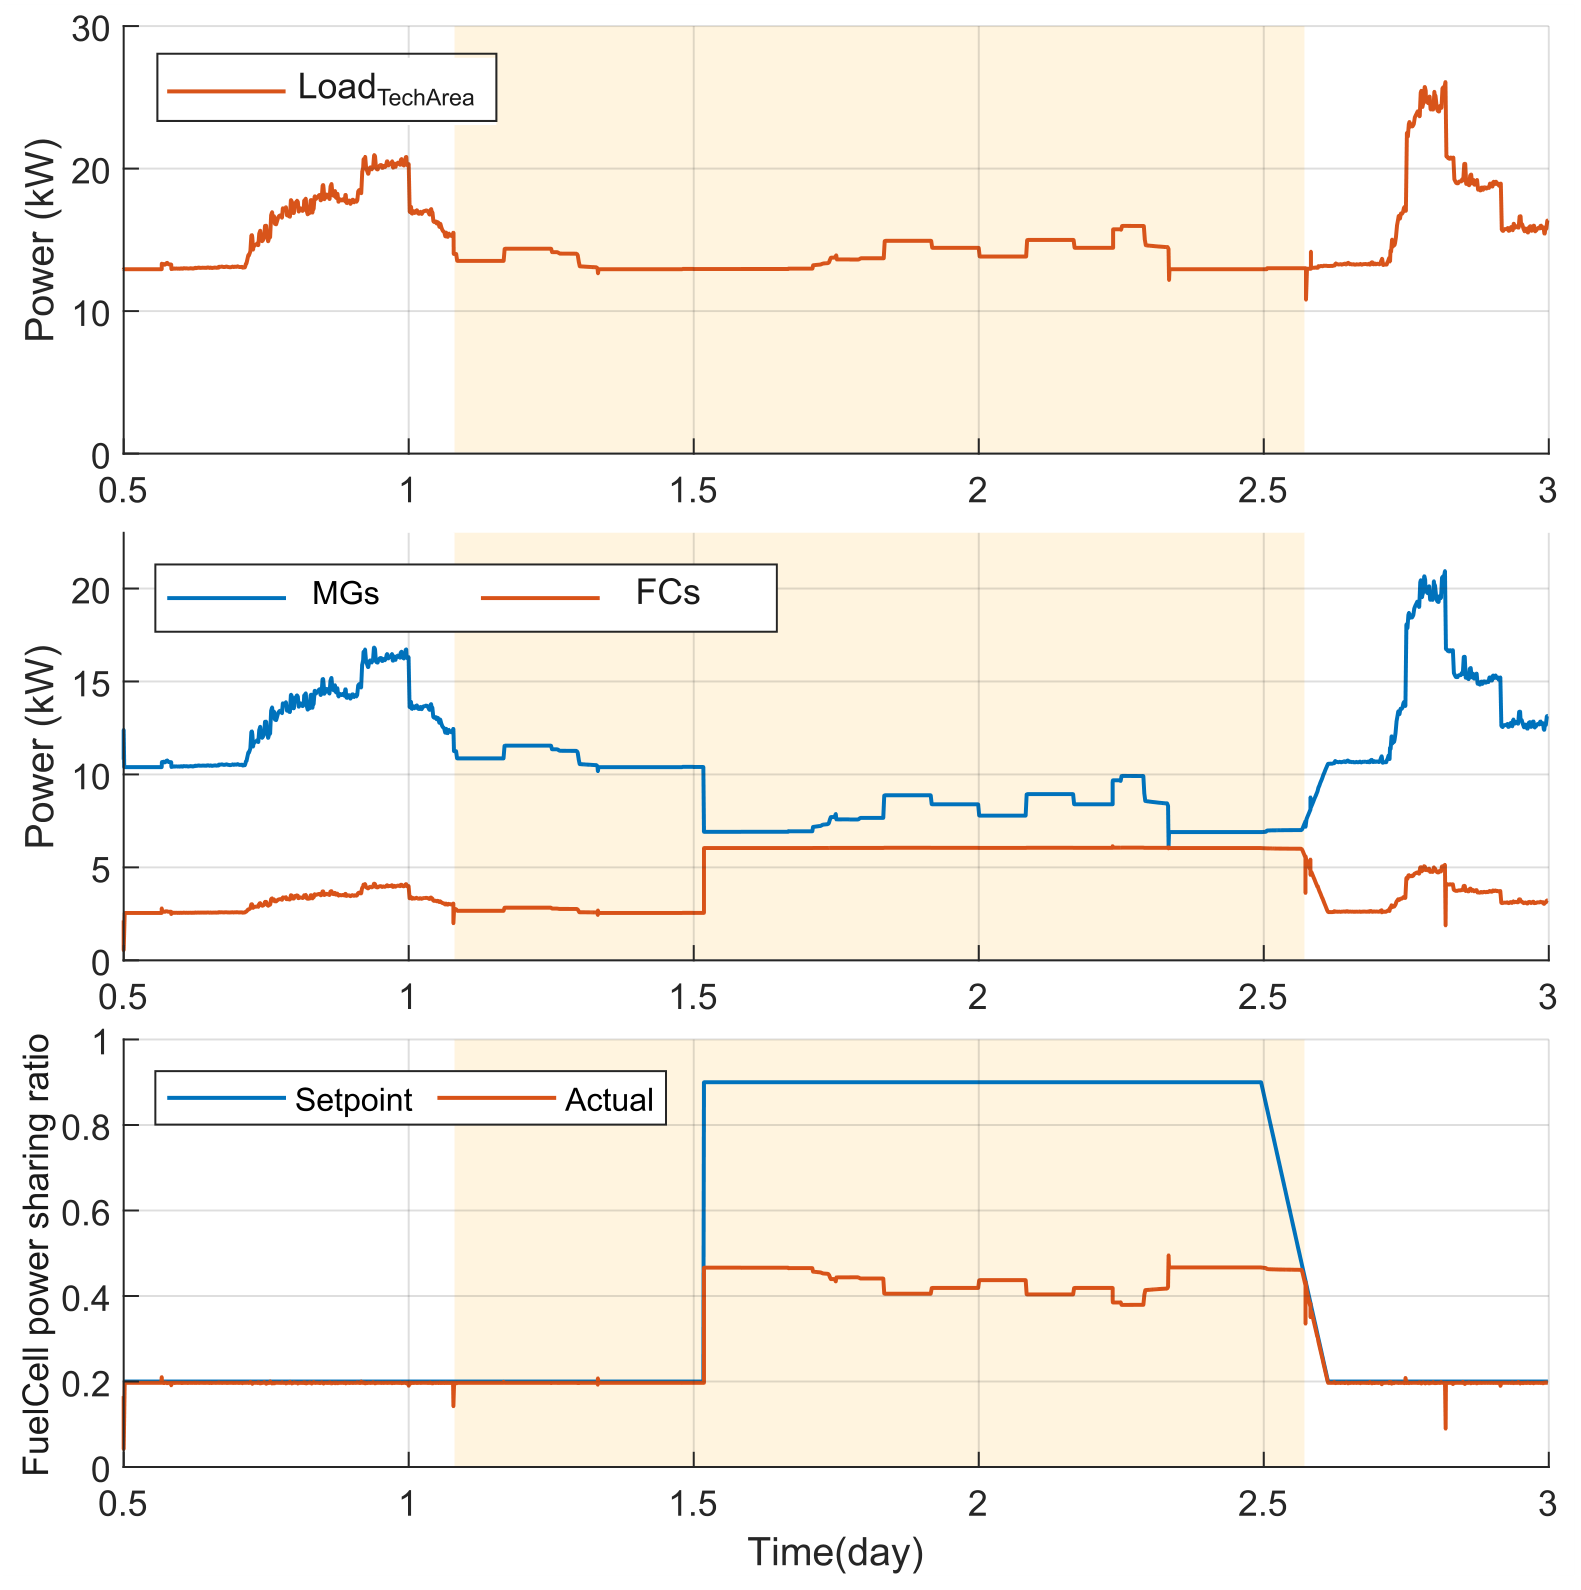
This subsection presents the simulation results for the TAD during irregular operation. The results include power distribution, output current, and vertical bus voltage on both sides of the firezone. Figure 15 illustrates the load demand, power generated by the sources, and the power sharing ratios between the FCs and MGs within the TAD. The load demand in the TAD is reduced due to the shutdown of the HVAC system on the port side, resulting from the fault. However, the HVAC system on the starboard side remains operational, supplied by the vertical busbar on that side, and its power output is sufficient to maintain adequate ventilation in the area. The third subplot compares the actual and setpoint power sharing ratios assigned to the FCs, revealing a close match, particularly when the assigned ratio is low. The deviation from the desired power sharing ratio at higher setpoints is caused by the limited capacity of the fuel cells, requiring the main generators to compensate for the remaining demand. This highlights the effectiveness of the droop controllers in maintaining the desired power sharing ratio. However, when the FCs are assigned a 90% power sharing ratio, they cannot meet the demand due to their limited capacity of 6 k W . In this scenario, the FCs provide 3 k W per side, while the MGs compensate for the remaining load. This confirms the effectiveness of the developed controller in limiting the power generation of the FCs to their capacity constraints and demonstrates the crucial role of the MGs in supporting the overall power demand.
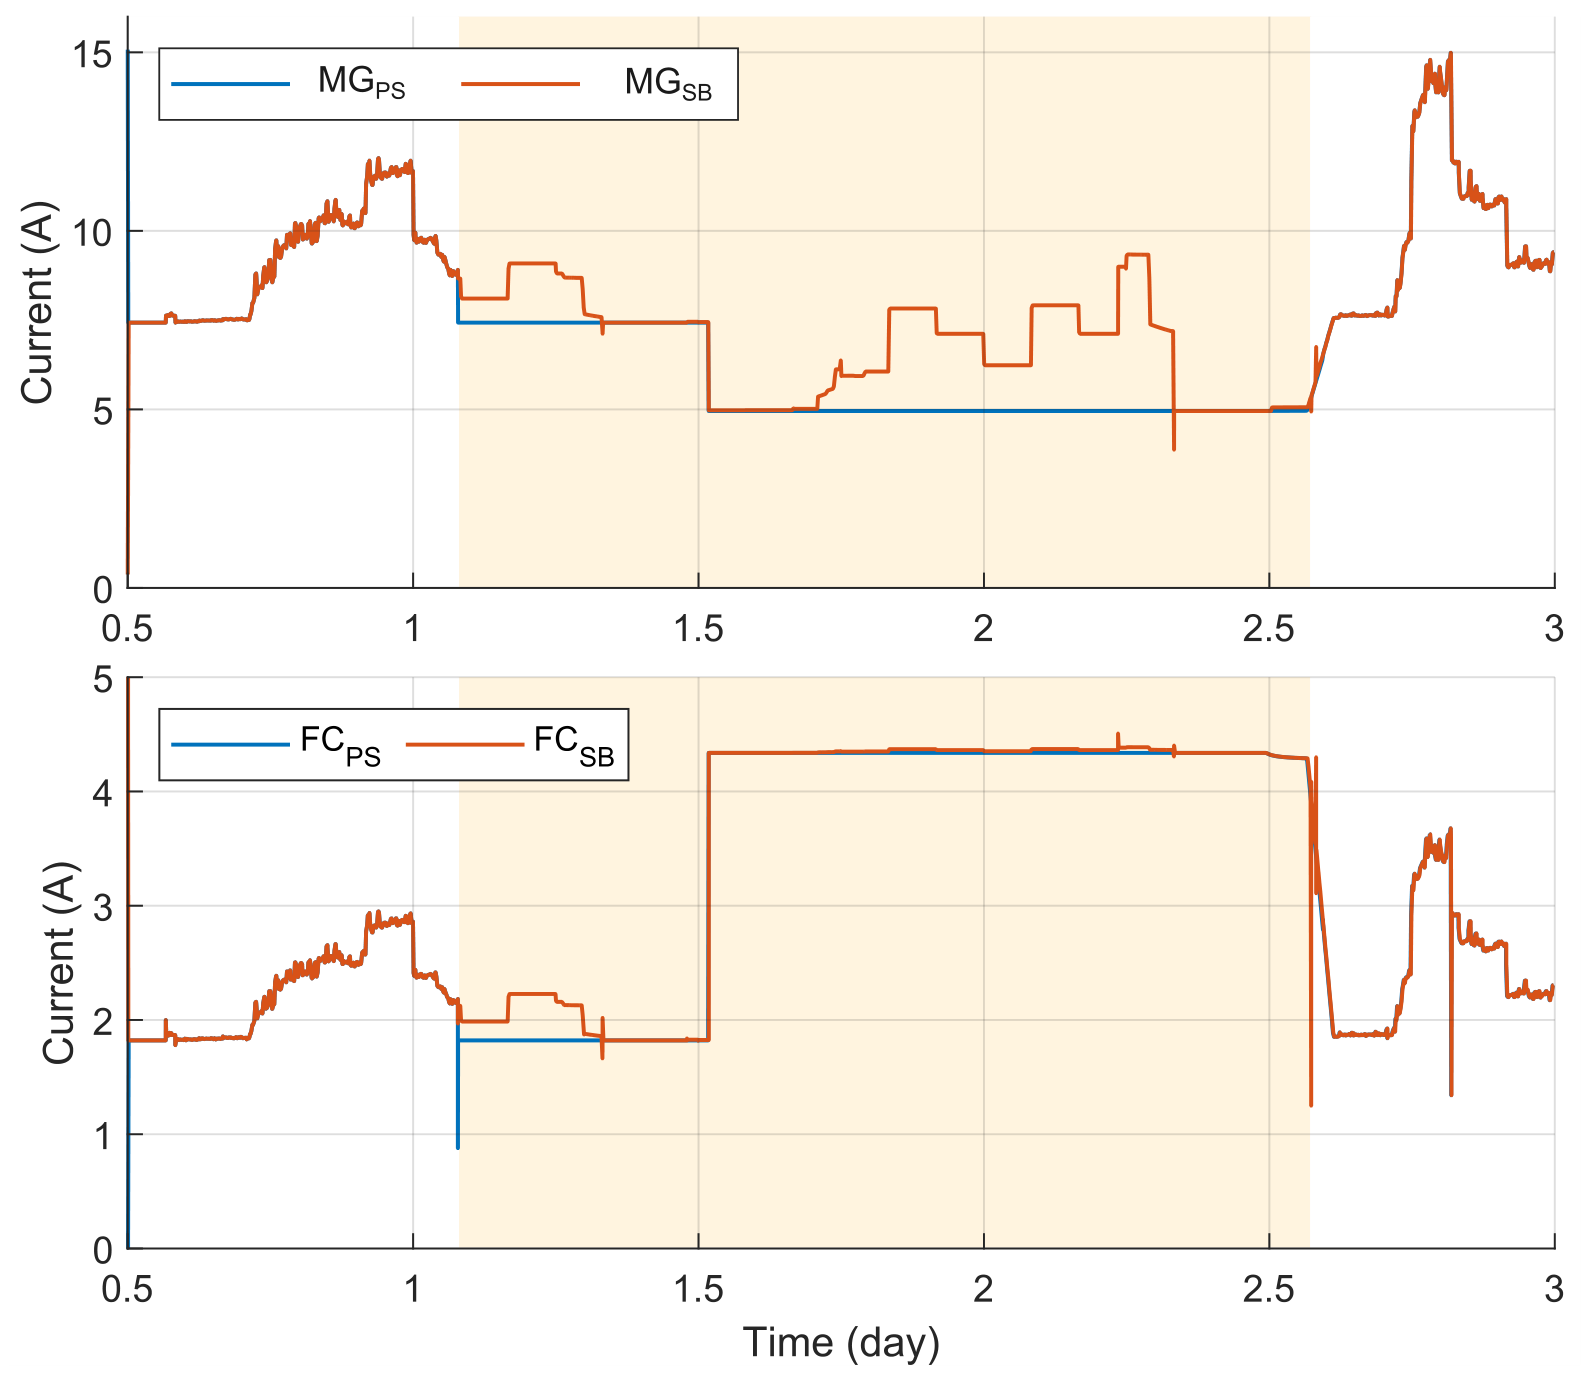
Figure 16 displays the current drawn by the MGs and the FCs on each side of the firezone within the TAD. The results show that the higher current observed on the healthy side indicates load redistribution following the fault, where available sources dynamically adjust their output to maintain system balance.

6. Discussion

The simulation results demonstrate that the proposed decentralized EMS effectively balances the competing objectives of voltage regulation and power sharing in a complex shipboard environment. Our EMS approach is designed to reduce system complexity for faster response times, in contrast to the EMS approaches proposed in [25,28]. While these approaches achieve high load sharing performance, they rely on hierarchical control systems, resulting in system complexity and slow operation. Furthermore, BESS regulation is implemented through a straightforward switching algorithm. This approach has proven effective in managing the charge/discharge of the BESSs, thereby prolonging battery life and ensuring state of charge balance.
Under regular operation, the system successfully maintained stable voltage profiles across both the CAD and TAD while adhering to the predefined power-sharing ratios between FCs and MGs. Notably, the system correctly handled the capacity constraints of the FCs; when the FCs reached their 6 k W limit, the MGs seamlessly compensated for the remaining demand without causing voltage instability. This confirms that the droop control logic is robust enough to manage source limitations dynamically.
The most significant finding, however, lies in the system’s behavior during irregular operation. The EMS demonstrates resilience by dynamically adjusting the load distribution. Specifically, the BESS on the port side autonomously takes over the power supply, utilizing its reserved capacity to maintain voltage stability and meet critical load demand on the fault side. Load shedding is also employed effectively to reduce non-critical loads and prevent cascading system failures. Power and current profiles clearly highlight the adaptive behavior of the system components in response to the disturbance, particularly the crucial role played by the BESSs, acting as a bridge between load and generation.
The simulation methodology was designed to validate the EMS under the most demanding operational conditions—specifically, a converter output fault that isolates the firezone from main generators. This scenario directly tests the EMS’s core claim: maintaining critical loads without external power support. Battery parameters were derived from experimental characterization, ensuring that simulation inputs reflect realistic component behavior. The evaluation under both regular and fault conditions, while conducted in simulation, provides essential proof-of-concept for the proposed decentralized control architecture in shipboard DC microgrids. Despite the promising results, several limitations should be acknowledged. The study is based on simulations under predefined load and environmental conditions, and real-world uncertainties such as measurement errors, communication delays, and component degradation are not explicitly considered.

7. Conclusions

This paper proposes an effective decentralized EMS combined with a novel topology tailored to meet the different operational and safety requirements of cruise ship firezones. The key findings and contributions are summarized as follows:
  • A decentralized droop-based EMS was developed for both the CAD and TAD, enabling proportional power sharing between multiple power sources under normal and fault conditions.
  • The study demonstrated the EMS’s ability to regulate voltage, maintain battery SOC within safe limits, and ensure proportional load sharing during regular operation.
  • Under fault conditions, the EMS demonstrated strong adaptability. The BESS on the port side successfully supported the critical loads, maintaining voltage stability and preventing service disruption. Moreover, load shedding was activated as designed to maintain system stability and prioritize critical loads.
  • The current and voltage profiles across both zones confirm the EMS’s ability to reconfigure power paths, balance sources, and avoid voltage collapses during faults, proving its practical applicability in isolated maritime energy systems.
Limitations and Future Work: This study focuses on simulation-based validation of a decentralized EMS architecture for a single firezone DC microgrid. Experimental validation and hardware-in-the-loop testing were beyond the scope of the present project work and will be addressed in future research. In particular, experimental investigation of the proposed droop-based load-sharing strategy in a DC microgrid environment will be conducted to further validate system performance. Furthermore, while the proposed EMS is evaluated at the firezone level, full-ship deployment would require coordination among multiple zones. Future research will explicitly investigate these types of failures, including BESS faults and load-side faults. Future work will also include hierarchical supervisory control architectures to integrate local firezone EMS units with ship-level energy management while preserving decentralized operation and fault tolerance. Integration of advanced fault diagnosis methods with the EMS represents another important direction for future work.

Author Contributions

Conceptualization, R.E.I. and R.B.; Methodology, R.E.I., R.B. and S.V.; Software, R.E.I. and R.B.; Validation, R.E.I. and S.V.; Formal analysis, R.B. and S.V.; Investigation, R.B. and F.S.; Resources, K.v.M.; Data curation, R.E.I.; Visualization, R.E.I. and S.V.; Writing—original draft preparation, R.E.I. and R.B.; Writing—review and editing, R.B. and S.V.; Supervision, F.S. and K.v.M.; Funding acquisition, K.v.M. All authors have read and agreed to the published version of the manuscript.

Funding

The results were generated in the framework of the project Sustainable DC-Systems (SuSy) (grant no. 03SX527B). We thank the Federal Ministry for Economic Affairs and Energy (BMWi) of Germany for funding.

Data Availability Statement

The data presented in this study are available on request from the corresponding author.

Acknowledgments

We would like to express our sincere thanks to our project partners: MEYER WERFT GmbH & Co. KG; morEnergy GmbH; Siemens Energy Global GmbH & Co. KG; the Hamburg University of Technology, Lloyd’s Register EMEA, and Damen Shipyards, for their valuable and professional cooperation.

Conflicts of Interest

The authors declare that they have no known competing financial interests or personal relationships that could have influenced the work reported in this paper. The funder was not involved in the study design, collection, analysis, interpretation of data, the writing of this article, or the decision to submit it for publication.

References

  1. International Maritime Organization. Fourth IMO GHG Study 2020 Executive-Summary; The Marine Environment Protection Committee: London, UK, 2020. [Google Scholar]
  2. Belila, A.; Benbouzid, M.; Berkouk, E.M.; Amirat, Y. On Energy Management Control of a PV-Diesel-ESS Based Microgrid in a Stand-Alone Context. Energies 2018, 11, 2164. [Google Scholar] [CrossRef]
  3. International Maritime Organization. 2023 IMO Strategy on Reduction of GHG Emissions from Ships; The Marine Environment Protection Committee: London, UK, 2023. [Google Scholar]
  4. Issa, M.; Ilinca, A.; Martini, F. Ship Energy Efficiency and Maritime Sector Initiatives to Reduce Carbon Emissions. Energies 2022, 15, 7910. [Google Scholar] [CrossRef]
  5. Pan, P.; Sun, Y.; Yuan, C.; Yan, X.; Tang, X. Research progress on ship power systems integrated with new energy sources: A review. Renew. Sustain. Energy Rev. 2021, 144, 111048. [Google Scholar] [CrossRef]
  6. Mackay, L.; Blij, N.H.v.d.; Ramirez-Elizondo, L.; Bauer, P. Toward the universal DC distribution system. Electr. Power Compon. Syst. 2017, 45, 1032–1042. [Google Scholar] [CrossRef]
  7. Ahmed Khan, A.; Timilsina, L.; Muriithi, G.; Arsalan, A.; Moghassemi, A.; Papari, B.; Ozkan, G.; Edrington, C.S.; Seifi Boghrabadi, N.; Wang, Z. Energy Management Systems for Maritime Microgrids: A Comprehensive Review of Intelligent Optimization Strategies. IEEE Access 2025, 13, 171563–171597. [Google Scholar] [CrossRef]
  8. Shabbir, G.; Hasan, A.; Yaqoob Javed, M.; Shahid, K.; Mussenbrock, T. Review of DC Microgrid Design, Optimization, and Control for the Resilient and Efficient Renewable Energy Integration. Energies 2025, 18, 6364. [Google Scholar] [CrossRef]
  9. Jin, Z.; Savaghebi, M.; Vasquez, J.C.; Meng, L.; Guerrero, J.M. Maritime DC microgrids—A combination of microgrid technologies and maritime onboard power system for future ships. In Proceedings of the 2016 IEEE 8th International Power Electronics and Motion Control Conference (IPEMC-ECCE Asia); IEEE: Piscataway, NJ, USA, 2016; pp. 179–184. [Google Scholar] [CrossRef]
  10. IRENA. Renewable Energy Options for Shipping; IRENA: Abu Dhabi, United Arab Emirates, 2015. [Google Scholar]
  11. Seenumani, G. Real-time Power Management of Hybrid Power Systems in All Electric Ship Applications. Ph.D. Thesis, The University of Michigan, Ann Arbor, MI, USA, 2010. [Google Scholar]
  12. Hunt, J.; Nascimento, A. Electrolysis ship for green hydrogen production and possible applications. Int. J. Energy Environ. Eng. 2021, 15, 42e6. [Google Scholar]
  13. Simmonds, O.J. DC: Is it the alternative choice for naval power distribution? J. Mar. Eng. Technol. 2014, 13, 37–43. [Google Scholar] [CrossRef]
  14. Zivi, E. Design of robust shipboard power automation systems. Annu. Rev. Control 2005, 29, 261–272. [Google Scholar] [CrossRef]
  15. Bassam, A.; Phillips, A.; Turnock, S.; Wilson, P.A. Design, modelling and simulation of a hybrid fuel cell propulsion system for a domestic ferry. In Proceedings of the 13th International Symposium on PRActical Design of Ships and Other Floating Structures (PRADS’ 2016); Nielsen, U.D., Ed.; Technical University of Denmark: Lundtofte, Denmark, 2016; pp. 545–553. [Google Scholar]
  16. Nivolianiti, E.; Karnavas, Y.L.; Charpentier, J.F. Energy management of shipboard microgrids integrating energy storage systems: A review. Renew. Sustain. Energy Rev. 2024, 189, 114012. [Google Scholar] [CrossRef]
  17. Luna, M.; La Tona, G.; Accetta, A.; Pucci, M.; Pietra, A.; Di Piazza, M.C. Optimal Management of Battery and Fuel Cell-Based Decentralized Generation in DC Shipboard Microgrids. Energies 2023, 16, 1682. [Google Scholar] [CrossRef]
  18. Batiyah, S.; Sharma, R.; Abdelwahed, S.; Zohrabi, N. An MPC-based power management of standalone DC microgrid with energy storage. Int. J. Electr. Power Energy Syst. 2020, 120, 105949. [Google Scholar] [CrossRef]
  19. Zhang, Y.; Li, Y.W. Energy management strategy for supercapacitor in droop-controlled DC microgrid using virtual impedance. IEEE Trans. Power Electron. 2016, 32, 2704–2716. [Google Scholar] [CrossRef]
  20. Shirkhani, M.; Tavoosi, J.; Danyali, S.; Sarvenoee, A.K.; Abdali, A.; Mohammadzadeh, A.; Zhang, C. A review on microgrid decentralized energy/voltage control structures and methods. Energy Rep. 2023, 10, 368–380. [Google Scholar] [CrossRef]
  21. Abdolmaleki, B.; Bergna Diaz, G. Distributed Control and Optimization of DC Microgrids: A Port-Hamiltonian Approach. IEEE Access 2022, 10, 64222–64233. [Google Scholar] [CrossRef]
  22. Zia, M.F.; Nasir, M.; Elbouchikhi, E.; Benbouzid, M.; Vasquez, J.C.; Guerrero, J.M. Energy Management System for an Islanded Renewables-based DC Microgrid. In Proceedings of the 2020 2nd International Conference on Smart Power & Internet Energy Systems (SPIES); IEEE: Piscataway, NJ, USA, 2020; pp. 543–547. [Google Scholar] [CrossRef]
  23. Aboelezz, A.M.; Sedhom, B.E.; El-Saadawi, M.M.; Eladl, A.A.; Siano, P. State-of-the-Art Review on Shipboard Microgrids: Architecture, Control, Management, Protection, and Future Perspectives. Smart Cities 2023, 6, 1435–1484. [Google Scholar] [CrossRef]
  24. Bhargavi, K.M.; Jayalakshmi, N.S.; Gaonkar, D.N.; Shrivastava, A.; Jadoun, V.K. A Comprehensive Review on Control Techniques for Power Management of Isolated DC Microgrid System Operation. IEEE Access 2021, 9, 32196–32228. [Google Scholar] [CrossRef]
  25. Dizqah, A.M.; Maheri, A.; Busawon, K.; Kamjoo, A. A Multivariable Optimal Energy Management Strategy for Standalone DC Microgrids. IEEE Trans. Power Syst. 2015, 30, 2278–2287. [Google Scholar] [CrossRef]
  26. Zia, M.F.; Elbouchikhi, E.; Benbouzid, M.E.H. An Energy Management System for Hybrid Energy Sources-based Stand-alone Marine Microgrid. IOP Conf. Ser. Earth Environ. Sci. 2019, 322, 012001. [Google Scholar] [CrossRef]
  27. Accetta, A.; Pucci, M. Energy Management System in DC Micro-Grids of Smart Ships: Main Gen-Set Fuel Consumption Minimization and Fault Compensation. IEEE Trans. Ind. Appl. 2019, 55, 3097–3113. [Google Scholar] [CrossRef]
  28. Xiao, Z.X.; Guan, Y.Z.; Fang, H.W.; Terriche, Y.; Guerrero, J.M. Dynamic and Steady-State Power-Sharing Control of High-Efficiency DC Shipboard Microgrid Supplied by Diesel Generators. IEEE Syst. J. 2022, 16, 4595–4606. [Google Scholar] [CrossRef]
  29. Xu, L.; Guerrero, J.M.; Lashab, A.; Wei, B.; Bazmohammadi, N.; Vasquez, J.C.; Abusorrah, A. A Review of DC Shipboard Microgrids—Part II: Control Architectures, Stability Analysis, and Protection Schemes. IEEE Trans. Power Electron. 2022, 37, 4105–4120. [Google Scholar] [CrossRef]
  30. Huang, K.; Li, W.; Cao, S.; Gao, F.; Li, R.; Xu, W.; Lin, B. Recent advances in fault diagnosis of ship integrated power systems: A review. Ocean Eng. 2026, 343, 123141. [Google Scholar] [CrossRef]
  31. Janecek, D. (Ed.) Statustagung Maritime Technologien: Tagungsband der Statustagung 2024. In Schriftenreihe Projektträger Jülich; Forschungszentrum Jülich GmbH Zentralbibliothek Verlag: Jülich, Germany, 2024; Volume 19. [Google Scholar]
  32. Gerardi, C.; Bengasi, G.; Carbone, L.; Spampinato, A.; Rametta, F.; Ragonesi, A.; Izzo, G.; Sciuto, M.; Foti, M.; Bizzarri, F. Innovative PV Technologies for reducing electricity costs. IOP Conf. Ser. Mater. Sci. Eng. 2022, 1265, 012002. [Google Scholar] [CrossRef]
  33. Klasen, N.; Weisser, D.; Rößler, T.; Neuhaus, D.H.; Kraft, A. Performance of shingled solar modules under partial shading. Prog. Photovolt. Res. Appl. 2022, 30, 325–338. [Google Scholar] [CrossRef]
  34. Ferreira, R.A.F.; Braga, H.A.; Ferreira, A.A.; Barbosa, P.G. Analysis of voltage droop control method for dc microgrids with Simulink: Modelling and simulation. In Proceedings of the 2012 10th IEEE/IAS International Conference on Industry Applications; IEEE: Piscataway, NJ, USA, 2012; pp. 1–6. [Google Scholar] [CrossRef]
  35. Abhishek, A.; Ranjan, A.; Devassy, S.; Kumar Verma, B.; Ram, S.K.; Dhakar, A.K. Review of hierarchical control strategies for DC microgrid. IET Renew. Power Gener. 2020, 14, 1631–1640. [Google Scholar] [CrossRef]
  36. Nair, U.R.; Costa-Castello, R. A Model Predictive Control-Based Energy Management Scheme for Hybrid Storage System in Islanded Microgrids. IEEE Access 2020, 8, 97809–97822. [Google Scholar] [CrossRef]
  37. Skeie, K.; Gustavsen, A. Utilising Open Geospatial Data to Refine Weather Variables for Building Energy Performance Evaluation—Incident Solar Radiation and Wind-Driven Infiltration Modelling. Energies 2021, 14, 802. [Google Scholar] [CrossRef]
  38. Schwager, P.; Bekebrok, H.; Gehrke, K.; Vehse, M. A probabilistic bottom-up modelling approach for synthetic load profiles within the energy efficiency management of cruise ship cabins. J. Mar. Eng. Technol. 2023, 22, 304–312. [Google Scholar] [CrossRef]
Figure 1. Overview of the cruise ship DC power system, representing the interaction between energy sources, loads, and EMS.
Energies 19 02512 g001
Figure 2. Electrical configuration of the proposed DC microgrid for cruise ship firezone, with vertical and horizontal busbars, power sources, and their interconnections within the CAD and TAD zones.
Energies 19 02512 g002
Figure 3. The designed control structure for limiting FC system’s output power.
Energies 19 02512 g003
Figure 4. Decision-making flowchart of EMS, illustrating the control brain for power allocation, battery operation, PV curtailment, and load shedding under both regular and fault conditions.
Energies 19 02512 g004
Figure 5. Cruise trajectory path used to obtain location-dependent solar irradiance over a 15-day period (© OpenStreetMap).
Energies 19 02512 g005
Figure 6. Interpolated solar irradiance profiles over a three-day period for port ( E p s ) and starboard ( E s b ) sides, derived from Copernicus hourly data using shape-preserving interpolation.
Energies 19 02512 g006
Figure 7. Time series load profiles for the considered deck, including aggregated cabin consumer demand and HVAC demand within the CAD.
Energies 19 02512 g007
Figure 8. System behavior during regular operation: comparative analysis of PV power generated and total load demand (consumer and HVAC cabins) for a deck comprising 45 cabins; and comparison between power supplied by the main generators via the vertical busbar and power delivered by BESS.
Energies 19 02512 g008
Figure 9. Performance of the TAD under regular operation: total load demand, and power supplied by MGs and FCs.
Energies 19 02512 g009
Figure 10. Total power demand in the CAD and Power sharing ratio between the BESS and vertical busbar.
Energies 19 02512 g010
Figure 11. Horizontal busbar voltage profile of the CAD during normal operating conditions.
Energies 19 02512 g011
Figure 12. Load profile of the cruise ship under fault conditions, where the fault period is highlighted in yellow and fixed activated load shedding corresponds to the critical load.
Energies 19 02512 g012
Figure 13. Total load demand, PV power, and curtailed PV power; Power sharing ratio between the BESSs and vertical busbar; Battery power sharing ratio actual vs. setpoint; and BESS SOC within the CAD on both sides of the firezone.
Energies 19 02512 g013
Figure 14. Current response of vertical busbars and BESSs on port and starboard sides during fault conditions.
Energies 19 02512 g014
Figure 15. TAD performance under fault conditions: load demand, power contribution of MGs and FCs, and comparison between actual and reference power sharing ratios for FCs.
Energies 19 02512 g015
Figure 16. Current profiles of MGs and FCs on both sides of the firezone during fault conditions, illustrating the redistribution of load following system disturbance.
Energies 19 02512 g016
Table 1. Electrical characteristics of the PV module under standard test conditions (1000 W/m2 irradiance, 25 °C cell temperature).
ParameterValue
Maximum Power ( P max )340 W
Voltage at Maximum Power ( V mpp )37.4 V
Current at Maximum Power ( I mpp )9.09 A
Open Circuit Voltage ( V oc )45.2 V
Short Circuit Current ( I sc )9.51 A
Module Efficiency19.6%
Module Length × Width1622 mm × 1068 mm
Table 2. Measured parameters of the battery pack.
SOC vec 00.10.20.30.40.50.60.70.80.91
V O C vec 500600640646650656660666670680730
R 0 vec 0.0250.02420.02340.02260.02170.02090.02010.01930.01850.01760.0168
Table 3. Operational status of system components under fault condition in the converter of the portside horizontal bus bar.
ComponentsNormalStarboard SidePortside (With Fault)
PVActiveActiveActive
BESSCharge/dischargeCharge/dischargeFull Support
MGActiveActiveInactive
FCActiveActiveInactive
LoadsAllCriticalCritical
DC/DC ConverterActiveActiveInactive
Disclaimer/Publisher’s Note: The statements, opinions and data contained in all publications are solely those of the individual author(s) and contributor(s) and not of MDPI and/or the editor(s). MDPI and/or the editor(s) disclaim responsibility for any injury to people or property resulting from any ideas, methods, instructions or products referred to in the content.