1. Introduction
In recent years, lithium-ion batteries (LIBs) have dominated the energy storage market for electric vehicles and grid-scale applications owing to their high energy density, wide operating temperature range, and long cycle life [
1]. Considerable efforts have been devoted to improving the electrochemical performance of LIBs through advanced electrode architectures, including enhancing anode capacity, rate capability, initial coulombic efficiency, and cycling stability [
2,
3,
4,
5,
6]. In addition, carbon nanotube/graphite-based electrodes have been reported to promote charge/discharge capacity through conductive networks and interfacial effects [
7]. These studies have provided important support for the development of high-performance LIBs.
Although the electrochemical performance of LIBs has been continuously improved, manufacturing-related defects remain a critical challenge for battery safety and reliability. During practical cell manufacturing, processes such as electrode cutting, slitting, stacking, and tab welding may introduce metallic contaminants, such as copper and aluminum particles, into the cell, which not only degrade electrochemical performance but also create serious safety hazards. Multiple studies classify metallic contamination as among the most dangerous defects in LIB production, directly compromising battery system reliability [
8,
9,
10]. Automotive industry analyses of global EV fire incidents consistently identify metal particles as a leading cause of thermal runaway events originating from manufacturing defects [
11]. This reality compels researchers to systematically investigate how metallic particles affect both initial battery performance and long-term aging characteristics, which is critical for optimizing manufacturing protocols and quality control. With LIBs expanding into large-scale EV and grid storage applications, the scientific community must address a key challenge: developing effective methods that detect early-stage internal short circuit (ISC) through operational electrical signatures, a crucial capability for ensuring system safety.
Early systematic investigations into the impact mechanisms of metallic particles in lithium-ion batteries trace back to pioneering work by Mohanty et al. [
12]. Their coin-cell experiments with intentionally introduced cobalt particles reveal that current densities exceeding 2C could trigger complete charge/discharge capability loss through induced internal short circuit, which is a foundational discovery for subsequent metallic contamination studies. Regarding underlying mechanisms, Sun et al. [
13] established the electrochemical dissolution–diffusion pathway for Cu particle-induced short circuit via controlled experiments. They demonstrated that at potentials >3.4 V (vs. Li+/Li), Cu particles oxidatively dissolve at the cathode to form Cu
2+ ions, which subsequently migrate through the electrolyte, penetrate separators, and ultimately reductively deposit on anode surfaces. Notably, metallic impurities exhibit effects beyond physical shorting. Nasser et al. [
14] reveal that trace Cu impurities interact with layered NCM cathode lattices through ionic substitution, given the comparable ionic radii of Cu
2+ (0.73 Å), Li
+ (0.76 Å), and Ni
2+ (0.69 Å), Cu
2+ occupies both lithium and transition metal sites, inducing cation disordering [
8,
9]. This structural distortion significantly increases charge transfer resistance and accelerates chemo-mechanical electrode degradation. Intriguingly, Zhang et al. [
15] and Sun et al. [
16] uncovered concentration-dependent effects: Below a certain concentration, Cu may stabilize cathode structures, whereas beyond this critical concentration, it exacerbates capacity fade. This “double-edged sword” phenomenon underscores that metallic impurity impacts transcend simple harmful/benign dichotomies, presenting complex mechanistic interplay.
In the field of internal short circuit detection, methodologies can be categorized into four primary approaches: signal processing-based, battery model-based, machine learning-based, and other emerging techniques. Schmidt et al. [
17] pioneered ISC detection by monitoring morphological variations in voltage relaxation curves following discharge pulses, while Haussmann subsequently quantified the relationship between relaxation voltage slope and ISC resistance. Kong et al. [
18] developed a residual charging capacity (RCC)-based analytical method, though such approaches typically require prolonged rest periods (often several hours) to identify short circuit currents, significantly compromising real-time capability. Fan et al. [
19] proposed a fixed voltage window-based diagnostic method that enables real-time ISC detection through charging voltage analysis. Regarding model-based approaches, Ouyang et al. [
20] established an average-difference model utilizing equivalent circuit parameters to estimate open-circuit voltage (OCV) and internal resistance for ISC diagnosis. Feng et al. [
21] integrated equivalent circuit models with thermal models to detect anomalies through coordinated deviations in state-of-charge (SOC) and heat generation. Similarly, Gao et al. [
22] employed an average-difference model to identify micro-short resistances in battery packs. However, these methods’ accuracy is constrained by model parameter calibration precision and often fails to accommodate parameter drift caused by battery aging. In machine learning applications, Naha et al. [
23] achieved 97% classification accuracy using random forest algorithms on experimental datasets, while Li et al. [
24] systematically compared random forests, support vector machines, and neural networks to establish safety boundary criteria under mechanical abuse conditions. Nevertheless, data-driven methods face challenges including scarce labeled failure data and limited model generalizability. Emerging techniques demonstrate alternative pathways: Wu et al. [
25] successfully implemented X-ray computed tomography (CT) for three-dimensional localization of metallic contaminants in commercial 18650 cells, and Nakajima et al. [
26] discovered through electrochemical impedance spectroscopy (EIS) that metal particle deposition induces significant phase angle shifts in the 10
−1 Hz frequency range, providing new diagnostic markers. However, such methods require specialized equipment, hindering vehicular implementation. Collectively, current technologies still exhibit limitations including delayed response, poor aging resistance, and strong sample dependence. These constraints highlight the critical need for further research into early-stage ISC detection for aged batteries in real-world automotive applications.
Previous studies have demonstrated that metallic particles can induce internal short circuit through mechanical penetration or electrochemical dissolution/migration/deposition processes. Cu particles are particularly important because they may dissolve under high-potential conditions, migrate through the electrolyte, and redeposit on the opposite electrode surface, thereby forming conductive pathways and accelerating side reactions. However, most existing studies mainly focused on the formation mechanism of internal short circuit in fresh or simplified cells, while the long-term degradation evolution and electrochemical signatures of Cu-contaminated practical pouch cells remain insufficiently understood. Therefore, this work addresses these issues by systematically investigating copper-particle-induced failure, where the particles were introduced to simulate contaminants originating from anode slitting and current collector welding processes. The investigation was conducted through multi-scale post-mortem analysis, which includes optical microscopy (OM), X-ray microscopy (XRM), scanning electron microscopy (SEM), and energy-dispersive spectroscopy (EDS), combined with electrochemical diagnostics. Our results reveal key failure modes, including ISC, graphite cracking, and aluminum dissolution, and identify a gradual mitigation of the ISC after long-term cycling. Furthermore, incremental capacity analysis (ICA) was used to evaluate the severity of Cu-induced internal short circuit, and differential voltage analysis (DVA) was further applied to distinguish Cu-contamination-induced internal leakage from normal aging. This study thus provides mechanistic insight into contamination-related degradation and electrochemical signatures for improving metallic-defect identification in lithium-ion cells.
2. Materials and Methods
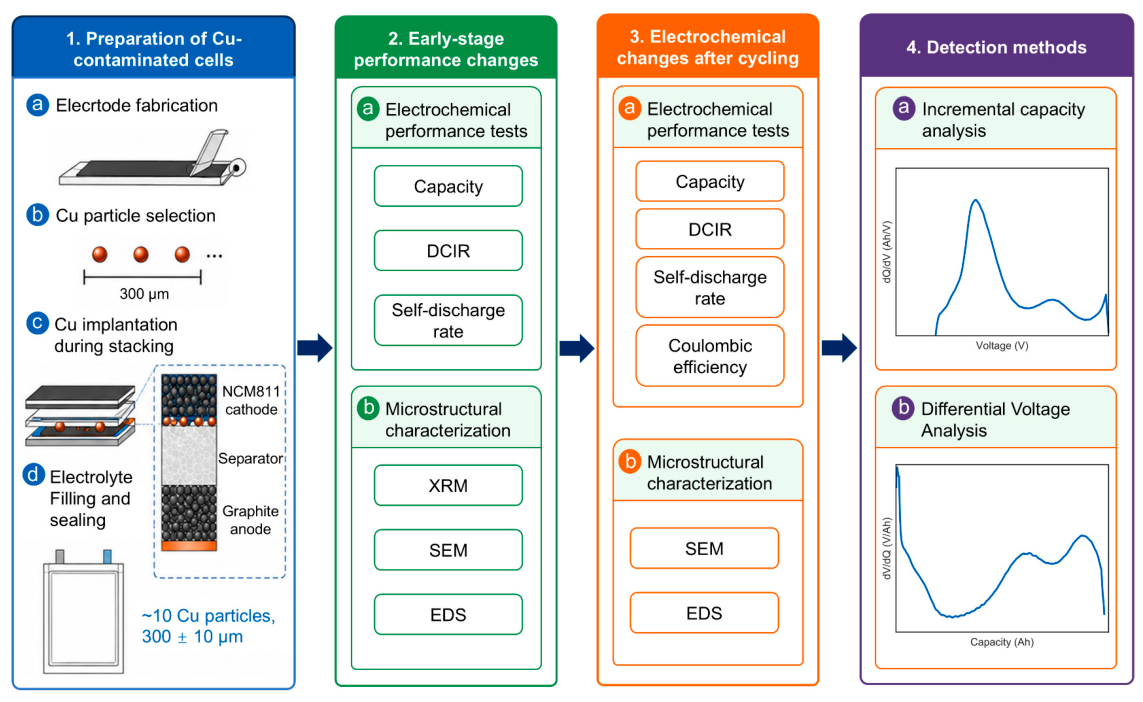
The overall research framework is summarized in
Figure 1. The study was organized into four parts: preparation of Cu-contaminated cells, early-stage performance evaluation, cycling-induced electrochemical and microstructural analysis, and defect detection based on electrochemical signatures.
2.1. Cell Preparation
The pouch cells used in this study were fabricated through a controlled manufacturing process, including electrode fabrication, calendering, slitting, stacking, electrolyte filling, and sealing. The cathode was prepared using NCM811 as the active material, while the anode was prepared using graphite as the active material. The anode coating thickness and cathode coating thickness were measured to be 64 μm and 51 μm, respectively. The N/P ratio of the full cell was 1.16, which was calculated based on the areal capacities of the anode and cathode electrodes. These electrode-design parameters were kept identical for all cells to ensure that the comparison between pristine and Cu-contaminated cells reflected the effect of Cu contamination under the same full-cell configuration.
The prepared cells were pouch-type lithium-ion cells with a nominal capacity of approximately 2.8 Ah and dimensions of 110 mm × 55 mm × 3 mm. The electrode assembly consisted of 11 anode layers and 10 cathode layers. A polypropylene/polyethylene/polypropylene (PP/PE/PP) composite separator with a thickness of 12 μm was used to separate the anode and cathode. The electrolyte was 1.0 M LiPF
6 dissolved in a mixed solvent of ethylene carbonate (EC) and ethyl methyl carbonate (EMC). The detailed parameters of the pouch cells and the introduced metallic particles are summarized in
Table 1.
To simulate Cu contamination that may be introduced during battery manufacturing processes such as anode slitting and current collector welding, spherical Cu particles were intentionally embedded into the cells during the stacking process. The Cu particles were selected under an optical microscope, and their diameter was controlled at 300 ± 10 μm. Approximately 10 Cu particles were introduced into each Cu-contaminated cell. During stacking, the process was temporarily paused after separator placement, and the Cu particles were manually positioned at the cathode–separator interface using non-metallic tweezers under optical guidance. The stacking and subsequent packaging procedures were then continued following the standard fabrication process.
The selected particle size and number were designed to induce detectable degradation and internal short circuit characteristics within the experimental period while avoiding immediate catastrophic failure during formation. The cathode–separator interface was selected as the implantation location because it allows the investigation of both particle-induced separator penetration and the electrochemical evolution of Cu particles, including dissolution, migration, and deposition. Pristine cells without Cu particles were fabricated using the same electrode materials, electrode thicknesses, N/P ratio, separator, electrolyte, layer number, and cell format, and were used as the control group.
2.2. Cyclic Aging Test
The cells were charged and discharged using a battery test system (CT3002K, LANHE, Wuhan, China). Charging was performed in a constant-current–constant-voltage (CC–CV) mode, while discharging was carried out in a constant-current (CC) mode. The cycling current was increased from 2 A to 3 A after 100 cycles to accelerate aging and make the degradation differences between pristine and Cu-contaminated cells more distinguishable within the experimental period. Since the same protocol was applied to both cell groups, the comparison remained consistent. The ambient temperature was maintained at 25 °C using a temperature-controlled chamber equipped with explosion-proof functionality (RH/GDW-225, Ronghua, Shanghai, China). To simulate the constrained condition of pouch cells in a practical battery module, a preload force of 150 N was applied to each pouch cell during cycling, corresponding to a nominal pressure of approximately 24.8 kPa over the cell area of 110 mm × 55 mm. The self-discharge rate was determined by allowing the cell to rest at 100% SOC for 72 h.
2.3. Material Characterization Techniques
In this study, a comprehensive suite of material characterization techniques was employed to elucidate the mechanisms by which copper particles influence battery performance. The following equipment was utilized: OM (MECATECH 334, Presi, Eybens, France), XRM (Xradia 520 Versa, Carl Zeiss, Oberkochen, Germany), and SEM-EDS (RISE-MAGNA, Tescan, Brno, Czech Republic). Specifically, OM was used to select metallic copper particles of specific dimensions and to examine the morphological features surrounding these particles at a magnification of 100× under reflected light. XRM was employed for non-destructive imaging of the internal microstructure of the battery, with a focus on the regions adjacent to the copper particles; the scans were performed at 160 kV and 10 W, achieving a voxel size of 3 μm. Meanwhile, SEM was utilized to investigate the microstructural characteristics of the anode and cathode surfaces at an accelerating voltage of 5 kV (imaging) and 15 kV (EDS), with a typical working distance of 8 mm, and EDS was applied to determine the elemental distribution across these surfaces.
3. Results and Discussion
3.1. Impact of Internal Metallic Contaminants on Initial Cell Performance
After the preparation of both pristine cells and Cu-contaminated cells, all cells were subjected to a slow formation process at a charging current of 0.3 A in a 25 °C constant-temperature chamber. The formation process was successfully completed for all cells, and no failure phenomena commonly reported in some studies [
13,
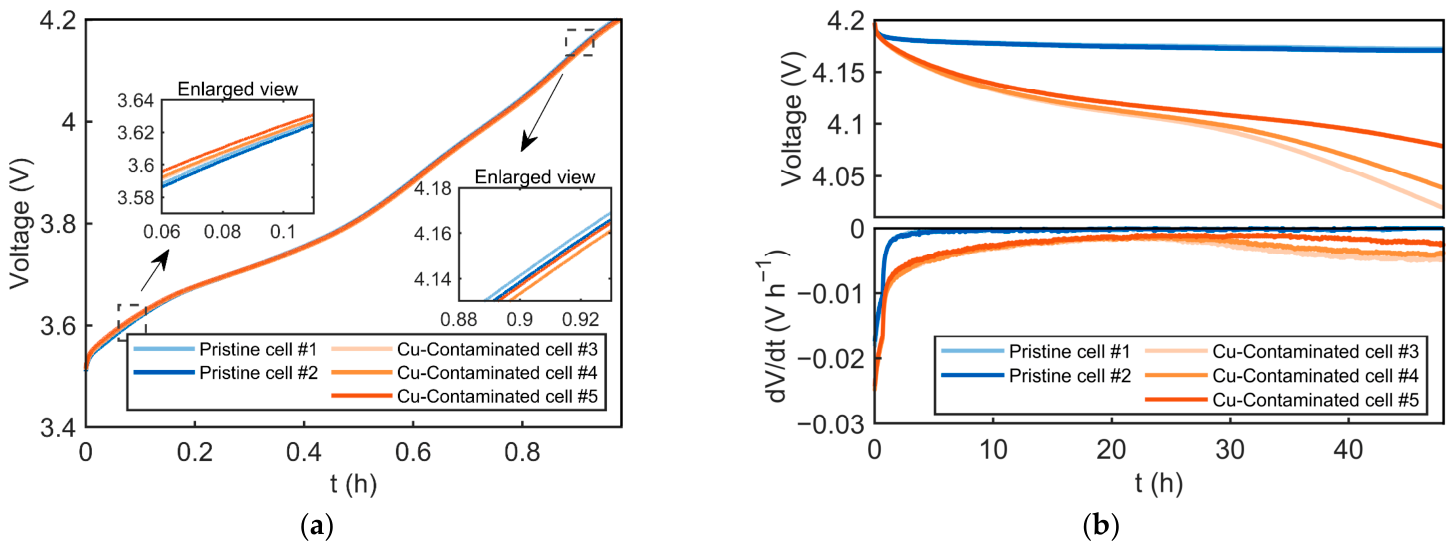
15] during formation were observed. Upon completion of the formation process, the cells underwent three charge–discharge cycles at a current of 2 A to stabilize their initial performance. The voltage profiles during the constant-current charging process are shown in
Figure 2a, with the green and blue lines representing the pristine and Cu-contaminated cells, respectively. In the early stage of charging, the voltage of the Cu-contaminated cells was higher than that of the pristine cells, while in the later stage, the voltage of the Cu-contaminated cells fell below that of the pristine cells. To better understand the voltage variation, the voltages of three pristine cells were averaged, and the differences between the averaged voltage of the pristine cells and the voltages of the Cu-contaminated cells were calculated. The results are presented as the red line in
Figure 2a. It can be observed that the voltage difference gradually decreased over time. This trend is attributed to the high self-discharge rate of the Cu-contaminated cells, whereas the initial voltage rise was due to the higher voltage change rate of the cells at that specific voltage point.
To measure self-discharge, the cells were charged to 4.2 V and then rested. The results are shown in
Figure 2b. For the pristine cells, the voltage stabilized after approximately 7 h, whereas the voltage of the Cu-contaminated cells continued to decline, indicating the presence of significant self-discharge. It is noteworthy that the self-discharge rate constant K was calculated only after the depolarization period, using the voltage drop after 7 h of rest. The calculated K values are summarized in
Table 2, showing that the self-discharge rate of the Cu-contaminated cells is significantly higher, generally more than 10 times that of the pristine cells.
In terms of capacity, both types of cells exhibited good consistency in their initial discharge capacities. However, the discharge capacity of the Cu-contaminated cells was slightly lower than that of the pristine cells, which can be attributed to their higher self-discharge rate. Furthermore, analysis of the voltage recovery at the end of discharge allowed the calculation of the direct current internal resistance (DCIR) at 0% SOC. As shown in
Table 2, the DCIR of the Cu-contaminated cells was consistently slightly higher than that of the pristine cells.
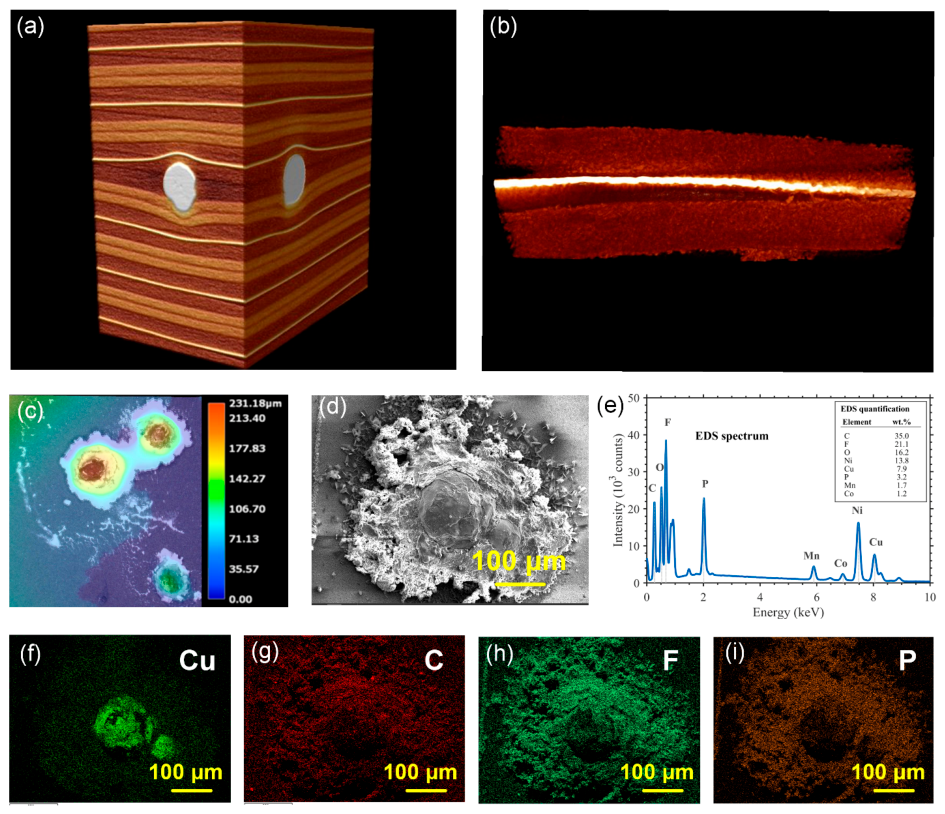
To uncover the underlying causes of the high self-discharge rate and increased polarization resistance in the cells, a series of microstructural analyses were conducted. First, XRM was used to perform a 3D scan of the regions surrounding the Cu particles, with the reconstructed image shown in
Figure 3a. The results indicate that the Cu particles penetrate the separator but do not fully puncture the cathode and anode. This structure leads to a conductive connection between the cathode and anode at the particle locations. In contrast to more severe short circuit modes, this cathode-anode micro-short circuit presents a relatively low risk of thermal runaway compared to other internal short circuit types [
27]. The propensity for an internal short circuit to initiate TR is highly contingent on the shorting configuration. The most hazardous scenario is a large-area short between the aluminum current collector and the anode, where high electrical conductivity and localized Joule heating can trigger TR [
11]. In the context of our study, which involves copper particle contamination inside the battery, the resulting internal short circuit is of the less severe “cathode-to-anode” type due to the spatial separation provided by the active material coating. Moreover, the contact area of the short is typically small, which leads to low heat generation and makes thermal runaway unlikely under these specific conditions. However, if the size of Cu particles is larger or the cell’s precompression force increased, more severe types of internal short circuit could be triggered, such as short circuit between the cathode and anode current collectors. This would significantly elevate the risk of thermal runaway and compromise cell safety [
28]. Therefore, strict control over the size and quantity of metallic particles is essential in manufacturing to mitigate potential safety risks. Further observation from
Figure 3b shows that the mechanical pressure exerted by the Cu particles on the internal cell structure causes a noticeable delamination between the graphite electrode and the current collector in the surrounding region. This delamination not only significantly increases the contact resistance but also obstructs charge transport pathways, leading to a rise in the cell’s DCIR. In addition, due to the incomplete conductivity paths, current distribution within the cell becomes uneven, with regions of higher local current density being more susceptible to overheating. This localized overheating can accelerate the degradation of the active materials and trigger further adverse reactions, which would expedite cell aging and further degrade its performance and safety.
After the formation process and three pretreatment charge–discharge cycles, the Cu-contaminated cells were disassembled in an argon-filled glove box, and the cathode-side region near the embedded Cu particles was first observed by OM, as shown in
Figure 3c. Noticeable deposits were observed around the Cu particles. To further clarify the composition of this particle-adjacent region, SEM and EDS analyses were performed, as shown in
Figure 3d–i. It should be noted that
Figure 3d–i correspond to the cathode-side region containing the intentionally embedded Cu particle, rather than the graphite electrode. Therefore, the Cu signal in the EDS mapping mainly originates from the embedded Cu particle and possible Cu-containing products formed during formation and pretreatment cycles. The corresponding EDS spectrum further confirms the presence of Cu in the selected cathode-side particle region, together with elements from the NCM811 cathode and electrolyte-derived species. This suggests that under high voltage operating conditions, Cu particles undergo redox reactions with the electrolyte, leading to partial dissolution of the Cu particles. The dissolved Cu ions then deposit on the electrode surface, forming complex deposits. The presence of these deposits not only blocks local conductive paths but also increases the cell’s impedance, further exacerbating performance degradation. Moreover, the dissolution of Cu particles and the deposition of their reaction products may trigger subsequent complex electrochemical processes, which could further compromise the cell’s cycling stability and long-term reliability.
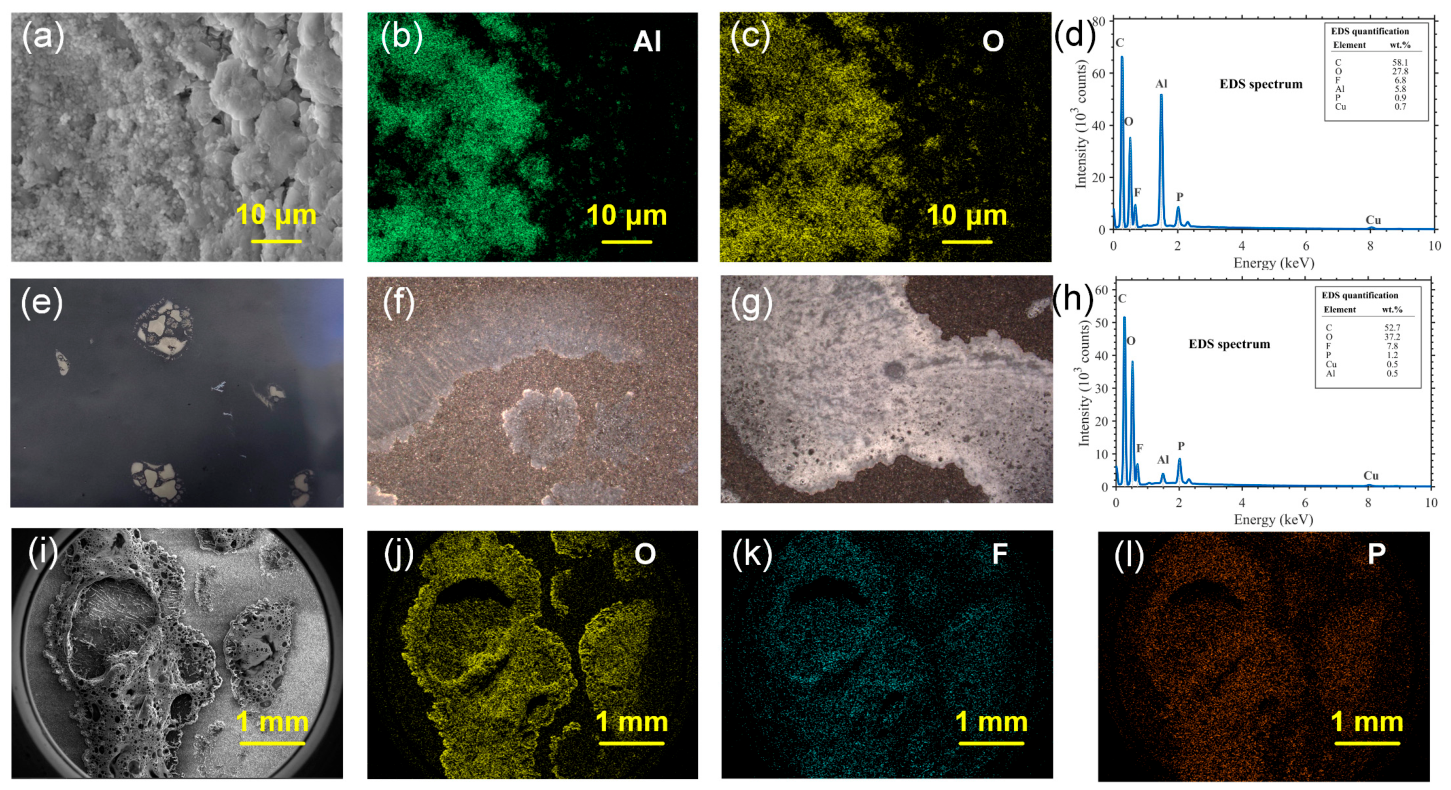
Subsequently, the negative electrode surface was examined in detail using SEM. As shown in
Figure 4a, a large number of small-sized square particles were observed within the pits on the anode surface. EDS mappings and the corresponding EDS spectrum revealed that these particles were mainly composed of Al and O elements, as shown in
Figure 4b–d. This indicates that aluminum dissolved from the positive electrode current collector and subsequently migrated to the anode, where it ultimately deposited as particles. This phenomenon is closely related to the elevated local current density at the site of the internal short circuit. The high local current density generates significant heat, which accelerates the decomposition of the electrolyte in the short circuited region, producing highly corrosive HF. The HF subsequently reacts with the aluminum current collector, enhancing its dissolution, as described by the reaction mechanism in Equation (1) [
29]. Additionally, the mechanical compression exerted by the Cu particles may damage the passivation layer of aluminum oxide on the surface of the current collector, compromising its protective function. Once the passivation layer is disrupted, the aluminum current collector is directly exposed to the electrolyte, making it more susceptible to corrosion and dissolution.
In addition, uneven deposition was clearly observed on the negative electrode surface (
Figure 4d). Further examination using OM (
Figure 4e) revealed that these deposits reacted violently when exposed to air, resulting in morphological changes as shown in
Figure 4f after a certain period. To investigate the composition of these deposits, detailed SEM, EDS mapping, and EDS spectrum analyses were conducted, as shown in
Figure 4h–l. The results indicate that these deposits were primarily composed of C, O, F, and P elements. This finding confirms that the deposits originated from side reactions of the electrolyte. These side-reaction products not only obstruct the conductive pathways on the negative electrode surface but also significantly increase the interfacial resistance of the battery, ultimately impacting its cycle life and electrochemical performance. In summary, the high local current density and thermal effects caused by internal short circuit induce complex side-reaction processes. These processes not only accelerate the dissolution of the aluminum current collector from the positive electrode but also lead to the formation of deposits on the negative electrode surface. The synergistic effects of these phenomena profoundly affect the battery’s electrochemical performance and safety. Therefore, further elucidation of these mechanisms is crucial for optimizing battery design and improving safety.
3.2. Effect of Cycling Aging on Cu-Contaminated Cells
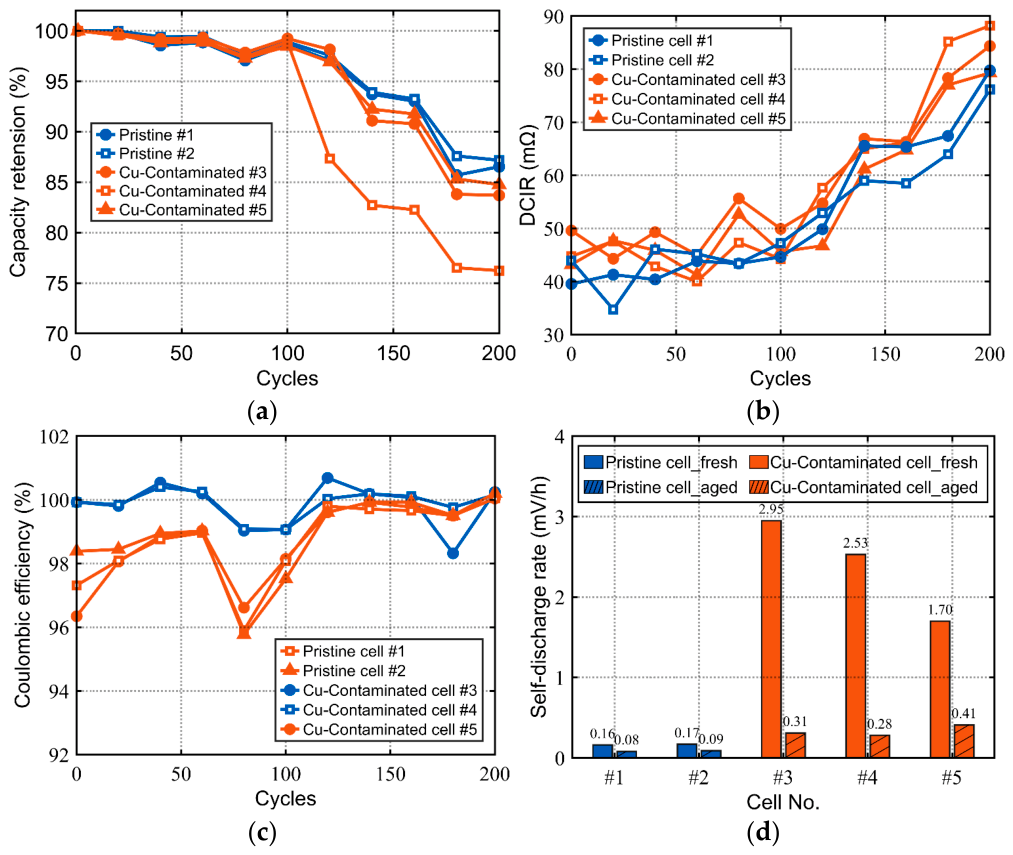
To investigate the impact of copper particles on the cycling performance of batteries, the pristine cells and Cu-contaminated cells were subjected to 200 charge–discharge cycles. The changes in capacity and direct current (DC) impedance of each cell are shown in
Figure 5a and
Figure 5b, respectively, where the blue line represents the pristine cells and the orange line represents the Cu-contaminated cells. The results indicate that the Cu-contaminated cells exhibit slightly higher capacity fade and impedance rise compared to the pristine cells, suggesting that the presence of Cu impurities accelerates cell aging. It is worth noting that only 10 copper particles were added to the same layer of the entire pouch cell in this study. In practical scenarios, where manufacturing process control may be less stringent, the number of metallic impurity particles could be significantly higher, leading to a more pronounced deterioration in the cycle life of the batteries. It should be specifically noted that the accelerated capacity decay observed in Cu-contaminated Cell #5 was primarily attributable to intrinsic manufacturing defects rather than copper contamination effects alone.
Additionally, the CE of the cells was analyzed. As shown in
Figure 5c, the CE of the Cu-contaminated cells is lower than that of the pristine cells in the early cycling stage, indicating abnormal charge loss during cycling. It should be noted that the CE difference should not be directly interpreted as a constant leakage current over the whole cycle. The internal leakage current varies with cell voltage and SOC, and assuming a constant leakage current throughout the entire charge/discharge process may overestimate the average leakage current. However, the CE of the Cu-contaminated cells gradually increases with cycling and eventually becomes close to that of the pristine cells. This trend is consistent with the self-discharge results in
Figure 5d, where the self-discharge rate of the Cu-contaminated cells decreases significantly after cycling. Therefore, the increase in CE is closely related to the weakening of the Cu-induced internal leakage current or micro-short circuit pathway.
In addition, Cu particles may promote electrolyte decomposition, SEI growth, and deposit formation, which contribute to irreversible capacity loss and increased DCIR. However, the simultaneous increase in CE and decrease in self-discharge rate indicate that the Cu-induced internal leakage pathway was gradually weakened during cycling.
The present study focused on two representative stages: the early stage after formation/pretreatment and the aged state after 200 cycles. This design was sufficient to reveal the early-stage internal short circuit induced by Cu contamination and the subsequent degradation evolution during cycling. After 200 cycles, the self-discharge rate of the Cu-contaminated cells decreased by approximately one order of magnitude and was reduced to less than twice that of the pristine cells, indicating that the Cu-induced internal short circuit path had been greatly weakened.
Nevertheless, the quantitative Cu-contamination amount as a function of cycle number was not directly measured in this study. Since post-mortem characterization is destructive, Cu-content data at 50, 100, 150, 200, 300, and 400 cycles would require additional parallel cells stopped at each target aging stage. The cells used in this work had already been cycled to 200 cycles, and the test was originally designed up to 200 cycles; therefore, earlier-stage and longer-cycle destructive data could not be obtained from the present dataset. Future work will combine parallel-cell experiments with ICP-OES and quantitative SEM/EDS to further quantify Cu-content evolution during cycling.
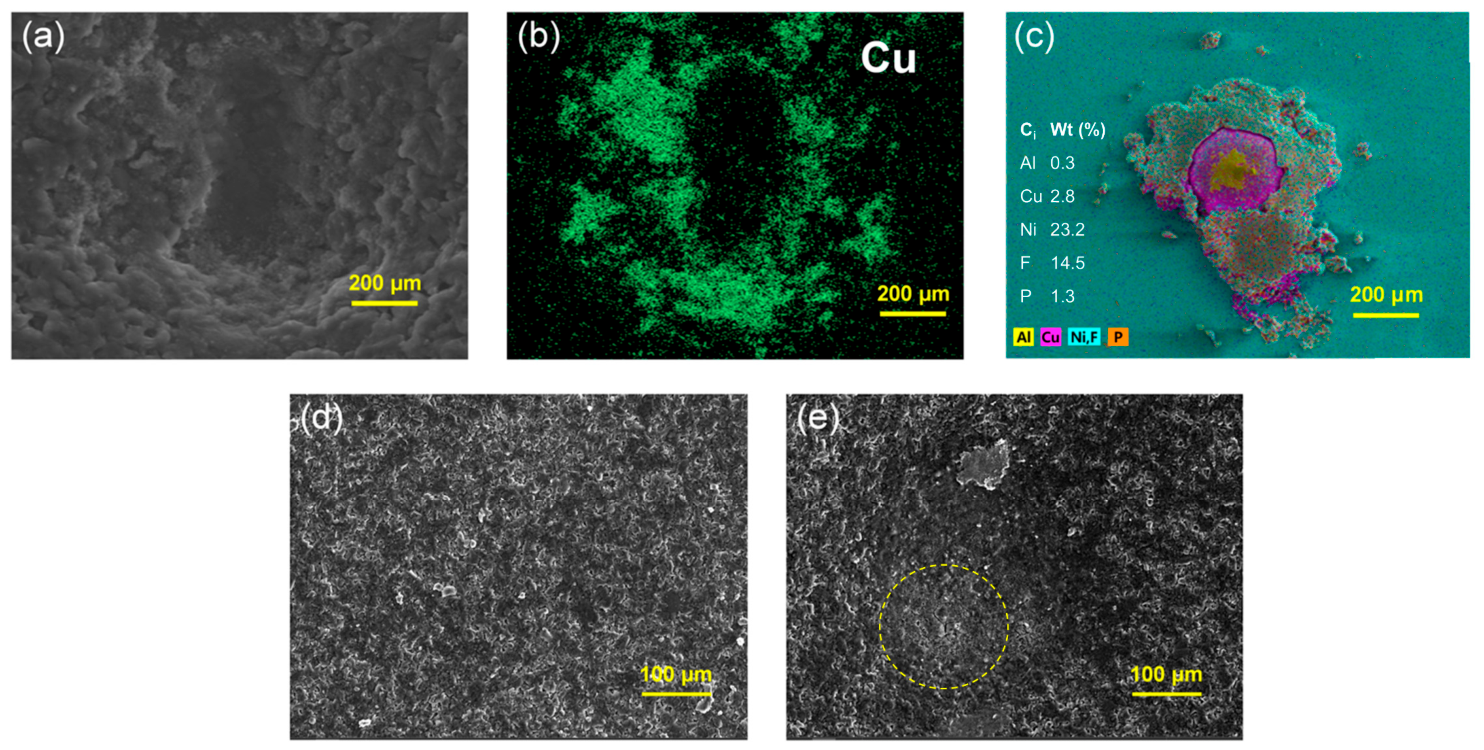
To elucidate the mechanisms behind the accelerated capacity fade, increased impedance, and the observed mitigation of internal short circuit in aged Cu-contaminated batteries, a series of microscopic characterization experiments were conducted. First, SEM and EDS observations show that copper deposits appear around the negative electrode pits, as shown in
Figure 6a,b. This indicates that copper particles have dissolved, resulting in a reduction in their size. This is also confirmed by comparing the particle size measurements of the disassembled aged battery with the initial particle size. Prolonged cycling induces partial electrochemical dissolution of the copper particles at the high-potential cathode interface (Cu → Cu
2+). This dissolution reduces the effective metallic cross-section and degrades the electrical contact at the short circuit site, thereby significantly increasing its local resistance [
16]. While some dissolved Cu
2+ ions may migrate and re-deposit at the anode, potentially forming dispersed deposits or becoming incorporated into the solid electrolyte interphase [
12], the primary cause of the observed performance mitigation is the increased resistance of the original short circuit path. According to Ohm’s law (I = V/R), this resistance increase directly reduces the internal leakage current, leading to a lower self-discharge rate. The manifestation and extent of this self-discharge mitigation behavior are likely dependent on several system-specific factors. The operating voltage window plays a crucial role, as higher cathode potentials promote copper dissolution kinetics. Additionally, electrolyte composition may influence the redeposition morphology and resistance of the resulting copper-containing phases. Cycling conditions, including temperature and current density, further modulate the transformation kinetics. While the specific self-discharge characteristics may vary across different cell chemistries and operating conditions, the fundamental principle of metallic contaminant evolution leading to changing failure modes represents an important consideration for battery reliability assessment across various systems.
Additionally, scanning electron microscopy coupled with energy-dispersive spectroscopy analysis of the cathode surface, depicted in
Figure 6c, detected the presence of aluminum on the copper particles, indicating severe corrosion of the cathode current collector. The Al deposits, which have penetrated the separator and settled on the anode surface, contribute to the observed capacity fade and impedance rise. Furthermore, SEM observations of the near-particle region in the fresh anode, shown in
Figure 6d, reveal distinct graphite particle boundaries. In contrast, the corresponding near-particle region in the aged anode, shown in
Figure 6e, exhibits blurred graphite particle boundaries and localized deposits, indicating deposit accumulation during cycling. These deposits may obstruct local ion/electron transport pathways, thereby contributing to the increase in impedance and capacity fade.
3.3. Detection Methods of Cu-Contaminated Cells
Accurate identification of Cu-contamination-induced internal short circuit is important for battery safety management. For Cu-contaminated cells, the internal short circuit usually appears as a high-resistance and weakly conductive micro-short circuit, which is difficult to detect directly using conventional voltage or temperature signals. Compared with model-based methods, non-model-based feature analysis is more suitable for practical battery management systems because of its lower dependence on model parameters. Therefore, an ICA-based method was used in this study to estimate the internal short circuit characteristics by comparing the charging capacity difference between pristine and Cu-contaminated cells within selected voltage intervals.
The basic principle is that, within the same voltage interval, the charging capacity of pristine cells is mainly used for normal electrochemical reactions, whereas part of the charge supplied to Cu-contaminated cells is additionally consumed by the leakage current through the internal short circuit pathway. Therefore, the capacity difference between the two types of cells can be used to estimate the average short circuit current and the corresponding equivalent internal short circuit resistance, as expressed in Equations (2) and (3) [
19]:
where
IISC is the internal short circuit current,
t(
U =
U1) is the time at voltage
U1,
t(
U =
U2) is the time at voltage
U2,
Iapp is the externally applied current,
n is the number of sampling points in the time interval,
Ui is the battery voltage at time
i,
RISC is the equivalent internal short circuit resistance.
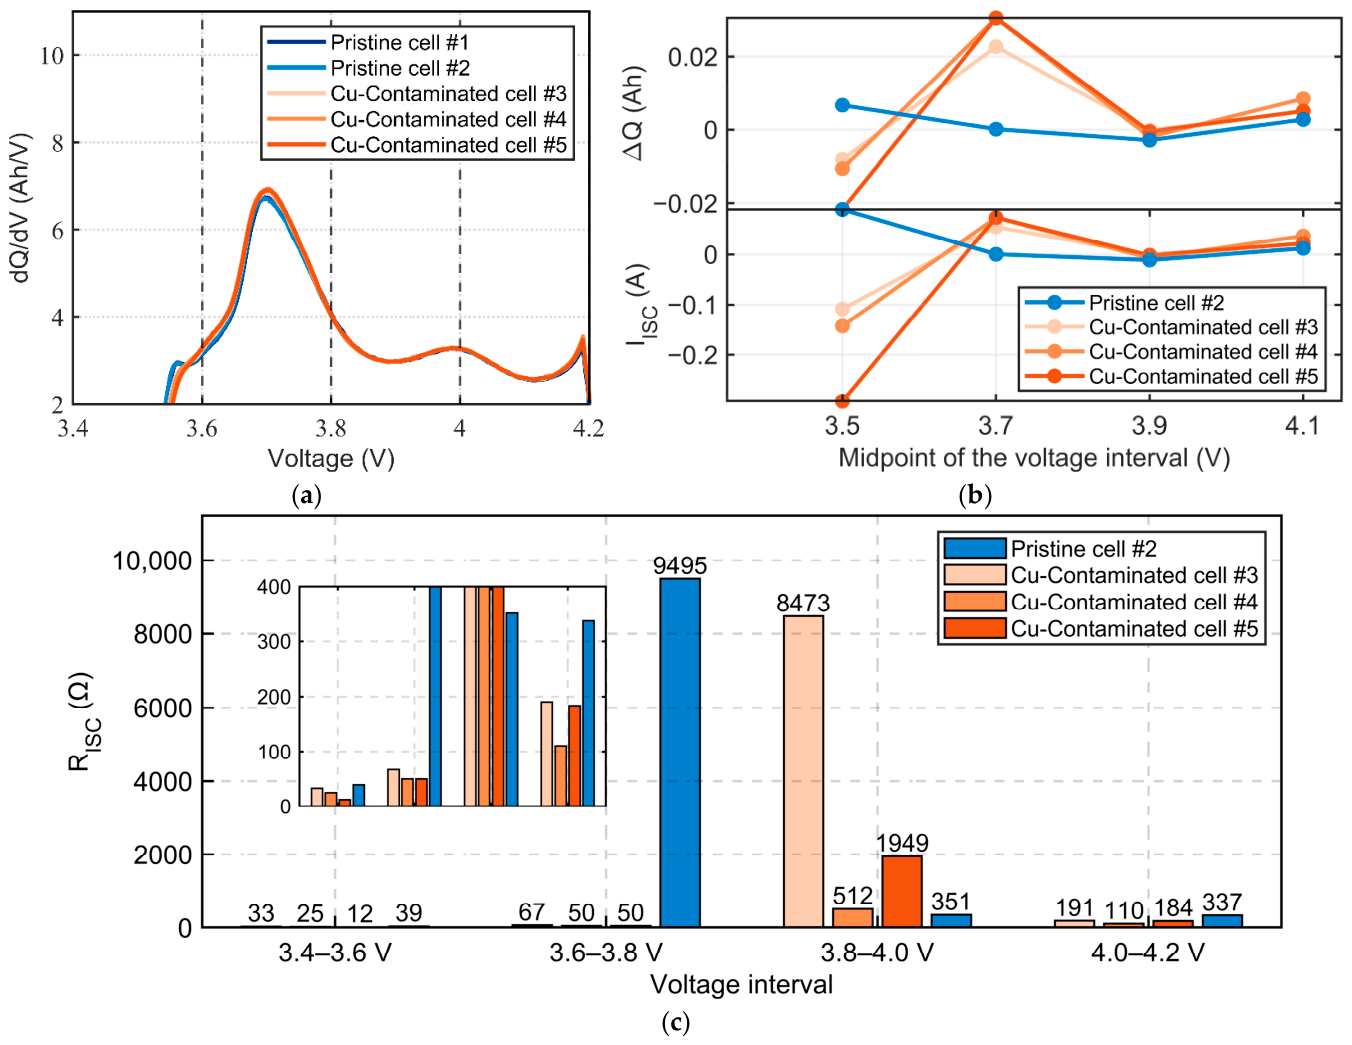
To determine a suitable detection window, the charging voltage range was divided into four intervals: below 3.6 V, 3.6–3.8 V, 3.8–4.0 V, and above 4.0 V. As shown in
Figure 7a, the ICA curves of Cu-contaminated cells show more obvious peak elevation and broadening than those of pristine cells in local voltage regions, indicating that ICA can amplify subtle electrochemical disturbances caused by micro-short circuit.
Figure 7b further shows that the capacity difference and the estimated short circuit current are the largest in the 3.6–3.8 V interval, suggesting that the leakage current effect is most pronounced in this voltage range.
The calculated equivalent internal short circuit resistance is shown in
Figure 7c. The difference in
RISC between Cu-contaminated and pristine cells is most significant in the 3.6–3.8 V interval. Cu-contaminated cells exhibit markedly lower
RISC, indicating a stronger internal current bypass pathway, whereas pristine cells maintain higher equivalent resistance. In other voltage intervals, the results of different cells partially overlap, reducing the discrimination reliability. Therefore, considering both detection sensitivity and the typical operating SOC range of practical batteries, the 3.6–3.8 V interval is recommended as the optimal voltage window for internal short circuit monitoring.
However, this method has a fundamental limitation: it assumes identical OCV characteristics between short circuited and normal cells, which implies that the cells have perfectly matched aging states. In practical battery packs, the aging degrees of individual cells are often inconsistent. Therefore, distinguishing Cu-induced internal short circuit from normal aging under different degradation states remains a critical challenge.
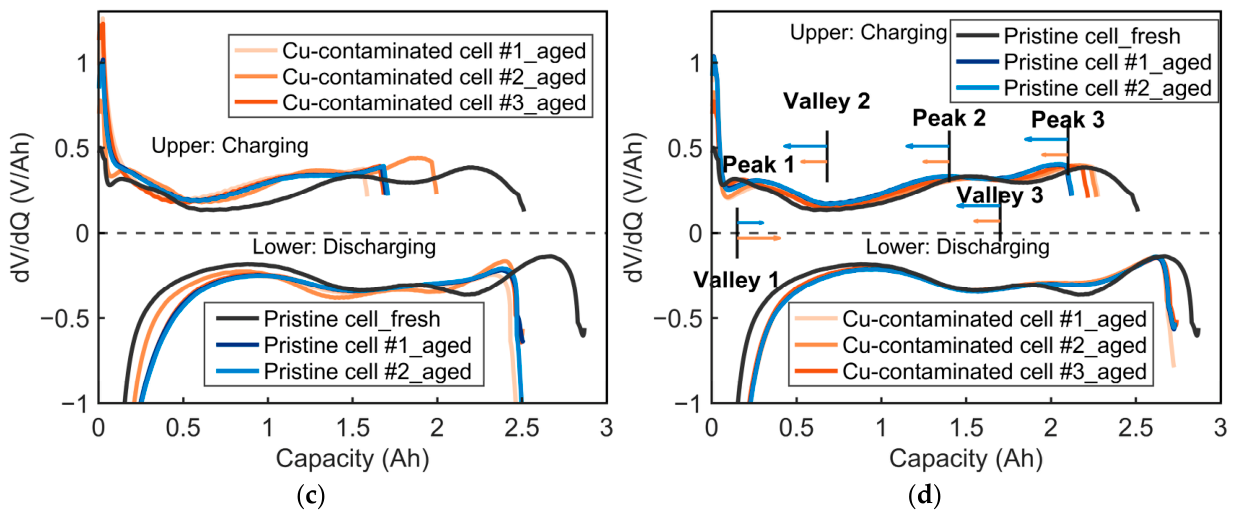
To address this issue, differential voltage analysis (DVA) was further used to distinguish normal aging behavior from Cu-contamination-induced internal short circuit. Compared with the conventional voltage–capacity curves, DVA can amplify subtle electrochemical changes and reveal the evolution of characteristic peaks and valleys associated with electrode polarization, active material loss, and lithium inventory variation. Therefore, the shifts in DVA features provide a useful basis for identifying whether the observed electrochemical deviation mainly originates from normal aging or from Cu-induced internal leakage.
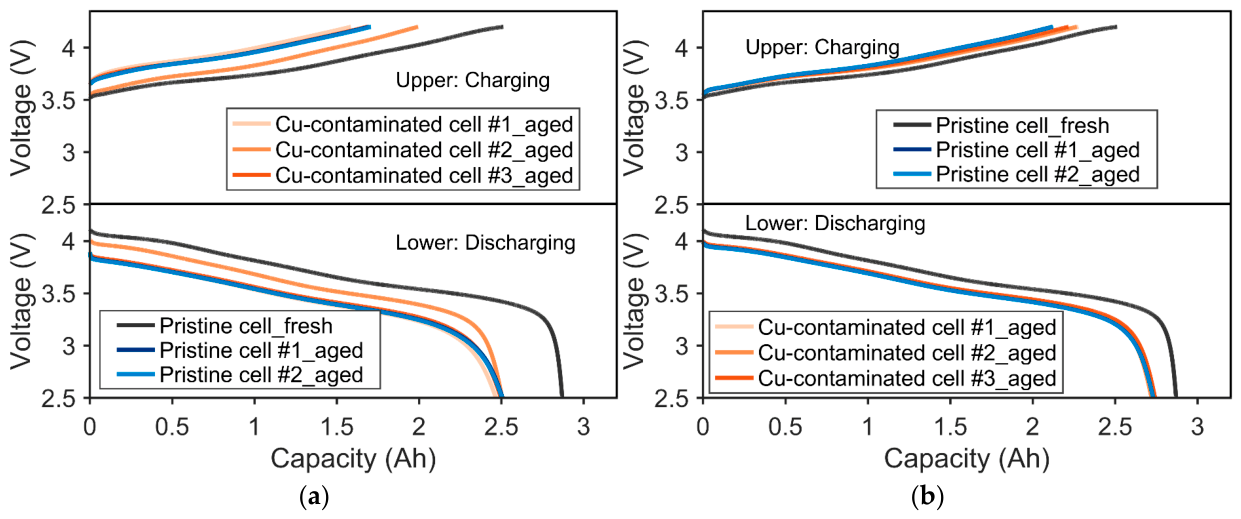
Figure 8a,b show the representative charge/discharge voltage–capacity curves used for the DVA comparison. Specifically,
Figure 8a presents the charge/discharge curves at 100% SOH and 87% SOH, corresponding to the DVA curves in
Figure 8c.
Figure 8b presents the charge/discharge curves at 100% SOH and 95% SOH, corresponding to the DVA curves in
Figure 8d. Although the voltage–capacity curves reflect the overall capacity and polarization changes, the characteristic differences between normal aging and Cu-induced internal short circuit are more clearly identified in the DVA profiles.
As shown in
Figure 8c, when the battery degrades to approximately 87% SOH, some characteristic DVA peaks become weakened or even disappear due to increased polarization and severe aging, making accurate feature tracking difficult. In contrast, at approximately 95% SOH, as shown in
Figure 8d, the characteristic peaks and valleys remain distinguishable, allowing quantitative comparison of their position shifts. The detailed changes in the DVA features are summarized in
Table 3.
The results show that Cu-contaminated cells exhibit different DVA evolution characteristics from normally aged pristine cells. In particular, the shifts in Peak 2, Peak 3, Valley 2, and Valley 3 are smaller in Cu-contaminated cells, which can be attributed to the continuous self-discharge behavior caused by the Cu-induced internal leakage pathway during charging. In contrast, Valley 1 shows a more pronounced shift. This is because the effective current in Cu-contaminated cells is influenced by the superposition of the external current and the internal short circuit current, leading to enhanced polarization and a higher termination SOC during discharge. Consequently, a more significant rightward shift in the DVA curve appears in the initial charging region. These results indicate that DVA feature shifts can provide an effective electrochemical signature for distinguishing Cu-induced internal short circuit from normal aging.
These DVA feature-shift patterns provide a potential basis for distinguishing normal aging from Cu-induced internal short circuit in practical battery packs. For BMS applications, historical aging data of a specific cell model can be used to establish a baseline DVA evolution pattern. A cell with Cu-induced internal leakage may then be identified when its peak/valley shifts deviate significantly from the expected aging trajectory. However, quantitative thresholds are expected to depend on cell chemistry, format, and aging history. Therefore, future work should establish cell-specific calibration databases to support adaptive internal short circuit detection. It should also be noted that the gradual mitigation of ISC during advanced aging may limit the applicability of this method for late-life diagnostics, whereas the method remains more promising for early-stage ISC detection.
4. Conclusions
This study investigated Cu-contamination-induced degradation and defect detection in graphite/NCM811 pouch cells. Approximately 10 Cu particles with a diameter of 300 ± 10 μm were introduced at the cathode–separator interface. The initial capacities of pristine and Cu-contaminated cells were similar, 2.856–2.880 Ah and 2.865–2.867 Ah, respectively. However, the self-discharge rate increased from 0.16 to 0.17 mV h−1 to 1.70–2.95 mV h−1, and the DCIR increased from 40.44 to 41.04 mΩ to 47.27–48.65 mΩ, indicating Cu-induced internal micro-short circuit and increased polarization.
After 200 cycles, Cu-contaminated cells showed lower capacity retention and higher DCIR than pristine cells, confirming accelerated degradation. The CE of Cu-contaminated cells was initially lower, approximately 97.5% compared with 99.5% for pristine cells, but gradually increased during cycling. Meanwhile, their self-discharge rate decreased by approximately one order of magnitude and was reduced to less than twice that of pristine cells, indicating that the Cu-induced leakage pathway gradually weakened rather than continuously deteriorated.
Post-mortem XRM, SEM, and EDS results reveal local separator penetration, electrode deformation, Cu dissolution/migration/deposition, Al current collector dissolution, and electrolyte-derived deposit accumulation. For defect detection, ICA showed that the 3.6–3.8 V interval provided the clearest distinction between pristine and Cu-contaminated cells, while DVA feature shifts further helped distinguish Cu-induced internal short circuit, from normal aging. These results provide quantitative evidence and electrochemical signatures for identifying metallic-contamination-induced defects.
Although thermal runaway did not occur in this study, the penetration of larger copper particles or increased pre-compression forces could potentially breach the electrode sheets, triggering more severe internal short circuit types, such as a short between the cathode and anode current collectors. This would significantly elevate the risk of thermal runaway and compromise battery safety. Future research will systematically investigate the interplay between metallic particle properties (e.g., type, size distribution, shape) and operational conditions (e.g., state of charge) to quantify their combined influence on failure progression. The insights gained are crucial for developing robust safety protocols and dynamic early-warning algorithms.




 ,
,