Article

Distributed De-Icing Approach for Overhead Ground Wires Based on AC Power Supply with Thermodynamic Validation


by
Yongliang Yi
,
Xiaofu Xiong
,
Changli Yu
,
Junyu Zhu
and
Jingang Wang
*
School of Electrical Engineering, Chongqing University, Chongqing 400044, China
*
Author to whom correspondence should be addressed.
Energies 2026, 19(10), 2474; https://doi.org/10.3390/en19102474
Submission received: 9 April 2026 / Revised: 11 May 2026 / Accepted: 18 May 2026 / Published: 21 May 2026

Abstract

The accumulation of ice on power lines severely affects the safety of power systems. Conventional ice melting methods suffer from poor flexibility and adaptability, accompanied by high power consumption. As a novel technical approach, distributed ice melting deploys modular and movable ice melting units at key sections of overhead ground wires, which generate heat on site according to the actual icing conditions of icing segments, and imposes high requirements on the miniaturization of ice melting equipment as well as the regulation strategy of ice melting current. This study proposes a distributed ice melting method for overhead ground wires based on AC power supply, which can adjust the current in accordance with the specific demands of wire protection and ice melting for different line sections. The feasibility and effectiveness of the proposed method are verified through thermodynamic simulations and experimental tests. The de-icing method injects power–frequency AC into the overhead ground wire through a Scott transformer combined with a series capacitor reactive power compensation structure, enabling on-demand regulation by adjusting capacitor switching strategies and transformer operating modes. This approach balances efficiency and flexibility. Based on a reactive power compensation capacity current control strategy and thermodynamic analysis, an electro-thermal-fluid field coupling simulation model for the experimental ground wire was developed. The current regulation strategies for different environmental and operating conditions were calculated and validated. The simulation results show that, under different conditions, the adjustable current effective values of the de-icing system in this model range from 101 to 380 A (line maintenance current), 304 to 622 A (critical de-icing current), and 661 to 1121 A (maximum de-icing current). Field tests demonstrate that this method can stably achieve AC de-icing and current control. For the experimental JLB40-150 model ground wire, adjusting the injected current to 350 A enables safe operation under line maintenance conditions, with a limit not exceeding 400 A. This paper provides a more efficient, flexible, controllable, and widely applicable method for the de-icing of overhead ground wires.

1. Introduction

Frequent faults caused by icing on transmission lines pose a serious threat to the safety of power systems [1,2,3]. Although conventional de-icing methods are widely applied, they require energizing the entire ground wire. In addition, due to differences in ground wire types, repeated adjustments are often necessary, resulting in high power consumption and low efficiency. In practice, severe icing usually occurs only in certain sections of line, and insulated ground wires can be sectionally grounded using disconnectors. Therefore, distributed ground wire de-icing method that adjusts injected current by section according to the icing condition shows promising application prospects [4,5,6,7].
Compared with conventional methods, distributed de-icing requires lower power, but demands flexible and portable equipment. Conventional DC de-icing devices provide uniform heating and easy current regulation [8,9], but their high cost, large size, and poor portability limit their suitability for distributed de-icing applications [10,11,12,13]. In contrast, AC-based de-icing devices are less expensive and can significantly simplify the equipment structure [14,15,16]. Unlike DC methods that require large-capacity converters, AC de-icing can directly utilize power–frequency AC supplied by the grid [16,17]. By reducing the device size and transportation cost, AC de-icing offers clear advantages in meeting the distributed de-icing needs of overhead ground wires in icing-prone areas [15,16,17,18].
For the optimization and application of AC de-icing technology, research [19] proposed an LC oscillating square-wave voltage method up to 5 kHz, along with a control strategy that significantly increases de-icing power, but did not adequately address the lower-power preventive operation for line maintenance. Research [20] developed a multi-parameter line de-icing model, including vibration and wind speed effects, which enables the more accurate evaluation of de-icing performance. Research [21] proposed a high-frequency AC de-icing technology to shorten de-icing duration, extending its applicability under more operating conditions. Although existing research has achieved notable results in improving de-icing speed, the optimization of device size and flexibility for distributed applications remains insufficient.
In summary, this study addresses the sectional icing characteristics of overhead ground wires and the demand for compact, distributed, and portable de-icing devices. The distributed de-icing method for overhead ground wires based on AC power supply (DDI-AC) is proposed, together with the theoretical analysis and validation of current regulation and thermodynamics. The device employs a small transformer to inject a power–frequency AC de-icing current into the ground wire and uses reactive power compensation to regulate the active current. By coordinating transformer operating modes with the switching of series compensation capacitors, reliable regulation can be achieved to meet the requirements of both line maintenance and de-icing operations. An electro-thermal-fluid coupling simulation model is developed to calculate and verify current regulation strategies for a selected type of ground wire under various operating conditions. Field experiments confirm the practical functionality of the device and further validate the feasibility of the proposed method, as well as the accuracy of the current regulation strategy, thermodynamic analysis, and simulation results. This study provides a flexible, portable, and widely applicable distributed approach for ground wire de-icing.

2. Principle of Distributed De-Icing Method for Overhead Ground Wires Based on AC Power Supply

2.1. Theory of De-Icing Current Regulation in DDI-AC

In view of the fact that meteorological conditions differ across sections of 500 kV transmission lines, conventional integrated ice melting for the entire line results in excessive energy consumption and unsatisfactory de-icing performance in heavy icing sections. This study proposes the distributed de-icing method based on AC power supply. The DDI-AC method first injects a power–frequency AC de-icing current into a section of overhead ground wire through a Scott transformer, utilizing the Joule heating to achieve de-icing. And it regulates the current through adjusting capacitor switching strategies together with different transformer operating modes, which is flexible and suitable for sectional de-icing.
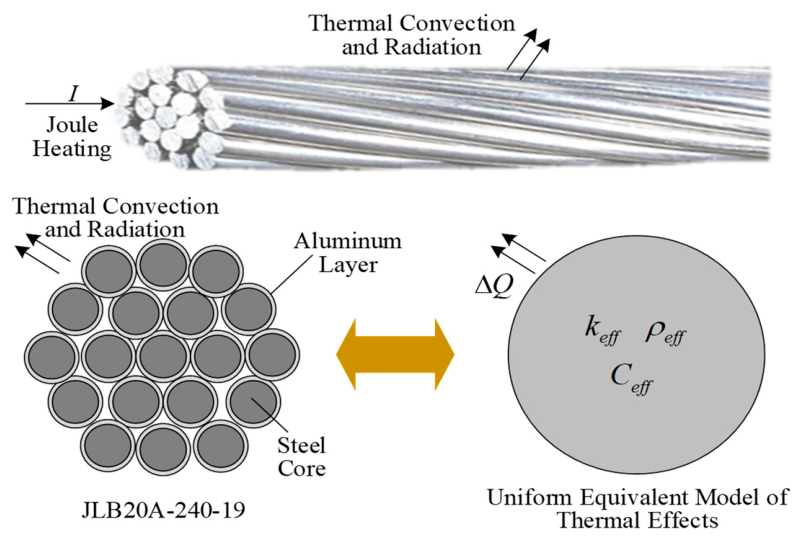
According to the requirements of ice-melting targets, a theoretical model of the thermal effects associated with the adjustable injection of a DDI-AC de-icing current into the strand is established, as shown in Figure 1.
The thermal conductivity and resistivity of aluminum and steel are different. The study of Joule heating effects is based on the equivalent resistivity and thermal conductivity related to the cross-sectional thermal effects, as shown in Equation (1).
k eff = k Al A Al + k steel A steel A Al + A steel ρ eff = ρ Al A Al + ρ steel A steel A Al + A steel C eff = C Al m Al + C steel m steel m Al + m steel
In this equation, keff represents the equivalent thermal conductivity, ρ eff denotes the equivalent resistivity, and Ceff is the equivalent specific heat capacity. Here, Asteel and AAl represent the cross-sectional areas of the steel core and aluminum layer, respectively, while m and k represent their respective mass and thermal conductivity. Thus, during the Joule heat analysis, the aluminum-clad steel strand can be treated as a thermally equivalent homogeneous material conductor. The internal distribution of temperature gradient is realized in the form of heat conduction, as shown in Equation (2).
ρ eff C eff T k t · ( k eff T k ) = Δ Q
where Tk denotes the component temperature (in Kelvin) and finds a partial derivative of t, with T representing the temperature gradient along the same direction, and Δ Q is the heat transferred through the wire, satisfying the thermal balance equation indicated in Equation (3).
Δ Q = Q total Q ab = I rms 2 ρ res l t L m tota C eff T d x L
Here, Irms is the effective value of the power–frequency AC current, ρ r e s is the wire resistivity, l is the wire length, L is the length in the gradient direction, with Qtotal and mtotal representing the total heat and mass of the wire, and Qab is the heat absorbed by the wire. The boundary condition is set such that the outermost layer of the wire reaches the critical freezing condensation temperature T0 = 0 °C (273.15 K). At this point, the heat transferred under conditions of forced convection is not considered, satisfying the thermal equilibrium equation in Equation (4).
ρ eff C eff T t · ( k eff T ) = S h T 0 T c d S + S ϵ σ ( T 0 4 T c 4 ) d S
where h is the convection heat transfer coefficient characterizing thermal convection transfer; ε and σ are the surface emissivity and Stefan–Boltzmann constant, respectively, representing thermal radiation transfer; S is the contact area of the wire with air; and Tc is the external environmental temperature. This results in the relationship between the electric current and component temperature rising.
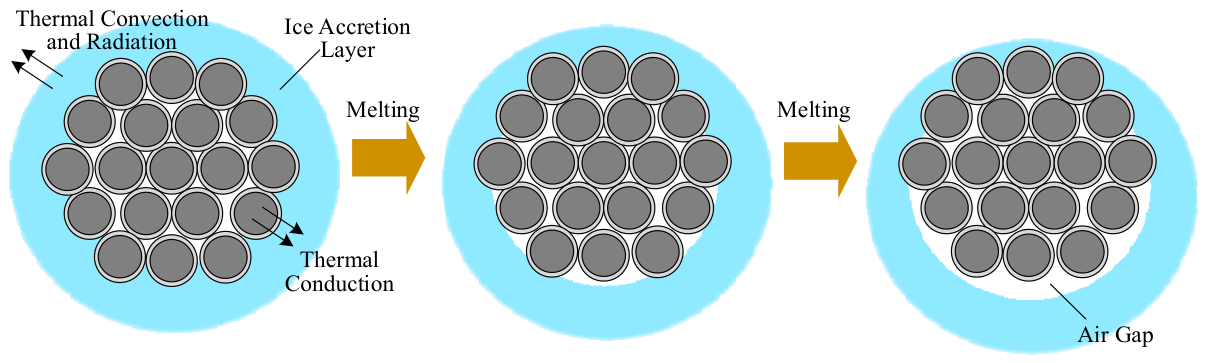
The Joule heat generated by the de-icing current serves partly to heat the inner surface of the wire and the ice layer, while the remaining portion is transmitted through heat conduction to the outer surface of ice layer, dissipating into the surrounding air through thermal convection and radiation. The model of the de-icing process of an overhead ground wire is illustrated in Figure 2.
At this point, the boundary condition assumes that the inner surface of ice layer functions as a phase-change interface to determine the latent heat of melting. During the theoretical analysis, it is firstly assumed that the latent heat required to melt the ice layer is sufficiently high, meaning that the ice layer does not melt quickly enough during the temperature rise process of the wire, resulting in not significant geometric changes. The wire is treated as a homogeneous equivalent medium cross-section. This system has two heat exchange processes: between the wire and the inner layer of ice, and between the outer layer of the ice and the external environment. First, the temperature gradient distribution between the wire and ice layer satisfies Equation (5).
ρ a C a T a t · ( k a T a ) = Δ Q a ρ b C b T b t · ( k b T b ) = Δ Q b
where subscripts a and b represent the wire and ice layer, respectively, and Δ Q a and Δ Q b denote the heat transferred between the wire and ice layer. Furthermore, Δ Q a indicated in Equation (3) still hold, and changes in the effective value of current Irms affect the total heat transfer across the system compartments, consequently influencing the temperature of each section. For Δ Q b , this fulfills Equation (6):
Δ Q b = Δ Q 1 L b m b C b T b d x L b
As the thickness of the ice layer increases, the path of the temperature gradient becomes longer and the temperature rises more slowly, necessitating the absorption of more heat. This results in less heat available to raise the temperature of the wire, thus requiring a larger current to achieve the target temperature. The heat exchanged Δ Q 1 between the wire and ice layer satisfies the boundary condition shown in Equation (7).
Δ Q 1 = k con S 1 ( T a 2 T b 1 ) d k con = k eff k b k eff + k b · S 1 d con
where kcon is the contact equivalent thermal conductivity, and dcon is related to the contact thickness and surface roughness. S1 represents the contact area of the outer surface of wire with the inner surface of ice layer, while Ta2 and Tb1 represent the temperatures of the two surfaces, not exceeding the melting critical temperature of 0 °C (273.15 K), and Tc is the environment temperature. Ultimately, the system’s heat balance equation satisfies Equation (8).
Δ Q b = S 2 h 2 T b 2 T c d S + S 2 ϵ b σ ( T b 2 4 T c 4 ) d S
where h2 is the convection heat transfer coefficient when the ice layer contacts the air, Tb2 denotes the outer surface temperature of the ice layer, and S2 is the contact area between the ice layer and air. The model ignores the volume changes of the ice layer, assuming that, during this process, the ice layer has not sufficiently absorbed heat to begin melting and deforming. Wind speed influences the rate of heat convection, described through the Nusselt number as shown in Equation (9):
N u = h D k = H · R e m · P r n R e = ρ c v D μ
where Nu represents the Nusselt number, indicating the ratio of convective to conductive heat transfer; D is the diameter of the cylinder; ρc is the fluid density of air; v is the fluid velocity (i.e., wind speed); μ is the dynamic viscosity of the fluid; Pr is the Prandtl number of the fluid; H, m, and n are empirical constants; and Re is the Reynolds number. The positive correlation between wind speed v and the convection heat transfer coefficient h can be seen. If considering the heat absorption and melting process of the ice layer, the portion of the ice layer that melts absorbs heat Δ Q m , satisfying Equation (10).
Δ Q m = ρ b L F Δ V
where LF is the latent heat, representing the heat absorbed during the melting of each unit mass of ice, and Δ V is the melting volume. Considering the melting of the ice layer, Equation (8) is revised to Equation (11).
Δ Q b = S 2 h 2 T b 2 T c d S + S 2 ϵ σ ( T b 2 4 T c 4 ) d S + ρ b L F Δ V
As the ice layer melts, an air gap will be created underneath its lower surface, ceasing contact with the wire. Due to the high thermal conductivity of ice layer, heat transfer occurs much faster than air convection and thermal radiation, leading to the conclusion that, once ice layer has melted, there needs an increased temperature rise to maintain the balance between heat production and dissipation.
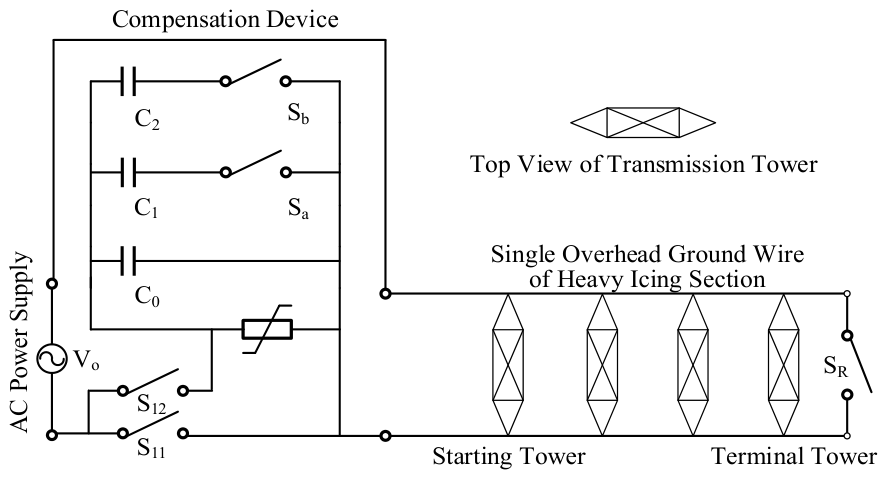
This method adjusts the line reactance through the switching of reactive power compensation capacitors, causing changes in the reactive power and effective value of de-icing current, thus impacting the temperature rise of the ground wire. The reactive power compensation capacitors, together with the switching devices, form a multi-level compensation device for the regulation of active de-icing current. The capacity of the compensation capacitors is calculated based on the temperature rise model of the ground wire, and the wiring diagram for reactive power compensation applied to the ice-melting of heavy icing sections between multiple transmission towers is shown in Figure 3.
Adopting two large-capacity capacitor models with a rated voltage of 1050 V, namely, 30 kvar and 50 kvar, three sets of reactive power compensation capacitors are configured with capacitances of C0 = 462.1 μF, C1 = 173.3 μF, and C2 = 288.8 μF. Different lengths of ice-melting sections correspond to different compensation gears. When the same ice-melting current is required for injection, a longer ice-melting section possesses a larger inductive reactance, thereby requiring a greater capacitive reactance for compensation. By increasing the number of compensation capacitor groups, the number of compensation gears and the control accuracy can be further improved. When switch S12 is closed and switch S11 is opened, the compensation device is integrated into the de-icing circuit; otherwise, it is disconnected. Using the JLB40-150 ground wire as an example, the compensation effects under different example capacitance values and series/parallel conditions are illustrated in Table 1.
Although parallel compensation can improve the power factor, it cannot increase the current and active power of the downstream load resistance (i.e., the ground wire) without changing the output voltage. Therefore, this design employs series-connected reactive power compensation capacitors. The combination of switches Sa and Sb is used to achieve multi-level adjustment of total compensation capacitance of the reactive power compensation device, with the relationship between the switch states and the total compensation capacitance shown in Table 2.

2.2. System Topology and Wiring Design of the DDI-AC

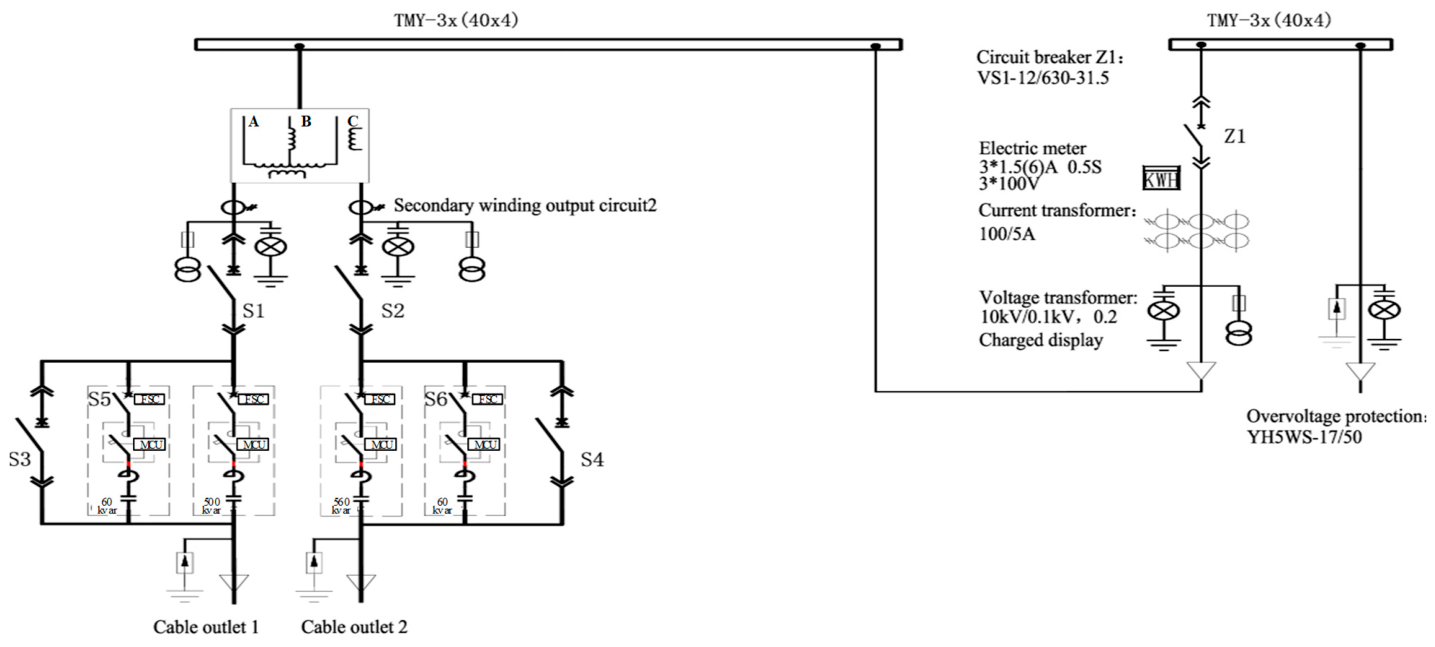
The distributed wiring design of the DDI-AC for overhead ground wires and the schematic diagram of the ice-melting system are shown in Figure 4.
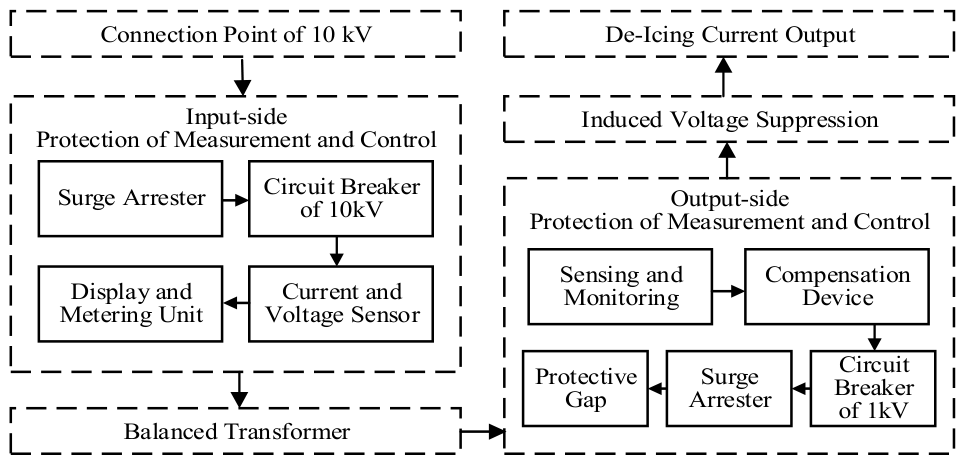
The incoming line cabinet includes an arrester, 10 kV incoming circuit breaker, live display device, energy meter, CT, and PT. The outgoing cabinet additionally includes a 1 kV outgoing circuit breaker, compensation device, and protective gap. The overall device is compact in size and can be transported flexibly. The system topology of the de-icing device is illustrated in Figure 5.
The device injects a power–frequency AC de-icing current into the overhead ground wire through the Scott transformer, while a series capacitor reactive power compensation unit regulates the output power and conductor temperature rise. By adjusting the transformer’s outgoing connections, the de-icing circuit can operate in three working modes:
  • Mode 1 (Normal De-Icing Mode): The two-phase outputs of the transformer are connected to two circuits separately, enabling the simultaneous de-icing of two loops.
  • Mode 2 (Line-Maintenance Mode): The two-phase outputs of the transformer are connected in series, with the two de-icing circuits also connected in series.
  • Mode 3 (Single-Loop Mode): The two-phase outputs of the transformer are connected in series to de-ice a single loop.
In Mode 1, the two-phase output voltage of the transformer is at the rated value, and, when the impedances of the two loops are close, a low level of three-phase imbalance can be ensured. In Mode 2, because the two-phase outputs of the Scott transformer have a 90° phase difference, the voltage output is 2 times the rated voltage, and the impedance equals the sum of the two line impedances (approximately twice if the impedances are similar). In this mode, the current output under the same rated voltage is lower, making it suitable for line-maintenance operation to prevent icing at low ambient temperatures. In Mode 3, the voltage output is 2 times the rated voltage, which can be used for single-loop de-icing. This mode provides a larger output current, thereby extending the applicability of the device.
In summary, the de-icing device supports two operating modes (normal de-icing and line-maintenance) for double-loop lines, and a single-loop mode for single-loop lines. Thus, the DDI-AC enables on-demand regulation by adjusting capacitor switching strategies together with three transformer operating modes. Additionally, the two-phase rated output voltage of the transformer is 1350 V (with ±2 × 20% tap adjustment), and the design capacity of the transformer is 1200 kVA.

3. Thermodynamic Analysis and Simulation of DDI-AC De-Icing Performance

Based on theoretical analysis, a distributed parameter thermal equivalent model for overhead ground wires is established using the finite element simulation software COMSOL 6.2. This model is used to calculate and verify the thermal effects of the wire and current control strategies when line maintenance or de-icing currents I are injected through DDI-AC. The key material parameters and the thermal equivalent model parameters for the JLB40-150 stranded wire are shown in Table 3.
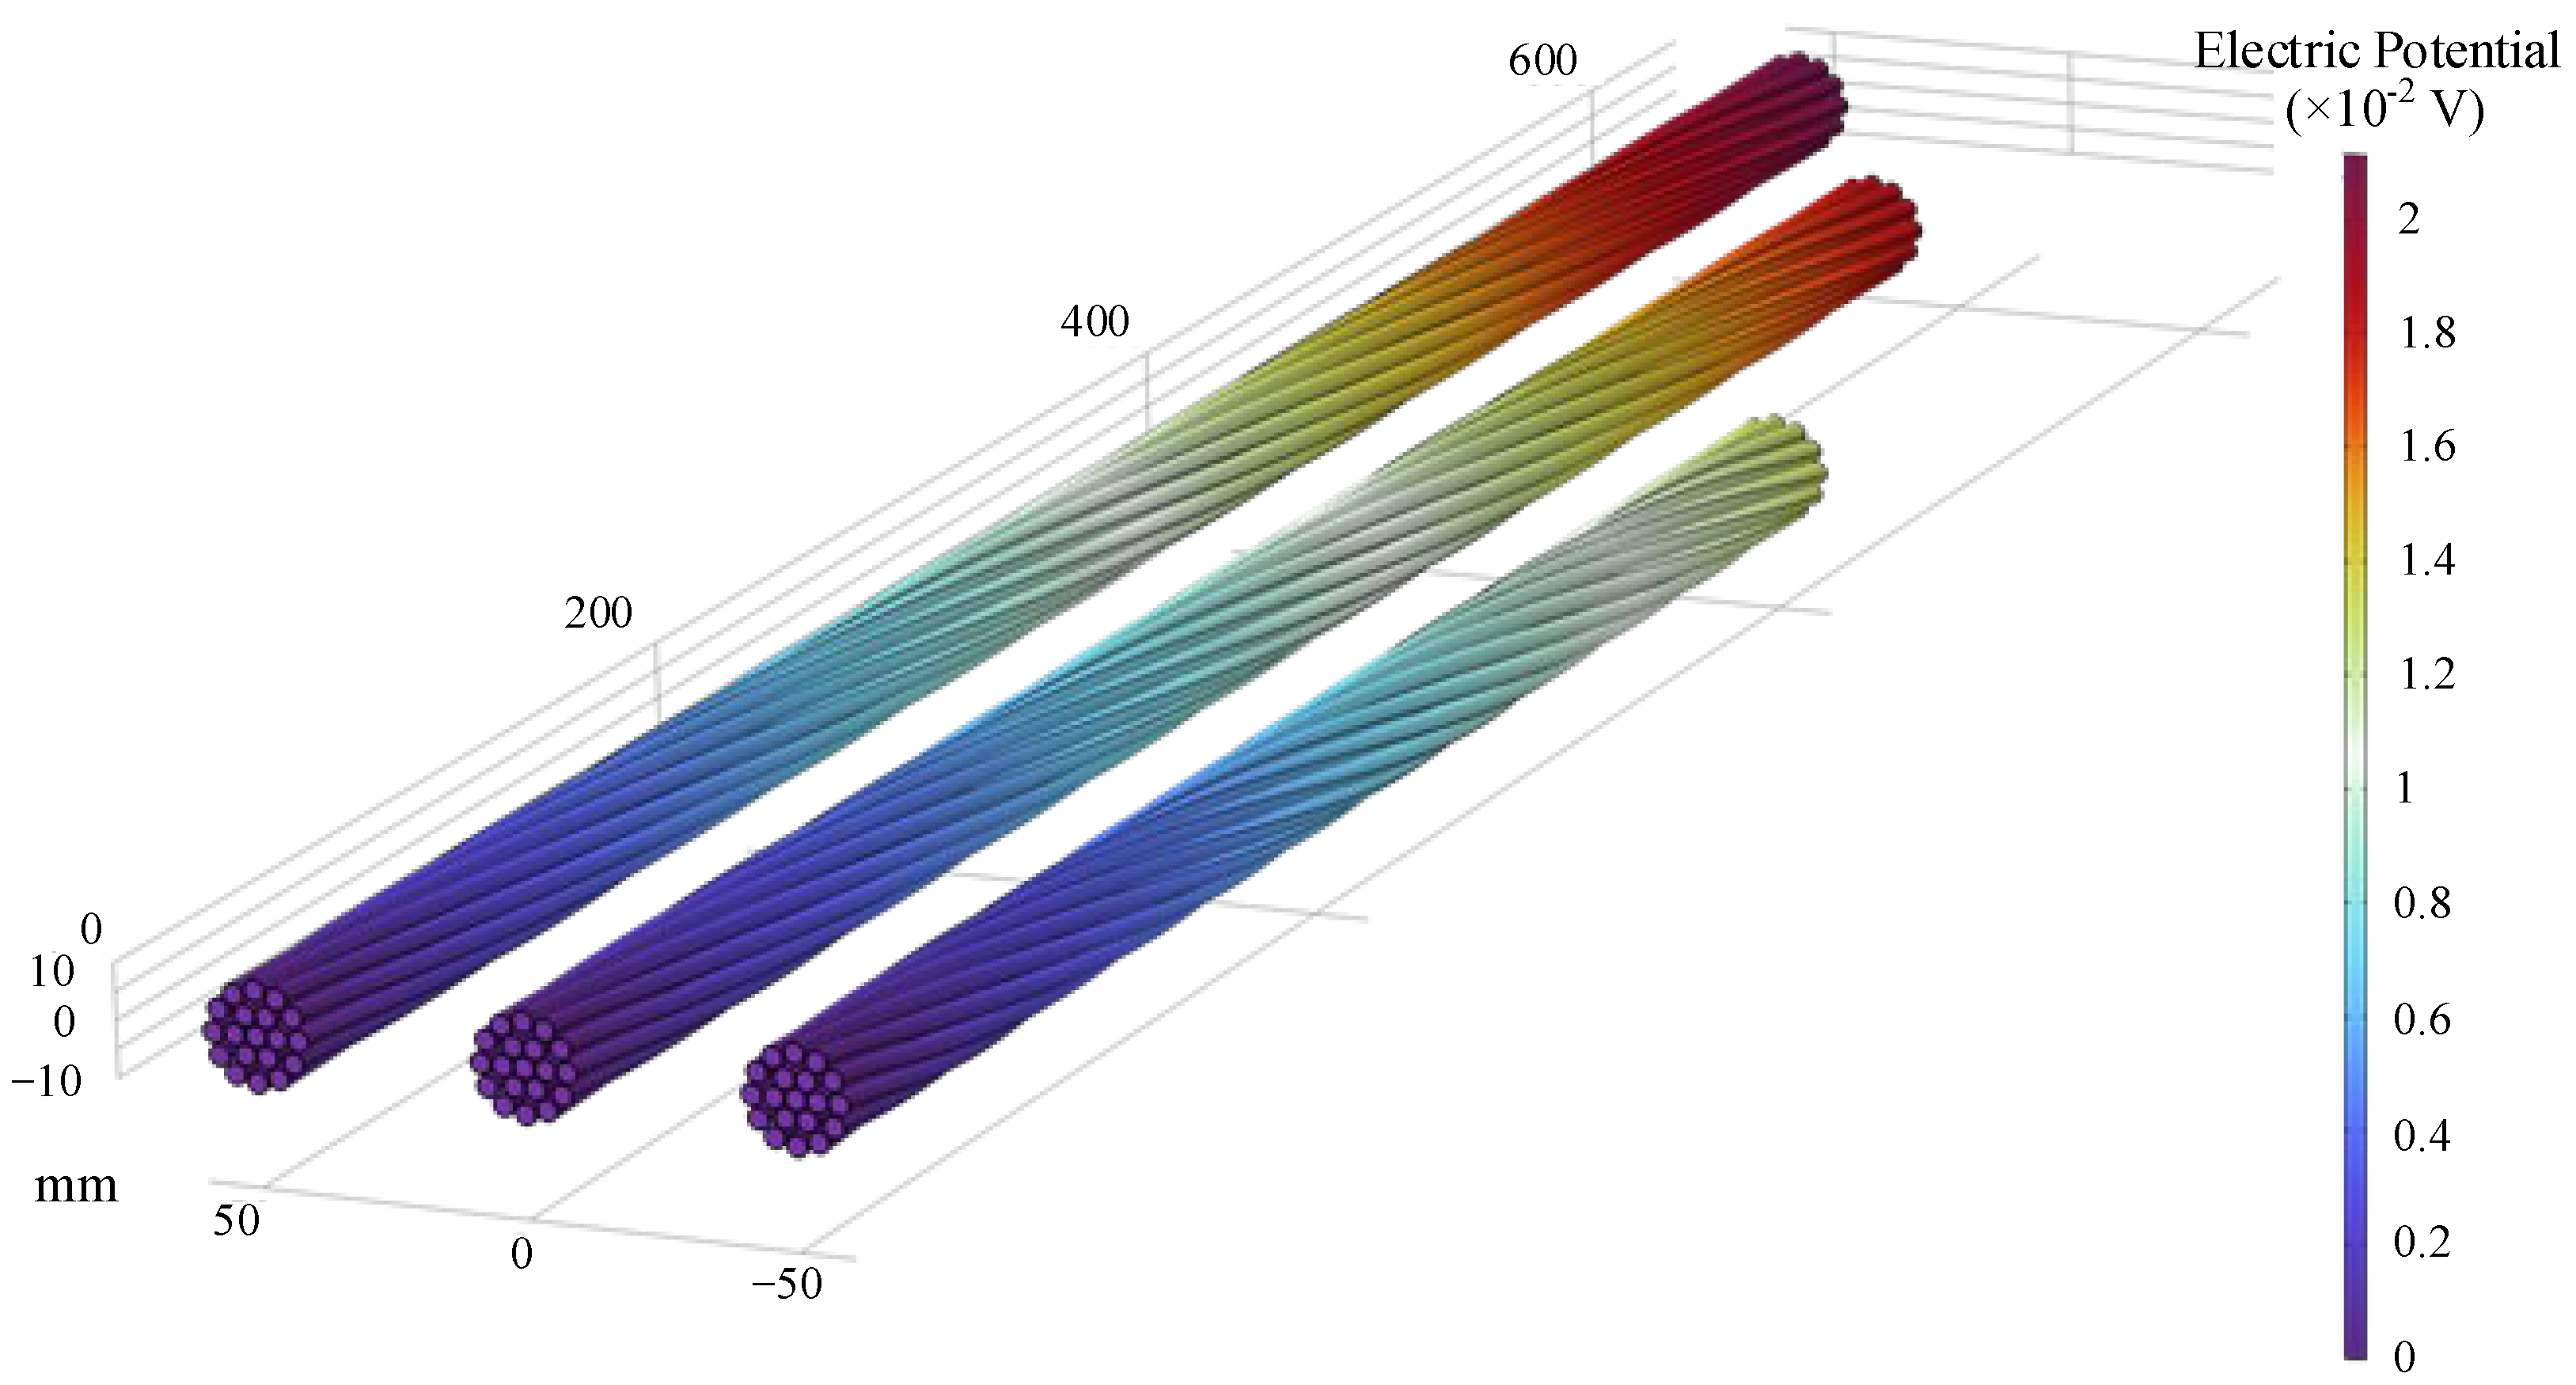
Considering the impact of spatial distribution on the thermal equivalent model, the DC resistance of the strand with different lay lengths is first simulated and calculated, comparing it with the thermal equivalent model. The results are shown in Figure 6 and Table 4.
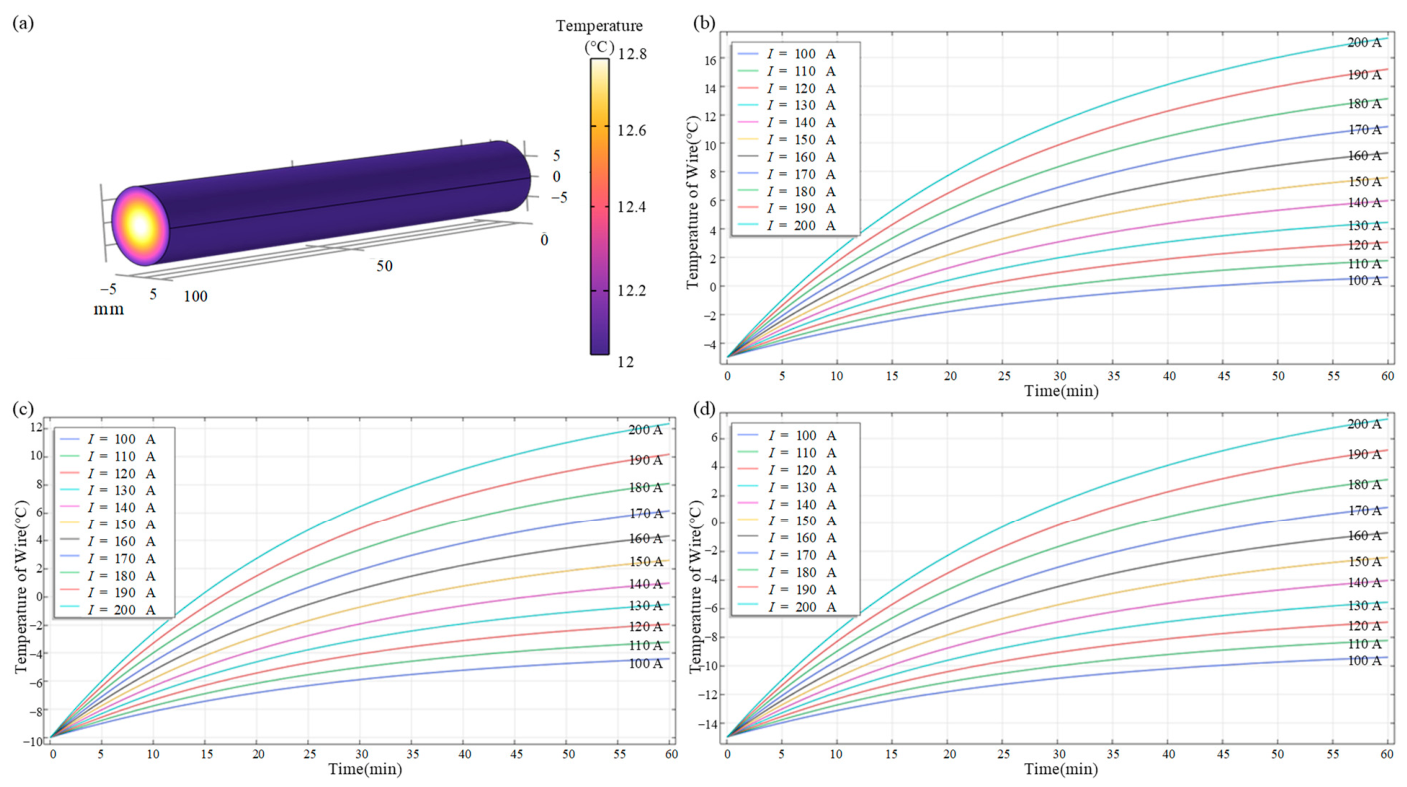
Considering the influence of the lay length on the equivalent model resistance is minimal, the impact of the lay length can be neglected. Subsequently, a thermal equivalent electro-thermal coupling model for aluminum-clad steel wire under natural convection cooling without an ice cover is established to analyze the Joule heating temperature rise due to the line maintenance current. The wire is modeled as a uniformly cross-section equivalent model based on theoretical analysis, with the initial simulation conditions set to wind speed V0 = 0 m/s and ambient temperature T = −10 °C. The temperature gradient distribution and temperature rise results caused by injected current I through DDI-AC are illustrated in Figure 7.
The wire exhibits good thermal conductivity; therefore, the temperature gradient distribution is uniform with minor variations. Due to the initially low temperature of the wire, the speed of heat transferring and dissipation is slow, causing a continuous increase in wire temperature. After a certain period, the wire temperature reaches its maximum value, at which point the temperature difference is substantial, and the heat transfer and dissipation rates satisfy the heat convection and thermal radiation balance equation in Equation (4), leading to a stable temperature at which the wire temperature no longer changes. After continuously applying line maintenance current for 60 min, the wire reaches a steady state temperature of 0 °C as the effective value of line maintenance current indicator. Under natural convection without wind conditions, the calculated effective values of the line maintenance current for different initial ambient temperatures are 101 A, 134 A, and 167 A, with the Joule heat power required to prevent condensation being 0.35 W, 0.61 W, 0.91 W, and 1.33 W, respectively.
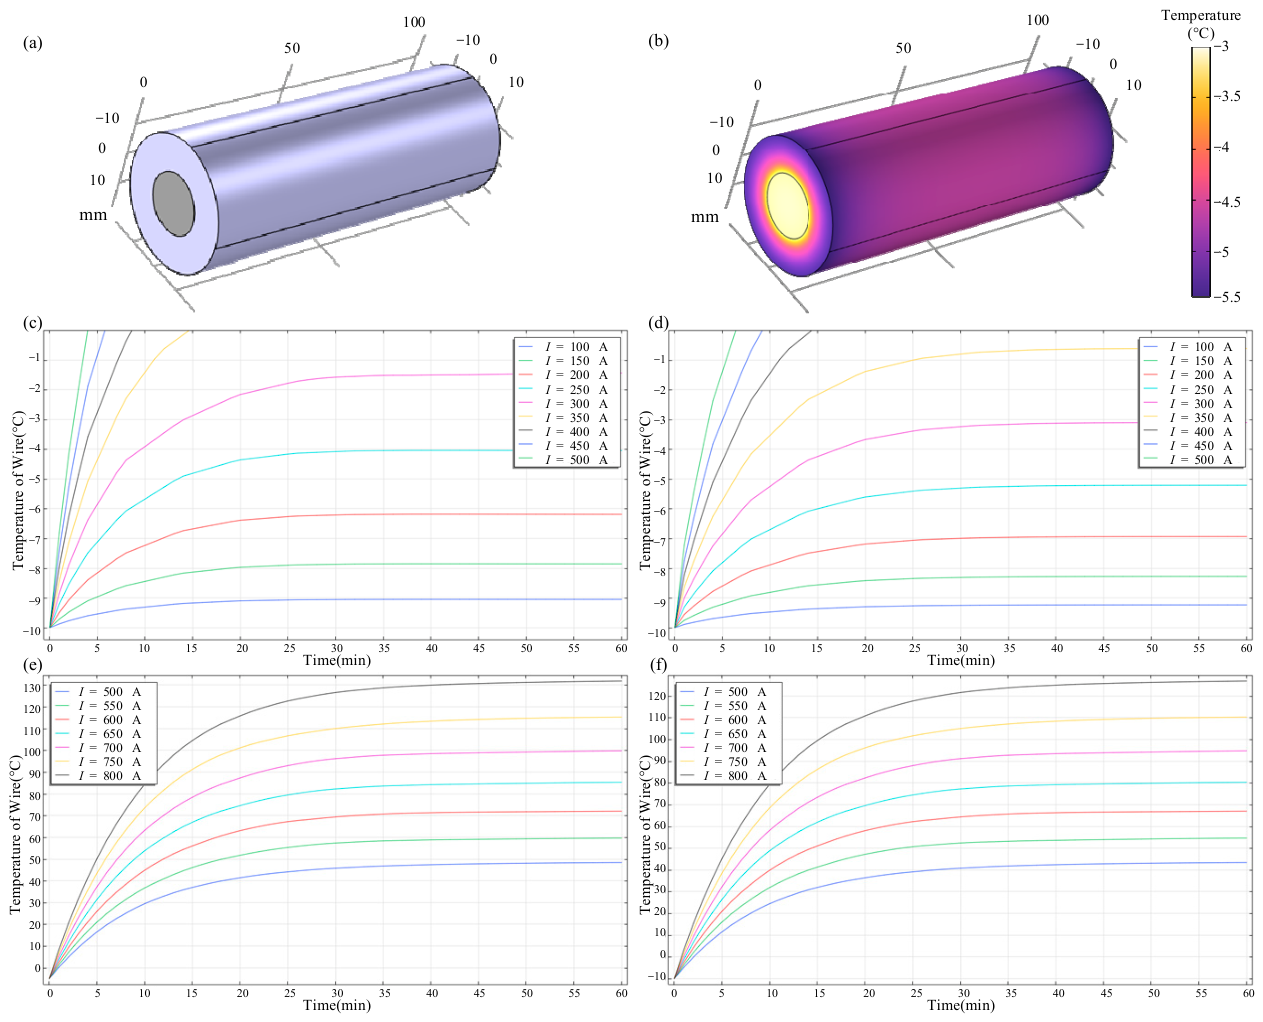
Next, an ice layer is modeled on the outer side of the wire, establishing a thermal equivalent model for the Joule heating temperature rise under natural convection cooling. The critical de-icing current is defined as the current threshold that begins to melt the ice layer over the overhead ground wire within 60 min. Therefore, the indicator is set to the current that raises the inner temperature of the ice layer to 0 °C. The maximum de-icing current is defined as the critical current required to attain the permissible temperature when the wire is in thermal steady-state, with the reference temperature set at 90 °C [19,20,21,22,23]. The initial ice thickness is set at d = 10 mm, with the inner surface of the ice layer acting as a phase change interface and the outer surface in contact with the air under natural convection, and the default ambient temperature is set at T = −10 °C. The simulation results are shown in Figure 8.
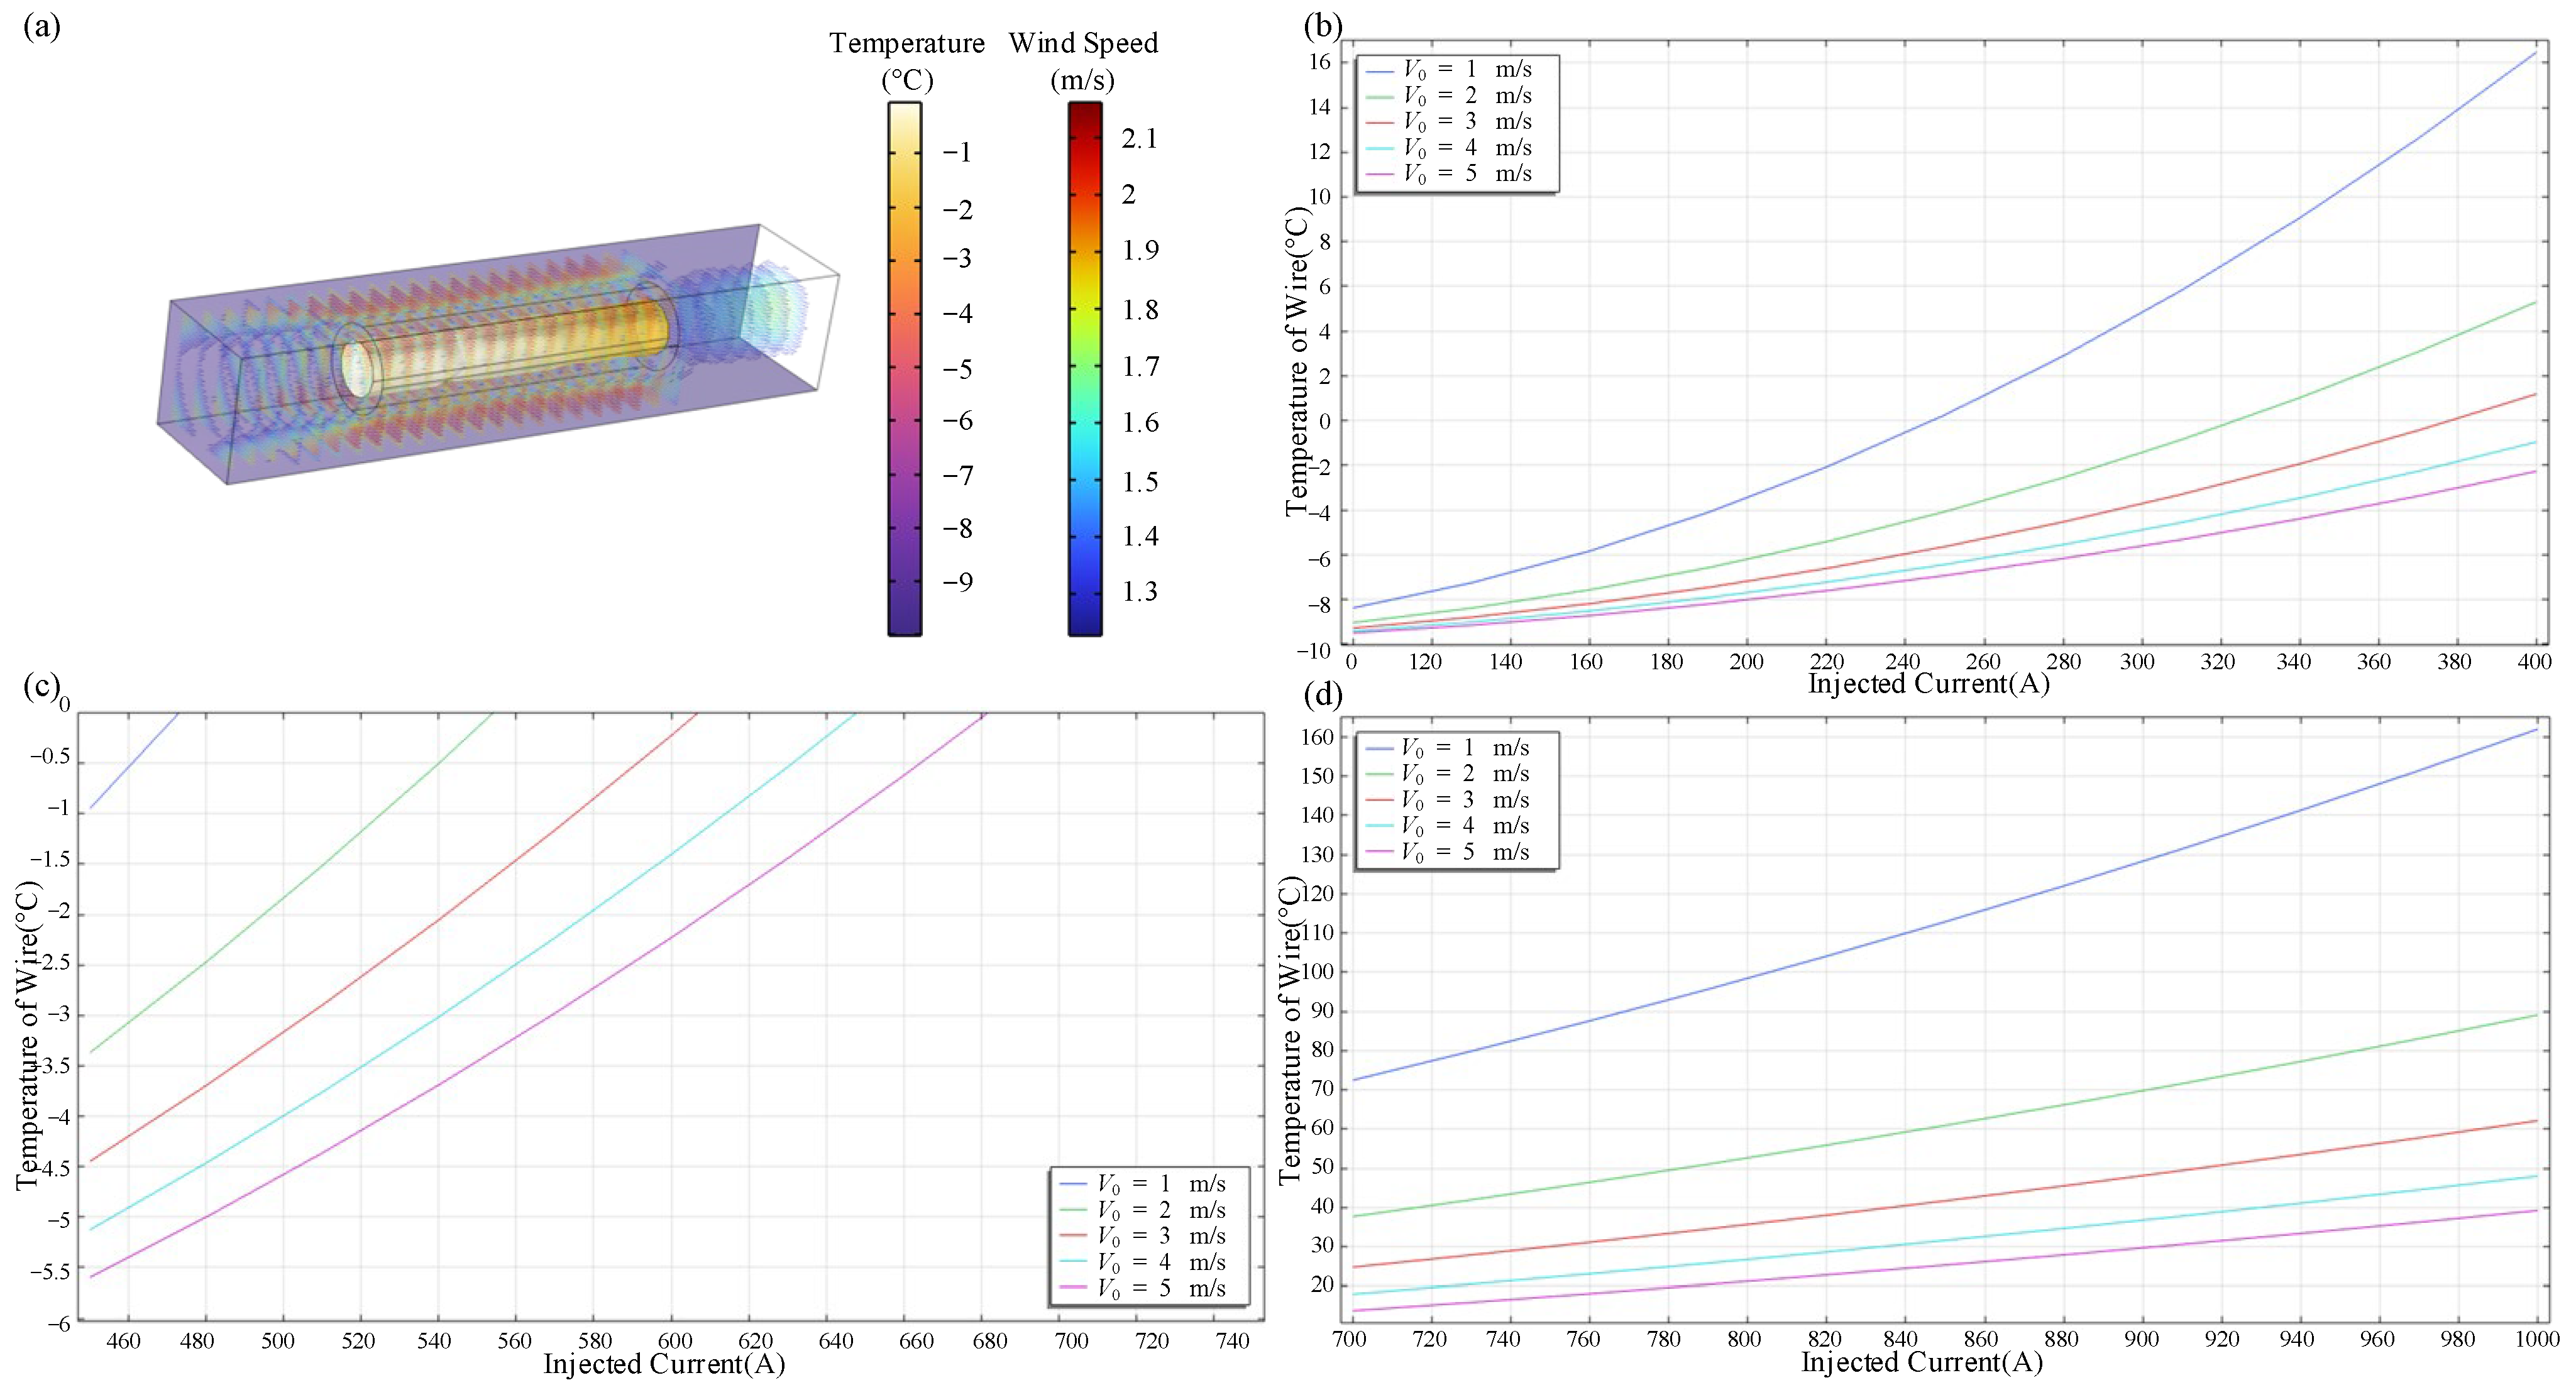
The theoretical analysis in Equation (9) indicates that wind speed influences the required de-icing current by altering convection heat transfer conditions. Therefore, based on the previously mentioned simulation model, a wind flow area is introduced to simulate conditions where the wind speed V is not zero. The initial simulation conditions are set to an average wind speed V0 = 1 m/s and ambient temperature T = −10 °C, resulting in outcomes displayed in Figure 9.
The Joule heat generated by the wire dissipates through forced convection caused by the wind, leading to a significant reduction in wire temperature increase. The fluid dissipates heat sufficiently, maintaining temperatures close to ambient conditions. Considering the establishment of thermal steady state with wind speed, there is a positive correlation between wind speed and convection heat transfer coefficient, markedly enhancing the cooling capacity. Consequently, the relationship between wind speed and wire temperature at thermal steady state is negative, indicating that higher wind speeds make it more difficult for the wire to achieve a temperature rise, consistent with the theoretical analysis of Equation (9).
However, the cooling effect brought about by wind speed tends to plateau as the wind speed increases, as the heightened wind speed reduces the boundary layer interaction between solid and fluid, diminishing the thermal capacity and resulting in decreased heat transfer efficiency. Furthermore, as wind speed increases, the slope of the relationship between the temperature rise and current reflects a decreasing trend, illustrating that enhanced cooling conditions facilitate the easier establishment of thermal balance.
The simulation results provide a control strategy for current regulation in the DDI-AC method. Ultimately, the calculated results indicate that, under the initial ambient temperature condition of T = −10 °C in this electro-thermal-fluid field coupling simulation model, the effective values of line maintenance currents corresponding to different average wind speeds V0 = 1,2,3 m/s are 248 A, 322 A, and 380 A, respectively. The effective values of critical de-icing currents are 463 A, 551 A, and 622 A, while the effective values of maximum de-icing currents are 771 A, 1002 A, and 1121 A, respectively. Furthermore, in practical scenarios, given the variability and randomness of wind speed, to ensure that the wire temperature remains within a safe state during de-icing, the threshold for maximum de-icing current should be based on low-wind-speed or no-wind conditions.

4. Field Parameter Measurement and Temperature Rise Test of DDI-AC

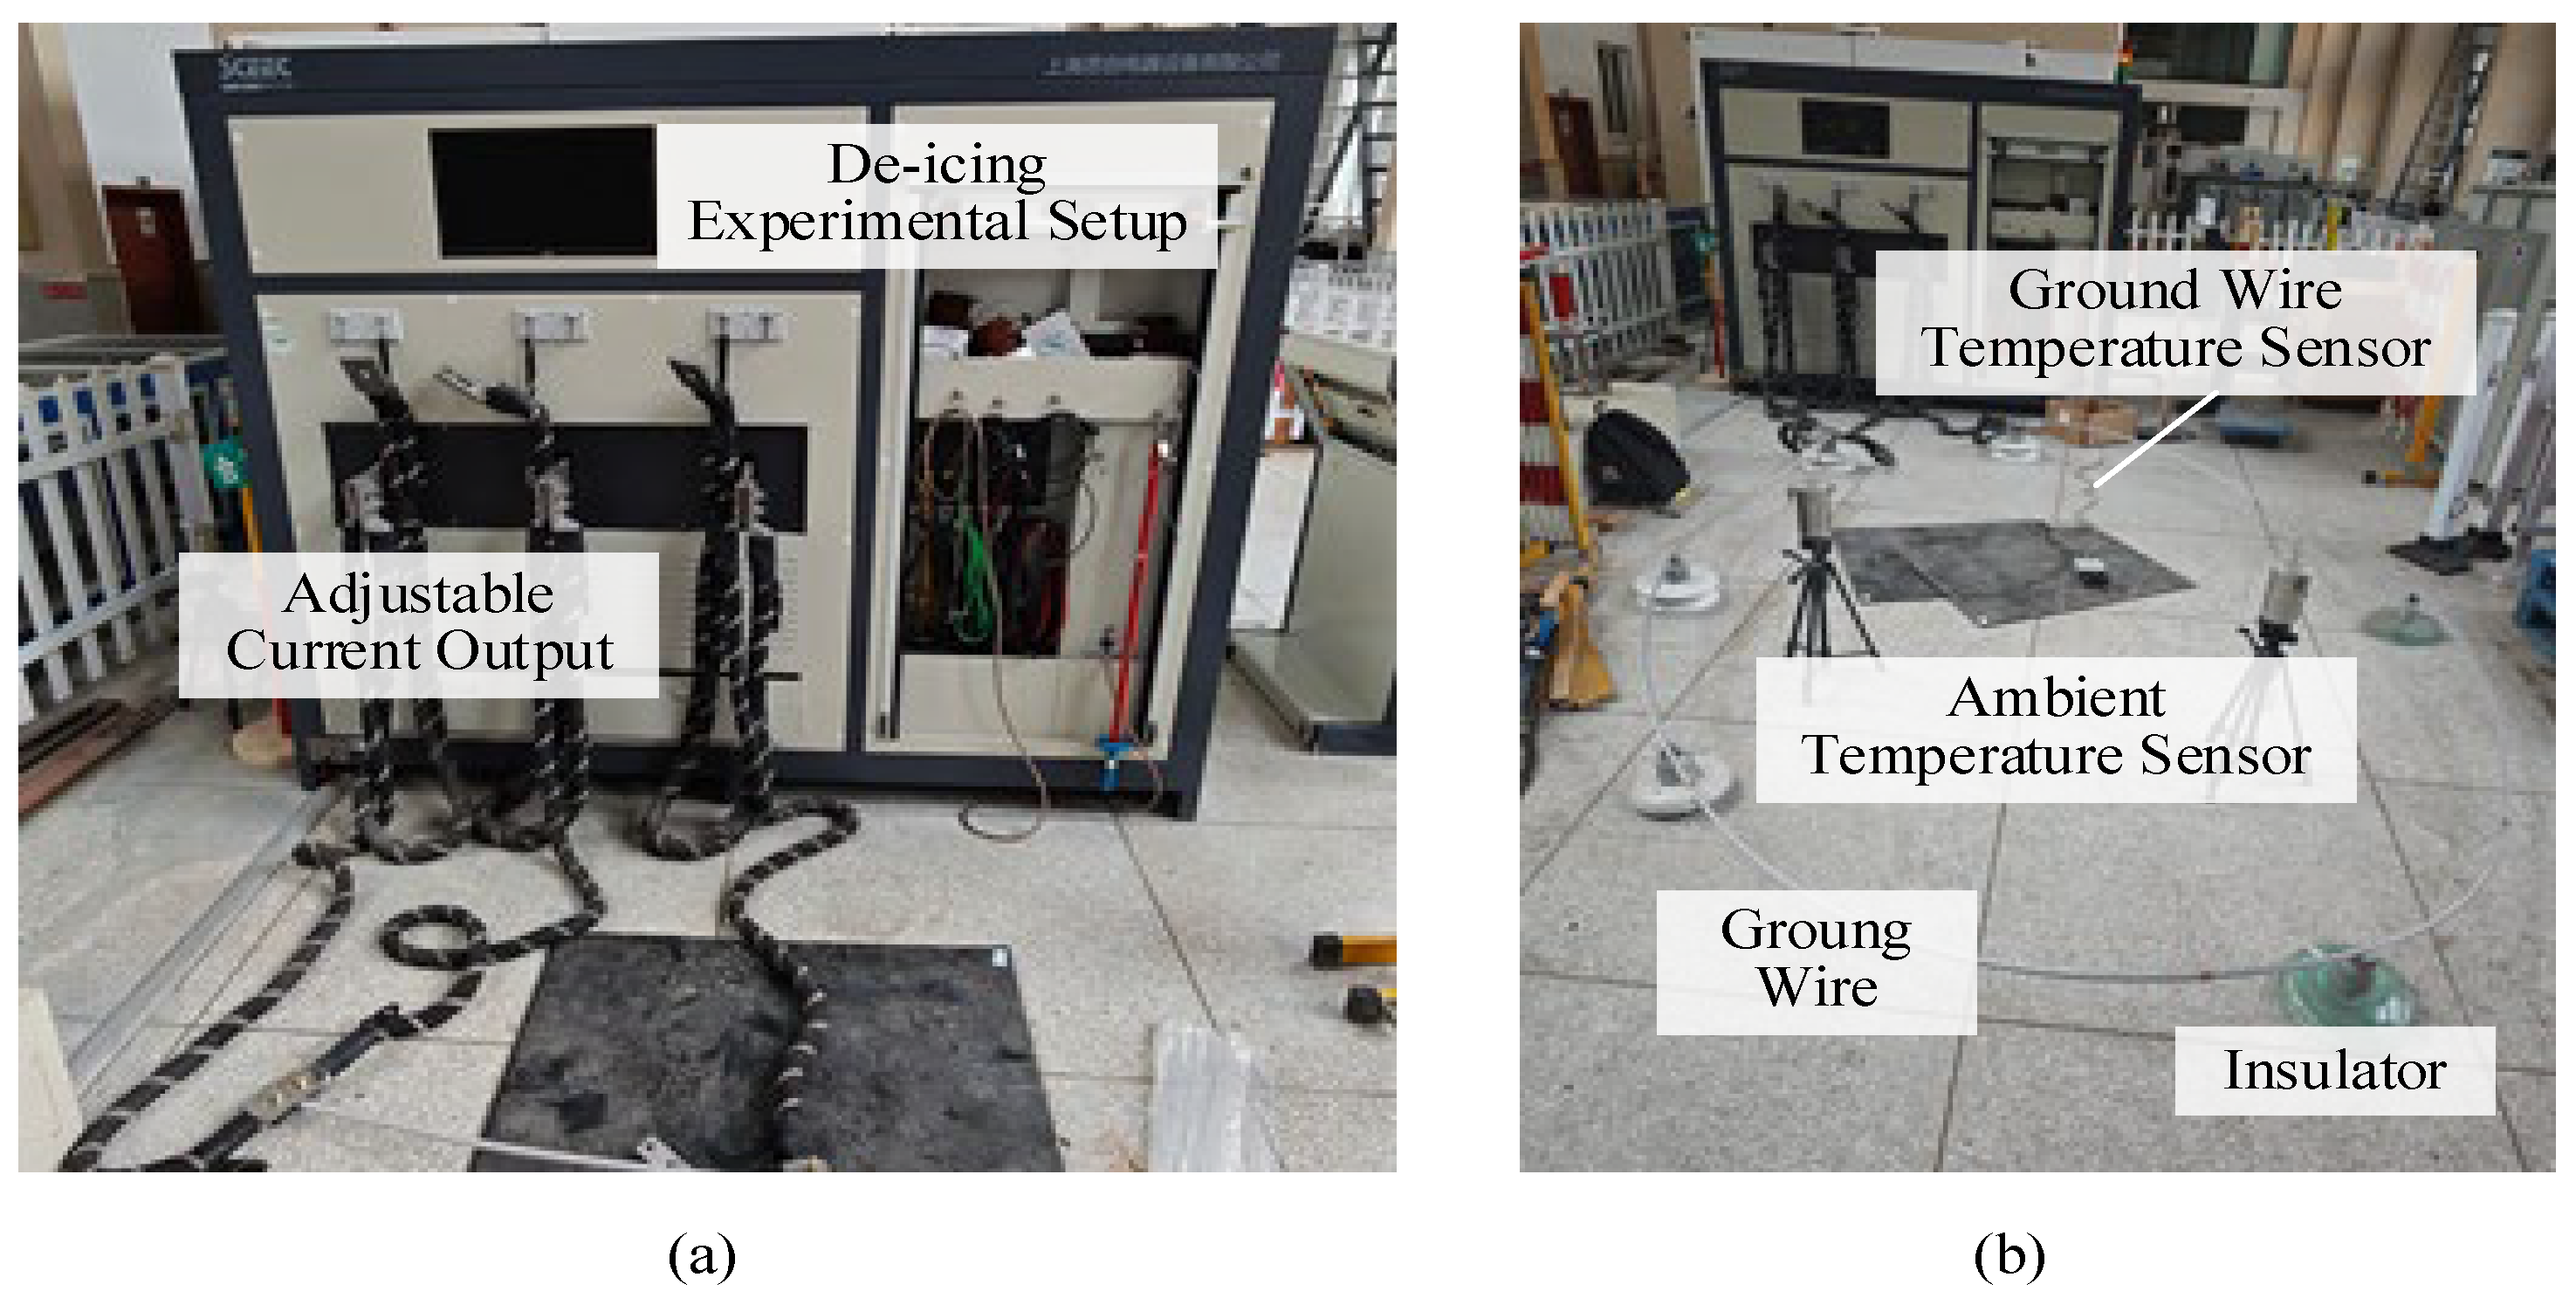
To validate the correctness of the theoretical analysis and simulation results, a prototype of the de-icing device was constructed. The experiment is implemented based on the theoretical design presented in Section 2.1 the reactive power compensation device adopts capacitors of 86.6 μF and 144.4 μF to form three compensation capacitor groups with capacitances of 173.3 μF, 288.8 μF, and 462.1 μF, which realizes stepped capacitive regulation ranging from 173.3 μF to 924.2 μF. After reactive power compensation, the current is further boosted by the current generator, and the circuit is connected to the JLB40-150 type load overhead ground wire to carry out the temperature rise test. The current switch cabine is capable of regulating the current up to a maximum of 2000 A. The experimental data recorded by the sensors are analyzed in real time through MATLAB R2019a for data fitting. The trial section of the ground wire is composed of 20.3 AS aluminum-clad steel strands, while the conductive part of the optical cable is made up of 14 AS and 20.3 AS aluminum-clad steel strands, with a temperature coefficient of resistance α of 0.0036. The overall experimental platform is illustrated in Figure 10.
The temperature probes of the ground wire, together with the surface-distributed temperature sensor units, accurately measure the temperature rise of the wire. Insulator supports simulate the environment of overhead transmission lines, combined with environmental temperature sensors to monitor experimental conditions in real time. Based on theoretical design, the de-icing device in practical applications shall be installed under the starting tower of the icing section to be melted, and connected to the overhead lightning wire via the tower down-leading wire. For safety considerations, a double-pole four-throw switch is installed at the connection point of the on-site lightning wire to disconnect the grounding wire at the tower grounding suspension point. When de-icing is required, the grounding wire within the de-icing section is connected to the tower down-leading wire to form a closed de-icing loop. When de-icing operation is terminated, the grounding wire of the de-icing section restores connection with the external grounding wire of the section, so as to ensure the operational safety of the de-icing device. At the terminal of the de-icing section, the switch installation mode is consistent with that at the starting tower. Experimental measurements are based on the DS-2008 high-power line frequency parameter test system, where the parameters of the experimental ground wire are incorporated into the equivalent model calculation to obtain the equivalent resistance values for the studied section of the ground wire. These values are compared with the impedance measurements obtained from a standard impedance tester in the measurement system, as shown in Table 5.
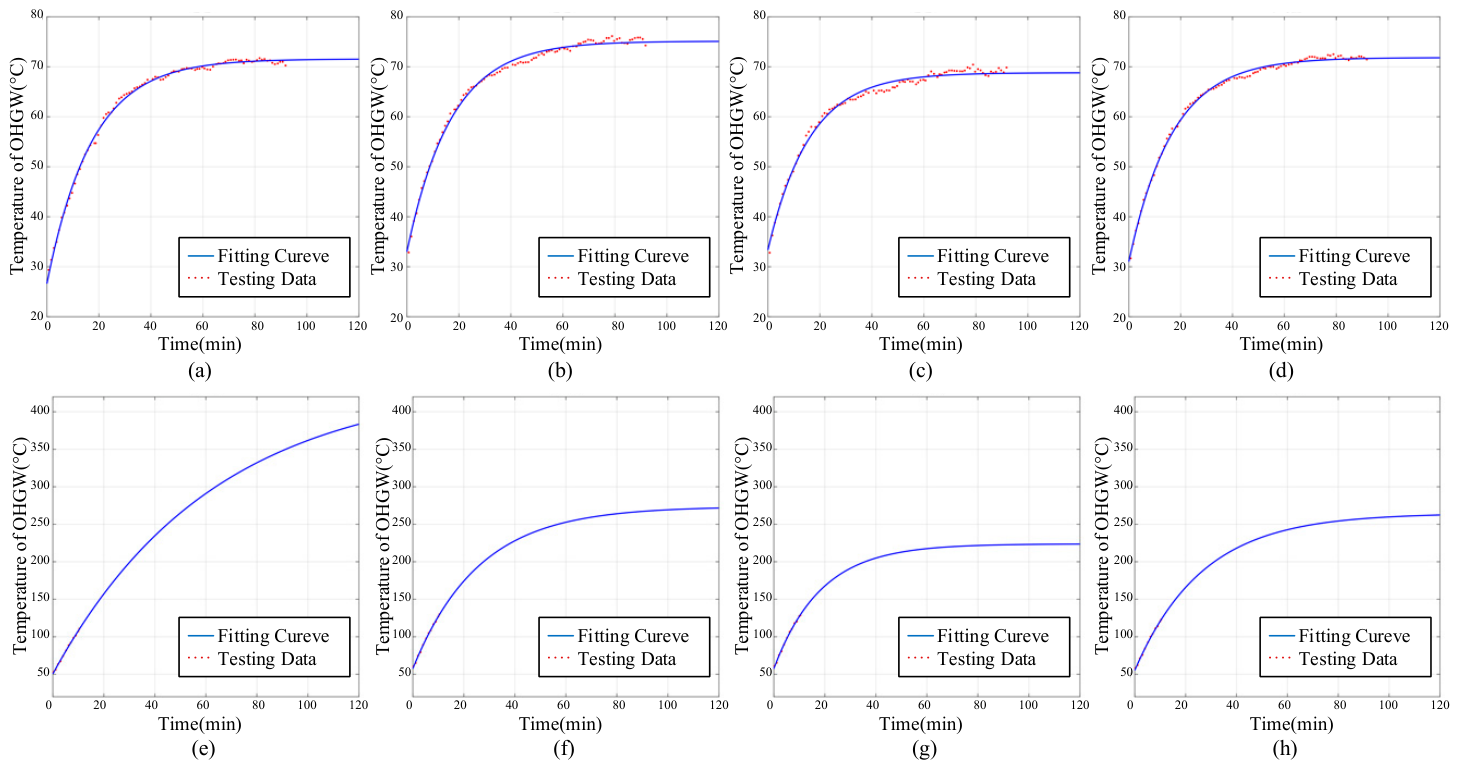
In the table, ft, Ut, It, φ c , and Zt represent the test frequency, ground wire voltage, ground wire current, line impedance angle, and line impedance value, respectively. Rc, Xc, and Lc denote the corresponding equivalent model impedance calculation values. The test results indicate that the impedance values calculated from the raw experimental values have a deviation from the impedance tester’s data of less than 0.0002, aligning with theoretical expectations and confirming the correctness of the theoretical model. The measured section of the ground wire includes contact impedance, and, after data processing based on the experimental impedance parameters, temperature rise tests and calculations were conducted on the JLB40-150 stranded wire. Temperature sensors were fixed using polyimide heat-resistant tape on the surface of the stranded wire, with data output values recorded every minute. The data and fitted curves of the line maintenance current control test results are shown in Table 6 and Figure 11.
During the experiments with output currents set at 400 A and 500 A, the temperature rise sensors on the experimental platform detected that the temperature of the JLB40-150 ground wire was increasing too rapidly, approaching the overcurrent threshold. This resulted in relatively poor validity of the temperature rise data from 0 to 7 min in the 400 A test and from 0 to 10 min in the 500 A test, while the subsequent period of slower temperature rise showed better validity. In the 300 A experiment, with the ambient temperature around 25 °C, the measured steady-state temperature of the wire when maintaining line current reached 75 °C. In the 350 A test, with the ambient temperature around 27 °C, the measured steady-state temperature of the ground wire reached 106 °C. The recorded environmental wind speed on that day was 0.2 m/s, and calculations were made. The comparison between the experimental current values and the theoretical calculated values for the process of the ground wire rising from ambient temperature to steady-state temperature is shown in Table 7.
Based on the theoretical analysis of Equations (3) and (11), the Joule heat absorbed by the ground wire is related to the temperature difference rather than the absolute temperature. The comparative results confirm the correctness of the theoretical calculations and validate the feasibility of the de-icing current regulation theory. In an almost no-wind experimental environment, when the line maintenance current is adjusted to 350 A, the corresponding steady-state temperature of the ground wire, converted to an ambient temperature of 0 °C, is approximately 79 °C. This indicates that a line maintenance current below 350 A can ensure the safe operation of the line without ice accumulation. The analysis focused on a relatively stable data interval with wind speed variations, combined with the use of silicone grease and other thermal conductive pastes for filling, ultimately yielded better temperature measurement results. Furthermore, the temperature rise test data indicate that a line maintenance current exceeding 400 A results in excessive temperature rise beyond the safe operational threshold for the ground wire, which does not meet the requirements for JLB40-150 line maintenance conditions and is generally consistent with the theoretical analysis.

5. Conclusions

This study presents the design of a distributed de-icing method for overhead ground wires based on an AC power supply. It involves the theoretical analysis of current regulation strategies for a de-icing device and the underlying thermodynamic principles, along with the completion of relevant simulations and on-site parameter measurements, ultimately validating the correctness of the method and theoretical model. The main conclusions are as follows:
(1)
The de-icing method injects a power–frequency de-icing current into the overhead ground wire through a Scott transformer, combined with a reactive power compensation device to achieve current regulation. The device is compact in size and easily transportable, making it suitable for small-capacity distributed de-icing. The two-phase independent and series working modes of the transformer, in conjunction with the switching of compensation capacitors, enable the reliable on-demand adjustment of active current under both line maintenance and de-icing conditions.
(2)
The simulation results of the electro-thermal-fluid field coupling model indicate that the impedance calculations of the thermal equivalent theoretical model meet the criteria and provide control strategies for de-icing current regulation, verifying the feasibility of the method. For the test subject, under an ambient temperature of T = −10 °C and an average wind speed of V0 = 1−3 m/s, the effective values of the maintenance current that the de-icing device can inject range from 248 A to 380 A, with the critical de-icing current effective values ranging from 463 A to 622 A, and the maximum de-icing current effective values ranging from 771 A to 1121 A.
(3)
The testing results from the field temperature rise experimental platform validate the accuracy of the current regulation strategy and the thermodynamic theoretical model. The device successfully achieves the reliable control of power–frequency AC injection and maintains the temperature rise. Under experimental conditions, for the JLB40-150 ground wire, the de-icing device injecting current of 350 A can ensure the safe operation of the line without ice accumulation, while currents exceeding 400 A are not suitable for the line maintenance conditions of the JLB40-150.

Author Contributions

Conceptualization, Y.Y. and X.X.; methodology, Y.Y.; software, X.X. and C.Y.; validation, Y.Y. and J.Z.; formal analysis, Y.Y. and C.Y.; investigation, J.Z.; resources, C.Y. and J.Z.; writing—original draft preparation, Y.Y.; writing—review and editing, Y.Y. and C.Y.; visualization, J.W. and J.Z.; supervision, J.W. and X.X.; project administration, J.W. and X.X.; funding acquisition, J.W. All authors have read and agreed to the published version of the manuscript.

Funding

This research received no external funding.

Institutional Review Board Statement

Not applicable.

Informed Consent Statement

Not applicable.

Data Availability Statement

The data used in the analysis presented in the paper will be made available, subject to the approval of the correspondence author.

Conflicts of Interest

All authors declare that the research was conducted in the absence of any commercial or financial relationships that could be construed as a potential conflict of interest.

References

  1. Šket, K.; Ficko, M.; Gubeljak, N.; Brezocnik, M. Study of environmental impacts on overhead transmission lines using genetic algorithms. Int. J. Simul. Model. 2023, 22, 610–618. [Google Scholar] [CrossRef]
  2. Wróbel, Z.; Ziemba, R.; Markowska, R.; Mielnik, R. Electromagnetic Impact of Overhead High-Voltage Lines during Power Transmission on Buried Signaling Cables of the Traffic Control Systems in Modernized Railway Lines. Energies 2024, 17, 2554. [Google Scholar] [CrossRef]
  3. Ye, Z.; Wu, C.; Liu, X.; Huang, F. Numerical simulation of the dynamic responses of electric power fitting of transmission lines after ice shedding. Shock Vib. 2022, 2022, 3675271. [Google Scholar] [CrossRef]
  4. Jafarishiadeh, F.; Mohammadi, F.; Sahraei-Ardakani, M. Preventive dispatch for transmission de-icing. In Proceedings of the 2021 IEEE Power & Energy Society General Meeting (PESGM), Washington, DC, USA, 26–29 July 2021; IEEE: Piscataway, NJ, USA, 2021. [Google Scholar] [CrossRef]
  5. Fang, Y.; Zeng, H.; Maluta, N.E.; Liu, W.; Shah, W.A.; Zhang, X. Study on the melting characteristics of icing on overhead contact lines using high-power fiber laser. Opt. Laser Technol. 2025, 191, 113297. [Google Scholar] [CrossRef]
  6. Saeidiharzand, S.; Sadaghiani, A.K.; Yürüm, A.; Koşar, A. Multiscale superhydrophobic zeolitic imidazolate framework coating for static and dynamic anti-icing purposes. Adv. Mater. Interfaces 2023, 10, 2202510. [Google Scholar] [CrossRef]
  7. Li, M.; Zhao, F.; Wang, H.; Yang, Y.; Dong, X.; Hai, Y. Visual recognition of icing risk on overhead transmission lines based on improved fuzzy wavelet domain. Results Eng. 2025, 28, 107126. [Google Scholar] [CrossRef]
  8. Zhu, H.; Han, Z.; Xing, H.; Xu, D.; Zhang, R.; Liu, C.; Chen, W. DC ice-melting operation of the ground wire based on the characteristic investigation of the thermal structure coupling effect. Electr. Power Syst. Res. 2023, 218, 109181. [Google Scholar] [CrossRef]
  9. Cao, Y.; Xu, X.; Fan, J.; Zeng, W.; Lv, S.; Liu, Y.; Liu, J. A two-stage decision-dependent stochastic strategy for de-icing maintenance of ice-covered transmission lines. Energy Rep. 2025, 13, 1959–1970. [Google Scholar] [CrossRef]
  10. Hu, Q.; Zhang, Y.; Chen, X.Y.; Lin, H.X.; He, J.; Wang, Z.G. DC ice-melting temperature rise characteristics of opgw and its influencing factors. High Volt. Eng. 2025, 51, 2363–2373. [Google Scholar] [CrossRef]
  11. Li, P.; Zhang, D.; Lei, M.; Xiao, P.; Wu, T.; Fang, C.; Pu, Z. Segmental insulation design method for UHV DC overhead ground wires under ice-melting with normal working condition. Electr. Power Syst. Res. 2025, 238, 111153. [Google Scholar] [CrossRef]
  12. Xiong, J.; Cheng, L.; Wang, M.D.; Chu, J.P.; Li, S.; Wang, S.; Wen, Z. Analysis of influencing factors of critical DC melting current for overhead ground wires. Sci. Technol. Innov. Appl. 2024, 14, 62–64+69. [Google Scholar] [CrossRef]
  13. Zhang, Z.; Zhang, H.; Yue, S.; Zeng, W. A Review of Icing and Anti-Icing Technology for Transmission Lines. Energies 2023, 16, 601. [Google Scholar] [CrossRef]
  14. Yang, G.; Jiang, X.; Liao, Y.; Li, T.; Deng, Y.; Wang, M.; Hu, J.; Ren, X.; Zhang, Z. Research on load transfer melt-icing technology of transmission lines: Its critical melt-icing thickness and experimental validation. Electr. Power Syst. Res. 2023, 221, 109409. [Google Scholar] [CrossRef]
  15. Veerakumar, R.; Tian, L.; Hu, H.; Liu, Y.; Hu, H. An experimental study of dynamic icing process on an Aluminum-Conductor-Steel-Reinforced power cable with twisted outer strands. Exp. Therm. Fluid Sci. 2023, 142, 110823. [Google Scholar] [CrossRef]
  16. Xiao, S.; He, Y.; Zhang, Y.; Wu, G.; Cao, Y.; Zhang, X.; Hou, J.; Guo, Y.; Li, T.; Erneste, N.; et al. Electrical-thermal conduction and distribution characteristics of the catenary system for electrified railway applying electrothermal ice-melting technique. Appl. Therm. Eng. 2025, 277, 126809. [Google Scholar] [CrossRef]
  17. Chi, M.; Hu, Y.; Jiang, X.; Liu, Z.; Gao, Y.; Zhao, M.; Jia, W. Influence mechanism of AC electric field on rime ice accretion on the insulator and its experimental verification in the natural environment. Cold Reg. Sci. Technol. 2025, 230, 104367. [Google Scholar] [CrossRef]
  18. Rekuviene, R.; Saeidiharzand, S.; Mažeika, L.; Samaitis, V.; Jankauskas, A.; Sadaghiani, A.K.; Gharib, G.; Muganlı, Z.; Koşar, A. A review on passive and active anti-icing and de-icing technologies. Appl. Therm. Eng. 2024, 250, 123474. [Google Scholar] [CrossRef]
  19. He, Y.; Zhou, Y.S.; Peng, Z.Y.; Liu, M.Q.; Zhou, K.; Tang, C. Research on a 5 kHz series inverter high-frequency excitation de-icing power supply and control strategy. Electr. Meas. Instrum. 2020, 57, 97–102. [Google Scholar] [CrossRef]
  20. Xu, F.; Li, D.; Gao, P.; Zang, W.; Duan, Z.; Ou, J. Numerical simulation of two-dimensional transmission line icing and analysis of factors that influence icing. J. Fluids Struct. 2023, 118, 103858. [Google Scholar] [CrossRef]
  21. Pan, Y.F.; Zhou, Y.S.; Zhou, W.Q.; Liu, Y.J.; Huang, X.Q. Optimization analysis of 1 kHz high frequency de-icing for medium voltage transmission lines. Power Capacit. React. Power Compens. 2024, 45, 106–113. [Google Scholar] [CrossRef]
  22. Gao, F.; Liu, Y.Y.; Jia, P.F.; Yang, Y. Evaluation technology for the operational status of overhead lines based on a health index. Power Syst. Prot. Control 2024, 52, 167–176. [Google Scholar] [CrossRef]
  23. Gao, K.; Luo, R.C.; Liu, J.; Chen, Z.Q.; Wang, Y.T. A method of energized DC ice-melting for overhead ground wire of transmission line. Electr. Eng. 2024, 25, 42–47. [Google Scholar]
Figure 1. Schematic diagram of thermal effects and heat flow model for overhead ground wire.
Energies 19 02474 g001
Figure 2. Schematic diagram of ice accumulation and de-icing process on ground wire.
Energies 19 02474 g002
Figure 3. Schematic diagram of capacitive compensation in the distributed de-icing system for overhead ground wires based on AC power supply.
Energies 19 02474 g003
Figure 4. Schematic diagram of AC-power-supply-based ice-melting system for overhead ground wires.
Energies 19 02474 g004
Figure 5. Topology of the distributed AC-power-based overhead ground wire de-icing system.
Energies 19 02474 g005
Figure 6. Potential distribution diagram of the stranded wire in lay length calculation and DC resistance comparison.
Energies 19 02474 g006
Figure 7. Temperature gradient distribution and temperature rise curve simulation results for un-iced wire with line maintenance current applied. (a) Temperature gradient distribution (I = 200 A, Time = 60 min). (b) Temperature rise at ambient temperature t = −5 °C. (c) Temperature rise at ambient temperature t = −10 °C. (d) Temperature rise at ambient temperature t = −15 °C.
Energies 19 02474 g007
Figure 8. Temperature gradient distribution and temperature rise curve simulation results for iced wire with critical de-icing current and maximum allowable current applied. (a) Icing model: the outer side of ground wire wraps with ice layer. (b) Temperature gradient distribution (I = 300 A, Time = 60 min). (c) Temperature rise with critical de-icing current for ice thickness d = 5 mm. (d) Temperature rise with critical de-icing current for ice thickness d = 10 mm. (e) Temperature rise with maximum allowable current at ambient temperature t = −5 °C. (f) Temperature rise with maximum allowable current at ambient temperature t = −10 °C.
Energies 19 02474 g008
Figure 9. Coupled electro-thermal-fluid field results for wire temperature gradient distribution and temperature rise curve with applied de-icing current. (a) Temperature gradient and wind flow distribution model (I = 350 A, V0 = 1 m/s). (b) Steady-state average temperature of ground wire with line maintenance current under different wind speeds. (c) Steady-state average temperature of ground wire with critical de-icing current under different wind speeds. (d) Steady-state average temperature of ground wire with maximum allowable current under different wind speeds.
Energies 19 02474 g009
Figure 10. Experimental platform and on-site wiring diagram. (a) Prototype setup for injecting de-icing current experimental platform. (b) Wiring for temperature rise experiment of long stranded wire.
Energies 19 02474 g010
Figure 11. Temperature rise curves of the ground wire at different injection currents and measurement channels. (a) 300 A, Channel 4. (b) 300 A, Channel 6. (c) 300 A, Channel 8. (d) 300 A, average value. (e) 500 A, Channel 4. (f) 500 A, Channel 6. (g) 500 A, Channel 8. (h) 500 A, average value.
Energies 19 02474 g011
Table 1. Compensation effects example of the compensation device on load ground wire under different conditions.
Compensation
Status
Compensation
Capacitance (μF)
Load Power
(kW)
Load Current
(A)
Power Factor
cosφ
Uncompensated\65.71740.4768
Parallel41065.71740.8527
Series1155.22143130.8667
Table 2. Relationship between the states of switches Sa and Sb and total compensation capacitance.
Switch
Sa
Switch
Sb
Compensation
Capacitance (μF)
Capacitance Range Considering
±10% Error (μF)
OnOn924.2859.5~988.9
OffOn750.9698.3~803.5
OnOff635.4590.9~679.9
OffOff462.1429.8~494.4
Table 3. Simulation model materials and thermal equivalent model parameters.
Component
Material
Specific Heat Capacity
J/(kg·K)
Thermal Conductivity
W/(m·K)
Electrical Conductivity
S/m
Steel Core46051.14.10×106
Aluminum Layer900205.43.53×107
Ice Layer21002.2/
Equivalent Model51477.41.18×107
Table 4. Calculated resistance error results of the stranded wire with different lay length and the thermal equivalent model.
Lay Length400560640
DC Resistance (Ω/km)0.332310.330530.33009
Relative Error−0.54%0%0.13%
Table 5. Comparison of temperature rise experimental ground wire impedance testing and equivalent model calculations.
Test GroupExperimental Ground Wire Test ValuesEquivalent Impedance Calculation
ft (Hz)Ut (V) φ c (°) Zt (Ω/km)Rc (Ω/km)Xc (Ω/km)Lc (mH/km)
14552.35146.2770.5236 +
j0.6067
0.5205 0.5443 1.9249
5553.41951.8150.5268 0.6698 1.9382
Average/49.2070.5237 0.6068 1.9316
24552.36746.1300.5251 +
j0.6047
0.5216 0.5426 1.9190
5553.43751.5820.5288 0.6667 1.9292
Average/49.0160.5252 0.6045 1.9241
34552.27146.8800.5206 +
j0.6084
0.5137 0.5486 1.9403
5553.49351.6870.5279 0.6681 1.9333
Average/49.4380.5208 0.6085 1.9368
Table 6. Dataset of steady-state temperature fitting results for multi-channel testing at different currents (Unit: °C).
Channels300 A350 A400 A500 A
Channel 471.5699.54184.58441.16
Channel 675.12109.72181.47273.74
Channel 868.82122.06200.25223.88
Average71.84106.48187.17264.72
Maximum75.12122.06200.25441.16
Table 7. Comparison of LBGJ-150-40AC ground wire temperature rise current calculation results (Wind speed 0.2 m/s).
Experimental
Current (A)
Ambient
Temperature (°C)
Steady-State
Temperature (°C)
Temperature
Rise (°C)
Calculated
Value (A)
300257550284.50
3502710679379.94
Disclaimer/Publisher’s Note: The statements, opinions and data contained in all publications are solely those of the individual author(s) and contributor(s) and not of MDPI and/or the editor(s). MDPI and/or the editor(s) disclaim responsibility for any injury to people or property resulting from any ideas, methods, instructions or products referred to in the content.