Article

Performance Analysis of Solar Photovoltaic Integration in Liquid Carton Packaging Manufacturing

by
George Ernest Omondi Ouma
1,*,
Moses Jeremiah Barasa Kabeyi
2,* and
Oludolapo Akanni Olanrewaju
2
1
Department of Mechanical and Manufacturing, University of Nairobi, Nairobi P.O. Box 30197, Kenya
2
Industrial Engineering Department, Durban University of Technology, Durban P.O. Box 1334, South Africa
*
Authors to whom correspondence should be addressed.
Energies 2026, 19(10), 2448; https://doi.org/10.3390/en19102448
Submission received: 28 January 2026 / Revised: 16 March 2026 / Accepted: 24 March 2026 / Published: 20 May 2026
(This article belongs to the Section A2: Solar Energy and Photovoltaic Systems)

Abstract

Energy-intensive processes such as flexographic printing, extrusion coating, slitting, compressed air generation, and chilled water production make liquid carton packaging manufacturing a major electricity consumer, increasing the need for cost-effective and sustainable energy solutions. This study evaluates the real-world performance of a 679 kWp grid-tied solar photovoltaic (PV) system integrated at the 11 kV level in a liquid carton packaging factory in Nairobi, Kenya, operating under regulatory export control constraints that require full on-site consumption of PV generation. Using measured operational data from energy monitoring platforms, including Sunny Portal, 1.31.8 Schneider EcoStruxure, and Sphera Cloud 8.17.2, system performance was assessed in accordance with IEC 61724-1, focusing on final yield, capacity utilization factor, grid offset contribution, and carbon emissions reduction. The results show that the system generated 617 MWh over the assessment period, corresponding to an average daily final yield of 2.49 kWh/kWp·day and a capacity utilization factor of 10.38%. On-site PV generation supplied approximately 17% of the plant’s annual electricity demand and avoided about 277.7 t CO2 emissions. Performance benchmarking against comparable installations in Kenya, Morocco, Malaysia, Senegal, and Uzbekistan indicates that the lower observed yield is primarily driven by curtailment and industrial load-matching limitations rather than inadequate solar resource or component inefficiency. The findings demonstrate that meaningful electricity cost savings and emissions reductions can be achieved in energy-intensive manufacturing environments despite export restrictions while highlighting the importance of improved load alignment and data-driven operational strategies to enhance PV utilization.

1. Introduction

Energy demand and sustainability continue to be critical concerns in the global packaging industry, particularly within the food and beverage segment, where continuous and electricity-intensive manufacturing operations are fundamental to product quality, safety, and convenience. The packaging sector accounts for a significant share of global manufacturing energy consumption [1,2] and greenhouse gas emissions, reflecting the considerable electrical loads associated with equipment such as flexographic printing machines, extrusion coating lines, slitting systems, compressed air units, and chilled water plants [3]. As the consumption of packaged beverages and ready-to-eat products expands globally, the environmental impacts and operational costs associated with packaging production have intensified. Market projections estimate the global packaging industry will exceed USD 1.42 trillion by 2028, with a compound annual growth rate (CAGR) of 3.9% [4]. This growth intensifies pressure on manufacturers to reduce energy costs, improve efficiency and adopt cleaner energy solutions while maintaining high product quality and operational reliability [5,6,7,8]. In response to these drivers, industrial facilities are increasingly adopting renewable energy technologies, particularly solar photovoltaic (PV) systems, as a means of reducing electrical energy costs while enhancing sustainability performance [9].
Recent research has also investigated advanced photovoltaic technologies aimed at improving PV module performance through enhanced thermal management. Hybrid photovoltaic–thermal (PVT) systems combine electricity generation with thermal energy recovery to mitigate the temperature-induced efficiency losses commonly observed in conventional PV modules [10]. Recent experimental studies have explored the integration of nanofluid cooling, metal foam fins, and phase change materials to enhance heat dissipation and improve electrical performance. For example, experimental work integrating aluminum foam fins and nanofluid cooling in PVT collectors demonstrated significant reductions in module operating temperature and improved combined electrical–thermal efficiency [11]. These studies highlight ongoing technological developments aimed at enhancing intrinsic PV module performance. However, such research primarily focuses on collector-level performance enhancement, whereas the present study addresses the operational performance and utilization of industrial PV systems operating under export control constraints.
Numerous studies have evaluated the operational performance of grid-connected photovoltaic systems across different climatic regions and installation scales. These investigations commonly employ standardized indicators such as final yield, performance ratio, and capacity utilization factor (CUF) to assess PV system efficiency and energy generation under real operating conditions. Reported installations include utility-scale plants, university campuses, and commercial rooftop systems, providing valuable insight into photovoltaic system behavior under varying environmental and operational conditions.
However, most existing studies examine photovoltaic systems operating under grid conditions that permit unrestricted export of excess generation to the utility network. Under such operating conditions, photovoltaic output is primarily limited by solar resource availability and intrinsic system losses. In contrast, many industrial photovoltaic installations operate under export control conditions, where generation is restricted to on-site self-consumption. In such environments, system utilization becomes dependent on the real-time interaction between photovoltaic generation and industrial load demand.
This study therefore investigates the performance of a grid-connected PV system integrated within an energy-intensive liquid carton packaging manufacturing facility operating under export-restricted conditions. The analysis provides a framework for interpreting photovoltaic performance indicators in load-limited industrial systems, demonstrating how commonly used metrics, such as final yield, performance ratio (PR), and capacity utilization factor, may be influenced by load generation interaction and curtailment rather than intrinsic system efficiency. The findings therefore extend beyond the specific case study and provide insights applicable to other industrial facilities operating under similar regulatory and operational constraints.

1.1. Research Area and Case Study Context

Kenya provides favorable conditions for industrial PV deployment, including average solar irradiance > 5.5 kWh·m−2·day−1, relatively high grid tariffs, and growing policy support for clean energy [12,13]. The case study examined in this research is a liquid carton packaging manufacturing factory in Nairobi, which serves a broad regional market across East and Central Africa. The facility operates a hybrid energy system that includes national grid electricity supplied at 11 kV, stepped down to 415 V for production loads, diesel generators for backup power, and a 679 kWp solar PV system installed on the rooftop. The PV system is integrated at the 11 kV medium-voltage level using a dedicated step-up transformer, enabling synchronization with the grid and allowing the PV energy to be distributed across the plant’s entire low-voltage network. The system operates under export control and anti-islanding protection in accordance with Kenyan grid regulations, which require that excess PV generation be curtailed whenever instantaneous factory demand falls below available PV output. Battery energy storage is not part of the system architecture, as the primary purpose of the installation is to reduce electricity expenditure and carbon emissions rather than to provide backup power.

1.2. Problem Statement

Liquid carton packaging manufacturing is an energy-intensive industrial process in which electricity is a major operational cost driver, especially for continuous production processes such as extrusion coating, flexographic printing, slitting, and auxiliary systems, like compressed air generation and chilled water production [14,15,16]. Despite the availability of abundant solar irradiance in Kenya and the decreasing cost of solar PV technology, many industrial facilities remain reluctant to invest in PV systems due to uncertainty about real-world performance under industrial load conditions, regulatory limitations on grid export that trigger curtailment, and insufficient integration between PV systems with plant energy management platforms [17,18,19,20,21,22]. Furthermore, grid-tied PV systems in Kenya are equipped with anti-islanding protections, which prevent the PV plant from supplying power during grid outages [23,24]. Although battery storage could enable backup operation, the high capital cost and longer payback periods associated with storage systems reduce their attractiveness for industries whose primary objective is cost savings [25,26]. A significant gap in the literature is the scarcity of empirical, data-driven performance studies on industrial solar PV systems operating under export control constraints, particularly in liquid carton packaging manufacturing environments. This limits the ability of manufacturers and policymakers to make informed investment and operational decisions.

1.3. Rationale of This Study

The rationale for this study stems from the need to generate empirical evidence on the real-world performance of grid-tied solar PV systems in energy-intensive industrial settings. Most published research on solar PV performance focuses on residential-, commercial-, educational-, or utility-scale installations, with relatively fewer studies examining industrial manufacturing facilities, which have distinct operational characteristics, including highly variable electrical load profiles, strict power-quality requirements, complex electrical architectures involving both medium- and low-voltage systems, and regulatory export control limitations [27,28,29]. By investigating the operational performance of a real industrial facility using measured energy data and multiple monitoring platforms, including Sunny Portal for PV generation data, Schneider EcoStruxure for facility-wide energy consumption, and Sphera Cloud for sustainability metrics, this study contributes practical insights that can support decision-making in similar manufacturing environments [30,31,32].

1.4. Novelty and Contribution of This Study

To further contextualize this research gap, several studies evaluating the performance of grid-connected photovoltaic systems across different operational environments are reviewed below.
Several studies have evaluated the performance of grid-connected solar photovoltaic systems across different geographic regions and application contexts. Campus-based and utility-scale installations dominate the literature, with most studies focusing on energy yield, performance ratio, and climatic influences under conditions that permit unrestricted export of excess generation to the grid.
For instance, Ndiaye et al. [33] analyzed the real-world performance of a 23 MWp grid-connected photovoltaic plant in Diass, Senegal, emphasizing seasonal yield variation and climatic effects in a utility-scale context. While the study provides valuable insight into large-scale PV behavior, it assumes full grid export capability and does not address load-constrained self-consumption or curtailment effects. Similarly, Eddahbi et al. [34] assessed the performance of a 1 MWp photovoltaic system connected to a factory grid in Morocco, focusing on soiling losses and system efficiency; however, the installation operates under export-permitted conditions and does not examine regulatory curtailment or load-matching limitations.
In the Kenyan context, Ngure et al. [35] evaluated the techno-economic performance of a 600 kWp rooftop PV system at Strathmore University. The study reports comparatively high final yield and capacity utilization values attributable to favorable irradiance and campus load flexibility. Nonetheless, the campus-based operational environment differs fundamentally from energy-intensive manufacturing facilities, particularly with respect to continuous production loads, medium-voltage integration, and export control constraints. Comparable campus-scale studies, such as Govindarajan et al. [36] in Malaysia and Khikmatov et al. [37] in Uzbekistan, similarly focus on yield and environmental losses under unconstrained grid-connected operation, with limited attention to industrial load interaction.
Across these studies, performance indicators such as final yield, capacity utilization factor, and performance ratio are generally interpreted as direct proxies for system efficiency. However, these interpretations implicitly assume that PV output is limited primarily by resource availability and system losses, rather than by regulatory or operational constraints. As a result, the effect of export control curtailment and self-consumption prioritization common in industrial PV installations in emerging markets remains underexplored.
This study addresses this gap by evaluating a 679 kWp grid-tied solar PV system integrated at the medium-voltage (11 kV) level within a liquid carton packaging manufacturing facility in Nairobi, Kenya, operating under strict export control conditions. Unlike previous studies, the analysis is based entirely on measured operational data and explicitly interprets standardized IEC 61724-1 [38]. performance indicators within the context of industrial load dominance and regulatory curtailment.
The novelty of this work, therefore, lies not in introducing new performance metrics but in demonstrating how established indicators such as final yield, performance ratio, and capacity utilization factor must be interpreted differently in load-limited industrial PV systems. In export-restricted environments, PV output can be constrained by instantaneous industrial demand rather than solar resource availability, meaning that lower apparent yield or capacity utilization does not necessarily indicate intrinsic system inefficiency.
By linking photovoltaic performance evaluation with industrial load behavior and regulatory operating constraints, this study provides a framework for interpreting PV system performance in export-restricted industrial environments and offers practical insight for PV system sizing, operation, and performance assessment in similar manufacturing facilities. This approach therefore provides a practical evaluation framework for assessing photovoltaic system performance in industrial facilities where generation is constrained by real-time load demand and regulatory export limitations.

1.5. Objectives and Paper Structure

The primary objective of this study is to evaluate the performance of the 679 kWp grid-tied solar PV system integrated into a liquid carton packaging manufacturing facility in Nairobi, with specific focus on energy yield, capacity utilization, grid-offset contribution, and environmental benefits. The analysis is based entirely on measured operational data and uses standardized performance indicators aligned with IEC 61724-1. The remainder of the paper is organized as follows. Section 2 describes the materials and methods, including the system architecture, monitoring platforms, solar resource assessment, and analytical formulations. Section 3 presents the results of the performance evaluation, while Section 4 offers a detailed discussion of operational constraints, curtailment effects, and comparative benchmarking with peer installations. Section 5 concludes the study and provides recommendations for optimizing PV integration in industrial manufacturing facilities, as well as directions for future research.

2. Materials and Methods

2.1. Research Design and Methodological Framework

This study adopts a case study-based empirical research design to evaluate the real-world performance of a grid-tied solar photovoltaic (PV) system integrated into a liquid carton packaging manufacturing facility in Nairobi, Kenya. The case study approach is particularly suitable because it enables an in-depth examination of system behavior under actual operating conditions, including industrial load variability, regulatory constraints, and plant-specific electrical architecture. Unlike simulation-based feasibility assessments, this methodology relies entirely on measured operational data, which ensures that performance indicators accurately reflect the interaction between solar PV generation, grid supply, and factory electrical demand. The analytical approach is aligned with internationally recognized performance monitoring practices defined under IEC 61724-1, ensuring standardization, reproducibility, and comparability with previously published studies [38,39]. The methodology includes detailed characterization of the study site and electrical distribution network, documentation of the PV system’s integration architecture, validation of data from multiple monitoring platforms, computation of standardized performance indicators, and benchmarking against comparable grid-connected PV systems reported in the literature across different climatic and operational contexts.

2.2. Description of the Study Site and Electrical Infrastructure

The study site is a liquid carton packaging manufacturing factory located in Nairobi, Kenya. The facility operates continuous and semi-continuous production processes that include flexographic printing, extrusion coating, slitting, compressed air generation, and chilled water production. These processes collectively contribute to a high and relatively stable electrical base load during normal operating hours, with additional variability arising from maintenance activities, production changeovers, and shifts in operating schedules. The electrical energy supply to the factory is derived primarily from the national utility grid at 11 kV, which is stepped down to 415 V through three distribution transformers supplying various production and auxiliary systems. Diesel generators are installed to provide backup power during grid interruptions, ensuring continuity of critical manufacturing operations and protection of sensitive equipment. The electrical distribution system is designed to meet demanding power quality requirements typical of industrial packaging facilities, including stringent voltage stability, low harmonic distortion, and high availability. The presence of large electrical loads within the factory, such as high-capacity DC motors, heaters, and refrigeration units, gives rise to a dynamic and time-varying load profile that plays a central role in determining the extent to which on-site PV generation can be effectively utilized under export-controlled, self-consumption operation.

2.3. Solar PV System Configuration and Integration Architecture

The PV system configuration is defined by a combination of structural, operational, and regulatory constraints. Structurally, approximately 4913 m2 of the rooftop area was suitable for PV installation. This area was further constrained by existing skylights and industrial safety requirements, including fire separation gaps, maintenance walkways, and access corridors. These factors collectively limited the maximum deployable capacity to 679 kWp, meaning the installed capacity reflects a practical engineering limit imposed by physical and operational constraints rather than a purely optimization-driven system size.
From an operational perspective, the facility comprises energy-intensive, partially continuous manufacturing processes, including extrusion coating, compressed air systems, and chilled water generation, which define the baseline daytime load profile. However, variations in production activity influence instantaneous demand.
In addition, the system operates under export control conditions, where PV generation is restricted to on-site self-consumption and inverter output is automatically curtailed whenever potential PV generation exceeds instantaneous plant demand in order to prevent reverse power flow into the grid. Consequently, system performance is governed not only by solar resource availability but also by the interaction between plant load demand and regulatory constraints.
The installed solar PV system has a nominal capacity of 679 kWp and consists of rooftop-mounted PV modules connected to string inverters. The inverters produce AC power at 0.415 kV, which is stepped up to 11 kV using a dedicated solar PV transformer to enable synchronization at the 11 kV busbar in parallel with the utility incomer. This medium-voltage integration architecture allows the PV system to operate in parallel with the utility grid while supplying power to the various low-voltage production and utility loads through the existing distribution transformers. The system comprises 1014 Trina Solar PV modules, each rated at 660 W, covering a rooftop area of 4913 m2. These modules are arranged and connected in series strings with varying numbers of panels per string; each string is connected into the DC inputs of one of six Sunny Tripower STP 110-60 three-phase grid tie solar inverters. These inverters feature 10 independent Maximum Power Point Trackers (MPPTs), enabling optimal power generation under diverse irradiance and partial shading conditions. With a conversion efficiency of 98.8%, they are also equipped with built-in DC and AC Type II surge arrestors for grid stability and equipment protection. DC cabling is routed through rooftop cable trays into a dedicated inverter room. The PV system is equipped with anti-islanding protection and export-limiting functionality, in compliance with local interconnection regulations. These protection mechanisms ensure safe synchronization with the utility grid and prevent reverse power flow during operation. The system does not incorporate battery energy storage, as the main purpose of the installation is to reduce electricity costs and carbon emissions through daytime grid offset rather than provide backup power during outages.
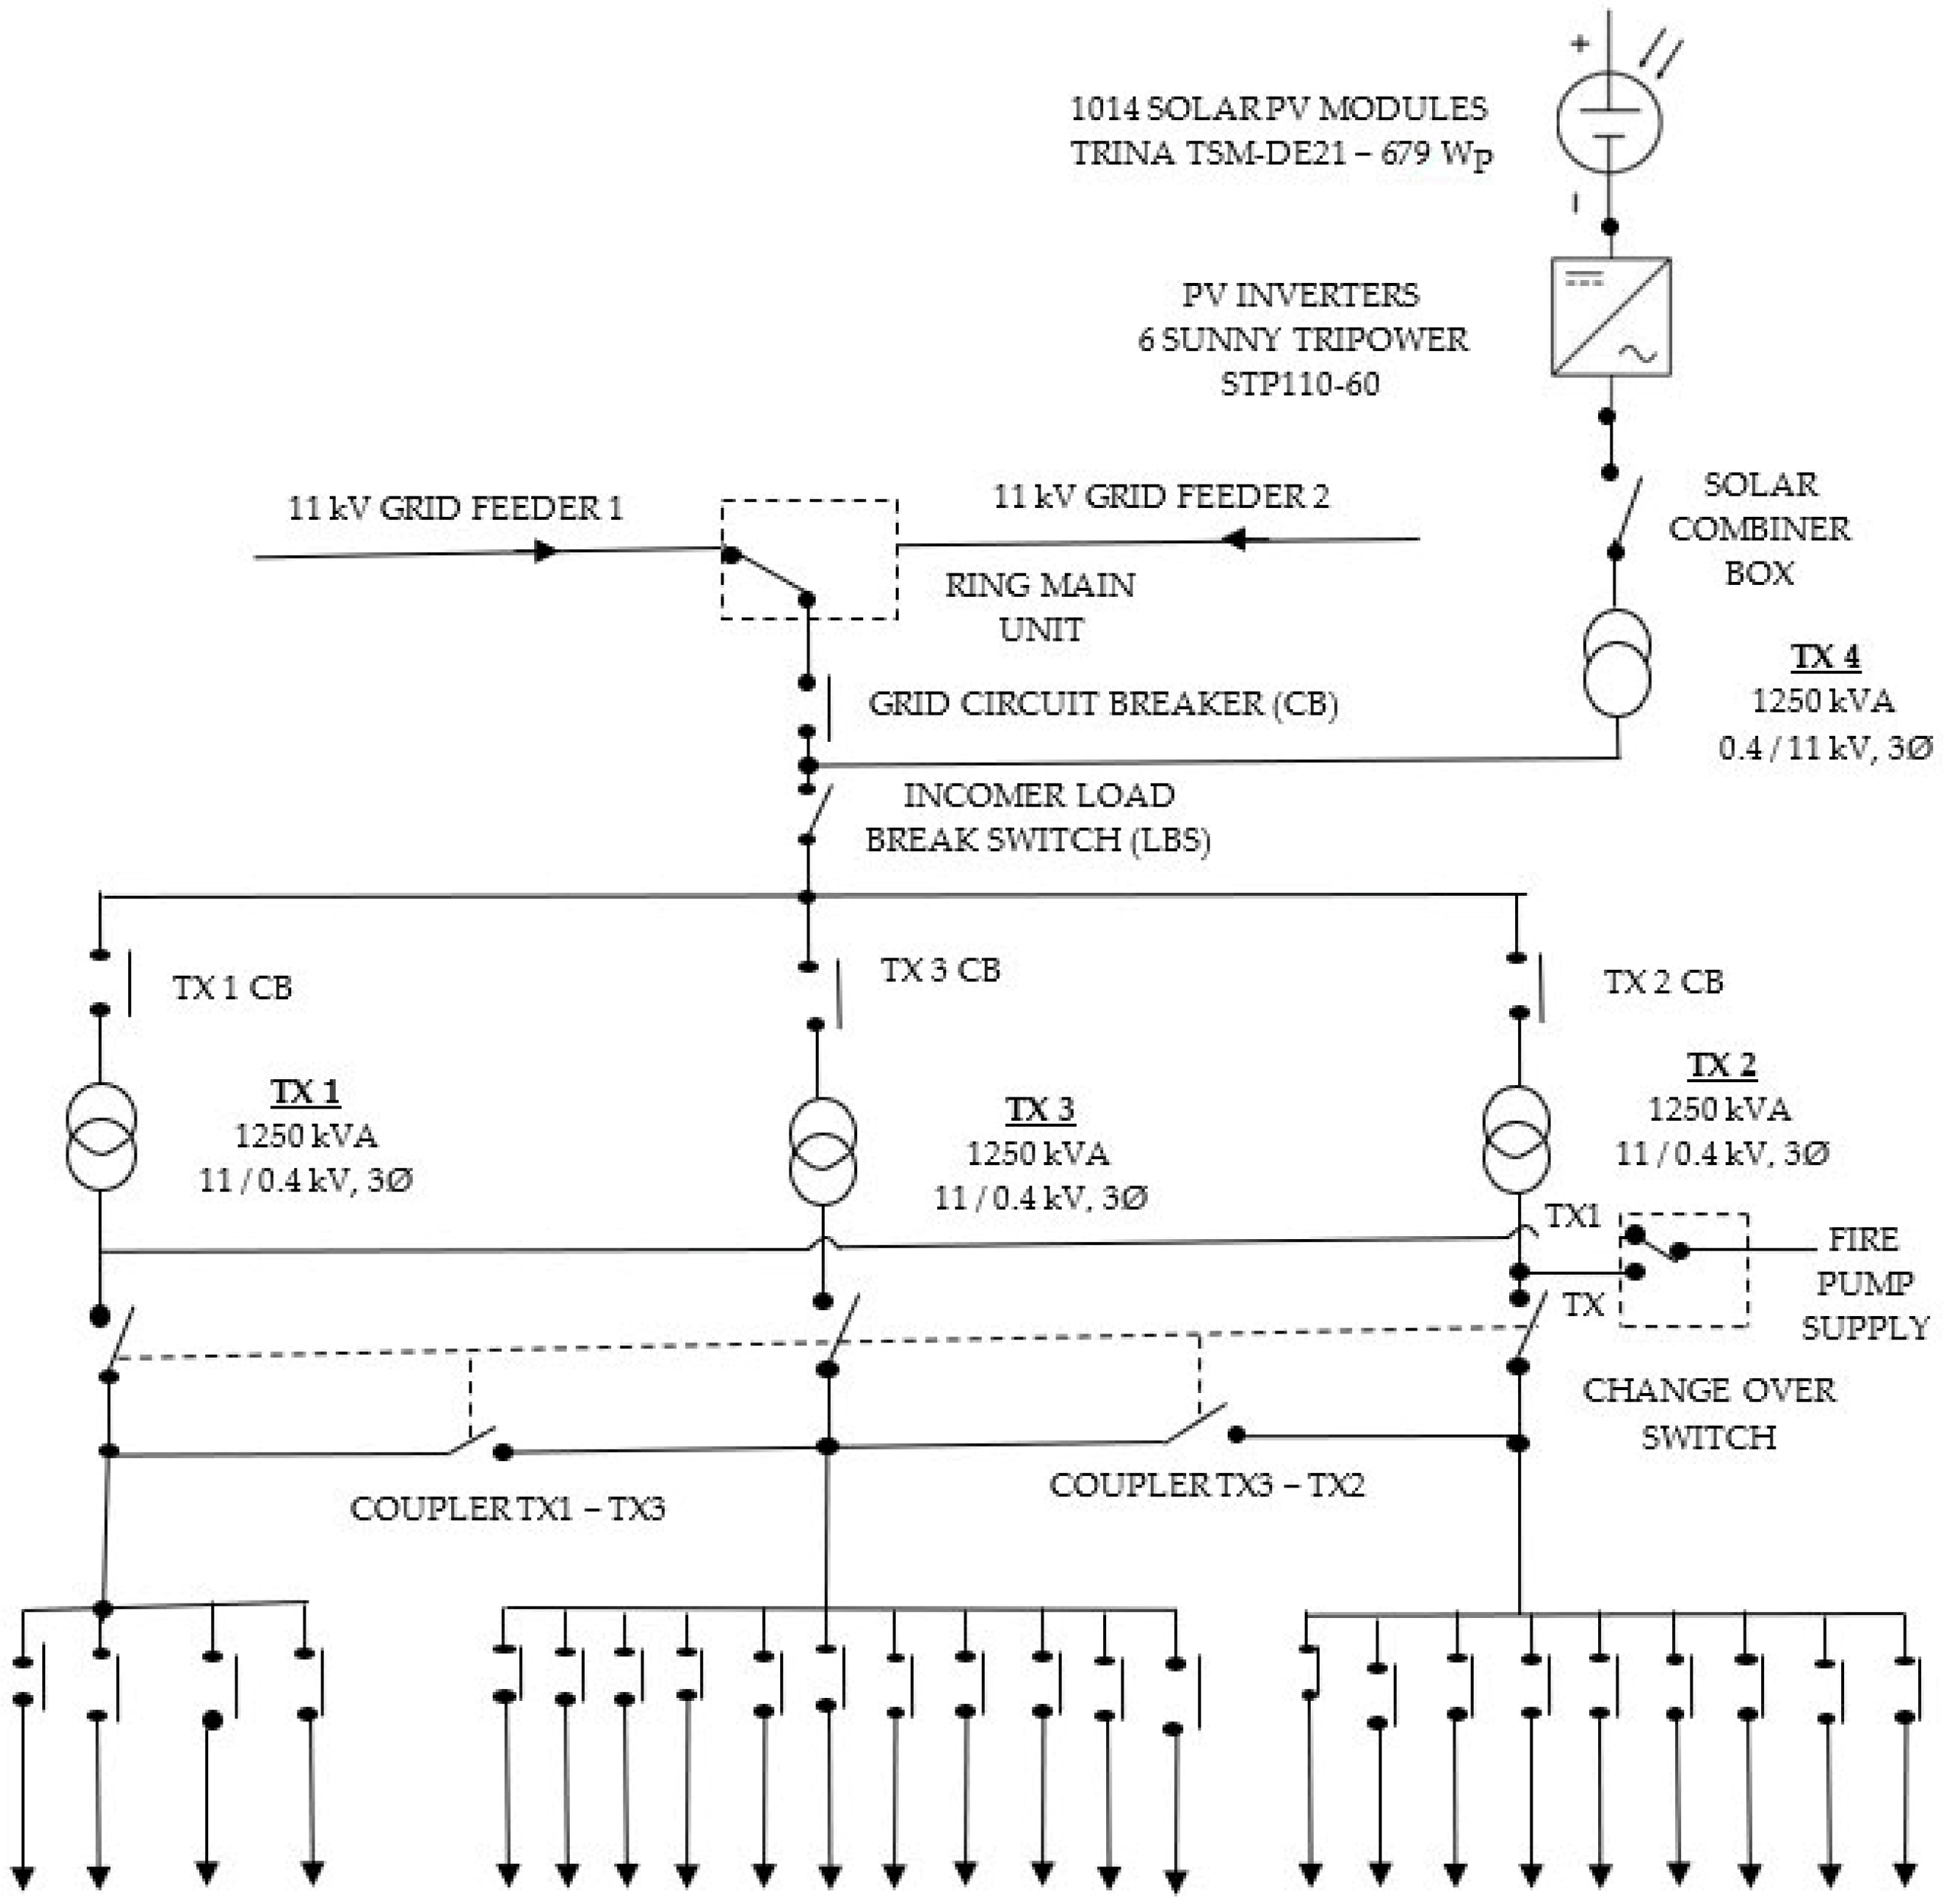
The overall system architecture is illustrated in the single-line diagram in Figure 1, showing how PV inverters supplying 0.4 kV AC are aggregated and passed through a 0.4/11 kV step-up transformer, after which the generated power is fed into the 11 kV plant distribution. This configuration ensures that PV energy is accessible to all major loads, minimizes voltage imbalance across transformers, and maintains adequate power quality for sensitive equipment. The medium-voltage integration approach used in this factory represents common practice in industrial PV deployments across Kenya and comparable emerging markets where multi-transformer industrial architecture makes low-voltage coupling less suitable.
Figure 1 shows the electrical configuration for integrating the solar PV system with the factory’s grid supply.
Figure 1 illustrates how the solar PV system outputs are stepped up to 11 kV using a transformer for synchronization with the factory’s main distribution network. This setup ensures centralized load sharing, minimizes voltage imbalances, and maintains power quality for continuous industrial operations.
The solar PV system is synchronized with the grid with export control and monitored through Sunny Portal for real-time performance tracking. This configuration allows substantial offset of daytime electrical load, supporting sustainability goals without compromising on power quality or system stability. This paper presents a detailed performance analysis of the solar PV integration at the factory, using data from Schneider EcoStruxure software and Sunny Portal platforms to monitor performance indicators such as performance ratio, utilization factor, and specific yield. By examining the system architecture, energy output, cost savings, and operational implications, this study offers a model for other industrial facilities in emerging markets aiming to transition to cleaner energy sources.

2.3.1. Grid Voltage Level Integration: 11 kV Versus 0.4 kV

The factory’s major loads, comprising printer, coating, slitting and auxiliary services, are connected independently to 3 step-down transformers on the low-voltage side at 0.4 kV. Integrating the solar plant at 11 kV allows greater flexibility for load distribution and centralized control. The solar inverter outputs are connected to an 11 kV step-up transformer via a combiner board, taking into consideration distribution losses, ease of control, and protection system. The approach of integrating solar PV at 11 kV instead of 0.4 kV ensures that solar PV serves all factory loads that are connected independently to the 3 transformers, minimizes load imbalances, enhances voltage regulation, and improves power quality across the distribution network, especially critical for sensitive and continuous industrial operations like printing and extrusion coating.

2.3.2. Self-Consumption Priority of Grid-Connected Industrial Solar PV Systems

In grid-connected industrial PV systems operating under self-consumption or export control conditions, locally generated solar energy is prioritized to supply on-site electrical loads. When PV generation is available, it directly offsets the facility’s electricity demand, thereby reducing electricity drawn from the utility grid. If PV generation exceeds instantaneous plant demand, excess generation is curtailed under no-export operating regimes. Conversely, when PV output is insufficient to meet plant demand, the remaining electricity requirement is supplied by the grid.
This operating principle results in natural prioritization of PV self-consumption within the industrial electrical system and ensures that locally generated solar energy is utilized before grid electricity whenever it is available.

2.3.3. Grid Export Control

Grid export control is critical in managing reverse power flow and complying with utility regulations. An export control meter has been installed to curtail excess generation during low-load periods to avoid exporting power beyond allowable limits. This is especially relevant in regions like Kenya, where net metering policies are still evolving.

2.4. Data Sources and Monitoring Platforms

Performance evaluation in this study is based entirely on measured operational data obtained from three digital monitoring platforms deployed at the factory.

2.4.1. Sphera Cloud

Sphera Cloud is an enterprise software solution designed for sustainability and environmental management [30]. It provides comprehensive tools for carbon footprint analysis, energy tracking, and reporting, allowing businesses to meet regulatory requirements and improve their environmental impact. In industrial applications, Sphera Cloud supports the identification of energy-saving opportunities by providing detailed insights into resource consumption patterns. Sphera Cloud is used to perform detailed environmental impact assessments, including carbon footprint analysis and energy tracking. The platform’s ability to integrate data from multiple sources provided a comprehensive view of resource consumption and highlighted areas with significant energy-saving potential using input variables such as power consumption (kWh), solar PV demand (kWh), and production volume (MSP). The output variables included carbon footprint reports and energy efficiency reports. An analysis was done to quantify GHG emissions from the energy sources, and a comparative analysis with global sustainability benchmarks was done.

2.4.2. Schneider Electric EcoStruxure Resource Advisor

Schneider Electric’s EcoStruxure Resource Advisor is an energy and sustainability management platform [32]. It enables centralized monitoring of energy usage, emissions, and other key performance indicators across multiple facilities. With its ability to integrate real-time data, the platform facilitates data-driven decisions that enhance energy efficiency and optimize resource usage. This tool is used to monitor and analyze energy consumption across various processes at the factory. The platform’s real-time monitoring capabilities enable the identification of inefficiencies and help in the development of targeted optimization strategies.
The input variables included real-time process power usage (kWh, A), with output variables being generated energy consumption reports, trend analysis, and load profiles. The study performed an analysis of load profiling of production equipment and developed data-driven recommendations for optimizing energy use across critical processes.

2.4.3. Sunny Portal

Sunny Portal, developed by SMA Solar Technology, is a monitoring platform designed specifically for solar PV systems [31]. It provides real-time data on energy generation, system performance, and grid interaction. By offering detailed performance analytics, Sunny Portal allows companies to maximize the efficiency of their solar PV installations and assess the impact of renewable energy integration on overall energy consumption. Sunny Portal provides critical insights into the factory’s solar PV energy generation and system performance. By analyzing data from Sunny Portal, the system contribution of renewable energy to overall factory operations and opportunities to enhance the system’s efficiency were evaluated.
It captured input variables such as solar PV output, grid reference and weather data/irradiance data, producing output variables including total energy consumption trend, solar energy consumption trend, grid energy consumption trend and carbon savings. Analysis of this data helped identify underperformance in solar energy generation and informed strategies to optimize solar PV integration with a grid electricity toolbar.
Operational data acquisition for the PV plant is performed through the SMA Data Manager M, which integrates inverter outputs and plant-level meter measurements to provide centralized monitoring and control. The system records operational data at a temporal resolution of 5 min, enabling detailed analysis of PV generation behavior, load–generation interaction, and potential curtailment events under export control operating conditions.
Data obtained from these three platforms were validated for completeness and crosschecked for internal consistency. Each platform contributes uniquely to the analytical framework by providing complementary measurements required to compute standardized indicators under IEC 61724-1.

2.5. Performance Indicators and Analytical Formulation

The performance indicators were evaluated using standardized performance definitions in accordance with IEC 61724-1, which provides internationally accepted definitions for photovoltaic performance monitoring and analysis [38]. These indicators quantify system energy output, efficiency, utilization, and contribution to factory energy demand under real operating conditions. It should be noted that the module operating temperature was not directly measured in this study. However, temperature-related performance effects are inherently reflected in the measured AC energy output of the operating system and are therefore implicitly captured in the calculated performance indicators.
All calculations were based on measured operational data, obtained from inverter-level monitoring and factory energy management systems, rather than simulation outputs.

2.5.1. Energy Output of the PV System

The total AC energy output of the PV system over a given evaluation period is expressed as:
E A C = i = 1 n E i ,
where E i represents the AC energy generated during the i -th interval and n is the total number of intervals considered [38].

2.5.2. Final Yield

The final yield Y f represents the net energy delivered by the PV system per unit of installed capacity [38]. It is defined as:
Y f = E A C P S T C ,
where:
E A C is the total AC energy output (kWh);
P S T C is the nominal installed capacity of the PV system at standard test conditions (kWp).
To enable comparison with literature benchmarks, the final yield is expressed on a daily basis [38].
Y f , d a i l y = Y f 365 .

2.5.3. Reference Yield

The reference yield Y r represents the theoretical energy yield based on available solar irradiance and is computed using plane-of-array irradiation H P O A , which was obtained from PVGIS irradiation datasets (GlobHor/GHI) and a PVsyst-consistent transposition approach, as described in Section 2.6 [38].
Y r = H P O A G r e f ,
where:
H P O A is the plane of array solar irradiation (kWh/m2);
G r e f is the reference irradiance at standard test conditions (1 kW/m2).

2.5.4. Performance Ratio

The performance ratio (PR) quantifies the overall efficiency of the PV system by accounting for losses due to temperature, inverter inefficiencies, wiring losses, soiling, and operational constraints [38]. It is defined as:
P R = Y f Y r .
In grid-tied industrial systems operating under export control constraints, curtailment reduces measured AC energy output without reflecting intrinsic system inefficiencies. Consequently, PR values derived under such conditions must be interpreted with caution, as curtailment losses are embedded within the measured final yield.

2.5.5. Capacity Utilization Factor

The capacity utilization factor (CUF), also referred to as the capacity factor, represents the degree to which the installed PV capacity is utilized over a given period and is defined as:
C U F = E A C P S T C × 8760 ,
where 8760 represents the total number of hours in a year.
The CUF provides insight into the operational effectiveness of the PV system under real load conditions and is particularly sensitive to curtailment, load-matching, and operational scheduling in industrial applications [38].

2.5.6. Grid Offset Contribution

The contribution of the PV system to factory electricity demand is expressed as the grid offset ratio [38]. It is calculated as:
G o f f s e t = E P V E t o t a l × 100 ,
where:
E P V is the energy supplied by the PV system to internal loads;
E t o t a l is the total electrical energy consumed by the factory.

2.5.7. Carbon Emission Reduction

The reduction in carbon dioxide emissions resulting from solar PV integration is estimated using:
C O 2 , s a v e d = E P V × E F g r i d ,
where:
E F g r i d is the grid emission factor (kgCO2/kWh).
This approach aligns with sustainability reporting methodologies implemented within industrial energy management platforms [38].

2.6. Solar Resource Assessment and Irradiation Data (PVGIS and PVsyst-Based Approach)

To contextualize PV generation performance and support calculation of reference yield Y r , the solar resource available at the Nairobi study site was assessed using PVGIS monthly irradiation datasets. PVGIS provides long-term satellite-derived irradiation estimates for specific geographic coordinates and is widely used in PV planning and performance evaluation studies [40]. Monthly irradiation data were extracted for the factory location, including Global Horizontal Irradiation (GHI) (reported in PVGIS outputs as GlobHor) expressed in kWh/m2/month. These values were used to characterize seasonal variability in solar resource availability and to provide an independent reference supporting the interpretation of measured PV output.
Since the PV modules are installed at a defined tilt and azimuth, the irradiance incident on the PV plane differs from horizontal irradiation. Consequently, a PVsyst consistent transposition approach was applied to relate horizontal irradiation to plane of array irradiation H P O A , which forms the numerator of Equation (4). The transposition process conceptually accounts for the beam, diffuse, and ground-reflected irradiance components and the geometric relationship between module orientation and sun position. The resulting H P O A was used to compute reference yield Y r according to IEC 61724-1 principles.
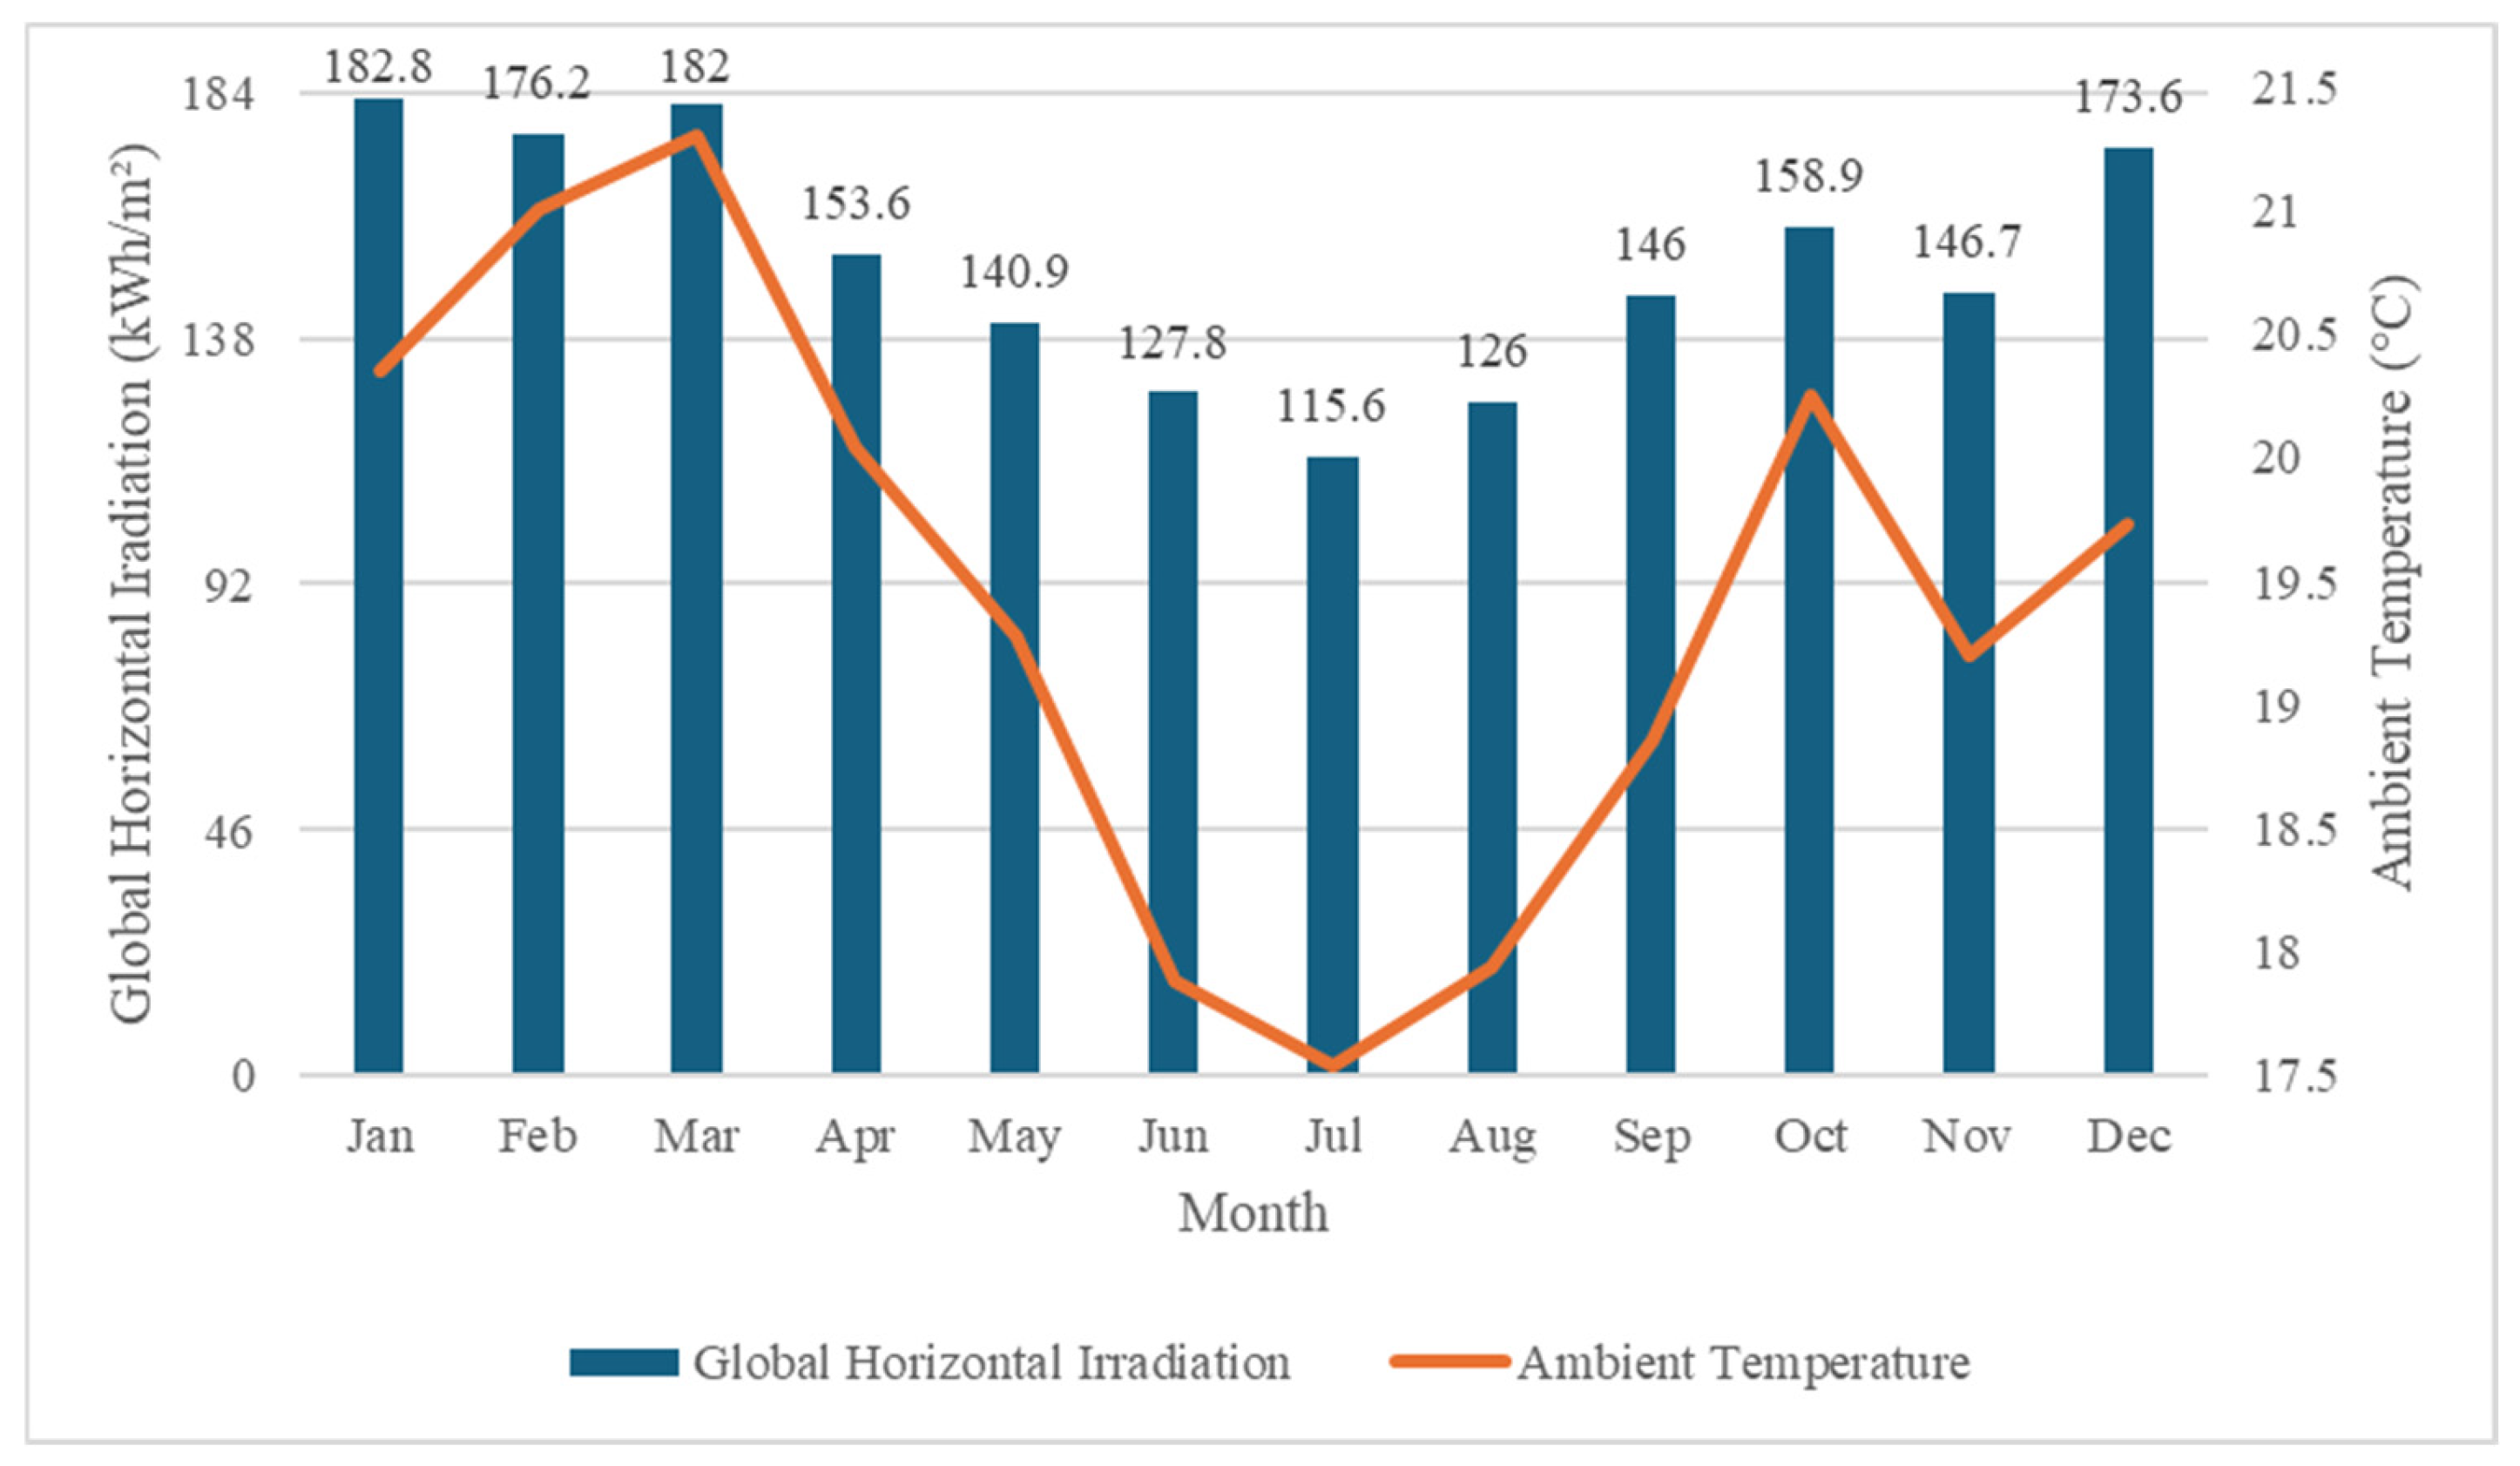
Table 1 presents monthly irradiance, Global Horizontal Irradiation (GlobHor) and ambient temperature values from the Nairobi packaging factory PVsyst simulation, defining the solar resource and thermal conditions for the Nairobi factory site.
From Table 1, high irradiation values in January–March correspond to peak energy yields, while mid-year dips (June–July) align with reduced irradiance despite cooler temperatures.
Figure 2 visualizes the same PVsyst data, showing monthly irradiance (GlobHor) as bars and ambient temperature (T_Amb) as a line, highlighting seasonal resource availability.
Both Table 1 and Figure 2 confirm resource-driven variability; high irradiance in January–March corresponds to peak energy yields, while mid-year dips dominate despite cooler temperatures. These patterns validate PVsyst baseline assumptions.

Resource Validation (PVGIS vs. PVsyst)

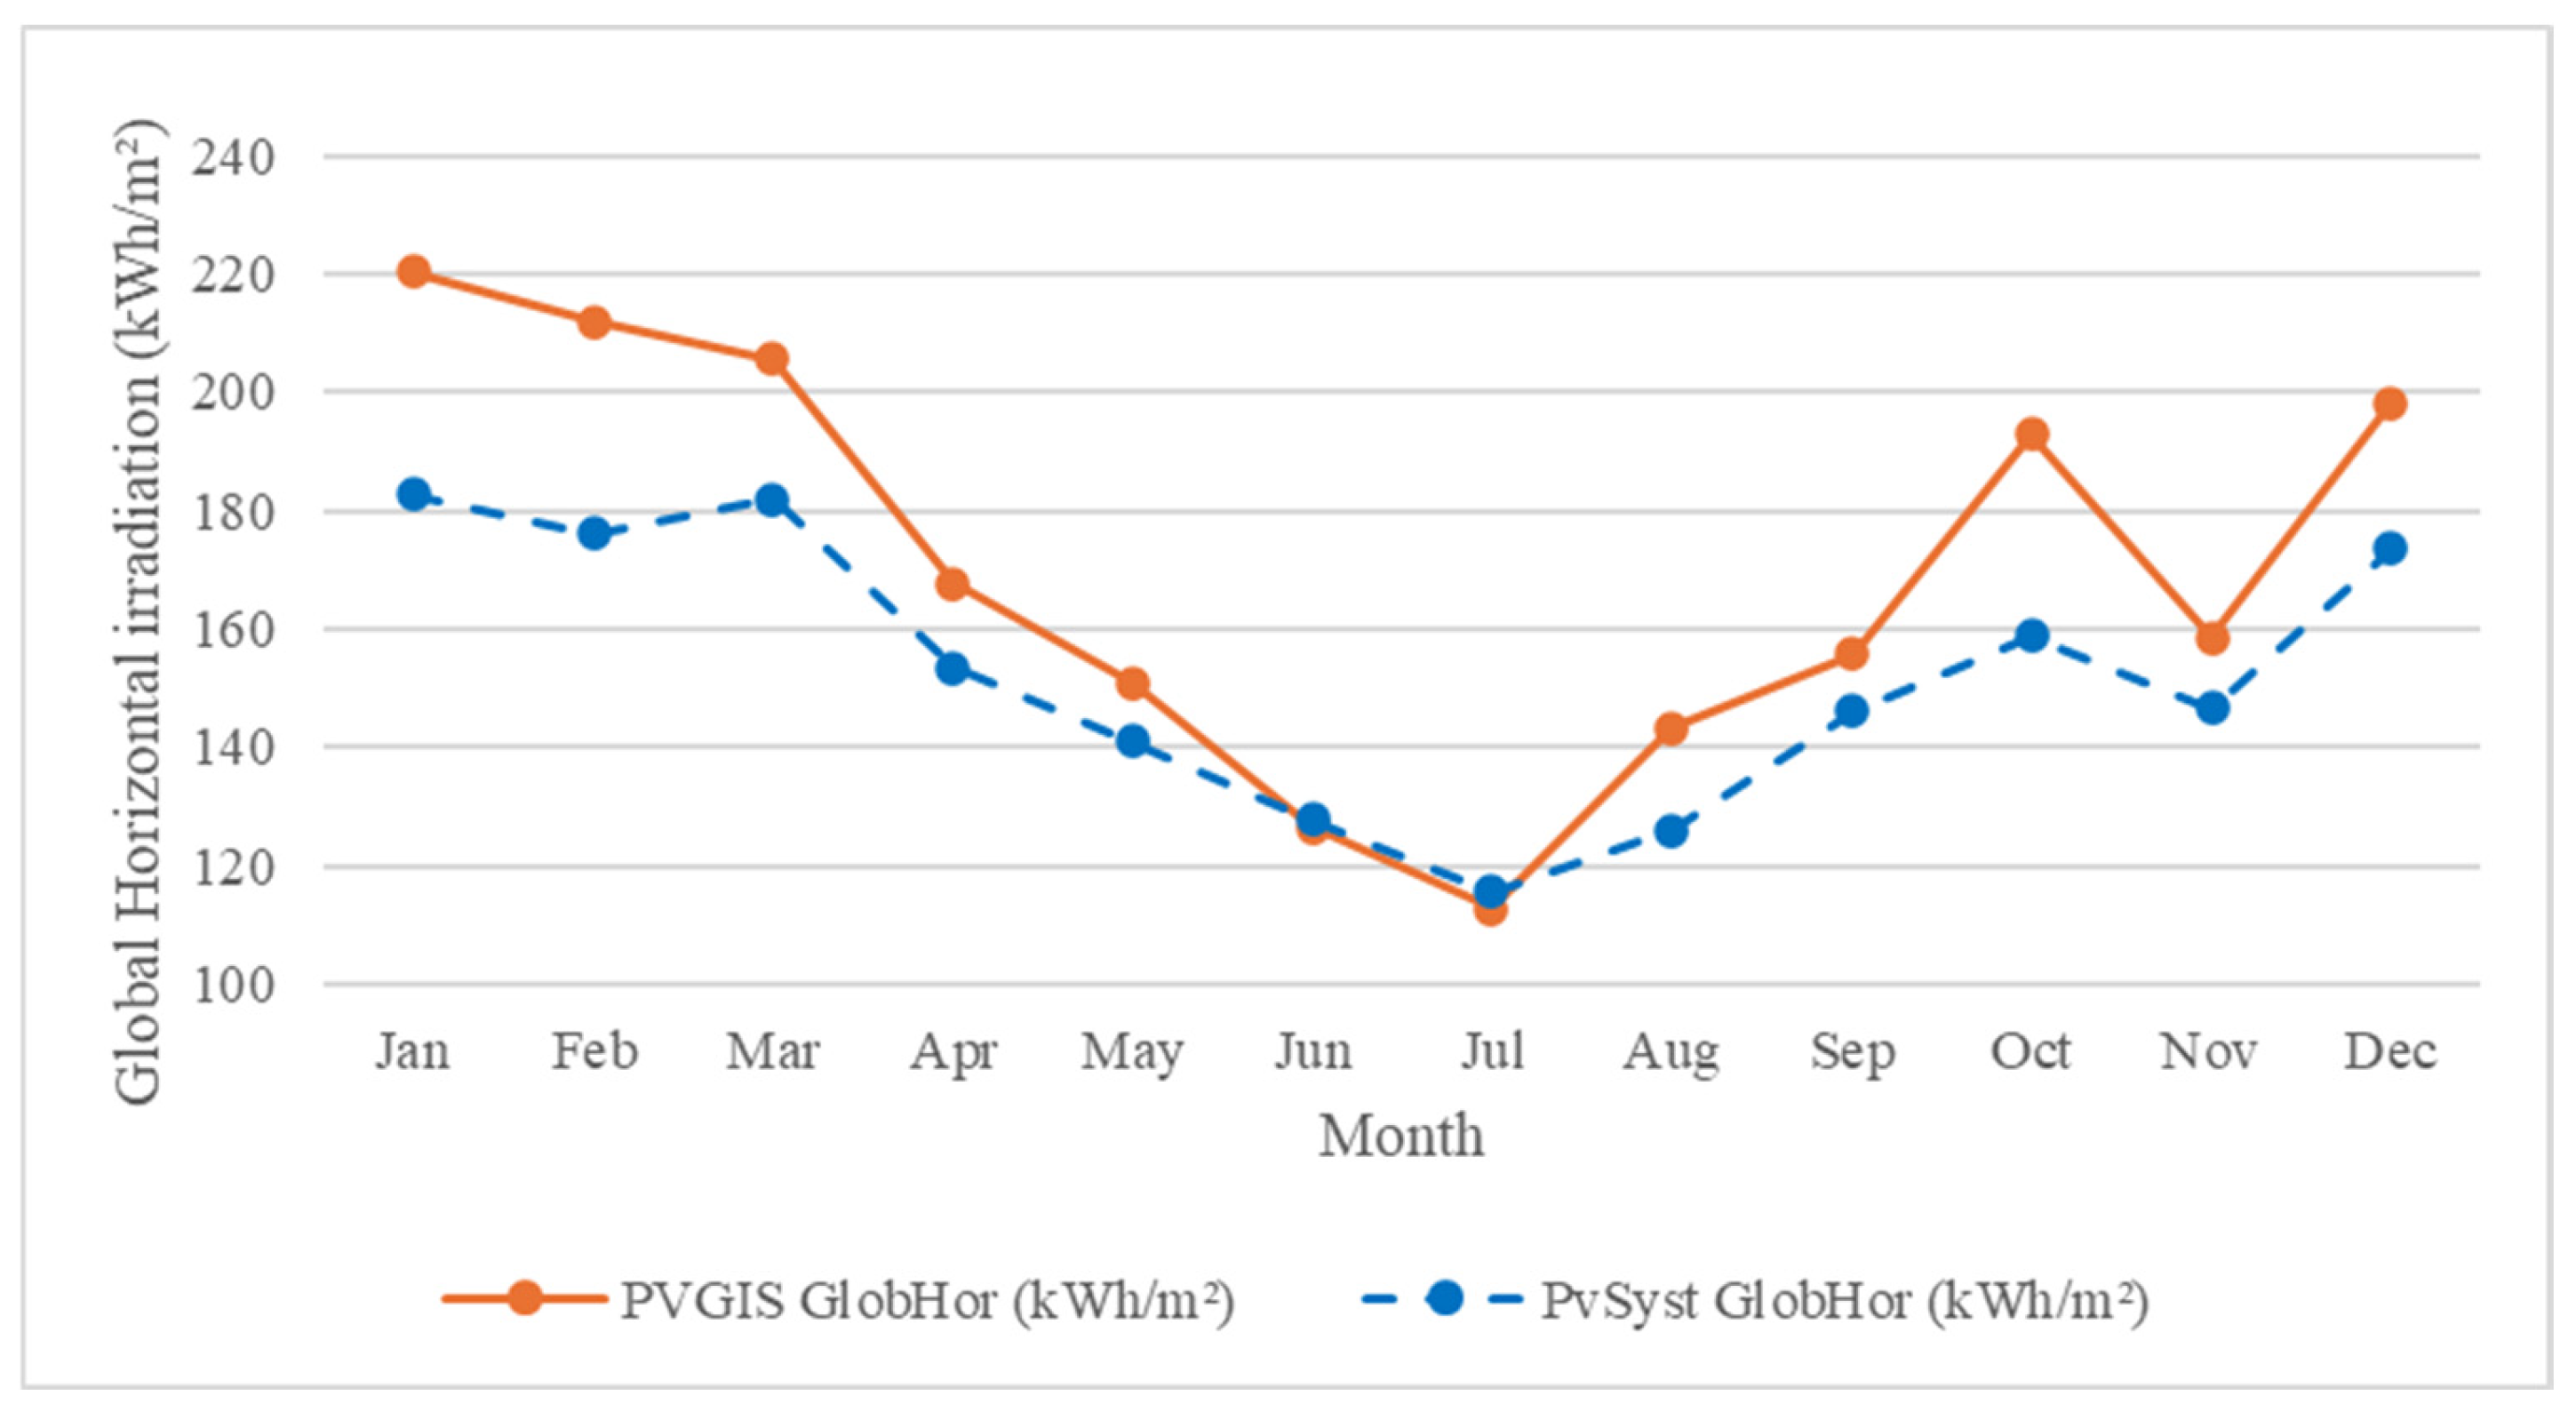
The extracted PVGIS solar resource dataset is summarized in Table 2, while the seasonal irradiation profile is illustrated in Figure 3. These solar resource results are later used in Section 3 to compare irradiation trends with measured energy output seasonality and to clarify whether observed yield limitations arise from solar resource availability or from operational constraints such as export control curtailment.
Table 2 reports PVGIS–SARAH3 monthly Global Horizontal Irradiation (GlobHor) and monthly average ambient temperature at the Nairobi packaging factory coordinates (2023). This independent dataset validates the resource assumptions used in PVsyst simulation.
The PVGIS baseline confirms a clear seasonal pattern: higher Global Horizontal Irradiation values occur in January–March (220–205 kWh/m2), followed by a mid-year trough in June–July (126.44–112.69 kWh/m2), and recovery toward October–December (192.99–198.13 kWh/m2). Ambient temperatures remain moderate (17.7–21.5 °C), which supports efficient PV conversion outside the hottest months. These trends align closely with the PVsyst outputs in Table 1 and Figure 2, reinforcing the reliability of the simulation and explaining the measured generation profile in Figure 4.
Figure 3 compares PVGIS monthly GlobHor with PVsyst GlobHor to verify consistency of resource seasonality between measurement-based and model-based datasets.
From Figure 3, the PVGIS and PVSyst curves exhibit the same seasonal phasing (Jan–Mar peak; Jun–Jul minimum), validating the simulation inputs and the measured generation profile.

2.7. Benchmarking Methodology

To place the performance results in context, the measured indicators derived in this study were benchmarked against previously published research on PV systems in comparable climatic zones and regulatory environments. Benchmark studies include installations in Kenya, Morocco, Malaysia, Senegal, and Uzbekistan. The comparison focuses on final yield, CUF, performance ratio, and general system characteristics, noting that most referenced installations operate without export control restrictions. As such, benchmarking is approached with caution, and differences in regulatory constraints and load-matching conditions are explicitly accounted for to ensure that conclusions drawn are appropriately contextualized.

3. Results

3.1. Solar PV Energy Generation

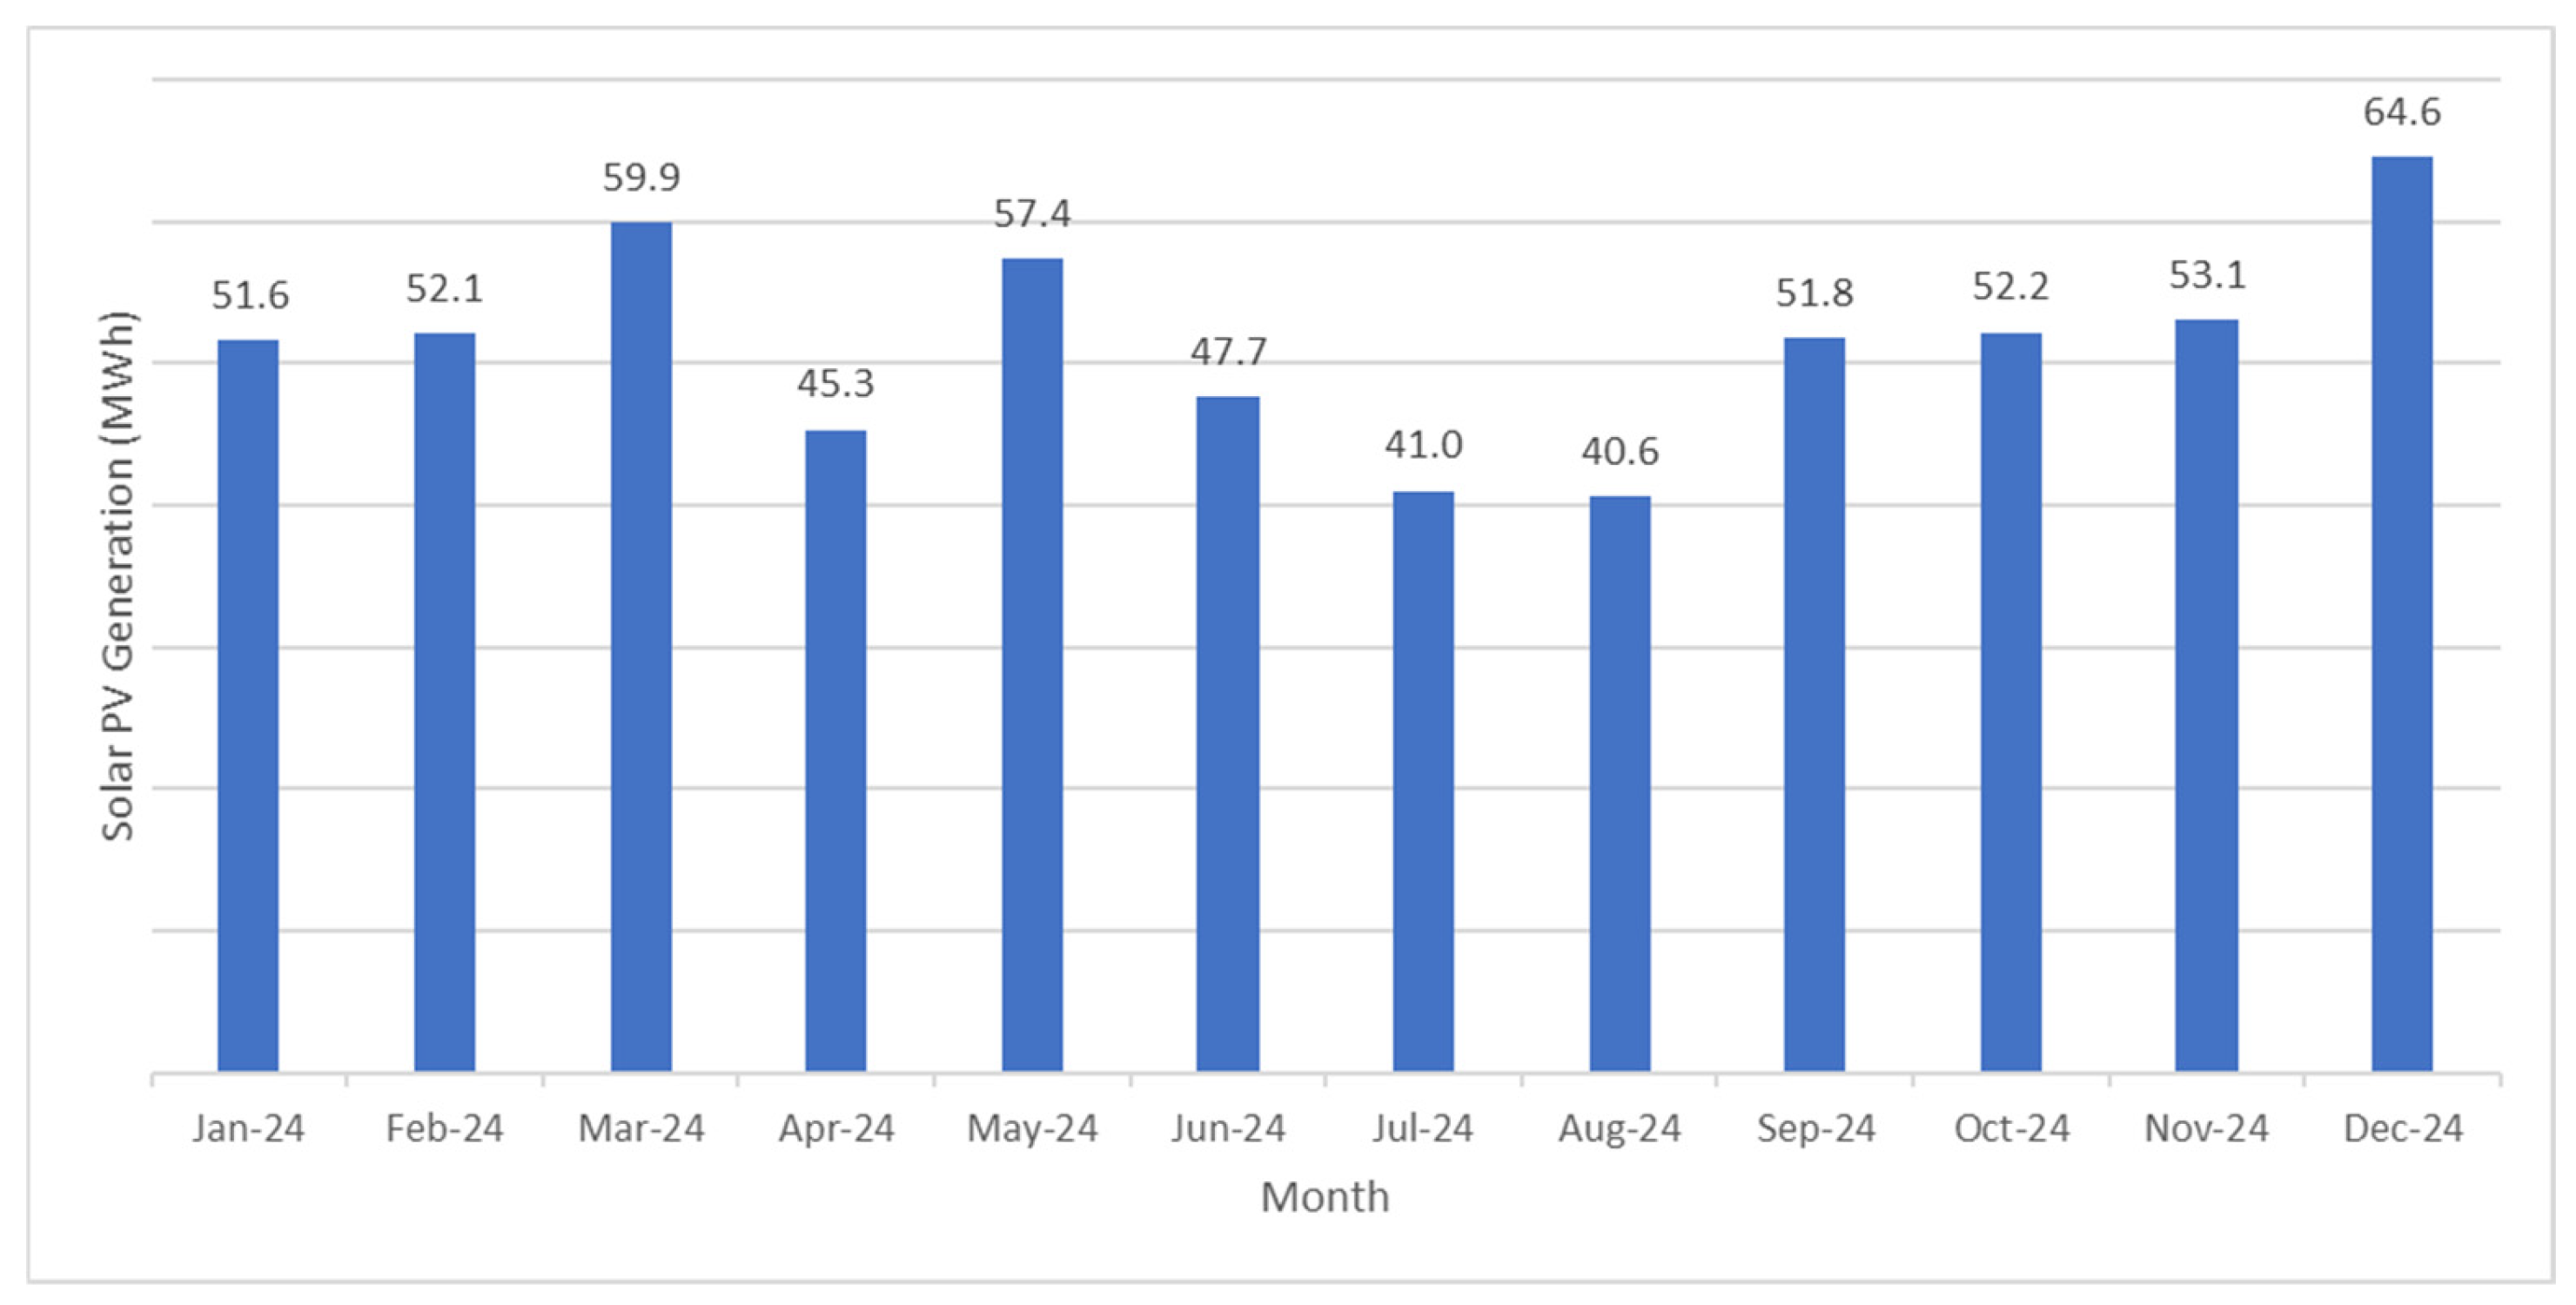
The measured AC energy output of the grid-tied solar PV system over the evaluation period is presented in Table 3, which reports the monthly and annual PV electricity generation based on inverter-level measurements aggregated according to Equation (1). The dataset captures variability arising from seasonal solar irradiance, cloud cover, and the factory’s operating schedules. Data completeness and consistency were verified through inverter availability checks in Sunny Portal and cross-verification against Schneider EcoStruxure imports; periods affected by incomplete records were excluded from KPI computations to preserve accuracy and reliability.
The temporal distribution in Table 3 is illustrated in Figure 4. Figure 4 shows monthly solar PV generation (MWh) from January to December 2024 for the 679 kWp grid-connected plant at the packaging factory. The system produced a total of 617 MWh in 2024. The highest monthly generation occurred in March, May, and December, coinciding with periods of comparatively higher irradiance and optimal system utilization. Lower generation occurred in July and August, attributable to a combination of lower irradiance and curtailment of excess generation by export control during lower production volumes. These seasonal patterns are consistent with the site’s resource baseline from the PVsyst simulation, which indicates annual Global Horizontal Irradiation (GlobHor) of 1830 kWh/m2 with peaks in January–March and minima in June–August, and a modeled performance ratio (PR) of 76.8% [41] and pre-curtailment energy of 1021.7 MWh, as illustrated in Figure 4 and Table 1.
Seasonal variations in solar irradiance significantly influence solar PV output, while export control during low-load periods further constrains utilization. Together, these factors explain the winter-high/mid-year-low pattern in 2024 and suggest that operational measures (load alignment) and curtailment capture (battery storage) can materially improve annual utilization under existing grid-integration constraints [41].
To further strengthen the robustness of the operational evaluation, additional photovoltaic generation data from 2025 were analyzed. The photovoltaic system, commissioned in December 2023 and operational since January 2024, continued operating under the same export control configuration during 2025. The monthly PV generation values for 2025 are summarized in Table 4, providing an additional reference period for evaluating the stability of system performance.
Comparison of the 2024 and 2025 datasets shows consistent annual energy generation and similar seasonal production patterns. The PV system generated 617,160 kWh in 2024 and approximately 615,714 kWh in 2025, indicating stable operational performance across consecutive years. Seasonal variations remain consistent, with higher generation observed during periods of stronger solar irradiance and reduced output during the mid-year months. The similarity between both datasets confirms that the observed PV performance characteristics are representative of the PV installation operating under industrial load-matching and export control conditions. It should be noted that this comparison reflects operational stability rather than long-term performance degradation, which typically requires multi-year monitoring over extended operational periods.

3.2. Final Yield

Using the measured annual AC energy reported in Table 3 and the installed capacity of 679 kWp, the annual final yield was calculated according to Equation (2). The system achieved Y f = 908.9   k W h / k W p y e a r .
To enable comparison with literature benchmarks, the final yield was normalized to a daily basis using Equation (3), resulting in an average daily final yield of 2.49 kWh/kWp·day. These values represent the net energy delivered per unit of installed capacity under actual industrial operating conditions.
As shown in Table 3 and Figure 4, monthly PV energy generation exhibits seasonal variability consistent with fluctuations in solar irradiance and factory operating schedules. These variations directly influence the calculated final yield and highlight the importance of using measured operational data when evaluating PV system performance in industrial environments. Comparable daily final yield values for grid-connected PV systems operating in tropical and subtropical climates typically range between 3.0 and 5.0 kWh/kWp·day [33,34]. While lower values have been reported for unconstrained campus-based and utility-scale systems in similar climates, the difference is primarily attributable to export control curtailment and load-matching limitations, rather than inadequacies in solar resource or system design.

3.2.1. Illustrative Calculation of Final Yield

To demonstrate the derivation of the reported final yield, an illustrative calculation based on measured operational data is presented. During the evaluation year, the solar PV system generated a total measured AC energy output of 617 MWh, as recorded by inverter-level monitoring data from Sunny Portal and summarized in Table 3. The nominal installed capacity of the system is 679 kWp at standard test conditions.
Substituting these values into Equation (2) yields the annual final yield:
Y f = E A C P S T C = 617,160   kWh 679   kWp = 908.9   kWh / kWp · year
When normalized to a daily basis using Equation (3), the average daily final yield is obtained as:
Y f , d a i l y = Y f 365 = 2.49   kWh / kWp · day
This illustrative calculation confirms the procedure used to derive the final yield values reported in Section 3.2. All other performance indicators presented in this study, including the capacity utilization factor and grid-offset contribution, were computed using the same measured operational data and analytical formulations defined in Section 2.5.

3.2.2. Solar Resource Profile and Irradiation Seasonality (PVGIS GlobHor/GHI)

The PVGIS irradiation dataset for the Nairobi site confirms a favorable and relatively stable solar resource throughout the year. The monthly GlobHor/GHI values summarized in Table 2 and illustrated in Figure 3 show that irradiation remains consistently high across most months, with moderate seasonal variation attributable to local rainfall and cloud cover patterns.
When compared to the measured PV energy output trends presented in Table 3 and Figure 4, the irradiation profile exhibits similar seasonality, with higher PV output occurring during months of higher irradiation and reduced output during periods of lower irradiation. This agreement confirms that the measured PV energy generation responds as expected to seasonal resource variability. Importantly, the persistence of relatively high irradiation across the year indicates that the low final yield and CUF values observed in Section 3.2 and Section 3.3 cannot be primarily attributed to inadequate solar resource availability but rather to operational constraints, most notably export control curtailment and load-matching limitations under industrial self-consumption operation.

3.3. Capacity Utilization Factor

The capacity utilization factor (CUF) was calculated using Equation (6), based on the measured annual AC energy output reported in Table 3 and the installed PV capacity.
The resulting CUF of 10.38% reflects partial utilization of the installed PV capacity and is primarily attributable to export control curtailment and load-matching constraints inherent to industrial self-consumption operation. Because Equation (6) directly incorporates measured AC energy output, any curtailed generation is embedded within the CUF value, reinforcing the need for contextual interpretation of this indicator.
In comparison, benchmark installations reported in the literature (such as campus-based and utility-scale PV systems) typically exhibit CUF values ranging between 13.8% and 20.5%. Unlike the Nairobi factory system, most benchmarked installations operate under conditions that allow unrestricted export of excess generation to the grid. Consequently, CUF values reported for unconstrained systems are not directly representative of self-consumption-driven industrial PV installations.

3.4. Performance Ratio

The performance ratio (PR) was formulated using Equation (5), which relates the final yield to the reference yield derived from the plane-of-array irradiance. In the present study, accurate interpretation of PR is constrained by the operational characteristics of the PV system, particularly the presence of export control curtailment, which limits inverter output independently of available solar irradiance.
Under export control operation, periods in which potential PV generation exceeds instantaneous factory demand result in deliberate limitation of inverter output. As a consequence, curtailment losses are embedded within the measured AC energy output, leading to an apparent reduction in final yield that does not correspond to intrinsic system losses such as temperature effects, inverter inefficiencies, or soiling. Calculation of PR using Equation (5) under such conditions would incorrectly attribute curtailment-related losses to intrinsic system inefficiencies rather than to operational constraints imposed by export regulation.
Although representative operating periods were examined using Sunny Portal energy-balance data to identify conditions where factory demand exceeded PV generation, export control curtailment remains a persistent operational characteristic of the system. Consequently, the measured AC energy output does not consistently represent the intrinsic conversion performance of the PV installation. Reporting a single numerical PR value under these circumstances could therefore misrepresent the true technical performance of the PV system.
As a result, PR is not reported as a single annual value but is discussed qualitatively in relation to system stability and operational behavior. Instead, the system was assessed based on operational stability, inverter availability, and consistency of energy delivery during periods of adequate factory demand. Monitoring data confirmed stable system operation without abnormal downtime or excessive internal losses, indicating that observed reductions in energy yield are primarily attributable to curtailment rather than technical underperformance.

3.5. Solar PV Contribution to Factory Energy Demand

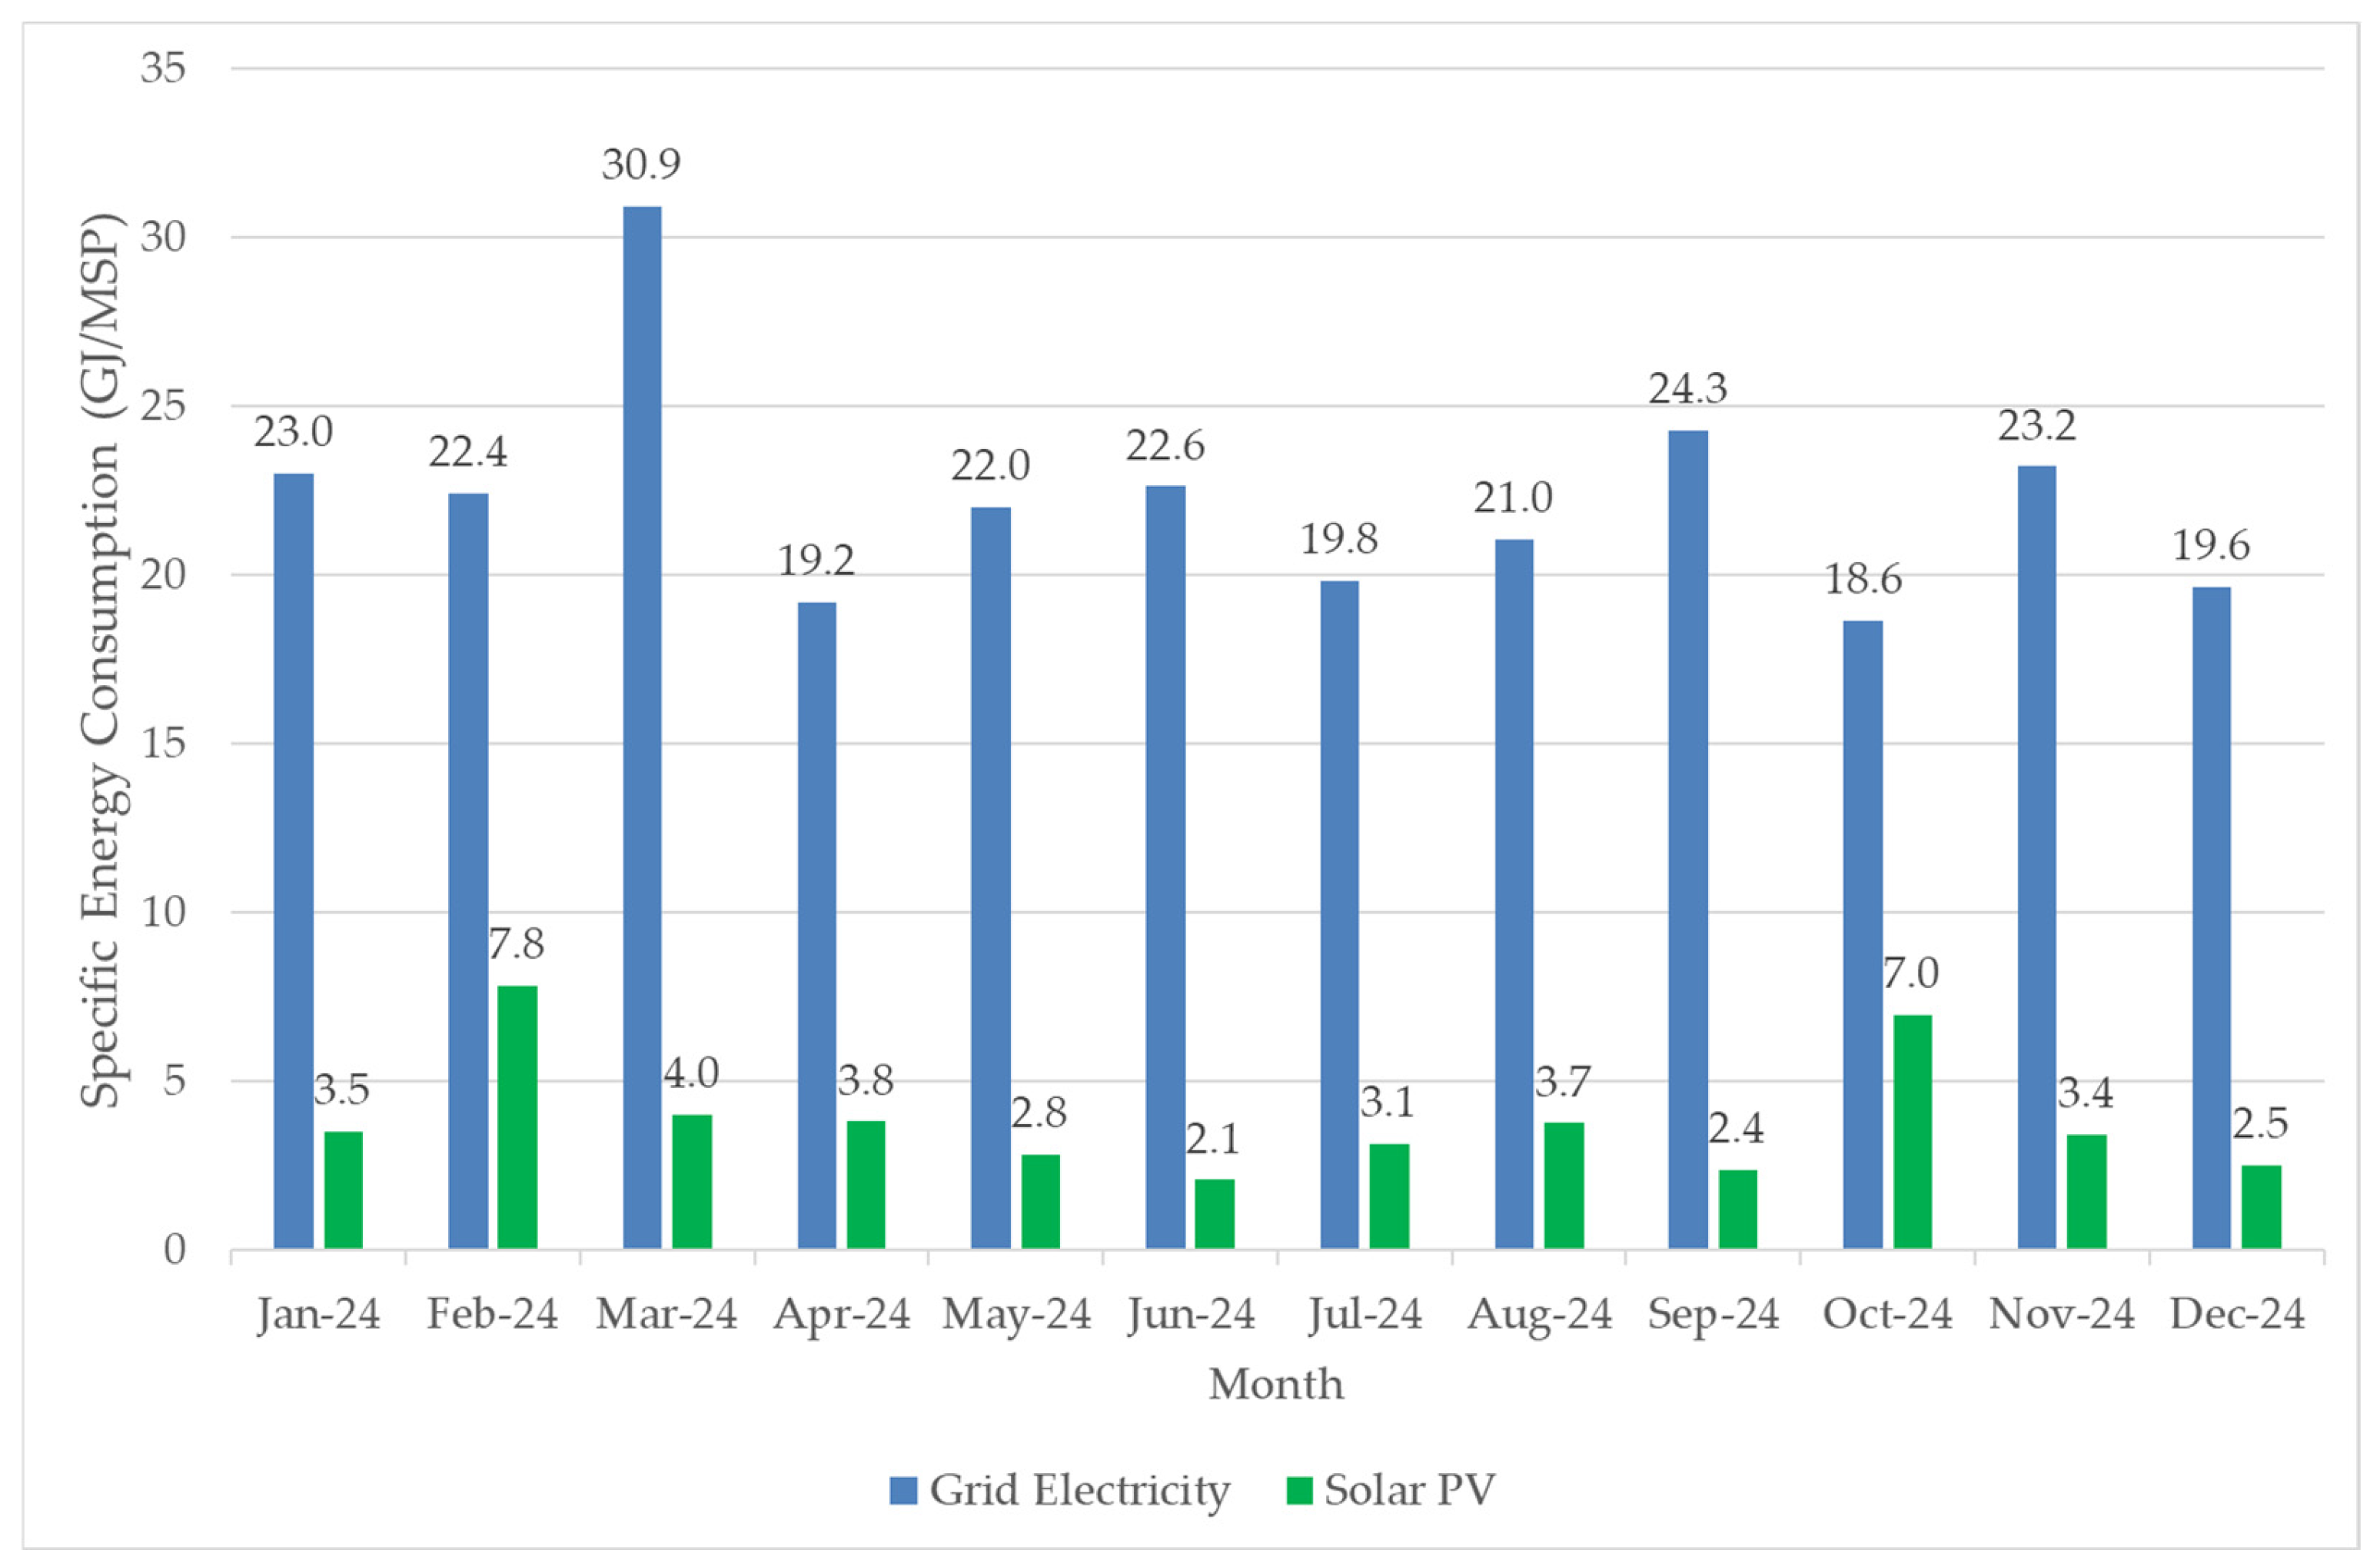
The contribution of on-site PV generation to total factory electricity consumption was assessed using Equation (7) and synchronized Sunny Portal and EcoStruxure measurements. The plant achieved an annual grid offset of 17% during production hours, as illustrated in Figure 5.
Figure 5 compares monthly electricity and solar PV utilization in Giga Joules (GJ) per unit production in million standard packs (MSP) across the 12 months of 2024. Solar PV contributed 46 GJ/MSP compared with 261 GJ/MSP from grid electricity, representing 17% utilization of solar PV. The highest solar energy utilization occurred in March and October 2024, when production volumes were high with good solar insolation levels, whereas months with lower production volumes saw increased curtailment due to export control, reducing the fraction of onsite solar PV consumed.
Solar PV offsets a notable portion of the factory’s energy demand; however, the magnitude of the contribution is constrained by production schedules and export control. Comparative campus/industrial studies show that where load is aligned with the PV profile or export is permitted, annual utilization rises; conversely, under export constraint, curtailment caps achievable contribution unless demand is shifted or storage is integrated [34,35,36].

3.6. Comparative Benchmarking of Performance Indicators

To contextualize the calculated performance indicators, the final yield and capacity utilization factor derived using Equations (2), (3) and (6) were compared against reported values from grid-connected PV installations operating in different climatic and regulatory contexts. It should be noted that direct comparison between installations must be interpreted with caution because the regulatory and operational boundary conditions differ significantly across systems. Many of the benchmarked installations operate under grid conditions that permit unrestricted export of excess generation, whereas the PV system examined in this study operates under strict export control and industrial self-consumption constraints. The benchmark comparison from peer-reviewed studies is presented in Table 5, which summarizes the system size, performance ratio, capacity utilization factor, final yield, and key operational characteristics for selected installations in Kenya, Morocco, Malaysia, Senegal, and Uzbekistan.
As shown in Table 5, benchmark installations generally report higher final yield and CUF values than the Nairobi factory system. However, many of these installations operate under conditions that permit unrestricted energy export or feature more flexible load profiles, such as campus-based or utility-scale systems. In contrast, the Nairobi factory PV system operates under strict self-consumption and export control constraints, which limit effective utilization of available solar generation. When interpreted within this operational context, the observed performance is consistent with expectations for industrial PV installations. Where export is permitted, or load is aligned with PV windows, PR and CUF values improve significantly, highlighting the need for operational strategies such as load shifting and battery storage [12,33,34,36,37].

3.7. Summary of Key Performance Indicators

A consolidated summary of the key performance indicators calculated in this study is presented in Table 6, including annual AC energy output, daily final yield, capacity utilization factor, grid offset contribution, and estimated carbon emissions reduction.
As summarized in Table 6, the PV system delivers meaningful energy and environmental benefits despite operational constraints. The reported indicators form the basis for the interpretation and discussion presented in Section 4.

3.8. Operational Implications

The results highlight that in energy-intensive manufacturing environments, the performance of grid-tied solar PV systems is governed not only by solar resource availability and system design but also by regulatory and operational constraints. Export control curtailment and load-matching limitations can significantly suppress apparent performance indicators such as the CUF and final yield, even when the PV system operates reliably and efficiently.
These findings underscore the importance of integrating solar PV planning with factory load analysis and energy management strategies to maximize utilization and economic benefit.

4. Discussion

4.1. Summary of Key Results

This section summarizes the key performance outcomes derived from the measured operational data presented in Section 3. The grid-tied solar photovoltaic (PV) system with an installed capacity of 679 kWp generated 617 MWh of electrical energy during 2024, corresponding to the first full operational year following commissioning in December 2023. Analysis of the additional operational dataset from 2025, presented in Section 3, indicates a comparable annual generation of approximately 616 MWh, confirming stable PV system performance across consecutive operational years. Based on this measured output for 2024, the system achieved an annual final yield of 908.9 kWh/kWp·year, corresponding to an average daily final yield of 2.49 kWh/kWp·day, and a capacity utilization factor (CUF) of 10.38%.
Analysis of monthly PV generation revealed clear seasonal variability, with higher energy output during periods of increased solar irradiance and higher factory production volumes. Conversely, reduced utilization occurred during months characterized by lower production activity, when export control mechanisms curtailed excess PV generation despite adequate solar resource availability.
The contribution of on-site solar PV to factory electricity demand was quantified through the grid-offset ratio, with PV generation supplying approximately 17% of the plant’s annual electricity consumption during production hours. From an environmental perspective, the measured PV generation resulted in an estimated annual avoidance of approximately 277.7 t CO2, based on the applicable grid emission factor.
Overall, while conventional performance indicators such as final yield and the CUF are lower than those typically reported for unconstrained PV installations, the observed performance is consistent with expectations for an industrial self-consumption system operating under strict export control and load-matching constraints. These results provide the basis for the validation, comparative analysis, and interpretation discussed in the subsequent sections.
The consistency between the 2024 and 2025 datasets further supports the interpretation that the observed PV utilization characteristics are primarily governed by industrial load interaction and export control curtailment, rather than by interannual variability in solar resource availability.

4.2. Validation and Interpretation of Energy Yield and Capacity Utilization

The performance indicators discussed in this section are derived directly from measured operational data using the analytical formulations defined in Section 2.5 and quantified in Section 3. Specifically, the final yield discussed herein is calculated using Equations (2) and (3) based on the measured AC energy output reported in Table 3, while the capacity utilization factor is calculated using Equation (6) and reflects the same measured dataset.
The observed daily final yield of 2.49 kWh/kWp·day and capacity utilization factor of 10.38%, as summarized in Table 5, indicate lower utilization relative to unconstrained grid-connected PV installations reported in the literature. However, as demonstrated by the benchmark comparison in Table 4, higher yields reported for campus-based and utility-scale systems are typically achieved under conditions that permit unrestricted energy export or flexible dispatch, which are not applicable in the present industrial self-consumption context.
In contrast, the Nairobi factory PV system is configured for self-consumption under export control constraints, meaning that PV output is limited by instantaneous factory demand. As a result, potential solar generation during periods of low production activity is curtailed rather than exported, directly reducing measured energy yield and capacity utilization.
These findings confirm that performance indicators such as final yield and the CUF are highly sensitive to load-matching conditions and regulatory frameworks, particularly in industrial self-consumption applications. This indicates that the observed reduction in utilization metrics is primarily a consequence of operational boundary conditions rather than limitations in solar resource availability or PV system design.
The solar resource assessment conducted using PVGIS GlobHor/GHI data provides additional support for this interpretation. As shown in Figure 3, the Nairobi site exhibits consistently favorable irradiation levels across the year, indicating that the solar resource is sufficient to support higher theoretical PV yields under unconstrained operation. Therefore, the observed suppression of yield and CUF metrics is more strongly linked to operational boundary conditions, particularly export control curtailment and industrial load interaction, rather than resource scarcity or system sitting limitations.

4.3. Impact of Export Control Curtailment on Performance Indicators

Export control curtailment emerges as a dominant factor influencing the apparent performance of the PV system. Under curtailment, inverter output is intentionally limited to prevent energy export to the grid, causing measured AC energy to deviate from the potential energy that could be generated based on available irradiance.
This has important implications for performance assessment. Curtailment losses are embedded within measured energy output and therefore affect all derived indicators, including final yield, CUF, and performance ratio. As a result, the conventional interpretation of these indicators, particularly the performance ratio, may lead to misleading conclusions if curtailment effects are not explicitly accounted for.
The findings underscore the need for caution when comparing PR values across studies without accounting for export control conditions. Failure to distinguish between curtailment-related losses and intrinsic system losses may lead to misleading conclusions regarding PV system performance in industrial environments.
The influence of export control curtailment on measured PV system performance is central to the interpretation of the results presented in Section 3. Curtailment occurs whenever potential PV generation exceeds instantaneous factory demand, resulting in deliberate limitation of inverter output despite adequate solar resource availability.
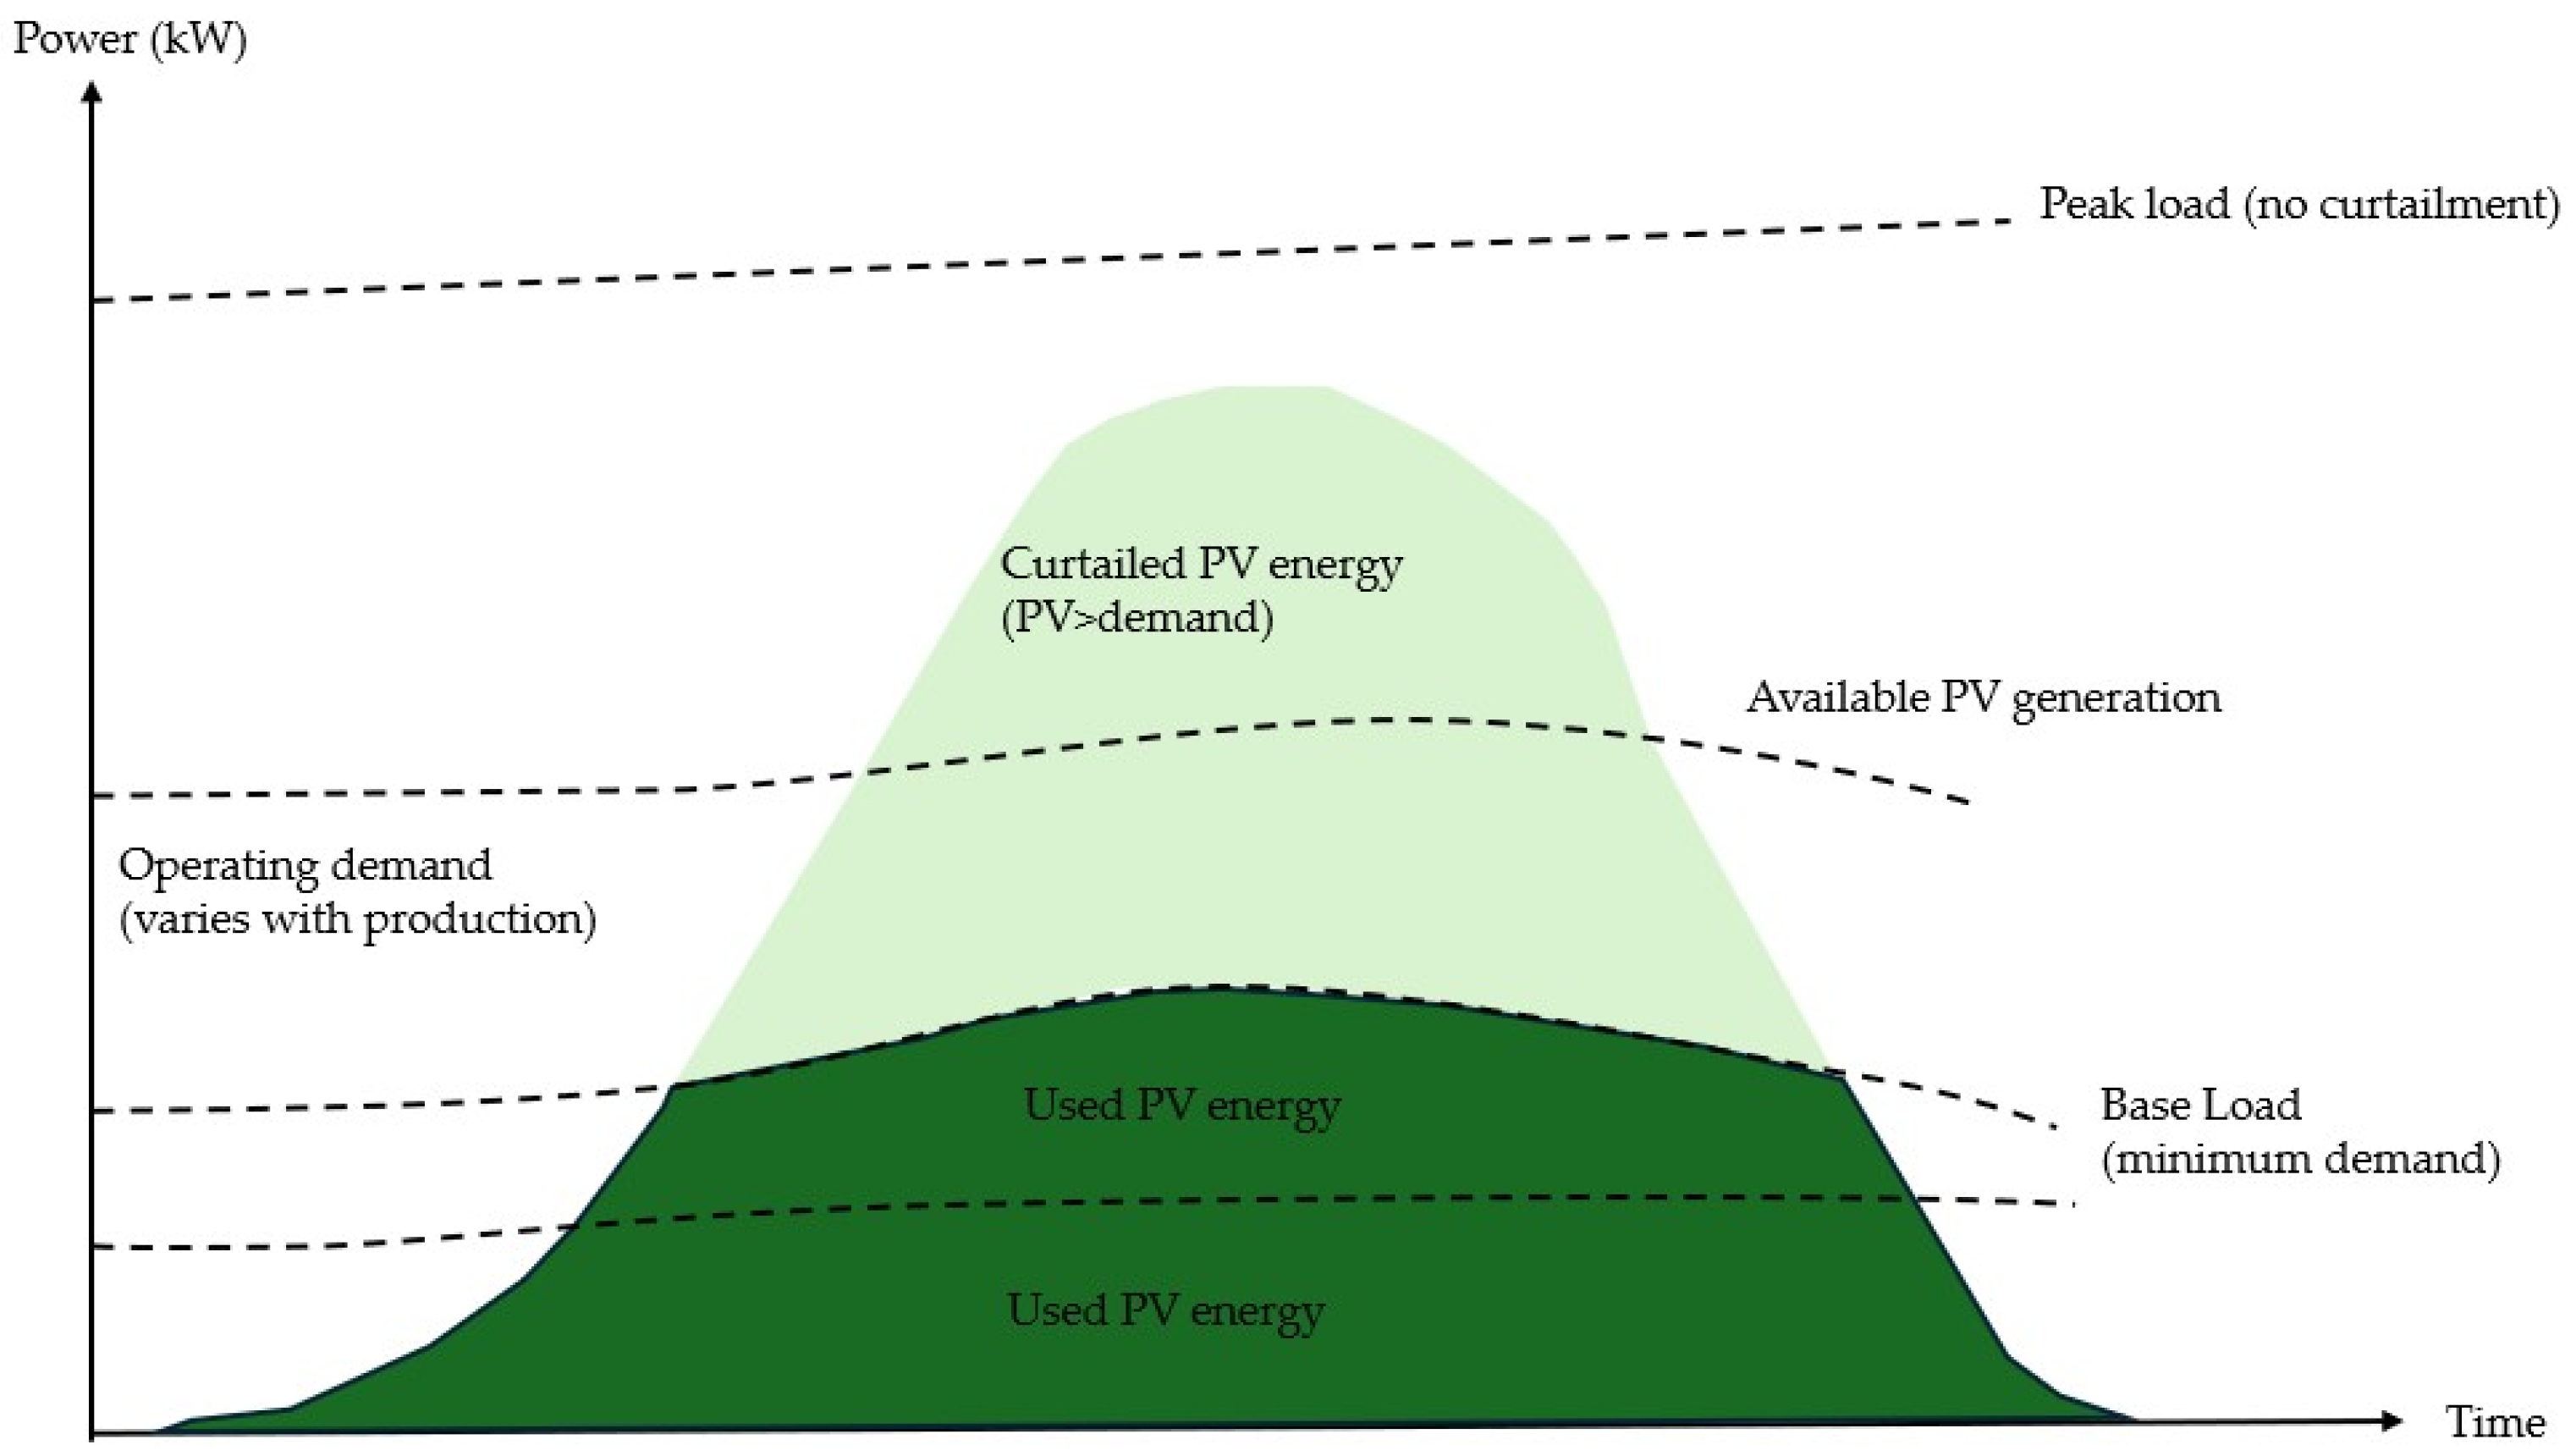
To clarify the effect of export control curtailment on measured performance indicators, a conceptual illustration is provided in Figure 6. When available PV generation exceeds instantaneous factory demand, excess solar PV is curtailed under no export operating conditions.
As illustrated in Figure 6, export control curtailment embeds unused generation within the measured AC energy output reported in Table 3. The performance trends observed can be further understood by examining the interaction between solar generation profiles and industrial load demand. Solar PV output follows the diurnal irradiance pattern, while factory electricity demand varies according to production schedules and operational activities. During periods of high irradiance combined with reduced production demand, PV generation may exceed the instantaneous plant load. Under export control operating conditions, this excess energy cannot be exported to the grid and is therefore curtailed. Consequently, the measured performance indicators reflect the combined influence of solar resource availability, industrial load variability, and regulatory operating constraints rather than intrinsic PV system inefficiency.
Because performance indicators such as final yield and capacity utilization factor are calculated directly from measured AC energy using Equations (2), (3) and (6), curtailed energy manifests as reduced utilization metrics without indicating intrinsic deficiencies in system design or component performance. The observed performance trends can be further understood by examining the interaction between the solar generation profile and the operational load characteristics of the manufacturing facility. Solar PV generation follows the diurnal irradiance pattern, while factory electricity demand varies according to production activity and operational schedules. During periods of high solar irradiance combined with reduced production demand, instantaneous PV generation may exceed the plant’s electrical load. Under the export control operating regime, this excess generation cannot be exported to the utility grid and is therefore curtailed by inverter output limitation. Consequently, measured performance indicators such as final yield and the capacity utilization factor reflect the combined influence of solar resource availability, industrial load variability, and regulatory operating constraints rather than intrinsic PV system inefficiency.
This interaction explains the absence of a representative annual performance ratio in the present study. Although PR is formally defined by Equation (5), the inclusion of curtailment-related losses within the measured AC energy output would result in misleading attribution of performance losses to the PV system itself rather than to operational constraints imposed by regulatory export limits.
Export control curtailment limits the utilization of available solar PV generation whenever instantaneous factory demand falls below potential PV output. Under such conditions, excess generation is curtailed rather than exported, directly suppressing the measured energy yield and capacity utilization factor without indicating intrinsic system inefficiency.
This conclusion is further reinforced by the irradiation validation, which confirms that potential PV output is often higher than utilized PV output during periods of low factory demand, thereby increasing curtailed energy under no-export conditions.

4.4. Comparison with Benchmark Installations

The comparison of the Nairobi factory PV system with reported installations in Kenya, Morocco, Malaysia, Senegal, and Uzbekistan, as presented in Table 4, provides important context for interpreting the observed performance indicators under differing climatic, regulatory, and operational conditions.
While benchmark installations report daily final yields ranging from approximately 3.3 to 4.9 kWh/kWp·day and CUF values exceeding 13%, these systems typically operate under grid conditions that permit energy export or load-independent dispatch. In contrast, the Nairobi factory system operates under strict self-consumption constraints, and its performance metrics, derived using identical formulations, therefore reflect fundamentally different boundary conditions.
By explicitly incorporating these operational differences into the analysis, this study provides a more realistic basis for benchmarking industrial PV systems. The results demonstrate that lower utilization metrics in industrial self-consumption systems do not necessarily indicate inferior system performance but rather reflect differing boundary conditions and optimization objectives.

4.5. Interaction Between PV Generation and Industrial Load Profiles

The interaction between PV generation and industrial load profiles observed in Section 3.5 further reinforces the interpretation of curtailed performance indicators. The grid offset contribution calculated using Equation (7) demonstrates that PV generation is most effectively utilized during peak production hours, when factory demand aligns with available solar output.
Periods of reduced production activity, such as weekends and scheduled maintenance windows, correspond to increased curtailment events and reduced effective PV utilization. These operational characteristics underscore the importance of aligning PV system integration strategies with detailed load analysis in industrial environments. This interaction demonstrates that PV system performance in industrial self-consumption applications is governed not only by solar irradiance availability but also by the operational scheduling of production processes.

4.6. Implications for Energy Management and System Optimization

The performance observed in Section 3 and Section 4 indicates that further improvements in effective PV utilization are more likely to arise from demand-side and operational measures than from increases in installed PV capacity. The results suggest that further improvements in PV system utilization could be achieved through non-storage-based optimization strategies. Enhanced energy management system integration can improve visibility of curtailment events and support informed decision-making regarding load scheduling and process optimization.
Enhanced integration between PV generation monitoring (Sunny Portal) and factory energy management systems (Schneider EcoStruxure), as described in Section 2.4, could support improved visibility of curtailment events and enable informed operational adjustments aimed at increasing solar energy utilization without incurring the capital costs associated with battery energy storage systems. Improved monitoring and data integration allow plant operators to identify periods where potential solar generation exceeds instantaneous factory demand and to implement targeted operational adjustments.
Potential optimization strategies include scheduling energy-intensive processes to coincide with periods of high solar availability, adjusting noncritical loads during low-demand periods, and improving real-time energy awareness among operations personnel. Such operational measures can increase effective PV utilization without requiring additional generation capacity.
While battery energy storage could theoretically mitigate curtailment, its high capital cost and extended payback period currently limit its economic attractiveness for many energy-intensive manufacturing facilities [28]. Consequently, demand-side management and digital energy management integration remain more practical strategies for improving PV utilization under export-restricted operating conditions.
These findings align with the broader industrial energy management literature, which emphasizes the role of load optimization and digital energy management in maximizing the value of on-site renewable energy integration [7,42,43,44].

4.7. Contribution to the Industrial Solar PV Literature

This study contributes to the existing body of knowledge by providing empirical performance analysis of a grid-connected photovoltaic system operating within an energy-intensive industrial manufacturing environment under export control constraints. Unlike many previous studies that focus on residential, campus-based, or utility-scale PV installations, this work integrates PV performance evaluation with industrial load behavior and regulatory operating conditions.
By combining standardized performance indicators, measured operational data, and explicit consideration of export control curtailment, this study contributes empirically grounded insights into the operational dynamics of photovoltaic systems integrated within manufacturing facilities. Unlike studies that focus on unconstrained or idealized PV operation, the present analysis highlights how regulatory export restrictions and load-matching conditions influence commonly used performance indicators.
The findings demonstrate that grid-tied solar PV systems can deliver meaningful electricity cost savings and emissions reductions in industrial settings, even under restrictive export regimes, if performance indicators are interpreted within their appropriate operational context. The results demonstrate that lower apparent yield or capacity utilization metrics in industrial self-consumption systems do not necessarily indicate inferior system performance but rather reflect operational boundary conditions imposed by load demand and export control constraints.
Beyond the specific installation analyzed in this study, the analytical approach presented here provides a framework for interpreting photovoltaic performance indicators in industrial self-consumption systems where PV utilization is constrained by real-time interaction between solar generation, industrial load demand, and regulatory export limitations. As such, the findings offer practical guidance for evaluating and optimizing photovoltaic integration in other energy-intensive manufacturing facilities operating under comparable regulatory and operational conditions.

5. Conclusions

This study evaluated the operational performance of a grid-tied solar photovoltaic (PV) system integrated into an energy-intensive liquid carton packaging manufacturing facility operating under export control constraints. Using measured operational data and standardized performance indicators aligned with IEC 61724-1, the analysis examined system energy generation, utilization behavior, and the influence of regulatory and operational conditions on photovoltaic performance.
The results demonstrate that PV system utilization in industrial self-consumption environments is strongly influenced by the interaction between solar generation profiles, industrial electricity demand, and export control operating regimes. Under such conditions, PV output may be curtailed when instantaneous generation exceeds factory load demand, resulting in reduced apparent utilization metrics. Consequently, conventional photovoltaic performance indicators must be interpreted within the context of operational and regulatory constraints rather than solely as indicators of intrinsic system efficiency.
Benchmark comparison with other PV installations across different geographic and operational contexts further highlights that performance indicators cannot be directly compared without considering variations in system configuration, regulatory frameworks, and load characteristics. In industrial self-consumption systems, performance metrics reflect not only solar resource availability and system efficiency but also the operational boundary conditions governing grid interaction.
The findings confirm that grid-tied solar PV systems can deliver meaningful electricity cost reductions and carbon emission mitigation in energy-intensive manufacturing environments, even under restrictive export control policies. However, effective utilization of solar generation depends strongly on the alignment between PV output and industrial load demand.
From an operational perspective, improving PV utilization in industrial facilities is more likely to arise from demand-side and operational measures rather than further increases in installed PV capacity. Strategies such as aligning energy-intensive processes with periods of high solar availability, improving integration between PV monitoring systems and factory energy management platforms, and implementing operational scheduling approaches can reduce curtailment and improve effective solar energy utilization.
This study is subject to certain limitations. The analysis focuses on a single industrial installation and does not explicitly quantify curtailed energy due to the absence of synchronized high-resolution irradiance and inverter control data. Future research could extend this work by examining PV performance across multiple industrial facilities and regulatory environments and by incorporating high-resolution monitoring data to better characterize curtailment dynamics and optimization opportunities.
Overall, this study contributes an empirically grounded interpretation of photovoltaic performance indicators in industrial self-consumption systems operating under export control constraints and provides practical insight for evaluating and optimizing solar PV integration in energy-intensive manufacturing environments.

Author Contributions

Conceptualization, G.E.O.O.; methodology, G.E.O.O. and M.J.B.K.; software, G.E.O.O.; validation, G.E.O.O. and M.J.B.K.; formal analysis, G.E.O.O.; investigation, G.E.O.O.; resources, G.E.O.O.; data curation, G.E.O.O.; writing—original draft preparation, G.E.O.O.; writing—review and editing, G.E.O.O., M.J.B.K. and O.A.O.; visualization, G.E.O.O.; supervision, M.J.B.K. and O.A.O.; project administration, M.J.B.K. and O.A.O.; funding acquisition, O.A.O. All authors have read and agreed to the published version of the manuscript.

Funding

This work was supported in part by the National Research Foundation of South Africa (Grant number: 131604).

Data Availability Statement

The original contributions presented in this study are included in this article. Further inquiries can be directed to the corresponding authors.

Conflicts of Interest

The authors declare no conflicts of interest.

Abbreviations

The following abbreviations are used in this manuscript:
ACAlternating Current
CO2Carbon Dioxide
CUFCapacity Utilization Factor
DCDirect Current
EFEmission Factor
EMSEnergy Management System
GHIGlobal Horizontal Irradiation
GlobHorGlobal Horizontal Irradiation (PVGIS terminology)
GJGigajoule
IECInternational Electrotechnical Commission
KPIKey Performance Indicator
kVKilovolt
kWpKilowatt-peak
LVLow Voltage
MPPTMaximum Power Point Tracker
MSPMillion Standard Packs
MVMedium Voltage
PCCPoint of Common Coupling
POAPlane of Array
PVGISPhotovoltaic Geographical Information System
PVsystPhotovoltaic System Simulation Software
STCStandard Test Conditions
t CO2Metric Tonnes of Carbon Dioxide
Yf Final Yield
YrReference Yield

References

  1. Szymańska, E.J.; Mroczek, R. Energy Intensity of Food Industry Production in Poland in the Process of Energy Transformation. Energies 2023, 16, 1843. [Google Scholar] [CrossRef]
  2. Corigliano, O.; Algieri, A. A Comprehensive Investigation on Energy Consumptions, Impacts, and Challenges of the Food Industry. Energy Convers. Manag. X 2024, 23, 100661. [Google Scholar] [CrossRef]
  3. Qin, Y.; Horvath, A. What Contributes More to Life-Cycle Greenhouse Gas Emissions of Farm Produce: Production, Transportation, Packaging, or Food Loss? Resour. Conserv. Recycl. 2022, 176, 105945. [Google Scholar] [CrossRef]
  4. World Packaging Market Set for Further Growth. Available online: https://www.smithers.com/resources/2023/november/packaging-market-set-for-further-growth (accessed on 24 October 2025).
  5. Zou, W.; Sun, Y.; Gao, D.c.; Zhang, X. Globally Optimal Control of Hybrid Chilled Water Plants Integrated with Small-Scale Thermal Energy Storage for Energy-Efficient Operation. Energy 2023, 262, 125469. [Google Scholar] [CrossRef]
  6. Khalid, N. Efficient Energy Management: Is Variable Frequency Drives the Solution. Procedia Soc. Behav. Sci. 2014, 145, 371–376. [Google Scholar] [CrossRef]
  7. Perone, C.; Romaniello, R.; Leone, A.; Berardi, A.; Tamborrino, A. Towards Energy Efficient Scheduling in the Olive Oil Extraction Industry: Comparative Assessment of Energy Consumption in Two Management Models. Energy Convers. Manag. X 2022, 16, 100287. [Google Scholar] [CrossRef]
  8. Kabeyi, M.J.B.; Olanrewaju, O.A. Environmental Sustainability of Decentralized Energy Sources. In Proceedings of the 13th IEEE International Conference on Smart Grid, icSmartGrid 2025, Glasgow, UK, 27–29 May 2025; pp. 672–678. [Google Scholar] [CrossRef]
  9. Kabeyi, M.; Australian, A.O. Solar Energy as a Sustainable Energy for Power Generation. In Proceedings of the 2nd Australian International Conference on Industrial Engineering and Operations Management, Melbourne, Australia, 14–16 November 2023. [Google Scholar]
  10. Venugopal, P.M.; Manickam, K.S.; Munimathan, A.; Dhairiyasamy, R. Enhancing Solar Energy Efficiency through Comparative Analysis of Photovoltaic and Hybrid Photovoltaic-Thermal Systems. Sol. Energy Mater. Sol. Cells 2025, 292, 113806. [Google Scholar] [CrossRef]
  11. Wu, J.; Derikvand, M.; Musa, D.A.R.; Sinnah, Z.A.B.; Altalbawy, F.M.A.; AbdulAmeer, S.A.; Toghraie, D.; Alsabery, A.I.; Waleed, I. Thermal Performance Improvement of a Heat-Sink Using Metal Foams for Better Energy Storage Systems. J. Energy Storage 2023, 60, 106663. [Google Scholar] [CrossRef]
  12. Ayora, E.; Munji, M.; Kaberere, K.; Engineering, B.T.-R. Performance Analysis of 600 KWp Grid-Tied Rooftop Solar Photovoltaic Systems at Strathmore University in Kenya. Results Eng. 2023, 19, 101302. [Google Scholar] [CrossRef]
  13. FAQs: Tariff|Kenya Power. Available online: https://kplc.co.ke/faq/tariff (accessed on 2 December 2025).
  14. Tuttle, D. Flexographic printing presses. In Chemistry and Technology of Water Based Inks; Laden, P., Ed.; Springer: Dordrecht, The Netherlands, 1997. [Google Scholar] [CrossRef]
  15. Abeykoon, C.; Kelly, A.L.; Vera-Sorroche, J.; Brown, E.C.; Coates, P.D.; Deng, J.; Li, K.; Harkin-Jones, E.; Price, M. Process Efficiency in Polymer Extrusion: Correlation between the Energy Demand and Melt Thermal Stability. Appl. Energy 2014, 135, 560–571. [Google Scholar] [CrossRef]
  16. Abeykoon, C.; Kelly, A.L.; Brown, E.C.; Vera-Sorroche, J.; Coates, P.D.; Harkin-Jones, E.; Howell, K.B.; Deng, J.; Li, K.; Price, M. Investigation of the Process Energy Demand in Polymer Extrusion: A Brief Review and an Experimental Study. Appl. Energy 2014, 136, 726–737. [Google Scholar] [CrossRef]
  17. Engeland, K.; Borga, M.; Creutin, J.D.; François, B.; Ramos, M.H.; Vidal, J.P. Space-Time Variability of Climate Variables and Intermittent Renewable Electricity Production—A Review. Renew. Sustain. Energy Rev. 2017, 79, 600–617. [Google Scholar] [CrossRef]
  18. Bird, L.; Milligan, M.; Lew, D. Integrating Variable Renewable Energy: Challenges and Solutions; Technical Report NREL/TP-6A20-60451; National Renewable Energy Laboratory: Golden, CO, USA, 2013. [Google Scholar] [CrossRef]
  19. Ye, L.C.; Rodrigues, J.F.D.; Lin, H.X. Analysis of Feed-in Tariff Policies for Solar Photovoltaic in China 2011–2016. Appl. Energy 2017, 203, 496–505. [Google Scholar] [CrossRef]
  20. Mateo, C.; Frías, P.; Cossent, R.; Sonvilla, P.; Barth, B. Overcoming the Barriers That Hamper a Large-Scale Integration of Solar Photovoltaic Power Generation in European Distribution Grids. Sol. Energy 2017, 153, 574–583. [Google Scholar] [CrossRef]
  21. Ahmad, S.; Tahar, R.M.; Muhammad-Sukki, F.; Munir, A.B.; Rahim, R.A. Role of Feed-in Tariff Policy in Promoting Solar Photovoltaic Investments in Malaysia: A System Dynamics Approach. Energy 2015, 84, 808–815. [Google Scholar] [CrossRef]
  22. Ruf, H. Limitations for the Feed-in Power of Residential Photovoltaic Systems in Germany—An Overview of the Regulatory Framework. Sol. Energy 2018, 159, 588–600. [Google Scholar] [CrossRef]
  23. Reddy, A.K.N. Barriers to Improvements in Energy Efficiency. Energy Policy 1991, 19, 953–961. [Google Scholar] [CrossRef]
  24. Leinauer, C.; Schott, P.; Fridgen, G.; Keller, R.; Ollig, P.; Weibelzahl, M. Obstacles to Demand Response: Why Industrial Companies Do Not Adapt Their Power Consumption to Volatile Power Generation. Energy Policy 2022, 165, 112876. [Google Scholar] [CrossRef]
  25. Singh, P.P.; Singh, S. Realistic Generation Cost of Solar Photovoltaic Electricity. Renew. Energy 2010, 35, 563–569. [Google Scholar] [CrossRef]
  26. Kabeyi, M.J.B.; Olanrewaju, O.A. Types of Grid Scale Energy Storage Batteries. In Advances in Clean Energy Systems and Technologies; Part F2329; Springer: Berlin/Heidelberg, Germany, 2024; pp. 181–203. [Google Scholar] [CrossRef]
  27. Kosorić, V.; Lau, S.; Tablada, A.; Sustainable, S.L.-R. General Model of Photovoltaic (PV) Integration into Existing Public High-Rise Residential Buildings in Singapore–Challenges and Benefits. Renew. Sustain. Energy Rev. 2018, 91, 70–89. [Google Scholar] [CrossRef]
  28. O’Shaughnessy, E.; Cutler, D.; Ardani, K.; Margolis, R. Solar plus: A Review of the End-User Economics of Solar PV Integration with Storage and Load Control in Residential Buildings. Appl. Energy 2018, 228, 2165–2175. [Google Scholar] [CrossRef]
  29. Salem, T.; Engineering, E.K.-P. Analysis of Building-Integrated Photovoltaic Systems: A Case Study of Commercial Buildings under Mediterranean Climate. Procedia Eng. 2015, 118, 538–545. [Google Scholar] [CrossRef][Green Version]
  30. Corporate Sustainability Software|Sphera. Available online: https://sphera.com/solutions/environment-health-safety-sustainability/corporate-sustainability-software/ (accessed on 7 August 2025).
  31. Sunny Portal Powered by EnnexOS|SMA Solar. Available online: https://www.sma.de/en/products/energy-management/sunny-portal (accessed on 15 June 2025).
  32. Energy Management Software|Schneider Electric Global. Available online: https://www.se.com/ww/en/work/services/sustainability-business/energy-and-sustainability-software/energy-management-software-resource-advisor.jsp (accessed on 15 June 2025).
  33. Ndiaye, F.; Aidara, M.; Sene, D.; Drame, O.; Ndiaye, M.L. Analysis of Real Performance and Seasonal Prediction of a 23 MWp Grid-Connected Photovoltaic Plant in Senegal: Case of Diass. Energy Sustain. Dev. 2025, 85, 101660. [Google Scholar] [CrossRef]
  34. Eddahbi, H.; Benaaouinate, L.; Khafallah, M.; Energies, A.E.A. Performance Assessment and Analysis of a 1 MW Three-Phase Photovoltaic Power Station Connected to a Factory’s Electrical Grid in Morocco. Energies 2023, 16, 7414. [Google Scholar] [CrossRef]
  35. Ngure, S.M.; Makokha, A.B.; Ataro, E.O.; Adaramola, M.S. Techno-Economic Performance Analysis of Grid-Tied Solar PV Systems under Tropical Savanna Climatic Conditions in Kenya. Int. J. Ambient Energy 2023, 44, 1–16. [Google Scholar] [CrossRef]
  36. Govindarajan, L.; Batcha, M.F.B.M.; Abdullah, M.K. Bin Performance Assessment of Large-Scale Rooftop Solar Pv System: A Case Study in a Malaysian Public University. Discov. Appl. Sci. 2024, 6, 328. [Google Scholar] [CrossRef]
  37. Khikmatov, B.; Mirzaev, M.; Samiev, K.; Khamidov, O. Performance Analysis of 1210kW Grid-Connected Solar Photovoltaic Systems at Bukhara State University. Results Eng. 2025, 26, 105465. [Google Scholar] [CrossRef]
  38. IEC 61724-1:2021; Photovoltaic System Performance—Part 1: Monitoring. International Electrotechnical Commission: Geneva, Switzerland, 2021. Available online: https://webstore.iec.ch/en/publication/65561 (accessed on 26 January 2026).
  39. Muñoz-Rodríguez, F.J.; Snytko, A.; de la Casa Hernández, J.; Rus-Casas, C.; Jiménez-Castillo, G. Rooftop Photovoltaic Systems. New Parameters for the Performance Analysis from Monitored Data Based on IEC 61724. Energy Build. 2023, 295, 113280. [Google Scholar] [CrossRef]
  40. Šúri, M.; Huld, T.; Cebecauer, T.; Dunlop, E.D. Geographic Aspects of Photovoltaics in Europe: Contribution of the PVGIS Website. IEEE J. Sel. Top. Appl. Earth Obs. Remote Sens. 2008, 1, 34–41. [Google Scholar] [CrossRef]
  41. OFGEN Ltd. PVsyst Simulation Report for Nairobi Packaging Factory Site (679 KWp), version 7.2.14; OFGEN Ltd.: Nairobi, Kenya, 2023.
  42. Zan, X.; Wu, Z.; Guo, C.; Yu, Z. A Pareto-Based Genetic Algorithm for Multi-Objective Scheduling of Automated Manufacturing Systems. Adv. Mech. Eng. 2020, 12, 168781401988529. [Google Scholar] [CrossRef]
  43. Ramadan, M.; Salah, B.; Othman, M.; Ayubali, A.A. Industry 4.0-Based Real-Time Scheduling and Dispatching in Lean Manufacturing Systems. Sustainability 2020, 12, 2272. [Google Scholar] [CrossRef]
  44. Plitsos, S.; Repoussis, P.P.; Mourtos, I.; Tarantilis, C.D. Energy-Aware Decision Support for Production Scheduling. Decis. Support Syst. 2017, 93, 88–97. [Google Scholar] [CrossRef]
Figure 1. Single-line diagram of the grid-tied solar PV system and factory power distribution.
Energies 19 02448 g001
Figure 2. Monthly global horizontal irradiation and ambient temperature for the Nairobi packaging factory site.
Energies 19 02448 g002
Figure 3. Comparison of PVGIS and PVsyst monthly global horizontal irradiation (GlobHor) for the Nairobi factory coordinates.
Energies 19 02448 g003
Figure 4. Monthly Solar PV energy generation at the Nairobi packaging factory in 2024.
Energies 19 02448 g004
Figure 5. Monthly specific energy consumption of grid electricity and solar PV at the Nairobi packaging factory.
Energies 19 02448 g005
Figure 6. Conceptual illustration of solar PV export control and energy curtailment.
Energies 19 02448 g006
Table 1. Monthly irradiation, ambient temperature, and AC energy output from PVsyst simulation.
MonthIrradiation
(kWh/m2)
Ambient Temperature
(°C)
Energy Output
(MWh)
Jan182.820.35101.4
Feb176.22197.1
Mar18221.3100.7
Apr153.620.0485.5
May140.919.2879.3
Jun127.817.8972.6
Jul115.617.5465.2
Aug12617.9471.4
Sep14618.8681.7
Oct158.920.2587.6
Nov146.719.282.4
Dec173.619.7396.9
Annual183019.441021.7
Table 2. PVGIS monthly GlobHor and ambient temperature (Nairobi packaging factory coordinates; SARAH3, 2023).
MonthPVGIS GlobHor (kWh/m2)PVGIS T_Amb (°C)
Jan220.3420.5
Feb211.9421.5
Mar205.5420.8
Apr167.6919.2
May150.9719.3
Jun126.4418.8
Jul112.6917.7
Aug143.4318.5
Sep155.8119.7
Oct192.9920.7
Nov158.5518.7
Dec198.1319.1
Table 3. Monthly and annual AC energy generation of the 679 kWp solar PV system (measured 2024 totals, Sunny Portal).
MonthPV Energy (kWh)Avg Daily Energy (kWh/day)
Jan51,5751663.7
Feb52,0831796.0
Mar59,9251933.1
Apr45,3371511.2
May57,3971851.5
Jun47,6641588.8
Jul41,0021322.6
Aug40,5811309.1
Sep51,7791726.0
Oct52,1761683.1
Nov53,0591768.6
Dec64,5822083.3
Total617,160-
Table 4. Monthly and annual AC energy generation of the 679 kWp solar PV system (measured 2025 totals, Sunny Portal).
MonthPV Energy (kWh)Avg Daily Energy (kWh/day)
Jan55,7831799.5
Feb72,3102582.5
Mar56,7691831.3
Apr53,2631775.4
May50,2051619.5
Jun43,1841439.5
Jul40,8411317.5
Aug37,3971206.4
Sep47,8791596.0
Oct53,8801738.1
Nov55,9081863.6
Dec48,2951557.9
Total615,714-
Table 5. Benchmark performance ratio, capacity utilization factor and final yield against peer plants.
Study AreaPV SizePerformance Ratio (%)Capacity Utilization Factor (%)Final Yield (kWh/kWp/day)NotesReferences
Nairobi factory (this study)679 kWpNot reported *10.32.47Export control curtailment
Strathmore, Kenya600 kWp69153.61Relative humidity negative; tilt/orientation[35]
El Jadida, Morocco1 MWp8418.64.5Thermography soiling hotspots[34]
UTHM, Malaysia6.9 MWp77.315.274.23Capture vs. system losses[36]
Diass, Senegal23 MWp64.7–75.813.8–20.493.31–4.91Dry season best[33]
BukhSU, Uzbekistan1.21 MWp65.1511.412.73Heat/dust storms[37]
* PR not reported because export control curtailment embeds unused energy in measured AC output, which would distort the PR indicator.
Table 6. Summary of calculated performance indicators for the Nairobi factory solar PV system.
IndicatorSymbol/FormulaValue
Installed capacityPSTC679 kWp
Annual AC energyEAC617,160 kWh
Final yield (annual) Y f = E A C P S T C 908.9 kWh/kWp·yr
Final yield (daily) Y f , d a i l y = Y f 365 . 2.49 kWh/kWp·day
Capacity utilization factor C U F = E A C P S T C × 8760 , 10.38%
Grid offset (annual) G o f f s e t = E P V E t o t a l × 100 , 17%
CO2 avoided C O 2 , s a v e d = E P V × E F g r i d ,  EFgrid (0.45 kg CO2/kWh)277.7 t CO2·yr−1
Disclaimer/Publisher’s Note: The statements, opinions and data contained in all publications are solely those of the individual author(s) and contributor(s) and not of MDPI and/or the editor(s). MDPI and/or the editor(s) disclaim responsibility for any injury to people or property resulting from any ideas, methods, instructions or products referred to in the content.