Article

Simulation Study on SF6 Circuit Breaker Arc-Extinguishing Chamber Based on Lattice Boltzmann Method (LBM)


1
School of Electrical Engineering, Shenyang University of Technology, Shenyang 110870, China
2
Department of Civil Engineering, Design School, Xi’an Jiaotong-Liverpool University, Suzhou 215123, China
3
Shenyang Transformer Research Institute Co., Ltd., Shenyang 110027, China
*
Author to whom correspondence should be addressed.
Energies 2026, 19(10), 2432; https://doi.org/10.3390/en19102432
Submission received: 30 January 2026 / Revised: 18 March 2026 / Accepted: 24 March 2026 / Published: 19 May 2026

Abstract

The SF6 circuit breaker is an essential piece of high-voltage equipment in ensuring the safe operation of the power grid. Regarding the arc-extinguishing chamber, as the most essential component, its performance is directly related to the breaking capacity of the circuit breaker. This study applies the Double Distribution Function Lattice Boltzmann Method (DDF-LBM), combined with the Smagorinsky sub-grid scale (SGS) model, to systematically simulate the dynamic breaking process of a 252 kV SF6 arc-extinguishing chamber under 50 kA breaking current conditions. Two independent distribution functions are employed to describe the fluid field and the temperature field, respectively, thereby simulating the physical flow–heat coupling process. A dynamic simulation framework is constructed using the D2Q9 model to describe the mechanical motion of the contacts and the fluid flow. The description of contact movement is achieved by dynamically updating the geometric mesh, thereby realizing fluid–solid transformation. The research results indicate that the proposed method can simulate the pressure variation of the fluid field during the breaking process. The value of the Smagorinsky constant (Cs) exhibits a non-negligible influence on the pressure field predictions. The optimal value of Cs = 0.10 is determined through analysis, and the peak pressures at the upstream and throat measurement points reach 1.11 MPa and 1.37 MPa, respectively. Numerical simulations are conducted on the dynamic breaking process of the arc-extinguishing chamber, revealing the evolution of the pressure field upstream of the nozzle and at the throat regions. This study provides new numerical simulation methods for the investigation of SF6 arc-extinguishing chambers and establishes a foundation for the application of the Lattice Boltzmann Method in the field of high-voltage electrical appliances.

1. Introduction

With the global energy transition and the rapid growth in electricity demands, the reliability and efficiency of high-voltage electrical equipment have become key pillars for the sustainable development of the power industry [1,2,3,4,5]. SF6 gas has significant advantages in insulation and arc-extinguishing performance, which has attracted many researchers to conduct in-depth research on SF6 circuit breakers [6,7,8,9,10]. The arc-extinguishing device is responsible for the current interruption and arc extinction processes, thus making the investigation of the arc-extinguishing mechanism especially significant [11]. The multi-physical interactions and chemical reactions during the current interruption process are extremely complex, making it highly difficult to predict the arc characteristics.
Investigations into arc models have been extensively conducted in both experimental and simulation domains. Rüegsegger et al. [12] analyzed the chemical composition of arc exhaust gases in SF6 circuit breakers experimentally, revealing the complex decomposition products generated during the circuit-breaking process. Their findings provided meaningful insights for the development of models. Based on the classic Mayr model, Schavemaker and Van der Sluis [13] proposed a black box model, which can simulate the dynamic characteristics and arc current. The findings demonstrate a significant improvement in simulation accuracy. Brand and Jungblut [14] conducted a series of ion mobility experiments and identified the (9,6,4) potential. Mitchell et al. [15] proposed a two-dimensional laminar model; they applied an adaptive mesh and a controlled amount of artificial diffusion. The results indicated a strong correlation with the experiments. In order to interpret the phenomenon of shunt reactor switching transients, a practical arc model with the function of parameter estimation was established by Chang et al. [16]. Guan et al. [17] proposed an experimental method for measuring the transient gas pressure in 252-kV SF6 circuit breakers. The experimental approach has inherent advantages regarding data accuracy, but there are unavoidable limitations in terms of high costs and measurement difficulties. Lin et al. [18] proposed a numerical model for predicting the dielectric recovery characteristic based on the streamer model. This model allows for the calculation of the temperature and electron density, significantly improving the accuracy and stability of simulations.
For numerical simulation, computational fluid dynamics (CFD) is a classic and important tool for modeling fluid flow dynamics, but it exhibits notable limitations in handling multi-physics-field coupling conditions. Therefore, magnetohydrodynamic (MHD) models on the basis of the standard CFD control equation system have been established, which couple the effects of electromagnetic fields. Zhang et al. [19] described the first attempt to propose a two-dimensional (2D) MHD model for the puffer-type arc-quenching chamber. With the development of research, a three-dimensional transient MHD model has been proposed [20]. This technical improvement facilitates the investigation of the underlying factors influencing arc stability. Furthermore, Wang et al. [21] performed experimental investigations to verify the accuracy and feasibility of the MHD-based simulation of a low-voltage circuit breaker.
Distinct from traditional simulations, the Lattice Boltzmann Method (LBM) is increasingly being recognized as a potential mesoscale approach by researchers. The LBM solves the macroscopic conservation equations by simulating the mesoscopic kinetics of a simplified particle system. This method has attracted extensive attention in the field of fluid mechanics [22,23], as well as in the plasma-jet field [24]. In thermal fluid simulations, a simplified thermal LBM model has been proposed. It achieves an effective balance between computational efficiency and acceptable accuracy [25]. The Double Distribution Function (DDF)-LBM method is capable of simulating argon arc plasmas [26]. In the field of circuit breakers, there are limited investigations so far, but the above studies have indicated its non-negligible potential. Sun et al. [27] applied the LBM to develop an arc model. This method has been proven to effectively simulate the arc process via experiments, and their findings provide a new perspective for the operation of circuit breakers. Cui et al. [28] analyzed the pressure characteristic distribution during the interruption process of a 252 kV SF6 circuit breaker. The researchers concluded that the results showed strong consistency with experimental tests, and they noted considerable potential for further investigation. Capturing transient pressure fluctuations in a SF6 circuit breaker during a 50 kA dynamic breaking process remains a significant challenge. To overcome this, investigating pressure evolution from a mesoscopic perspective is fundamental to understanding the macroscopic breaking performance. Based on the above, this study aims to develop a numerical simulation method for the dynamic breaking process of the SF6 arc-extinguishing chamber based on the Double Distribution Function Lattice Boltzmann Method (DDF-LBM). By solving the distribution functions of the fluid and temperature fields, the challenge of coupling multiple physical fields is effectively addressed. Considering the transient interruption process of the circuit breaker and the high velocity of the gas flowing through the narrow nozzle, the system exhibits strong turbulence. This study introduces the Smagorinsky sub-grid scale (SGS) model to improve the simulation accuracy by adjusting the relaxation time. Furthermore, this article systematically analyzes the influence of the Smagorinsky constant Cs on the simulation results, providing a basis for the selection of Cs values. This work uses the LBM method to simulate the pressure characteristics during the breaking process of the SF6 circuit breaker arc-extinguishing chamber, providing direct technical support for the engineering application of the LBM method in high-voltage electrical appliances.

2. Numerical Methods

2.1. LBE Evolution Equation and DDF Model

This section sequentially introduces the basic details of the mathematical methods used for the purpose of this study. The core numerical approach is based on the Lattice Bhatnagar–Gross–Krook (LBGK) model [22]. This model constitutes a discrete velocity formulation of the continuous Boltzmann equation, which governs the evolution of the particle distribution function f (c, x, t) in phase space.
f t + c · f + F m · c f = Ω
where c is the particle velocity, F stands for the external force, m is the mass of a particle, ∇c refers to the velocity gradient operator, and Ω is the collision operator.
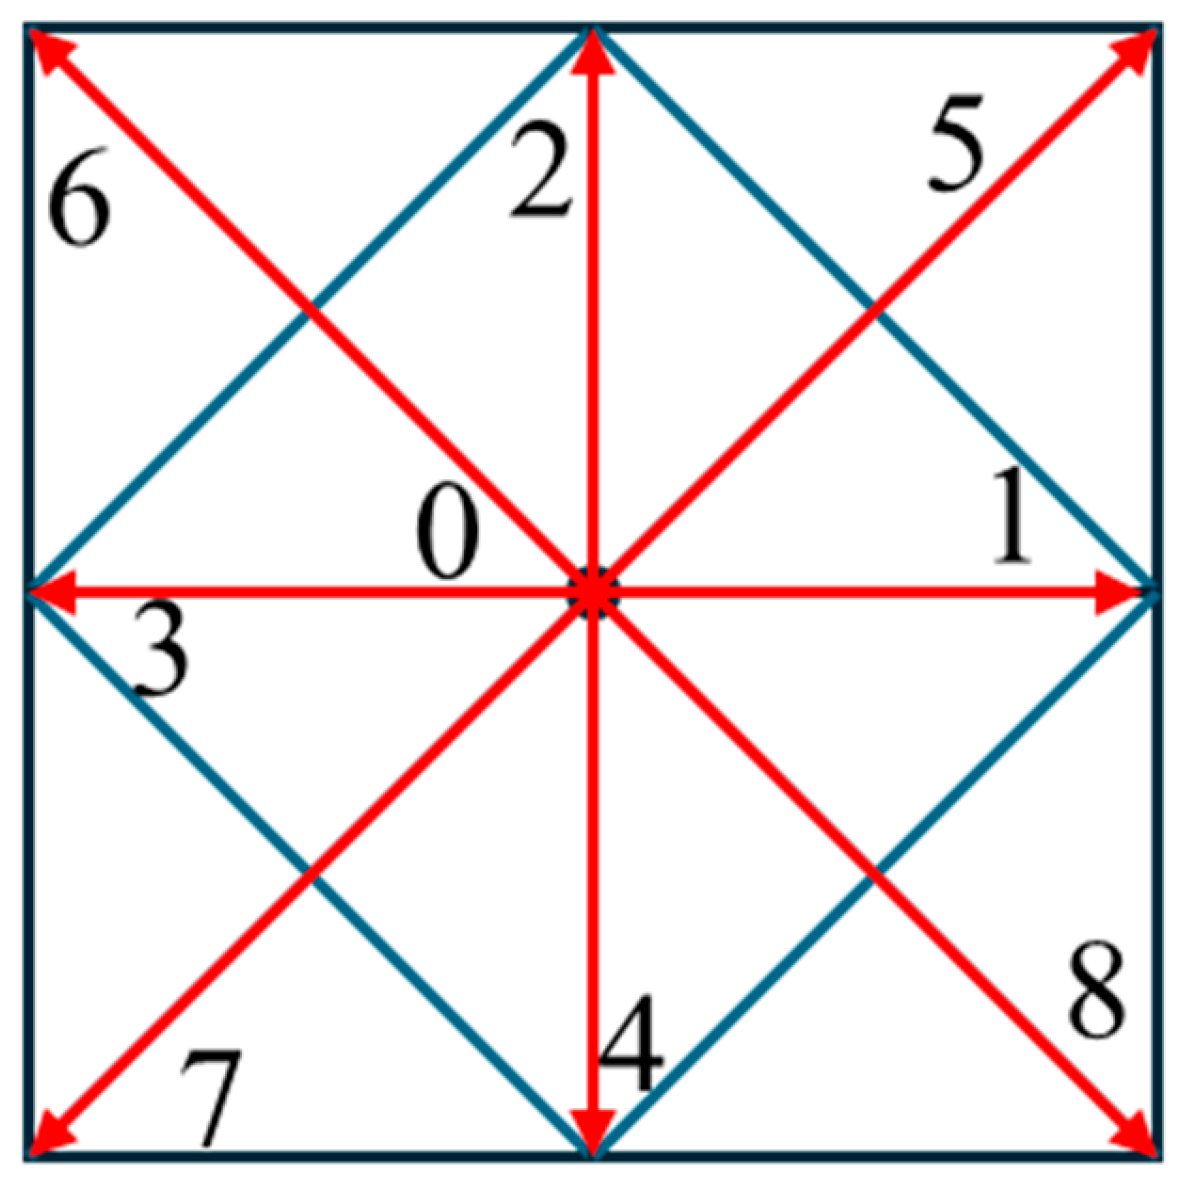
While the core of the conventional LBM addresses mass and momentum conservation, accurately simulating an arc-extinguishing chamber requires the addition of an energy conservation model to capture the intense heating from the arc. The Double Distribution Function (DDF) Lattice Boltzmann Method (LBM) serves as the core numerical framework to simulate the mass and heat transfer of SF6 gas. It enables the efficient and stable simulation of the fluid dynamics and heat transfer processes in the arc-extinguishing chamber. The procedure of this mesoscopic method begins with discretizing the velocity, space, and time. Specifically, the standard two-dimensional (2D) nine-velocity (D2Q9) model is used to simulate the flow by employing nine discrete velocity directions (Figure 1). Figure 1 shows that only nine possible directions (i = 0 to 8) for the movement and collision of fluid particles exist in the LBM, which correspond to the nine points in the square grid. The expression of the discrete velocity vector ei is
e i = { ( 0 , 0 ) i = 0 [ cos ( i 1 ) π 2 , sin ( i 1 ) π 2 ] i = 1 , 2 , 3 , 4 2 [ cos ( 2 i 1 ) π 4 , sin ( 2 i 1 ) π 4 ] i = 5 , 6 , 7 , 8 }
The continuous Boltzmann equation is then transformed into an easily computable discrete lattice Boltzmann equation (LBE) via the Bhatnagar–Gross–Krook (BGK) approximation, which simplifies the collision operator into a relaxation process governed by a single relaxation time. In the BGK model, the particle distribution function is assumed to relax toward its local equilibrium at a rate determined by a single relaxation time. The resulting discrete evolution equation is expressed as
f i ( x + e i t , t + t ) = f i ( x , t ) + 1 τ f [ f i e q f i ] + t · F i
where fi is the flow field distribution function in direction i, τf is the flow field relaxation time, ei is the discrete velocity, fieq is the equilibrium distribution, and Fi represents external forces. The DDF model adopted in this study uses two independent distribution functions: f (for mass and momentum) and g (for temperature). Although both functions evolve according to the BGK collision operator towards their local equilibrium states, they are governed by distinct relaxation times (τf and energy field relaxation time τg) to account for their physical processes, such as viscous dissipation in the flow and heat conduction in the temperature field. The equation used to describe the evolution process of the energy distribution function from the current state gk (x, t) to the next moment gk (x + ekΔt, t + Δt) is
g k ( x + e k t , t + t ) = g k ( x , t ) + 1 τ g [ g k e q g k ] + t · Q k
where Qk denotes the discrete energy source term; it is used to inject the macroscopic volumetric heat generated by the arc into the evolution process of the microscopic distribution function in an appropriate mathematical form. In the loaded case, arc heating is represented by a prescribed equivalent volumetric heat source. The macroscopic source term is defined as
Q ( x , t ) = Q 0 f t ( t ) ϕ ( x )
where Q0 is the reference source magnitude, ft(t) is the time-dependent activation function, and ф(x) is the normalized spatial distribution function of the arc-heating region. In the present implementation, the source starts at t = 15 ms, reaches its maximum at t = 25 ms, and then decreases linearly to zero over the following 10 ms.
f t ( t ) = { 0 ,   t < 15   ms , t 15 10 ,   15   ms t 25   ms , 1 t 25 10 ,   25   ms < t 35   ms , 0 ,   t > 35   ms .
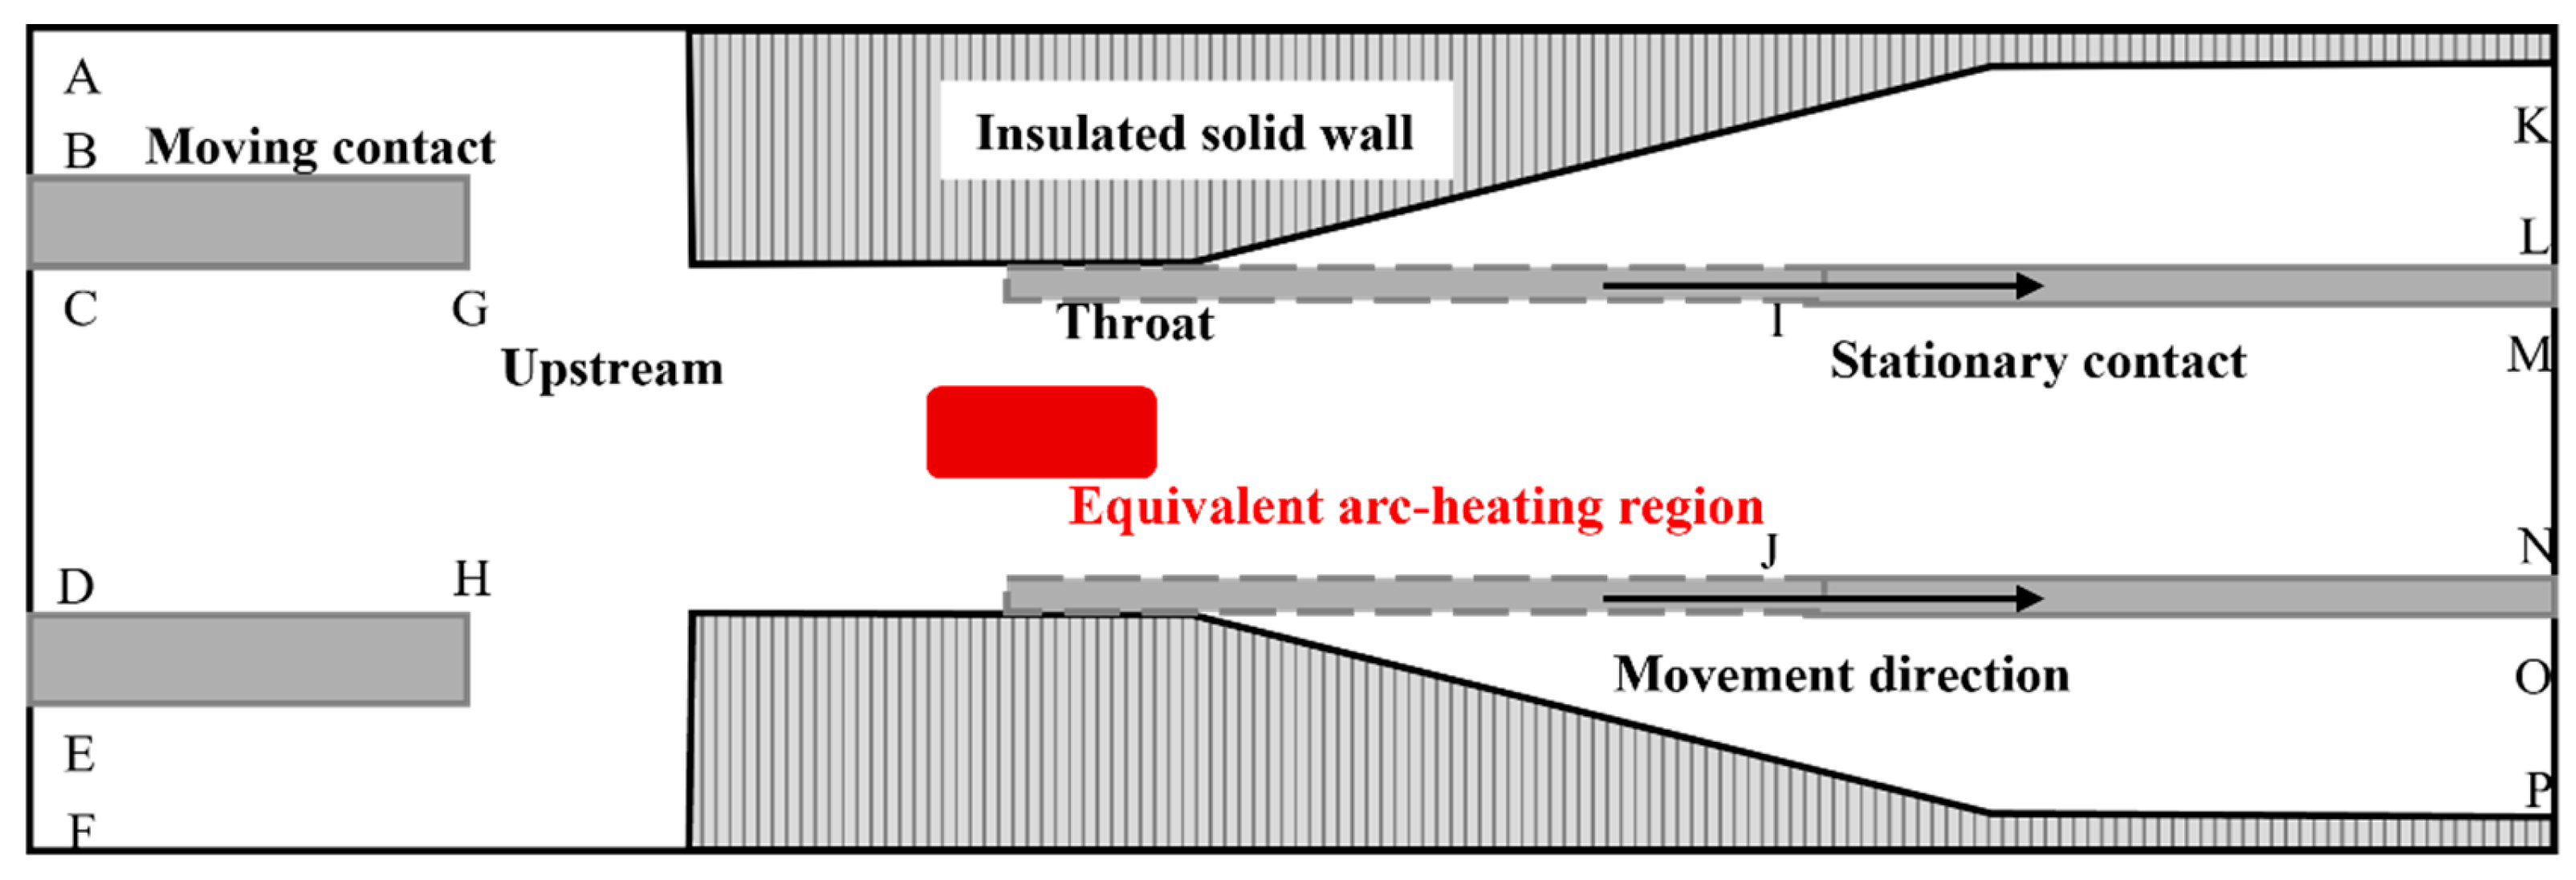
The heat source is applied in the inter-contact/nozzle throat region, as highlighted in Figure 2. In the numerical implementation, spatial deposition is prescribed as a throat-centered Gaussian-type heating region with its center located near the nozzle throat. The source width in both directions is controlled by the same characteristic spread parameter used in code implementation. The peak source magnitude is determined from the equivalent arc power divided by the prescribed arc volume, yielding Q0 ≈ 1.06 × 10¹¹ W/m3. To avoid non-physical overheating, the source magnitude is further limited by an upper bound of 5 × 10¹¹ W/m3 in the numerical implementation. The discrete source term Qk in the DDF-LBM energy equation is constructed from this prescribed macroscopic heat source. Therefore, the loaded case results should be interpreted as the thermo-fluid response of the interrupter under an imposed equivalent arc-heating condition. The thermal balance in a circuit breaker arc is governed by the difference between the Joule heat generated by the high current flowing through the plasma resistance and the radiant heat energy radiated from the high-temperature plasma to the surroundings. The equilibrium distribution function is expressed as
f i e q = ρ ω i [ 1 + ( e i u ) θ s 2 + ( e i u ) 2 2 θ s 4 u 2 2 θ s 2 ]
g i e q = T ω i [ 1 + ( e i u ) θ s 2 + ( e i u ) 2 2 θ s 4 u 2 2 θ s 2 ]
where u is the macroscopic velocity; ωi denotes the weight coefficients (standard D2Q9 model: 4/9 for the center, 1/9 for axial directions, 1/36 for diagonal directions); θs is the lattice speed of sound; and ei is the discrete velocity vector. In the DDF-LBM, the equilibrium distributions fieq and gieq are directly computed from macroscopic quantities (density ρ, velocity u, and temperature T) using low-order expansions of the Maxwell–Boltzmann distribution. By applying the Chapman–Enskog expansion to fi and gk, the LBE recovers the macroscopic continuity equation ( ρ t + · ( ρ u ) = 0 ), Navier–Stokes momentum equation ( ( ρ u ) t + · ( ρ u u ) = P + · ( τ ) + F ), and convection–diffusion energy equation ( T t + u T = α 2 T + Q ).

2.2. Macroscopic Reconstruction

The macroscopic physical quantities of density ρ, velocity u, and temperature T are reconstructed by the following equations:
ρ = i f i
ρ u = i f i e i
T = k g k
The coupling of the DDF-LBM is primarily reflected in the feedback and driving mechanisms of key parameters. For instance, the flow velocity u is substituted into the equilibrium distribution function gieq, and the thermal field counteracts the fluid field from dynamically calculating τf and ρ, thus achieving comprehensive thermal–flow coupling. It should be noted that the standard LBM is inherently constrained to low-Mach-number and low-compression regimes. The SF6 arc-extinguishing process involves intense localized heating that induces severe thermal expansion and density variations. In this study, the localized high-compression effects can be reasonably approximated without violating the core Chapman–Enskog expansion stability to ensure the validity of the DDF-LBM framework.

2.3. Dynamic Physical Properties

In Equations (3) and (4), the relaxation times τf and τg are significant parameters that control the viscosity ν and thermal diffusion coefficient α, enabling them to adapt to the real-time changes in the arc-extinguishing chamber environment.
τ f = ν c s 2 t + 0.5
τ g = α c s 2 t + 0.5
where cs is the lattice sound velocity, equal to 1 3 . The established LBM framework enables the real-time verification of the viscosity and thermal diffusivity within the arc-extinguishing chamber by detecting changes in ρ and T that affect the relaxation time τf and τg values, thereby ensuring physical fidelity. Since the ideal gas law is not applicable to SF6 under high-temperature and high-pressure conditions, the transportation coefficient β is incorporated to modify its behavior for non-ideality:
P = ρ R T / β
where R is the gas constant. Using this equation, the changes in the temperature field are fed back in real time to the pressure gradient, thereby driving the evolution of the airflow field. The coefficient β serves as a reference mapping factor to reconcile the real gas behavior with the lattice isothermal EOS. In this study, β is expressed as a constant based on the initial reference state to simplify the model:
β = R T r e f c s 2
where Tref is the reference temperature. This ensures that the lattice pressure evolution is consistent with the physical pressure at the reference temperature, while allowing the model to effectively capture macroscopic pressure wave propagation.

2.4. Smagorinsky Sub-Grid Scale (SGS) Model

Large eddy simulation (LES) is a turbulence simulation method. In order to capture the turbulence within the arc-extinguishing chamber, an explicit Smagorinsky sub-grid scale (SGS) model is implemented by dynamically updating the local relaxation time in this study. Therefore, the Reynolds number (Re), as an important indicator, is calculated during the simulation process to detect turbulence. Based on the Smagorinsky model, the eddy viscosity correction method is applied to transform the dissipative effect of turbulence into an effective viscosity νeff that varies in space and time. It is expressed as
ν e f f = ν + ν t
where ν and νt indicate the molecular viscosity and the turbulent eddy viscosity, respectively. The value of νt is related to the strain rate tensor (S), which is calculated using a formulation derived from the Smagorinsky model:
ν t = ( C S ) 2 | S |
where CS is the Smagorinsky constant, determined as 0.1; Δ is the lattice filter width, which is equal to 1.0. S is used to describe the deformation rate of the fluid, indicating the symmetrical part of the gradient tensor of the fluid velocity field. The definition is
S = 0.5 ( u + ( u ) T )
Therefore, the local strain rate tensor is synchronously calculated based on the current macroscopic velocity u. Since the viscosity is directly related to the relaxation time in the LBM, the effective relaxation time τeff is
τ e f f = ν e f f c s 2 t + 0.5
Then, injecting Equation (16) into Equation (19), we obtain
τ e f f = 3 ν t t + ( 0.5 + 3 ν t ) = 3 ν t t + τ f
In the collision process, the value of τeff directly governs the evolution of fi, thereby allowing the turbulence model to indirectly influence the dynamic physical properties and the energy field gi.

3. Modeling Methodology

3.1. Geometric Model

The arc-extinguishing chamber of a 252 kV SF6 circuit breaker with a breaking current of 50 kA is simulated in this study. Referencing [27], a simplified geometric model (shown in Figure 2) with dimensions of 220 mm × 72 mm is manually constructed to represent the physical arc chamber domain. The blank area is the calculation area, the moving and stationary contacts are displayed as grey rectangles, and the insulated wall is three-sectioned (with annotations in Figure 2). The areas AB and EF are gas inlets, and CD, MN, KL, OP, are gas outlets. To ensure numerical accuracy and resolve the steep pressure gradients near the nozzle throat, a global grid refinement factor of 2 is applied, resulting in a fine mesh of 440 × 144 grids in total. This results in uniform physical lattice spacing of Δx = 0.5 mm. The physical dimensions are scaled by a refinement factor to convert millimeter units into grid indices.
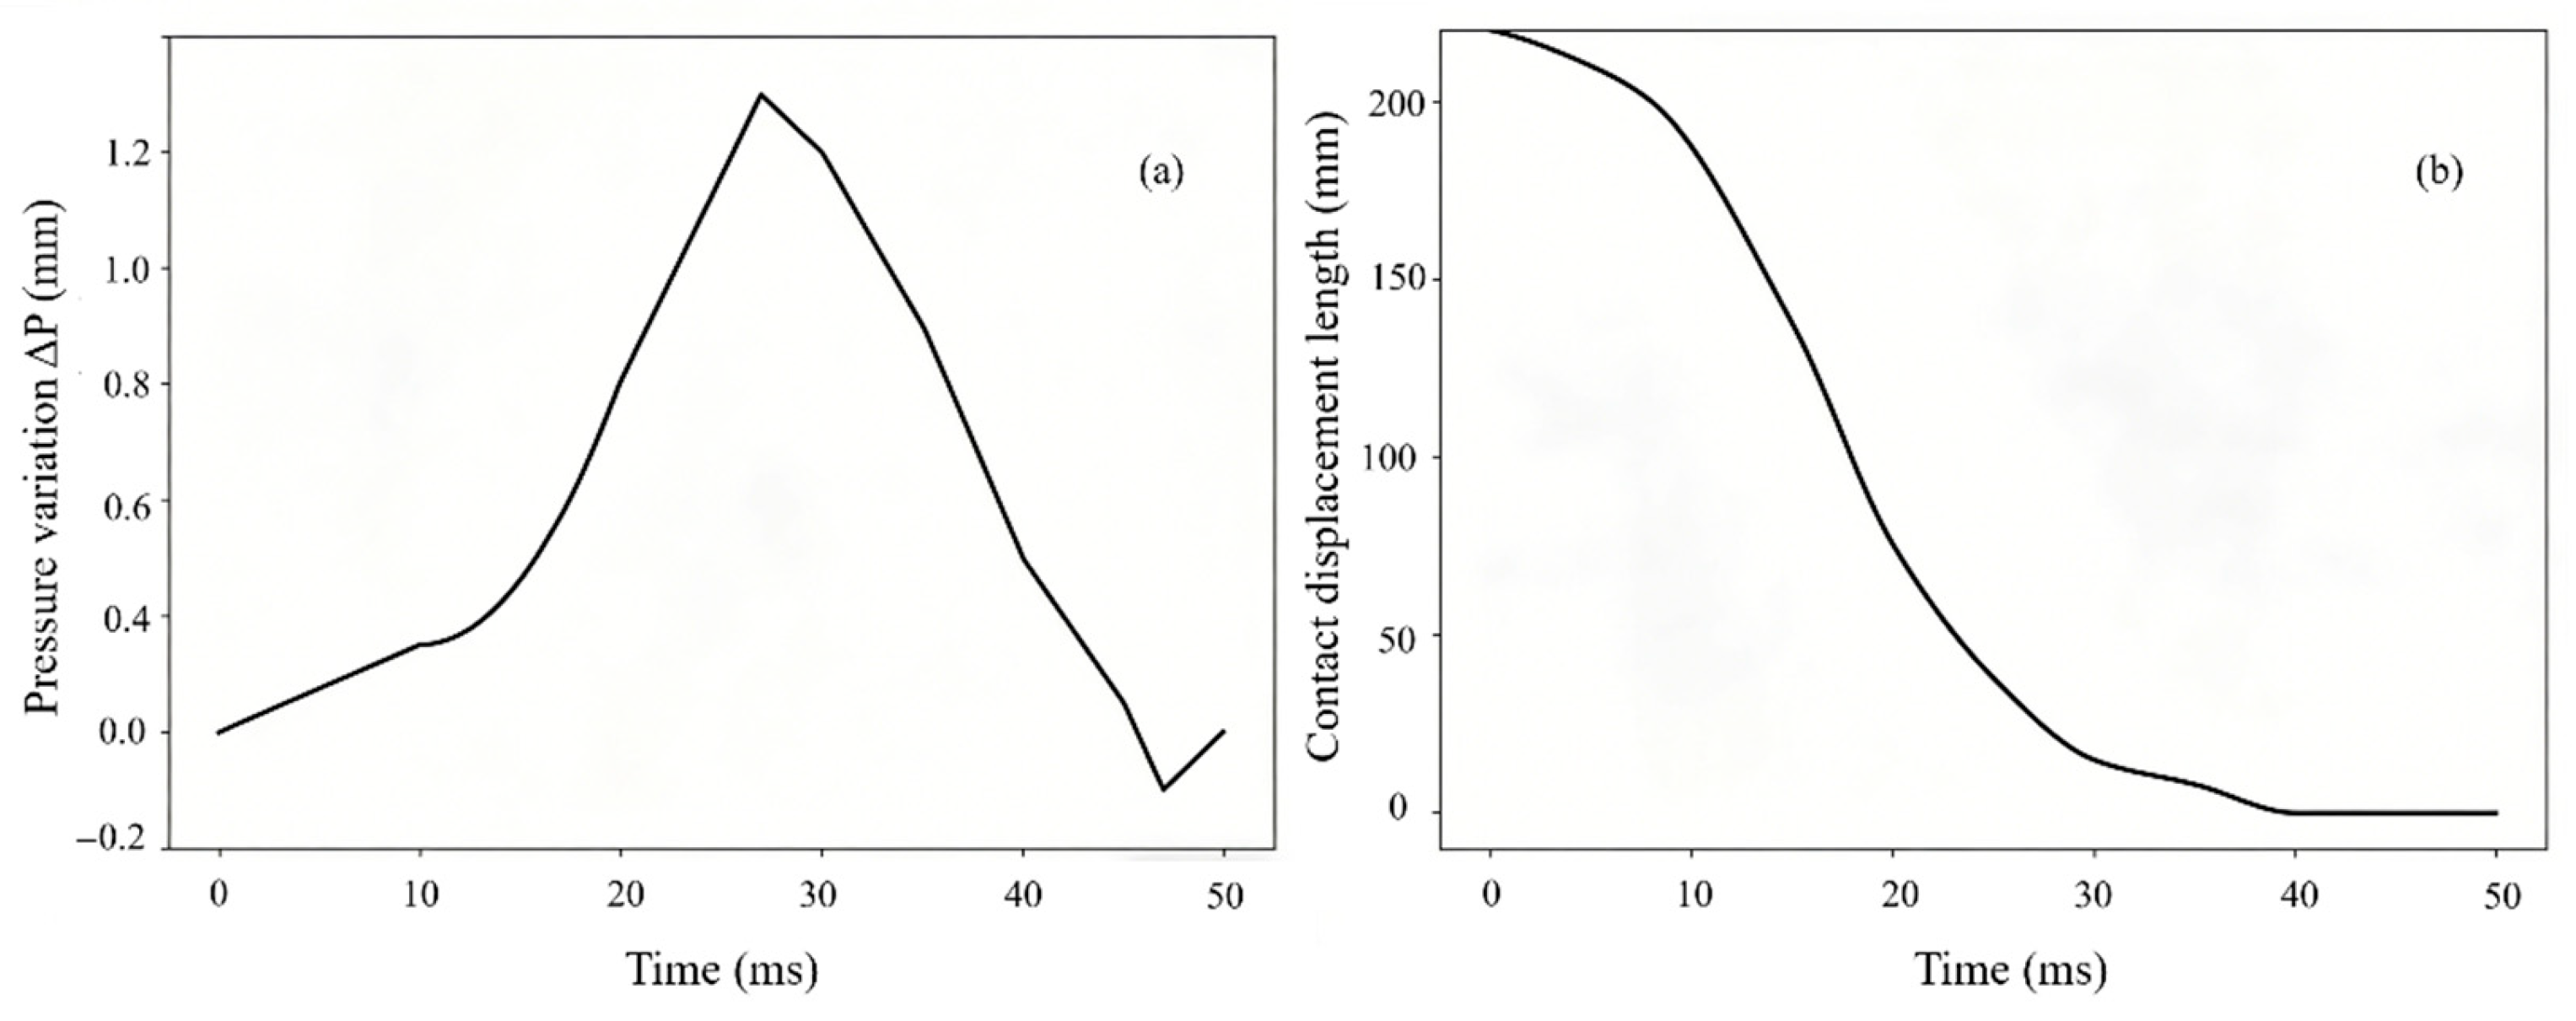
In SF6 circuit breaker simulations, the geometric structure evolves in real time with the separation motion of the contacts. Considering the relative motion in the arc-extinguishing chamber, this simulation models the breaking process by changing the length of the stationary contacts (from 220 mm to 0). This movement directly changes the boundary shape and flow channels of the fluid domain. In the LBM, the numerical labels 0 and 1 are implemented to distinguish between fluid regions and solid boundaries, respectively. Initialized as an (Nx × Ny) NumPy array, the computational domain is filled with a default value of 0. Solid structures, including the stationary insulating walls and moving contacts, are generated through array slicing and geometric operations. The stationary contacts are modeled as two rectangular blocks located within a specific range of y coordinates, and the x position is updated over time based on a specified motion curve (in Figure 3) for the simulation of the breaking process of the circuit breaker. In addition, Figure 3 provides the pressure variation curve of the gas inlet over time.

3.2. Initialization and Simulation Workflow

The initial conditions for the arc-extinguishing chamber are defined by the physical properties of the SF6 gas under standard operating conditions, with pressure of 0.7 MPa and a temperature of 300 K. The key thermophysical properties of SF6 are as follows: the specific gas constant RSF6 = 56.9 J/(kg·K), the kinematic viscosity ν = 2.56 × 10⁻⁶ m2/s, the adiabatic sound speed cs = 137.03 m/s, and the thermal diffusivity α = 1.0 × 10⁻⁴ m2/s. To bridge the physical domain and the lattice domain in the LBM framework, dimensional scaling factors are employed for accurate mapping while ensuring numerical stability. The physical parameters are converted to lattice units via scaling factors:
L r = L p h y s L l u
u r = c s θ s
Lr is the length scaling factor; it converts physical lengths (Lphys) to lattice grid units (Llu). ur is the velocity scaling factor, and the value of the lattice sound speed θs is constant, equal to 1/√3. In addition, the velocity scale multiplier Ur is set to bridge the physical and lattice domains; it is expressed as
U r = U p h y u l a t t
where Uphy denotes the characteristic physical velocity, and ulatt is the corresponding velocity in lattice units. In this study, ulatt is determined as 0.1. This strategy ensures that the value of ulatt throughout the computational domain remains significantly lower than θs. Consequently, the maximum local lattice Mach number (Ma = |ulatt|/cs,latt) is effectively suppressed, ensuring that the simulation remains within the stable, weakly compressible regime. The time-scaling factor is calculated based on Equations (21) and (22):
t r = L r u r
Density conversion is expressed as
ρ r = ρ ρ
where ρ is the lattice unit (=1), and ρ′ is the physical density, derived from the equation ρ = p 0 R S F 6 T .

3.3. Boundary Conditions

This simulation employs the DDF approach, which governs the momentum and energy fields via two distinct distribution functions. To ensure physical fidelity, boundary conditions must be consistently defined for both fields. In the context of circuit breaker analysis, specifically for current interruption and arc quenching, various boundary conditions are considered along the flow path to meet the requisite physical constraints. Accordingly, the following sections will address the boundary conditions for the fluid and energy fields separately, following the flow path.
For the pressure boundary, a time-dependent Zou–He pressure boundary is implemented at the inlet to simulate the compression of SF6 gas by the puffer cylinder. This provides the primary driving force for the gas blast via the equation P = ρ c s 2 . The Mei–Luo–Shyy (MLS) method is implemented to simulate the motion of the contacts. It dynamically updates the moving boundary and ensures proper momentum exchange between the solid contacts and the fluid field. The no-slip bounce-back boundary condition is used for the solid wall area; it reverses the momentum of fluid particles at the boundary, resulting in zero macroscopic velocity at the wall. At the outlet zone, the gradient extrapolation boundary condition is applied. It simulates the state downstream of the arc-extinguishing chamber leading to the atmosphere and allows the pressure waves and gas flow to exit the domain without non-physical reflections.
The energy boundary condition manages the dissipation of arc-generated heat and governs the energy exchange between the hot plasma and the surrounding cold gas. To simulate the cooling mechanism of the circuit breaker, an isothermal boundary is applied at the inlet, maintaining a constant ambient temperature of 300 K to represent the injection of fresh, cold SF6 gas. Conversely, the nozzle walls and electrode surfaces are modeled as adiabatic boundaries, reflecting the assumption that heat conduction into the solid materials is negligible during the transient 50 ms quenching process. It is worth mentioning that, although the arc region is not a spatial boundary, the arc effect is represented by a prescribed equivalent volumetric heat source coupled to the energy field. The mathematical definition of this source term is provided in Section 2.1.

4. Results and Analysis

The simulation results of the dynamic fluid field in the SF6 circuit breaker arc-extinguishing chamber are presented in this section. The LBM was adopted as the numerical methodology to simulate the complex interruption process. The explicit SGS model was employed to capture the turbulence effect to improve the simulation’s stability and the accuracy of the transient compressible flow. Sensitivity tests of the Smagorinsky constant CS were also conducted to investigate the influence on the magnitude of the sub-grid-scale (SGS) viscosity.

4.1. Validation Strategy

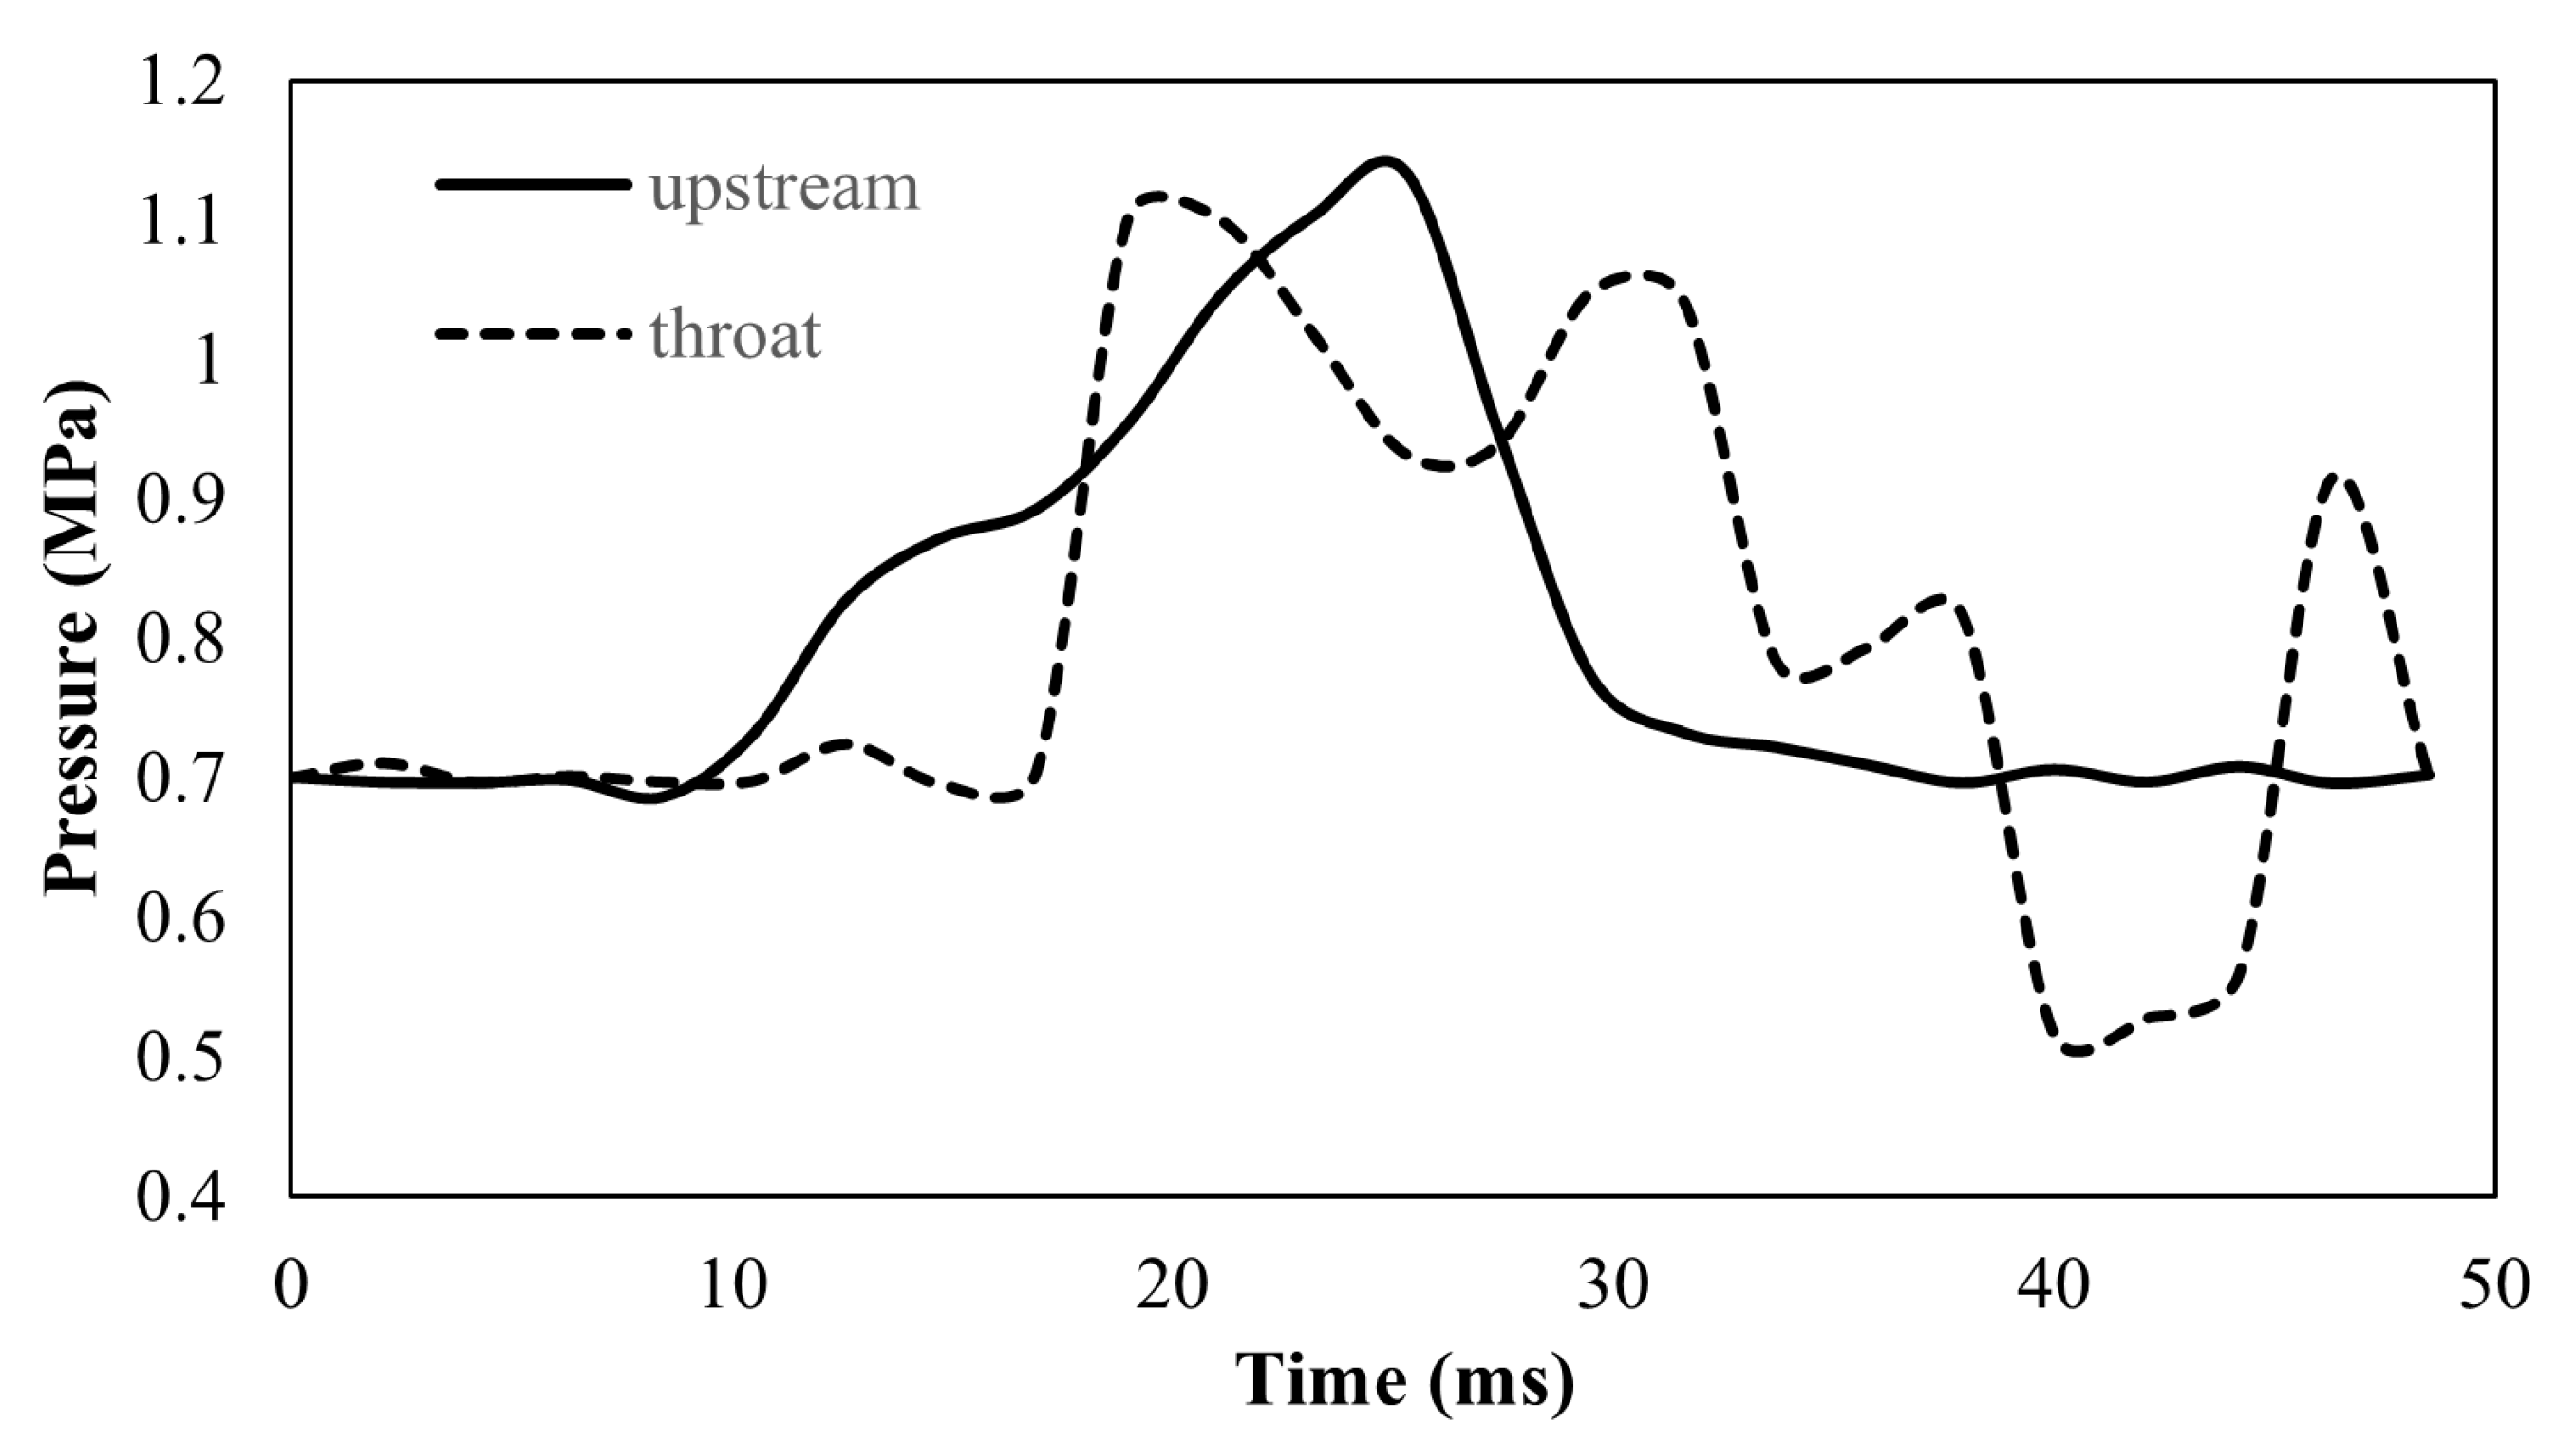
In this section, the simulation results of the generated model are compared with the experimental results [17]. To verify the correctness of the numerical implementation and the boundary condition treatment, simulations were first conducted under no-load conditions, where arc-induced heating and the thermo-fluid coupling effects are not considered. Table 1 shows the pressure characteristics of the peak pressure upstream of the nozzle and nozzle throat measurement points. The mean absolute percentage error is calculated as 8.81%. This deviation is acceptable for validating the feasibility of the simulation model. Figure 4 shows the simulation results of the LBM upstream of the nozzle and the nozzle throat of the arc-extinguishing chamber during the no-load interruption process. It can be seen that the initial pressure of the system remains stable, with the pressure at both observation points maintained at approximately 0.7 MPa (absolute pressure). Then, the upstream pressure exhibits a relatively smooth and monotonous upward trend, reaching a global maximum (1.13 MPa) at about 25 ms, while the pressure at the throat increases more significantly and exhibits obvious fluctuations at the peak value (1.10 MPa). After this, the contact distance further increases, and the gas in the jet is fully released, causing the upstream pressure to decrease and eventually return to the base pressure state. The numerical simulation results capture the key physical phenomena during the no-load breaking process, including the initial contact separation, the post-nozzle opening, and the late nozzle-opening stages. This process indicates that the basic flow solver and moving boundary treatment are correctly implemented.

4.2. Effect of Smagorinsky Constant on Pressure Evolution

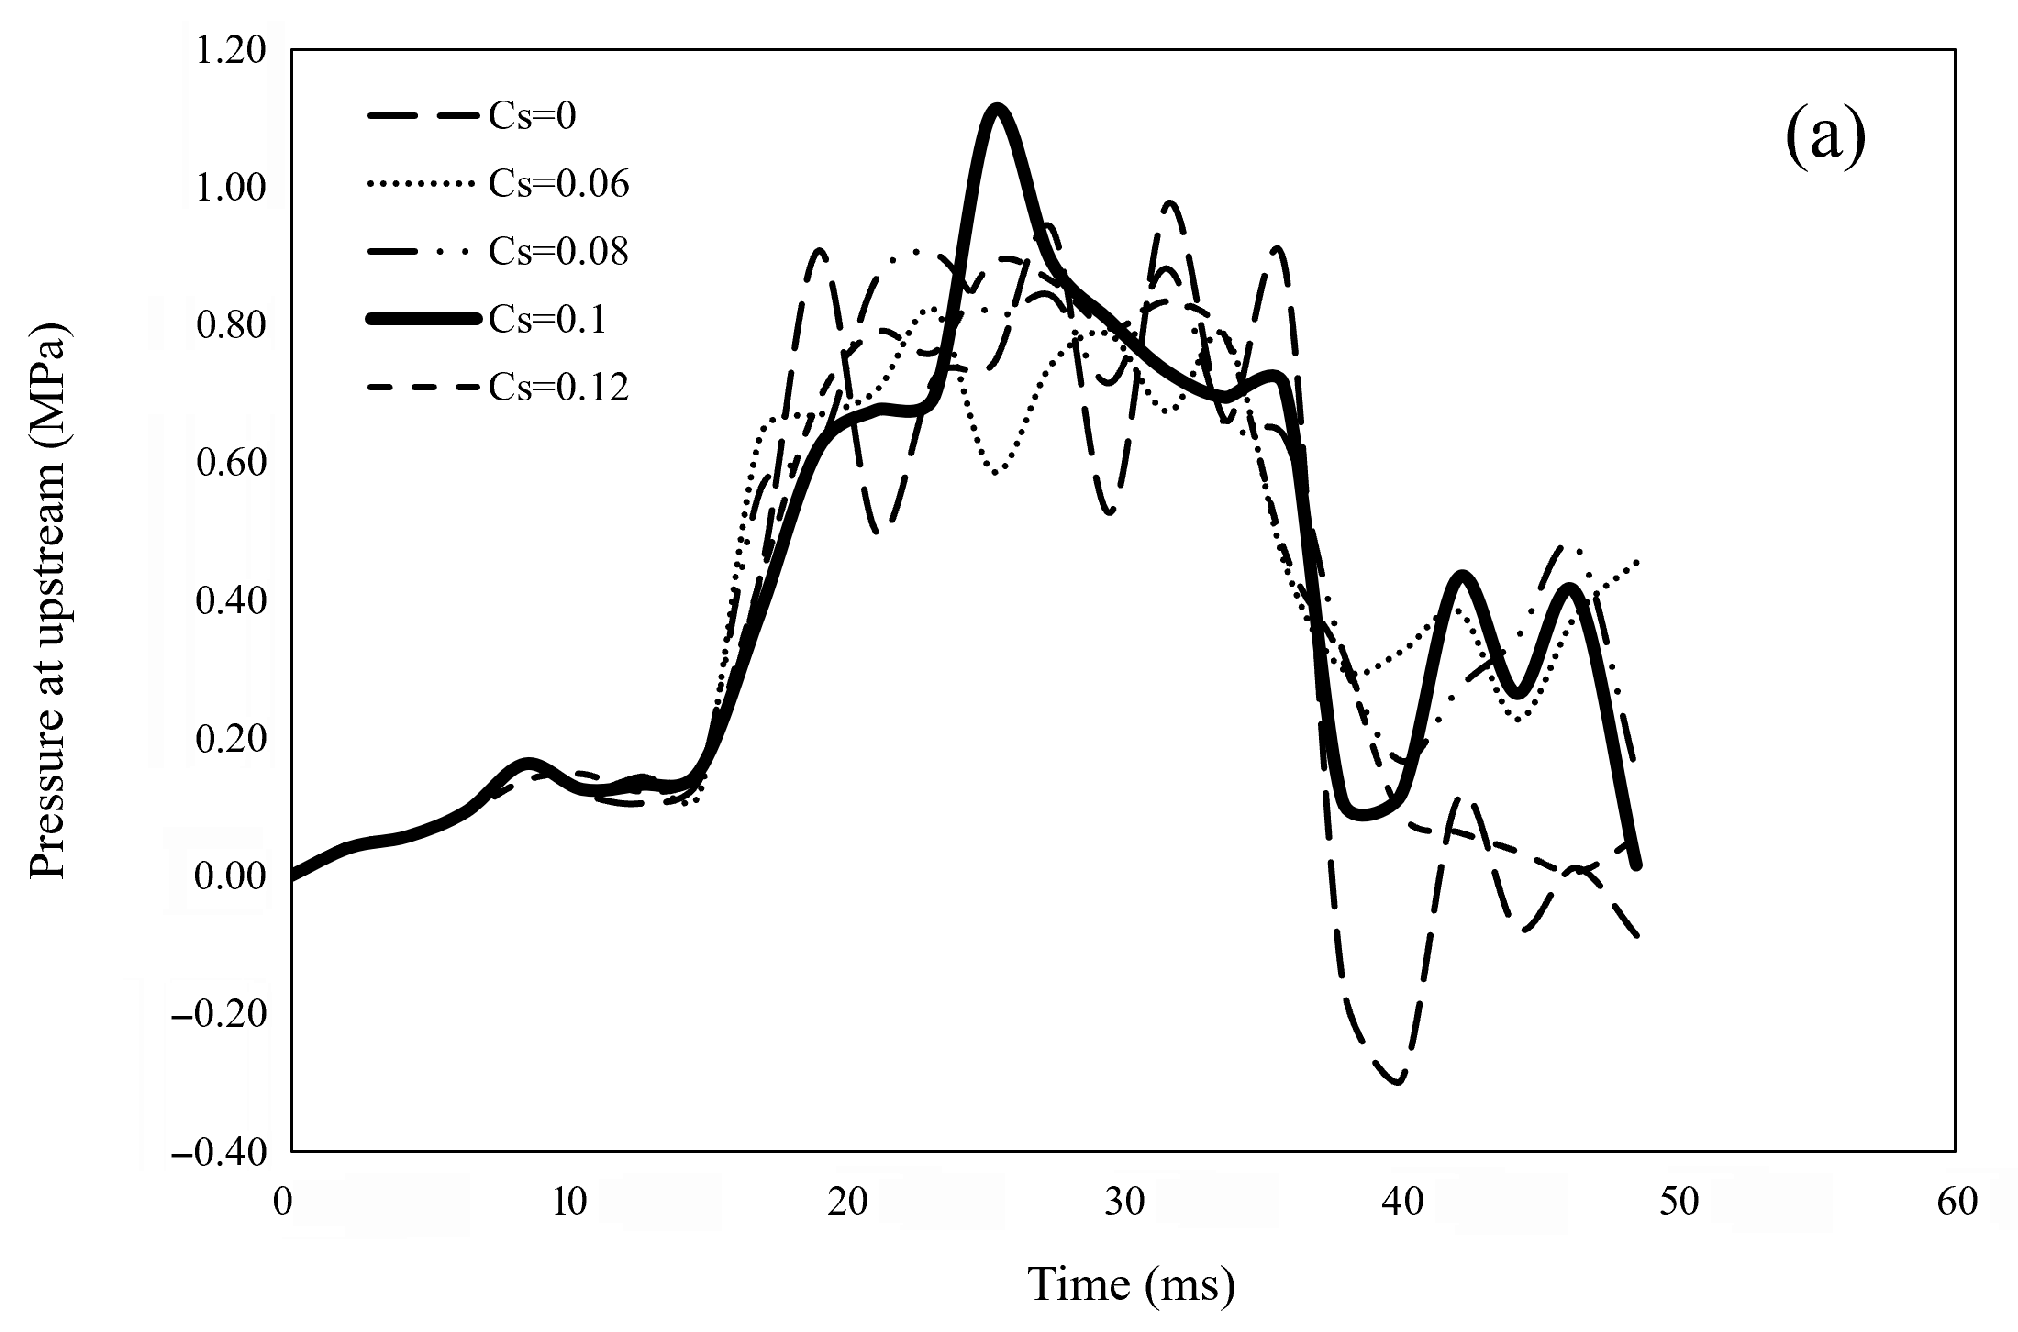
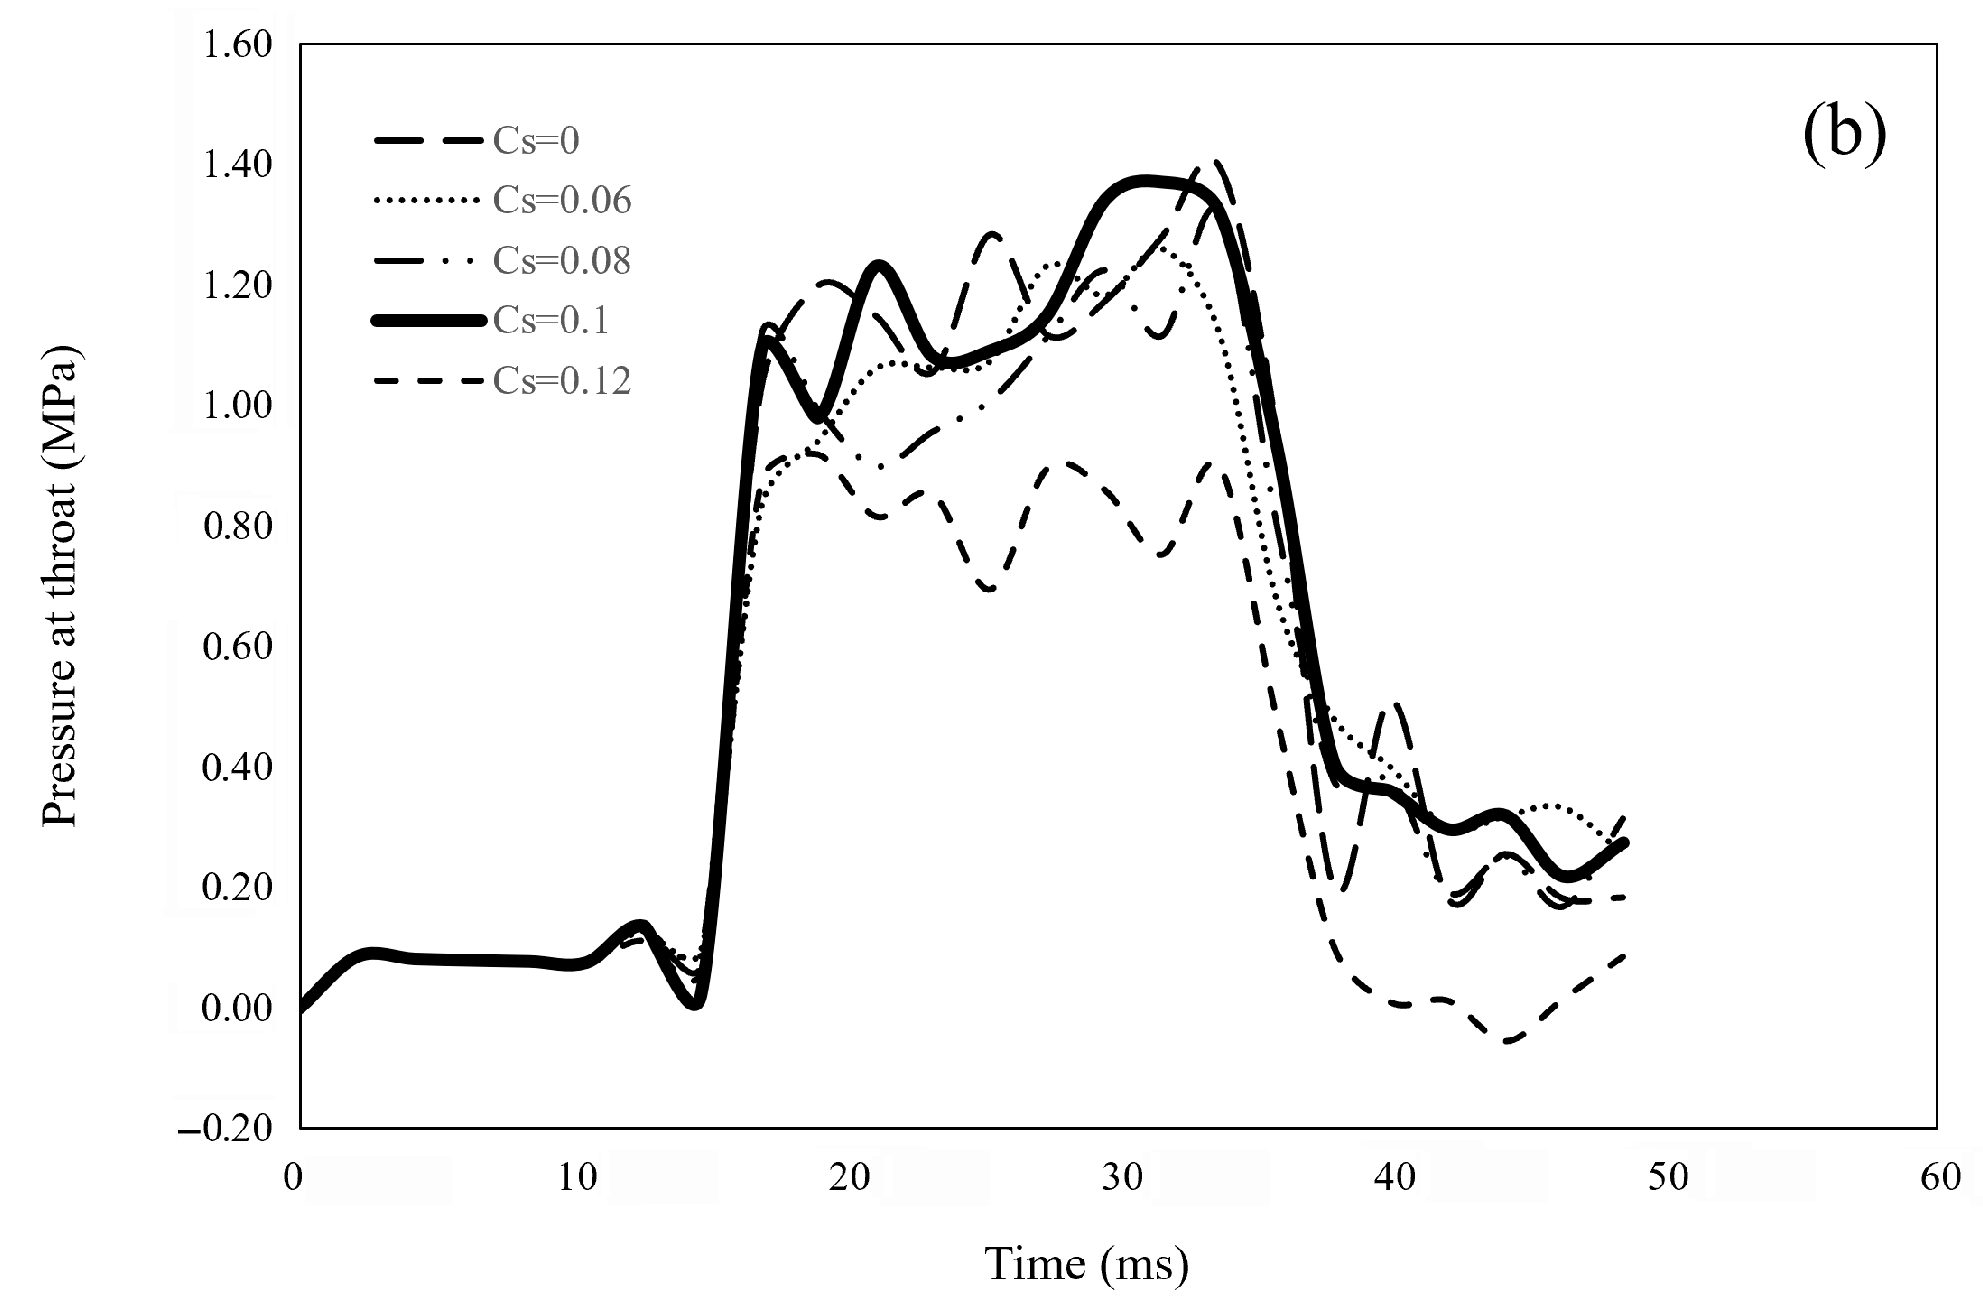
Within the LBM framework, the effect of Cs is manifested in the effective relaxation time, thus governing the resulting numerical dissipation. To systematically investigate the influence of the Cs value on the pressure response in the arc-extinguishing chamber, this study designed five sets of comparative simulation cases, with the Cs values set at 0.06, 0.08, 0.10, and 0.12 and a scenario without SGS (corresponding to Cs = 0). The quantitative comparison of the pressure responses under different Cs values is summarized in Table 2. The peak pressure in the no-SGS case (Cs = 0) is 1.40 MPa at the throat and 0.97 at the upstream measurement points. As the Cs value increases from 0.06 to 0.10, the peak pressure at the throat exhibits an incremental trend (from 1.26 MPa to 1.37 MPa), while, as the Cs value increases from 0.10 to 0.12, the throat peak pressure declines to 0.92 MPa; for the upstream measurement point, it measures 0.82 MPa at Cs = 0.06, increases to 0.90 MPa at Cs = 0.08, reaches a maximum of 1.11 MPa at Cs = 0.10, and drops to 0.89 MPa at Cs = 0.12. According to the experimental findings presented in [17], the simulation correlates better with the actual situation at Cs values of 0 and 0.1. When Cs is too small, the turbulent viscosity becomes insufficient, resulting in inadequate energy transfer efficiency. As Cs = 0.10, an optimal balance is achieved, which effectively simulates turbulent fluctuations without causing excessive energy dissipation.
Figure 5 provides the pressure variation under different Cs values at both the upstream and throat measurement points during the process of breaking. Close inspection of the case without considering the SGS model indicates that the pressure evolution experiences intense oscillations and multi-peak conditions. Without SGS, the turbulent fluctuations in the flow field remain under-resolved, which contradicts physical reality and leads to excessive pressure accumulation. In contrast, the case with Cs = 0.1 (highlighted by the solid line) exhibits a single dominant pressure rise stage, which is more consistent with the test results.

4.3. Dynamic Pressure Response

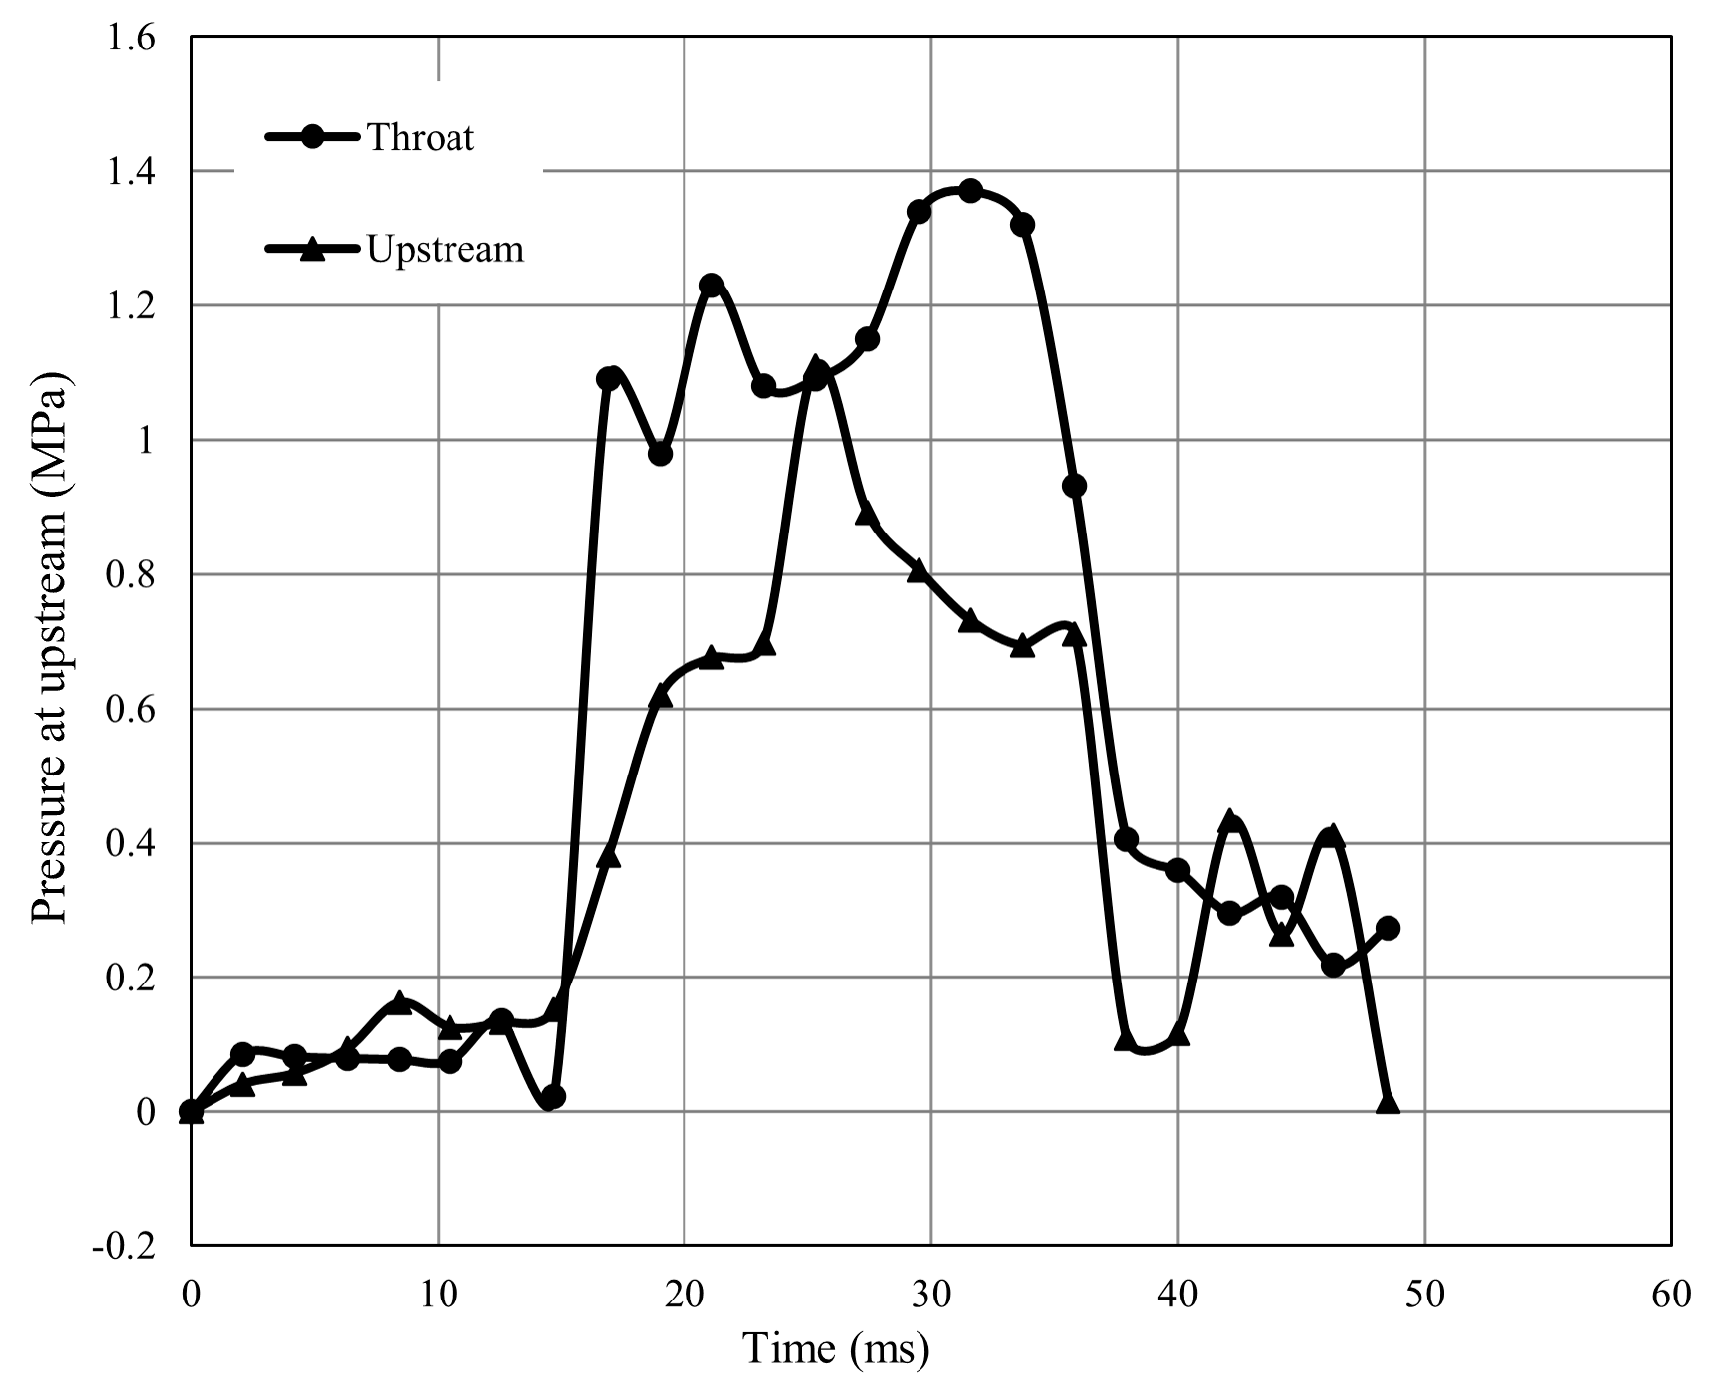
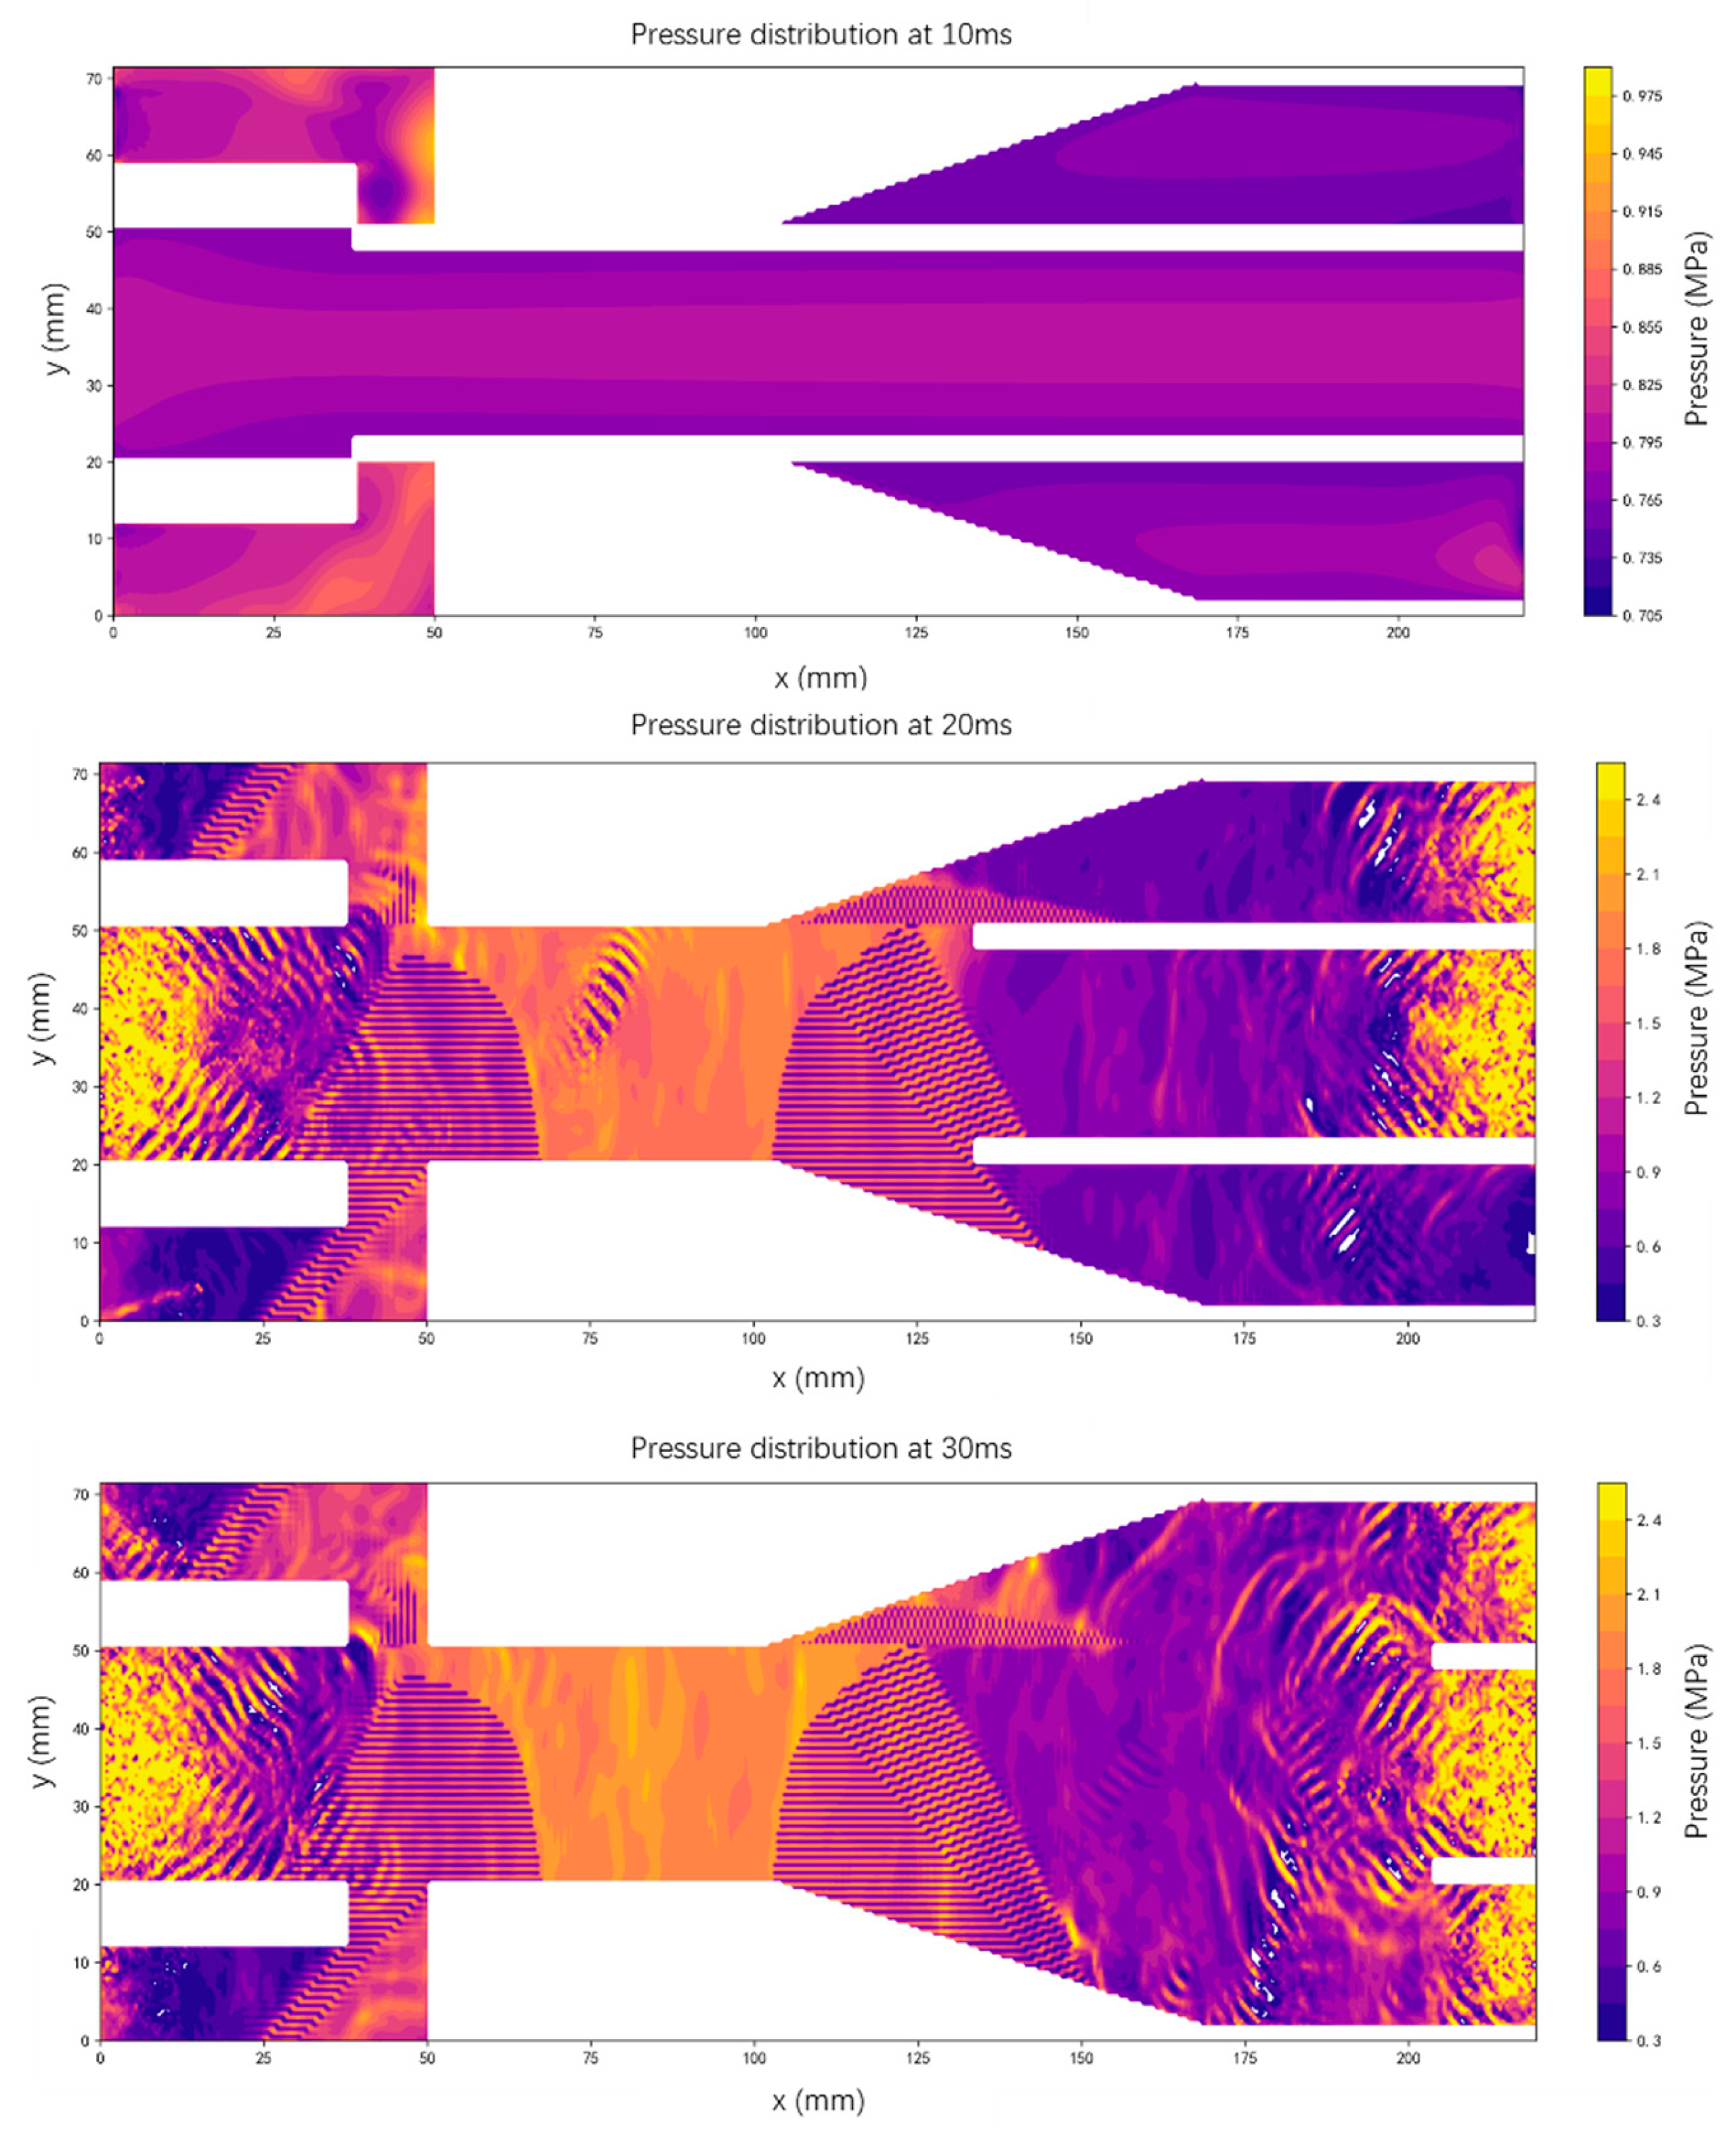
In this section, the pressure characteristics in the arc-extinguishing chamber during an interruption are simulated through the proposed DDF-LBM-based model. As described in Section 2 and Section 3, the dynamic pressure response of the arc-extinguishing chamber was simulated for the loaded 50 kA case, in which the arc effect was represented by a prescribed equivalent volumetric heat source introduced into the energy equation. The source was activated from 15.0 ms to 35.0 ms, corresponding to the assumed arc-burning interval. Figure 6 presents the temporal variation in the pressure increment at the upstream location and the throat location during the process of breaking with a Smagorinsky constant CS of 0.1. Generally, the pressure responses at both measurement points exhibit typical unsteady characteristics, including an initial slow increase, a subsequent rapid rise to the peak, and a later decaying oscillation, while noticeable differences are observed in terms of the peak pressure amplitude and dynamic response characteristics. It can be seen that the pressure at both the upstream and throat locations marginally increases with nearly identical magnitudes at the initial 10 ms. Figure 7 shows the spatial distribution of the pressure field at 10 ms, 20 ms, and 30 ms. Close inspection of Figure 7 shows that the pressure wave has not yet propagated on a large scale at 10 ms. This indicates that the flow remains in a quasi-steady state and is mainly governed by the inlet pressure condition. In this stage, the contacts have only recently begun to separate, and the effective flow area of the nozzle is limited. Subsequently, the nozzle gradually opens, where a rapid rise in pressure is observed. The peak pressure reaches 1.35 MPa at 32 ms at the throat and 1.1 MPa at the upstream observation point at 25 ms. This observation indicates the formation of a critical throttling condition, and the 7 ms difference between the two measurement points reflects the process of pressure wave propagation from the upstream to the throat position. It can be explained by the fact that the thermal expansion effect dominates, overwhelming the Bernoulli effect. Figure 7 indicates a high-pressure area that appears in the central region and is spreading to both sides at 20 ms, and the visible interference patterns and complex wave structures can be observed. In the 30 ms snapshot of the fluid flow, the pressure distribution becomes further complicated and diffuses downstream. The throat forms a minimum effective flow area, limiting the mass flow rate; moreover, with the continuous gas supply from upstream, the throat becomes the controlling section, leading to strong local compression and a sharp increase in pressure. It can be concluded that the pressure response is not simply determined by the inlet conditions but is jointly governed by local geometric constraints and unsteady compression effects. Then, in the later stage of opening, the stationary contact no longer blocks the main nozzle, reducing the flow resistance and enabling more effective gas discharge. The chamber begins to relieve the overall pressure, and the pressure gradually decays with reduced fluctuations.

5. Conclusions

This study focuses on the arc-extinguishing chambers of SF6 circuit breakers. It employs the Lattice Boltzmann Method (LBM) coupled with an explicit Smagorinsky sub-grid scale (SGS) model to simulate the fluid field and investigate the pressure variation characteristics inside the arc-extinguishing chamber. This method provides a new technical option for the numerical simulation of high-voltage electrical equipment, and the following main conclusions can be drawn.
  • This method employs the D2Q9 dual distribution function model to simultaneously solve for the fluid field and temperature field, enabling it to capture the thermodynamic coupling effects during the arc extinction process. The explicit SGS model is applied to simulate turbulence and control the numerical dissipation intensity.
  • The simulation results indicate the significance of the application of the SGS model in simulating turbulence. The Smagorinsky constant value Cs shows a significant and non-monotonic effect on the pressure response of the arc-extinguishing chamber. The optimal Cs value is determined as 0.10 according to the simulation results. The strong dependence of the pressure response on Cs also indicates that the accuracy of numerical simulation is crucial in predicting the interruption performance of circuit breakers. The optimal selection of the Cs value has been proposed, filling the research gap in this field.
  • To capture the pressure characteristics, two measurement points were arranged, located at the upstream of the nozzle and throat sections. The peak pressure at these two measurement points under the condition of Cs = 0.10 reached 1.11 MPa (at the upstream) and 1.37 MPa (at the throat). Based on the simulation results, the pressure field within the arc-extinguishing chamber can be divided into four stages: the initial stage (t < 20 ms), the rising stage (20 ms ≤ t < 25 ms), the peak stage (25 ms ≤ t < 35 ms), and the decay stage (t ≥ 35 ms).
  • This study adopted a simplified 2D representation of the arc chamber in the simulations, introducing certain limitations. The proposed model provides a scientific basis for the application of the LBM in the simulation of plasma in arc-extinguishing chambers and offers useful suggestions for the selection of turbulence model parameters. This study advances the application of the LBM in the field of high-voltage electrical appliances.

Author Contributions

Conceptualization, R.Z.; methodology, Y.Z.; software, R.Z. and H.Z.; validation, R.Z.; formal analysis, R.Z.; investigation, R.Z.; resources, Y.Z.; data curation, Y.Z.; writing—original draft, R.Z.; writing—review and editing, B.X. and C.C.; visualization, H.Z.; supervision, B.X.; project administration, C.C.; funding acquisition, B.X. All authors have read and agreed to the published version of the manuscript.

Funding

This research received no external funding.

Data Availability Statement

The data presented in this study are available on request from the corresponding author. The data are not publicly available due to privacy or ethical restrictions.

Conflicts of Interest

Author Huancheng Zou was employed by the company Shenyang Transformer Research Institute Co., Ltd. The remaining authors declare that the research was conducted in the absence of any commercial or financial relationships that could be construed as a potential conflict of interest.

References

  1. Hinov, N. Solid-State Transformers in the Global Clean Energy Transition: Decarbonization Impact and Lifecycle Performance. Energies 2026, 19, 558. [Google Scholar] [CrossRef]
  2. Arévalo, P.; Ochoa-Correa, D.; Villa-Ávila, E. Towards energy efficiency: Innovations in high-frequency converters for renewable energy systems and electric vehicles. Vehicles 2024, 7, 1. [Google Scholar] [CrossRef]
  3. Bogdanov, D.; Ram, M.; Aghahosseini, A.; Gulagi, A.; Oyewo, A.S.; Child, M.; Caldera, U.; Sadovskaia, K.; Farfan, J.; Barbosa, L.D.; et al. Low-cost renewable electricity as the key driver of the global energy transition towards sustainability. Energy 2021, 227, 120467. [Google Scholar] [CrossRef]
  4. Wang, Y.; Zhen, J.; Pan, H. Ultra-high-voltage construction projects and Total factor energy efficiency: Empirical evidence on cross-regional power dispatch in China. Sustainability 2024, 16, 8083. [Google Scholar] [CrossRef]
  5. Henderson, M.I.; Novosel, D.; Crow, M.L. Electric power grid modernization trends, challenges, and opportunities. IEEE Power Energy 2017. Available online: https://www.academia.edu/143589233/Electric_Power_Grid_Modernization_Trends_Challenges_and_Opportunities (accessed on 23 March 2026).
  6. Knobloch, H.; Habedank, U. Behaviour of SF6 high-voltage circuit breakers with different arc-extinguishing systems at short-line fault switching. IEE Proc.-Sci. Meas. Technol. 2001, 148, 273–279. [Google Scholar] [CrossRef]
  7. Yin, J.; Zhao, Y.; Zeng, X.; Duan, J. The arcing and post-arc breakdown characteristics of SF6 generator circuit breaker based on magnetohydrodynamic model. Phys. Fluids 2024, 36, 115107. [Google Scholar] [CrossRef]
  8. Muratovic, M.; Engelbrecht, J.T.; Simka, P.; Pietrzak, P.; Machler, F.; Erismann, S.; Franck, C.M. An experimental circuit breaker for benchmarking the intrinsic interruption performance of SF6 alternative gas mixtures. IEEE Trans. Power Deliv. 2024, 39, 3082–3091. [Google Scholar] [CrossRef]
  9. Vianna, E.A.; Abaide, A.R.; Canha, L.N.; Miranda, V. Substations SF6 circuit breakers: Reliability evaluation based on equipment condition. Electr. Power Syst. Res. 2017, 142, 36–46. [Google Scholar] [CrossRef]
  10. Wadie, F.; Eliyan, T. A universal high voltage SF6 circuit breaker for HVDC and HVAC systems. Sci. Rep. 2025, 15, 1200. [Google Scholar] [CrossRef]
  11. Wang, N.; Wang, Y.; Zhang, Y.; Tang, C.; Sun, C. An Operational Status Assessment Model for SF6 High-Voltage Circuit Breakers Based on IAR-BTR. Sensors 2025, 25, 3960. [Google Scholar] [CrossRef]
  12. Rüegsegger, W.; Meier, R.; Kneubühl, F.K.; Schötzau, H.J. Mass spectrometry of arcs in SF6 circuit breakers. Appl. Phys. B 1985, 37, 115–135. [Google Scholar] [CrossRef]
  13. Schavemaker, P.H.; Van der Slui, L. An improved Mayr-type arc model based on current-zero measurements [circuit breakers]. IEEE Trans. Power Deliv. 2002, 15, 580–584. [Google Scholar] [CrossRef]
  14. Brand, K.P.; Jungblut, H. The interaction potentials of SF6 ions in SF6 parent gas determined from mobility data. J. Chem. Phys. 1983, 78, 1999–2007. [Google Scholar] [CrossRef]
  15. Mitchell, R.R.; Tuma, D.T.; Osterle, J.F. Transient two-dimensional calculations of properties of forced convection-stabilized electric arcs. IEEE Trans. Plasma Sci. 2007, 13, 207–220. [Google Scholar] [CrossRef]
  16. Chang, G.W.; Huang, H.M. A Practical SF 6 Circuit Breaker Arc Model for Studying Shunt Reactor Switching Transients. In Proceedings of the 2005/2006 IEEE/PES Transmission and Distribution Conference and Exhibition, Dallas, TX, USA, 21–26 May 2006; IEEE: Piscataway, NJ, USA, 2006; Volume 21, pp. 1024–1029. [Google Scholar]
  17. Guan, Y.; Liu, W.; Wu, J.; Wu, J. Pressure Measurement and Characteristic Analysis on a 252-kV Puffer-Type SF6 Circuit Breaker. IEEE Trans. Power Deliv. 2013, 28, 2616–2622. [Google Scholar] [CrossRef]
  18. Lin, X.; Wang, F.; Xu, J.; Xia, Y.; Liu, W. Study on the mathematical model of dielectric recovery characteristics in high voltage SF6 circuit breaker. Plasma Sci. Technol. 2016, 18, 223. [Google Scholar] [CrossRef]
  19. Zhang, J.; Jia, S.; Li, X.; Liu, P.; Shi, Z.; Wang, L. Modelling of the interruption process in SF6 high voltage circuit breaker and preliminary study of the arc characteristics for different gases. In Proceedings of the 55th IEEE Holm Conference on Electrical Contacts, HOLM, Vancouver, BC, Canada, 14–16 September 2009; IEEE: Piscataway, NJ, USA, 2009; pp. 237–242. [Google Scholar]
  20. Abbasi, V.; Gholami, A.; Niayesh, K. Three-dimensional simulation of plasma deformation during contact opening in a circuit breaker, including the analysis of kink instability and sausage instability. Plasma Sci. Technol. 2012, 14, 996. [Google Scholar] [CrossRef]
  21. Wang, Q.; Ge, S.; Cao, W.; Yu, S.; Liao, Z. Study of arc interruption characteristics under rated current in low voltage circuit breakers. Energies 2023, 16, 4114. [Google Scholar] [CrossRef]
  22. Qian, Y.H.; d’Humières, D.; Lallemand, P. Lattice BGK models for Navier-Stokes equation. Europhys. Lett. 1992, 17, 479–484. [Google Scholar] [CrossRef]
  23. Chen, S.; Doolen, G.D. Lattice Boltzmann method for fluid flows. Annu. Rev. Fluid Mech. 1998, 30, 329–364. [Google Scholar] [CrossRef]
  24. Djebali, R.; Pateyron, B.; El Ganaoui, M.; Sammouda, H. Axisymmetric high temperature jet behaviours based on a lattice Boltzmann computational method. Part I: Argon Plasma. Int. Rev. Chem. Eng. 2009, 1, 428–438. [Google Scholar]
  25. Peng, Y.; Shu, C.; Chew, Y.T. Simplified thermal lattice Boltzmann model for incompressible thermal flows. Phys. Rev. E 2003, 68, 026701. [Google Scholar] [CrossRef]
  26. Kim, Y.J.; Luo, K.; Li, T.N.; Yi, H.L.; Tan, H.P. Double distribution function lattice Boltzmann modeling for energy transport in the DC argon arc plasma. Int. Commun. Heat Mass Transf. 2016, 70, 59–65. [Google Scholar] [CrossRef]
  27. Sun, Q.; Cui, J.; Gao, F.; Gui, M.; Zhang, J. Application of Lattice Boltzmann Method to SF6 Circuit-breaker Arcing Process Simulation. In Proceedings of the 2022 6th International Conference on Electric Power Equipment-Switching Technology (ICEPE-ST), Seoul, Republic of Korea, 15–18 March 2022; IEEE: Piscataway, NJ, USA, 2022; Volume 15, pp. 326–330. [Google Scholar]
  28. Cui, J.; Sun, Q.; Zhang, J. Calculation of Pressure in Interrupter of SF6 Circuit Breaker Using Lattice Boltzmann Method. In Proceedings of the 2022 IEEE 5th International Conference on Knowledge Innovation and Invention (ICKII), Hualien, Taiwan, 22–24 July 2022; IEEE: Piscataway, NJ, USA, 2022; Volume 22, pp. 253–258. [Google Scholar]
  29. Succi, S. The Lattice Boltzmann Equation: For Complex States of Flowing Matter; Oxford University Press: Oxford, UK, 2018. [Google Scholar]
  30. Krüger, T.; Kusumaatmaja, H.; Kuzmin, A.; Shardt, O.; Silva, G.; Viggen, E.M. The Lattice Boltzmann Method: Principles and Practice; Springer International Publishing: Cham, Switzerland, 2017. [Google Scholar]
Figure 1. Lattice velocity arrangements for D2Q9 model (adapted from [29,30]).
Energies 19 02432 g001
Figure 2. Calculated area of arc-extinguishing chamber.
Energies 19 02432 g002
Figure 3. Time-varying curves of inlet pressure and contact movement. (a) Curve of inlet pressure over time; (b) Curve of contact movement with time.
Energies 19 02432 g003
Figure 4. Simulation results regarding pressure fluctuations at the upstream and throat positions during no-load operation.
Energies 19 02432 g004
Figure 5. Pressure variation at two measurement points under different Cs values: (a) upstream of nozzle; (b) throat.
Energies 19 02432 g005aEnergies 19 02432 g005b
Figure 6. Comparison of pressure variation in the upstream nozzle and throat.
Energies 19 02432 g006
Figure 7. Pressure distribution inside the arc-extinguishing chamber at different times.
Energies 19 02432 g007
Table 1. Comparison of maximum pressure upstream of nozzle and throat under no-load breaking conditions.
Maximum Pressure (MPa)
UpstreamThroat
TestLBMTestLBM
1.051.131.001.10
Table 2. Pressure response characteristics under different Cs values.
CsUpstream Peak Pressure (MPa)Throat Peak Pressure (MPa)
0 (No SGS)0.971.40
0.060.821.26
0.080.901.32
0.11.111.37
0.120.8910.92
Disclaimer/Publisher’s Note: The statements, opinions and data contained in all publications are solely those of the individual author(s) and contributor(s) and not of MDPI and/or the editor(s). MDPI and/or the editor(s) disclaim responsibility for any injury to people or property resulting from any ideas, methods, instructions or products referred to in the content.