Article

A Reservoir Engineering Method for Graded Evaluation of Early Gas Breakthrough During CO2 Flooding in Glutenite Reservoirs

1
Research Institute of Exploration and Development, Xinjiang Oilfield Company, PetroChina, Karamay 834000, China
2
Petroleum Institute, China University of Petroleum-Beijing at Karamay, Karamay 834000, China
3
College of Petroleum Engineering, China University of Petroleum-Beijing, Beijing 102249, China
*
Author to whom correspondence should be addressed.
Energies 2026, 19(10), 2370; https://doi.org/10.3390/en19102370
Submission received: 5 April 2026 / Revised: 10 May 2026 / Accepted: 11 May 2026 / Published: 15 May 2026
(This article belongs to the Section H1: Petroleum Engineering)

Abstract

Due to the strong heterogeneity of the reservoir, early gas breakthrough and low CO2 displacement efficiency are common issues in the CO2 flooding process of domestic gravel reservoirs. This study focuses on a gravel reservoir in Xinjiang, proposing a quantitative evaluation method that combines early gas breakthrough identification and the inversion of gas channel characteristic parameters. The aim is to provide theoretical support and technical guidance for gas breakthrough risk warning, injection-production system optimization, and control measures during the CO2 flooding process. The research method includes the following several key steps: first, clarifying the criteria for determining the time of gas breakthrough and proposing a classification method for early gas breakthrough types based on CO2 concentration levels; second, adopting a “matrix-dominant gas channel” dual-medium model, considering the geometric and physical characteristics of inter-well gas channels, and deriving a theoretical calculation formula with gas breakthrough time and CO2 concentration in the produced gas as the target; third, using actual gas breakthrough time and CO2 concentration as constraints, constructing a method to invert the characteristic parameters of gas channels, quantitatively representing key parameters such as gas channel thickness ratio, permeability variation, and equivalent permeability; finally, through the combined analysis of CO2 concentration and gas channel characteristic parameters, establishing a method for identifying gas channel types suitable for domestic gravel reservoirs. The practical application results show that the test area has formed localized dominant gas channels, but the overall stage is still in the early phase of weak gas breakthrough. Most gas breakthrough phenomena are weak, with only a few well groups experiencing severe gas breakthrough issues. The gas channel thickness ratio is generally less than 0.05, and the permeability variation mainly ranges from 2 to 20. The gas channels are primarily of the fracture type, with some areas also containing ordinary fractures and main control fractures. The method proposed in this study, which combines early gas breakthrough identification with the inversion of gas channel characteristic parameters, not only provides a new approach to revealing the characteristics of gas breakthrough during CO2 flooding but also offers solid theoretical and technical support for optimizing CO2 flooding technology and controlling gas breakthrough risks.

1. Introduction

In recent years, as conventional oil and gas fields advance into the mid-to-late stages of development, carbon dioxide-enhanced oil recovery (CO2-EOR) has emerged as a key technique for medium to low permeability and tight reservoirs, offering both improved oil recovery and reduced carbon emissions [1,2,3,4,5,6]. Gravel reservoirs in Xinjiang are characterized by rapid lateral variations in sedimentary facies, complex pore networks, and strong heterogeneity. Conventional waterflooding often promotes the development of preferential flow channels, resulting in a highly dispersed residual oil distribution [7,8,9,10]. Consequently, implementing CO2-EOR as a secondary recovery method presents significant practical value for enhancing crude oil recovery in these reservoirs.
With the widespread application of CO2-EOR technology, the identification and control of gas channeling have become critical issues for improving oil recovery. Current studies on gas channeling mainly involve the following three approaches: experimental investigation, reservoir engineering analysis, and numerical simulation [11,12,13]. Experimental studies commonly reveal gas-channeling mechanisms through core flooding tests. Fang et al. [14] investigated a chemical-assisted CO2 water-alternating-gas injection technique and demonstrated its effectiveness in improving CO2-EOR performance and enhancing sweep efficiency. Zhu et al. [15] examined the evolution characteristics of gas channeling during CO2 flooding in low-permeability reservoirs. Reservoir engineering methods focus on gas-channeling diagnosis and dynamic evaluation based on reservoir characteristics and production responses. Liu et al. [16] developed a gas-channeling identification method based on fuzzy comprehensive evaluation, which integrates static geological parameters and dynamic production indicators to quantitatively characterize the degree of interwell gas channeling, thereby providing a basis for gas-channeling diagnosis and injection–production parameter optimization. Qi et al. [17] used one-dimensional and two-dimensional numerical models to investigate CO2 front migration and sweep behavior under different displacement conditions, indicating that reservoir heterogeneity, permeability contrast, well spacing, gas injection rate, and crude oil viscosity are key factors affecting CO2 sweep efficiency. Overall, existing studies have deepened the understanding of CO2 gas-channeling identification and front migration behavior from the perspectives of experimental analysis, reservoir engineering, and numerical simulation. However, for glutenite reservoirs characterized by strong heterogeneity and well-developed preferential flow channels, the graded evaluation of early gas breakthrough remains insufficiently developed and requires further investigation.
Compared with homogeneous sandstone or fractured reservoirs, gravel reservoirs are particularly susceptible to dominant flow paths and heterogeneous structures during CO2-EOR. This often causes CO2 to preferentially break through production wells along these high-permeability channels, leading to frequent early gas breakthrough events. Early gas breakthrough not only decreases CO2 sweep efficiency and exacerbates CO2 recycling inefficiencies but also accelerates the decline of oil production capacity, significantly constraining the overall effectiveness of CO2-EOR [18,19,20,21,22]. Consequently, characterizing the features and defining parameters of early gas breakthrough in gravel reservoirs, as well as establishing systematic methods for its identification and evaluation, are essential to ensuring CO2-EOR performance [23,24].
Currently, both domestic and international studies on early gas breakthrough have primarily focused on fractured or conventional sandstone reservoirs. These investigations often rely on production dynamic indicators, such as gas–oil ratio anomalies and gas production fluctuations, to identify breakthrough events. Such approaches depend heavily on subjective judgment and practical experience, lacking objective, systematic, and scientifically grounded criteria. Some studies incorporate reservoir numerical simulations to predict gas breakthrough processes; however, these models generally exhibit limited representation of complex geological heterogeneity and restricted engineering applicability [25,26]. In this context, the present study focuses on a gravel reservoir in a Xinjiang oilfield, systematically analyzing reservoir heterogeneity and the characteristics of early gas breakthrough under CO2-EOR conditions. We investigate the identification, characterization, and quantitative evaluation of early gas breakthrough, and develop a comprehensive evaluation methodology tailored for gravel reservoirs. The approach has been validated in a CO2 test area, demonstrating both scientific reliability and engineering applicability. This provides technical support for improved risk management and optimization of development parameters in CO2-EOR for gravel reservoirs.

2. Identification and Characterization of Gas Breakthrough Characteristics

2.1. Judgment of Gas Breakthrough Time

In CO2-enhanced oil recovery (CO2-EOR) for gravel reservoirs, the pronounced heterogeneity often leads to the development of dominant gas channeling pathways or fracture-type high-permeability zones. Consequently, injected CO2 tends to rapidly breakthrough production wells along these local high-permeability paths, a phenomenon referred to as early gas breakthrough [27,28,29,30,31]. The most distinctive feature of early gas breakthrough is a sustained increase in the CO2 concentration in the produced gas over time. However, even in the absence of significant gas channeling, small amounts of injected CO2 are inevitably produced with the production fluid. Therefore, accurately determining the gas breakthrough time is essential, as it forms the basis for early gas breakthrough identification and subsequent analyses.
By synthesizing definitions of gas breakthrough time from conventional CO2-EOR reservoirs, a method for determining early gas breakthrough time in gravel reservoirs has been proposed. Specifically, gas breakthrough time is defined as the initial point when the CO2 concentration in the produced gas continuously exceeds 2%. From this point onward, although the CO2 concentration may fluctuate, the overall trend demonstrates a gradual increase over time. Accurately establishing this breakthrough time is therefore critical for timely monitoring and evaluating the impact of gas channeling on CO2-EOR performance.

2.2. Determination of Gas Breakthrough Types

Field practice of CO2 flooding demonstrates that the CO2 concentration in produced gas serves as a direct indicator of both the effectiveness of CO2 injection and the intensity of gas channeling. Accordingly, based on CO2 concentration measurements in produced gas, a classification standard for early gas breakthrough types in CO2 flooding is proposed, informed by field monitoring data and practical production experience. The classification divides gas breakthrough into the following four categories:
Category 1: No gas breakthrough (CO2 < 2%)—At this stage, CO2 has not effectively reached the production wells, and gas channeling pathways have not yet formed. CO2 primarily exists as associated gas, exerting minimal influence on production well performance. Field observations indicate that concentrations below 2% typically reflect the absence of significant gas channeling in the wellbore.
Category 2: Weak gas breakthrough (CO2 2–20%)—CO2 is approaching the bottom of the production well or has partially entered the wellbore. Early stage gas channeling pathways begin to emerge on a limited scale. Gas channeling has a minor effect on production, with low gas mobility and underdeveloped channeling pathways. The upper threshold of 20% indicates that the CO2 front is near the production wells, initiating preliminary gas channeling. Field monitoring suggests that gas channeling within this range remains weak and does not substantially compromise CO2 flooding effectiveness, though continued observation is warranted.
Category 3: Significant gas breakthrough (CO2 20–60%)—Gas channeling pathways of considerable scale have formed between injection and production wells, enhancing CO2 mobility. These pathways begin to affect production well performance. Within this concentration range, while gas mobility increases, the main channeling pathways are not yet fully developed. Field data indicate that CO2 concentrations between 20% and 60% reflect the emergence of channeling effects, which start to limit the efficiency of CO2 flooding.
Category 4: Severe gas breakthrough (CO2 > 60%)—CO2 rapidly breaks through production wells along dominant channeling pathways, resulting in severe gas channeling and a pronounced reduction in effective reservoir recovery. In this stage, CO2 primarily flows along the dominant channels, causing substantial productivity losses. Field experience and monitoring data indicate that when CO2 concentrations exceed 60%, channeling pathways are highly developed, leading to rapid CO2 breakthrough, severe gas channeling, and a marked decline in the overall effectiveness of CO2 flooding.

2.3. Characterization of Gas Breakthrough Parameters

(1)
Gas Breakthrough Time
Early gas breakthrough essentially indicates the development of dominant gas-channeling pathways between injection and production wells. The geometric scale and seepage capacity of these pathways control key response parameters, including gas breakthrough time and CO2 concentration in the produced gas [32,33,34,35,36]. Therefore, CO2 can be regarded as a tracer, and an equivalent seepage model can be established to characterize inter-well gas-channeling pathways. Under the combined constraints of well spacing, injection–production patterns, and reservoir properties, the principal characteristic parameters of the inter-well gas-channeling pathways can be inversely determined by matching the gas breakthrough time and CO2 concentration in the produced gas [37,38].
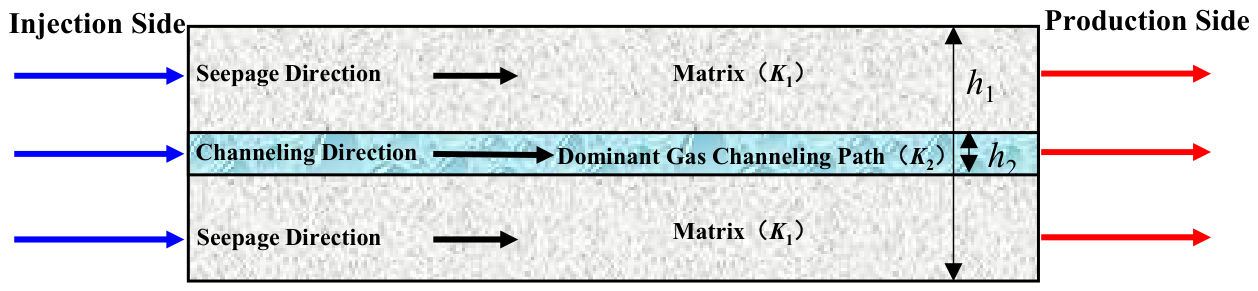
The dual-medium parallel-flow model adopted in this study is designed to characterize the flow behavior and parameter differences between the dominant gas-channeling pathway and the matrix. This model is suitable for heterogeneous reservoirs because it explicitly separates the flow contributions of the high-permeability gas-channeling zone and the surrounding matrix. In this model, the inter-well seepage system during CO2 flooding is conceptualized as a dual-medium system consisting of a dominant gas-channeling zone and a matrix zone arranged in parallel, as shown in Figure 1. The effective thickness and permeability of the dominant gas-channeling zone are denoted as h2 and K2, respectively, whereas the matrix zone has an effective thickness of h1 − h2 and a permeability of K1. During fluid migration, CO2 preferentially propagates rapidly through the dominant gas-channeling pathway, while only a limited portion of CO2 participates in low-velocity seepage within the matrix.
The effective pore volume between the injection and production wells can be expressed as Equation (1):
V g = d L h e q ϕ S g
where d is the average width of gas channeling channel, m; L is the distance between injection and production wells, m; heq is the equivalent thickness of gas channeling channel, m; Φ is the average porosity of connected layers, f; and Sg is the movable gas saturation, f.
The gas driving capacity can be expressed as the geometric mean of the flow rates of the injection and production wells, as given by Equation (2):
Q = Q 1 Q 2
where Q1 is the injection rate of injection well, m3/d; Q2 is the production rate of production well, m3/d.
According to the principle of volume conservation, the gas breakthrough time between injection and production wells can be defined as the time required for gas to fill the effective pore volume Vg between wells. Combining Equations (1) and (2), the expression of gas breakthrough time can be derived, as shown in Equation (3).
t = V g Q
where t is the gas breakthrough time, d; Vg is the effective pore volume between injection and production wells, m3; and Q is the gas driving capacity, m3/d.
In the process of CO2 flooding, part of CO2 dissolves in crude oil, so it is necessary to consider the correction of the volume of CO2 actually participating in the displacement process by the volume of dissolved CO2. The dissolved CO2 volume can be characterized by the solution gas–oil ratio Rsc, and the influence of water cut fw during displacement is also considered, so the CO2 volume correction term can be expressed as Equation (4):
S g + ( 1 f w ) Q 1 Q 2 R s c 800
where fw is the average water cut of oil well, f; Rsc is the CO2 solution gas–oil ratio, m3/m3. In this equation, the introduction of the parameter 800 serves to adjust the relationship between flow rate, CO2 solubility, and the fluid dynamics characteristics of oil and gas.
Since the dominant gas-channeling zone and the matrix zone in the seepage model are arranged in parallel, their equivalent flow capacity can be expressed by Equation (5):
K 2 h 2 + K 1 ( h 1 h 2 )
where h1 is the effective thickness of connected layers, m; h2 is the effective thickness of gas channeling channel, m; K1 is the average matrix permeability, mD; and K2 is the average permeability of gas channeling channel, mD.
By rearranging Equation (5), the equivalent thickness of the gas-channeling pathway can be obtained, as expressed in Equation (6):
h e q = h 2 + K 1 K 2 ( h 1 h 2 )
By substituting the relationships in Equations (1), (2) and (4)–(6) into the gas breakthrough time expression in Equation (3), the theoretical CO2 gas breakthrough time between the injection and production wells can be derived, as shown in Equation (7).
t = d L ϕ S g + ( 1 f w ) Q 1 Q 2 R s c 800 h 2 + K 1 K 2 ( h 1 h 2 ) Q 1 Q 2
It can be inferred from the above equation that the theoretical CO2 gas breakthrough time is primarily controlled by well spacing, reservoir properties, the scale of the gas-channeling pathway, and injection–production intensity. The movable gas saturation, Sg, and the solution gas–oil ratio, Rsc, are obtained from field measurements, whereas the average channel width, d, is estimated as one-half of the injection–production well spacing.
(2)
CO2 Concentration in Produced Gas
After inter-well CO2 breakthrough occurs, the CO2 concentration in the produced gas varies with the degree of development of gas-channeling pathways. Therefore, in addition to gas breakthrough time, the CO2 concentration in produced gas is another key parameter for characterizing early gas breakthrough behavior during CO2 flooding.
The CO2 in the produced gas from production wells mainly originates from the followiing two sources: the contribution of free gas flowing through the dominant gas-channeling pathway and the release of dissolved CO2 from the matrix after migration to the production well with the oil phase. Based on the parallel-flow concept of the dual-medium model, and neglecting differences in pressure drop, migration distance, and seepage cross-sectional area, the CO2 concentration in produced gas can be characterized by the gas-phase flow capacity of free gas and the gas-carrying capacity of oil-phase dissolved gas.
According to Darcy’s law, the contribution capacity of free gas can be approximately expressed by Equation (8):
Q g K 2 h 2 k r g μ g
where Qg is the flow contribution capacity of free gas, m3/d; K2 is the permeability of gas channeling channel, mD; h2 is the effective thickness of gas channeling channel, m; krg is the gas relative permeability, f; and μg is the gas viscosity, mPa·s.
For engineering simplification, the gas relative permeability can be approximated as kᵣg ≈ Sg. Accordingly, the above equation can be simplified as Equation (9):
Q g K 2 h 2 S g μ g
where Sg is the gas saturation, f.
The contribution capacity of dissolved CO2 in the matrix, which migrates with the oil phase, can be expressed by Equation (10):
Q o K 1 ( h 1 h 2 ) R s μ o
where Qo is the flow contribution capacity of oil phase dissolved gas, m3/d; K1 is the matrix permeability, mD; h2 is the total effective thickness of reservoir, m; Rs is the solution gas-oil ratio, m3/m3; and μo is the crude oil viscosity, mPa·s.
The CO2 concentration in the produced gas from production wells can be approximated as the ratio of the free-gas contribution to the total produced-gas contribution, as expressed in Equation (11):
C C O 2 = Q g Q g + Q o
where CCO2 is the CO2 concentration in produced gas, f.
By substituting Equations (9) and (10) into Equation (11), the approximate expression for the CO2 concentration in the produced gas can be derived, as shown in Equation (12):
C C O 2 K 2 h 2 S g μ g K 2 h 2 S g μ g + K 1 ( h 1 h 2 ) R s μ o
Considering the weakening effect of increasing water cut on the gas-carrying capacity of the oil phase in the matrix, the theoretical upper limit of CO2 concentration in the produced gas from production wells can be expressed by Equation (13):
C 1 = K 2 h 2 S g μ g K 2 h 2 S g μ g + K 1 ( h 1 h 2 ) ( 1 f w ) R s μ o
where C1 is the theoretical upper limit of CO2 concentration in produced gas, f; fw is the water cut, fraction.
When the gas-carrying capacity of the oil phase in the matrix is enhanced, the theoretical lower limit of the CO2 concentration in the produced gas from production wells can be expressed by Equation (14):
C 2 = K 2 h 2 S g μ g K 2 h 2 S g μ g + K 1 ( h 1 h 2 ) R s μ o
where C2 denotes the theoretical lower limit of the CO2 concentration in the produced gas, expressed as a fraction.
For comparison with the measured CO2 concentration in the produced gas, the geometric mean of the theoretical upper and lower limits is adopted as the theoretical average CO2 concentration in the produced gas, as expressed in Equation (15):
C = C 1 C 2
where C denotes the theoretical average CO2 concentration in the produced gas, expressed as a fraction.
The simplified model proposed in this study is applicable to immiscible CO2 flooding, in which CO2 is assumed to mainly exist as a gas phase in the reservoir and to have limited dissolution in the aqueous and oil phases. Under this condition, CO2 preferentially flows through high-permeability pathways, resulting in gas-channeling behavior. Its migration capacity is primarily governed by the effective pore volume and gas driving capacity.

3. Quantitative Evaluation of Gas-Channeling Pathways

3.1. Inversion of Characteristic Parameters

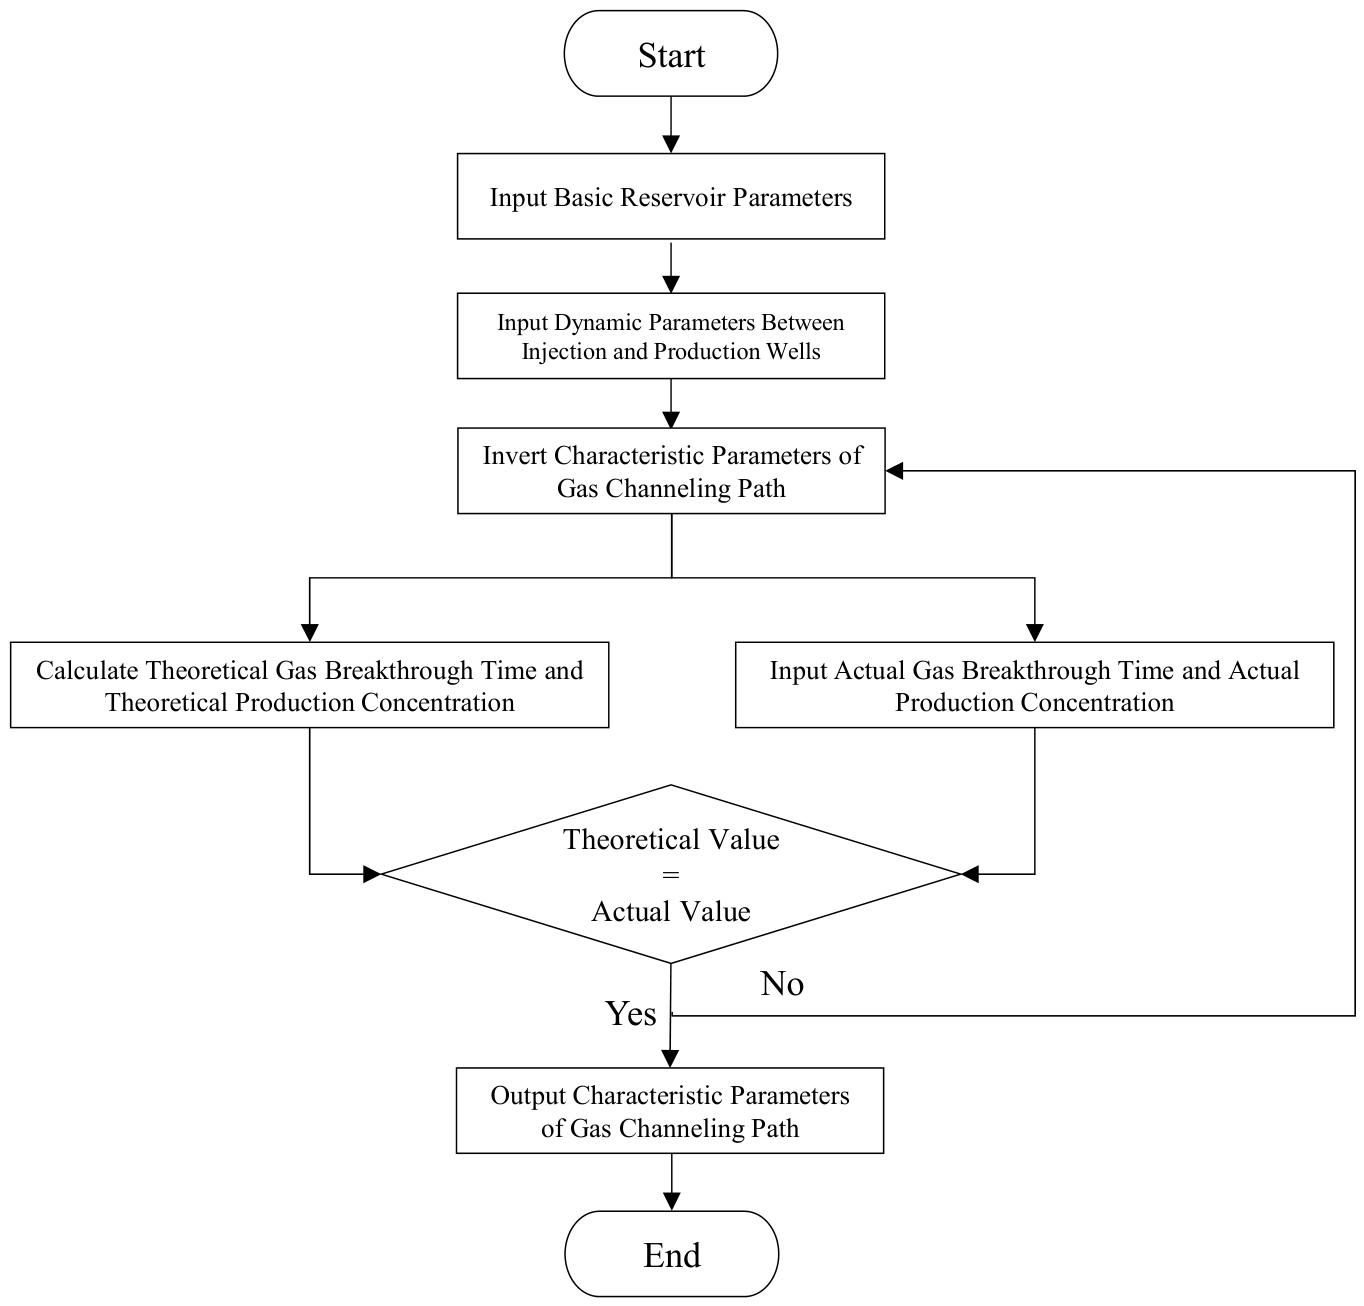
Based on the assumption that the inter-well seepage system can be divided into two flow units, namely the matrix zone and the dominant gas-channeling pathway, distinct reservoir physical properties and seepage parameters are assigned to each unit. Constrained by the production history of the injection and production wells, the characteristic parameters of the inter-well gas-channeling pathways are determined through iterative optimization and inversion. The inversion workflow is shown in Figure 2.
As illustrated in the parameter inversion workflow in Figure 2, the CO2 injection rate, injection duration, well-pattern geometry, and petrophysical properties of the injection wells are used as input parameters. By fitting the characteristic parameters of interwell gas-channeling pathways, the predicted early gas-breakthrough indicators are matched with the observed values. These theoretical indicators mainly include the following:
(1)
Theoretical CO2 breakthrough time: Under a given set of gas-channeling pathway parameters, this refers to the time at which the CO2 concentration in the produced gas first reaches a predefined threshold, such as 2%. This parameter is used to characterize the CO2 breakthrough rate and the degree of interwell connectivity.
(2)
Theoretical upper and lower limits of CO2 concentration in produced gas: By varying key parameters, including the thickness and permeability of gas-channeling pathways, as well as the permeability contrast between the gas-channeling pathways and the matrix, a series of theoretical CO2 concentration profiles can be generated. These profiles represent the possible upper and lower bounds of produced CO2 concentration under different degrees of gas channeling.
(3)
Theoretical average CO2 concentration in produced gas: Under reasonable assumptions regarding the thickness ratio of gas-channeling pathways and the permeability contrast, representative parameter combinations are selected to generate the theoretical average CO2 concentration profile. This profile serves as a reference for comparison with the observed CO2 concentration trend in produced gas.
The observed variation in CO2 concentration in produced gas over time is fitted and compared with the theoretical upper and lower concentration limits, as well as the theoretical average concentration profile. On this basis, the optimal combination of characteristic parameters for interwell gas-channeling pathways can be inversely determined, including the thickness ratio, equivalent thickness, permeability contrast, and permeability of the gas-channeling pathways. Furthermore, the development degree of interwell gas-channeling pathways and their influence on the sweep efficiency of CO2 flooding can be quantitatively evaluated.
In practical applications, the early gas breakthrough type for each injection-production well pair is initially assessed using the CO2 concentration classification standard. Subsequently, a comprehensive analysis and evaluation are conducted, incorporating the inversion results of gas channeling pathway characteristic parameters. If the CO2 concentration in the produced gas is high and increases rapidly, and the inversion results indicate the presence of a thin, high-permeability dominant gas channeling pathway with a significant permeability contrast between wells, it can be concluded that interwell gas channeling is well-developed, categorizing it as a typical strong gas channeling type. Conversely, if the CO2 concentration remains in a low range for an extended period and deviates significantly from the theoretical gas breakthrough time, it suggests a normal displacement process or a slow advancement of the displacement front, indicating that gas channeling is not a prominent issue.
In this study, the model’s tolerance range has been strictly controlled. Specifically, the error in gas breakthrough time is maintained within 0.5%, and the relative error between the theoretical and fitted CO2 concentration values in the produced gas is kept within 15%, ensuring the model’s accuracy and reliability in practical applications. In cases where different combinations of channel thickness, permeability contrast, saturation, and width result in similar gas breakthrough times and CO2 concentrations, the interpretation of results must be aligned with actual production measures for the injection-production well pairs. Within the same production well group, if the inversion results of multiple injection-production well pairs are similar, factors such as injection time and injection intensity should be comprehensively considered to reasonably identify and interpret the similar results, based on the characteristics of the injection-production wells during the actual production process.

3.2. Joint Identification Boundary

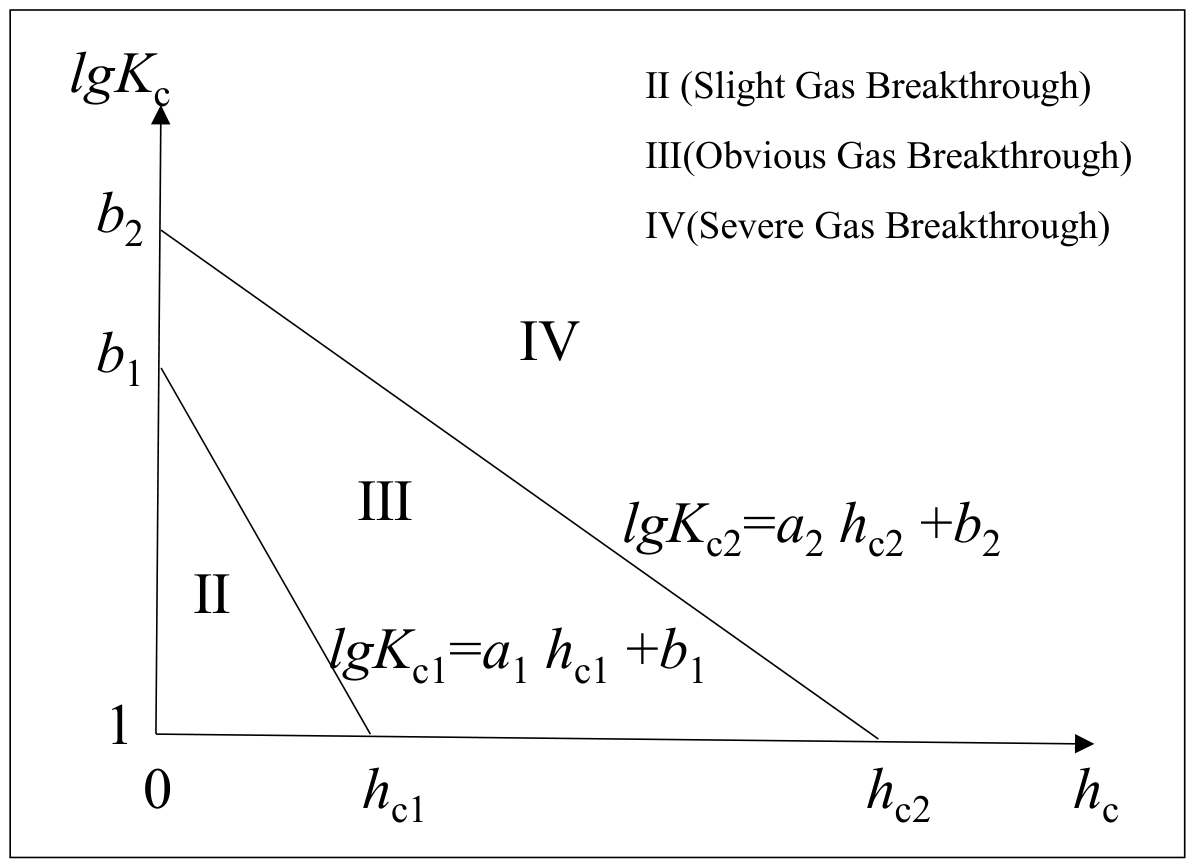
Through a data correlation analysis of numerous characteristic parameters of gas channeling pathways, a strong numerical relationship was identified between the thickness ratio of gas channeling pathways and the permeability contrast, as illustrated in Figure 3. Based on this correlation and the CO2 concentration classification standard, a joint identification boundary was established for CO2 concentration and the characteristic parameters of gas channeling pathways. This boundary distinguishes the following three types of wells exhibiting gas breakthrough: Type II (weak gas breakthrough), Type III (obvious gas breakthrough), and Type IV (severe gas breakthrough).
As shown in Figure 3, the joint identification boundary between two adjacent types of gas breakthrough wells is expressed by Equation (16):
lg K c 1 = a 1 h c 1 + b 1 lg K c 2 = a 2 h c 2 + b 2
where Kc1, hc1, a1, and b1 represent the permeability contrast, thickness ratio, coefficient, and intercept of gas channeling pathways corresponding to the joint identification boundary between Type II and Type III wells, respectively. Similarly, Kc2, hc2, a2, and b2 represent the permeability contrast, thickness ratio, coefficient, and intercept of gas channeling pathways corresponding to the joint identification boundary between Type III and Type IV wells, respectively.
Simplifying the above formula can be obtained as Equation (17):
h c 1 = lg K c 1 b 1 a 1 ,   K c 1 = 10 a 1 h c 1 + b 1 h c 2 = lg K c 2 b 2 a 2 ,   K c 2 = 10 a 2 h c 2 + b 2
Therefore, using the joint identification boundary between two adjacent types of gas breakthrough wells, the numerical ranges for the thickness ratio and permeability contrast of gas channeling pathways corresponding to different gas breakthrough well types can be determined, as expressed by Equation (18):
Slight   gas   breakthrough :   0 < h c h c 1 , 1 < K c K c 1 Obvious   gas   breakthrough :   h c 1 < h c h c 2 , K c 1 < K c K c 2 Severe   gas   breakthrough :   h c > h c 2 , K c > K c 2
Based on the value ranges of the characteristic parameters of gas channeling pathways obtained from the above formula, this approach facilitates the analysis of gas channeling types and the early warning of gas channeling risks for gas breakthrough wells within the same well area or similar reservoirs.

4. Application Case

4.1. Overview of the Test Area

Block A is a glutenite reservoir located in Xinjiang, within the Junggar Basin. The oil and gas accumulation area is situated at the high part of the nose-like structure, with a formation dip ranging from 3° to 5°. The following four oil-bearing series are developed in the block from bottom to top: T1b, T2k1, T2k2, and T3b. Among these, the sedimentary thickness of the T1b layer is 165 m, which is further subdivided into the following three sand groups: T1b1, T1b2, and T1b3, from top to bottom.
The target layer for the CO2 flooding test is T1b3, with an average effective thickness of 11.7 m and an original geological reserve of approximately 85.8 × 10⁴ tons. This layer has good connectivity, significant heterogeneity, average porosity of 12.4%, and average permeability of 58.1 mD, classifying it as a medium-low permeability reservoir with strong heterogeneity. The formation crude oil viscosity is 2.5 mPa·s, indicating low-viscosity crude oil, while the formation water type is NaHCO3.
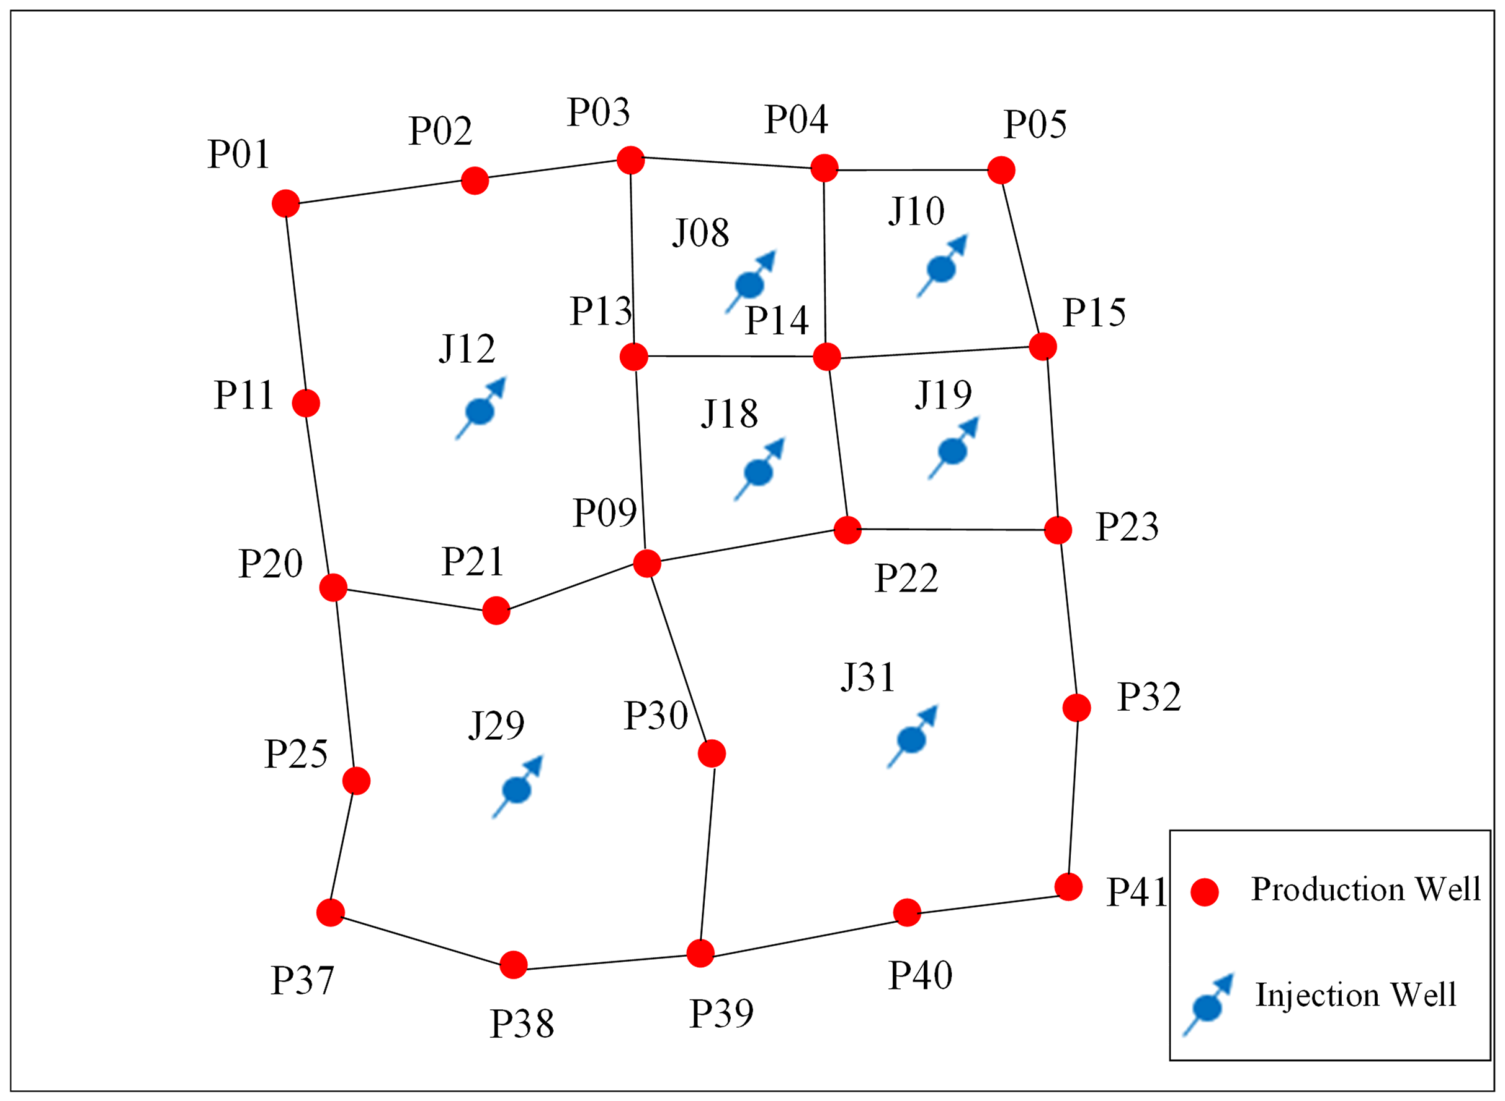
Block A was put into development in 1982 with an inverted seven-spot well pattern for production. Several infill adjustments were made during water flooding development, resulting in the current inverted seven-spot well pattern, with well spacing ranging from 200 to 350 m. In 2022, seven well groups were selected in Block A for the CO2 flooding pilot injection test, including seven injection wells and 22 production wells. However, due to the discovery of casing damage in Well J19 during downhole operations, which made it unsuitable for gas injection, the scheme was adjusted to include six injection wells and 22 production wells. The well locations of the test area are shown in Figure 4.

4.2. Parameter Calculation and Inversion

Based on the early gas breakthrough classification standard proposed in this study, the early gas breakthrough identification for the production wells in the test area was conducted using the actual CO2 concentration in the produced gas. The identification results are summarized in Table 1. Among these, seven wells exhibited no gas breakthrough, ten wells showed weak gas breakthrough, four wells experienced obvious gas breakthrough, and one well had severe gas breakthrough. It can be observed that most of the production wells in the test area have experienced varying degrees of gas breakthrough, with weak gas breakthrough being the most prevalent. Only a few wells have shown obvious or severe gas breakthrough. This suggests that the CO2 displacement front has generally advanced to the vicinity of the production wells, but the overall degree of gas channeling remains controllable, and the gas channeling phenomenon is not severe.
For the 15 gas breakthrough wells in the test area, the early gas breakthrough characteristic parameter calculation method and the gas channeling channel characteristic parameter inversion method proposed in this study were applied. The theoretical formula calculation results were fitted with the actual data of the gas breakthrough characteristic parameters as the target. Through the inversion of the characteristic parameters of interwell gas channeling pathways for all gas breakthrough wells, the calculation results of the early gas breakthrough characteristic parameters and the inversion results of the gas channeling pathway characteristic parameters for each individual well were obtained, as shown in Table 1 and Table 2.
(1)
Early Gas Breakthrough Characteristic Parameters
Based on the well pattern distribution shown in Figure 4, the well pattern in the study area was adjusted to include six injection wells and 22 production wells, except for well J19, where casing damage was discovered during downhole operations, rendering it unsuitable for gas injection. The injection–production relationships in the well group consist mainly of one injection well to four production wells and one injection well to eight production wells. Using these injection–production relationships, further inversion analysis of the channel parameters between the injection–production well pairs was carried out.
As shown in Table 1, the fitting accuracy of gas breakthrough time for the gas breakthrough wells in the test area is high, with the absolute error between the theoretical and actual values ranging from 0 to 0.31%. The fitting accuracy of the CO2 concentration in the produced gas is generally high as well. Except for wells P11 and P25, which show large absolute errors, the absolute errors for other gas breakthrough wells are all below 10%. This demonstrates that the inversion results of the characteristic parameters of gas channeling pathways obtained using this method effectively reflect the true development of interwell gas channeling, and enable scientific and quantitative characterization of these parameters.
In this study, the CO2 concentration fitting error for well P11 exceeds 25%, primarily due to the following factors: first, the uncertainty in the experimental data, as the field data may be influenced by measurement precision, equipment errors, and environmental changes; second, reservoir heterogeneity, where the heterogeneity of the reservoir at well P11 results in different CO2 distribution and flow characteristics compared to other wells. Nevertheless, the effectiveness of the inverted channel parameters was validated by combining geological background analysis with dynamic response analysis of the injection and production wells, ensuring the reliability of the model results.
(2)
Characteristic Parameters of Gas Channeling Channels
The results in Table 2 indicate the following:
(1)
For most gas-breakthrough wells in the test area, the permeability contrast is lower than or close to 10, whereas only wells P37 and P21 exhibit permeability contrasts greater than 40. Although well P37 is characterized by a high permeability in the gas-channeling pathway, the thickness ratio of the gas-channeling channel is relatively small. Consequently, gas channeling is not pronounced, and the well is classified as exhibiting weak gas breakthrough. In contrast, well P21 has both a high gas-channel permeability and a large channel thickness ratio, resulting in significant gas channeling and severe gas breakthrough. These observations suggest that reservoir heterogeneity promotes preferential gas migration through local high-permeability zones. However, no widespread, extremely high-permeability zones have developed at the well-pattern scale. Overall, the gas-channeling pathways exhibit a spatial distribution characterized by thin, narrow, and discrete features, rather than large-scale, thick, laterally continuous development.
(2)
The equivalent thicknesses of gas-channeling pathways associated with weak gas-breakthrough wells are all lower than or close to 0.5 m, and their channel thickness ratios are all less than 0.05. In contrast, the corresponding parameters for wells with obvious or severe gas breakthrough exceed these threshold values. This indicates that, compared with the flow capacity of gas-channeling pathways, the degree of channel development has a more significant influence on the gas-breakthrough type. When both the channel thickness ratio and equivalent channel thickness are small, pronounced gas channeling may not occur even if the channel permeability and permeability contrast are relatively high, as observed in well P37. Conversely, when both the channel thickness ratio and equivalent thickness are large, obvious gas channeling can occur even under relatively low channel permeability and permeability contrast, as demonstrated by wells P03, P13, P20, and P32.
In summary, the CO2 gas-channeling pathways in the test area are identifiable but have not yet reached a fully developed stage. On the one hand, heterogeneity-controlled dominant gas-channeling pathways have exerted a clear guiding effect on gas migration, and the observed gas breakthrough behavior together with the abnormal increase in permeability reflect the early response characteristics of gas channeling. On the other hand, the equivalent thicknesses and permeability contrasts of the gas-channeling pathways are generally at medium to low levels, indicating that gas channeling has not yet substantially reduced the sweep volume or macroscopic displacement efficiency of CO2 flooding. Therefore, it can be inferred that a certain number of dominant gas-channeling pathways have formed in the test area; however, the overall system remains in the early stage of weak gas channeling, mainly manifested as localized weak gas-channeling effects within specific well groups and channel scales.

4.3. Result Analysis and Evaluation

(1)
Distribution of Characteristic Parameters
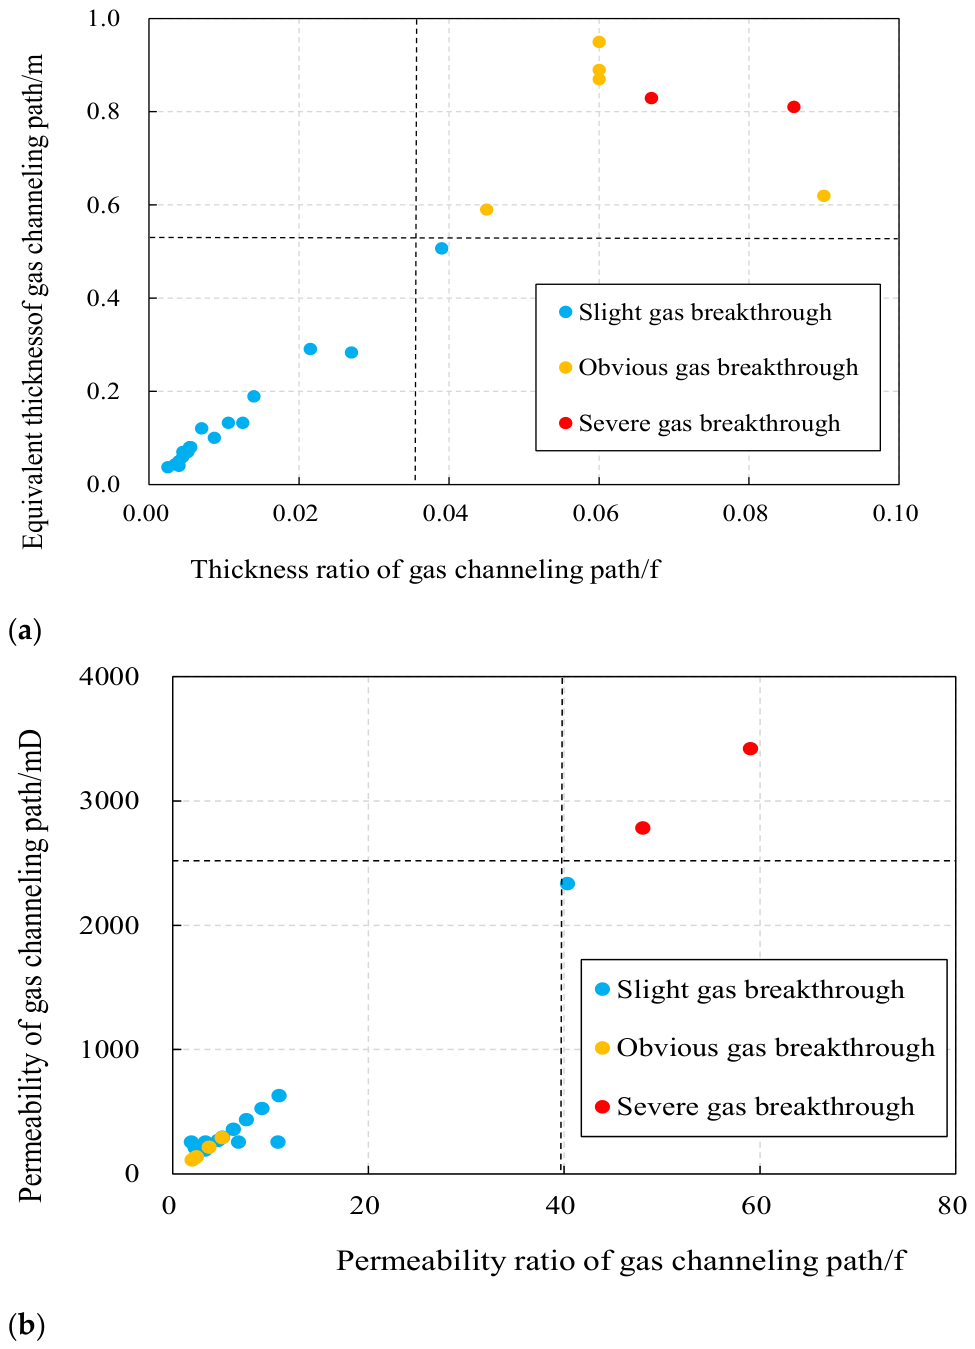
Based on the inversion results of the characteristic parameters for gas channeling pathways in all gas breakthrough wells within the test area, distribution maps were generated to illustrate the development degree and seepage capacity of these gas channeling pathways under different gas breakthrough types, as shown in Figure 5.
As shown in Figure 5a, the development degree of gas channeling pathways is weakest in the case of weak gas breakthrough, with the thickness ratio of gas channeling channels less than 0.4 and the equivalent thickness less than 0.5 m. In cases of obvious gas breakthrough and severe gas breakthrough, the numerical ranges for the thickness ratio and equivalent thickness of gas channeling channels overlap; however, the values are all greater than those observed in the weak gas breakthrough case.
As seen in Figure 5b, the seepage capacity of gas channeling pathways is highest during severe gas breakthrough, with the permeability contrast exceeding 40 and permeability greater than 2500 mD. In the weak gas breakthrough and obvious gas breakthrough cases, the numerical ranges for permeability contrast and permeability overlap. In these cases, the permeability contrast typically falls between 2 and 20, and the permeability generally ranges from 100 to 500 mD.
It can be observed that during the weak gas breakthrough and obvious gas breakthrough stages, the seepage capacity of gas channeling pathways is relatively weak and increases gradually. However, the spatial structure of these gas channeling pathways continues to develop as production progresses. During the severe gas breakthrough stage, the development of gas channeling pathways slows down or even halts, while their seepage capacity changes rapidly and increases significantly. Therefore, the optimal time to prevent severe gas channeling risks is during the weak or obvious gas breakthrough stages. At this stage, implementing effective control measures to slow the development of gas channeling pathways can greatly reduce the probability of severe gas breakthrough in production wells and effectively delay the transition to the severe gas breakthrough stage.
(2)
Evaluation of Joint Identification Boundary
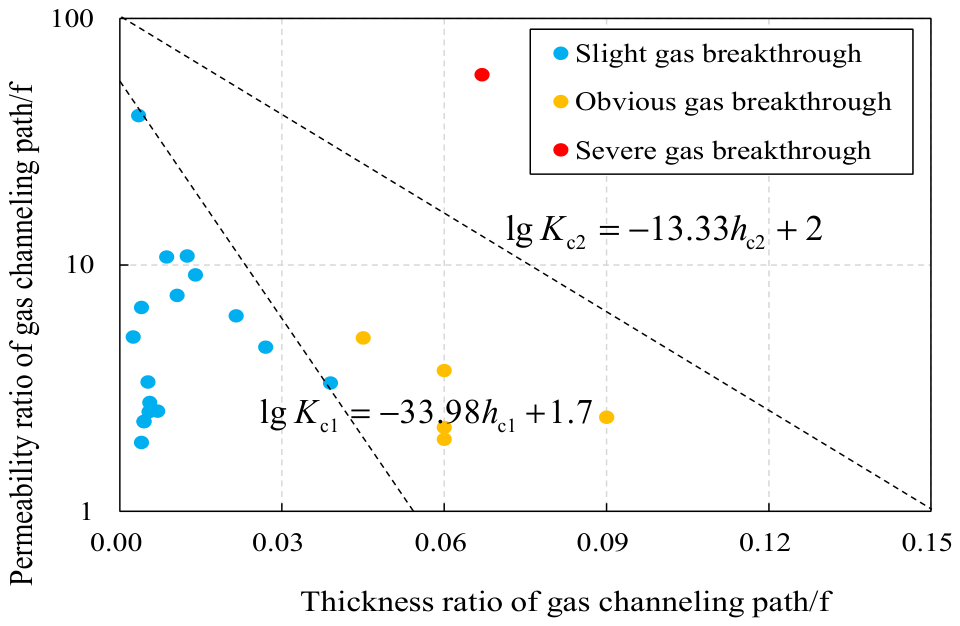
Based on the inversion results of the thickness ratio and permeability contrast for gas channeling pathways in all gas breakthrough wells within the test area, the characteristic curve of the joint identification boundary, which combines CO2 concentration with the characteristic parameters of gas channeling pathways under different gas breakthrough types, was generated, as shown in Figure 6.
From Figure 6, the expression of the joint identification boundary between weak gas breakthrough and obvious gas breakthrough in the test area is as follows:
lg K c 1 = 33.98 h c 1 + 1.7
The expression of the joint identification boundary between obvious gas breakthrough and severe gas breakthrough is as follows:
lg K c 2 = 13.33 h c 2 + 2
The regression equation describes the relationship between the gas channeling parameter (lgK2), CO2 concentration, and channel thickness (h2) under the condition of obvious gas breakthrough. The derivation of the regression boundary is based on actual parameter inversion results, encompassing the characteristics of gas channeling under various gas breakthrough types, including breakthrough time, CO2 concentration, and channel thickness. According to the parameter inversion results, the permeability contrast typically ranges from 2 to 20, with permeability mostly ranging from 100 to 500 mD, and the vertical axis data are all positive. All logarithmic values in the regression equation fall within a reasonable range, and the regression constants and coefficients are derived through data fitting, aligning with the CO2 concentration and gas channeling characteristics under actual reservoir conditions.
While the regression boundary effectively reflects the characteristics of gas channeling, the model may exhibit certain limitations when applied to complex reservoir conditions. Future research will focus on optimizing the regression boundary to accommodate varying geological conditions and complex flow patterns. Specifically, for miscible CO2 or complex reservoir heterogeneity, more refined physical models and additional parameter results will be integrated to enhance the model’s accuracy and reliability.
By substituting Formulas (19) and (20) into Formula (18), the value ranges for the thickness ratio and permeability contrast of gas channeling pathways corresponding to different gas breakthrough types can be derived as follows:
Slight   gas   breakthrough :   0 < h c 0.05 ,   1 < K c 50 Obvious   gas   breakthrough :   0.05 < h c 0.15 ,   50 < K c 100 Severe   gas   breakthrough :   h c > 0.15 ,   K c > 100
Based on the understanding of the joint identification boundary for all gas breakthrough wells in the test area, a method and criteria for determining the type of gas channeling pathways suitable for domestic glutenite reservoirs have been proposed, as detailed in Table 3.
Combining the well distribution in Figure 6 with the judgment criteria in Table 3, it can be seen that interwell gas channeling pathways are generally developed in the test area. The gas channeling pathways are primarily fracture-type, with a small number of ordinary fractures and dominant fracture channels. Although there are a large number of gas breakthrough wells in the test area, the overall condition is still in the early stages of gas breakthrough. The gas breakthrough phenomenon is predominantly characterized by weak gas breakthrough wells, with obvious and severe gas breakthrough being limited to the adjacent areas of a few well groups. The characteristic parameters of gas channeling pathways align with the quantitative characteristics of “thin layer, narrow band, gas channeling thickness ratio mostly less than 0.05, and permeability contrast mostly lower than 50,” which were obtained from the previous research findings. No high-intensity gas channeling zones spanning multiple well groups or large-scale contiguous development have formed. Overall, the degree of gas channeling is not severe, but preventive measures should still be taken.

4.4. Future Prospects and Limitations

This study focuses on the gravel reservoir of an oilfield in Xinjiang, providing a theoretical reference for gas seepage patterns during CO2 flooding processes. However, it has certain limitations. The paper summarizes the shortcomings of the research and outlines future research directions:
(1)
Impact of Heterogeneous Reservoir Conditions
This study assumes that the reservoir consists of a matrix and a dominant gas channel region, simplifying the complexity of the reservoir and neglecting its heterogeneity. In reality, reservoirs often exhibit highly heterogeneous pore structures, with gas flow influenced by multiple factors. Future research will consider introducing more complex geological models, utilizing multi-medium or multi-channel models, to more accurately simulate gas flow behavior in heterogeneous reservoirs.
(2)
Refined Consideration of Gas–Liquid Interactions
In this study, the derivation of breakthrough time only considered pore volume and gas driving capacity, without fully accounting for the interactions between gas and liquid. The solubility of CO2 varies with pressure and temperature, and the interactions between CO2 and the water and oil phases in the reservoir can significantly impact gas flow velocity and breakthrough time. Therefore, future studies will incorporate more detailed gas–liquid interaction models, calibrated and validated with experimental data, to more accurately describe the flow characteristics during the CO2 flooding process.
(3)
Experimental Validation and Practical Application of the Model
Although the theoretical model proposed in this study provides an effective framework for gas flow during CO2 flooding, it still requires validation through more extensive experimental data. The complexity of actual reservoir conditions may lead to deviations when applying the theoretical model. Therefore, future research should focus on enhancing the collection of experimental data and the field validation of the model. By comparing the model with data from real reservoirs, further calibration and optimization can ensure its applicability under different reservoir conditions, thereby improving the model’s practical utility and predictive capabilities.

5. Conclusions

(1)
The initial time, corresponding to when the CO2 concentration in the produced gas consistently exceeds 2%, is defined as the gas breakthrough time. A gas breakthrough classification method based on CO2 concentration levels is proposed, categorizing production wells into the following four types: no gas breakthrough, weak gas breakthrough, obvious gas breakthrough, and severe gas breakthrough.
(2)
The “matrix-dominant gas channel” dual-medium model is used, considering the geometric parameters and physical properties of the interwell gas channel. A theoretical calculation formula for gas breakthrough time and CO2 concentration in the produced gas is derived, further obtaining functional expressions for theoretical gas breakthrough time, CO2 concentration upper limit, CO2 concentration lower limit, and CO2 concentration mean value.
(3)
Using actual gas breakthrough time and CO2 concentration as constraints, a method for inverting gas channel characteristic parameters is established. This method quantitatively characterizes key parameters such as gas channel thickness ratio, equivalent thickness, permeability, and permeability variation, enabling dynamic inversion and quantitative evaluation of gas channel characteristics.
(4)
Based on the data correlation between CO2-driven gas channel characteristic parameters, a joint identification boundary for CO2 concentration and gas channel parameters is established. A method for determining suitable gas channel types for domestic gravel reservoirs is proposed, allowing for a comprehensive evaluation of gas breakthrough well types and risk assessment.
(5)
Case study results indicate that a localized dominant gas channel has formed in the experimental area; however, overall, the gas breakthrough is still in the early weak stage. Most wells exhibit weak gas breakthrough, with only a few well groups experiencing severe gas breakthrough. The gas channel thickness ratio is generally less than 0.05, and the permeability variation primarily ranges from 2 to 20. The gas channel type is predominantly fracture-type, though a small number of ordinary fractures and main control fractures are also present. Overall, the degree of gas breakthrough is not severe, but preventive measures should still be implemented.

Author Contributions

Conceptualization, J.L. and T.L.; methodology, Z.N.; validation, Y.L. and Z.L.; investigation, L.T.; data curation, J.W.; writing—original draft preparation, Y.L.; writing—review and editing, T.L.; visualization, H.T. All authors have read and agreed to the published version of the manuscript.

Funding

This study was supported by the Science and Technology Program of Xinjiang Uyghur Autonomous Region, grant number 2025D04014, and the Science and Technology Project of PetroChina Company Limited, “Research on the Ballast Stone Demonstration Project in the Baikouquan and Wuxia Oilfields,” grant number 2023YQX10207. No additional financial support from any other institutions or individuals was received for the preparation, publication, or conclusions of this article.

Data Availability Statement

The original contributions presented in this study are included in the article. Further inquiries can be directed to the corresponding author(s).

Conflicts of Interest

Authors Jianrong Lv, Zhenrong Nie, Li Teng, and Haowen Tang were employed by the Research Institute of Exploration and Development, Xinjiang Oilfield Company, PetroChina. Specifically, Jianrong Lv contributed to conceptualization, Zhenrong Nie contributed to methodology, Li Teng contributed to investigation, and Haowen Tang contributed to visualization. The remaining authors declare that the research was conducted in the absence of any commercial or financial relationships that could be construed as a potential conflict of interest. The authors declare that this study received funding from PetroChina Company Limited. Except for the academic contributions of the above-mentioned authors as stated in the Author Contributions section, the funder had no additional role in the study design, data collection, data analysis, interpretation of data, writing of the manuscript, or the decision to submit the article for publication.

References

  1. Li, Y. Progress and prospects of CO2 flooding for enhanced oil recovery in low-permeability reservoirs. Pet. Geol. Recovery Effic. 2020, 27, 1–10. [Google Scholar] [CrossRef]
  2. Li, S.; Tang, Y.; Hou, C. Current status and development trend of CO2 flooding technology for enhanced oil recovery. Pet. Reserv. Eval. Dev. 2019, 9, 1–8. [Google Scholar] [CrossRef]
  3. Li, Y.; Huang, W.; Jin, Y.; He, F.; Chen, Z.; Tang, Y.; Wu, G. Development and application of CO2-EOR technology for different reservoir types of Sinopec under the dual-carbon vision. Pet. Reserv. Eval. Dev. 2021, 11, 793–804. [Google Scholar] [CrossRef]
  4. Hu, Y.; Hao, M.; Chen, G.; Sun, R.; Li, S. CO2 enhanced oil recovery and storage technology in China: Status and practice. Pet. Explor. Dev. 2019, 46, 716–727. [Google Scholar] [CrossRef]
  5. Qin, J.; Han, H.; Liu, X. Application of CO2 flooding technology in the United States and its implications. Pet. Explor. Dev. 2015, 42, 209–216. [Google Scholar] [CrossRef]
  6. Zhou, Y.; Wang, R.; Gou, F.; Lang, D. Mechanisms of CO2 flooding in high-water-cut reservoirs. Acta Pet. Sin. 2016, 37, 143–150. [Google Scholar] [CrossRef]
  7. Li, Y.; Zhang, D.; Fan, X.; Zhang, J.; Yang, R.; Ye, H. Enhanced oil recovery by CO2 flooding in low-permeability sandy conglomerate reservoirs. Xinjiang Pet. Geol. 2022, 43, 59–65. [Google Scholar] [CrossRef]
  8. Chen, S.; Xu, J.; Zhang, X.; Wang, R.; Zhang, L.; Li, H. Connectivity characteristics of CO2 flooding in a strongly water-sensitive conglomerate reservoir in Xinjiang Oilfield. Xinjiang Oil Gas 2024, 20, 44–51. [Google Scholar]
  9. Deng, Z.; Wang, X.; Tan, L.; Zhang, J.; Chen, C.; Song, P. Enhanced oil recovery by asynchronous CO2 huff-and-puff in tight conglomerate reservoirs of Mahu Sag. Xinjiang Pet. Geol. 2022, 43, 200–205. [Google Scholar] [CrossRef]
  10. Jia, K.; Wang, Y.; Wang, S.; Ji, D.; Liu, B.; Zhang, R.; Gao, J. Influence of reservoir heterogeneity on gas channeling during CO2 flooding in low-permeability reservoirs. Xinjiang Pet. Geol. 2019, 40, 208–212. [Google Scholar] [CrossRef]
  11. Li, D.; Saraji, S.; Jiao, Z.; Zhang, Y. CO2 injection strategies for enhanced oil recovery and geological sequestration in a tight reservoir: An experimental study. Fuel 2021, 284, 119013. [Google Scholar] [CrossRef]
  12. Luo, J.; Hou, Z.; Feng, G.; Liao, J.; Haris, M.; Xiong, Y. Effect of Reservoir Heterogeneity on CO2 Flooding in Tight Oil Reservoirs. Energies 2022, 15, 3015. [Google Scholar] [CrossRef]
  13. Li, D.; Saraji, S.; Jiao, Z.; Zhang, Y. An experimental study of CO2 injection strategies for enhanced oil recovery and geological sequestration in a fractured tight sandstone reservoir. Geoenergy Sci. Eng. 2023, 230, 212166. [Google Scholar] [CrossRef]
  14. Fang, P.; Zhang, Q.; Zhou, C.; Yang, Z.; Yu, H.; Du, M.; Chen, X.; Song, Y.; Wang, S.; Gao, Y.; et al. Chemical-Assisted CO2 Water-Alternating-Gas Injection for Enhanced Sweep Efficiency in CO2-EOR. Molecules 2024, 29, 3978. [Google Scholar] [CrossRef]
  15. Zhu, Y.; Wang, X.; Kang, Y.; Guo, C.; He, Q.; Li, C. Characterization of Stages of CO2-Enhanced Oil Recovery Process in Low-Permeability Oil Reservoirs Based on Core Flooding Experiments. Energies 2024, 17, 5469. [Google Scholar] [CrossRef]
  16. Liu, Y.; Hao, M.; Bi, R.; Bian, C.; Wang, X. Research on Gas Channeling Identification Using the Fuzzy Comprehensive Evaluation Method. Energies 2024, 17, 3908. [Google Scholar] [CrossRef]
  17. Qi, X.; Zhou, T.; Lyu, W.; He, D.; Sun, Y.; Du, M.; Wang, M.; Li, Z. Front Movement and Sweeping Rules of CO2 Flooding under Different Oil Displacement Patterns. Energies 2024, 17, 15. [Google Scholar] [CrossRef]
  18. Kong, F. Experimental study on influencing factors of gas channeling during immiscible CO2 flooding in low-permeability reservoirs. J. China Univ. Pet. (Ed. Nat. Sci.) 2021, 45, 97–103. [Google Scholar]
  19. Li, C. Influencing factors and laws of gas channeling during CO2 flooding in ultra-low-permeability reservoirs. Spec. Oil Gas Reserv. 2018, 25, 82–86. [Google Scholar]
  20. Zhang, S. Identification method of gas-channeling channels during CO2 flooding in low-permeability reservoirs. Pet. Geol. Recovery Effic. 2020, 27, 101–106. [Google Scholar]
  21. Gao, Y.; Zhao, M.; Wang, J.; Zong, C. Production characteristics and gas-channeling laws of immiscible CO2 flooding in ultra-low-permeability reservoirs. Pet. Explor. Dev. 2014, 41, 79–85. [Google Scholar] [CrossRef]
  22. Qian, K.; Yang, S.; Dou, H.; Zhang, J. Microscopic oil-displacement characteristics of different CO2 injection modes in ultra-low-permeability reservoirs. Xinjiang Pet. Geol. 2020, 41, 204–208. [Google Scholar]
  23. Liu, H.; Li, X.; Li, P.; Gao, Y.; Xia, J.; Yu, P. Effect of gas injection rate on recovery degree during CO2 flooding in ultra-low-permeability heterogeneous reservoirs. Oil Drill. Prod. Technol. 2016, 38, 105–109. [Google Scholar]
  24. Liu, X. Field practice and performance evaluation of CO2 miscible flooding in an ultra-low-permeability beach-bar sandstone reservoir. Pet. Geol. Recovery Effic. 2020, 27, 113–119. [Google Scholar]
  25. Jia, Y.; Yu, J.; Yan, C.; Wang, S.; Wang, Z.; Li, H.; Qu, X.; Qi, S. Analysis of gas-channeling law and technical countermeasures of CO2 flooding in Chang 8 ultra-low-permeability reservoirs. Drill. Prod. Technol. 2025, 48, 76–84. [Google Scholar]
  26. Zhao, L.; Liu, T.; Zhang, Y.; Chen, H.; Han, F.; Zhou, J.; Jiang, S.; Yao, Y. Microscopic visualization experiment on gas occurrence characteristics in CO2 flooding. Oil Drill. Prod. Technol. 2023, 45, 358–367. [Google Scholar]
  27. Cui, C.; Yan, D.; Yao, T.; Wang, J.; Zhang, C.; Wu, Z. Migration law of CO2 flooding front and prediction method of gas channeling timing: A case study of G89-1 block in Shengli Oilfield. Pet. Reserv. Eval. Dev. 2022, 12, 741–747. [Google Scholar]
  28. Tang, R.; Chen, L.; Xie, X.; Zhao, C.; Wang, B.; Jiang, S. Evaluation and field application of synergistic oil displacement by CO2-viscoelastic fluid in low-permeability tight reservoirs. Pet. Reserv. Eval. Dev. 2025, 15, 672–678. [Google Scholar]
  29. Li, Y.; Liu, J.; Zhang, P.; Gong, X.; Ma, J. Pilot test of CO2 huff and puff for enhanced oil recovery and storage at ultra-high water cut stage in Shanshan Oilfield. Xinjiang Pet. Geol. 2023, 44, 327–333. [Google Scholar]
  30. Wang, Y.; Lin, L.; Wang, H. Dynamic prediction for the whole development process of CO2 flooding in low-permeability reservoirs. Pet. Reserv. Eval. Dev. 2025, 15, 664–671. [Google Scholar]
  31. Meng, X.; Liu, T.; Li, Y.; Liu, C.; Xue, B.; Lü, P.; Wang, N.; Diwu, P. Quantitative model and application of channeling pathways in polymer flooding reservoirs based on self-tracer. China Offshore Oil Gas 2022, 34, 108–116. [Google Scholar]
  32. Liu, T.; Jiang, H.; Li, X. Mathematical model of a semi-analytical method system for interwell tracer tests. Acta Pet. Sin. 2007, 5, 118–123. [Google Scholar]
  33. Xu, Y.; Liu, W.; Zhao, H.; Chen, Q. CO2 flooding simulation and channeling-path prediction method based on connection elements. J. China Univ. Pet. (Ed. Nat. Sci.) 2025, 49, 158–168. [Google Scholar]
  34. Mu, J.; Yan, X.; Zhang, S.; Shi, L.; Li, D.; Ma, X. Study on the effective distance of carbon dioxide in tight reservoir matrix. Xinjiang Oil Gas 2024, 20, 64–71. [Google Scholar]
  35. Liu, T.; Zhao, L.; Zhang, S.; Wang, Y.; Li, X. Theoretical method for injector-producer spacing design based on recovery factor of CO2 flooding. Pet. Geol. Recovery Effic. 2025. early view. [Google Scholar]
  36. Shi, X.; Wen, S.; Liu, T.; Liu, J.; Zhao, L.; Sun, J. Seepage mechanism of gas tracers in fractured horizontal wells of tight gas reservoirs. Unconv. Oil Gas 2026, 13, 89–97. [Google Scholar]
  37. Cao, C.; Chen, X.; Zhang, L.; Zhou, S.; Zhao, Y.; Wen, S.; Li, Q.; Zhang, D.; Hu, Y.; Shen, B. Mechanism of natural gas recovery enhancement and gas-channeling control by CO2 mixed-system injection in carbonate gas reservoirs. Nat. Gas Ind. 2025, 45, 92–103. [Google Scholar]
  38. Cao, X.; Xiong, Y.; Feng, Q.; Zhao, L.; Zhang, S.; Liu, T.; Wang, S.; Yang, Y. Collaborative evaluation method of CO2 flooding and storage in low-permeability to tight reservoirs. Pet. Geol. Recovery Effic. 2023, 30, 44–52. [Google Scholar]
Figure 1. Schematic diagram of dual-medium seepage model.
Energies 19 02370 g001
Figure 2. Inversion process of characteristic parameters of gas channeling pathways.
Energies 19 02370 g002
Figure 3. Schematic diagram of joint identification boundary.
Energies 19 02370 g003
Figure 4. Well location map of the test area.
Energies 19 02370 g004
Figure 5. Distribution maps of characteristic parameters of gas channeling pathways: (a) development degree of gas channeling pathways; (b) seepage capacity of gas channeling pathways.
Energies 19 02370 g005
Figure 6. Joint identification boundary of CO2 concentration and gas channeling pathway parameters.
Energies 19 02370 g006
Table 1. Comparison of calculated and actual values of early gas breakthrough characteristic parameters.
Gas Breakthrough TypeInjection WellProduction WellGas Breakthrough TimeCO2 Concentration in Produced Gas
Actual Value
/d
Theoretical Value
/d
Error
/%
Actual Value
/f
Theoretical Upper Limit
/f
Theoretical Lower Limit
/f
Theoretical Mean Value
/f
Error
/%
Slight gas breakthroughJ10P04562563.80.310.020.080.000.02−5.38
J12P09435435.10.020.130.380.050.131.25
J18P09632632.00.000.130.400.040.132.68
J29P09437437.60.150.130.390.050.131.55
J31P09457457.80.180.130.370.040.13−2.99
J12P11513513.50.100.020.030.010.02−27.97
J08P14609609.30.060.020.110.000.02−1.20
J10P14610609.2−0.130.020.110.000.02−1.73
J18P14612612.00.000.020.080.000.02−1.12
J10P15489489.10.010.030.150.010.035.17
J18P22673673.00.010.030.100.010.03−2.07
J31P22498498.10.020.030.110.010.030.76
J29P25481480.7−0.070.020.120.000.02−13.64
J29P30436436.0−0.010.080.150.040.08−1.70
J31P30457456.4−0.130.050.100.030.051.36
J29P37379378.7−0.090.050.050.050.059.08
J31P41457456.7−0.070.050.090.030.051.65
Obvious gas breakthroughJ08P03690689.9−0.020.210.480.090.21−1.27
J08P13709707.6−0.200.200.540.070.20−0.48
J18P13712713.20.160.200.590.070.201.68
J12P20496495.6−0.080.210.480.090.21−1.25
J31P32512511.5−0.110.220.650.080.221.34
Severe gas breakthroughJ12P21130129.8−0.170.770.970.610.77−0.16
J29P21130130.10.060.770.960.590.76−1.85
Table 2. Inversion results of characteristic parameters of gas channeling pathways.
Gas Breakthrough TypeInjection WellProduction WellCharacteristic Parameters of Gas Channeling Path
Thickness Ratio
/f
Equivalent Thickness
/m
Permeability Ratio
/f
Permeability
/mD
Slight gas breakthroughJ08P140.0050.062.32212.1
J10P040.0030.045.10295.8
J10P140.0050.072.31212.1
J10P150.0060.082.76212.1
J12P090.0130.1310.85629.3
J12P110.0040.046.72258.1
J18P090.0390.513.32192.6
J18P140.0050.082.54212.1
J18P220.0070.122.55212.1
J29P090.0220.296.21360.2
J29P250.0040.051.90258.1
J29P300.0140.199.10527.8
J29P370.0040.0440.302337.4
J31P090.0270.284.64269.1
J31P220.0050.073.35258.1
J31P300.0110.137.53436.7
J31P410.0090.1010.75258.1
Slight gas breakthroughJ08P030.0600.953.73216.1
J08P130.0600.892.19127.0
J12P200.0450.595.05292.9
J18P130.0600.871.96113.7
J31P320.0900.622.41139.8
Severe gas breakthroughJ12P210.0860.8148.002784.0
J29P210.0670.8359.003422.0
Table 3. Classification table of gas channeling pathway types.
Type of Gas Channeling PathFracture TypeFracture and Thin Channel Coexisting TypeDominant Fracture Channel Type
Gas breakthrough type in production wellsSlight gas breakthrough (Type II)Obvious gas breakthrough (Type III)Severe gas breakthrough (Type IV)
CO2 concentration in produced gas (C)/f2% < C ≤ 20%20% < C ≤ 60%60% < C ≤ 100%
Thickness ratio of gas channeling path (hc)/f0 < hc ≤ 0.050.05 < hc ≤ 0.15hc > 0.15
Permeability ratio of gas channeling path (Kc)/f1 < Kc ≤ 5050 < Kc ≤ 100Kc > 100
Seepage capacity of gas channeling pathLow fluidity, restricted gas flowGas fluidity is improved, and the channel structure becomes more complexGas fluidity is greatly improved, and fracture channels are dominant.
Disclaimer/Publisher’s Note: The statements, opinions and data contained in all publications are solely those of the individual author(s) and contributor(s) and not of MDPI and/or the editor(s). MDPI and/or the editor(s) disclaim responsibility for any injury to people or property resulting from any ideas, methods, instructions or products referred to in the content.