Article

Transient Numerical Simulations of Low-Cost KNSB Solid-Propellant Rocket Motors

1
College of Astronautics, Nanjing University of Aeronautics and Astronautics, Nanjing 211106, China
2
China Academy of Aerospace Aerodynamics, Beijing 100074, China
*
Author to whom correspondence should be addressed.
Energies 2026, 19(10), 2260; https://doi.org/10.3390/en19102260
Submission received: 1 March 2026 / Revised: 5 April 2026 / Accepted: 4 May 2026 / Published: 7 May 2026

Abstract

Potassium nitrate and sorbitol (KNSB) is a promising low-cost solid propellant for aerospace, characterized by stable combustion and a low pressure exponent. However, its application is constrained by a deficiency in detailed numerical simulation studies for solid rocket motors (SRMs). This study develops a comprehensive numerical model for a KNSB SRM, incorporating dynamic mesh techniques to simulate real-time burning surface regression. Steady-state internal flow field analysis proves to be well-validated by literature data, with combustion pressure and thrust errors of 7.7% and 3.2%, respectively. Increasing oxidizer mass fraction from 57.5% to 70% leads to a significant temperature rise of 22.15%. Dynamic simulations reveal that thrust and pressure initially increase after ignition but later decline as the regressing surface reduces gas generation below the nozzle exhaust rate. Comparison with literature yields an average thrust error of 4.9%, with simulated trends matching documented behavior well. This research provides a robust reference for performance prediction and supports further development of KNSB SRMs.

1. Introduction

The rapid development of the commercial aerospace sector has led to growing market demand for low-cost, high-performance solid rocket motors [1,2,3]. Solid rocket motors are indispensable in areas such as satellite power system, launch vehicles, and sounding rockets due to their advantages of simple structure, high reliability, and ease of maintenance. The propellant, as the core component of the motor, directly determines its overall performance [4,5,6,7].
KNSB propellant, composed of potassium nitrate and sorbitol, features a moderate burning rate, high safety, and low cost. Considering the pursuit of ultra-low-cost and environmentally friendly propulsion, researchers have even evaluated the suitability of steam rocket propulsion systems as potential alternatives to KNSB for amateur model rockets [8]. Although its specific impulse is relatively low, it is widely used in amateur rockets and small-scale scientific test rockets. Numerical simulation of the combustion laws, energy release mechanisms, and internal flow-field evolution of KNSB propellant in a motor provides important insights for performance optimization. Furthermore, simulation technology can significantly reduce the number of tests, shorten development cycles, and accelerate the development of new solid rocket motors. Optimization methodologies for KNSB motors, particularly those employing Bates-type grain configurations, have focused on establishing efficiency limits by evaluating the relationship between maximum thrust and propellant mass through iterative computational processes [9].
Although some experimental studies have been conducted on KNSB propellant motors—such as the successful flight of the TU-1 model rocket and static ignition tests of UAV booster motors [2], and the development of university-level sounding rockets integrated with internal ignition and active recovery systems [10]—existing numerical simulations still suffer from insufficient model accuracy, weak multi-physics coupling capability, and limited ability to simulate complex working conditions, making it difficult to fully capture the dynamic characteristics of the motor in actual operation.
Extensive studies have been conducted on propellants from the perspectives of combustion mechanisms, material modification, and performance regulation. For example, Chen et al. (2019) numerically analyzed the combustion characteristics of AP-HTPB propellant under different pressures, revealing significant effects of pressure on burning rate and flame structure [6]. Han et al. (2020) developed a low-burning-rate, high-solid-loading HTPB propellant, providing a viable formulation for large motors [7]. Recent research on aluminum–lithium alloys in propellants has shown their potential to significantly improve combustion efficiency and induce micro-explosion effects, though challenges remain in particle stability and compatibility [11]. Furthermore, Li et al. (2024) investigated the ignition and combustion characteristics of HTPE solid propellants, revealing that the minimum ignition energy and burning rate are highly sensitive to initial environmental conditions and specific burning rate regulators [12]. Xin Kai et al. (2025) reviewed high-pressure combustion models and regulation methods for NEPE propellants, indicating that nanotechnology and composite modification are effective approaches to enhance combustion performance [13].
Despite advances in various novel propellants [14], systematic research on the dynamic combustion characteristics and high-fidelity, multi-field coupled numerical simulation of low-cost, safe sugar-based propellants like KNSB remains insufficient, hindering their further engineering application.
This article numerically models the operational process of a KNSB solid rocket motor, analyzing steady-state performance and the temporal evolution of parameters such as chamber pressure, temperature, and gas flow velocity. To investigate the impact of oxidizer ratio on engine performance, the internal flow field parameters of motors with varying fuel-to-oxidizer ratios were analyzed, revealing how these parameters change with increasing oxidizer proportion. This simulation provided a reference for selecting the optimal propellant ratio and advancing the application of such safe, low-cost propellants.

2. KNSB Solid Rocket Motor 2D Dynamic Numerical Model

Utilizing numerical simulation technology to predict the performance of solid rocket motors can significantly reduce the research and development costs while enhancing research efficiency. Currently, there has been extensive research on quasi-steady-state numerical models for solid rocket motors, which can provide preliminary simulations of motor operation. However, these models are inadequate in terms of accurately simulating the dynamic changes in geometric boundaries due to the regression of the propellant surface as the solid fuel decreases. Recent studies have employed dynamic mesh technology and User-Defined Functions (UDFs) to simulate the three-dimensional transient internal flow field and surface regression, proving that accounting for boundary movement is essential for accurate performance prediction [15]. This regression impacts the parameters of the internal flow field and the prediction of propellant combustion performance. Therefore, to accurately simulate the dynamic processes of rocket motor operation, quasi-static models do not suffice. It is essential to employ dynamic mesh technology to simulate the changes occurring at the propellant surface.
In this simulation, Fluent simulation software (2023 R1) is utilized to establish a two-dimensional numerical simulation model for the KNSB solid rocket motor. The dynamic mesh technology is employed to track the movement of the propellant surface in real-time, allowing for dynamic updates of the propellant surface and thereby enhancing the authenticity and reliability of the simulation. This work also lays a foundation for subsequent numerical simulations.

2.1. Construction of the Internal Flow Field Geometry Model

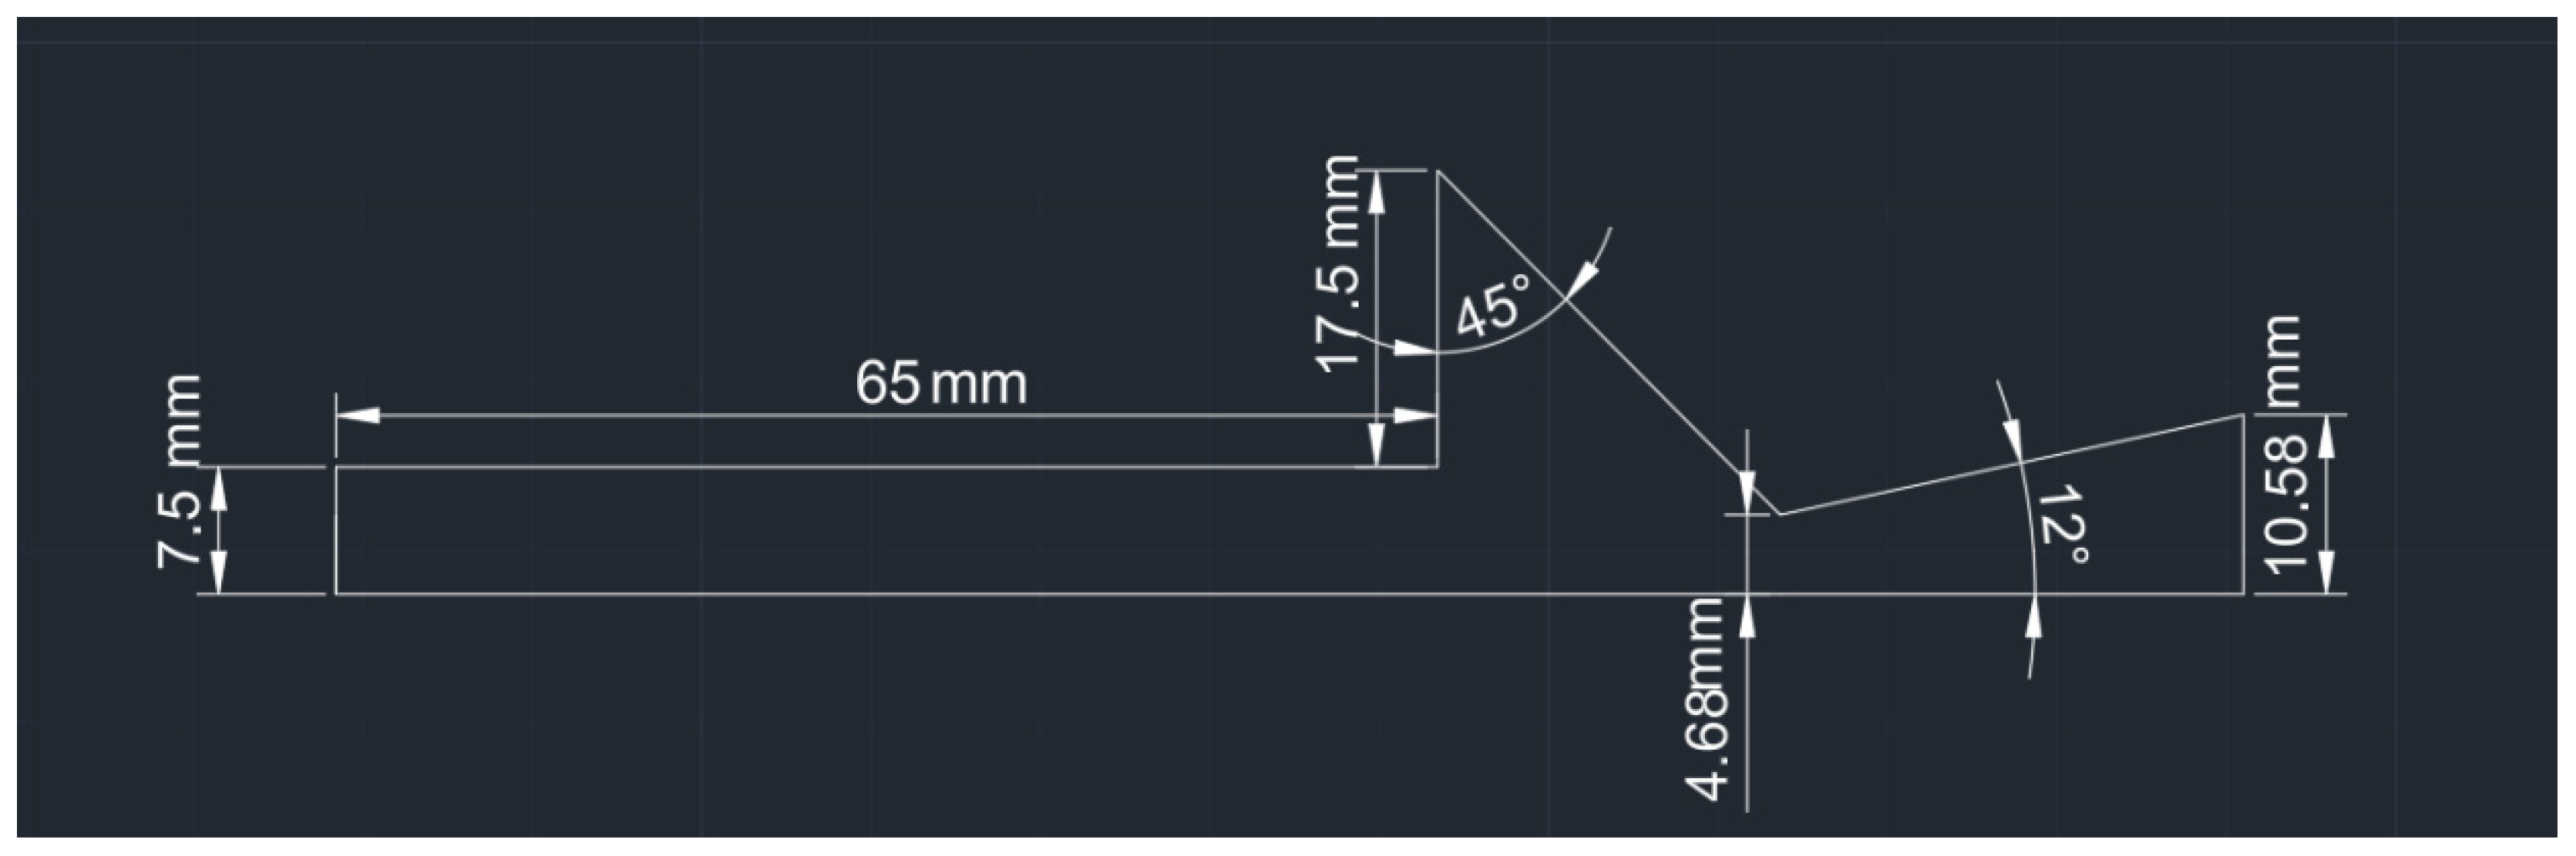
The grain is a tubular type with an inner diameter of 15 mm, a length of 65 mm, and an outer diameter of 50 mm. It serves as structural support and thermal insulation, a restrictor to prevent burning on its outer surface, and a thermal insulator. The combustion chamber is constructed from AL6061 aluminum alloy, featuring an outer diameter of 60 mm and a wall thickness of 5 mm, capable of withstanding temperatures up to 1600 K and pressures up to 25 bar [16]. The nozzle is designed to expand combustion gases from 25 bar to ambient atmospheric pressure. The combustion rate formula for the solid propellant is defined as follows [17,18]:
r ˙ = a p c n
where the constants a and n are determined empirically [19].
P c = K 1 / ( 1 n ) a ρ b c
where r . represents the regression rate, a is the pre-exponential factor (burning rate coefficient), n is the pressure exponent, and P c is the combustion chamber pressure. In Equation (2), K denotes the burning area-to-throat area ratio, ρ is the density of the solid propellant, and c represents the characteristic velocity.
The combustion pressure is calculated using the ratio K of the burning area to the nozzle throat area and the characteristic velocity. The throat diameter is determined to be 9.37 mm. Assuming an isentropic expansion process for optimal expansion, an expansion ratio of 5.1 is established, leading to an exit diameter of 21.16 mm, with the material selected as stainless steel. Finally, the propellant grain, combustion chamber, and nozzle are assembled into a complete motor structure to facilitate the function of converting propellant combustion into gaseous products, which are then accelerated through the nozzle to generate thrust. Given the axisymmetry, the finalized geometric model is illustrated in Figure 1.

2.2. Numerical Simulation Model

2.2.1. Computational Assumptions

While a one-dimensional flow model can simulate parameters in simple internal flow fields, its precision is insufficient for analyzing more complex internal flow structures. Therefore, multidimensional models are typically required for simulating complex internal flow fields, albeit with increased computational cost. Given that a three-dimensional model is computationally intensive and the geometry in this simulation is axisymmetric, a two-dimensional model is selected for comprehensively simulating the various parameters of the internal flow field. Neglecting viscous effects is detrimental to the fidelity of internal flow field simulations. To achieve a more accurate representation of the flow field, this simulation accounts for viscous effects in analyzing the internal flow field parameters, thereby enhancing the accuracy and fidelity of the simulation.

2.2.2. Governing Equations

The simulation employs the Navier–Stokes (N-S) equations to calculate the internal flow field. The Reynolds averaging method is adopted, treating the flow as a superposition of a time-averaged mean flow and instantaneous fluctuating motions. The time-averaged equations for turbulence, including the continuity equation, momentum equations and energy equation, are presented below [20,21,22,23,24].
(1)
Continuity Equation:
ρ t = ( ρ u i ) x i
(2)
Momentum Equations:
ρ ( u u x + v u y ) = p x + μ ( 2 u 2 x + 2 u 2 y ) ( u ¯ u ¯ x + v ¯ u ¯ y )
ρ ( u v x + v v y ) = p y + μ ( 2 v 2 x + 2 v 2 y ) ( u ¯ v ¯ x + v ¯ v ¯ y )
where u, v are velocity components in different coordinate directions; ρ is the fluid density; μ is the dynamic viscosity.
(3)
Energy Equation:
( ρ e ) t + ( ρ u j h ) x i = d i v ( k g r a d ( T ) ) + ( u i τ i j ) x i
where u i represents a component of the fluid velocity vector u in a specific direction; T is the temperature; τ i j represents the viscous stress tensor; and h signifies the specific enthalpy.

2.2.3. Turbulence Model

The gas flow within the internal flow field is turbulent. During the convective heat transfer between the gas and the burning surface, the combustion at the surface is significantly influenced by the turbulent gas flow. Therefore, the effects of turbulence cannot be neglected. This numerical simulation accounts for turbulent flow to enhance the accuracy of the results. This study employs the Realizable k-ε turbulence model [25,26], which offers good adaptability:
t ( ρ k ) + x j ( ρ k u j ) = x j [ ( μ + μ t σ k ) k x j ] + G k + G b ρ ε Y M + S k
t ( ρ ε ) + x j ( ρ ε u j ) = x j [ ( μ + μ ε σ ε ) ε x j ] + ρ C 1 S ε ρ C 2 ε 2 k + ν ε + C 1 ε ε k C 3 ε G b + S ε
where μ t denotes the turbulent viscosity, σ k is the turbulent Prandtl number for the turbulent kinetic energy k (typically σ k = 1.0), G k represents the generation of turbulent kinetic energy due to the mean velocity gradients, G b is the generation of turbulent kinetic energy due to buoyancy, Y M represents the contribution of fluctuating dilatation to the overall dissipation rate, S k is a user-defined source term for turbulent kinetic energy, σ ε is the turbulent Prandtl number for the turbulent dissipation rate ε (typically σ ε = 1.2), ν represents the kinematic viscosity, and S ε is a user-defined source term for the turbulent dissipation rate.
The advantage of the Realizable k-ε model lies in its ability to maintain consistency of Reynolds stresses with physical reality. It can more accurately simulate planar and round jet issues, better capture the mean flow in complex structures, and yields satisfactory results for rotating flows, boundary layer flows with strong adverse pressure gradients, flow separation, and secondary flows [27].
While the k ω SST model is recognized for its precision in near-wall regions, the Realizable k ϵ model was adopted in this study due to its superior performance in capturing complex vortex flows and maintaining numerical stability during mesh deformation. Previous high-fidelity three-dimensional simulations of rocket motors using dynamic mesh technology have demonstrated that the Realizable k ϵ model, when combined with enhanced wall functions, provides a more robust solution for tracking the regression of the combustion surface while maintaining an optimal balance between core flow accuracy and computational efficiency [28]. Specifically, it effectively manages the strong streamline curvature and flow separation characteristic of internal motor environments.

2.2.4. Gas–Solid Coupling Model

When the internal flow field reaches a steady state, the gas–solid coupling model is established based on mass conservation [29] as follows:
ρ g u = ρ f r ˙
where ρ g represents the density of the gas phase, u denotes the gas velocity at the solid fuel surface, ρ f represents the density of the solid fuel, and r ˙ denotes the burning rate of the solid fuel.
Equation (9) is established based on the principle of mass conservation, stating that the mass of propellant gas entering the flow field is equal to the mass loss of the grain. This conservation relationship remains valid at every instantaneous moment during the operation of the motor, thereby justifying its application in both steady-state and unsteady numerical simulations.

2.2.5. Solid Fuel Regression Rate Model

Based on ignition tests cited in references [1], the measured regression rate is 5.83 mm/s. Simultaneously, according to the burning rate formula r = a P c n , where, based on literature review, a is 5.13, n is 0.222, and P = 1.4 MPa; the calculated result is r = 5.528 mm/s. The error compared to the regression rate from the literature is 5.18%, which validates the accuracy of the formula. Therefore, this formula is adopted for solving the regression rate.

2.2.6. Combustion Reaction Model

Sorbitol serves as the fuel and potassium nitrate as the oxidizer. Within the combustion chamber, these components decompose into the products shown in the following equation through convective heat transfer. The decomposition reaction is represented as:
C 6 H 14 O 6 C O + 2 C O 2 + H 2 O + 2 H 2 + C 2 H 4 + C H 4
2 K N O 3 K 2 O + N 2 O + 2 O 2
Following decomposition, the oxidizer and fuel undergo turbulent combustion, releasing a significant amount of heat. The combustion reaction equations are:
N 2 O + 6 O 2 + C H 4 + H 2 + C 2 H 4 + 2 C O N 2 + 5 C O 2 + 5 H 2 O
K 2 O + C O 2 K 2 C O 3
The Eddy Dissipation combustion model is employed to calculate the reaction rates for the aforementioned turbulent chemical reactions. This model offers two significant advantages for simulating the internal flow field of solid rocket motors: first, it assumes that the chemical reaction rate is governed by the turbulent mixing rate rather than chemical kinetics, which bypasses the need for complex Arrhenius rate parameters that are often difficult to obtain; second, it is exceptionally well-suited for simulating turbulent diffusion flames where rapid mixing dominates the combustion process. In this model, the net rate of production for each of these steps is taken as the smaller value between the following two equations [30].
R i , r = v i , r M w , i A ρ ε k min R ( Y R v R , r M w , i )
R i , r = v i , r M w , i A B ρ ε k P Y P j N v j , r M w , j
where R i , r represents the reaction rate of species i in reaction r. v i , r denotes the stoichiometric coefficient of species i in reaction r as a reactant. M w , i is the molecular weight of species i. A denotes the pre-exponential factor. ρ is the density of the gas mixture. ε is the turbulent dissipation rate. k is the turbulent kinetic energy. Y R is the mass fraction of a key reactant R. v R , r is the stoichiometric coefficient of reactant R in reaction r. B represents an empirical constant associated with the reaction. v j , r is the stoichiometric coefficient for product species j in reaction r (in the alternative formulation). M w , j is the molecular weight of species j. N is the total number of participating species.

2.2.7. Dynamic Mesh Model

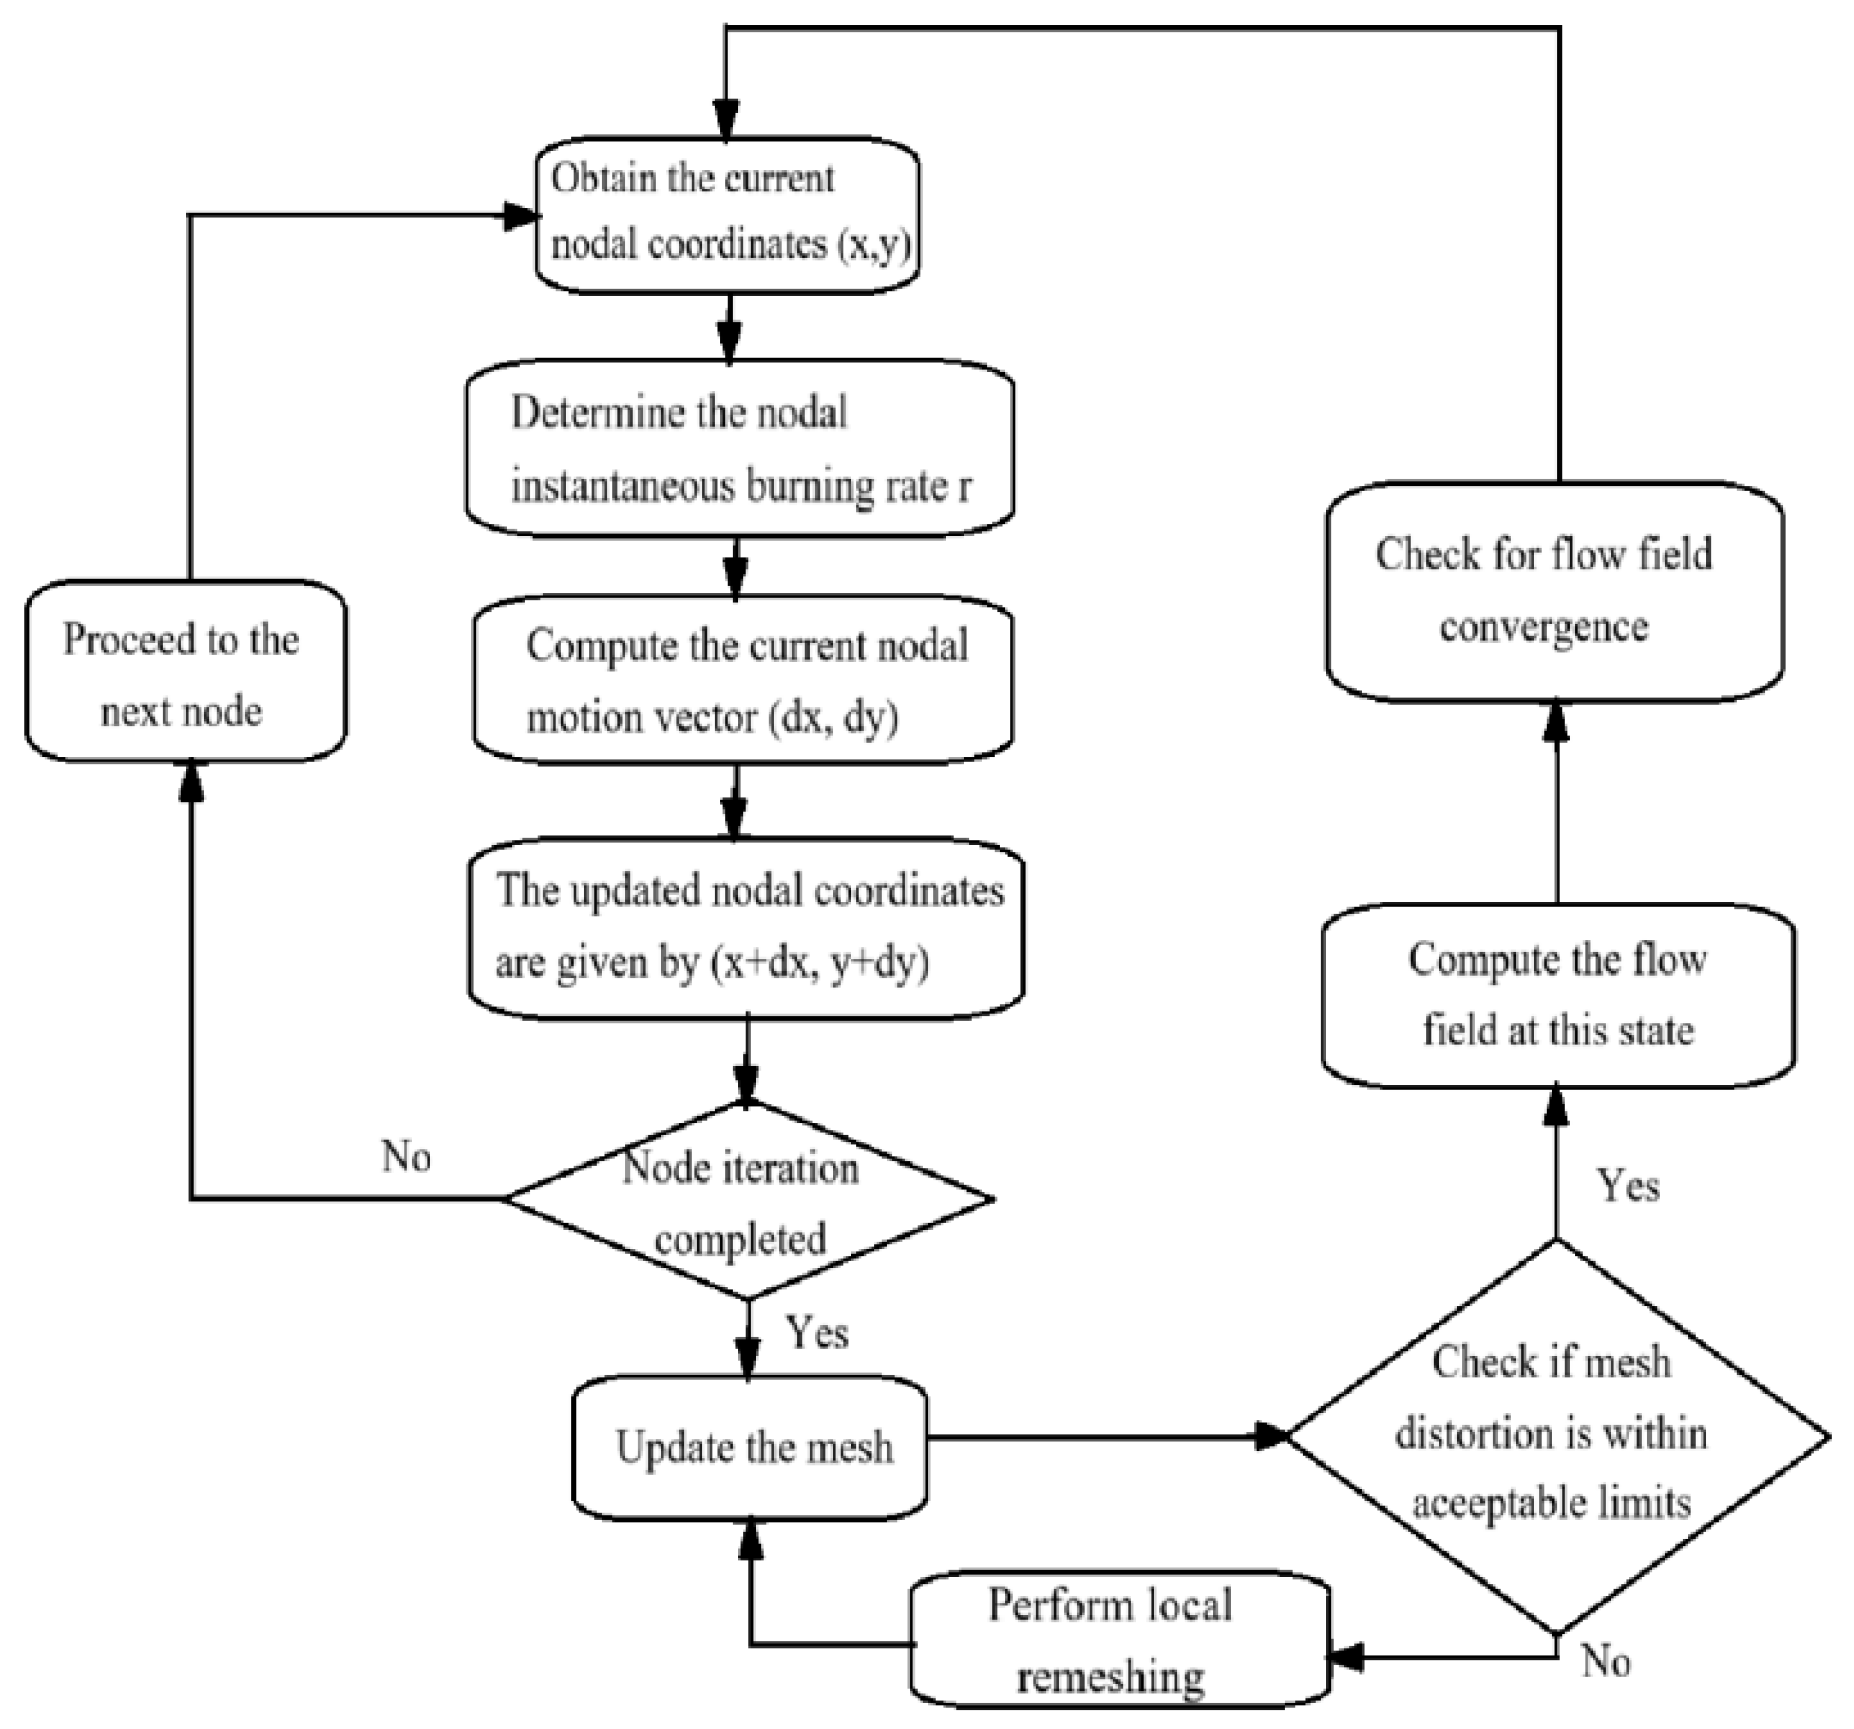
The core objective of this research is to employ dynamic mesh technology to simulate the real-time regression of the burning surface. Fluent provides three primary methods for updating the mesh: the spring-based smoothing method, the dynamic layering method, and the local remeshing method [31]. The local remeshing method is typically used in conjunction with the spring-based smoothing method. When boundary movement is too fast, leading to high mesh distortion or negative cell volumes where spring smoothing fails, the local remeshing method is invoked to reconstruct the poor-quality cells. This approach improves overall mesh quality and ensures the robustness of the simulation. In the present simulation, the local remeshing method is employed to control mesh quality, yielding effective results for simulating burning surface regression.
To control the burning surface regression, a user-defined function (UDF) is programmed to displace the nodes at the burning surface in the direction of regression based on the regression rate calculated from the previous time step. A zonal approach is adopted for mesh updates. In regions close to the burning surface where deformation is severe, the local remeshing method is applied to guarantee high mesh quality and simulation accuracy. In regions farther from the burning surface where deformation is mild, the spring-based smoothing method is used to update the mesh, thereby reducing computational cost. This hybrid zonal strategy ensures that mesh quality meets requirements while minimizing computational overhead as much as possible. The workflow for dynamic mesh updating is illustrated in Figure 2.

2.3. Computational Mesh

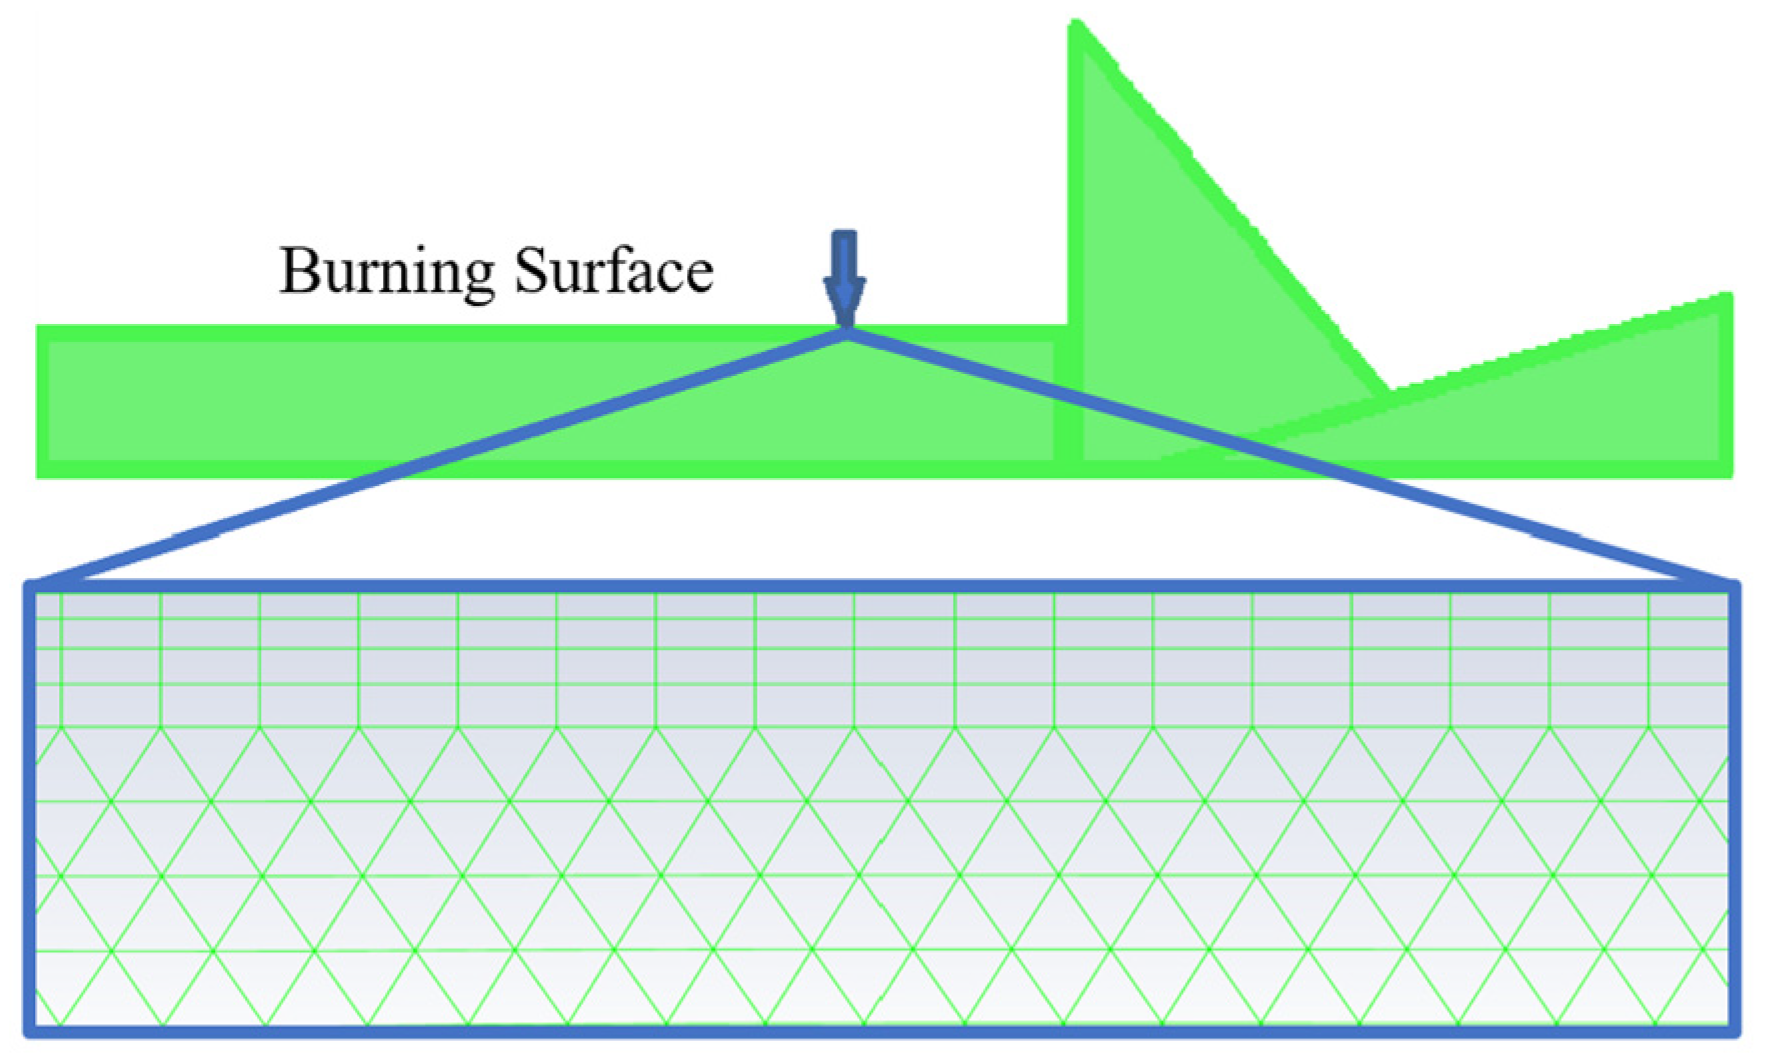
This study utilizes the ANSYS Fluent software (2023 R1) platform to conduct both steady-state and transient numerical simulations of the KNSB solid rocket motor. To better simulate the burning surface regression process and the parameter variations in the internal flow field, a dynamic mesh model for the KNSB solid rocket motor is established. Based on the previously developed geometric model of the motor, mesh refinement is applied to the boundary layer. Quadrilateral cells are employed for both the nozzle and the boundary layer regions to accelerate computation and save computational time. To facilitate the simulation of burning surface regression, a triangular mesh with boundary definition is generated in the region farther from the burning surface, enabling dynamic mesh updates via the local remeshing method. The interface is used to handle the connection between the two computational domains. The overall mesh is shown in Figure 3.
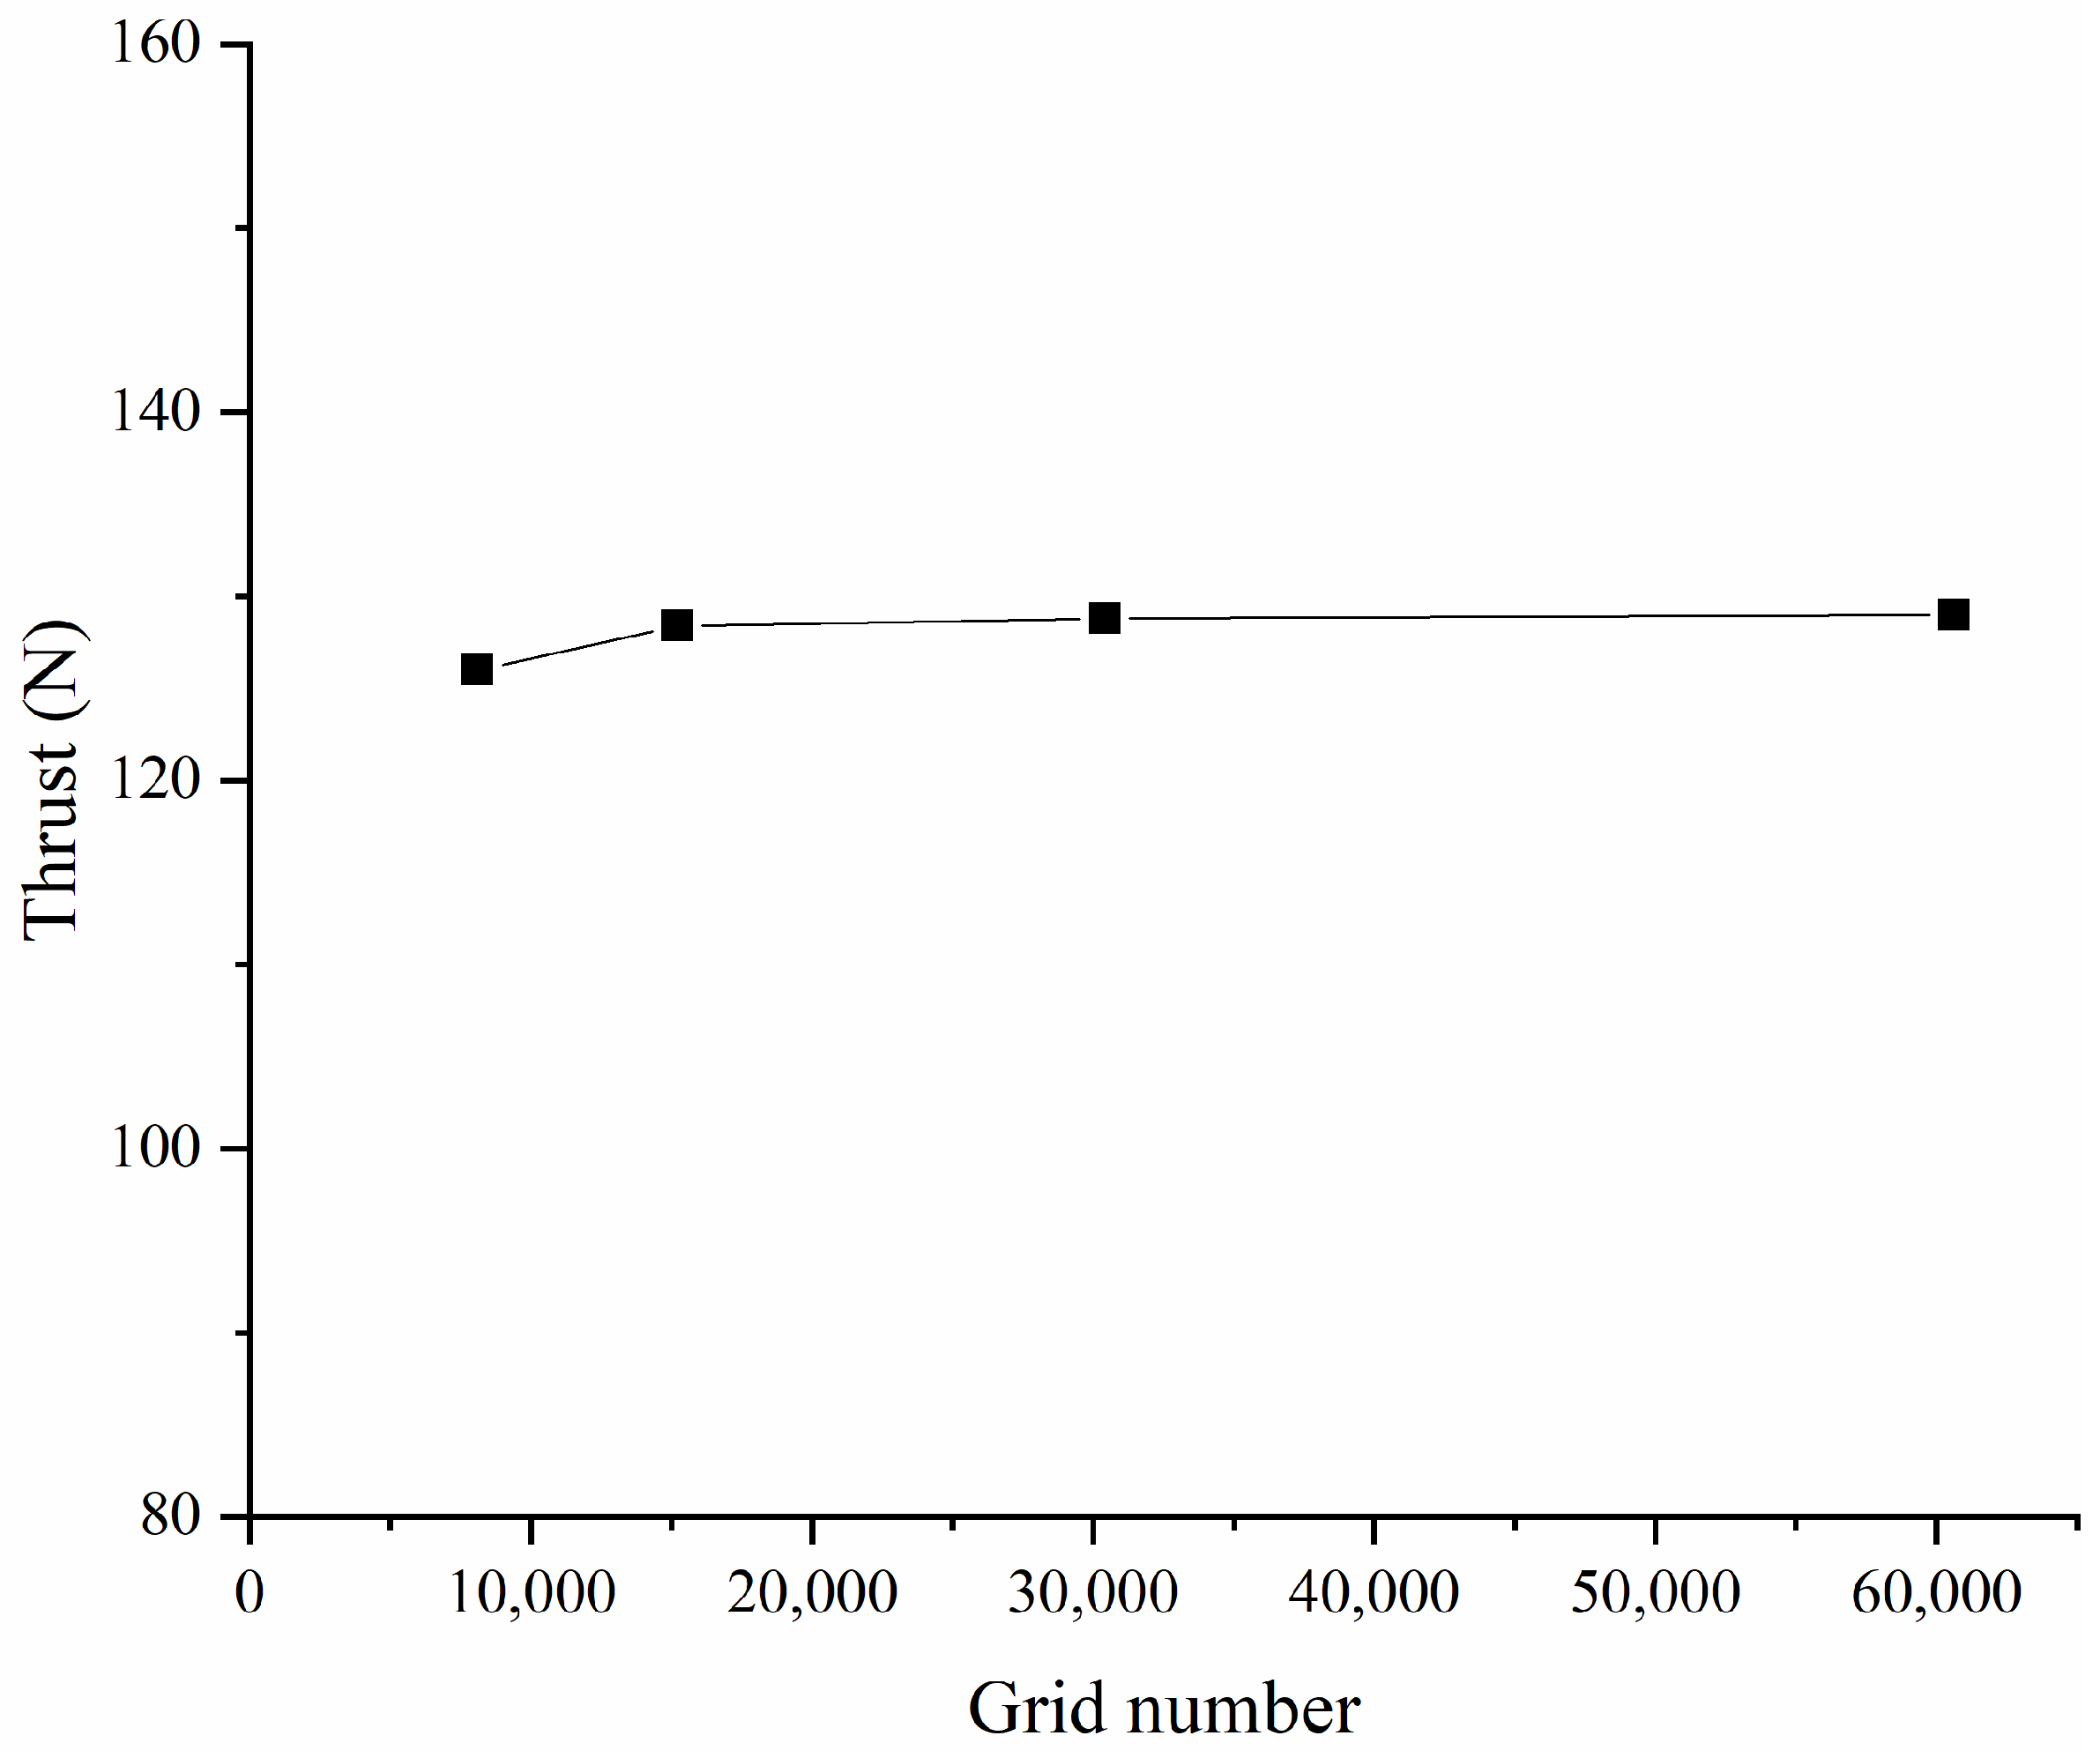
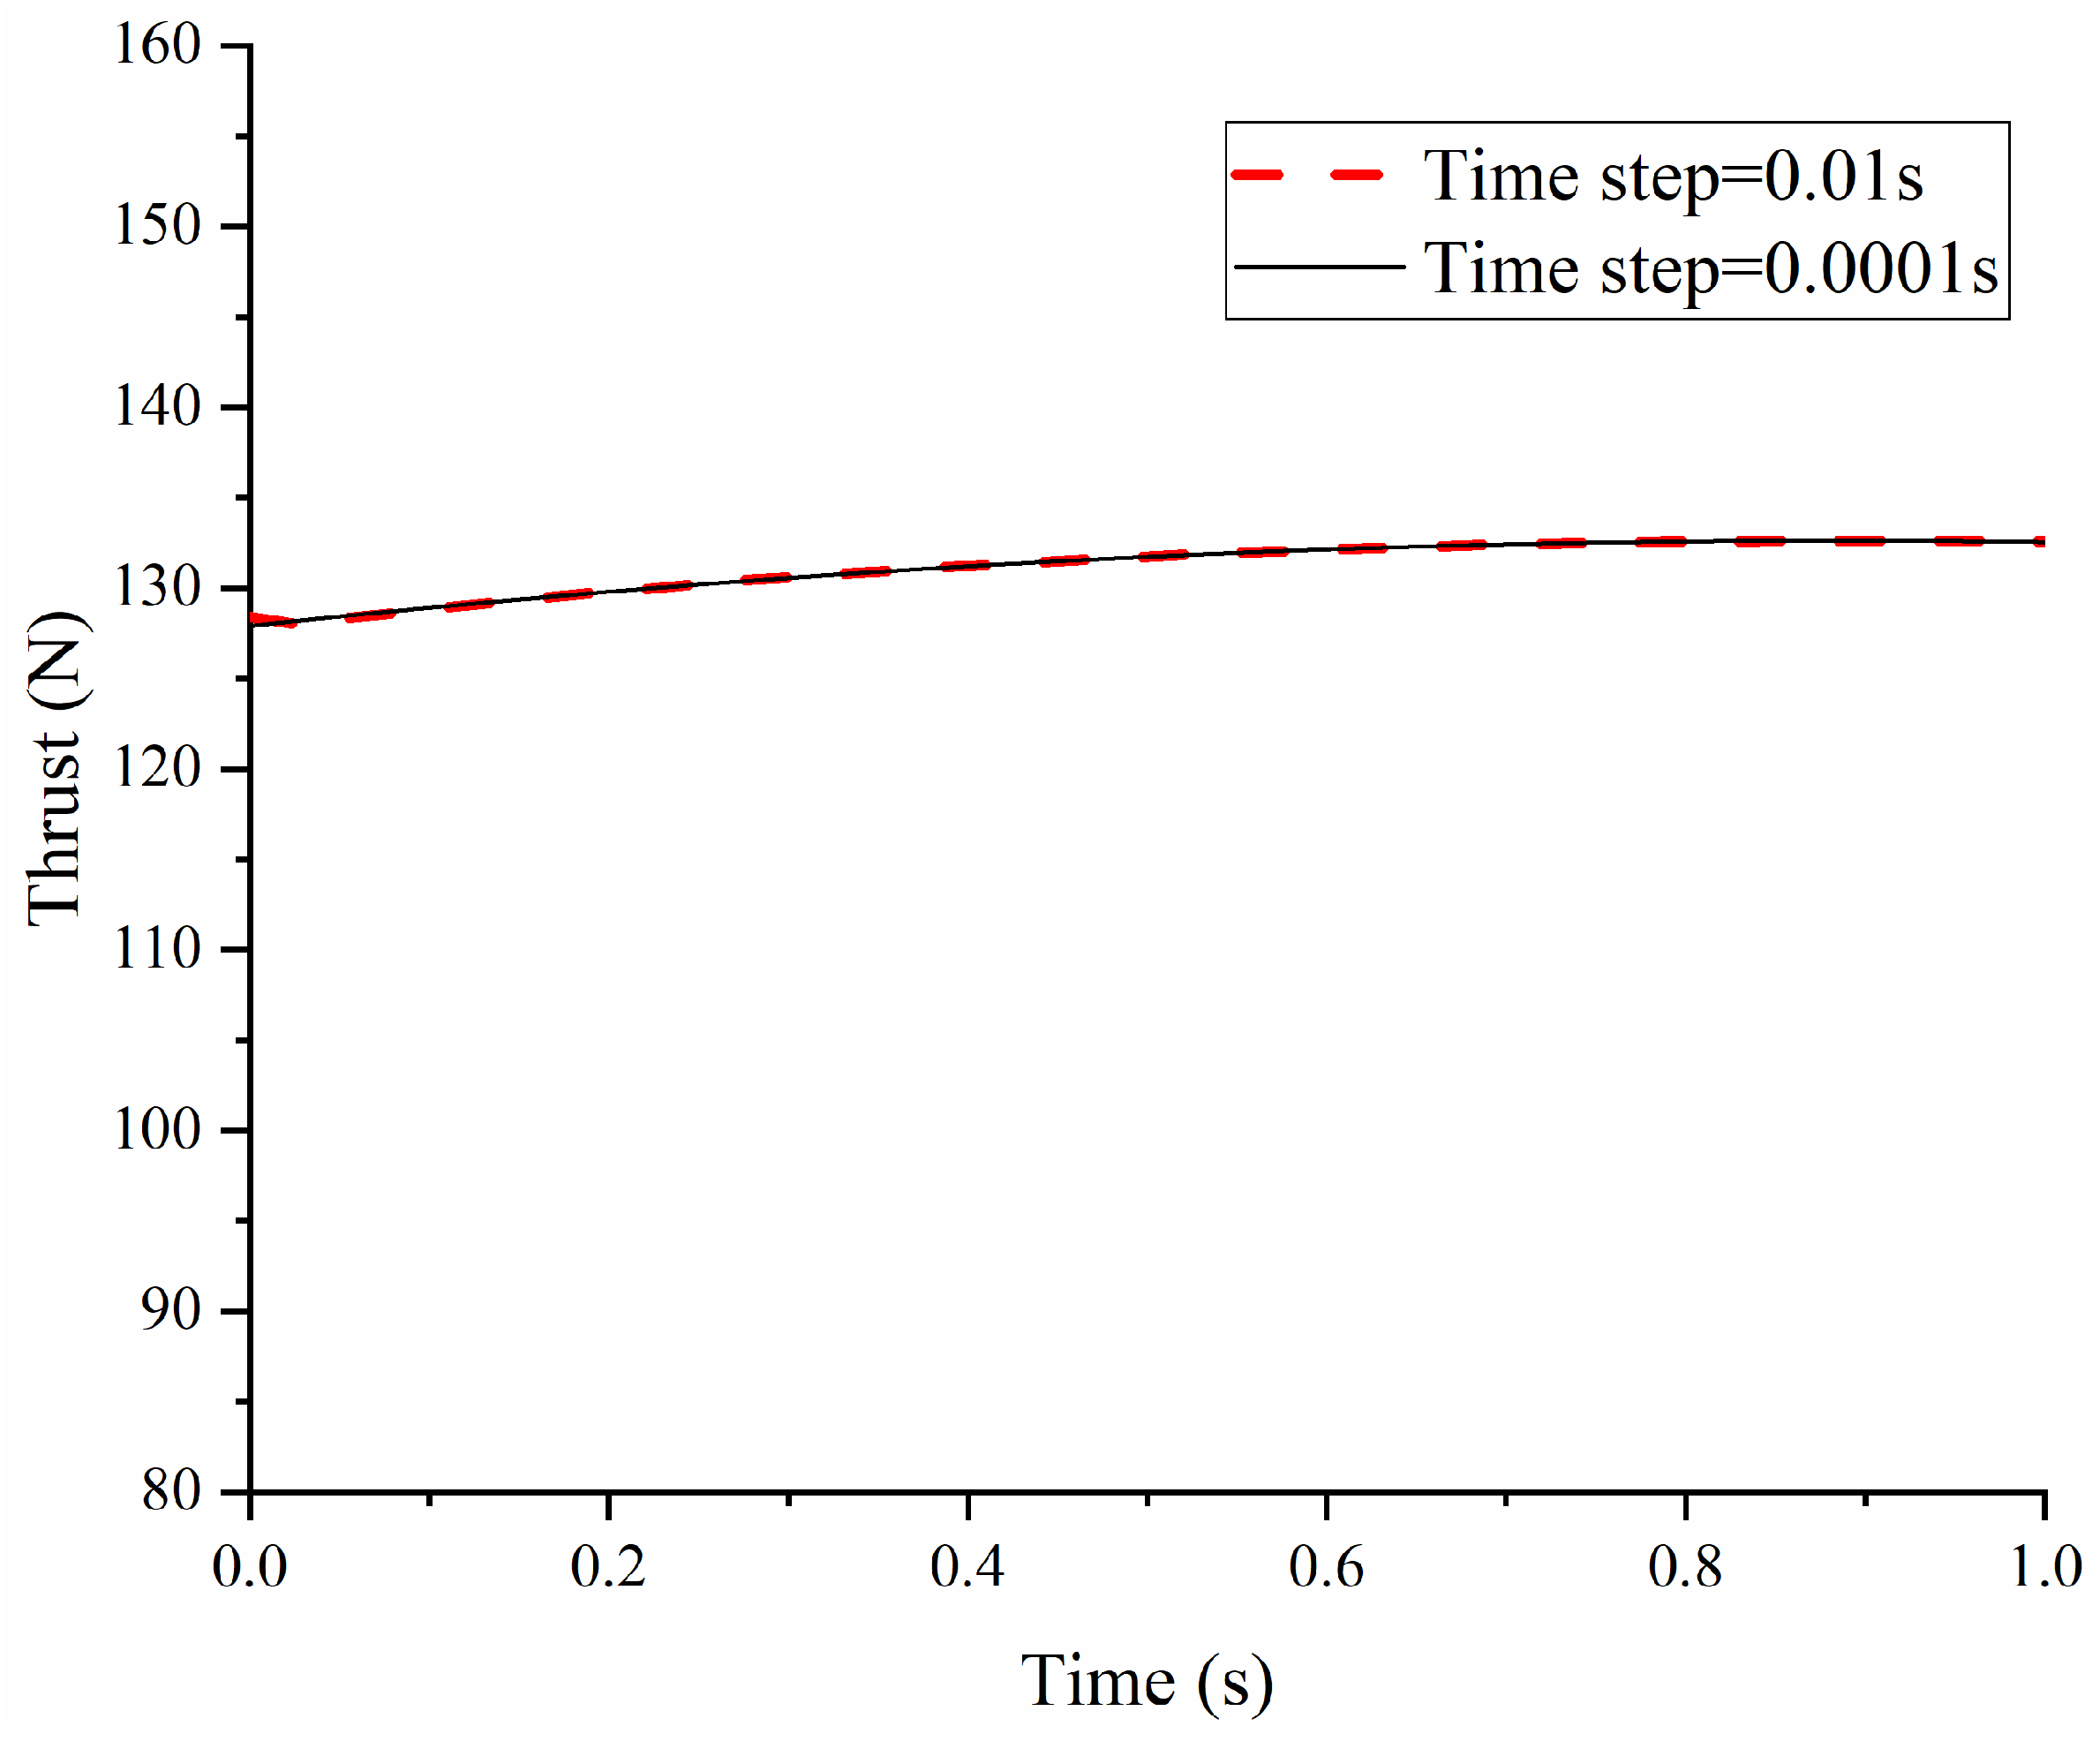
To confirm the simulation accuracy and rule out the influence of grid resolution and time step size on the computational results, a mesh independence test and a time step check were conducted, as shown in Figure 4 and Figure 5.
For the mesh independence test, four different grid resolutions were evaluated: 8106, 15,212, 30,410, and 60,628 cells. As illustrated in Figure 4, as the number of grid cells increases, the calculated thrust curves gradually converge. The thrust curves for the 30,410 and 60,628 cell grids show negligible differences, indicating that the solution has become independent of the mesh resolution. Consequently, to achieve an optimal balance between computational efficiency and simulation accuracy, the grid with 30,410 cells was selected for all subsequent simulations. Similarly, a time step check was performed using two different time steps: 0.0001 s, 0.01 s, as depicted in Figure 5. The thrust curve exhibits no significant deviation from the results obtained with the finest time step of 0.0001 s. Therefore, to minimize computational costs while maintaining high fidelity, a time step of 0.01 s was adopted for the unsteady numerical calculations in this study.

2.4. Simulation Conditions and Procedures

The boundary conditions for the computational domain are defined based on the actual operation of the motor, as summarized in Table 1. The inner surface of the motor casing is set as an adiabatic and non-slip wall boundary. The nozzle exit is defined as a pressure outlet boundary with an ambient pressure of 101,325 Pa and a temperature of 300 K. The inner surface of the propellant grain is treated as a mass flow inlet, where the mass flow rate ( q m ) is dynamically calculated in real-time based on the solid fuel regression rate model ( q m = ρ p A b r . ).
Regarding the numerical solution algorithms, the Coupled scheme is utilized as the pressure–velocity coupling solution method. The spatial discretization employs the Least Squares Cell-Based method for gradient evaluation. To ensure high calculation accuracy, the Second Order Upwind scheme is applied for the discretization of density, momentum, and energy. Pressure is discretized using the Second Order scheme, while the First Order Upwind scheme is adopted for the turbulent kinetic energy and turbulent dissipation rate to maintain computational stability during dynamic mesh deformation.
During the initialization phase, a hybrid initialization method is first employed to establish the baseline flow field. Subsequently, to simulate the ignition process and facilitate combustion convergence, a high-temperature region of 2000 K is patched into the front half of the combustion chamber. The calculation then proceeds until a stable steady-state flow field is fully achieved before initiating the transient simulations.

3. Steady-State Simulation of the KNSB Solid Rocket Motor

To validate the accuracy of the model, simulation data is compared with experimental data. Building upon this foundation, steady-state numerical simulations are conducted for different propellant formulations. This provides theoretical justification and critical reference for the design of the KNSB solid rocket motor.

3.1. Steady-State Simulation Flow Field Distribution

The boundary condition on burning surface is a mass flow inlet with 0.068 kg/s. The ratio of fuel components KNO3 and C6H14O6 is 0.65:0.35. KNO3 serves as the oxidizer, yielding 0.21 O2 upon decomposition. The nozzle outlet has a pressure of 0.1 MPa.
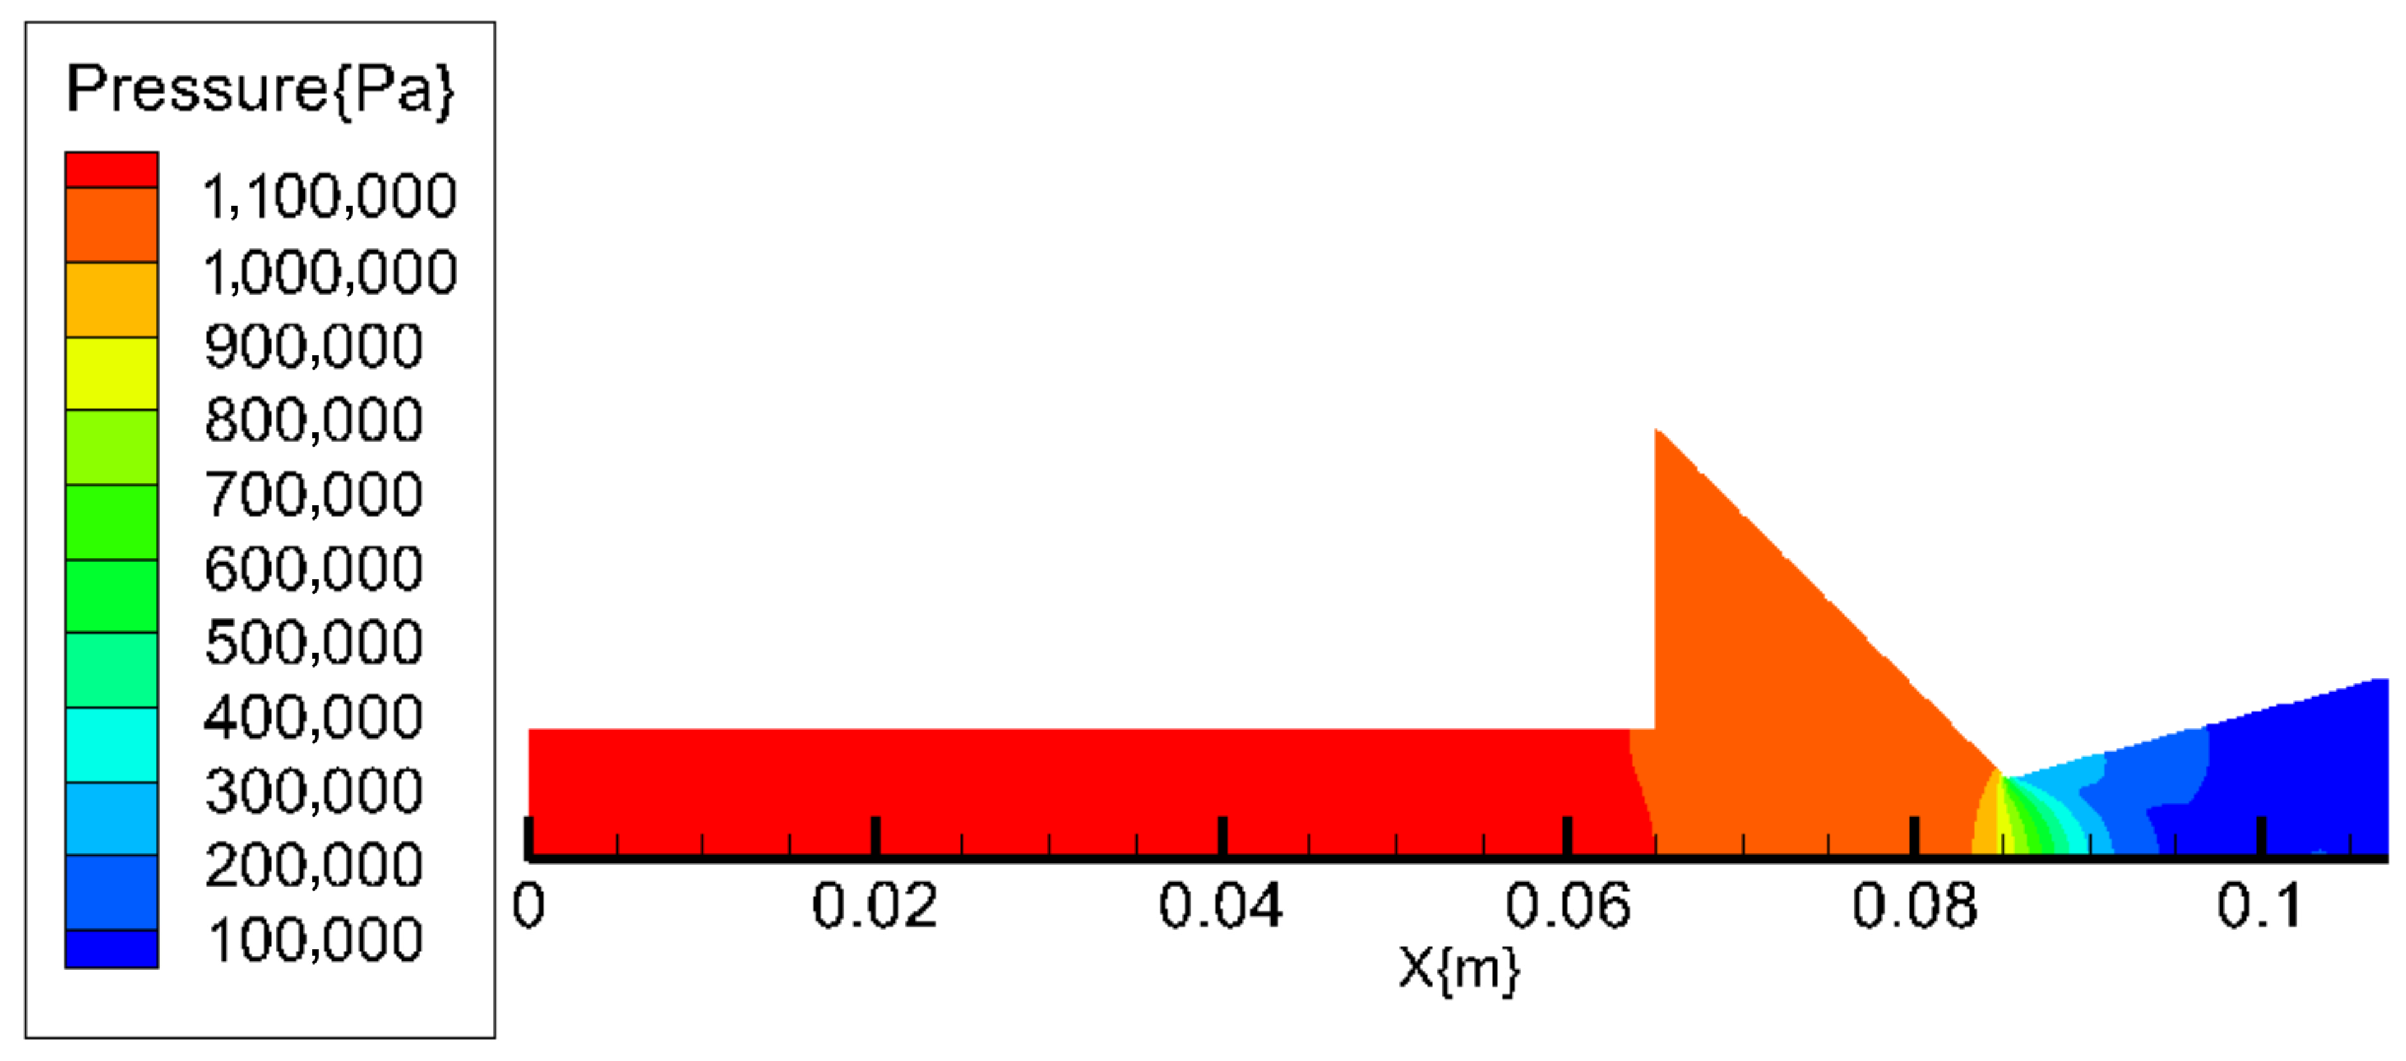
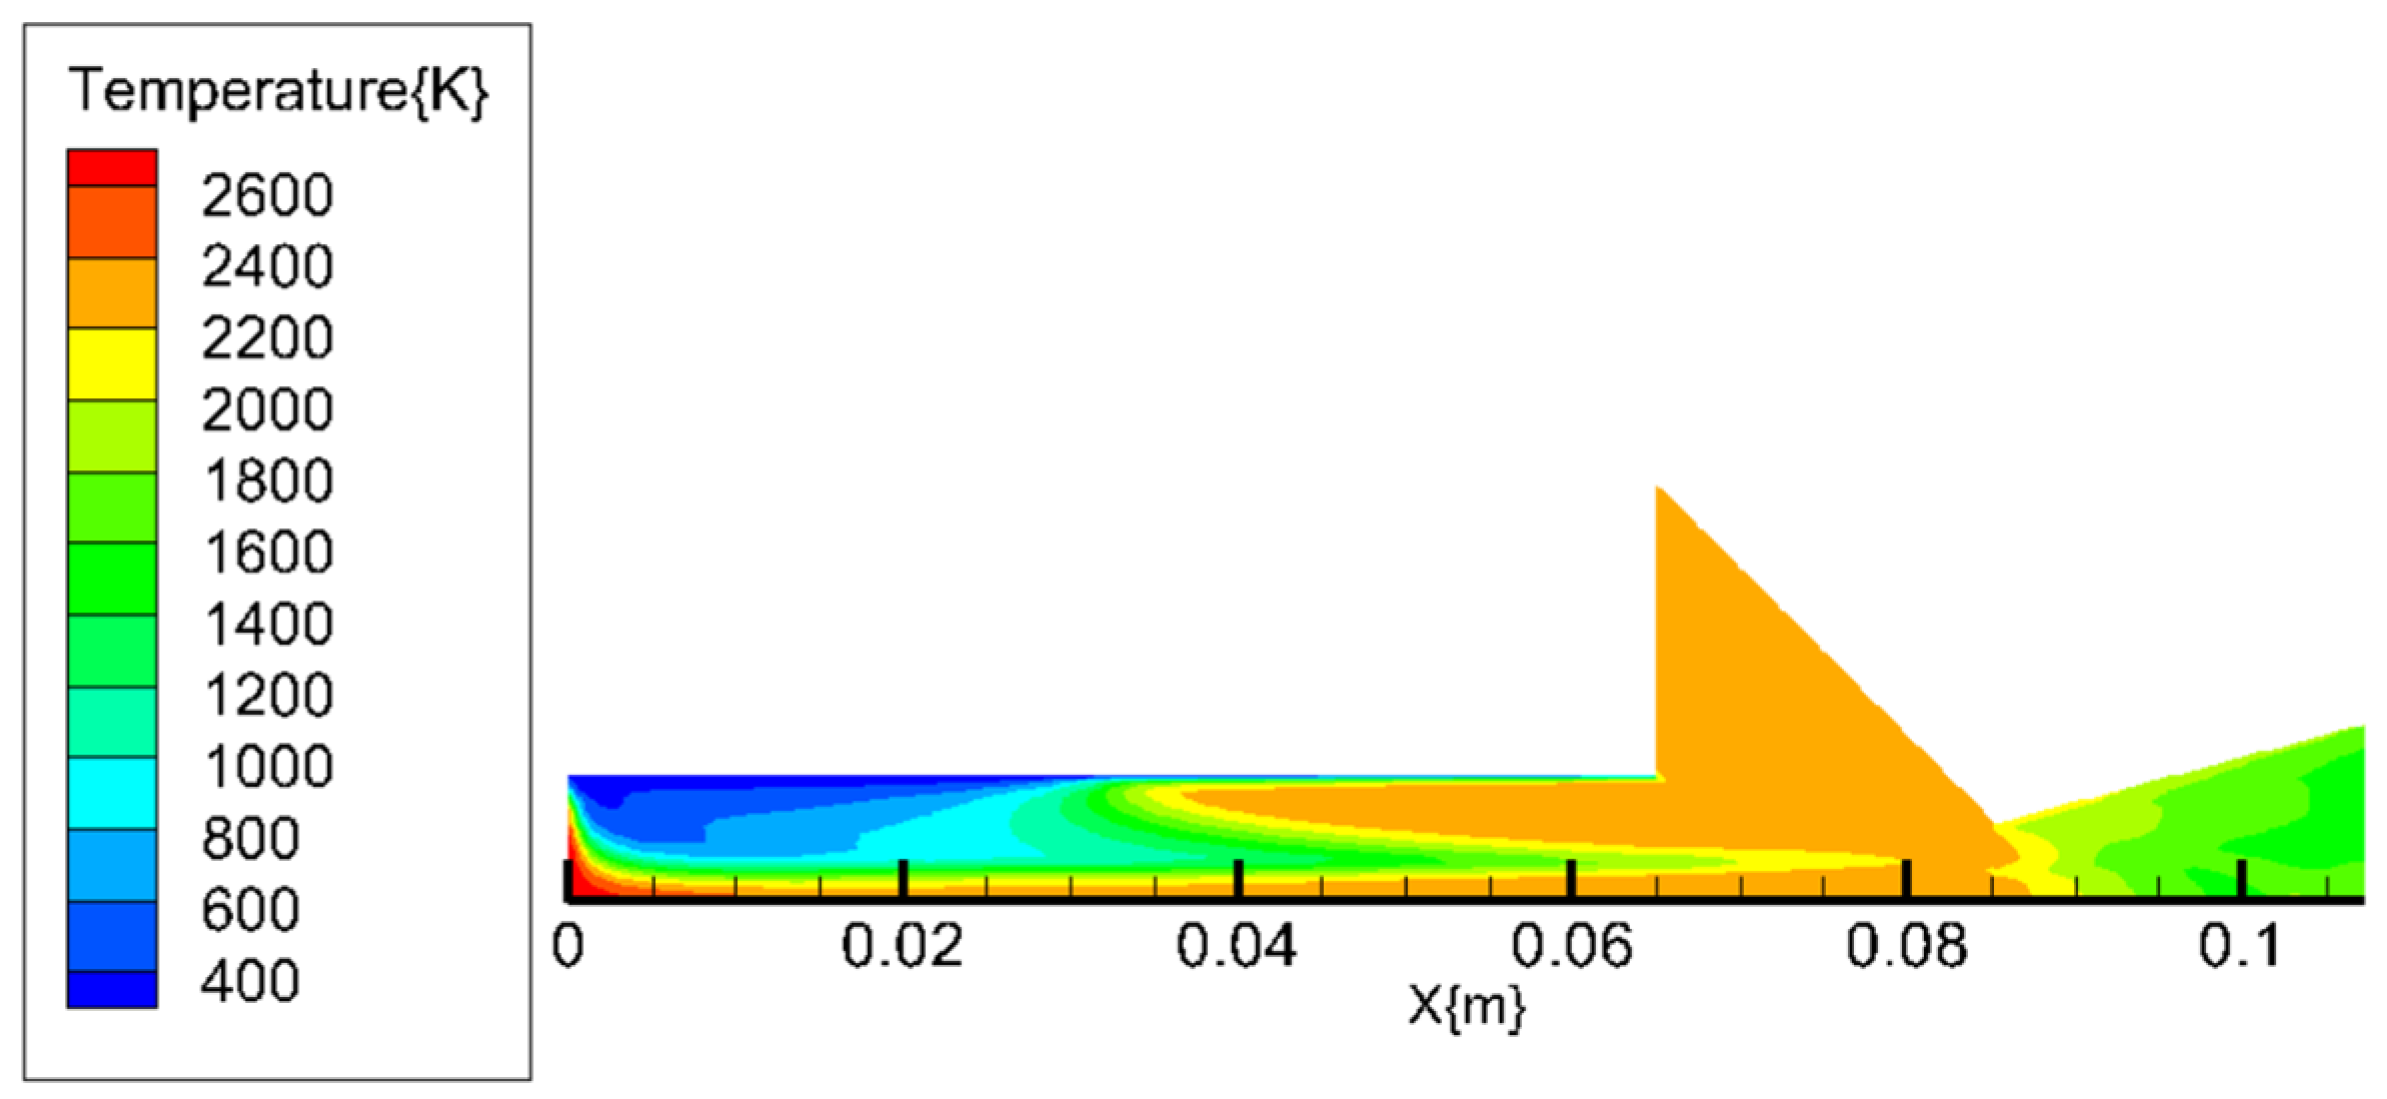
The contour plots of pressure and temperature distributions within the internal flow field during steady-state operation are shown in Figure 6 and Figure 7.
It can be observed that the pressure distribution within the combustion chamber is relatively uniform. In the nozzle region, high-temperature combustion gases convert internal energy into kinetic energy, which also causes a decrease in gas temperature at the nozzle outlet and combustion chamber pressure. The pressure of the internal flow field is 1.18 MPa. The temperature distribution within the combustion chamber is highly non-uniform. Near the combustion surface, temperatures remain relatively low, hovering around 1200 K. This is primarily because the pyrolysis of the propellant is a highly endothermic process that absorbs a significant amount of heat. This simulated burning surface temperature of approximately 1200 K is highly consistent with the experimental observations reported for the KNSB rocket motor [1], further validating the accuracy of the current numerical model. However, in the core region farther from the combustion surface, temperatures are significantly higher, reaching 2400 K. Simultaneously, it is evident that temperatures are exceptionally high at the motor’s nose section. This phenomenon arises from multiple factors: within the nose region, the gas flow velocity is slower, allowing for more complete oxidation of the oxidizer and fuel. Consequently, greater heat is released, causing the gas temperature to rise rapidly and ultimately forming localized hot spots at the motor nose [32].
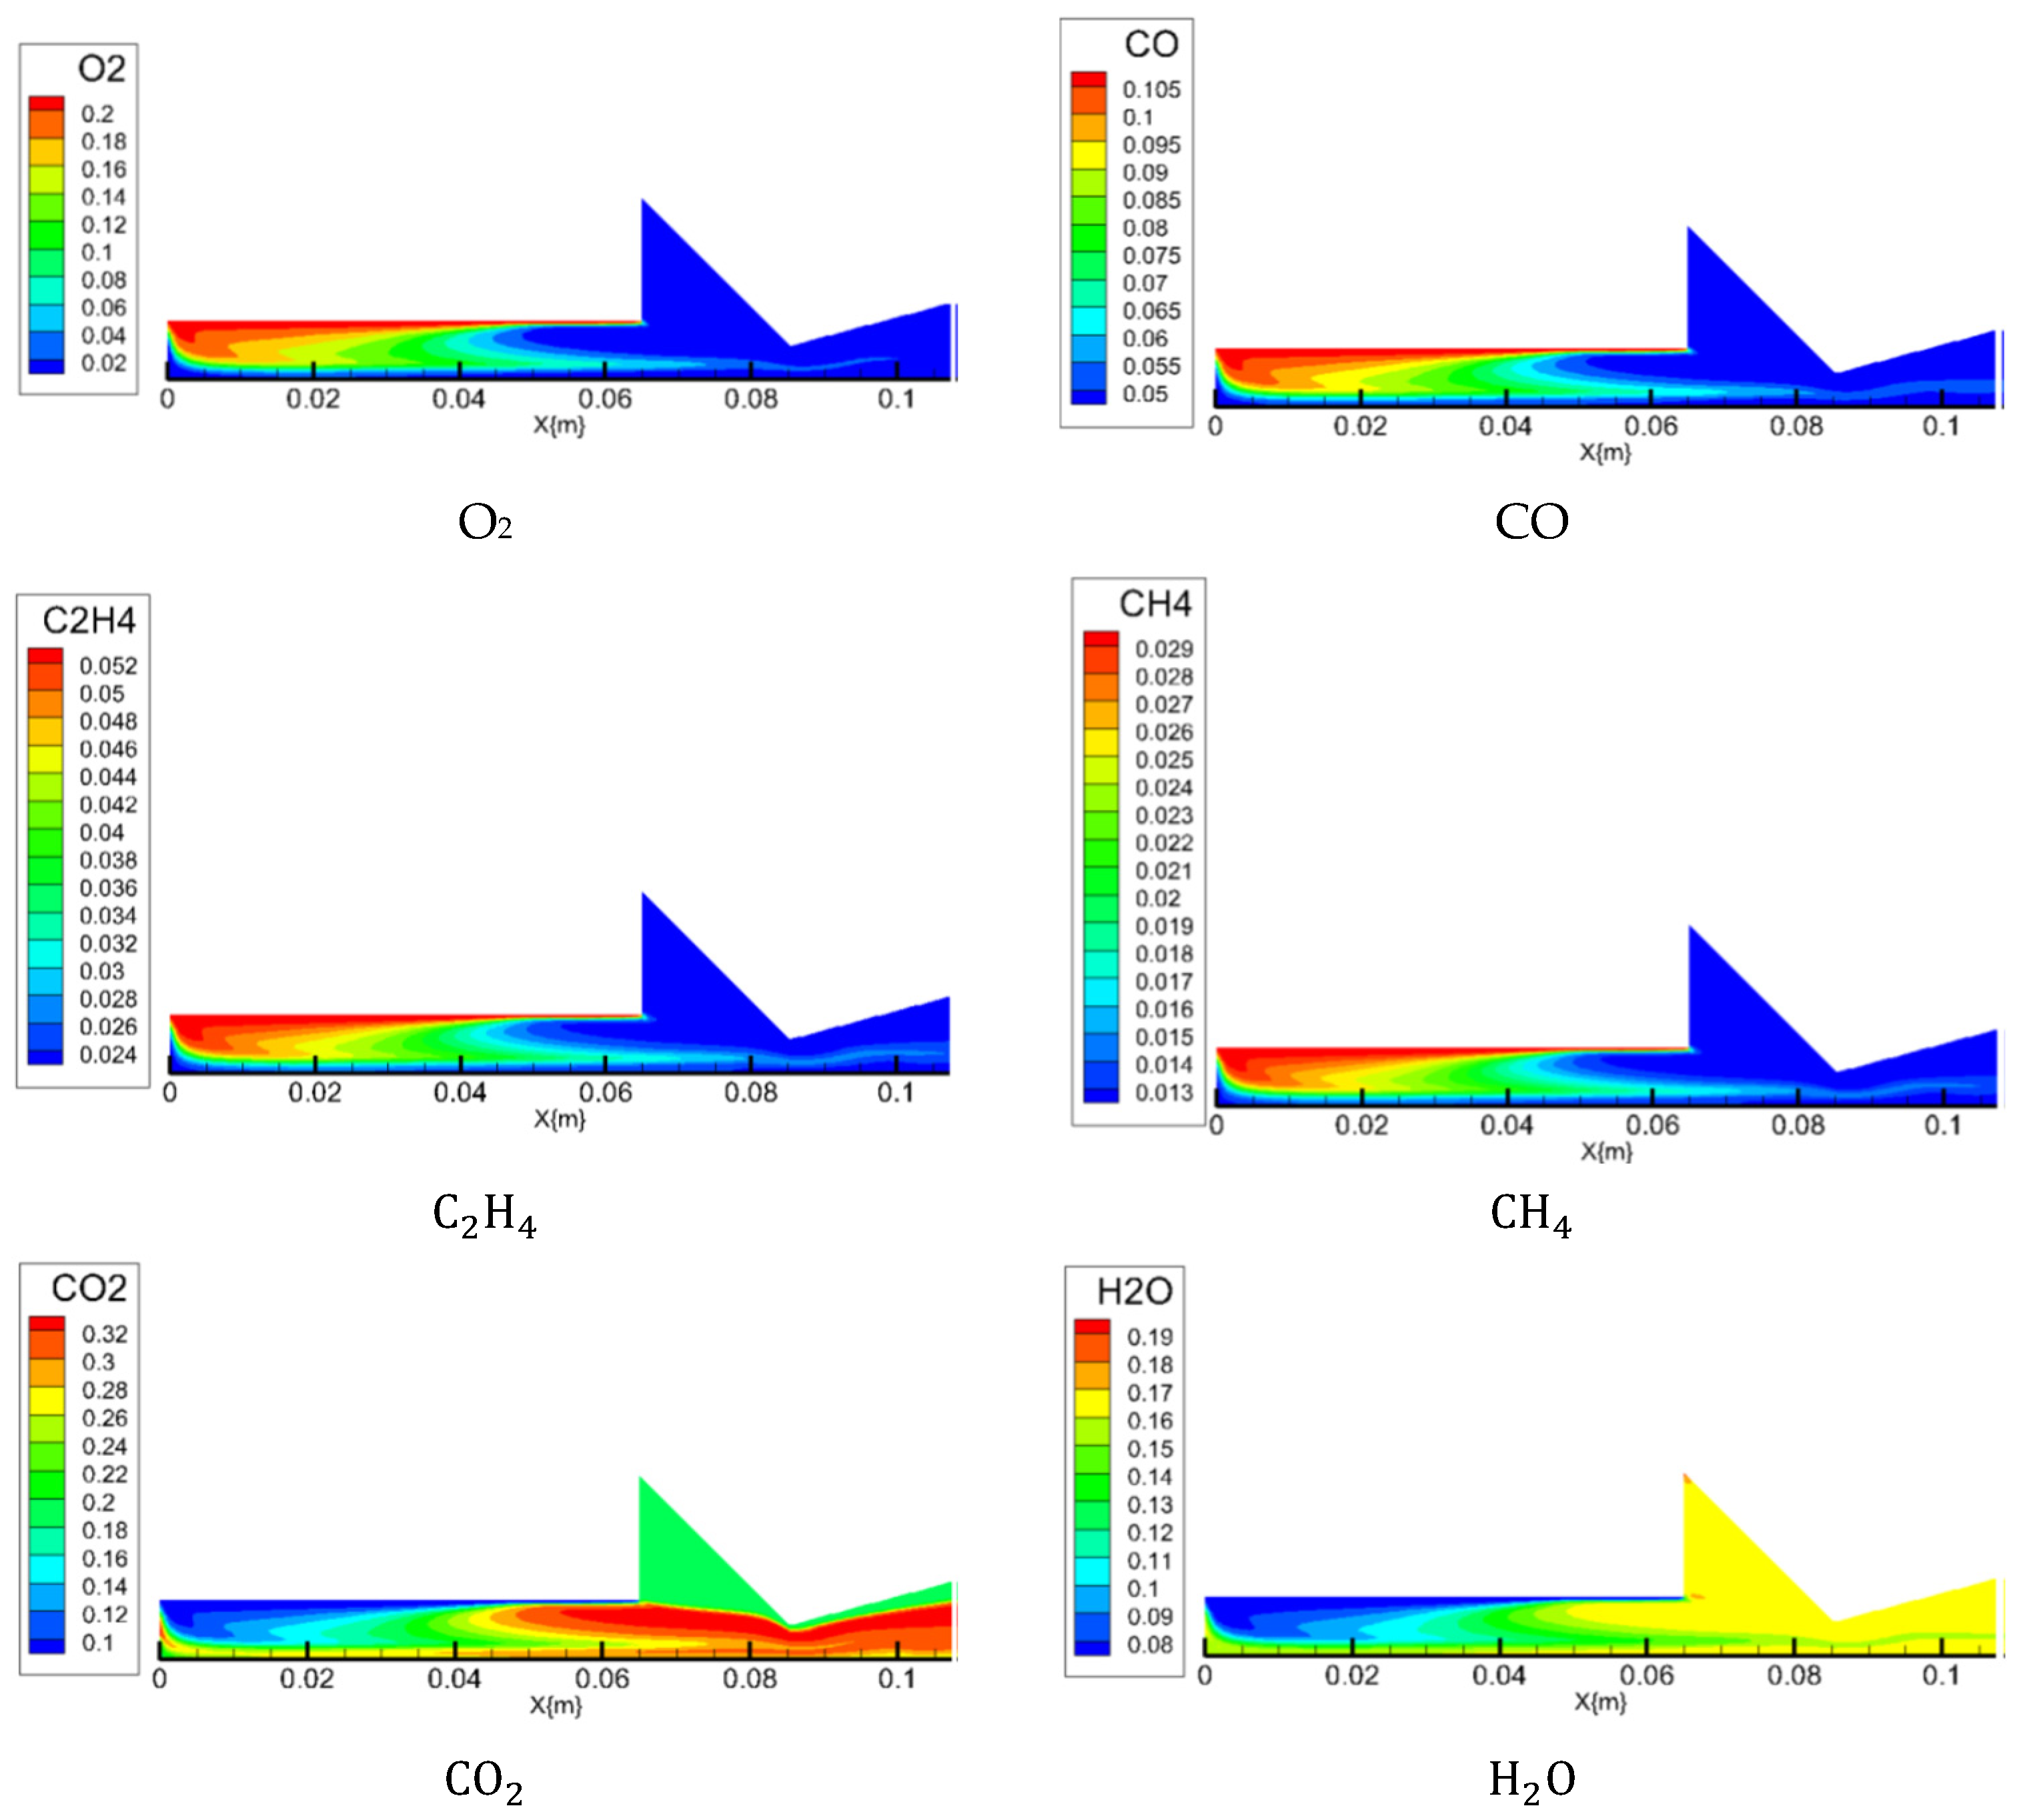
The steady-state internal flow field component distribution is shown in Figure 8.
The mass fraction contour plots of each gas component reveal, similar to the steady-state temperature distribution plots, that the distribution of all components within the motor flow field is non-uniform. At the combustion surface, the mass fractions of O2, CO, CH4, and C2H4 are relatively high, indicating incomplete fuel reaction and lower production of CO2 and H2O. Away from the core region of the internal flow field, the mass fractions of O2, CO, CH4, and C2H4 decrease, reflecting more complete reactions and higher production of CO2 and H2O. As the gas flows toward the flame zone and nozzle, the reaction becomes increasingly complete. The mass fractions of fuel gases decrease, while the mass fractions of CO2 and H2O increase. Temperature and flow velocity also gradually rise, corresponding to the temperature and flow velocity distribution maps shown above.

3.2. Model Validation

This paper verifies the accuracy of the numerical simulation model by comparing it with performance data from Reference [16]. In motor design and fabrication, the propellant charge utilizes KNSB propellant with a potassium nitrate to sorbitol mass ratio of 65:35. During combustion testing, thrust and combustion pressure were measured using a 100 kgf force sensor and a 50 bar pressure sensor.
The motor thrust ( F ) evaluated in the numerical simulation is calculated by integrating the flow parameters across the nozzle exit boundary ( A e ). The specific formula employed in the CFD post processing is: F = A e ρ u 2 + P e P a m b d A is the axial velocity of the exhaust gas, ρ is the static pressure at the nozzle exit, and P a m b is the ambient atmospheric pressure.
Extract motor thrust and combustion chamber pressure data from the literature diagram. For thrust, record a steady-state value of 124 N. For pressure, convert the bar units in the literature to MPa (1 bar = 0.1 MPa), yielding an initial steady-state pressure of 1.3 MPa. The simulation model parameters matched those in the literature, yielding steady-state thrust of 128 N and pressure of 1.2 MPa. To further improve the fidelity of such performance predictions, ballistic reconstruction techniques have been proposed to accurately reproduce the temporal trends of regression rates during the entire burning duration, especially for motors in the 200 N thrust class [16]. The combustion chamber pressure difference is 0.1 MPa, with a relative error of 7.7%. Similarly, the motor thrust difference is 4 N, with a relative error of 3.2%. Comparing this relative error to the predefined tolerance range of 10%, the relative error is significantly below the allowable limit, indicating good accuracy of simulation.

3.3. Steady-State Simulation of Different Fuel Mixtures

KNSB solid rocket propellant, a commonly used nitrate-based propellant. The standard formulation typically blends potassium nitrate and sorbitol in a 65:35 or 60:40 ratio. The composition ratio of the propellant significantly influences combustion characteristics and product composition: When potassium nitrate content falls below 62.5%, the propellant undergoes oxygen-deficient combustion with an oxygen balance value below −28.1%. Combustion residues contain substantial amounts of elemental carbon, leading to increased carbon monoxide production. When the potassium nitrate content falls within the 65–67.5% range, the propellant exhibits negative oxygen balance. At this point, sorbitol and potassium nitrate react completely, achieving maximum gas production efficiency; However, when the potassium nitrate content exceeds 70%, excess oxidizer decomposes to form residues. This not only reduces thrust but also affects motor cleanliness and reusability due to residue buildup.
Regarding flame temperature, theoretically it increases with higher potassium nitrate content, but in practice is limited by decomposition residues. Experimental data indicate that when potassium nitrate accounts for 65–67.5% of the mixture, the peak flame temperature reaches 1000 °C. When the content falls below 57.5% or exceeds 70%, the combustion time prolongs due to a significant decrease in burning rate, preventing the temperature from being maintained at an efficient level. This simulation ultimately selected six composition ratios: 57.5%, 60%, 62.5%, 65%, 67.5%, and 70% potassium nitrate.
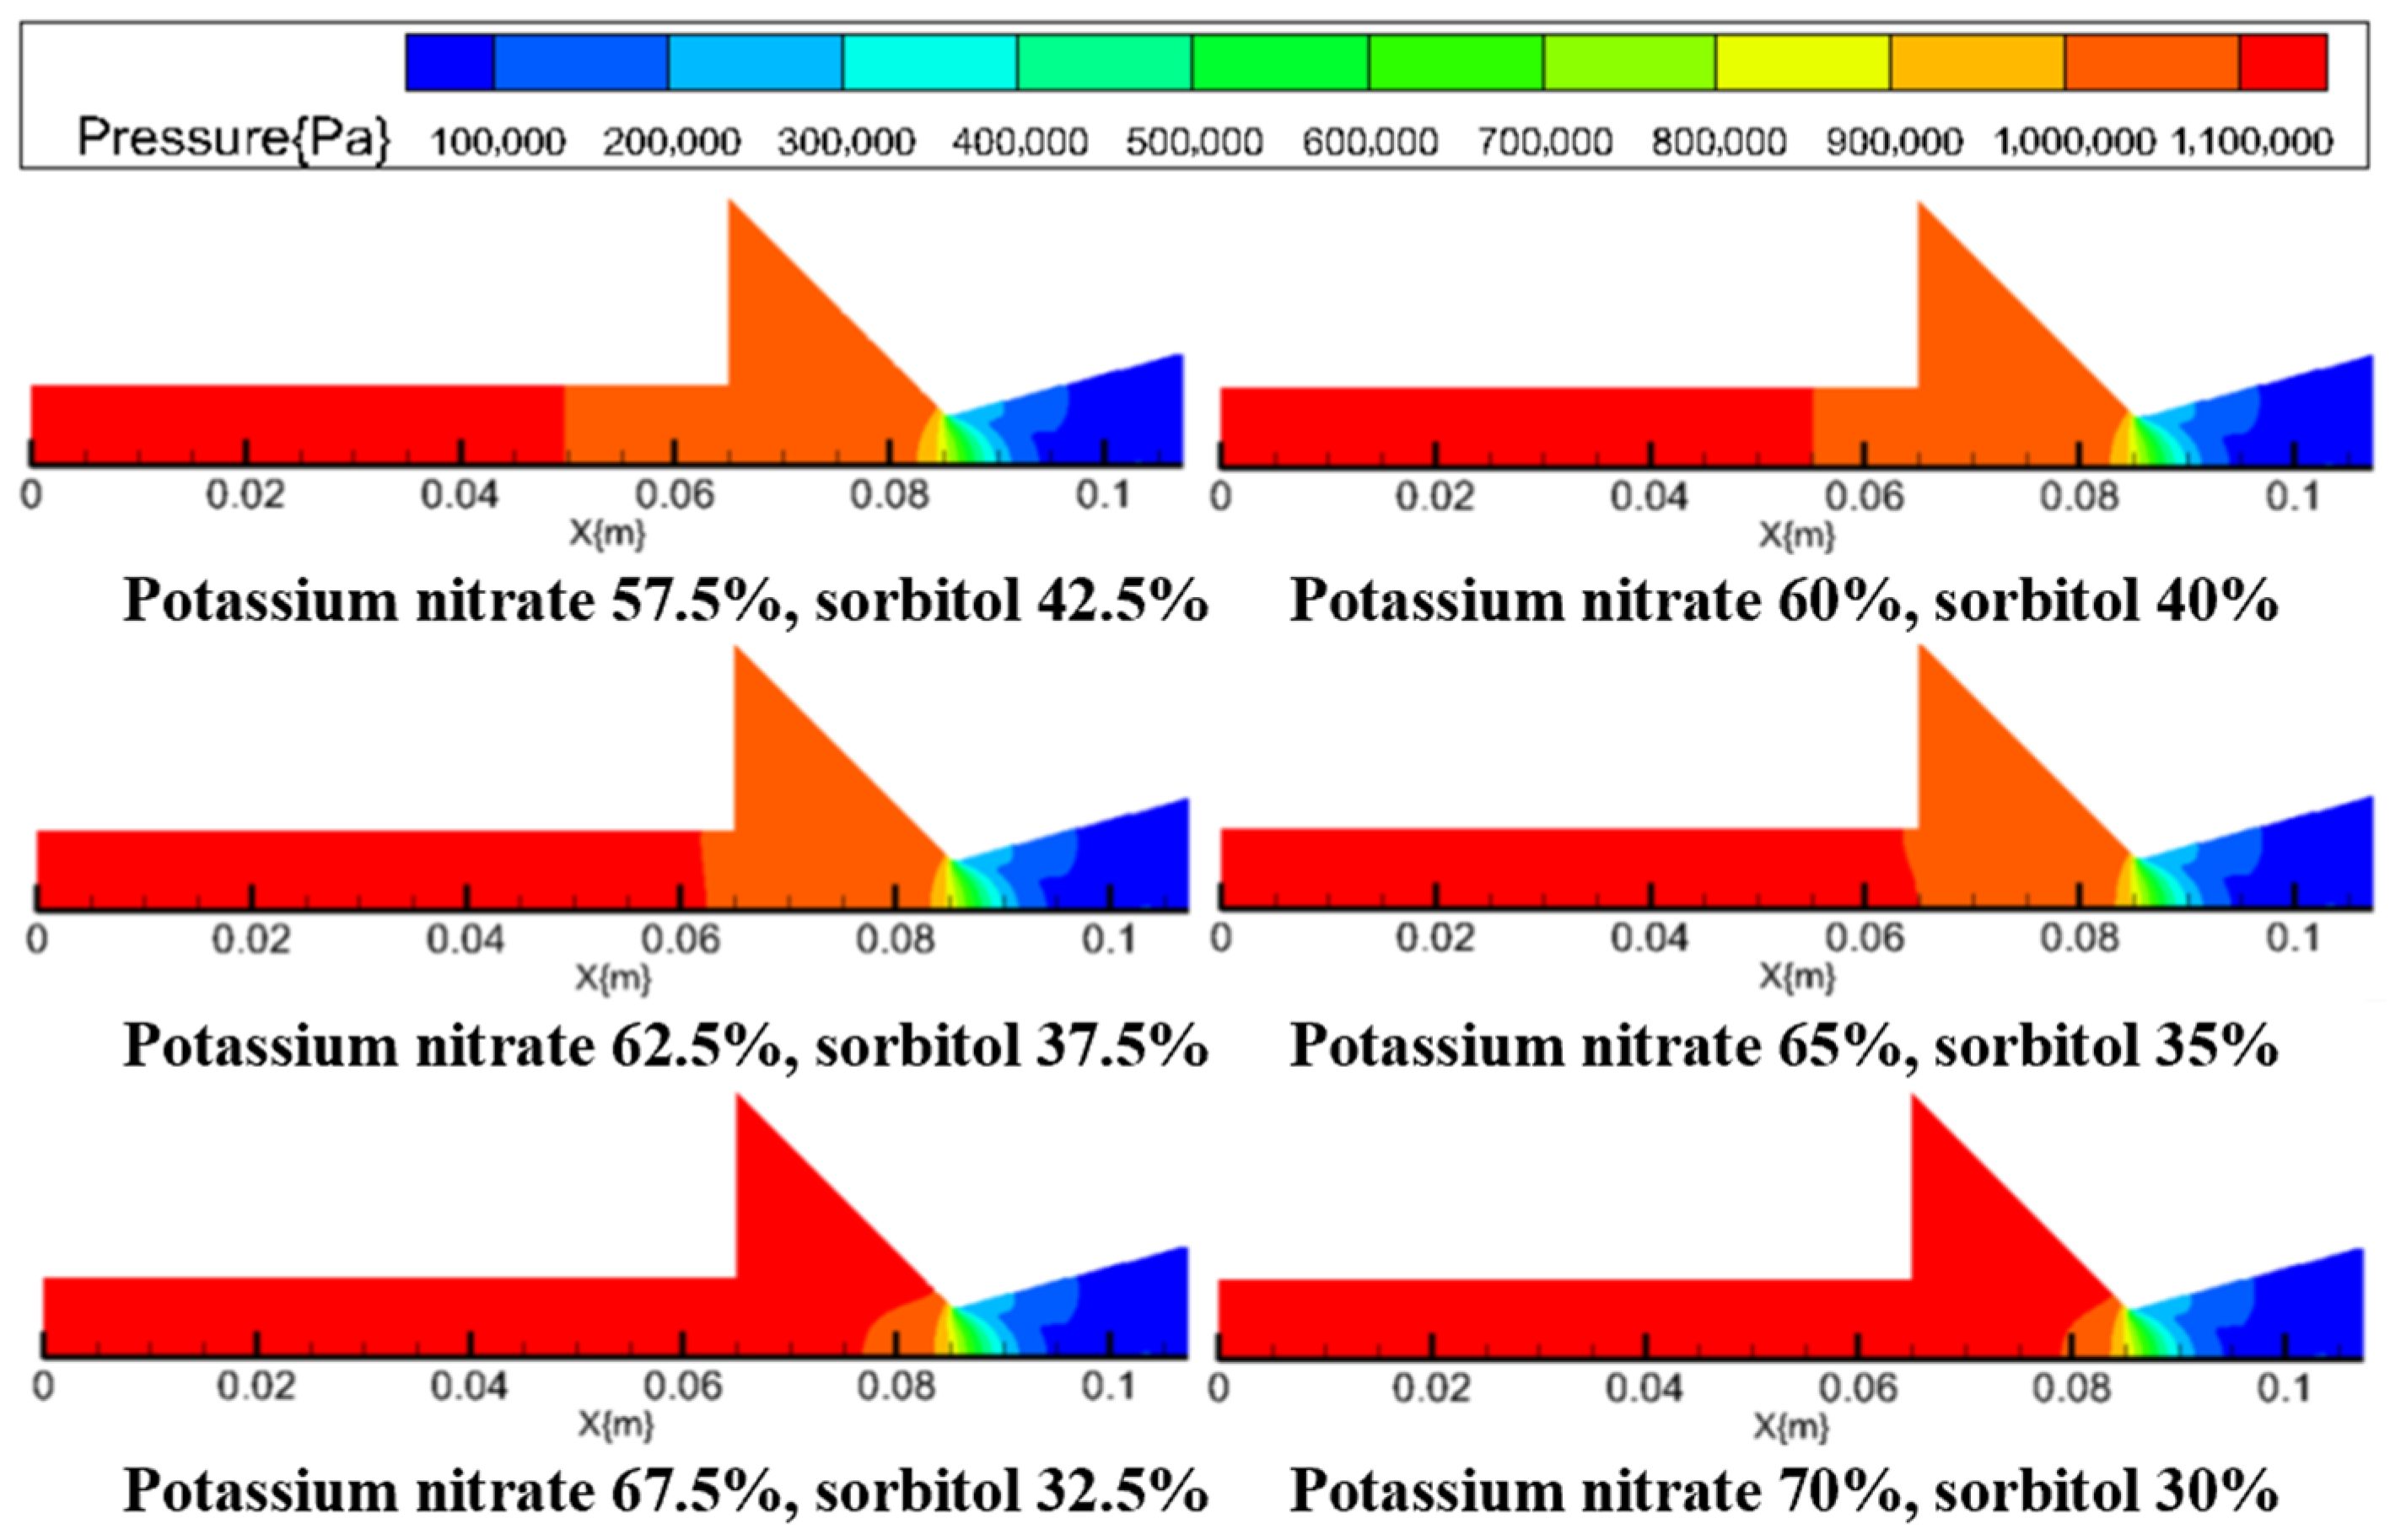
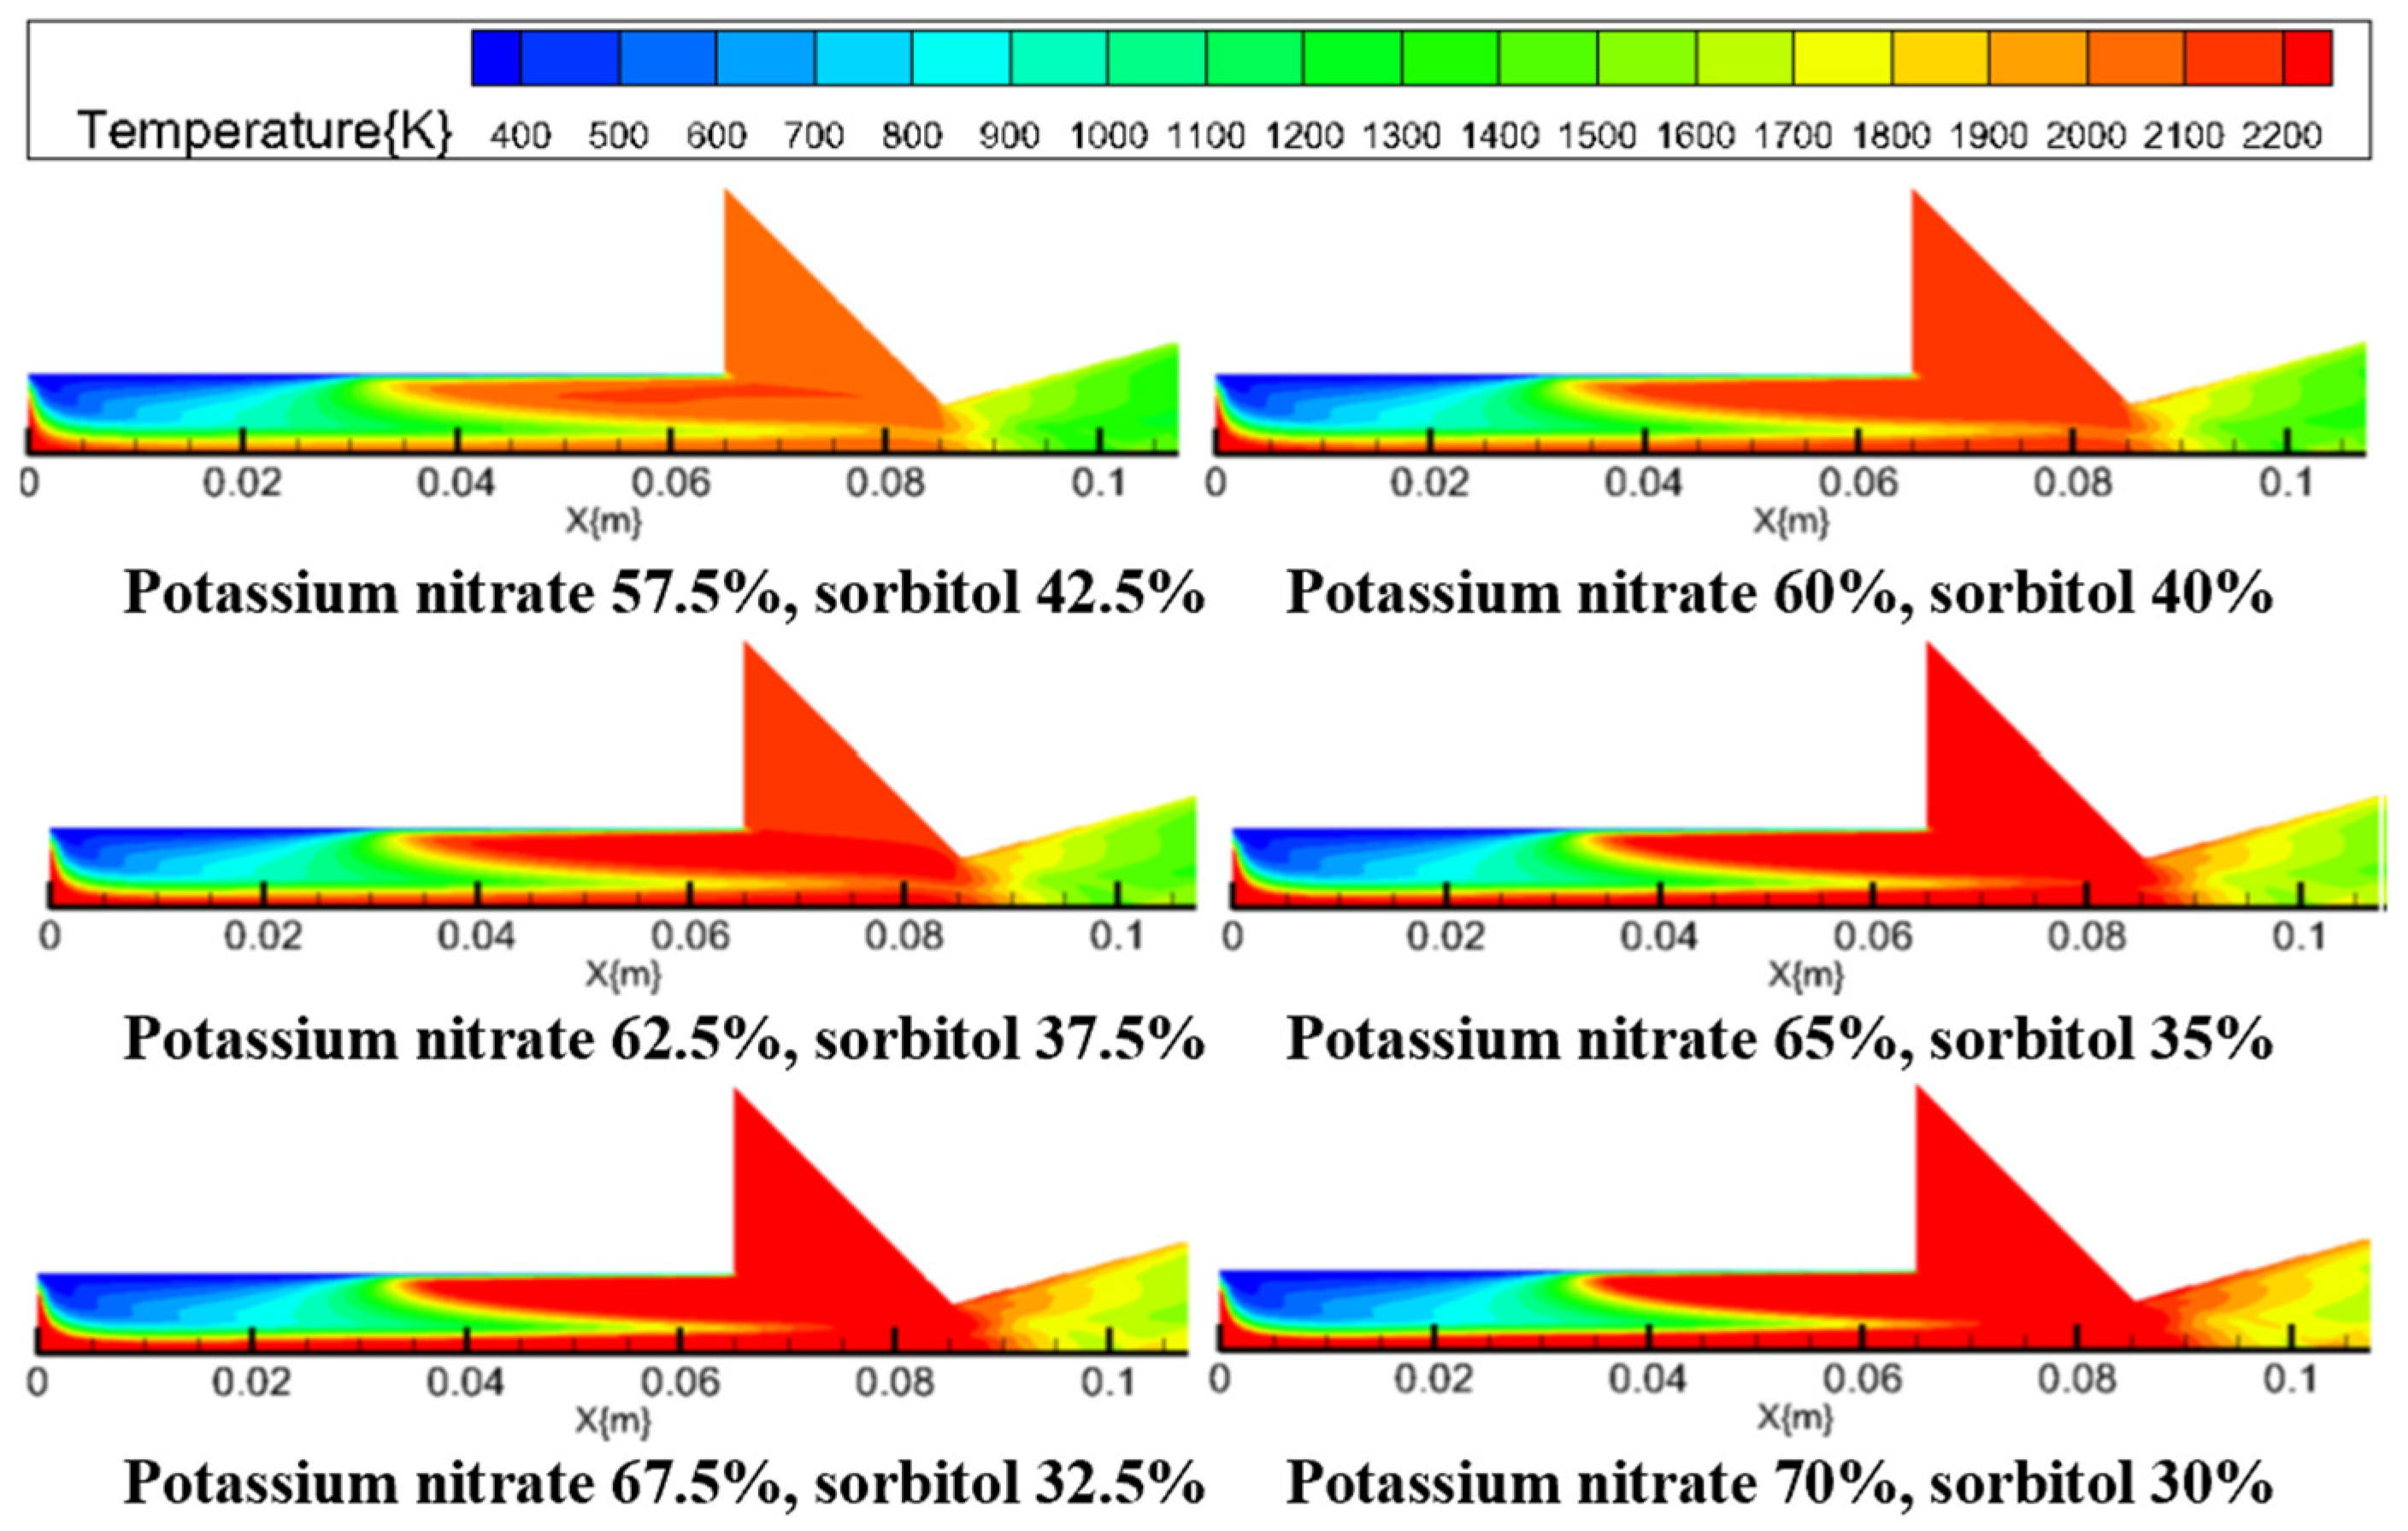
To predict the performance of KNSB propellant and better evaluate the operational characteristics of KNSB solid rocket motors with different fuel ratios, internal flow field simulations were conducted for the six fuel ratio configurations. The internal flow field pressure, temperature, velocity distribution, and motor thrust provide reference data for assessing KNSB solid rocket motor performance. Therefore, to eliminate other factors inherent to the motor itself, all inlet conditions were kept consistent except for the fuel ratios. The distribution contour plots of internal flow field pressure, temperature, and velocity for these six groups were analyzed, and a comparative analysis of motor thrust was conducted for different fuel ratios.
The pressure distribution contour map of the inflow field at steady state is shown in Figure 9.
The steady-state pressure contour maps of the internal flow field for the six motors with different fuel-to-oxidizer ratios show that as the proportion of potassium nitrate increases—that is, as the oxidizer ratio rises—the overall pressure within the flow field increases. Simultaneously, the area of high-pressure zones expands, with pressure rising both within the flow field and near the nozzle region. This pressure increases stems from multiple factors. An elevated oxidizer ratio signifies more thorough fuel–oxidizer mixing, leading to more complete and rapid combustion reactions that accelerate the overall reaction rate. According to the ideal gas equation, the intensified combustion generates high-temperature, high-pressure combustion gases with greater energy, consequently raising the gas pressure.
The temperature distribution contour map of the inflow field at steady state is shown in Figure 10.
As the oxidizer ratio rises, the overall temperature of the internal flow field also increases. This temperature rise is influenced by multiple factors. From a chemical reaction kinetics perspective, the chemical reaction between fuel and oxidizer is the core energy releasing process during solid rocket motor combustion. As the primary oxidizer, an increased proportion of potassium nitrate provides fuel molecules with more abundant oxygen. This allows fuel molecules to fully contact and undergo redox reactions with a greater number of oxidizer molecules, thereby accelerating the reaction rate. According to chemical reaction kinetics principles, an increased reaction rate means a greater amount of reactants participates per unit time. This enables the combustion reaction to proceed more completely and thoroughly. Consequently, more heat is released, leading to an increase in the temperature of the internal flow field.
To more clearly visualize the impact of fuel–air mixture ratios on motor performance, Table 2 below presents the effects of varying oxidizer proportions on internal flow field pressure, flow velocity, temperature, and motor thrust:
As the proportion of oxidizer increases, all parameters within the motor’s flow field increase. While combustion chamber pressure rises only slightly by 4.6%, temperature increases significantly by 22.15%. This pressure increase enhances exhaust gas velocity, delivering greater thrust to the motor. Simultaneously, the high-pressure environment promotes stable combustion, reducing instances of combustion instability. Although high-temperature exhaust gases improve the motor’s thermal efficiency, they also elevate demands on thermal protection and other critical systems.

4. KNSB Solid Rocket Motor Transient Numerical Simulation

To maintain strict consistency with the actual experimental conditions, where both end faces of the propellant grain are coated with an inhibitor layer, the simulation solely considers the regression of the burning surface in the radial direction (i.e., time variation in the y-direction). Consequently, no combustion or geometric variation occurs in the axial direction (x-direction) of the grain.
The operation of a solid rocket motor consists of three stages: the ignition stage, the stable combustion stage, and the burnout (tail-off) stage. Among these, the stable combustion stage is the critical period during which the motor generates continuous and stable thrust. Performance parameters during this stage—such as pressure variations within the combustion chamber, temperature distribution, propellant burning rate, and thrust magnitude—directly determine the overall performance of the motor. Therefore, this project mainly analyzes the stable combustion stage.

4.1. Transient Simulation Flow Field Analysis

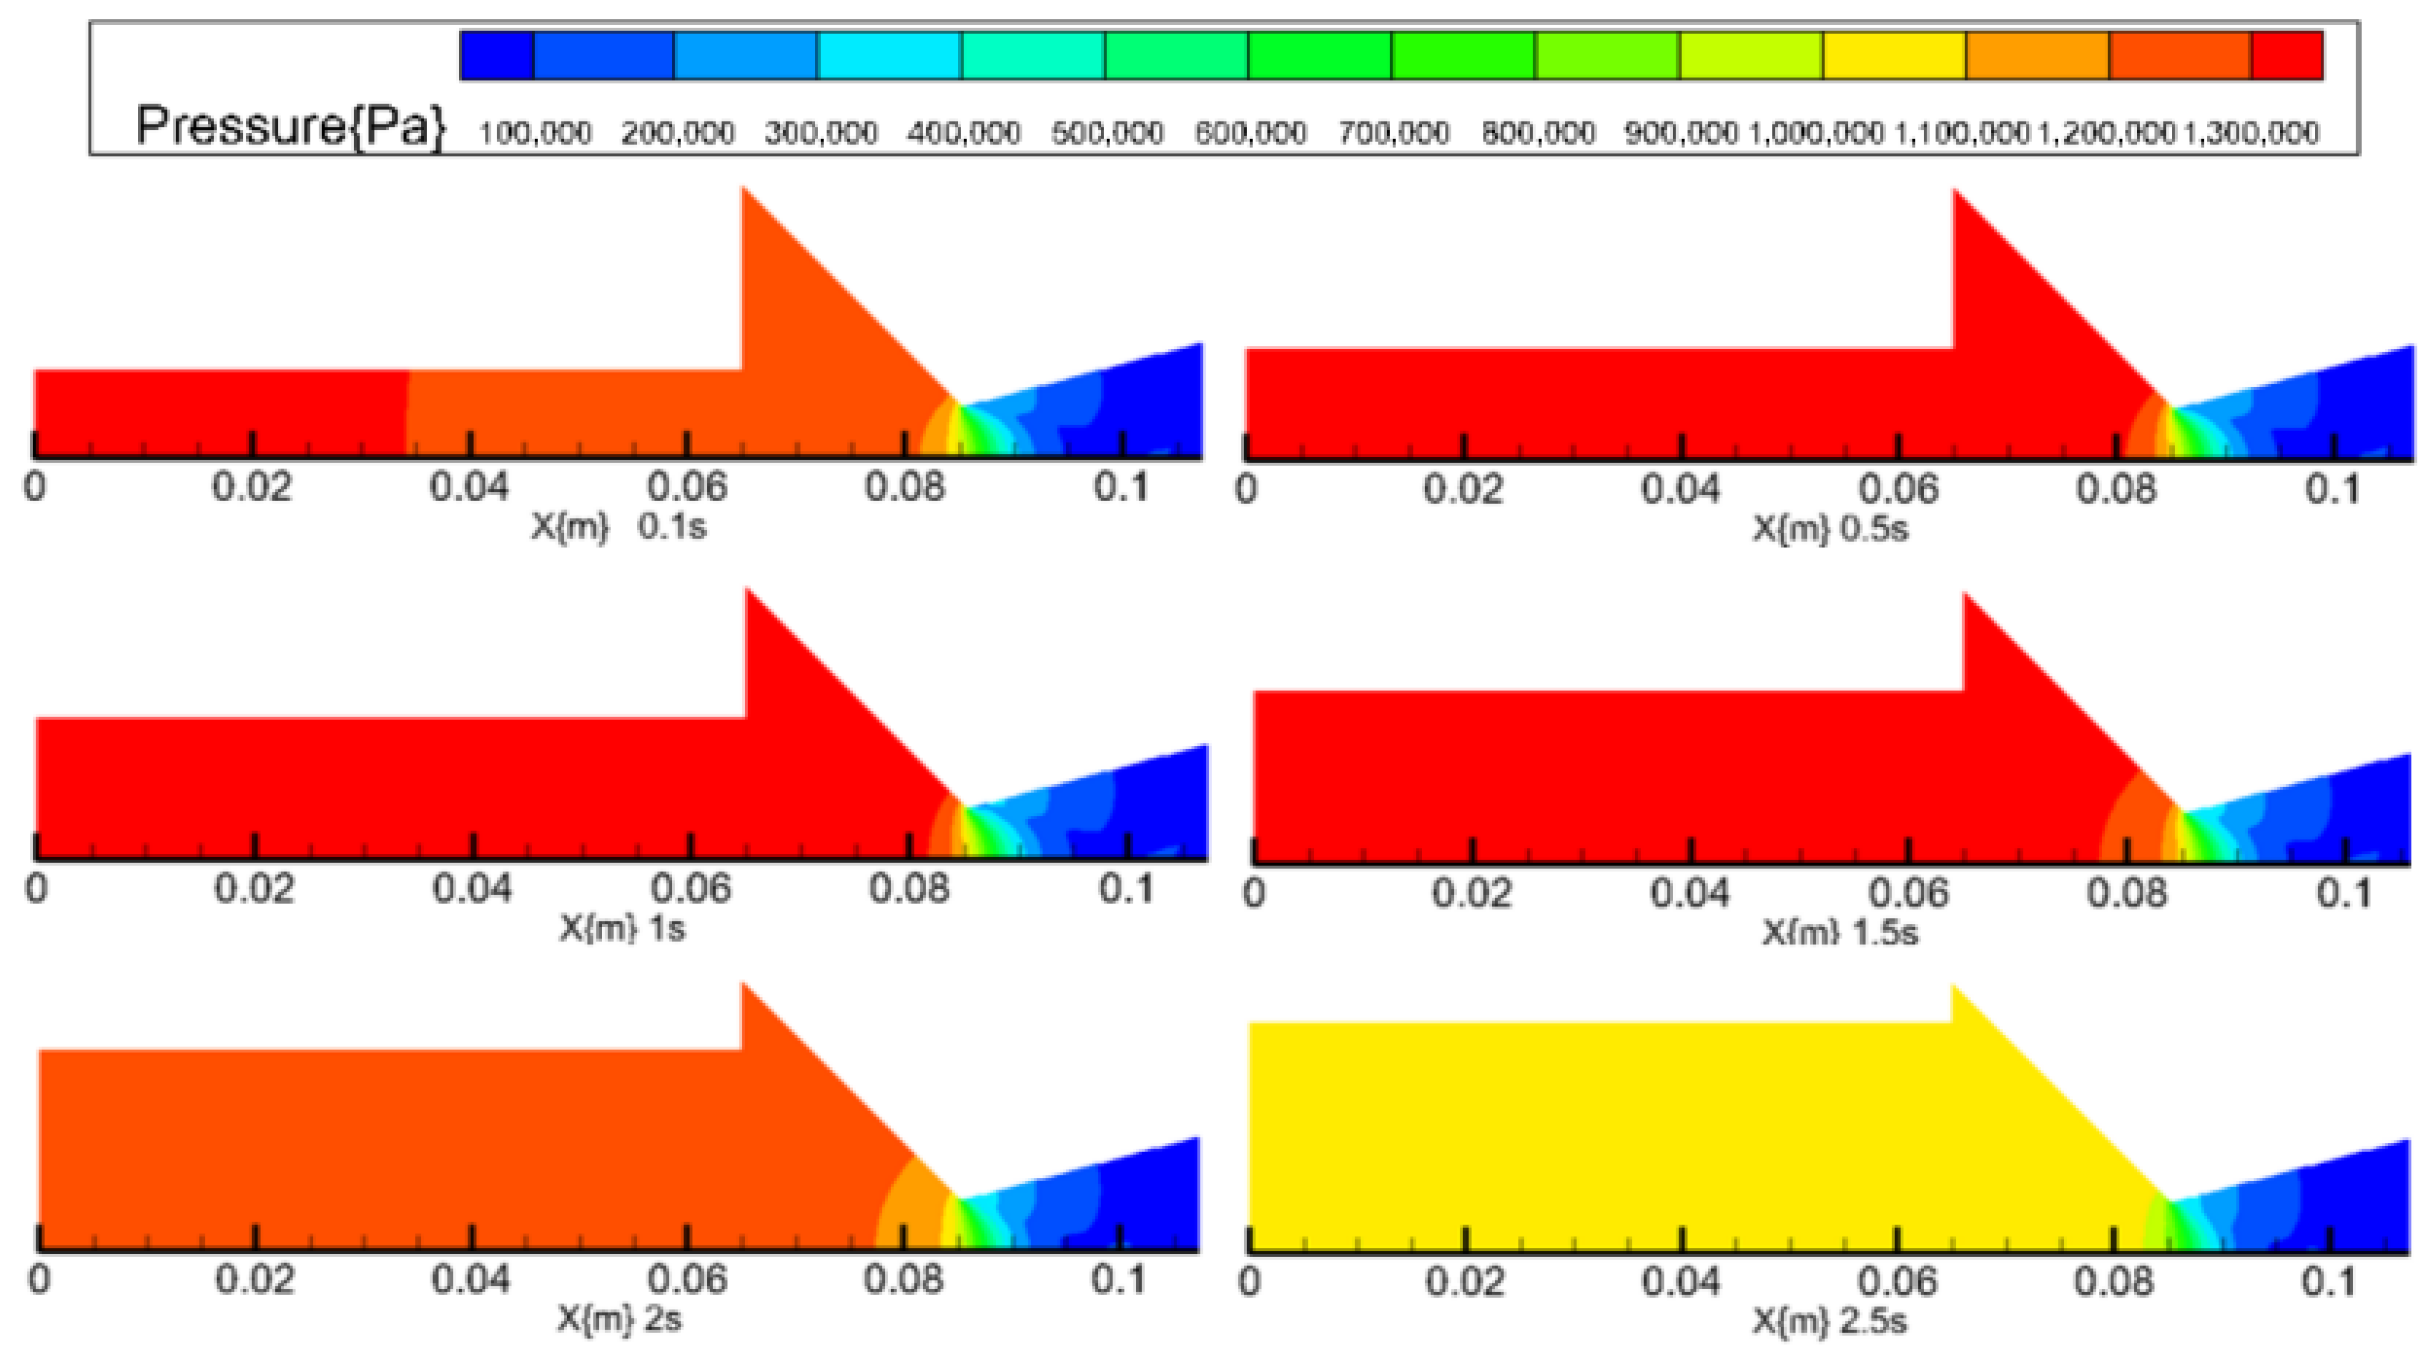
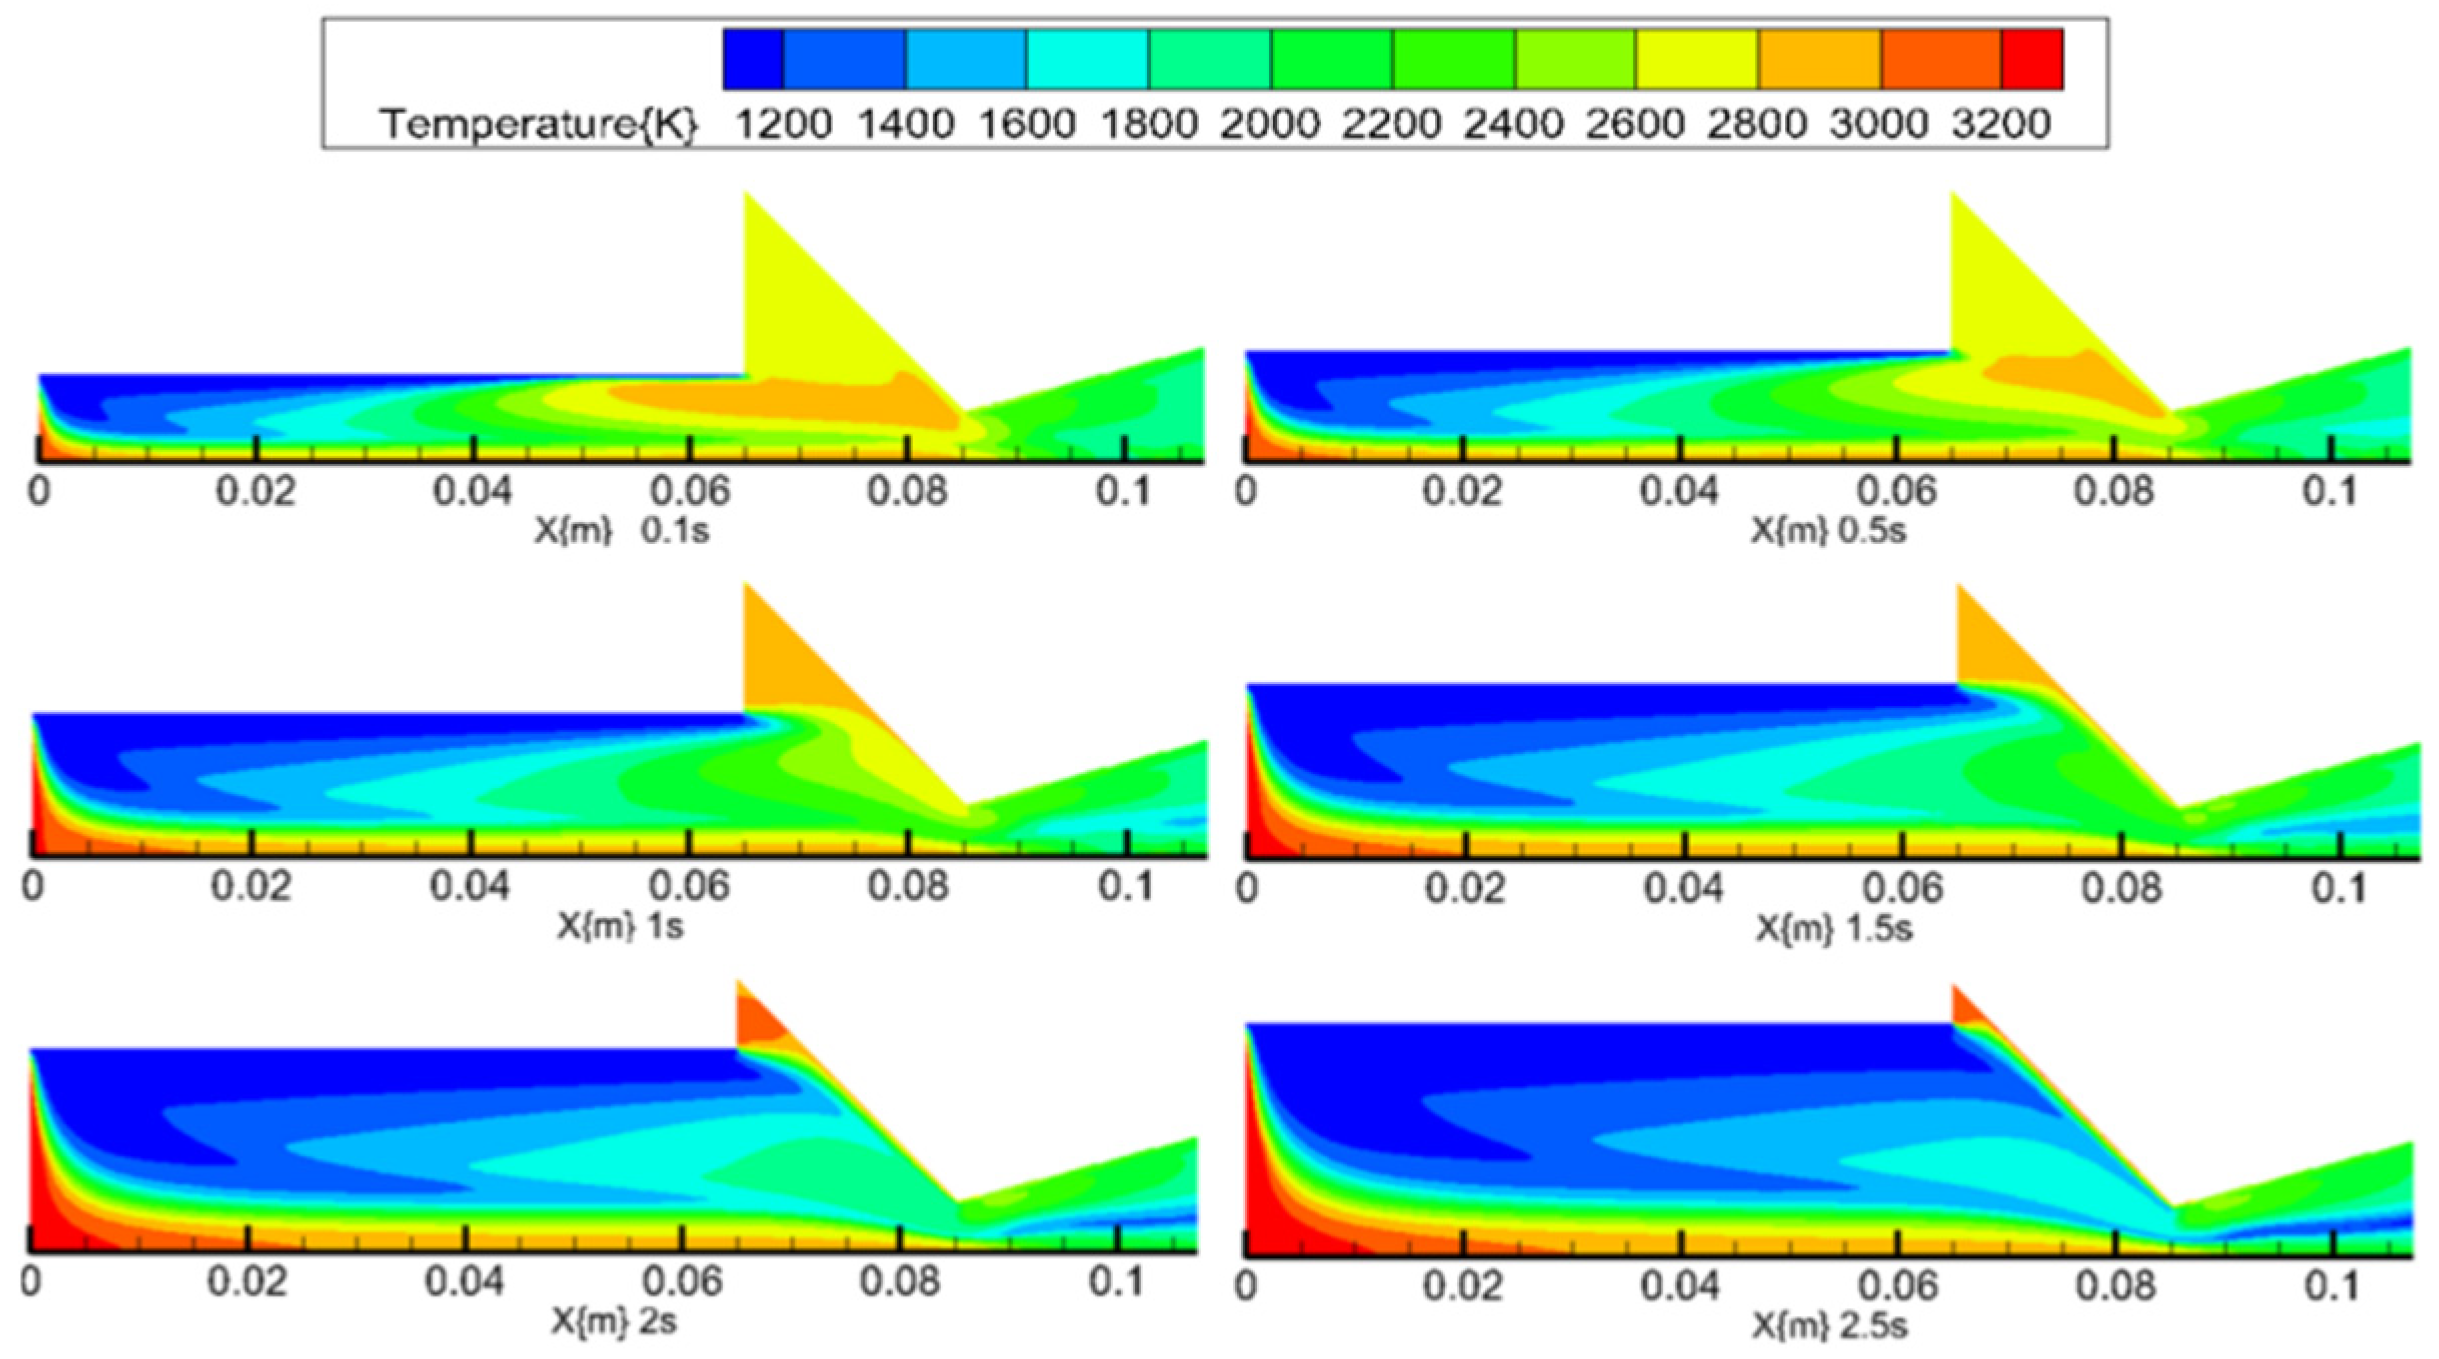
The regression rate condition is configured to adjust in real-time based on the combustion chamber pressure using the dynamic mesh model. The initial inlet mass flow rate is 0.068 kg/s. The combustion duration is set to 2.5 s, consistent with the reference. The transient simulation of the motor was analyzed by selecting seven specific time points: 0.1 s, 0.5 s, 1 s, 1.5 s, 2 s, 2.5 s. It should be noted that the transient flow field analysis is presented up to 2.5 s, omitting the final tail-off phase (2.5 s to 3.0 s). In actual firing processes, severe performance degradation is observed during this final phase, primarily due to nozzle ablation and other heat-loss factors. Therefore, to more accurately evaluate and compare the performance parameters during the stable operating condition, our analysis is specifically focused on the 0 to 2.5 s interval. The temperature and pressure of the internal flow field throughout the transient simulation were analyzed to observe the parameter variations within the motor’s internal flow field at different moments.
Figure 11 and Figure 12 illustrates the variations in the pressure and temperature distribution of the internal flow field.
The temperature contours at different moments reveal a distinctly non-uniform state in the internal flow field. In the region near the burning surface, the temperature is relatively low, stably maintained at around 1200 K, as the fuel has just begun to undergo chemical reactions. In the core region of the internal flow field, the mixing of fuel and oxidizer is more complete, and the chemical reaction is more intense, resulting in temperatures reaching approximately 3000 K in this area. As the burning surface regresses, the temperature of the internal flow field slowly decreases, and the temperature change is particularly significant in positions closer to the nozzle. At 0.1 s, the temperature at the junction of the grain and the nozzle reaches between 2800 K and 3000 K, whereas at 3.0 s, the temperature at the same location drops to between 1200 K and 1400 K. This temperature change is mainly attributed to the reduced fuel supply caused by burning surface regression, as well as the acceleration, expansion, and energy dissipation of the gas within the nozzle.

4.2. Simulation Parameter Analysis

The experimental data utilized for the validation of the dynamic numerical model are derived from the static fire tests of the KNSB solid rocket motor [16], features a robust 6061-T6 aluminum alloy combustion chamber capable of enduring internal temperatures up to 1600 K and operating pressures up to 2.5 MPa. The motor is loaded with 400 g of KNSB propellant, which consists of a mixture of potassium nitrate and sorbitol in a 65:35 weight ratio. To ensure a stable and predictable burning surface area during the transient process, the propellant is cast into a four-segment Bates grain configuration. The motor employs a converging–diverging nozzle to efficiently accelerate the high-temperature exhaust gases. Ignition is reliably initiated using a pyrotechnic igniter equipped with a heated nichrome wire. The combustion stability is verified by the experimental records; specifically, the stable and symmetrical ignition plume captured during the static fire test serves as a benchmark for the steady combustion state. High-fidelity data acquisition for the thrust–time curve was achieved by utilizing a precision load cell to ensure the accuracy of the model validation.
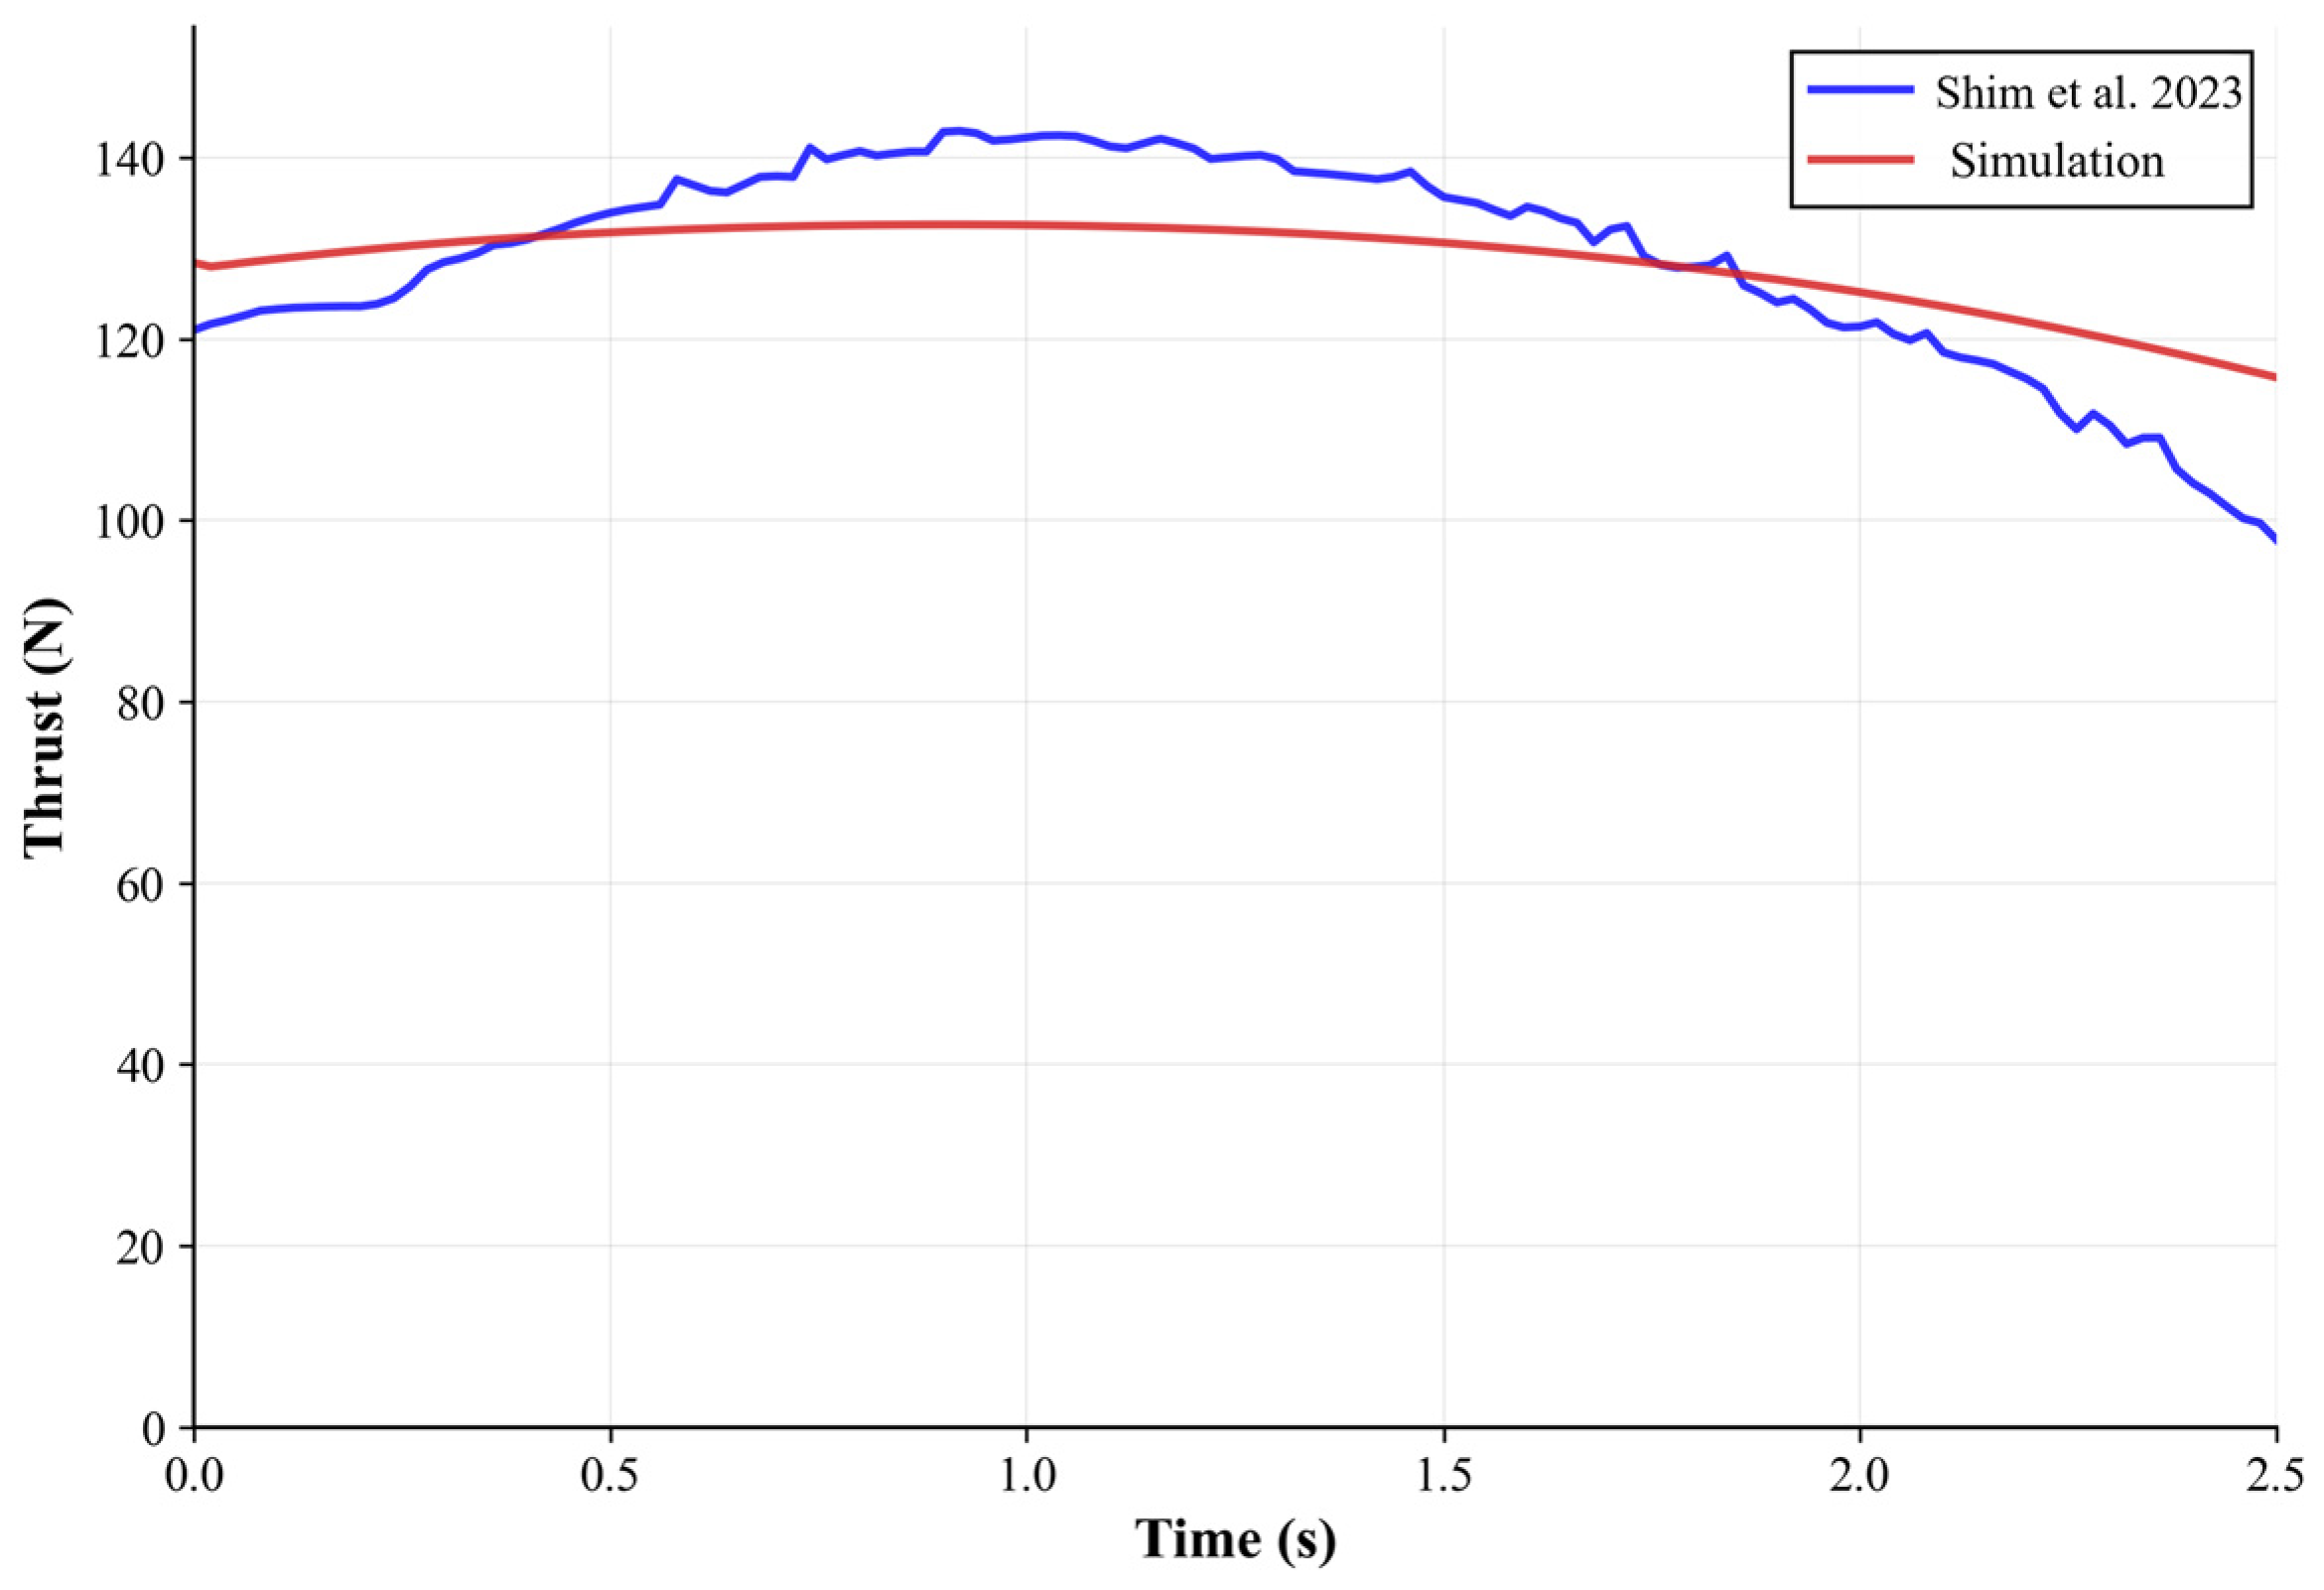
Thrust is the core element determining motor performance. Thrust directly determines the ability to propel the vehicle and is the fundamental power source for achieving aerospace missions such as liftoff, orbit maneuvering, and acceleration. To further analyze the motor performance, the thrust variations are compared and analyzed against experimental data [16], as shown in Figure 13.
The motor thrust results from the transient simulation of the KNSB solid rocket motor internal flow field are basically consistent with the experimental motor thrust. The simulated thrust ranges from 85 N to 134 N, with a maximum thrust of 134 N and an average thrust of 117 N. During the initial stage of operation, thrust gradually increased. Subsequently, with the significant expansion of the combustion chamber volume, the gas generation rate became insufficient to maintain the chamber pressure. As the gas discharge rate through the nozzle gradually exceeded the gas generation rate, both the motor thrust and the combustion chamber pressure gradually decreased. The experimental thrust ranges from 96 N to 143 N, with a maximum thrust of 143.1 N and an average thrust of 128.4 N. The average thrust error is 4.9%. This indicates that the simulation results can accurately reflect the combustion performance of the KNSB propellant. This numerical simulation study of the KNSB solid rocket motor helps to more accurately grasp its working laws, providing a theoretical basis for optimization design and performance improvement.

5. Conclusions

This paper presents a relatively detailed two-dimensional numerical model of the KNSB solid rocket motor, conducts its steady-state and transient simulations, and examines the performance of the KNSB rocket motor under various fuel ratios, providing a reference for the application of KNSB propellant in solid rocket motors.
In this steady-state simulation, the distribution of pressure, temperature and components within the internal flow field was analyzed in detail to predict the performance of KNSB propellant. The study shows that the pressure distribution inside the combustion chamber is relatively uniform, but the temperature distribution is significantly uneven, with local hot spots forming at the head due to gas stagnation. To validate the model and ensure the accuracy of the simulation, the simulation data were compared with data from the literature. The pressure error in the combustion chamber was only 7.7%, and the motor thrust error was 3.2%, demonstrating the accuracy of this steady-state simulation result. At the same time, analyzing the performance of KNSB solid rocket motors with different fuel ratios showed that as the oxidizer content increased from 57.5% to 70%, the combustion chamber pressure increased only slightly by 4.6%, while the temperature increased significantly by 22.15%, indicating that the thermochemical energy release is more sensitive to the O/F ratio than the aerodynamic mass flow balance.
This transient simulation analyzed the changes in flow field pressure, temperature and motor thrust during the stable combustion phase (0–2.5 s). The trends of pressure and thrust both increase in the initial stage and gradually decrease as the combustion surface recedes. Compared with data from the literature, the average error of motor thrust is 4.9%, validating the accuracy of this transient simulation.
Despite the accurate predictions achieved in this study, the current numerical model has certain limitations. Specifically, the simulation assumes a pure gas-phase flow and does not account for the condensed particle phase generated during KNSB combustion. In future work, the Discrete Phase Model (DPM) will be integrated to further optimize the existing framework and investigate the two-phase flow characteristics. Regarding practical applications, KNSB solid rocket motors, characterized by their low cost and simple structure, are highly suitable for sounding rockets, airbag inflators, and small-scale aerial vehicles. The high-fidelity thrust prediction achieved in this research enables more accurate flight trajectory estimations, thereby facilitating better flight control. Additionally, the detailed temperature distribution obtained from the internal flow field analysis provides a valuable reference for the thermal protection design of these motors.

Author Contributions

Conceptualization, X.M.; methodology, L.L.; validation, M.Y.; formal analysis, S.T.; investigation, L.W.; resources, X.M.; writing—original draft preparation, L.L.; writing—review and editing, J.M.; visualization, Y.C.; supervision, X.M.; funding acquisition, X.M. All authors have read and agreed to the published version of the manuscript.

Funding

This research was supported by “the Fundamental Research Funds for the Central Universities, NO. NS2025027” and funded by the open foundation of aerodynamics laboratory of CAAA (NO. 800009000199C1725058).

Data Availability Statement

The original contributions presented in the study are included in the article, further inquiries can be directed to the corresponding author.

Acknowledgments

The authors would like to express their gratitude to the Nanjing University of Aeronautics and Astronautics.

Conflicts of Interest

The authors declare no conflicts of interest.

References

  1. Park, J.H.; Seong, J.W.; Baek, J.W.; Park, J.Y.; Park, T.Y.; Yu, H.C. Development and Testing of the KNSB Solid Rocket TU-1. In Proceedings of the 2023 KSPE Fall Conference, Gyeongju, Republic of Korea, 22–24 November 2023; pp. 521–535. [Google Scholar]
  2. Alblooshi, A.; Ahmed, A.; Almazrouei, M.; Alali, N.; Alazeezi, M. Development of KNSB Rocket Motor for UAVs’ Rocket Assisted Take-Off (RATO) Boosters. J. Phys. Conf. Ser. 2024, 2891, 142021. [Google Scholar] [CrossRef]
  3. Ye, D.Y.; Zhang, D.X. Evolution of Chinese solid rocket propulsion technology for space missions. J. Solid Rocket Technol. 2002, 25, 1–7. [Google Scholar]
  4. Chen, S.; Liu, Y.; Chen, H. Successful firing test on the home-developed largest-scale segmented SRM. J. Solid Rocket Technol. 2021, 44, 1–3. [Google Scholar]
  5. Li, D.; Cheng, T.M. Development Prospect of China’s New Generation of Launch Vehicles. Aerosp. China 2008, 8, 7–10. [Google Scholar]
  6. Chen, W.Q.; Yu, Y.G. Numerical Simulation of Micro-Scale Combustion of AP/HTPB Propellant Under Various Pressure Conditions. J. Ordnance Equip. Eng. 2019, 40, 241–246. [Google Scholar]
  7. Han, X.J.; Su, C.Y.; Li, X.F.; Zhang, A.K.; Liang, X.D.; Li, Q. HTPB propellant with low burning rate and high solid content. J. Solid Rocket Technol. 2020, 43, 290–295. [Google Scholar]
  8. Choi, K.; Lee, C.; Moon, H.; Kim, J.; Ra, H.; Nam, M. Reviewing the Suitability of the Steam Rocket Propulsion System as an Alternative for KNSB Propellant System. In Proceedings of the 2023 KSPE Fall Conference, Gyeongju, Republic of Korea, 22–24 November 2023; pp. 1–4. [Google Scholar]
  9. Vega, J.A.; Leyton, J.A. Optimization of a type KNSB solid fuel engine for experimental rocketry. Cienc. Poder Aéreo 2016, 11, 182–193. [Google Scholar]
  10. Kim, M.; Kim, D.; Kim, D.; Koo, H.; Lee, D.; Bae, J.; Yoo, H.; Choi, N.; An, J.; Lee, S.; et al. Development of KNSB Rocket and Rocket Recovery System Using Ducted Fan. In Proceedings of the 2022 KSPE Fall Conference, Jeju, Republic of Korea, 23–25 November 2022; pp. 835–838. [Google Scholar]
  11. Sun, J.; Hu, J.X.; Duan, L.; Hu, Q.; Miao, X.; Xu, Y.Y.; Yang, Q. Review on ignition and combustion of Al-Li alloy solid propellant. J. Solid Rocket Technol. 2024, 47, 764–773. [Google Scholar]
  12. Li, Z.X.; Yuan, J.F.; Liu, J.Z.; Sun, Z.H.; Zhao, Y.; Yang, H.T. Study on the Experiment of Ignition Energy and Combustion Characteristics of HTPE Solid Propellants. Chin. J. Explos. Propellants 2024, 47, 1022–1030. [Google Scholar]
  13. Xin, K.; Yang, K.R.; Huo, Z.; Li, J.; Yang, R.J.; Li, Y.P.; Li, Q.; Wang, D.K. Research progress on high-pressure combustion performance of NEPE propellant. J. Propuls. Technol. 2026, 47, 38–57. [Google Scholar]
  14. Mao, C.L.; Zheng, J. Reflections on the development of high-performance composite solid propellants. Chin. J. Energetic Mater. 2025, 33, 817–819. [Google Scholar]
  15. Mao, J.Y.; Du, Y.; Tian, Y.F.; Gao, H.W.; Li, J.F. Simulation Analysis of the Internal Flow Characteristics for SRM with Tail-pipe Nozzle. J. Proj. Rocket. Missiles Guid. 2024, 44, 46–52. [Google Scholar]
  16. Shim, J.W.; Lee, S.H.; Im, H.J.; Ahn, J.M.; Kwon, S.J. Development and Validation of 220 N KNSB Solid Rocket Motor. In Proceedings of the 2023 KSPE Spring Conference, Busan, Republic of Korea, 24–26 May 2023; pp. 61–66. [Google Scholar]
  17. Wei, Y.W. Design and Investigate of Automatic Loading Multi-Pulse Solid Rocket Motor. Master’s Thesis, North University of China, Taiyuan, China, 2024. [Google Scholar]
  18. Yang, G.; Wei, Z.J.; Wang, S.X.; Han, W.Z.; Yu, H.X. Unsteady depressurization combustion model comparison for composite propellants. J. Propuls. Technol. 2026. [Google Scholar] [CrossRef]
  19. Wu, J.F.; Tian, H.; Li, J.H.; Yu, N.J.; Cai, G.B. Calculation of experimental regression rate of hybrid rocket motor. J. Aerosp. Power 2013, 28, 941–946. [Google Scholar]
  20. Deissler, R.G. Turbulent Fluid Motion III: Basic Continuum Equations; NASA-TM-104386; NASA Lewis Research Center: Cleveland, OH, USA, 1991. [Google Scholar]
  21. Zou, X.R.; Wang, N.F.; Han, L.; Bai, T.T.; Xie, K. Numerical investigation on regression rate and thrust regulation behaviors of a combined solid rocket motor with aluminum-based fuel. Aerosp. Sci. Technol. 2021, 119, 107102. [Google Scholar] [CrossRef]
  22. Gallo, G.; Savino, R. Regression rate model assessed by ballistic reconstruction technique in hybrid rocket engines burning liquefying fuels. Aerosp. Sci. Technol. 2022, 127, 107712. [Google Scholar] [CrossRef]
  23. Bernardini, M.; Cimini, M.; Stella, F.; Cavallini, E.; Di Mascio, A.; Neri, A.; Salvadore, F.; Martelli, E. Implicit Large-Eddy Simulation of Solid Rocket Motors using the Immersed Boundary Method. In Proceedings of the AIAA Propulsion and Energy 2021 Forum, Virtual Event, 9–11 August 2021. [Google Scholar]
  24. Hao, X.F.; Zhang, H.; Hou, X.; Tang, G.H. Radiative properties of alumina/aluminum particles and influence on radiative heat transfer in solid rocket motor. Chin. J. Aeronaut. 2022, 35, 98–116. [Google Scholar] [CrossRef]
  25. Yang, H.J. Numerical Simulation on the Hydraulic Characteristics of the Lower Chamber of the PWR. Master’s Thesis, Harbin Engineering University, Harbin, China, 2013. [Google Scholar]
  26. Zhang, N.; Guan, X.P.; Wang, K.J.; Yang, N. CFD simulation of bubble columns with tube bundles: Impact of turbulence models. Chin. J. Process Eng. 2025, 25, 261–272. [Google Scholar] [CrossRef]
  27. Tian, X.H. Numerical Simulation Investigation on the Unsteady Internal Flows in Solid Rocket Motor. Master’s Thesis, Huazhong University of Science and Technology, Wuhan, China, 2023. [Google Scholar]
  28. Meng, X.Y.; Tian, H.; Yu, R.P.; Lu, Y.D.; Gu, X.M.; Tan, G.; Cai, G.B. Three-dimensional numerical simulation of hybrid rocket motor based on dynamic mesh technology. Aerosp. Sci. Technol. 2023, 141, 108573. [Google Scholar] [CrossRef]
  29. Meng, X.Y.; Tian, H.; Lu, Y.D.; Jiang, X.Z.; Chen, R.K.; Zhang, Y.J. Simulation Study on Effects of Oxidizer Temperature on Performance of Hybrid Rocket Motor. J. Propuls. Technol. 2022, 43, 210683. [Google Scholar]
  30. Jia, Z.Y.; Li, Q.S.; Li, G.H.; Qi, F.S.; Li, B.K. Simulation of low NOx combustion technology of high and low lamp brick in coke oven vertical flue based on multi-field coupling models. China Metall. 2025, 35, 130–140. [Google Scholar]
  31. Zhou, P.; Li, T.; Zhang, J.Y.; Zhang, W.H. Aerothermal Effect Generated by Hyper Train in the Evacuated Tube. J. Mech. Eng. 2020, 56, 190. [Google Scholar]
  32. Liu, P.A.; Chang, H.; Li, S.S.; Wang, W.C. Numerical simulation of distributed combustion of the aluminized composite propellant. J. Solid Rocket Technol. 2018, 41, 156–161. [Google Scholar]
Figure 1. Schematic Diagram of the Geometric Model.
Energies 19 02260 g001
Figure 2. Flowchart of the dynamic mesh update procedure.
Energies 19 02260 g002
Figure 3. Mesh model of the KNSB motor (The arrow area has been enlarged).
Energies 19 02260 g003
Figure 4. Mesh independence test results: thrust curves for different grid resolutions.
Energies 19 02260 g004
Figure 5. Comparison of thrust curves with various time step sizes.
Energies 19 02260 g005
Figure 6. Pressure Contour Map of the KNSB motor.
Energies 19 02260 g006
Figure 7. KNSB motor Temperature Contour Plot.
Energies 19 02260 g007
Figure 8. Contour Map of Mass Fraction Components in the Internal Flow Field of KNSB.
Energies 19 02260 g008
Figure 9. Pressure Contour Map for Different Fuel Mixtures.
Energies 19 02260 g009
Figure 10. Temperature Contour Map for Different Fuel Mixtures.
Energies 19 02260 g010
Figure 11. Pressure Contours of KNSB Motor at Different Times.
Energies 19 02260 g011
Figure 12. Temperature cloud map of the KNSB motor at different times.
Energies 19 02260 g012
Figure 13. Thrust Variation in Simulation and Experiment [16].
Energies 19 02260 g013
Table 1. Boundary conditions for the numerical simulation.
BoundaryTypeValue
Inner surface of the grainMass flow inletMass flow q m = ρ p A b r .
Nozzle exitPressure outletPressure P o u t = 101,325 Pa
Temperature T o u t = 300 K
Inner surface of motorWallAdiabatic
Non-slip
Table 2. Motor Performance Comparison at Different Fuel Mixture Ratios.
Oxidizer RatioPressureAverage TemperatureThrust
57.5% KNO31.1423 MPa1731 K123.86 N
60% KNO31.1548 MPa1805 K125.24 N
62.5% KNO31.1734 MPa1870 K127.23 N
65% KNO31.1777 MPa1951 K127.69 N
67.5% KNO31.1880 MPa2029 K128.8 N
70% KNO31.1951 MPa2114 K129.6 N
Disclaimer/Publisher’s Note: The statements, opinions and data contained in all publications are solely those of the individual author(s) and contributor(s) and not of MDPI and/or the editor(s). MDPI and/or the editor(s) disclaim responsibility for any injury to people or property resulting from any ideas, methods, instructions or products referred to in the content.