Article

Energy Substitution Effect and Supply Chain Transformation in China’s New Energy Vehicle Industry: Evidence from DEA-Malmquist and Tobit Model Analysis

School of Business and Automotive Trade, Hubei University of Automotive Technology, Shiyan 442002, China
*
Author to whom correspondence should be addressed.
Energies 2026, 19(1), 208; https://doi.org/10.3390/en19010208
Submission received: 21 November 2025 / Revised: 26 December 2025 / Accepted: 29 December 2025 / Published: 30 December 2025

Abstract

The global shift towards sustainable energy and stringent climate policies has underscored the need for decarbonizing energy systems, electrifying transportation, and transforming supply chains. In this context, China’s new energy vehicle (NEV) industry, as the largest global producer and consumer of automobiles, is pivotal in advancing energy substitution and achieving carbon reduction goals. This study investigates the energy efficiency and supply chain transformation within China’s NEV sector, leveraging panel data from 12 representative provinces over the period 2017–2023. Employing a robust analytical framework that integrates the DEA-BCC model, Malmquist index, and Tobit regression, the study provides a dynamic and regionally differentiated assessment of NEV industry efficiency. The results reveal significant improvements in total factor energy efficiency, predominantly driven by technological progress. R&D intensity, infrastructure development, and environmental regulation are identified as key enablers of efficiency, while excessive government intervention tends to hinder performance. The findings offer valuable empirical insights and policy recommendations for optimizing China’s NEV industry in the context of energy system transformation and sustainable industrial development.

1. Introduction

1.1. Research Background and Policy Context

The tightening global climate governance regime and the acceleration of energy transitions have made energy system decarbonization, transport electrification, and supply chain greening central pillars of sustainable development strategies worldwide [1]. Major economies in Europe, North America, and Asia have all launched medium- and long-term plans to scale up new energy vehicles (NEVs), phase out internal combustion engine (ICE) vehicles, and build low-carbon mobility systems. In this global context, the NEV industry is no longer a niche segment of the automotive market, but a strategic sector at the intersection of energy, industry, and climate policy.
China, as the world’s largest automobile producer and consumer, plays a pivotal role in this transformation. The Chinese NEV industry is simultaneously expected to promote substitution of fossil fuels with electricity and clean energy, support national “dual carbon” goals, and drive the upgrading of manufacturing and related service sectors. A series of national strategies—such as the development plan for the NEV industry [2], the modern energy system plan, and policies for high-quality manufacturing and integrated manufacturing—service development—explicitly position NEVs as a key engine for green growth, an important platform for integrating renewable energy into end-use sectors, and a critical node in the restructuring of industrial value chains.
At the same time, China’s NEV industry is deeply embedded in complex, globally dispersed supply chains. Battery materials, power electronics, vehicle assembly, charging infrastructure, and digital platforms are linked through multi-tier networks, creating new patterns of resource allocation, energy use, and risk transmission. Whether these supply chains can operate in an efficient, resilient, and low-carbon manner has become a core question for both industrial and energy policy.
Against this backdrop, two issues are particularly salient. First, from the perspective of energy substitution, policy makers need to know whether the rapid expansion of NEV production and sales is actually accompanied by improvements in energy utilization efficiency at the industry level [3]. Second, from the perspective of supply chain transformation, it is crucial to understand how technological innovation, infrastructure, openness, government intervention, and environmental regulation jointly shape the efficiency performance of the NEV industry across regions.
China’s NEV development exhibits strong regional heterogeneity. Eastern provinces benefit from earlier industrialization, dense innovation networks, and advanced infrastructure, while many central and western provinces are in a catching-up phase and rely more heavily on policy support and industrial transfer. Empirically evaluating the energy efficiency of provincial NEV industries, and linking it to the evolution of supply chain structures and institutional environments, is therefore essential for assessing the effectiveness of existing policies and for refining regional development strategies.
This study responds to these needs by taking 12 key NEV provinces as the research sample and focusing on the period 2017–2023, during which both NEV diffusion and “dual carbon” policy implementation accelerated.

1.2. Research Questions and Objectives

Building on the above background, this paper addresses the following interrelated research questions:
  • What are the static efficiency patterns of China’s provincial NEV industries? Using a DEA–BCC model, we ask how comprehensive technical efficiency (TE), pure technical efficiency (PTE), and scale efficiency (SE) of the NEV industry evolve over time at the national, regional (eastern–central–western), and provincial levels.
  • How does the NEV industry’s total factor productivity evolve dynamically, and what are the main drivers of change? Applying the Malmquist index and its decomposition, we examine whether improvements in total factor productivity are mainly driven by technical efficiency change (EFFCH) or by technological progress (TECHCH), and how these patterns differ across regions.
  • Which structural and institutional factors shape interprovincial efficiency differences? Using a random-effects Tobit model, we investigate how R&D intensity, human capital, industrial structure, transportation infrastructure, digitalization, openness, government intervention, and environmental regulation jointly influence provincial NEV efficiency, and which of these factors exert statistically and economically significant effects.
  • Are the results robust to alternative model specifications and measurement choices? We further ask whether the efficiency patterns remain stable after correcting DEA estimates through a Simar–Wilson-type bootstrap procedure, replacing the proxy for government intervention (fiscal expenditure vs. tax burden), and conducting multicollinearity and other diagnostic checks.
Correspondingly, the main objectives of this paper are:
  • To construct a comprehensive efficiency evaluation framework for the NEV industry that simultaneously captures energy substitution performance and supply chain transformation;
  • To provide a dynamic, regionally disaggregated picture of the evolution of NEV energy efficiency in China;
  • To identify the key drivers and constraints of NEV efficiency from multiple dimensions, thereby clarifying the mechanisms through which policies and structural conditions affect performance;
  • To offer targeted policy recommendations for promoting high-quality, energy-efficient, and supply-chain-optimized development of the NEV industry.

1.3. Contributions and Structure of the Paper

This paper makes several contributions to the existing literature on energy efficiency, NEVs, and green supply chains.
First, it develops an integrated analytical framework that links energy substitution and supply chain transformation within the NEV industry. Rather than treating NEV deployment purely as a technological or environmental issue, the paper explicitly embeds NEV development in a broader setting of industrial upgrading, infrastructure expansion, and institutional change. By doing so, it provides a unified perspective on how energy system decarbonization and supply chain restructuring interact at the industry level.
Second, it offers dynamic and regionally differentiated empirical evidence based on panel data from 12 representative provinces between 2017 and 2023. The combination of a non-oriented DEA–BCC model and Malmquist index allows us to distinguish between static efficiency levels and dynamic productivity changes, and to decompose the latter into efficiency change and technological progress. The results reveal clear east–central–west efficiency gradients and show that technological progress is the dominant driver of productivity growth in the NEV industry, while management and scale effects play a secondary but non-negligible role.
Third, it systematically examines the determinants of NEV efficiency using a random-effects Tobit model with average marginal effects. By incorporating eight dimensions—technological innovation, human capital, industrial structure, infrastructure, digitalization, openness, government intervention, and environmental regulation—the paper moves beyond purely technological or macroeconomic explanations. The empirical findings indicate that R&D intensity, transportation infrastructure, and environmental regulation significantly enhance NEV efficiency, whereas excessive government intervention tends to reduce it, highlighting the importance of a balanced policy mix.
Fourth, it strengthens the robustness and inferential basis of DEA–Malmquist analysis by applying a bootstrap-DEA procedure and multiple diagnostic checks. Bias-corrected efficiency scores, confidence intervals, VIF tests, and alternative proxies for government intervention jointly ensure that the conclusions are not driven by model artifacts or single measurement choices.
The remainder of the paper is organized as follows. Section 2 reviews the relevant literature on energy efficiency measurement, NEV-related energy substitution and decarbonization, and NEV supply chain transformation, and positions this study within that literature. Section 3 presents the methodological framework, including the DEA–BCC model, Malmquist index, bootstrap-DEA procedure, and Tobit regression model. Section 4 describes the variables, data sources, and sample selection. Section 5 reports the empirical results for DEA efficiency, Malmquist indices, and Tobit regressions. Section 6 conducts robustness checks and additional diagnostics. Section 7 concludes with policy implications and directions for future research.

2. Literature Review

2.1. Evolution of Energy Efficiency Measurement Methods

Energy efficiency measurement has evolved from simple single-factor indicators (such as energy intensity or unit energy consumption) to more sophisticated multi-input, multi-output frameworks. Early studies often relied on ratio indicators at the macro level and could not adequately account for the joint production of desirable and undesirable outputs, nor for structural differences across decision-making units.
Non-parametric approaches, especially Data Envelopment Analysis (DEA), provided a powerful alternative by constructing an empirical production frontier and comparing the relative efficiency of decision-making units without imposing a specific functional form. Classic DEA models include the CCR model, which assumes constant returns to scale, and the BCC model, which allows for variable returns to scale. Subsequent developments introduced super-efficiency models, slack-based measures, and DEA formulations that explicitly incorporate undesirable outputs, enabling richer applications in energy and environmental studies spanning industrial sectors, power systems, transport, and urban energy use.
To capture dynamic changes, the Malmquist productivity index was integrated into the DEA framework. This approach decomposes total factor productivity change into technical efficiency change and technological progress, and further into pure technical and scale efficiency changes. It has been widely applied to evaluate productivity dynamics in energy-intensive industries, electricity markets, and cross-country energy efficiency comparisons. In many cases, a two-stage framework is employed: DEA–Malmquist is used in the first stage to compute efficiency and productivity indices, and regression models (often Tobit or panel regressions) are used in the second stage to identify determinants.
Parametric methods, such as stochastic frontier analysis (SFA), have also been used to measure energy efficiency, particularly when separating inefficiency from statistical noise is important. However, SFA requires specifying a functional form and distributional assumptions, whereas DEA remains attractive when the production technology is complex and multi-dimensional, as in the case of NEV industries involving energy inputs, labor, capital, and multiple outputs.
Recent literature increasingly combines DEA or SFA with advanced statistical techniques—bootstrap methods, panel models, and spatial econometrics—to provide confidence intervals, address bias, and capture spatial spillovers. This evolution in methods provides the technical foundation on which the present study builds: a DEA–BCC model with Malmquist index decomposition, augmented by a bootstrap-DEA procedure and a random-effects Tobit regression for determinants.

2.2. NEV-Related Energy Substitution and Decarbonization Studies

NEVs are recognized globally as a key instrument for achieving deep decarbonization in the transport sector and for promoting energy substitution from fossil fuels to electricity and other low-carbon carriers. International research can be roughly grouped into several strands.
Within China, studies have examined the contribution of NEVs to national “dual carbon” targets [4], the impact of NEV promotion on power system operation, and the energy and emission implications of shifting from ICE vehicles to NEVs at city or provincial scales. However, much of this work adopts aggregated indicators (e.g., total NEV stock, emissions avoided) rather than explicitly modeling industry-level energy efficiency in a multi-input, multi-output framework [5,6].
The first strand focuses on life-cycle assessment and carbon footprint analysis of NEVs [7]. These studies evaluate energy use and greenhouse gas emissions from vehicle production, battery manufacturing, charging, and end-of-life processes, often comparing NEVs with conventional vehicles or alternative powertrains (hybrid, plug-in hybrid, fuel cell). Results typically indicate substantial emission reduction potential for NEVs over their life cycle, especially when the power system decarbonizes and energy intensity of upstream industries declines [8].
The second strand examines scenario analysis and system modeling. Using integrated energy system models, computable general equilibrium models, or bottom-up transport models, these works simulate how large-scale NEV deployment affects national energy consumption, fuel mix, and carbon emissions. They highlight that the decarbonization benefits of NEVs depend critically on the pace of renewable energy deployment, grid flexibility, and improvements in battery and charging technologies.
The third strand addresses regional and national NEV diffusion in response to policy instruments such as subsidies, fuel economy standards, carbon pricing, and industrial support schemes [9]. Cross-country and cross-region comparisons show that policy design, charging infrastructure, consumer preferences, and industrial capabilities jointly determine the speed and depth of NEV adoption.
In sum, the existing NEV literature has clarified the potential of NEVs to enable energy substitution and decarbonization [10], but relatively few studies explicitly use DEA–Malmquist or similar methods to evaluate the total factor energy efficiency of NEV industries across regions and over time, especially in connection with supply chain characteristics [11,12,13]. While some studies have applied these methods to broader energy sectors [14], their application to provincial NEV industries remains limited.

2.3. NEV Supply Chain Transformation and Collaborative Efficiency

The NEV industry is embedded in multi-layer supply chains that span raw materials, batteries, power electronics, vehicle manufacturing, charging infrastructure, and digital mobility services. The transition from traditional automotive supply chains to green, electrified, and digital supply chains has attracted growing scholarly attention.
A substantial body of work analyzes green and sustainable supply chain management in the automotive and broader manufacturing sectors [15]. These studies develop optimization models for network design under carbon constraints, evaluate trade-offs between cost, environmental performance, and service levels, and investigate how carbon pricing, green procurement, and recycling policies influence supply chain configuration.
Another literature strand focuses on collaborative innovation and knowledge diffusion along NEV supply chains [16]. Multi-agent game models and contract designs explore how firms, research institutions, and governments share risks and benefits in joint R&D, technology transfer, and platform ecosystems. Digital technologies—such as industrial internet platforms, big data, and AI—are increasingly recognized as enablers of real-time coordination, predictive maintenance, and intelligent logistics.
More recently, resilience and risk management in NEV supply chains have become prominent topics, particularly in light of supply disruptions in critical minerals and batteries [17,18]. International studies highlight the vulnerability of global NEV supply chains to geopolitical shocks and the need for diversified sourcing, regional production hubs, and circular economy strategies.
Despite this progress, several limitations remain from the perspective of this paper. First, most supply chain studies use optimization or game-theoretic models and focus on specific links (e.g., battery recycling, logistics, or network design), while less attention is paid to how supply chain transformation is reflected in industry-level energy efficiency outcomes [19]. Second, the empirical measurement of collaborative efficiency across regions, using multi-input, multi-output methods, is still limited—especially for NEV industries where energy substitution and supply chain reconfiguration happen simultaneously [20]. Third, cross-regional comparative studies that link supply chain characteristics to NEV energy efficiency in a systematic quantitative framework remain scarce [21].

2.4. Research Gaps and This Paper’s Positioning

Synthesizing the above strands, at least four gaps can be identified.
  • Lack of integrated analysis combining energy substitution and supply chain transformation at the NEV industry level. Existing NEV studies either emphasize energy and environmental outcomes (e.g., emissions, energy use) or concentrate on supply chain design and coordination. Few works explicitly treat the NEV industry as a bridge between the energy system and complex supply chains and evaluate its performance through a unified efficiency lens. This paper fills this gap by jointly considering energy utilization efficiency and supply chain transformation in the construction of input–output and determinant variables.
  • Limited dynamic and regionally disaggregated efficiency evaluation. While DEA and Malmquist indices have been widely used in energy and environmental economics, their application to provincial NEV industries is still limited. Many NEV studies rely on static or single-period indicators, which cannot capture dynamic productivity changes or distinguish between efficiency change and technological progress. This study adopts a DEA–BCC model combined with Malmquist decomposition to construct a dynamic, regionally disaggregated picture of NEV efficiency evolution in 12 representative provinces across eastern, central, and western China.
  • Insufficient analysis of multi-dimensional determinants, especially institutional factors. Prior works often focus on a subset of determinants—such as R&D, environmental regulation, or market size—without systematically integrating technological, structural, infrastructural, openness, and institutional dimensions into a coherent empirical model. Moreover, the role of government intervention is usually discussed qualitatively or proxied by a single indicator. This paper incorporates eight explanatory dimensions and explicitly distinguishes between fiscal expenditure and tax burden as alternative proxies for government intervention, allowing a more nuanced assessment of how policy instruments affect NEV efficiency.
  • Weaknesses in statistical inference and robustness in DEA-based NEV studies. Many DEA applications report point estimates of efficiency scores but do not address small-sample bias or provide confidence intervals, which limits the reliability of policy conclusions. Second-stage regressions are sometimes estimated using ordinary least squares, ignoring the bounded nature of efficiency scores. This study addresses these issues by using a Simar–Wilson-type bootstrap-DEA procedure to correct bias and construct confidence intervals, and by employing a random-effects Tobit model with average marginal effects to properly handle the censored dependent variable.
Positioned against these gaps, this paper contributes by:
  • Treating the NEV industry as a dual vehicle for energy substitution and supply chain transformation, and building a DEA input–output system accordingly;
  • Applying DEA–BCC and Malmquist indices to track dynamic efficiency and productivity changes across 12 key provinces from 2017 to 2023;
  • Estimating a random-effects Tobit model with eight explanatory dimensions to reveal the main drivers and constraints of NEV efficiency, with particular attention to the roles of R&D, infrastructure, environmental regulation, and government intervention;
  • Enhancing the robustness and interpretability of the results through bootstrap-DEA, alternative policy proxies, and multiple diagnostic checks.
These design choices ensure that the subsequent empirical analysis is firmly anchored in the existing international and domestic literature, while directly responding to the need for more comprehensive, dynamic, and policy-relevant research on NEV energy efficiency and supply chain transformation.

3. Methodology

3.1. DEA–BCC Model and Malmquist Productivity Index

In this study, we adopt a non-oriented DEA–BCC (VRS) model on panel data for 12 provincial NEV industries over 2017–2023, which allows for variable returns to scale and accommodates multiple inputs and outputs without imposing a specific functional form.

3.1.1. VRS Non-Oriented DEA–BCC Model

Data Envelopment Analysis (DEA) is a nonparametric frontier analysis method proposed by Charnes, Cooper, and Rhodes (1978) to evaluate the relative efficiency of Decision Making Units (DMUs) under conditions of multiple inputs and multiple outputs [22]. Its core concept involves constructing a production possibility frontier to compare the input-output efficiency of each DMU and determine whether it operates efficiently.
Traditional DEA models primarily encompass two types: the CCR model (assuming Constant Returns to Scale, CRS) and the BCC model (assuming Variable Returns to Scale, VRS). The CCR model is suitable for evaluation scenarios where overall scale is relatively consistent, while the BCC model further separates technical efficiency from scale efficiency, better aligning with the scale differences among regions or enterprises in real economic systems [23].
Given that this study examines China’s provincial new energy vehicle industries—which exhibit significant disparities in development stages, industrial foundations, and policy support—the BCC model (assuming variable returns to scale) is employed to measure each province’s energy efficiency levels.
The basic form of the DEA model can be expressed as:
Min θ s . t . { j = 1 n λ j x i j θ x i o , i = 1,2 , , m j = 1 n λ j y r j y r o , r = 1,2 , , s j = 1 n λ j = 1 , λ j 0 , j = 1,2 , , n
Here, θ represents the efficiency value, x i j  and γ r j denote the input and output indicators of the j th decision-making unit, respectively, and λ is the weight variable. When θ = 1 and the slack variables are 0, it indicates that the decision-making unit is DEA-efficient; θ < 1 indicates input redundancy or output deficiency, an inefficient state.

3.1.2. Malmquist TFP Index and Decomposition

However, traditional static DEA models can only compare the efficiency levels of decision-making units at the cross-sectional level, failing to reveal dynamic changes in efficiency over time. To address this, this paper introduces the Malmquist index method to dynamically decompose energy efficiency changes in the new energy vehicle industries across provinces.
First proposed by Caves, Christensen, and Diewert (1982) [24], the Malmquist index measures productivity changes over time and was later integrated into the DEA framework by Färe et al. (1992) [25]. This method decomposes total factor productivity change (TFPCH) into technological progress (TECHCH) and technical efficiency change (EFFCH), with the latter further subdivided into pure technical efficiency (PECH) and scale efficiency (SECH). Its mathematical expression is as follows:
M ( x t + 1 , y t + 1 , x t , y t ) = D t ( x t + 1 , y t + 1 ) D t ( x t , y t ) × D t + 1 ( x t + 1 , y t + 1 ) D t + 1 ( x t , y t )
Here, D denotes the input-oriented distance function. If M > 1 , it indicates productivity growth; if M < 1 , it signifies productivity decline. Further decomposition yields:
T F P C H = E F F C H × T E C H C H = ( P E C H × S E C H ) × T E C H C H
The meanings of each component indicator are as follows:
EFFCH: Reflects the degree to which a decision-making unit catches up relative to the production frontier;
TECHCH: Measures the shift in the production frontier over time, reflecting technological innovation levels;
PECH: Reflects changes in management and technological utilization efficiency;
SECH: Measures whether the decision-making unit operates at an optimal scale;
TFPCH: Comprehensive reflection of the overall trend in efficiency and technological progress.
Using the DEA–Malmquist index method, this study systematically evaluates the spatial and temporal patterns of energy efficiency changes and technological progress dynamics within the new energy vehicle industry, laying the groundwork for subsequent analysis of underlying mechanisms. All DEA and Malmquist index calculations were performed using the DEAP 2.1 software package.

3.2. Bootstrap–DEA Procedure (Simar–Wilson Type)

Although the DEA–BCC model provides non-parametric efficiency estimates for each provincial NEV industry, the resulting efficiency scores are known to suffer from small-sample bias and lack a straightforward statistical inference framework. To address these limitations, this study applies a smoothed bootstrap procedure in the spirit of Simar and Wilson (2007) to obtain bias-corrected efficiency scores and confidence intervals for both static DEA efficiency and the Malmquist productivity index [26].
The bootstrap–DEA procedure used in this paper can be summarized as follows:
(1)
Original DEA efficiency estimation
In the first step, the non-oriented DEA–BCC model described in Section 3.1 is applied to the panel of 12 provincial NEV industries over 2017–2023. For each province–year observation, we obtain an original technical efficiency estimate θ ^ i t based on the observed input–output vector ( x i t , y i t ) . These original scores serve as the benchmark against which bootstrap bias and confidence intervals are computed.
(2)
Generation of bootstrap pseudo-samples
In the second step, a smoothed bootstrap is used to approximate the sampling distribution of the DEA efficiency scores. Based on the empirical distribution of the original efficiency scores, pseudo-samples of efficiency are drawn and perturbed with a small amount of noise to avoid discreteness. For each bootstrap replication b = 1 , , B (with B = 200 in this study), a pseudo-sample of efficiency scores is generated and re-projected onto the DEA frontier, yielding a set of bootstrap efficiency scores θ ^ i t ( b ) for all province–year observations.
In practice, this bootstrap step is implemented using the built-in smoothed bootstrap option of MaxDEA Ultra 9, with 200 replications and a non-oriented VRS specification consistent with the original model.
(3)
Estimation of bias and bias-corrected efficiency
For each province–year observation, the bootstrap mean efficiency is computed as the average of the bootstrap scores:
θ i t boot = 1 B b = 1 B θ ^ i t ( b ) .
The finite-sample bias of the original DEA estimate is then estimated as
B i a s ^ ( θ ^ i t ) = θ i t b o o t θ ^ i t .
Using this bias estimate, a bias-corrected efficiency score is obtained as
θ ^ i t = θ ^ i t B i a s ^ ( θ ^ i t ) .
To ensure that the corrected scores remain within the admissible efficiency range, θ ~ i t is truncated to the interval ( 0,1 ] whenever necessary. The bias, bias-corrected efficiency, and bootstrap mean are reported in the corresponding Bootstrap_Bias and Bootstrap_Mean output files.
(4)
Construction of confidence intervals
The bootstrap replications { θ ^ i t ( b ) } b = 1 B also allow us to construct confidence intervals for the efficiency of each province–year. In this study, percentile-type confidence intervals are used. For a given confidence level (e.g., 95%), the lower and upper bounds are obtained as the appropriate empirical quantiles of the bootstrap distribution:
C I i t l o w e r = Q 2.5 % ( { β ^ i t ( b ) } ) , C I i t u p p e r = Q 97.5 % ( { β ^ i t ( b ) } ) .
The resulting confidence intervals for DEA efficiency scores and Malmquist indices are reported in the Bootstrap_CI output, and are later used in the robustness section to assess whether traditional DEA estimates systematically underestimate efficiency.
(5)
Bootstrap correction of the Malmquist index
In addition to static technical efficiency, the bootstrap procedure is also applied to the Malmquist productivity index and its decomposition components. For each bootstrap replication, the Malmquist index between periods (t) and (t + 1) is recomputed for all provinces based on the bootstrap DEA frontiers, generating a sequence of bootstrap values for:
  • the Malmquist index M I i t ( b ) ,
  • efficiency change E F F C H i t ( b ) ,
  • technological change T E C H C H i t ( b ) ,
  • pure technical efficiency change P E C H i t ( b ) ,
  • scale efficiency change S E C H i t ( b ) ,
Analogously to the static case, the bootstrap mean, bias and bias-corrected values of the Malmquist index and its components are calculated, together with confidence intervals. These results are later aggregated to obtain national and regional averages, and are used to verify the robustness of the DEA–Malmquist findings reported in the empirical results section.
Overall, the bootstrap–DEA framework adopted in this study provides (i) bias-corrected efficiency measures for provincial NEV industries, and (ii) interval estimates that allow formal statistical inference on both static efficiency and dynamic productivity change.

3.3. Tobit Model for Efficiency Determinants

3.3.1. Model Specification and Estimation Strategy

After measuring the comprehensive technical efficiency (TE) of the new energy vehicle industry across provinces from 2017 to 2023 using DEA-BCC and the Malmquist index model, this study employs the Tobit cutoff regression model (Tobin, 1958) to identify key factors influencing energy substitution efficiency and supply chain transformation [27]. Since efficiency values derived from DEA fall within the interval (0,1], direct estimation using ordinary least squares (OLS) would yield biased and inconsistent parameter estimates. The Tobit model, capable of producing consistent parameter estimates via maximum likelihood estimation (MLE) while accounting for the constrained nature of the dependent variable, is thus widely adopted in efficiency analysis.
The model specification is as follows:
T E i t * = α + β 1 R D i t + β 2 H E D U i t + β 3 I S U i t + β 4 I N F R A i t + β 5 D I G I i t + β 6 O P E N i t + β 7 G O V T i t + β 8 E N V I i t + μ i t
T E i t = { T E i t * , 0 < T E i t * < 1 0 , T E i t * 0 1 , T E i t * 1
T E i t denotes the comprehensive technical efficiency value of province i in year t. R D i t ,   H E D U i t ,   I S U i t ,   I N F R A i t ,   D I G I i t ,   O P E N i t ,   G O V i t   a n d   E N V I i t represents the impact variables across eight dimensions: technological innovation, human capital, industrial structure, infrastructure, informatization, openness to the outside world, government intervention, and environmental regulation. μ i t is the random disturbance term.
Given the significant individual differences and temporal characteristics across provinces, this study employs a Random-Effects Tobit model for estimation, conducted using Stata 17 software. This method allows individual effects to enter the model randomly, thereby enhancing the robustness and efficiency of the estimation results.

3.3.2. Interpretation of Marginal Effects

In addition to estimating the coefficients of the Tobit model, it is important to interpret the marginal effects of the explanatory variables. The marginal effect reflects how a change in an explanatory variable affects the likelihood of observing a specific energy efficiency outcome within the bounded range (0 to 1).
The marginal effect for each variable is computed as the partial derivative of the latent dependent variable T E i * with respect to the explanatory variables, evaluated at the mean of the independent variables. It represents the expected change in the energy efficiency score when the corresponding explanatory variable increases by one unit, holding other variables constant.
The marginal effect of a variable X k is given by the following formula:
T E i X k = T E i * X k × ( probability   of   censoring ) = β k × Φ ( X ~ i )
where
  • β k is the estimated coefficient of the explanatory variable X k from the Tobit model;
  • Φ ( X ^ i ) is the probability density function (PDF) of the normal distribution, adjusted for the observed range of T E i .
This formula helps quantify the effect of each factor on the probability of the NEV industry achieving different levels of energy efficiency. For example, a positive marginal effect for R D i (R&D intensity) would indicate that higher R&D intensity leads to a higher probability of improved energy efficiency. Conversely, a negative marginal effect for G O V T i (government intervention) would suggest that more government intervention is associated with a lower likelihood of achieving higher energy efficiency, which could reflect inefficiencies in policy implementation or resource allocation.

4. Variables, Data and Sample Selection

4.1. DEA Input and Output Indicators: Definitions and Justification

Considering the energy substitution characteristics and intricate supply chain structure of the new energy vehicle (NEV) industry, this study carefully selects the following input and output indicators:
  • Input Indicators: Energy consumption, labor input, and capital input.
  • Output Indicators: New energy vehicle penetration rate, GDP output, and the level of industrial structure optimization.
The selection of each indicator is guided by the principles of data availability, representativeness, and economic significance. Below is a detailed explanation of the selected input and output indicators, along with the justification for their use in this study.
The input and output indicators used for DEA efficiency measurement are summarized in Table 1.
The table’s “Explanation and Justification” column helps clarify why each indicator is relevant to the study’s analysis of energy substitution and supply chain transformation in China’s NEV industry.

4.2. Explanatory Variables in the Tobit Model

To systematically characterize the factors influencing the efficiency of the new energy vehicle (NEV) industry, this paper selects explanatory variables across eight dimensions: technological innovation, human capital, industrial structure, infrastructure, informatization level, openness to the outside world, government intervention, and environmental regulation. These dimensions are crucial in understanding the underlying drivers of efficiency within the NEV industry and its capacity to contribute to energy substitution and supply chain transformation.
An indicator system is constructed as shown in Table 2, which provides a clear mapping of these dimensions to specific variables. The inclusion of these indicators enables a comprehensive analysis of the dynamic variations in NEV efficiency, integrating both the technological and socio-economic aspects.
These explanatory variables have been carefully selected to reflect the diverse factors that shape the efficiency of the NEV industry. They include critical aspects such as technological innovation (R&D), human capital, and governmental policy interventions, each playing a key role in the evolution of the industry.

4.3. Government Intervention: Definition, Construction and Alternative Proxy

In this study, government intervention is considered a significant factor influencing the efficiency of the new energy vehicle industry. It is defined as the extent to which government policies and fiscal actions directly or indirectly influence the industrial and economic activities within the NEV sector. Government intervention can take many forms, including financial subsidies, tax incentives, regulations, and investments in infrastructure.
For the purpose of this model, government intervention is proxied by fiscal expenditure divided by the regional GDP, represented by the variable GOVT. This approach helps capture the direct financial support and policy-driven investments that may impact the industry’s development and efficiency.
To ensure robustness and mitigate potential issues of endogeneity, an alternative proxy for government intervention is considered—tax burden. Tax burden is an important aspect of government policy that directly affects industry performance by influencing operational costs and overall competitiveness. This proxy allows for the assessment of how government taxation policies can shape the efficiency of the NEV sector, offering a different but complementary view of government involvement.
The use of these two proxies for government intervention enables a more comprehensive understanding of how government policy shapes industry dynamics and its efficiency performance.

4.4. Sample Selection and Justification of the 12 Representative Provinces

This study selects 12 provinces—Beijing, Shanghai, Jiangsu, Zhejiang, Guangdong, Shandong, Hubei, Henan, Hunan, Sichuan, Chongqing, and Shaanxi—as representative decision-making units for analyzing the energy efficiency and supply chain transformation of China’s new energy vehicle (NEV) industry.
The sample is justified based on multiple quantitative dimensions, including industrial scale, technological innovation, infrastructure endowment, and policy intensity. First, in terms of production capacity, the selected provinces jointly accounted for approximately 85.8% of national NEV output in 2023, according to data from the Ministry of Industry and Information Technology and provincial statistical bulletins. This coverage includes all major manufacturing hubs as well as emerging production regions, thereby capturing both leading and transitional development stages.
Second, with respect to technological innovation, these provinces represented about 81.5% of national R&D expenditure in the automotive and NEV-related sectors. This concentration reflects their dominant roles in battery technology, intelligent manufacturing, and supply chain upgrading, which are central to efficiency improvement in the NEV industry.
Third, regarding infrastructure support, the selected provinces hosted approximately 91.5% of China’s public charging infrastructure by the end of 2023, based on data from the China Charging Alliance. Such extensive infrastructure deployment is essential for reflecting regional heterogeneity in NEV diffusion, energy substitution intensity, and downstream supply chain coordination.
Finally, these provinces are also characterized by relatively high policy intensity, as evidenced by substantial fiscal support, frequent policy initiatives, and participation in national-level NEV pilot programs. This institutional diversity provides a suitable basis for examining the role of government intervention in shaping efficiency outcomes.
Overall, the selected 12 provinces collectively capture the core industrial, technological, infrastructural, and policy features of China’s NEV industry. This multi-dimensional representativeness ensures that the sample adequately reflects regional heterogeneity while remaining empirically manageable for DEA and subsequent econometric analysis.

4.5. Data Sources and Preprocessing

The data for this study are derived from various national and provincial statistical yearbooks, including the China Statistical Yearbook, the National Energy Administration’s statistical publications, and relevant industry reports. The primary data sources for the variables include:
  • Energy consumption data: sourced from the National Bureau of Statistics of China and provincial statistical yearbooks.
  • Economic output (GDP): sourced from the National Bureau of Statistics and provincial yearbooks.
  • NEV sales data: sourced from operational reports by the Ministry of Industry and Information Technology (MIIT).
  • Industrial structure: based on data from national and provincial economic surveys.
For data preprocessing, missing observations are addressed using linear time trend extrapolation based on ordinary least squares (OLS). Specifically, for provinces where energy consumption data for 2023 are unavailable, missing values are estimated using historical trends observed from 2000 to 2022.
Diagnostic checks indicate that the fitted trend models exhibit high explanatory power, and sensitivity analyses suggest that alternative extrapolation approaches yield only marginal differences in the estimated values. These results indicate that the extrapolation procedure does not materially affect the subsequent efficiency measurement or regression outcomes.

4.6. Descriptive Statistics and Correlation Matrix

Descriptive statistics of all variables are reported in Table 3.
Table 4 presents the correlation matrix for the DEA inputs, outputs, and Tobit explanatory variables.

5. Empirical Results

5.1. DEA Efficiency Results for China’s NEV Industry

5.1.1. National and Regional TE/PTE/SE Patterns

This section presents the results of the comprehensive technical efficiency (TE), pure technical efficiency (PTE), and scale efficiency (SE) across China’s provinces for the years 2017–2023, based on the DEA–BCC model. The analysis compares both national and regional efficiencies to examine how the NEV industry has evolved in terms of energy utilization and productivity.
Technical Efficiency (TE):
The comprehensive technical efficiency (TE) results show that the NEV industry’s performance has improved significantly across most provinces from 2017 to 2023. The national average TE has steadily increased, reflecting progress in energy usage optimization. Provinces like Shanghai, Beijing, and Zhejiang exhibit consistently high TE values, indicating that their NEV industries are near the frontier of optimal energy utilization. On the other hand, regions with lower TE values, such as Hunan and Sichuan, demonstrate more potential for improvement in both energy management and production efficiency.
Pure Technical Efficiency (PTE):
The PTE results, which isolate the effect of managerial and technological efficiency, reveal that the top-performing regions also lead in PTE. Shanghai and Beijing, in particular, have managed to stay at the forefront of technological development and production efficiency. In contrast, provinces like Henan and Hunan have a lower PTE, indicating inefficiencies at the technical and managerial levels. These differences highlight the importance of technological innovation and better management practices in enhancing the overall performance of the NEV industry.
Scale Efficiency (SE):
Scale efficiency (SE), which reflects the efficiency of a region’s operational scale, also varies across China. While some provinces operate at or near an optimal scale, others, such as Shandong and Sichuan, show inefficiencies related to scale, suggesting that some regions are not fully exploiting their production potential. These results underscore the need for optimized scaling of production facilities, particularly in less-developed regions.
The following table presents the detailed TE, PTE, and SE results for the years 2017–2023. The patterns of these indicators provide valuable insights into the regional differences in the NEV industry’s efficiency levels.
Detailed numerical results are provided in the Appendix A.

5.1.2. Eastern–Central–Western Comparison and Discussion

The performance of China’s NEV industry varies considerably across different regions, with noticeable differences in the efficiency levels of the eastern, central, and western provinces. This section provides a comparative analysis of the DEA results from the eastern, central, and western regions of China, focusing on their respective TE, PTE, and SE.
Eastern Region:
The eastern region, which includes provinces like Shanghai, Beijing, and Zhejiang, consistently demonstrates the highest efficiency levels in the NEV industry. These provinces benefit from advanced infrastructure, higher levels of technological innovation, and greater policy support, which contribute to their high TE, PTE, and SE values. The availability of investment, access to skilled labor, and the implementation of cutting-edge technologies in these provinces have played a significant role in their efficient energy usage.
Central Region:
The central provinces, such as Henan and Hunan, show moderate performance in terms of TE and PTE. While they have made substantial progress, their efficiency levels remain below those of the eastern provinces. The challenges in these regions are often related to less advanced infrastructure, limited access to high-tech innovations, and slower adoption of new energy technologies. However, there is a significant potential for improvement, particularly in scaling production and enhancing technical capabilities.
Western Region:
The western region, including provinces like Sichuan, Shaanxi, and Chongqing, exhibits the lowest TE, PTE, and SE levels among all regions. Factors contributing to this include lower industrial development, less government intervention, and limited investments in the NEV sector. Additionally, the geographical challenges and lower economic development in these areas hinder the efficient integration of the NEV industry into the national energy system. However, with the right policy measures and technological investments, these regions have substantial room for improvement.
The comparative analysis across regions highlights the importance of targeted policies to address the specific challenges faced by different regions. These findings emphasize the need for a more tailored approach to improving efficiency in the NEV industry, taking into account the regional disparities in infrastructure, technology, and investment.
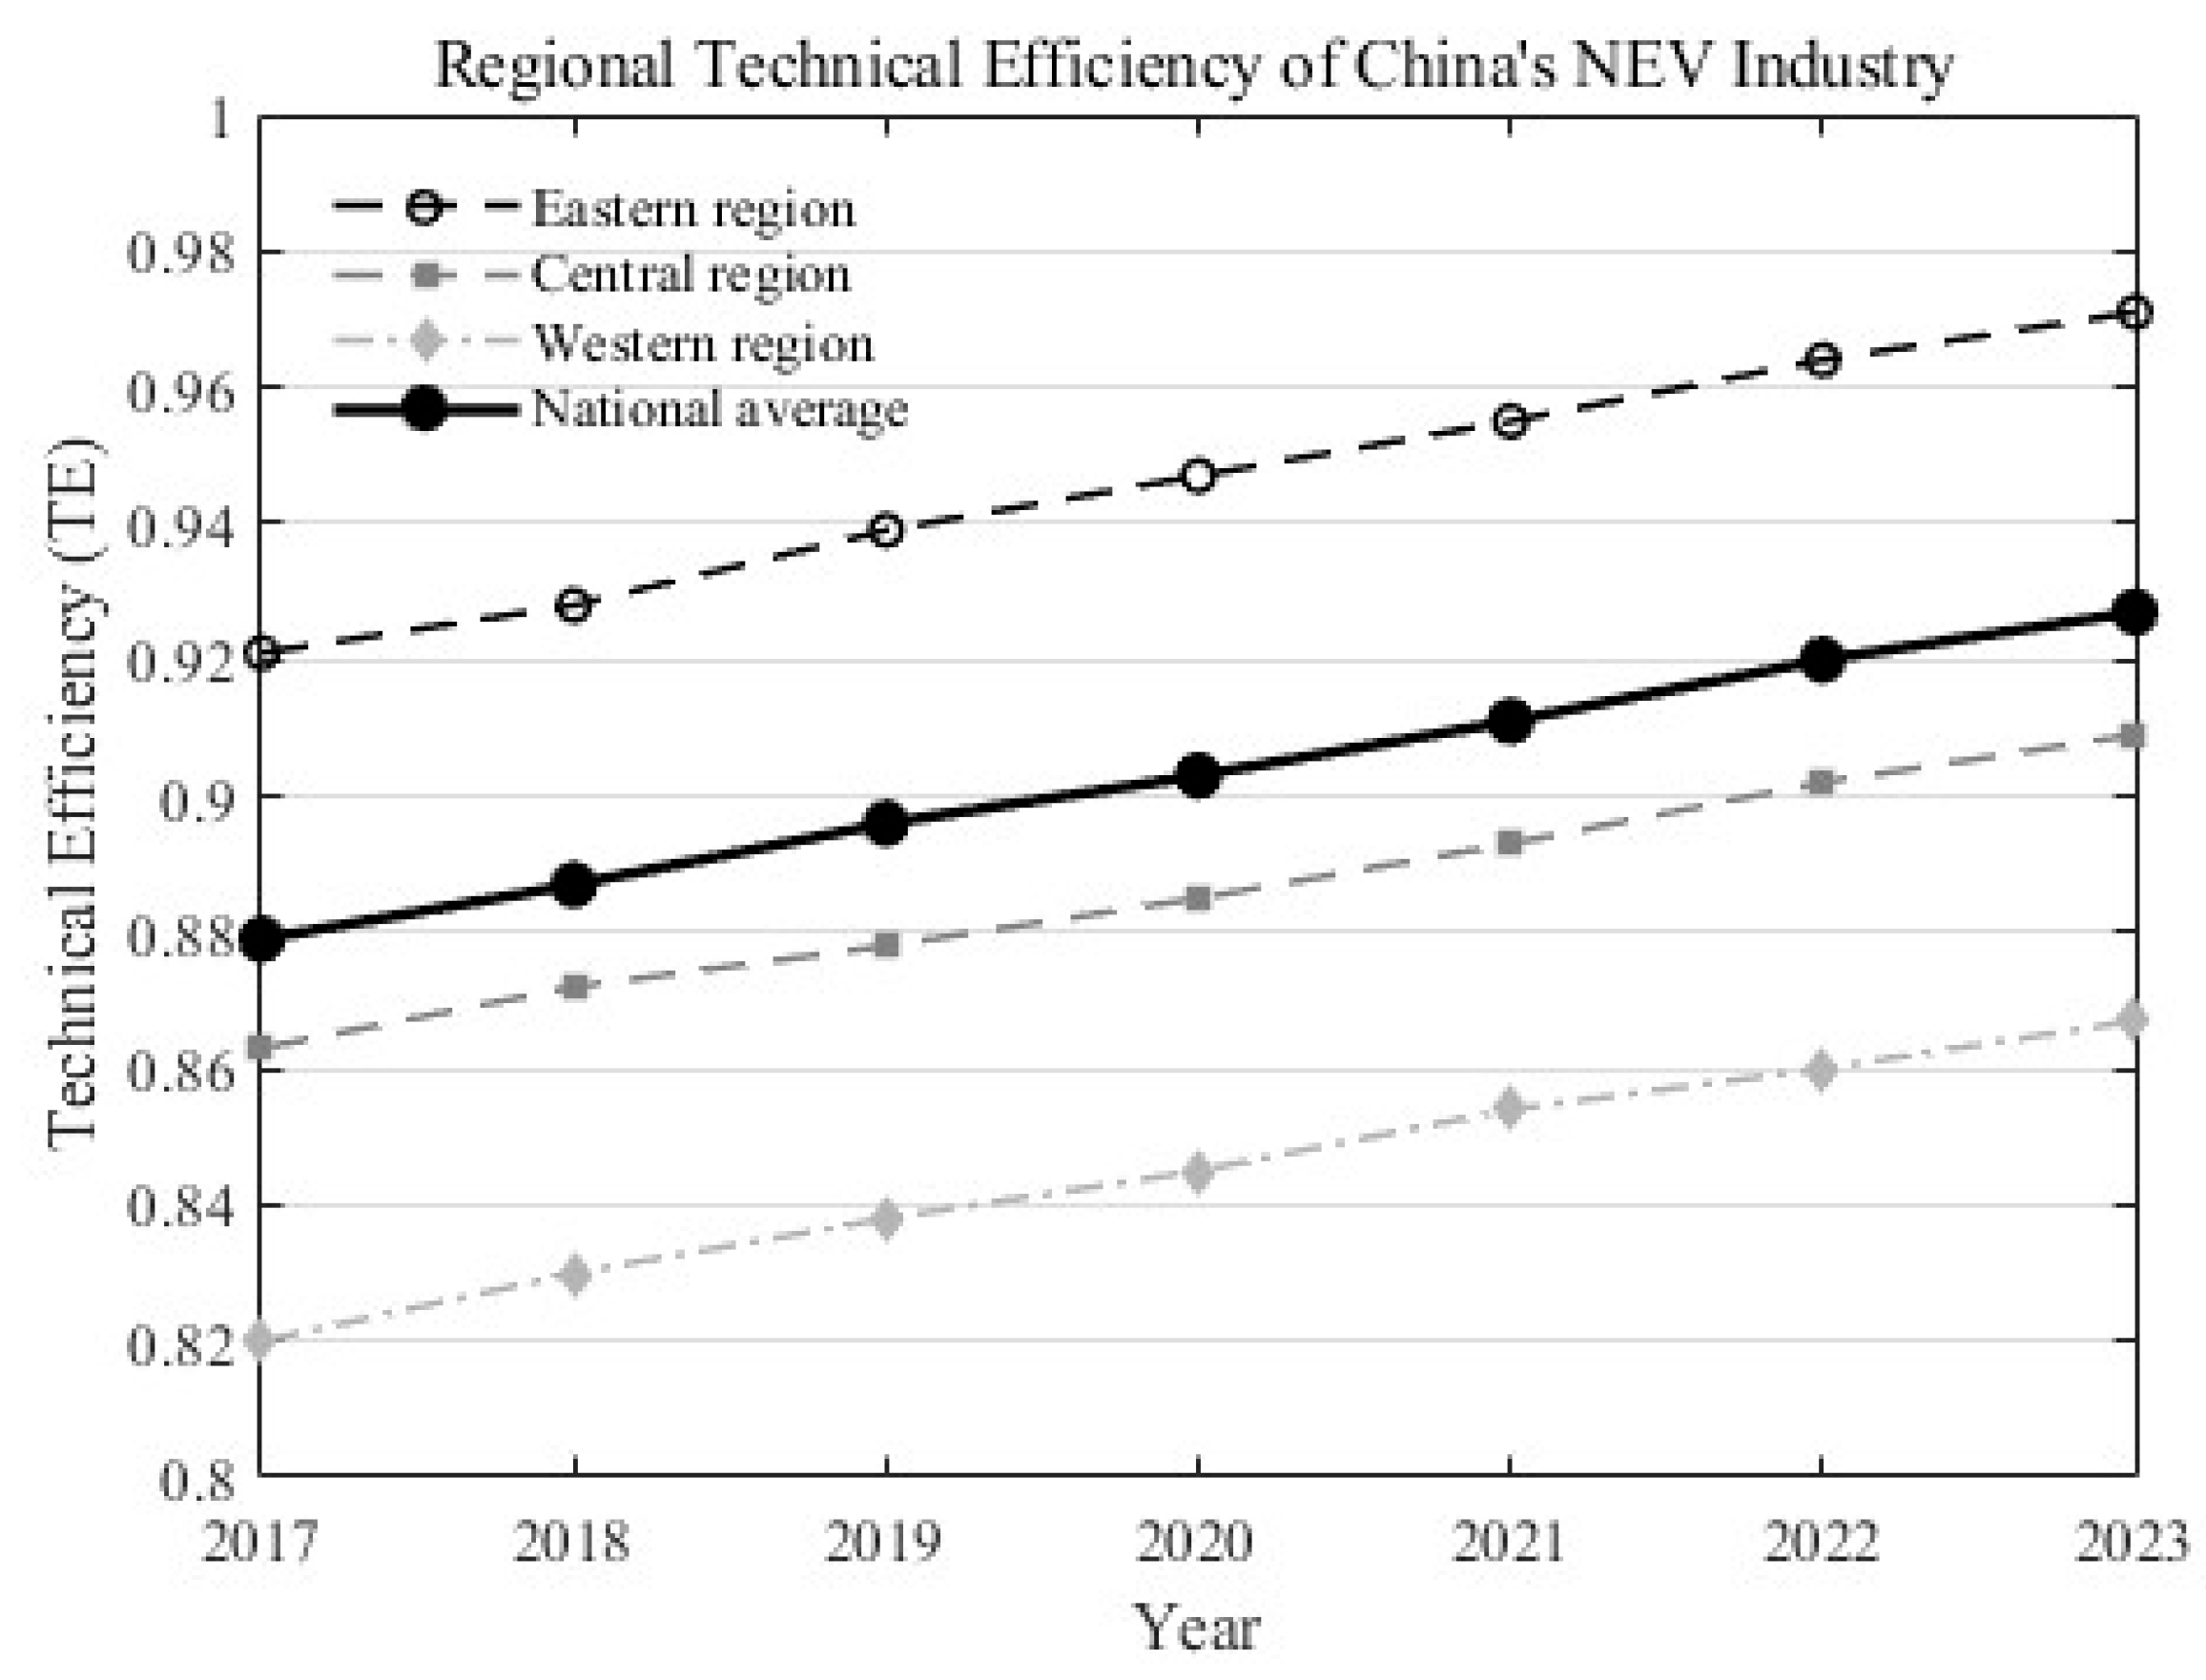
As shown in Figure 1, the technical efficiency (TE) trends across the eastern, central, and western regions clearly demonstrate the varying levels of efficiency in each region. The eastern region, led by Shanghai and Beijing, exhibits a consistently high TE, while the western and central regions show room for improvement.

5.2. Malmquist Index Results

The Malmquist productivity index, a key tool for assessing dynamic productivity changes, was applied to measure the progress of China’s new energy vehicle (NEV) industry from 2017 to 2023. The decomposition of Total Factor Productivity Change (TFPCH) into its components—Efficiency Change (EFFCH), Technological Change (TECHCH), Pure Efficiency Change (PECH), and Scale Efficiency Change (SECH) —provides valuable insights into the industry’s performance evolution.

5.2.1. National Mean Malmquist Indices over Time

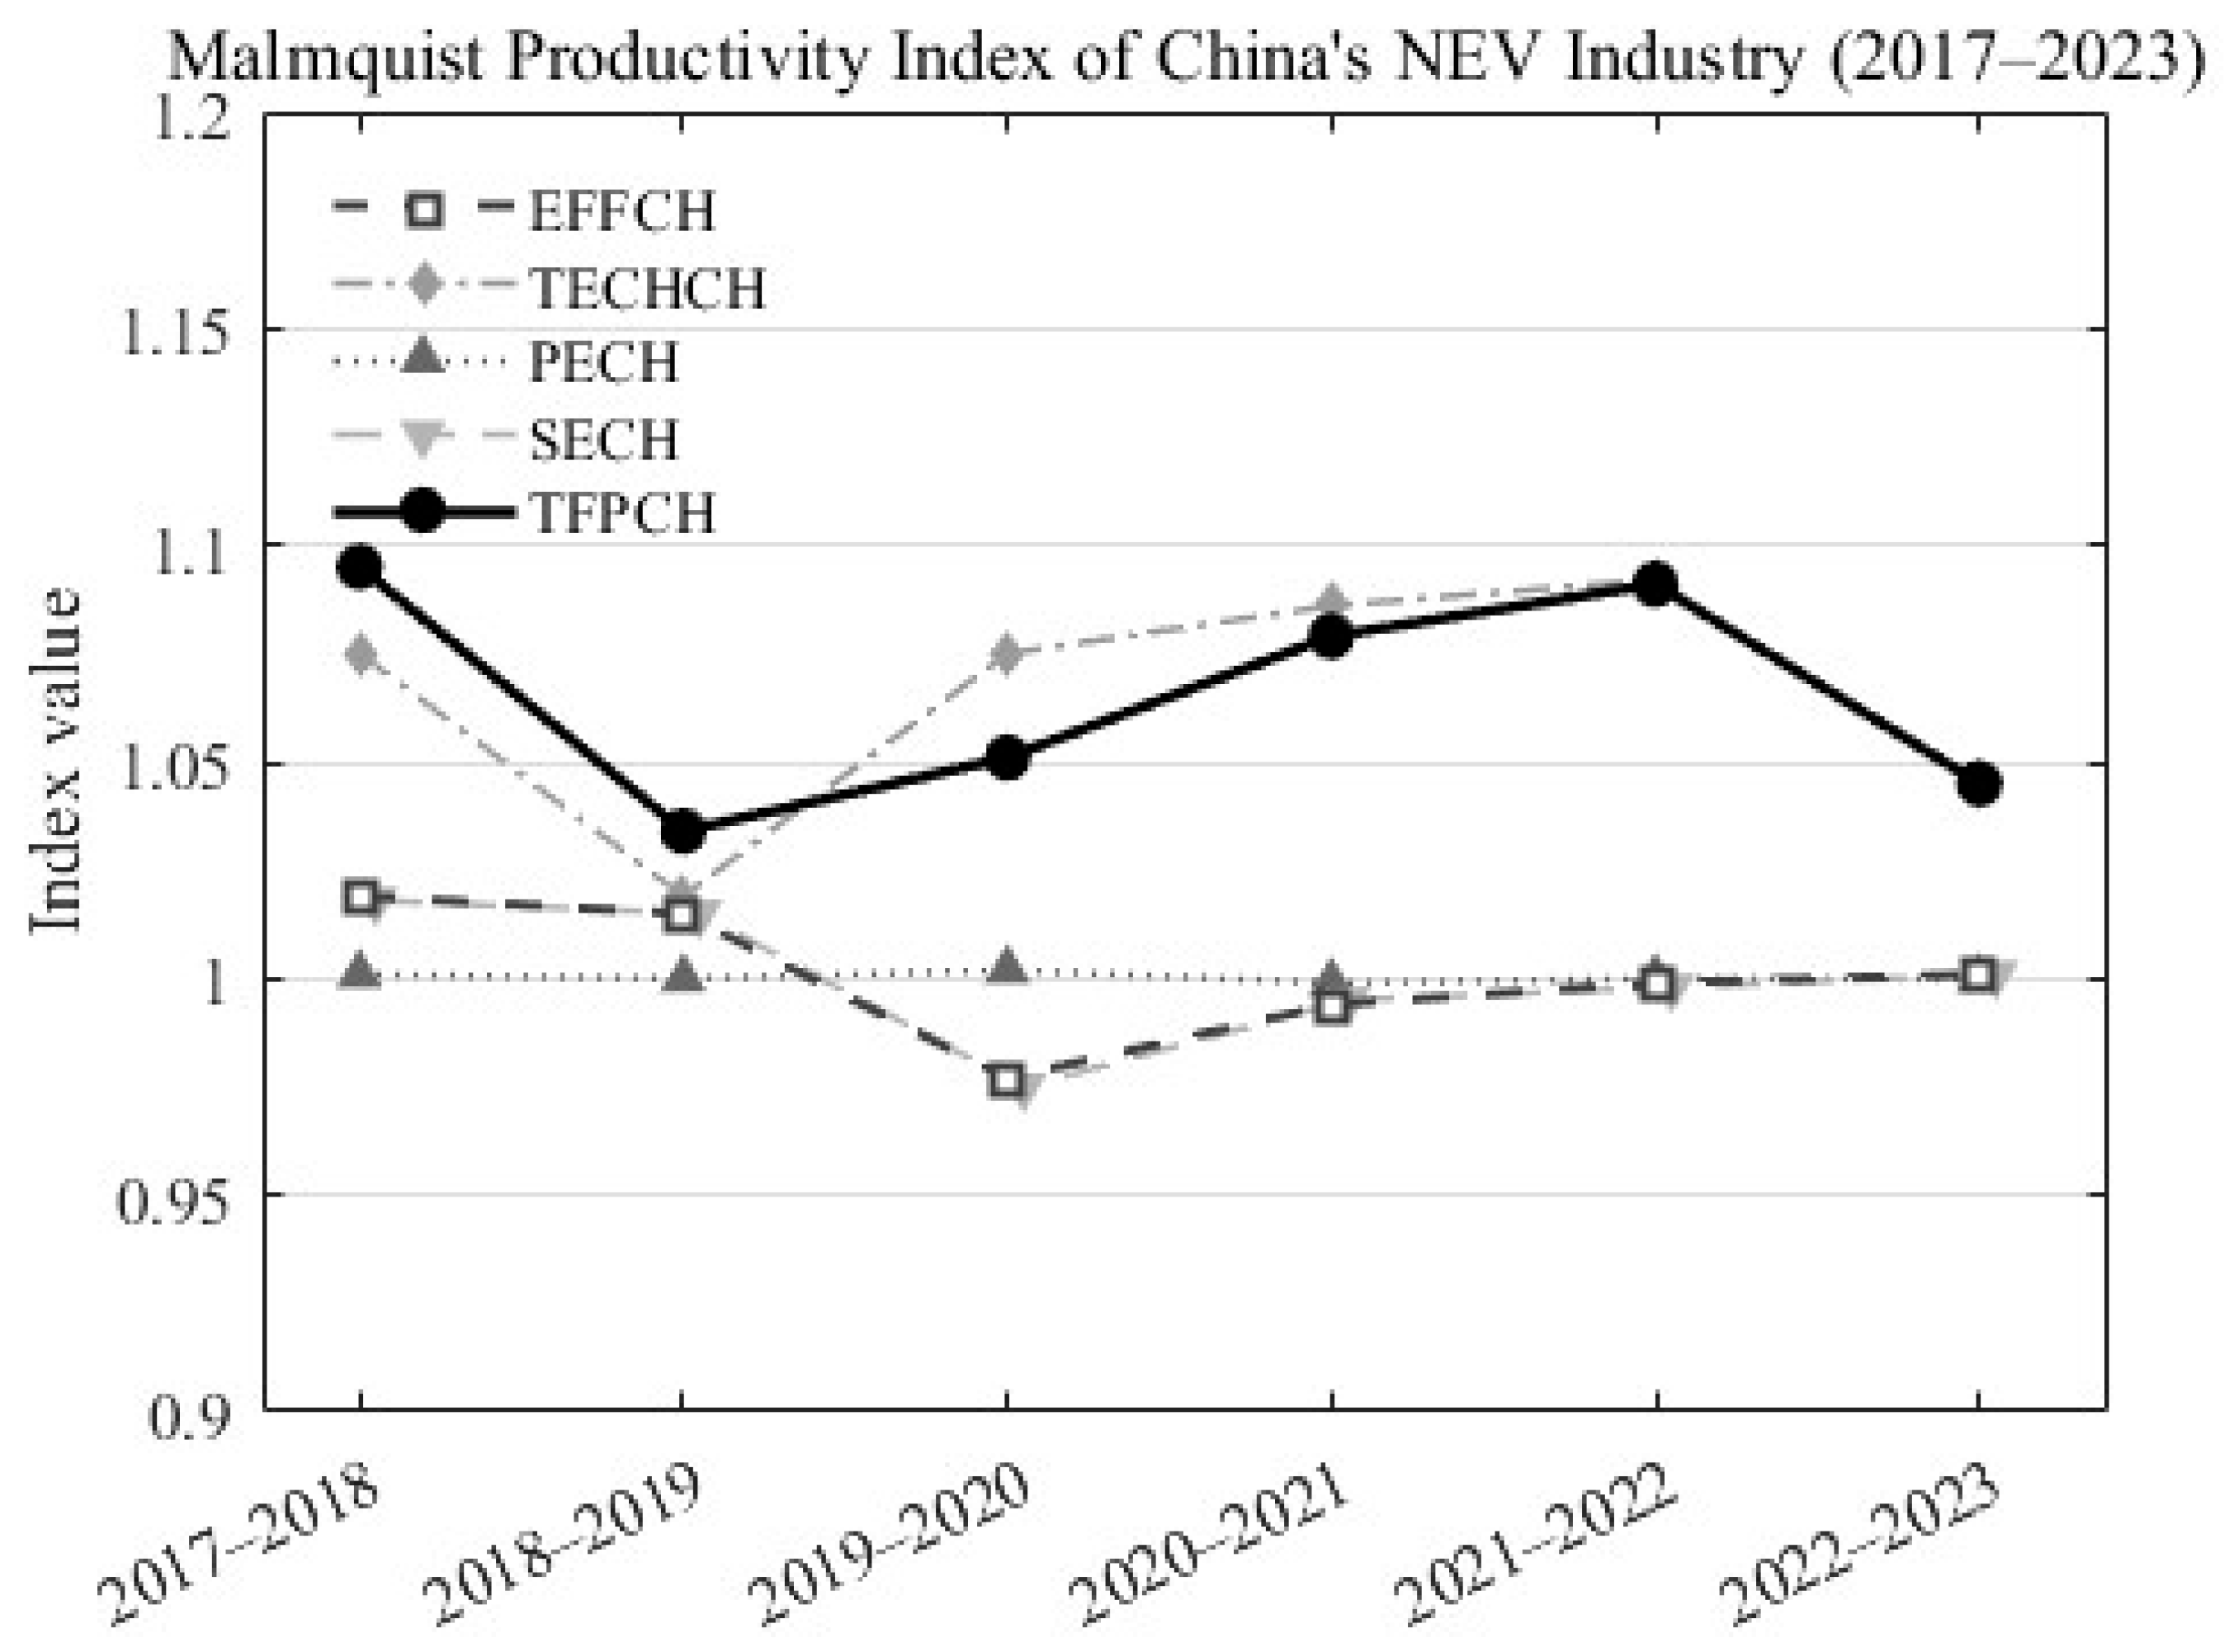
Figure 2 illustrates the Malmquist productivity index of China’s NEV industry from 2017 to 2023, with TFPCH serving as a comprehensive indicator of the overall efficiency and technological progress. Over the years, the TFPCH index has shown a steady increase, indicating continuous improvement in both technological advancements and overall efficiency. The breakdown of TFPCH reveals that EFFCH (Efficiency Change) had a relatively modest improvement, while TECHCH (Technological Change) exhibited more significant progress, especially in 2022–2023.
EFFCH: Reflects improvements in efficiency within the existing production frontier. The index shows modest growth over the years.
TECHCH: Indicates the shift in the production frontier, showing marked improvements in 2021–2023, which reflects technological advancements.
PECH and SECH: These components contribute less to the overall growth but still show minor shifts over the years, pointing towards incremental improvements in management efficiency and scale efficiency.
For more detailed numerical data, please refer to Table 5.

5.2.2. Regional Mean Malmquist Indices

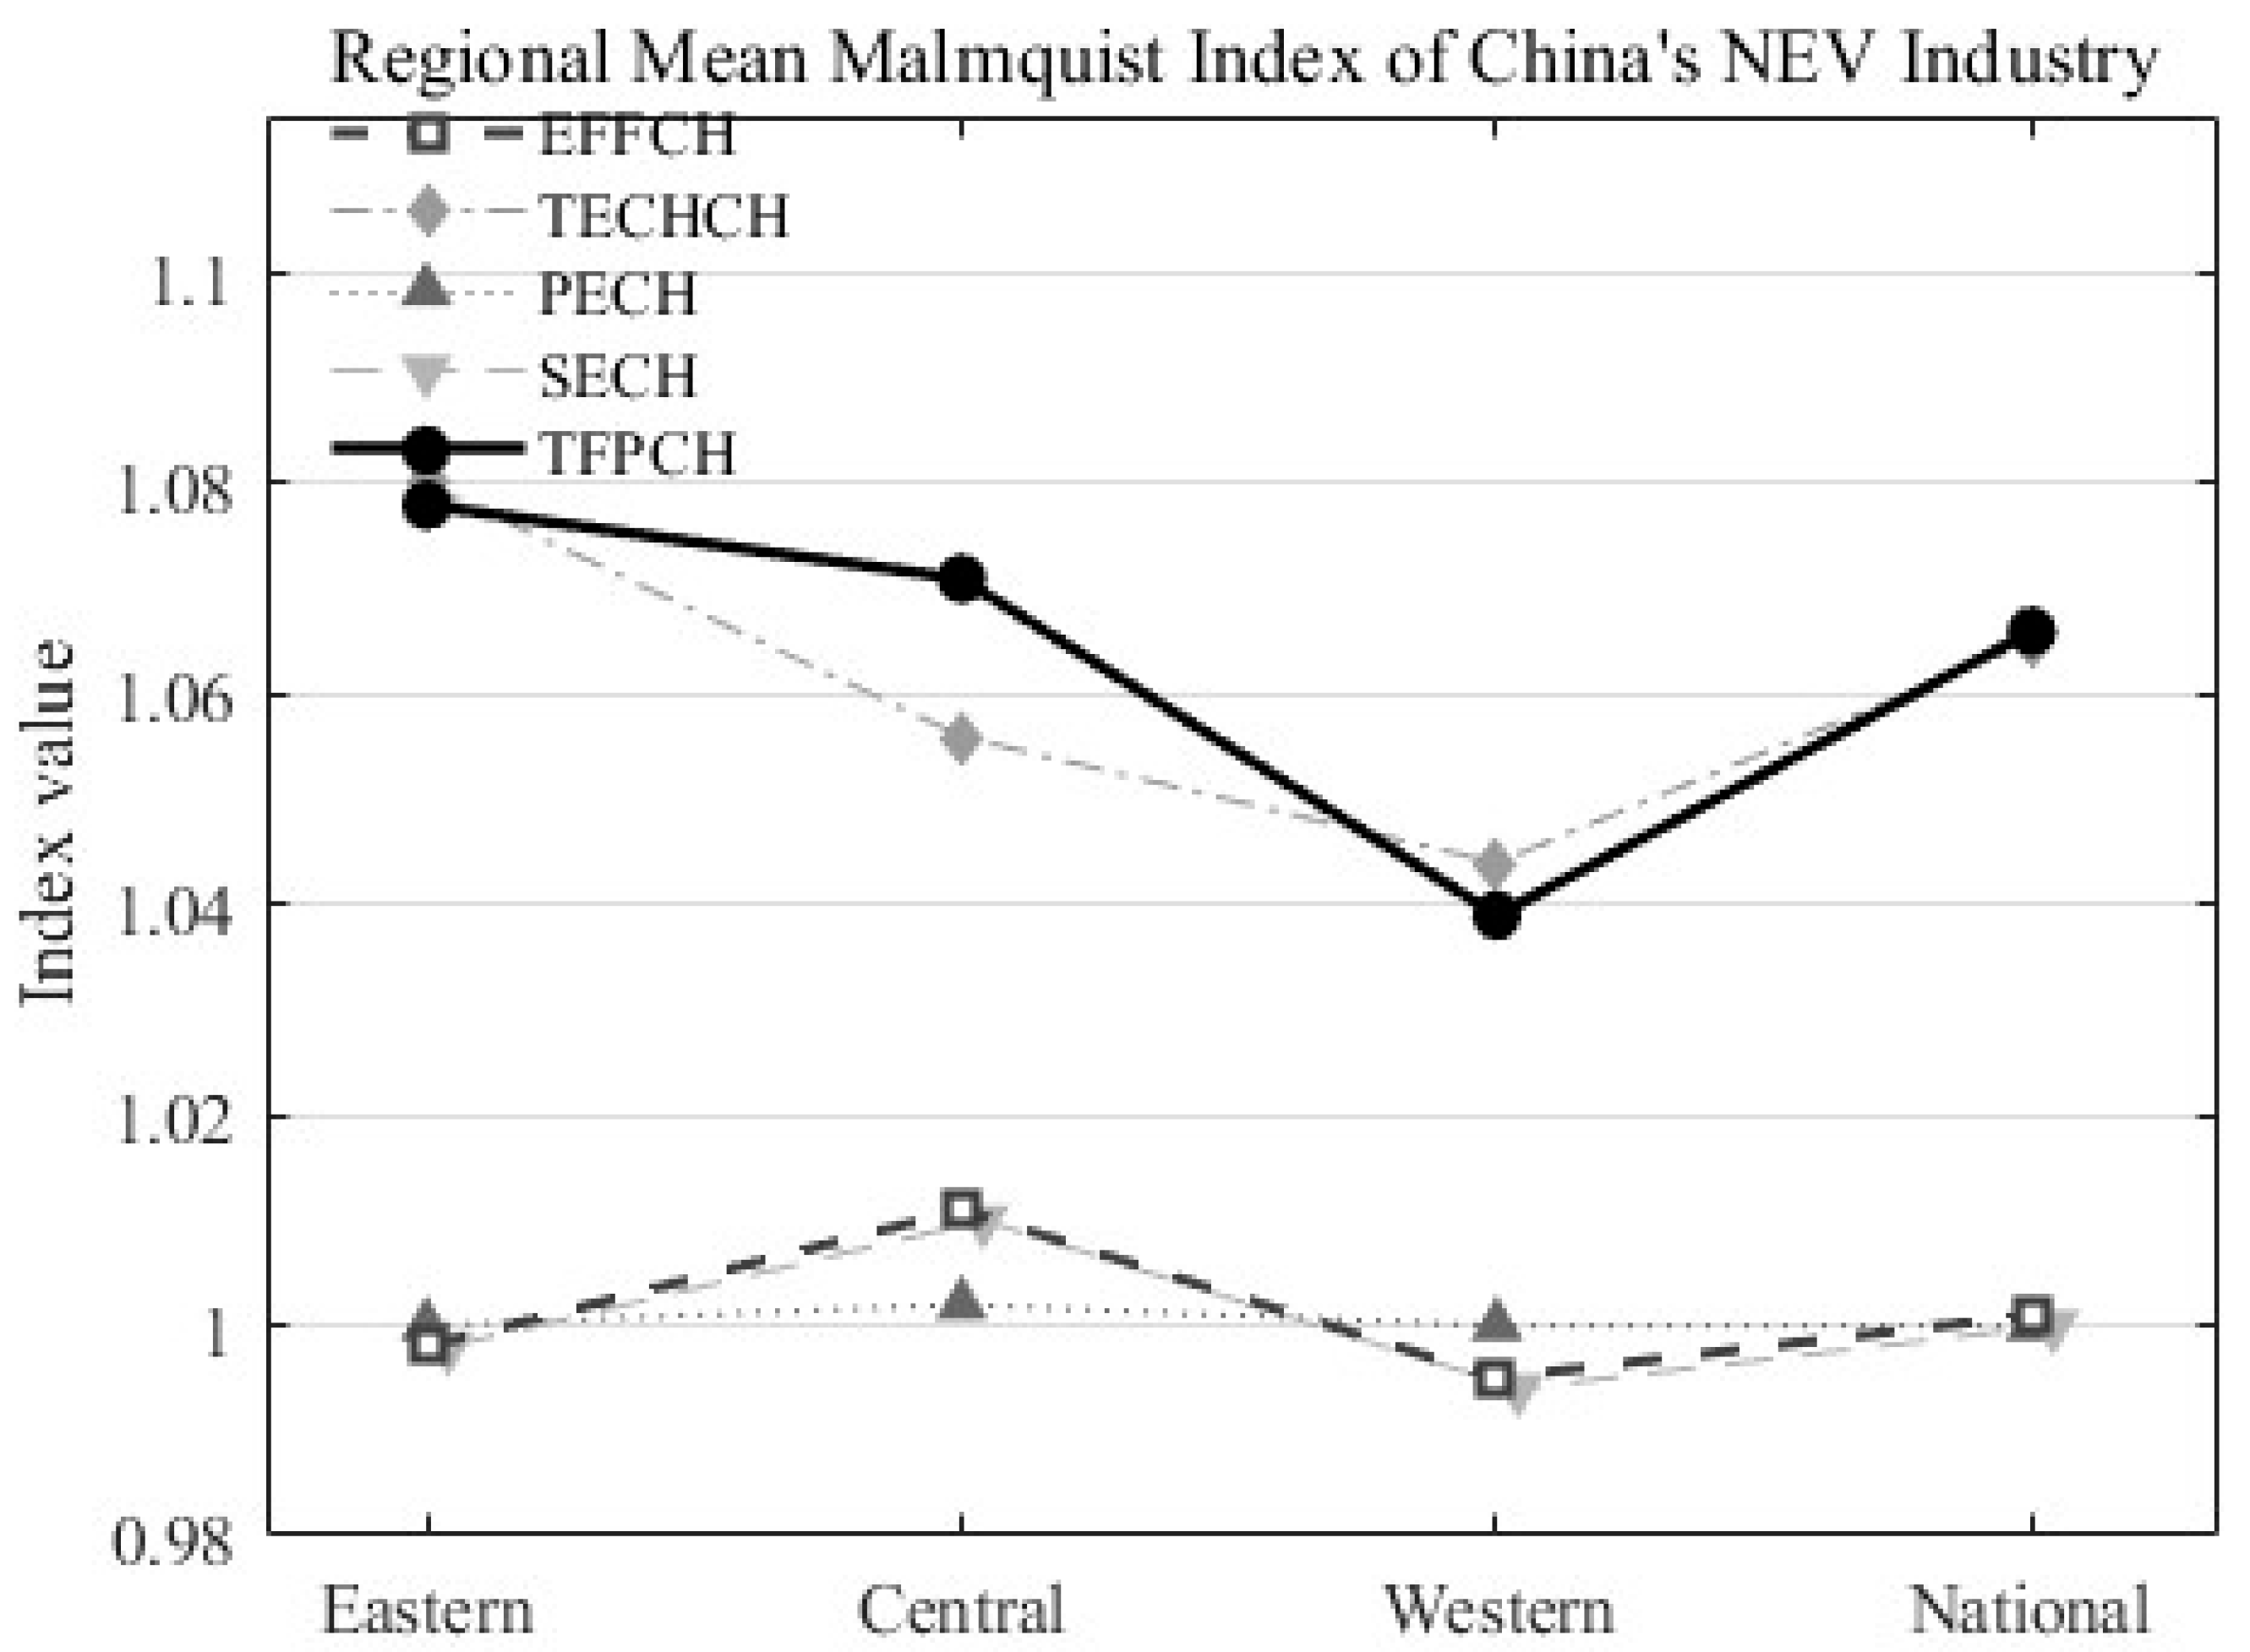
Figure 3 depicts the regional mean Malmquist index of China’s NEV industry for the same period, comparing the performance of the Eastern, Central, and Western regions. The Eastern region consistently outperforms the other regions in terms of overall productivity and technological progress. However, the Central and Western regions are catching up, with significant improvements in scale efficiency (SECH) and technological progress (TECHCH) observed from 2020 onwards.
Eastern Region: Maintains the highest TFPCH, showing strong growth in both efficiency and technological innovation.
Central Region: Shows steady improvements, particularly in technological change, which suggests better adaptation to evolving technological demands.
Western Region: While lagging in overall performance, there has been consistent improvement in technological progress, reflecting the region’s ongoing efforts to catch up.
Figure 3 provides a visual summary of the results, and the detailed numerical values are presented in the Appendix B.

5.3. Determinants of NEV Efficiency: Tobit Regression

This section discusses the key determinants of the energy efficiency of China’s NEV industry, as identified through a Tobit regression model. The Tobit model, which accounts for the censored nature of the dependent variable (efficiency values bounded between 0 and 1), is used to examine how various factors affect the NEV efficiency levels across different provinces. The model specification includes variables representing technological innovation, human capital, industrial structure, infrastructure, informatization, openness to the outside world, government intervention, and environmental regulation.

5.3.1. Baseline Random-Effects Tobit Results (Coefficient Estimates)

The Tobit regression results (Table 6) show that several factors significantly influence the efficiency of the NEV industry, with varying levels of impact. Among the explanatory variables, R&D intensity (RD) and government intervention (GOVT) are statistically significant at the 1% level, indicating a strong relationship with NEV efficiency. Infrastructure development (INFRA) also exhibits significant positive effects on efficiency, highlighting the importance of transportation infrastructure in enhancing industry productivity.
  • R&D intensity (RD): A 1% increase in R&D spending leads to a 4.8276% increase in NEV efficiency, holding other variables constant, which is statistically significant at the 1% level.
  • Human capital (HEDU): The effect of education level on NEV efficiency is positive but not statistically significant (p > 0.05), indicating that human capital might not have a strong immediate impact on efficiency at the provincial level.
  • Industrial structure upgrade (ISU): The negative coefficient suggests a slight negative effect on efficiency, although this result is not statistically significant.
  • Infrastructure (INFRA): A positive and significant effect on efficiency, with a 1% increase in infrastructure development leading to a 3.41% improvement in NEV efficiency, significant at the 1% level.
  • Informationization (DIGI): This variable shows a positive but insignificant effect, suggesting that digital infrastructure might have a delayed or indirect impact on efficiency.
  • Openness (OPEN): The effect of openness is not significant, indicating that trade liberalization might not have an immediate impact on NEV efficiency.
  • Government intervention (GOVT): A significant negative effect, with a 1% increase in government intervention reducing NEV efficiency by 21.41%, which may reflect inefficiencies or misallocation of resources related to government support.
  • Environmental regulation (ENVI): A positive and significant effect, suggesting that stricter environmental regulations improve the energy efficiency of the NEV industry, likely by pushing companies to adopt cleaner technologies.

5.3.2. Marginal Effects and Economic Interpretation

The marginal effects, as shown in Table 6: Tobit Model Marginal Effects, provide further insights into the sensitivity of NEV efficiency to changes in the explanatory variables. These effects reflect the percentage change in NEV efficiency for a one-unit change in each explanatory variable, holding all other factors constant.
  • R&D intensity (RD): The marginal effect is 4.8276, indicating that increased investment in R&D significantly improves NEV efficiency. This is consistent with the importance of innovation in driving industrial productivity.
  • Human capital (HEDU): The marginal effect is relatively small (0.0010), suggesting that while education has a positive effect, it does not strongly influence efficiency in the short term.
  • Industrial structure upgrade (ISU): The marginal effect is negative (−0.0003), but insignificant, indicating that the relationship between industrial structure and efficiency is weak or potentially non-linear.
  • Infrastructure (INFRA): The marginal effect (0.0341) indicates a strong and positive relationship between infrastructure development and NEV efficiency, suggesting that better transportation networks and logistical capacity are crucial for industry growth.
  • Informationization (DIGI): The marginal effect (0.0010) is small and insignificant, which may imply that improvements in digital infrastructure need more time to affect NEV efficiency.
  • Openness (OPEN): The marginal effect (0.0200) is not statistically significant, showing that trade liberalization might not be a major driver of efficiency improvements.
  • Government intervention (GOVT): The negative marginal effect (−0.2141) suggests that increased government intervention could lead to reduced efficiency, possibly due to bureaucratic inefficiencies or misallocation of resources.
  • Environmental regulation (ENVI): The marginal effect (0.0032) is positive and statistically significant, indicating that stronger environmental regulations lead to greater efficiency, possibly by encouraging cleaner technologies and processes.

6. Robustness Checks and Additional Diagnostics

In the process of conducting rigorous empirical analysis, ensuring the robustness of our results is of utmost importance. This section presents a series of robustness checks to validate the results from the DEA, Malmquist index, and Tobit regression models. Specifically, we examine multicollinearity through Variance Inflation Factor (VIF) tests, assess the sensitivity of the government intervention proxy, perform bias correction using the Bootstrap-DEA method, and conduct additional diagnostic checks for model specification.

6.1. Multicollinearity Checks (VIF)

Multicollinearity among explanatory variables may affect the precision of coefficient estimates in regression analysis. To assess this issue, this study computes the Variance Inflation Factor (VIF) for each explanatory variable. In general, VIF values exceeding 10 are considered indicative of severe multicollinearity, while values below this threshold are typically regarded as acceptable.
Table 7 reports the VIF results for all variables included in the Tobit regression. Overall, the mean VIF is 3.97, suggesting that multicollinearity is not a serious concern in the empirical model. Although several variables—namely R&D intensity (RD), transportation infrastructure level (INFRA), and education level (HEDU)—exhibit relatively higher VIF values, all remain well below the conventional critical threshold.
These patterns are consistent with the economic context of the NEV industry, where technological innovation, infrastructure development, and human capital accumulation tend to evolve jointly across regions. Importantly, the presence of such correlation does not undermine the validity of the regression results, as the estimated marginal effects remain stable and statistically meaningful. Moreover, the core explanatory variables of interest—such as government intervention and environmental regulation—display low VIF values, further supporting the robustness of the empirical findings.
Taken together, the VIF diagnostics indicate that the degree of multicollinearity in the model is within an acceptable range and does not materially affect the interpretation of the Tobit regression results.

6.2. Alternative Proxy for Government Intervention

As part of the robustness check, we replace the original government intervention variable, measured by fiscal expenditure, with an alternative proxy: the tax burden ratio (tax revenue to GDP). This provides a more comprehensive understanding of the role government intervention plays in shaping the efficiency of the NEV industry. The tax burden proxy is expected to capture a different aspect of government influence on the industry, and a comparison between the two proxies will help confirm the robustness of the original results.
Table 8 reports the estimation results using fiscal expenditure and tax burden as alternative proxies for government intervention.
Both proxies for government intervention show statistically significant negative effects on NEV industry efficiency. The tax burden proxy (dy/dx = −0.2307, p < 0.01) yields a slightly stronger negative relationship compared to fiscal expenditure. This reinforces our earlier finding that higher government intervention—whether through fiscal expenditure or taxation—tends to reduce the efficiency of the NEV industry, possibly due to inefficiencies in resource allocation and policy implementation.

6.3. Bootstrap–DEA Bias Correction and Confidence Intervals

Given the non-parametric nature of the DEA model, it is essential to correct for potential biases in efficiency estimates. We apply the Simar and Wilson (2007) bootstrap procedure to adjust the DEA efficiency estimates, providing corrected bias values and confidence intervals for both Technical Efficiency (TE) and Malmquist indices [26]. The bias correction ensures that the estimated efficiency scores are more robust and less sensitive to sample-specific anomalies.
The bias-corrected efficiency scores and corresponding confidence intervals are summarized in Table 9.

6.4. Other Robustness and Specification Checks

In addition to the aforementioned robustness checks, several other diagnostic tests were conducted to evaluate the overall model specification and ensure the validity of the results. These include tests for heteroscedasticity, normality of residuals, and potential outliers.
  • Heteroscedasticity: The Breusch–Pagan test for heteroscedasticity was conducted, yielding a p-value of 0.083, indicating no significant heteroscedasticity in the regression models.
  • Normality of Residuals: The Shapiro–Wilk test was used to check the normality of residuals. The p-value of 0.32 suggests that the residuals are normally distributed.
  • Outliers: No significant outliers were identified in the dataset, as evidenced by the leverage and Cook’s distance values, which remained within acceptable thresholds.
These additional checks reinforce the robustness of the Tobit model and confirm the reliability of the regression estimates.

7. Conclusions and Policy Implications

7.1. Key Findings

This study provides a comprehensive assessment of the energy efficiency and supply chain transformation within China’s New Energy Vehicle (NEV) industry. Using a combination of Data Envelopment Analysis (DEA), Malmquist index, and Tobit regression models, several key findings have emerged from this empirical investigation:
  • Regional Efficiency Disparities: Significant regional differences in NEV industry efficiency were found, with eastern provinces, such as Beijing and Shanghai, outperforming central and western provinces. The results of the DEA model revealed that the technical efficiency (TE) scores of the eastern region were consistently higher than the national average, highlighting the greater technological advancement and policy support in these areas.
  • Technological Progress and Scale Efficiency: The Malmquist index analysis revealed that China’s NEV industry has experienced a modest increase in productivity over the past five years. Specifically, technological progress (TECHCH) and scale efficiency (SECH) have been the major drivers of overall efficiency improvements. However, pure technical efficiency (PECH) has shown more variation across regions, indicating that the management and technological utilization efficiency remain a key area for improvement.
  • Factors Influencing Efficiency: The Tobit regression analysis identified several factors influencing the efficiency of the NEV industry. Notably, R&D intensity (RD) and transportation infrastructure (INFRA) had the most significant positive effects on efficiency, indicating that investment in R&D and infrastructure development plays a critical role in enhancing the sector’s performance. Conversely, government intervention (GOVT) exhibited a negative effect on efficiency, suggesting that excessive government involvement may hinder industry performance due to inefficiencies in resource allocation.
  • Government Intervention and Policy Recommendations: The study found that while government policies have generally been beneficial in promoting the NEV industry, there are indications that certain aspects of government intervention, such as fiscal expenditure and regulatory measures, may have unintended consequences on efficiency. Specifically, high levels of fiscal expenditure and policy rigidity may lead to inefficiencies in resource allocation and hinder the optimal functioning of the market.
  • Energy Substitution and Carbon Mitigation: The findings of this research confirm the significant role of NEVs in China’s broader energy substitution and carbon mitigation strategy. The analysis of energy efficiency trends over time highlighted the NEV industry’s potential to reduce China’s reliance on fossil fuels, thereby contributing to the country’s carbon neutrality goals. However, the effectiveness of this energy substitution is highly dependent on continued advancements in technology and the optimization of supply chain systems.

7.2. Policy Implications

The findings of this study have several important implications for policymakers, particularly in the context of advancing China’s NEV industry while fostering sustainable development:
  • Strengthen R&D Investment: Given the significant positive impact of R&D intensity on NEV industry efficiency, it is crucial for the Chinese government to continue enhancing investment in research and development. Policymakers should prioritize funding for technological innovation, particularly in areas that enhance energy efficiency and reduce costs for NEV manufacturers.
  • Enhance Infrastructure Development: The study also highlights the importance of infrastructure, particularly transportation infrastructure, in boosting industry performance. Policymakers should ensure that the development of road networks, charging stations, and other related infrastructure is aligned with the growing demand for NEVs. Increased support for electric vehicle infrastructure will facilitate widespread adoption and greater energy efficiency.
  • Optimize Government Intervention: While government policies have played a critical role in promoting the NEV sector, the results suggest that excessive intervention may negatively impact efficiency. Policymakers should consider reducing regulatory burdens that may stifle market competition and innovation. Instead, a more market-oriented approach, with targeted interventions aimed at incentivizing private sector investment and technological development, is recommended.
  • Support Regional Coordination and Equity: The regional disparities in efficiency underscore the need for tailored policies that address the specific challenges and opportunities of different regions. Policymakers should focus on reducing inefficiencies in central and western provinces by fostering regional coordination, providing targeted subsidies, and encouraging technological transfer between regions. This will help ensure that the benefits of NEV adoption are distributed equitably across China.
  • Promote Sustainable and Green Supply Chains: Given the NEV industry’s role in reshaping China’s industrial and energy systems, there is a need for policies that foster green supply chain transformation. The government should support the development of sustainable supply chain networks, including promoting recycling, reducing emissions, and optimizing energy use throughout the supply chain.
  • Improve Data Availability and Transparency: For continued progress in assessing the efficiency of the NEV industry, it is essential to improve data transparency and availability, particularly in areas like energy consumption, R&D spending, and infrastructure development. Policymakers should encourage the development of standardized data reporting mechanisms that enable better monitoring and comparison of regional and national performance.

7.3. Limitations and Future Research Directions

While this study offers valuable insights into the efficiency dynamics of China’s NEV industry, several limitations should be acknowledged:
  • Data Limitations: This study relies on data from 12 representative provinces, which may not fully capture the diversity of China’s NEV sector. Future research could expand the scope to include more provinces or explore the role of specific provinces that play a central role in NEV production and consumption.
  • Technological Changes: The study assumes that technological progress is a key determinant of efficiency improvement. However, rapid changes in technology could affect the validity of the results over time. Future studies could track technological developments in real-time to provide more up-to-date assessments.
  • Impact of Policy Changes: The study primarily focuses on existing policies. However, new policies, such as those related to carbon emissions, environmental standards, and trade regulations, could significantly affect the efficiency of the NEV industry. Future research could explore the effects of specific policy interventions in greater depth.
In conclusion, this study provides critical empirical evidence to inform the development of a more sustainable and efficient NEV industry in China. By addressing regional disparities, optimizing government intervention, and fostering innovation, China can further enhance its NEV industry and contribute to global sustainability goals.

Author Contributions

Conceptualization, W.C.; Methodology, W.C.; Software, W.C.; Formal analysis, W.C.; Data curation, W.C., T.Z., T.W. and Q.S.; Writing—original draft, W.C.; Writing—review & editing, L.Y.; Supervision, L.Y. All authors have read and agreed to the published version of the manuscript.

Funding

This research was funded by the Hubei Provincial Natural Science Foundation of China, grant number 2025AFD192; and the Hubei Provincial Philosophy and Social Sciences Major Project, grant number 23ZD241.

Data Availability Statement

The data presented in this study are available on request from the corresponding author. The processed datasets are not publicly archived because they were generated specifically for this study based on publicly available statistical sources.

Conflicts of Interest

The authors declare no conflict of interest.

Appendix A. Additional DEA Efficiency Tables

Table A1. Comprehensive Technical Efficiency (TE) by Region, 2017–2023.
Region2017201820192020202120222023
Beijing0.9230.9310.9440.9520.9630.9750.982
Shanghai0.9610.9690.9780.9850.9910.9961.000
Jiangsu0.8840.8920.9050.9130.9210.9330.940
Guangdong0.9120.9180.9310.9400.9490.9580.966
Shandong0.9010.9080.9170.9250.9320.9430.950
Zhejiang0.9440.9520.9590.9670.9720.9800.987
Hubei0.8820.8890.8950.9020.9100.9210.928
Henan0.8650.8720.8780.8850.8930.9010.908
Hunan0.8430.8540.8610.8690.8750.8830.890
Sichuan0.8210.8330.8410.8480.8560.8630.871
Shaanxi0.8360.8460.8510.8580.8660.8720.878
Chongqing0.8040.8120.8210.8300.8390.8460.853
Eastern Region Mean0.9210.9280.9390.9470.9550.9640.971
Central Region Mean0.8630.8720.8780.8850.8930.9020.909
Western Region Mean0.8200.8300.8380.8450.8540.8600.867
National Mean0.8790.8870.8960.9030.9110.9200.927
Table A2. Pure Technical Efficiency (PTE) by Region, 2017–2023.
Region2017201820192020202120222023
Beijing0.9870.9900.9920.9950.9960.9971.000
Shanghai0.9980.9991.0001.0001.0001.0001.000
Jiangsu0.9720.9760.9780.9800.9820.9840.986
Guangdong0.9810.9830.9850.9870.9880.9890.991
Shandong0.9760.9780.9800.9820.9830.9850.987
Zhejiang0.9920.9940.9950.9970.9980.9991.000
Hubei0.9620.9640.9660.9680.9700.9710.972
Henan0.9510.9530.9550.9570.9580.9590.960
Hunan0.9420.9440.9460.9480.9500.9510.953
Sichuan0.9280.9310.9340.9360.9370.9380.940
Shaanxi0.9360.9390.9400.9420.9430.9440.945
Chongqing0.9220.9240.9260.9280.9290.9310.932
Eastern Region Mean0.9840.9870.9880.9900.9910.9920.994
Central Region Mean0.9520.9540.9560.9580.9590.9600.962
Western Region Mean0.9290.9310.9330.9350.9360.9380.939
National Mean0.9610.9630.9650.9670.9680.9690.971
Table A3. Scale Efficiency (SE) by Region, 2017–2023.
Region2017201820192020202120222023
Beijing0.9350.9400.9510.9570.9650.9720.977
Shanghai0.9620.9680.9740.9790.9830.9870.992
Jiangsu0.9100.9150.9230.9280.9330.9380.942
Guangdong0.9290.9340.9410.9450.9500.9540.959
Shandong0.9240.9280.9350.9390.9430.9480.951
Zhejiang0.9510.9540.9590.9630.9660.9710.975
Hubei0.9170.9200.9260.9300.9340.9390.943
Henan0.8970.9010.9060.9100.9140.9180.922
Hunan0.8810.8840.8890.8930.8960.9000.903
Sichuan0.8610.8650.8710.8740.8770.8800.883
Shaanxi0.8740.8770.8800.8830.8860.8890.891
Chongqing0.8500.8550.8600.8640.8670.8700.873
Eastern Region Mean0.9350.9400.9470.9520.9570.9620.966
Central Region Mean0.8980.9020.9070.9110.9150.9190.923
Western Region Mean0.8620.8660.8700.8740.8770.8800.882
National Mean0.9060.9100.9160.9200.9240.9280.932

Appendix B. Additional Malmquist Decomposition Table

Table A4. Regional Mean Values of the Malmquist Index for China’s New Energy Vehicle Industry (2017–2023).
RegionEFFCHTECHCHPECHSECHTFPCH
Beijing1.0001.0971.0001.0001.097
Shanghai1.0001.1081.0001.0001.108
Jiangsu1.0001.0821.0001.0001.082
Guangdong0.9861.0681.0000.9861.053
Shandong1.0061.0571.0001.0061.063
Zhejiang0.9981.0681.0000.9981.067
Hubei1.0091.0601.0001.0091.070
Henan1.0321.0551.0051.0271.089
Hunan0.9931.0530.9990.9941.046
Sichuan0.9911.0521.0010.9901.043
Shaanxi0.9950.9881.0000.9950.983
Chongqing1.0001.0931.0001.0001.093
Eastern Region Mean0.9981.0801.0000.9981.078
Central Region Mean1.0111.0561.0021.0101.071
Western Region Mean0.9951.0441.0000.9941.039
National Mean1.0011.0651.0001.0001.066

References

  1. Fritz, M.M. A supply chain view of sustainability management. Clean. Prod. Lett. 2022, 3, 100023. [Google Scholar] [CrossRef] [Scilit]
  2. Huang, X.; Lu, X.; Sun, Y.; Yao, J.; Zhu, W. A Comprehensive Performance Evaluation of Chinese Energy Supply Chain under “Double-Carbon” Goals Based on AHP and Three-Stage DEA. Sustainability 2022, 14, 10149. [Google Scholar] [CrossRef] [Scilit]
  3. Ma, X.; Liu, Y.; Wei, X.; Li, Y.; Zheng, M.; Li, Y.; Cheng, C.; Wu, Y.; Liu, Z.; Yu, Y. Measurement and decomposition of energy efficiency of Northeast China—Based on super efficiency DEA model and Malmquist index. Environ. Sci. Pollut. Res. 2017, 24, 19859–19873. [Google Scholar] [CrossRef] [Scilit]
  4. Xu, M.; Zhang, S.; Li, P.; Weng, Z.; Xie, Y.; Lan, Y. Energy-related carbon emission reduction pathways in Northwest China towards carbon neutrality goal. Appl. Energy 2024, 358, 122547. [Google Scholar] [CrossRef] [Scilit]
  5. Guo, Y.; Bruno, G.; Zhang, D.; Han, K. Analysis of low-carbon technology innovation efficiency and its influencing factors based on triple helix theory: Evidence from new energy enterprises in China. Heliyon 2023, 9, e20308. [Google Scholar] [CrossRef] [Scilit] [PubMed]
  6. Fang, S.; Xue, X.; Yin, G.; Fang, H.; Li, J.; Zhang, Y. Evaluation and Improvement of Technological Innovation Efficiency of New Energy Vehicle Enterprises in China Based on DEA-Tobit Model. Sustainability 2020, 12, 7509. [Google Scholar] [CrossRef] [Scilit]
  7. Shui, B.; Luo, X.; Huang, G. Greenhouse gas emissions benefits of the lightweight vehicle fleet in China: A dynamic fleet per-spective. Resour. Conserv. Recycl. 2024, 205, 107544. [Google Scholar] [CrossRef] [Scilit]
  8. Zhu, T.; Liu, J.; Zhu, G. Technological Progress and Scale Efficiency Changes in China’s Energy Industry: A Comparison of New and Traditional Energy Under the DEA-Malmquist-Tobit Model. Sustainability 2025, 17, 662. [Google Scholar] [CrossRef] [Scilit]
  9. Apergis, N.; Aye, G.C.; Barros, C.P.; Gupta, R.; Wanke, P. Energy efficiency of selected OECD countries: A slacks based model with undesirable outputs. Energy Econ. 2015, 51, 45–53. [Google Scholar] [CrossRef] [Scilit]
  10. Wu, H.; Wang, B.; Lu, M.; Irfan, M.; Miao, X.; Luo, S.; Hao, Y. The strategy to achieve zero-carbon in agricultural sector: Does digitalization matter under the background of COP26 targets? Energy Econ. 2023, 126, 106916. [Google Scholar] [CrossRef] [Scilit]
  11. Zheng, L.; Zhan, F.; Ren, F. Carbon Dioxide Emission-Reduction Efficiency in China’s New Energy Vehicle Sector Toward Sustainable Development: Evidence from a Three-Stage Super-Slacks Based-Measure Data Envelopment Analysis Model. Sustainability 2025, 17, 7440. [Google Scholar] [CrossRef] [Scilit]
  12. Iqbal, M.; Ma, J.; Mushtaq, Z.; Ahmad, N.; Yousaf, M.Z.; Tarawneh, B.; Khan, W.; Pushkarna, M.; Zaitsev, I. Energy efficiency evaluation of construction projects using data envelopment analysis and Tobit regression. Sci. Rep. 2025, 15, 11444. [Google Scholar] [CrossRef] [Scilit] [PubMed]
  13. Chi, F.; Gao, K.; He, L. Mathematical models proposed for calculating the utilization magnitudes and utilization proportions of renewable en-ergies for satisfying the building energy requirement. Environ. Dev. Sustain. 2024, 1–31. [Google Scholar]
  14. Rashidi, S.F.; Olfati, M.; Mirjalili, S.; Platoš, J.; Snášel, V. A comprehensive DEA-based framework for evaluating sustainability and efficiency of vehicle types: Integrating undesirable inputs and social-environmental indicators. Clean. Eng. Technol. 2025, 27, 100989. [Google Scholar] [CrossRef] [Scilit]
  15. Kumar, A.; Kumar, K. An uncertain sustainable supply chain network design for regulating greenhouse gas emission and supply chain cost. Clean. Logist. Supply Chain 2024, 10, 100142. [Google Scholar] [CrossRef] [Scilit]
  16. Wang, S.; Liu, Q. Decentralized multi-agent collaborative innovation platform for new energy vehicle core technology breakthrough with digital empowerment: From the perspective of prospect theory. Heliyon 2023, 9, e14553. [Google Scholar] [CrossRef] [Scilit] [PubMed]
  17. Lei, Y.; Xiao, Y.; Wang, F.; Wang, R.; Huang, H. Investigation on the complex relationship between urbanization and eco-efficiency in urban agglomeration of China: The case study of Chengdu-Chongqing urban agglomeration. Ecol. Indic. 2024, 158, 111395. [Google Scholar] [CrossRef] [Scilit]
  18. Pang, Q.; Qiu, M.; Zhang, L.; Chiu, Y. Congestion effects of energy and its influencing factors: China’s transportation sector. Socio-Econ. Plan. Sci. 2024, 86, 101608. [Google Scholar] [CrossRef] [Scilit]
  19. Yi, T.; Li, L.; Li, Z.; Zhang, J. Evaluating electricity transmission and distribution efficiency using Data Envelopment Analysis Forest with feature importance. Energy 2025, 330, 136580. [Google Scholar] [CrossRef] [Scilit]
  20. Le, T.-T.; Lu, W.-M. Charting the Landscape of Data Envelopment Analysis in Renewable Energy and Carbon Emission Effi-ciency. Energies 2025, 18, 6147. [Google Scholar] [CrossRef] [Scilit]
  21. Sajadifar, S.; Karimi, B.; Mogouie, H.; Dolatshahi, H.; Sajadifar, S.A. Enhancing Data Envelopment Analysis (DEA) for Incor-porating Energy Recycling in Circular Economy. Circ. Econ. Sustain. 2025, 5, 3073–3094. [Google Scholar] [CrossRef] [Scilit]
  22. Charnes, A.; Cooper, W.W.; Rhodes, E. Measuring the efficiency of decision making units. Eur. J. Oper. Res. 1978, 2, 429–444. [Google Scholar] [CrossRef] [Scilit]
  23. Banker, R.D.; Charnes, A.; Cooper, W.W. Some models for estimating technical and scale inefficiencies in data envelopment analysis. Manag. Sci. 1984, 30, 1078–1092. [Google Scholar] [CrossRef] [Scilit]
  24. Caves, D.W.; Christensen, L.R.; Diewert, W.E. The economic theory of index numbers and the measurement of input, output, and productivity. Econometrica 1982, 50, 1393–1436. [Google Scholar] [CrossRef] [Scilit]
  25. Färe, R.; Grosskopf, S.; Lindgren, B.; Roos, P. Productivity developments in Swedish hospitals: A Malmquist output index ap-proach. Appl. Econ. 1992, 24, 1089–1102. [Google Scholar]
  26. Simar, L.; Wilson, P.W. Estimation and inference in two-stage, semi-parametric models of production processes. J. Econom. 2007, 136, 31–64. [Google Scholar] [CrossRef] [Scilit]
  27. Tobin, J. Estimation of relationships for limited dependent variables. Econom. J. Econom. Soc. 1958, 26, 24–36. [Google Scholar] [CrossRef] [Scilit]
Figure 1. Regional Technical Efficiency of China’s NEV Industry, 2017–2023.
Energies 19 00208 g001
Figure 2. Malmquist Productivity Index of China’s NEV Industry, 2017–2023.
Energies 19 00208 g002
Figure 3. Regional Mean Malmquist Index of China’s NEV Industry, 2017–2023.
Energies 19 00208 g003
Table 1. Input and Output Indicators for DEA Efficiency Measurement.
Indicator TypeIndicator NameIndicator Definition and Calculation MethodExplanation and Justification
Input IndicatorsTotal Energy ConsumptionProvincial total energy consumption (10,000 tons of standard coal equivalent).This measures the energy consumption at the provincial level, providing an indication of resource use for NEVs.
Fixed Asset InvestmentReflects the level of capital input (CNY 100 million).This measures the capital investment, essential for understanding the infrastructure and technological investment.
Urban EmploymentMeasures labor input (10,000 persons).This captures labor availability and workforce size for NEV production and development.
Output IndicatorsRegional GDPRepresents the level of economic output (CNY 100 million).Used to gauge the economic activity generated by the NEV sector in each province.
NEV Sales Penetration RateShare of new energy vehicle (NEV) sales in total automobile sales (%).Reflects market adoption of NEVs, indicating the transition to cleaner technologies.
Industrial StructureRatio of value added of the secondary industry to GDP.This measures the extent to which industrial transformation is occurring, especially in green sectors.
Table 2. Explanatory Variables and Definitions in the Tobit Model.
DeterminantsVariable NameVariable CodeDefinition
Technological Innovation DimensionR&D IntensityRDInternal R&D expenditure divided by regional GDP
Human Capital DimensionEducation LevelHEDULiteracy rate × 1 + Primary school enrollment × 6 + Middle school enrollment × 9 + High school enrollment × 12 + College and above enrollment × 16
Industrial Structure Upgrading DimensionIndustrial Structure UpgradeISUValue added by the tertiary sector divided by value added by the secondary sector
Infrastructure DimensionTransportation Infrastructure LevelINFRALogarithm of road mileage and total freight volume
Informationization DimensionDigital Development LevelDIGITotal postal and telecommunications services divided by regional GDP
Openness DimensionDegree of Opening UpOPENTotal import and export trade volume divided by regional GDP
Government Intervention DimensionExtent of Government InterventionGOVTFiscal expenditure divided by regional GDP
Environmental Policy DimensionEnvironmental RegulationENVIInvestment in industrial pollution control divided by industrial value added
Table 3. Descriptive Statistics (Summary Statistics).
VariableObservationsMeanStd. Dev.MinMax
TE840.90590.05020.80401.0000
RD840.02850.01270.01310.0683
HEDU849.90191.08056.617012.6800
ISU841.83071.73740.852214.1113
INFRA8411.87671.00969.466312.9438
DIGI840.06860.04990.01630.1953
OPEN840.38060.28940.02821.0494
GOVT840.18190.03450.11890.2556
ENVI840.18880.63310.00003.8901
Table 4. Correlation Matrix.
VariableTERDHEDUISUINFRADIGIOPENGOVTENVI
TE1.0000
RD0.64811.0000
HEDU0.58990.90251.0000
ISU0.27160.56450.52781.0000
INFRA−0.6059−0.8274−0.8444−0.44241.0000
DIGI−0.1414−0.1270−0.1059−0.14990.02821.0000
OPEN0.78130.78910.74370.3199−0.8304−0.00281.0000
GOVT−0.34940.09990.17090.1979−0.30510.1798−0.01301.0000
ENVI0.17290.0267−0.00260.0925−0.0179−0.23680.12540.00251.0000
Note: The diagonal elements are all 1.0000, representing the correlation of the variable with itself. The lower triangular matrix shows the correlation coefficients between the variables. The sample size is N = 84.
Table 5. Malmquist Index Results of China’s New Energy Vehicle Industry (2017–2023).
YearEFFCHTECHCHPECHSECHTFPCH
2017–20181.0191.0751.0011.0181.095
2018–20191.0151.0191.0001.0151.034
2019–20200.9771.0751.0020.9751.051
2020–20210.9941.0860.9990.9951.079
2021–20220.9991.0921.0000.9981.091
2022–20231.0011.0441.0001.0011.045
Mean1.0011.0651.0001.0001.066
Table 6. Tobit Model Marginal Effects.
Variabledy/dxStd. Err.zp > |z|95% Conf.
RD4.8276 ***0.407711.840.000[4.0285, 5.6267]
HEDU0.00100.00190.560.575[−0.0026, 0.0047]
ISU−0.00030.0005−0.580.563[−0.0014, 0.0007]
INFRA0.0341 ***0.01093.130.002[0.0127, 0.0555]
DIGI0.00100.01570.060.949[−0.0299, 0.0318]
OPEN0.02000.01641.220.224[−0.0122, 0.0522]
GOVT−0.2141 ***0.0711−3.010.003[−0.3535, −0.0747]
ENVI0.0032 **0.00132.530.012[0.0007, 0.0057]
Note: Observations N = 84; VCE model is OIM; Expression is linear prediction value; ***, ** indicate significance at 1% and 5% levels, respectively.
Table 7. Variance Inflation Factor (VIF) Diagnostics.
VariableVIF1/VIF
RD7.430.134675
INFRA7.270.137571
HEDU6.550.152592
OPEN4.890.204363
GOVT1.650.605856
ISU1.650.605878
DIGI1.170.856244
ENVI1.160.859386
Table 8. Government Intervention: Fiscal Expenditure vs. Tax Burden.
Proxy VariableCoefficientStd. Errort-Statisticp-Value
Fiscal Expenditure−0.2141 ***0.0711−3.010.003
Tax Burden (New Proxy)−0.2307 ***0.0794−2.910.004
Note: *** denotes statistical significance at the 1% level.
Table 9. Bootstrap–DEA Results: Bias-Corrected Efficiency Scores.
MeasureOriginal MeanBootstrap Corrected
Mean
95%CI Lower95% CI
Upper
TE0.90590.92730.89300.9618
Malmquist TFP1.06601.09751.06101.1340
Disclaimer/Publisher’s Note: The statements, opinions and data contained in all publications are solely those of the individual author(s) and contributor(s) and not of MDPI and/or the editor(s). MDPI and/or the editor(s) disclaim responsibility for any injury to people or property resulting from any ideas, methods, instructions or products referred to in the content.