Article

Void Partial Discharge Simulation Under a Repetitive Frequency Square Wave with Different Overshoot Rates


1
State Grid Shanxi Electric Power Research Institute, Taiyuan 030012, China
2
College of Electrical and Power Engineering, Taiyuan University of Technology, Taiyuan 030024, China
*
Author to whom correspondence should be addressed.
Energies 2026, 19(1), 135; https://doi.org/10.3390/en19010135
Submission received: 2 October 2025 / Revised: 8 December 2025 / Accepted: 24 December 2025 / Published: 26 December 2025
(This article belongs to the Section F6: High Voltage)

Abstract

Long-term partial discharge (PD) erosion is an important factor causing insulation failure. With the rapid development of power electronics and the widespread application of inverters, more insulation is subjected to repetitive frequency square wave signals. To understand the void PD characteristics of insulation subjected to repetitive frequency square wave signals, a finite element simulation model of void PD is established based on the ABC model. A time-domain waveform and a phase-resolved partial discharge (PRPD) plot of void PD under repetitive frequency square wave with different overshoot rates are simulated. Then, void PD is measured under different overshoot rates and compared with the simulation results. Finally, the influence of overshoot voltage on internal discharge is analyzed. The simulation and experimental results show that the overshoot rate positively correlates with statistical characteristics, such as the average PD number and maximum PD quantity. Void PD events mainly occur in the overshoot portion of the repetitive frequency square wave. Therefore, the overshoot portion of the repetitive frequency square wave is one of the key factors contributing to severe PD in insulation.

1. Introduction

Inverters are widely used in power systems. Inverter-fed motors serve as the power core of high-speed railroads, multi-electric airplanes, wind power generators, and new energy vehicles. They have gradually replaced traditional three-phase alternating current (AC) motors due to their advantages of easy speed regulation, easy starting, and high energy efficiency [1]. The rapid development of emerging wide-bandgap semiconductor devices has driven a surge of inverter-fed motors in the direction of high-voltage and high-speed performance; the requirements for insulation performance are also increasing [2]. The main principle of inverter-fed motors is to convert a fixed AC supply to a variable fundamental frequency by generating multi-width squared pulses [3]. The insulation of stator ends and electricity power cables is continuously exposed to high-frequency voltages with rapidly rising- and falling-edge pulse-width modulation (PWM) [4,5]. Electrical stresses between phases, between phase and ground, and between turns have been thoroughly considered in the design of sinusoidally fed AC motors. There is also a large amount of field experience and data available to ensure the quality and expected lifespan of insulation systems. However, repetitive frequency square wave voltages produce a sustained localized higher electric field for inverter-fed motors, resulting in stronger electrical stresses on the insulation than at power frequency voltages [6]. A significant challenge in the current design and manufacture of inverter-fed motors is developing insulation that can withstand high frequency and voltage without affecting the motor’s power density or efficiency.
Defects such as voids and impurities may be formed in the insulation of electrical equipment during its manufacture and operation. These defects cause electric field distortion, resulting in the appearance of partial discharge (PD). The accumulation of discharge may gradually degrade the insulation material and may even lead to localized dielectric breakdown. Therefore, PD detection can provide information to evaluate the insulation status and ensure the safe and stable operation of power equipment. To ensure the safe and reliable operation of inverter-fed motors, the International Electrotechnical Commission (IEC) has developed standards (IEC 60034-18-41 [7] and IEC 61934 [8]). According to these standards, Type I inverter-fed motors (typically rated below 900 V) need to be tested for partial discharge initiation voltage (PDIV) before leaving the factory. Type II inverter-fed motors (typically rated above 900 V) require evaluation of their insulation lifespan under both sinusoidal and repetitive frequency square waves [7].
Many scholars have studied the partial discharge of inverter-fed motor insulation under repetitive frequency square waves. The effect of rise time on PDIV was investigated, and it was concluded that overvoltage during the rise phase is the main reason for high PDIV [9]. The effect of rise time on the statistical characteristics of partial discharges has also been studied. It was found that increases in the short pulse rise time result in decreases in the discharge amplitude and a widening of the phase [10]. By studying the effects of the polarity and duty cycle of repetitive frequency square waves on PDIV, it was found that unipolar PDIV is higher than bipolar PDIV when the duty cycle is 50%, and that unipolar and bipolar PDIVs are different at different duty cycles [11]. A study on the effect of repetitive impulse overvoltage on the partial discharge initial voltage and extinguishing voltage of inverter-fed motor insulation was beneficial for evaluating the insulation performance of Type I inverter motors [12]. Moreover, predicting partial discharge PDIV based on a deep belief network may provide new ideas for insulation design and condition assessment of inverter-fed motors. The effects of high dV/dt switching transient PWM voltages on partial discharges and square wave voltage at different air pressures (as low as 20 kPa) on partial discharge characteristics have also attracted extensive attention [13]. These studies, which have focused on the effect of rise time on PDIV, have shown that the rise time of the applied voltage is closely related to PDIV. However, few studies have considered the role of overshoot voltage during voltage rise. Due to the discrepancy in impedance between the cable and load, increasing the slew rate produces higher overshoot voltages. High turn-on frequencies and speeds may also lead to higher overshoot voltages at the motor terminals, which may cause additional electrical stresses on the insulation. However, overshoot voltages are often overlooked as a factor affecting the PD detection of variable-frequency motors.
In this study, a simulation model is established, and the effect of overshoot voltage on void PD is studied through simulation. The phase-resolved partial discharge (PRPD) plot and statistical characteristics of PD are analyzed under different overshoot rates, and the results are compared with the experimental results to verify the validity of the simulation. Then, the influencing factors of the overshoot rate on void PD under a repetitive frequency square wave are analyzed.

2. Void PD Simulation Setup

Due to the thermal aging of mica–epoxy groundwall insulation in stator winding systems, the mica tapes tend to separate under thermo-mechanical stress, leading to delamination of the insulation. Delamination creates gas-filled cavities or voids between the tape layers, leading to PD in the high-voltage coils. In this paper, “void” refers to a delamination defect in groundwall insulation. The electric field strength within a void in insulation is higher than the surrounding insulation because the dielectric constant of the gas is lower than that of the insulation [14]. When the electric field strength in a void exceeds the gas breakdown field strength, void partial discharge may occur, leading to local heating and destroying the epoxy resin components of the insulation system.

2.1. Overshoot Voltage

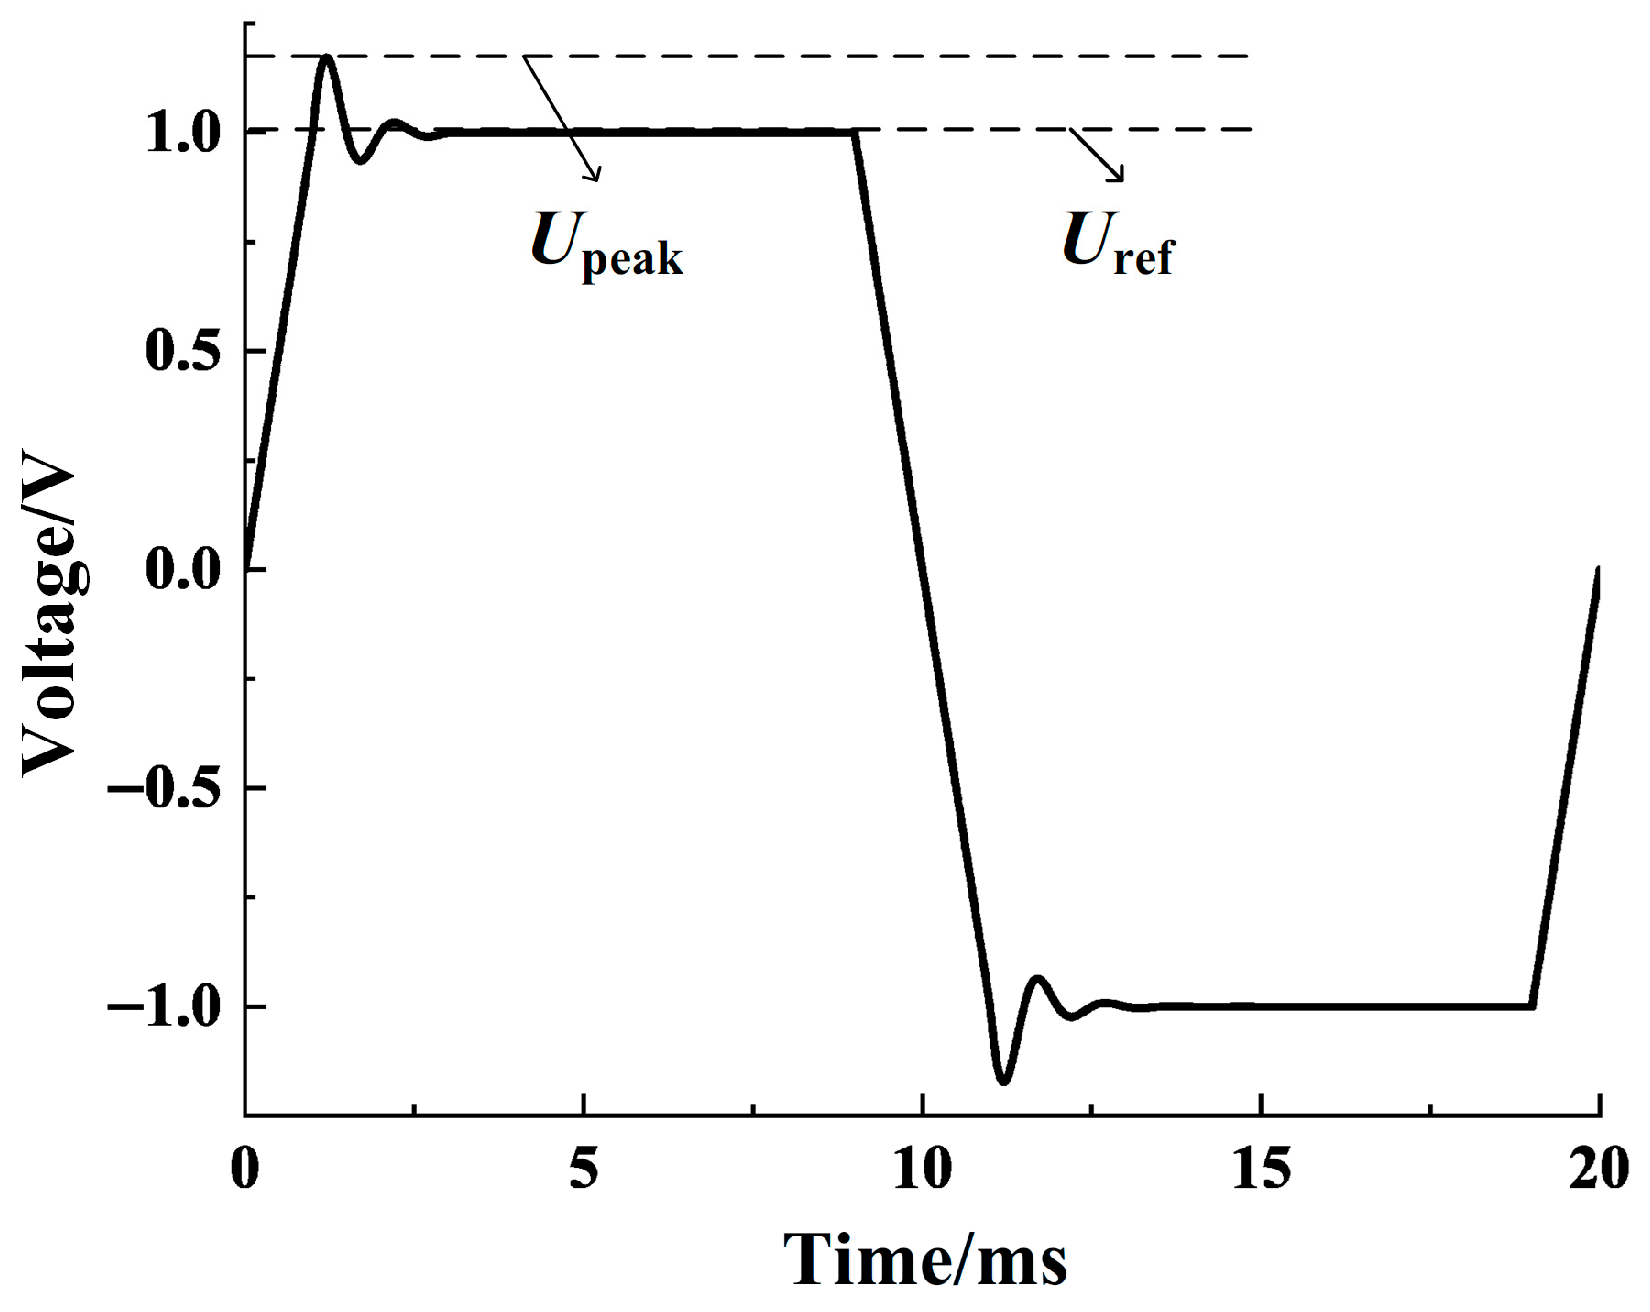
In this study, the frequency of the repetitive frequency square wave was set to 50 Hz. When the rise time of the repetitive frequency square wave is less than 100 ns, the power electronic switch on–off moment during the experiment produces a sizeable electromagnetic interference, which affects the PD results [10]. Since the focus of this study was on overshoot voltage, a specific pulse rise time was not required. Considering the subsequent use of the simulation waveform for experiments, the rise time was set to 1 ms during the simulation. The overshoot voltage portion u of the repetitive frequency square wave can be expressed by the decaying oscillation function, as follows:
u = C e t / τ o sin ( 2 π f o t ) + 1
where τo is the attenuation coefficient (when τo > 0, the overshoot waveform exhibits damped oscillation; when τo < 0, the waveform exhibits growth oscillation); fo is the oscillation frequency of the overshoot voltage; and C is the amplitude of the overshoot voltage. In this study, λ was set to 1/500 μs, and fo was set to 1000 Hz, ensuring that the overshoot voltage decayed completely after two oscillations.
The overshoot rate of the repetitive frequency square wave, Uos, can be expressed as follows:
U os = U peak U ref / U ref
where Upeak and Uref are the peak values of the repetitive frequency square wave and the square wave, respectively.
Figure 1 shows the repetitive frequency square wave with a Uos of 15%. According to the literature [3], Uos was set to 0 (i.e., trapezoidal waveform), 15%, and 35%, respectively, in the simulation, and the amplitude of the square wave was set to 14 kV.

2.2. Finite Element Model

A model of insulation with a void defect is shown in Figure 2. This two-dimensional axisymmetric model is a simplified representation of a coil with a void next to the turn insulation. The diameter of the insulation was set to 10 mm, the thickness was set to 2 mm, the diameter of the void in the middle of the insulation was set to 1.7 mm, and there was a 0.05 mm thick void surface on the surface of the insulation. A voltage was applied to the upper boundary of the insulating layer, and the lower boundary was grounded.

2.3. Void PD Simulation Process

Two conditions need to be met for void PD to occur within insulation. The first condition is that the electric field strength within a void in insulation, i.e., the initial field strength of the PD, Einc, needs to be higher than the breakdown field strength of the gas. Einc can be expressed as follows [15]:
E inc = A p ( 1 + B 2 p r 1 )
where p is the gas pressure in the void, r1 is the radius of the void, and both A and B are the ionization parameters of the air.
The second condition is that sufficient free electrons must be present to form an electron avalanche, which can further develop into streamer discharge [16]. The number of free electrons generated can be expressed in terms of the total electron generation rate, which can be obtained by assuming that the number of free electrons generated in the void per unit of time is the sum of the emission from the void surface and the ionization in the bulk:
N et ( t ) = N es ( t ) + N ev
where Net(t) is the total number of free electrons in the void; Nes(t) is the number of electrons generated by the emission from the insulating surface; and Nev is the number of electrons generated by the ionization of the gas inside the void, which was set to a constant during the simulation.
In the simulation, Nev mainly provided the free electrons required for the first void PD. After an initial void PD occurs, some charges may remain on the void surface, after which the free charges required for void PD are mainly provided by surface emission [17]. The number of electrons Nes(t) generated by surface emission can be expressed as follows [18]:
N es ( t ) = N es 0 exp t t PD τ dec exp E cav ( t PD ) E inc + E cav ( t ) E inc T mat T amb
where Ecav(tPD) is the electric field strength in the void when the last PD occurs before the time reaches tPD; τdec is the effective charge decay time constant, which depends on the materials (τdec of epoxy resin was set to 2 ms [19]); Tamb is the ambient temperature; Tmat is the sample’s temperature; Ecav(t) is the electric field strength of the void at time t; Ecav(t)/Einc and Tmat/Tamb are the simplified electric field strengths and the temperature dependence; Nes0 is the number of free electrons ejected from the void surface per unit of time when the initial field strength is Einc.
Considering the change in polarity of the applied voltage during the simulation, the values of Nes0 include Nes0H and Nes0L, where Nes0H is larger than Nes0L. Nes0H represents the change in the void’s electric field polarity after a previous void PD and is defined as the number of free electrons generated by the surface emission per unit of time before the applied voltage polarity changes. Nes0L represents no polarity change between consecutive void PD events and is defined as the number of free electrons generated by the surface emission after a polarity change.
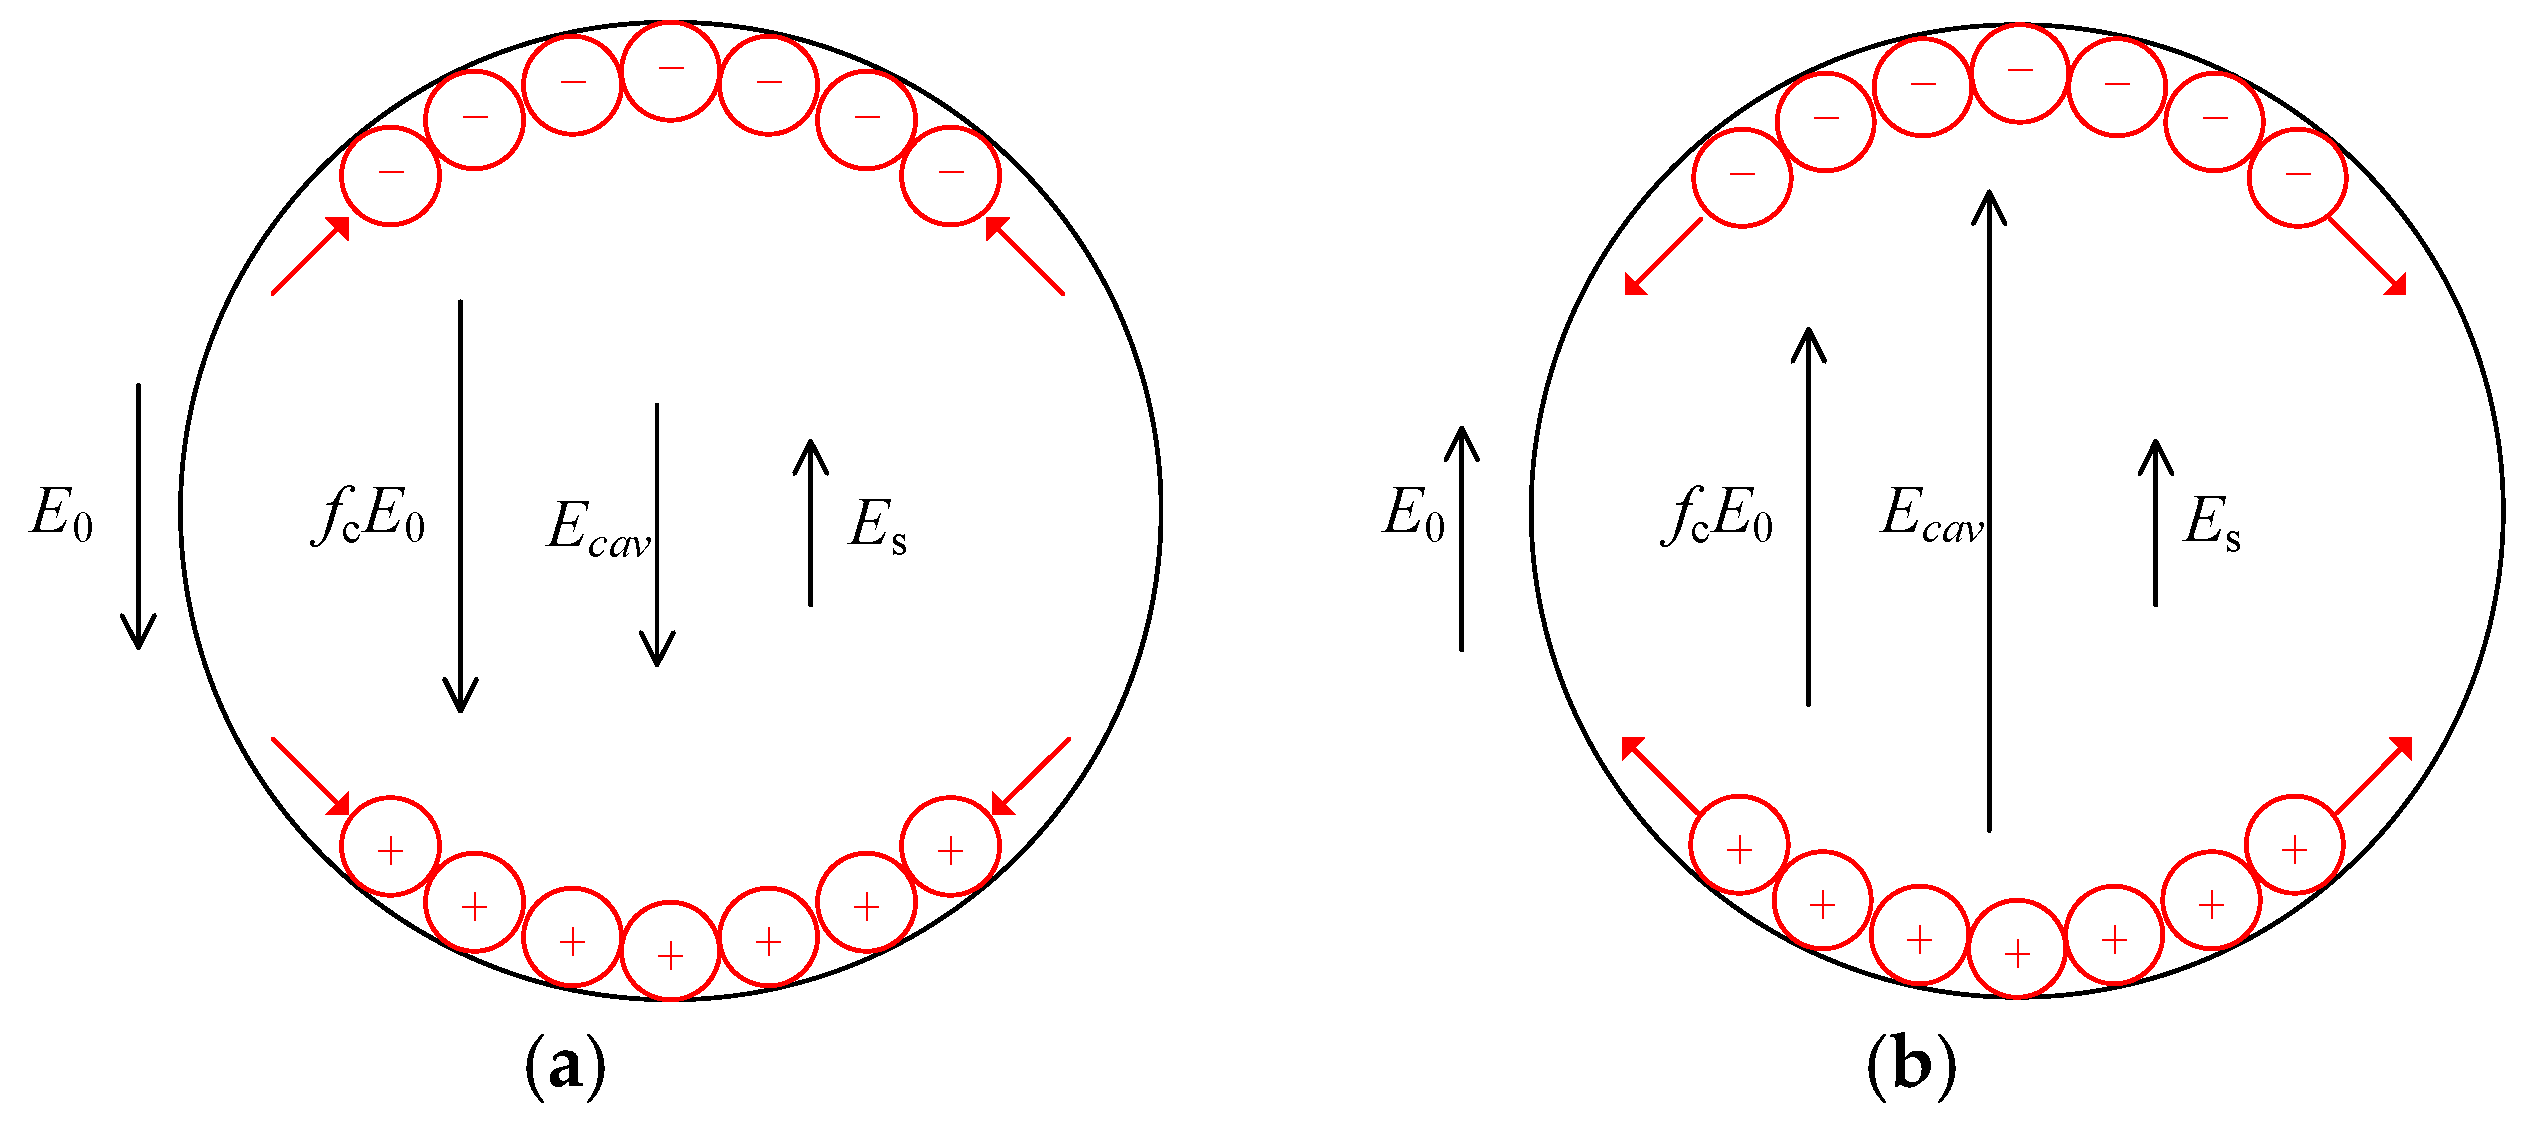
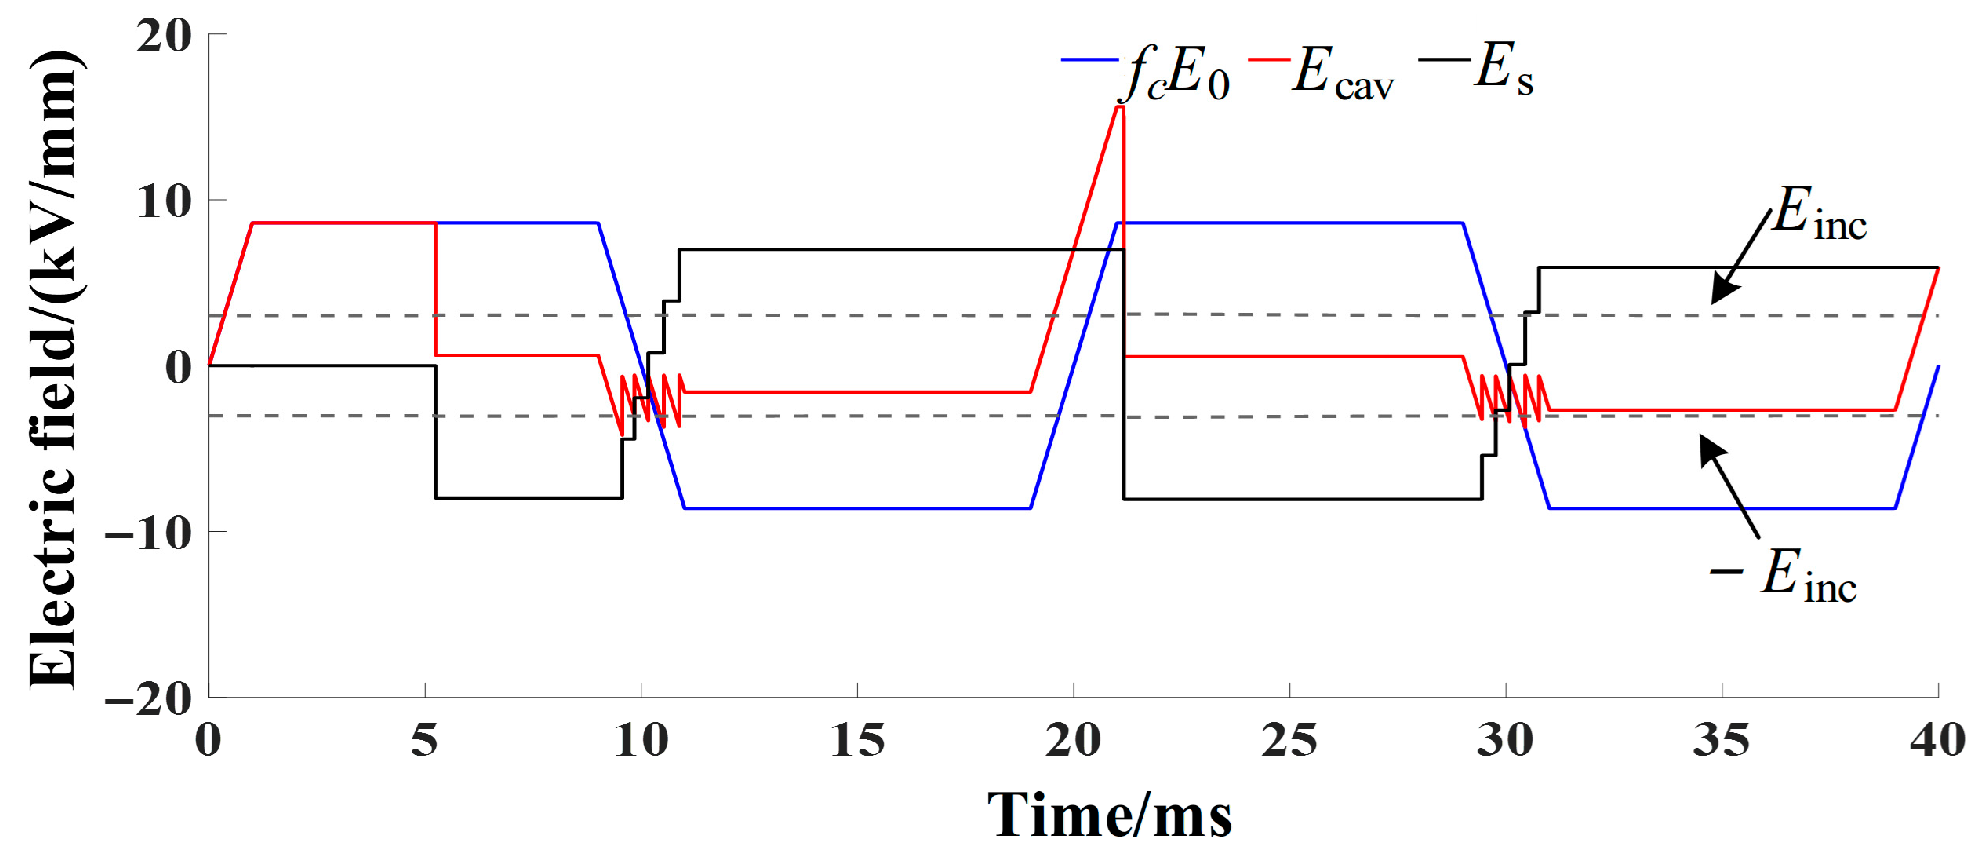
After PD occurs, the free charges accumulated on the void surface move along the surface, with their direction determined by the electric field within the void. As shown in Figure 3a, E0 is the applied electric field. Due to the difference in the dielectric constants of the insulation and the void, the applied electric field E0 is multiplied by a dimensionless electric field enhancement factor fc, resulting in the localized field fcE0 within the void. After the discharge, in addition to the Laplace field fcE0, the surface charges of the void also form an electric field Es. The combination of these two electric fields forms the void electric field Ecav. When fcE0 is opposite in direction to Es, the surface charge moves toward the upper and lower surfaces of the void under the void electric field Ecav. Under this condition, surface charges decay slowly, resulting in greater charge accumulation on the upper and lower surfaces of the void. When subsequent void PD occurs, more free charges remain on the void surface. In this study, the value of Nes0 was taken as Nes0H. In addition, it was assumed that there was almost no charge movement on the void surface, and the surface conductivity of the void was low, so the surface conductivity was set to the initial value, σs0, in the simulation.
As shown in Figure 3b, when the applied electric field, E0, changes in polarity, fcE0 is in the same direction as Es, and the charges accumulated on the surface of the void move toward the middle of the void under the influence of Ecav. The positive and negative surface charges meet and neutralize, reducing the overall surface charge and decreasing the residual charges available for subsequent discharges. In this study, the value of Nes0 was set to Nes0L. Additionally, charge movement also increases void surface conductivity, σs(t), which can be expressed as follows:
σ s ( t ) = σ s 0 exp [ α E ons ( t ) + β T ons ( t ) ]
where σs0 is the initial conductivity of the void surface; Eons(t) and Tons(t) are the initial electric field and temperature of the void surface; α and β are the electric stress coefficient and temperature coefficient. Following the method of reference [15], α was applied to adjust the change rate of surface conductivity depending on the electric stress and was set to 10 mm/kV. For example, when a has a larger value, the surface conductivity, σs, and electric field, Es, increase rapidly, resulting in a maximum PD quantity lower than that of the measured PD. The temperature coefficient was set to 1/293 K−1.
To avoid non-convergence of the model, it was necessary to set the maximum value of the void surface conductivity σs(t) as σsmax. The probability of PD occurrence can be expressed as follows:
P = N et ( t ) Δ t
where Net(t) is the total number of free electrons produced per unit of time, and Δt is the time step.
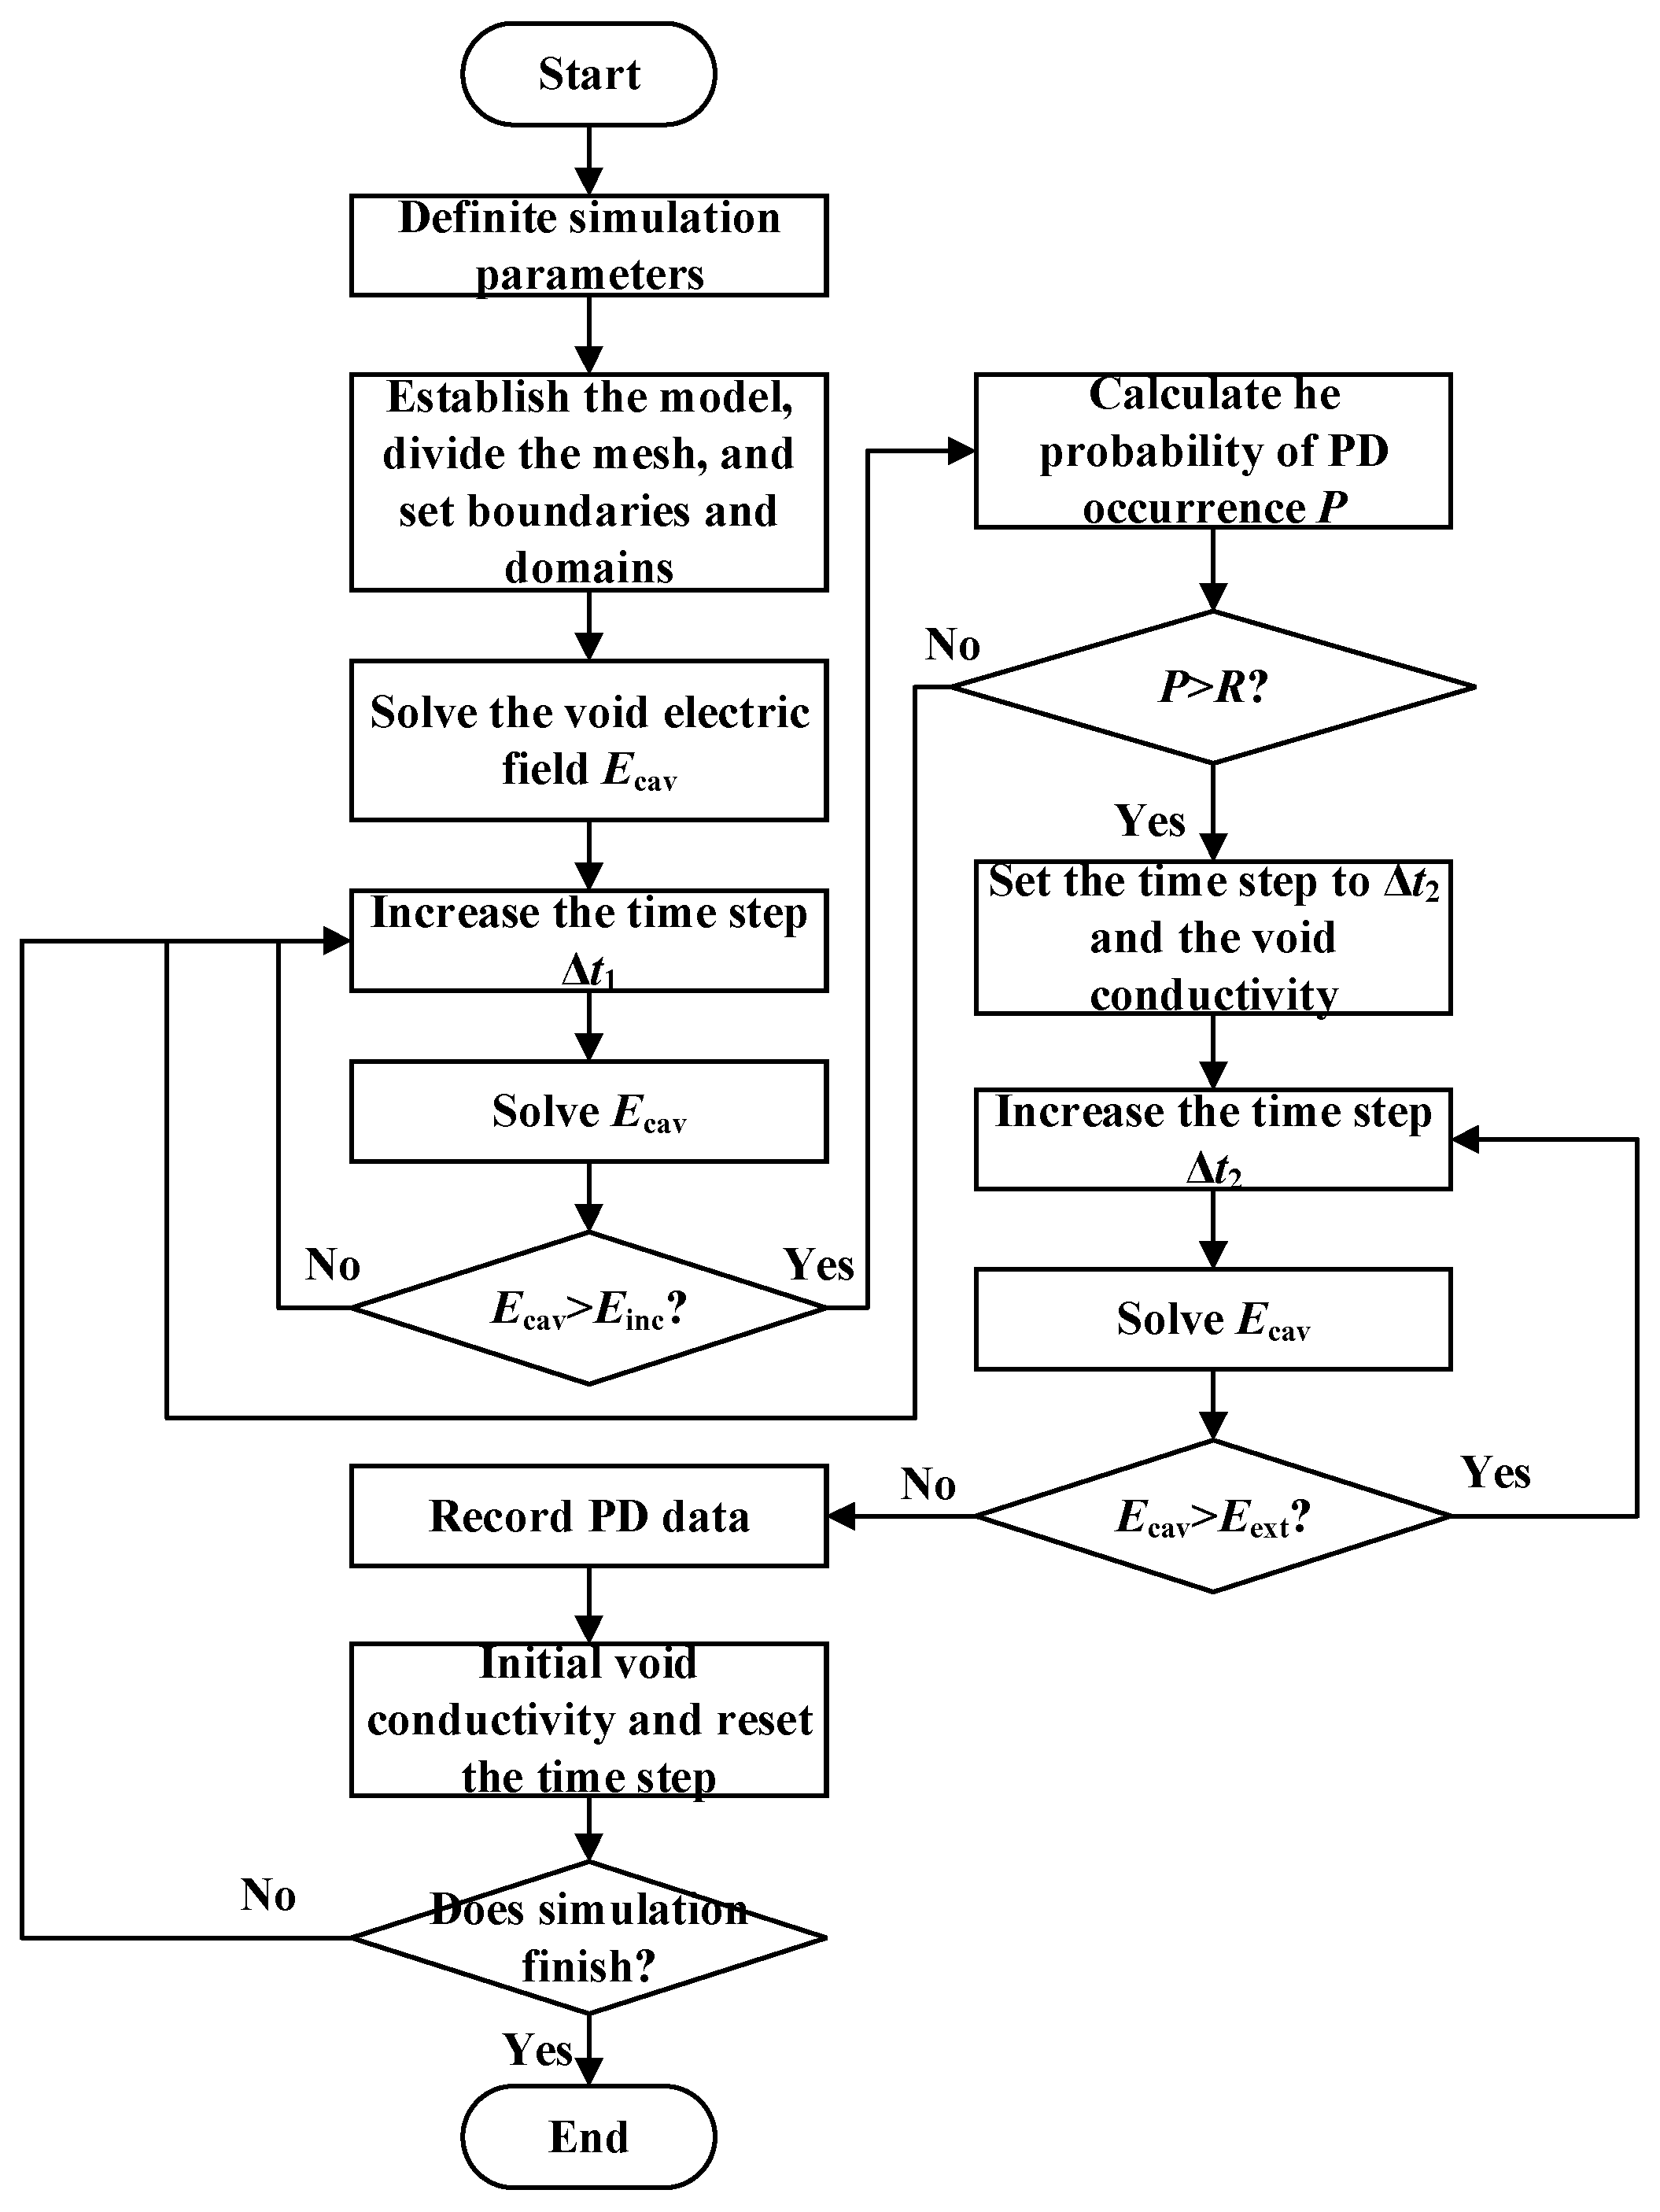
The probability of PD occurrence, P, can be compared with a random number R (between 0 and 1). When P is higher than R, void PD occurs; otherwise, no discharge will occur.
Once a void PD occurs, the void’s conductivity is adjusted to simulate the change. Before PD occurs, the void’s conductivity is nearly zero; after PD occurs, the void breaks down, and its conductivity σcavmax becomes relatively large. This can be estimated using the electronic conductivity in the plasma, i.e.,
σ cavmax = α e 2 N e λ e m e c e
N e = q max 4 / 3 π r 3
where e is the electron charge; αe is the correlation coefficient between the electron energy distribution and the mean free range; Ne is the electron density; λe is the mean free range of the electron; me is the electron mass; ce is the thermal velocity of the electron; qmax is the maximum charge obtained from the measurement; r is the radius of the void.
The void PD modeling flowchart is shown in Figure 4. The simulation parameters are reported in Table 1. Within a discharge time interval, the discharge quantity, q, is obtained by integrating the current, I(t), flowing through the grounded electrode, as follows:
q = t t + dt I ( t ) d t
where the current I(t) is derived from the current density J over the surface area of the ground electrode.

3. Simulation Results

3.1. Electric Field Distribution Under Different Voltages

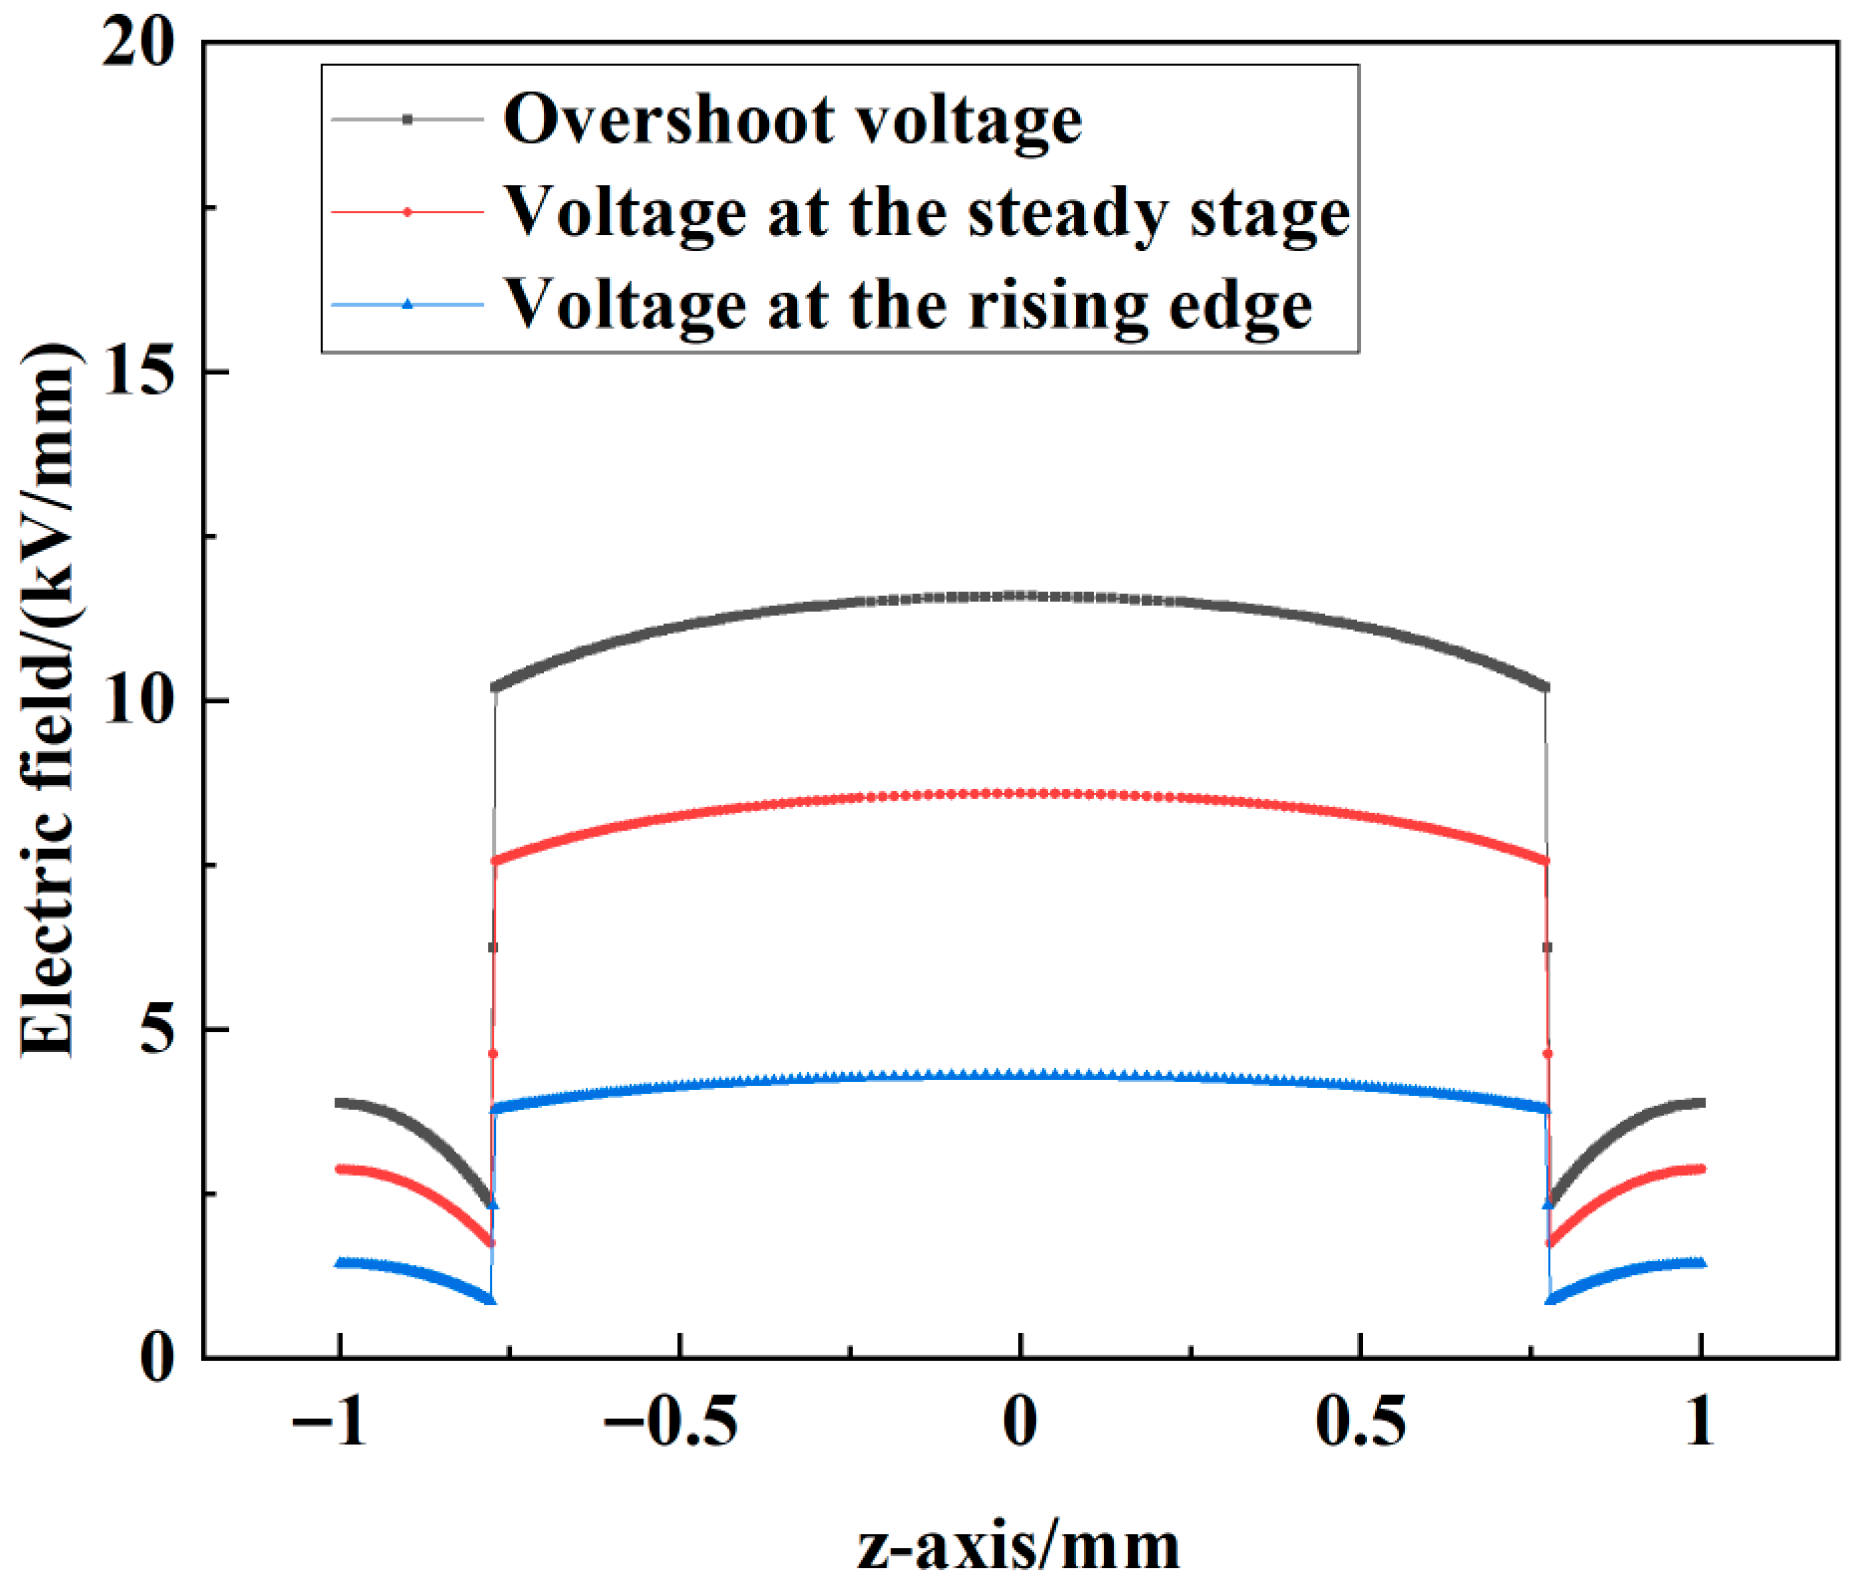
As shown in Figure 5, when the applied voltage was a repetitive frequency square wave with an overshoot voltage (Uos of 35%), the electric field amplitude in the void varied during the rising edge, the overshoot portion, and the steady voltage stage. At z = 0 mm, the electric field strength of the void at the same voltage was notably higher than that of the insulation surrounding the void. The electric field strength of the void during the overshoot voltage portion was significantly higher than that at the steady voltage stage and at the rising edge. Overall, the electric field strength of the void was positively correlated with the applied voltage amplitude at different moments.

3.2. Simulation Results of Different Overshoot Rates

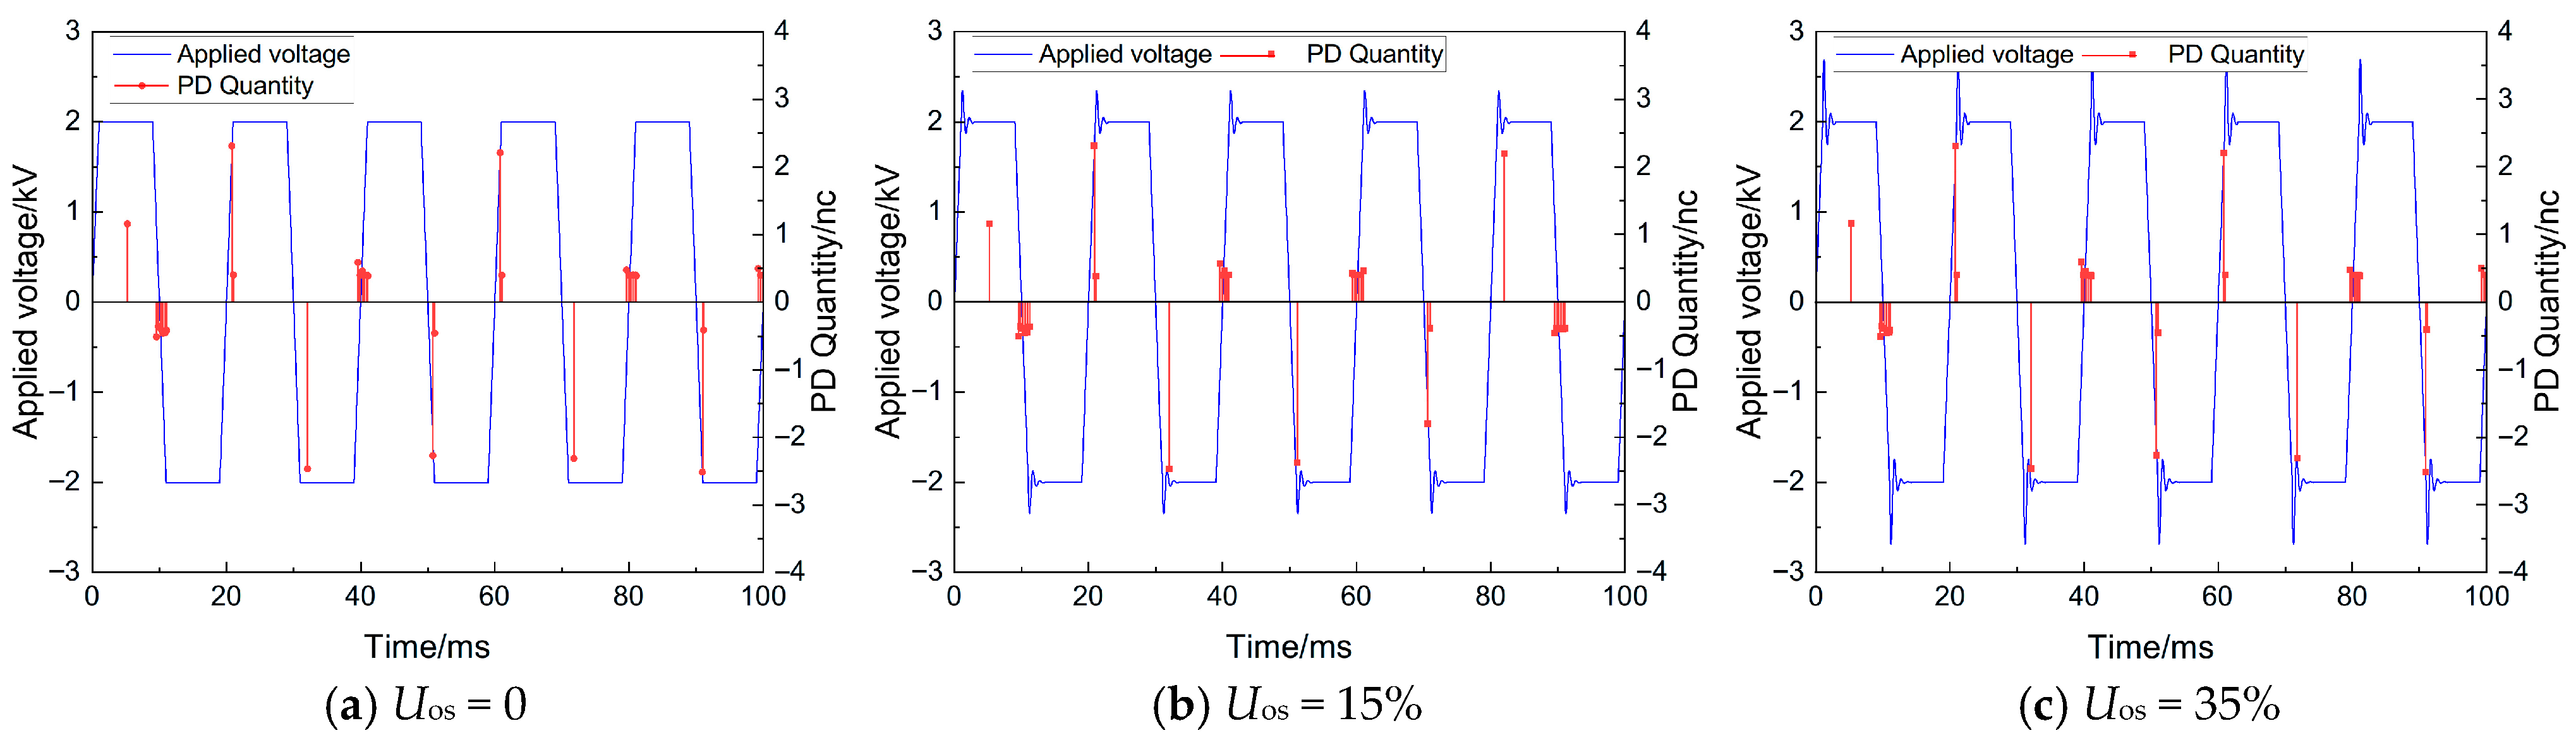
The simulation results of the discharge quantity over five cycles at different overshoot rates are shown in Figure 6. When the polarity of the applied electric field changed, void PD tended to produce a discharge pulse with a large PD quantity, similar to void PD under a sinusoidal wave. This is because the electric field Es formed by the accumulated charges on the void surface is opposite in direction to the void electric field Ecav before the polarity of the applied electric field E0 changes. When the polarity of the applied electric field changes, Es is in the same direction as Ecav, enhancing the void electric field and potentially producing a PD pulse with higher discharge.
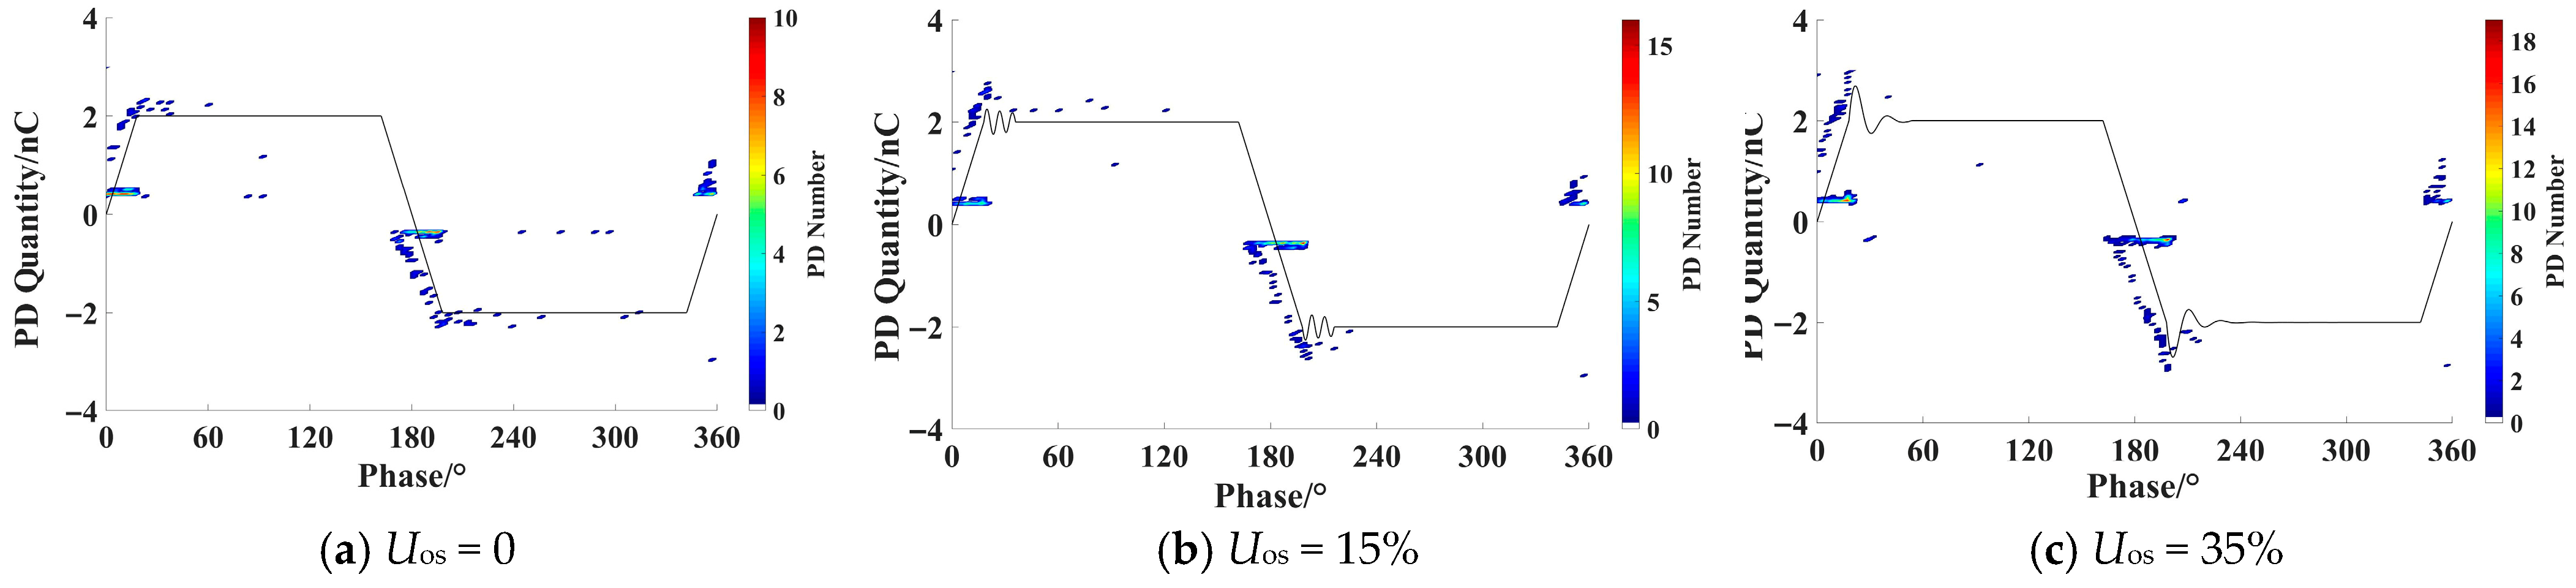
PRPD plots obtained from the simulation results of 50 cycles are shown in Figure 7. Table 2 shows the statistical characteristics of PD, including the average PD number, n, the maximum PD quantity, qmax, and the total PD quantity, qtotal. According to the data in Figure 7 and Table 2 it can be concluded that the overshoot rate was positively correlated with the PD quantity; that is, as the overshoot rate rose, both the maximum PD quantity qmax, and the average PD number n significantly increased. The qmax values under overshoot rates of 15% and 35% were about 1.15 and 1.43 times that under the square wave, respectively. Moreover, qtotal was about 1.43 times higher than the square wave when the overshoot rate was 35%. qtotal accounts for both the PD number and the amplitude of each discharge, reflecting the energy transferred by PD activity and the resulting PD damage. Therefore, the higher the overshoot rate is, the more serious the damage to the insulation will be. In addition, most PD events occurred in the voltage rising stage. As the overshoot rate increased, the number of PD pulses during the overshoot portion also increased.

4. Experimental Validation

4.1. Experimental Setup

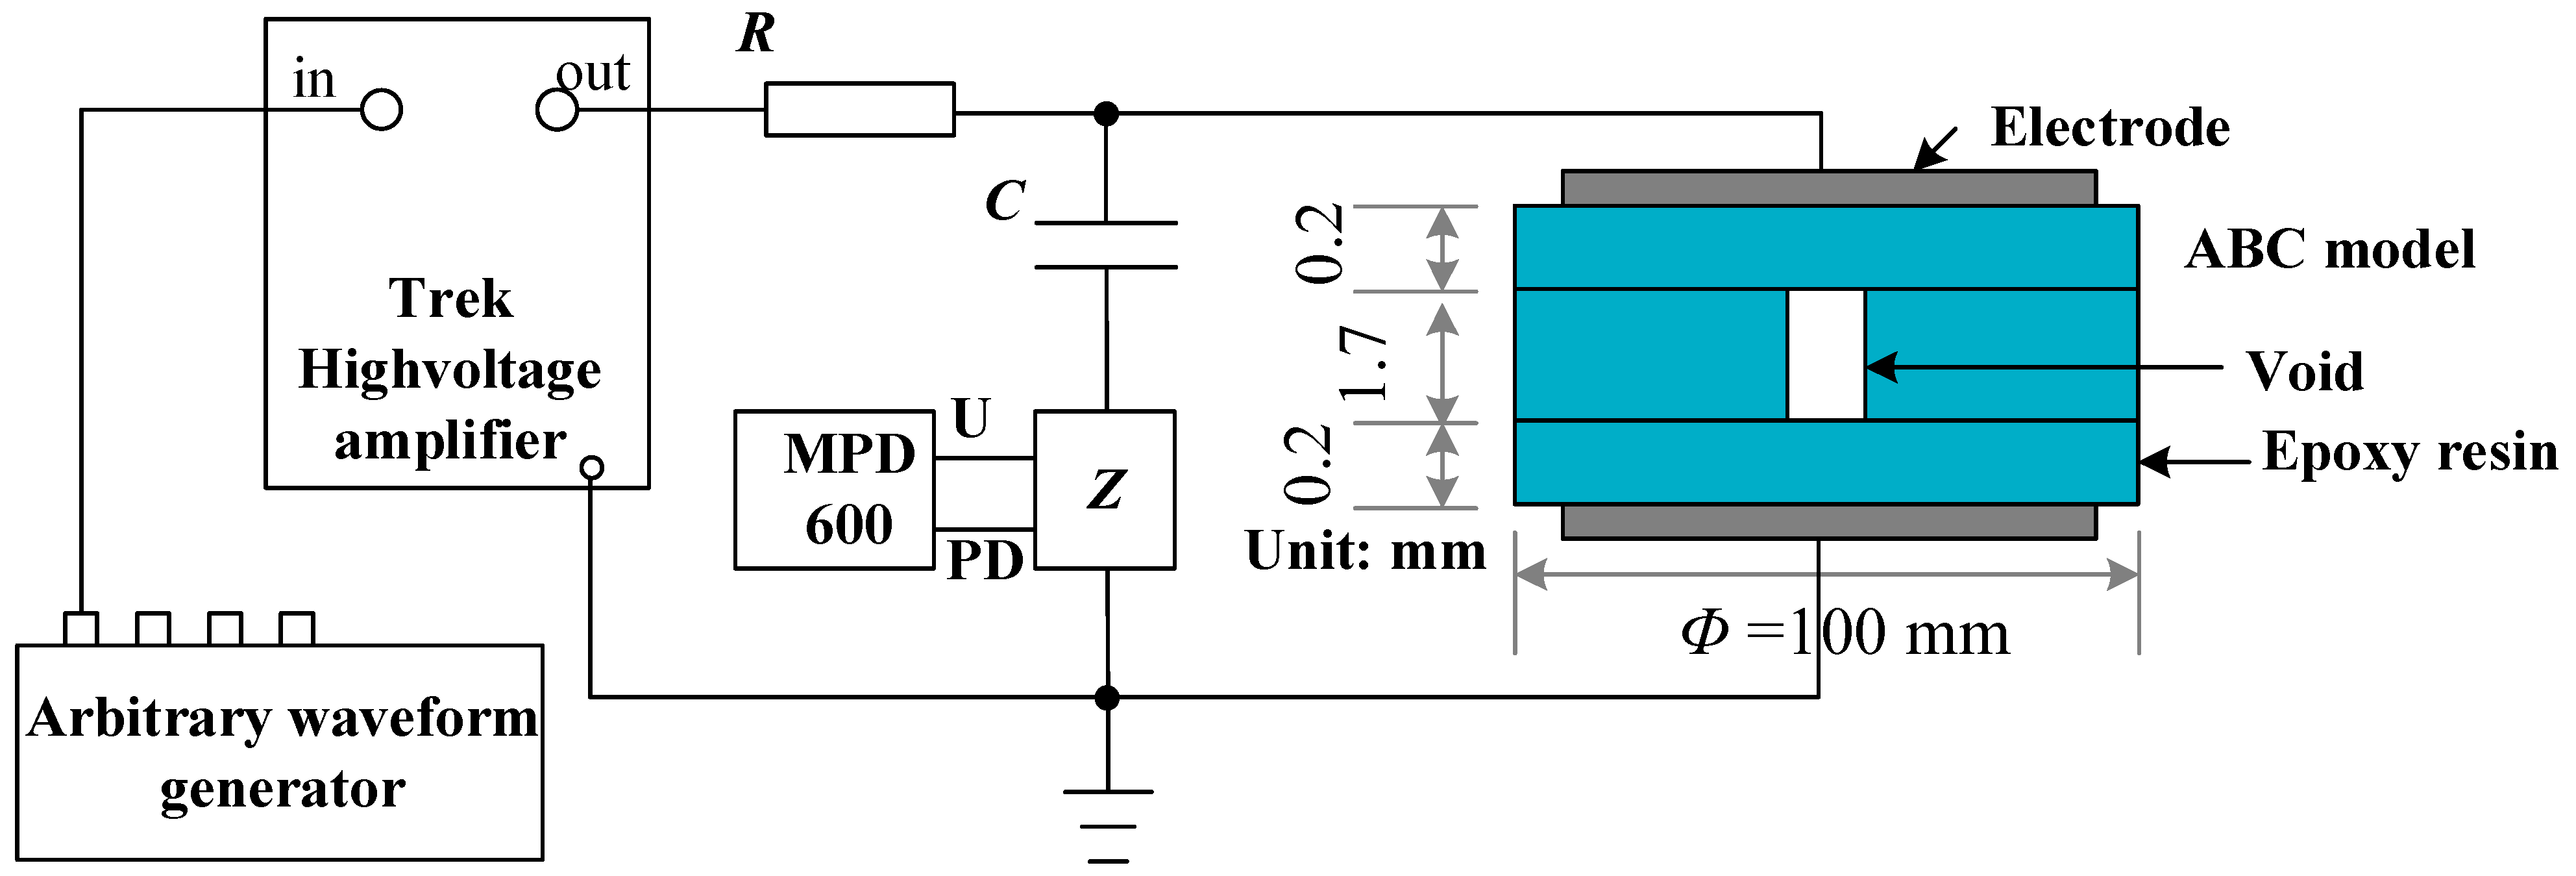
To verify the simulation results, a partial discharge experimental platform was built. As shown in Figure 8, the high-voltage amplifier, Trek 30/20A, Trek inc., Fort Collins, CO, USA, amplifies the voltage waveform emitted from the arbitrary waveform generator, LeCroy ArbStudio, by a factor of 3000. The protection resistor R is a water resistor with 20 kΩ of resistance. The practical void PD model was designed based on the ABC model and comprised three insulation pieces made of tung-maleic anhydride, each ~100 mm in diameter. A cylindrical void with a diameter of ~1.7 mm and a height of ~1.7 mm was located in the middle layer. Two cylindrical electrodes with a diameter of ~50 mm and a height of ~10 mm clamped the ABC model. A small amount of transformer oil was applied between the layers of insulation to ensure close contact of the epoxy resin. Partial discharges were measured using the OMICRON MPD600, with a coupling capacitor C, HIPOTRONICS PSF 100/1/DDX, 1 nF. Z represents detection impedance. During each test, the new ABC model was used to eliminate the influence of the void gas conditions (such as air pressure and composition) and the surface conditions of the insulation surrounding the void.

4.2. Experimental Results

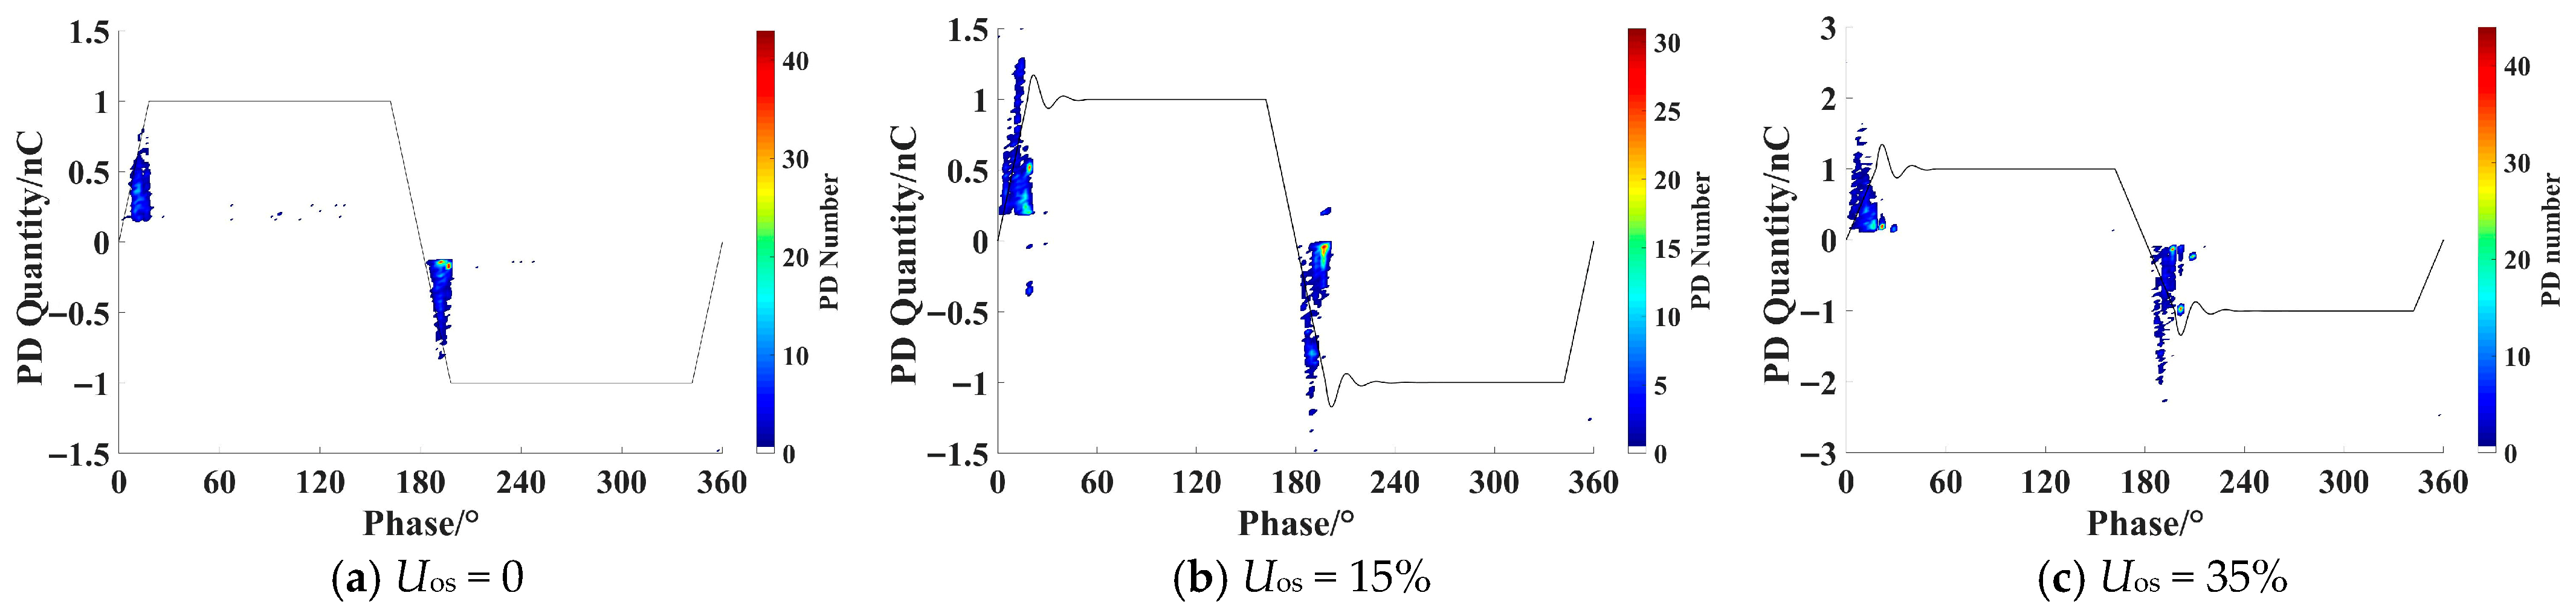
Figure 9 shows the experimental results of void PD with different overshoot rates. The maximum PD quantity, qmax, increased significantly with increases in the overshoot rate. The qmax of the square wave was ~900 pC, while it reached 2500 pC when the overshoot rate was 35, which is 2.8 times higher than that of the square waveform. Meanwhile, the average PD number during the overshoot portion increased significantly. There were fewer PD pulses with lower PD quantities during the steady voltage stage of the square wave. However, as the overshoot rate rose to 35%, almost no PD pulse occurred during the steady voltage stage, which is consistent with the simulation results. Analysis of the experimental PRPD plot shows distinct solid “Δ” shapes in both the positive and negative half cycles, which are different from the shapes in the simulation PRPD plot. This is because void PD in the real conditions is highly random, and some random variables were ignored or held constant in the simulation, especially when PD is intense. For example, intense PD will cause the temperature of the gas in the void and the local area of insulation to rise. With this increase in temperature, the PDIV also increases. The pressure and volume of gas in the void also change with increases in PD intensity, which has been confirmed as the main reason affecting PD quantity [20]. Therefore, the PRPD plot from the simulation results differs from that of the experimental results; its distribution is more concentrated, appearing as a solid “Δ” shape.

4.3. Comparison of Simulation and Experimental PD Characteristics

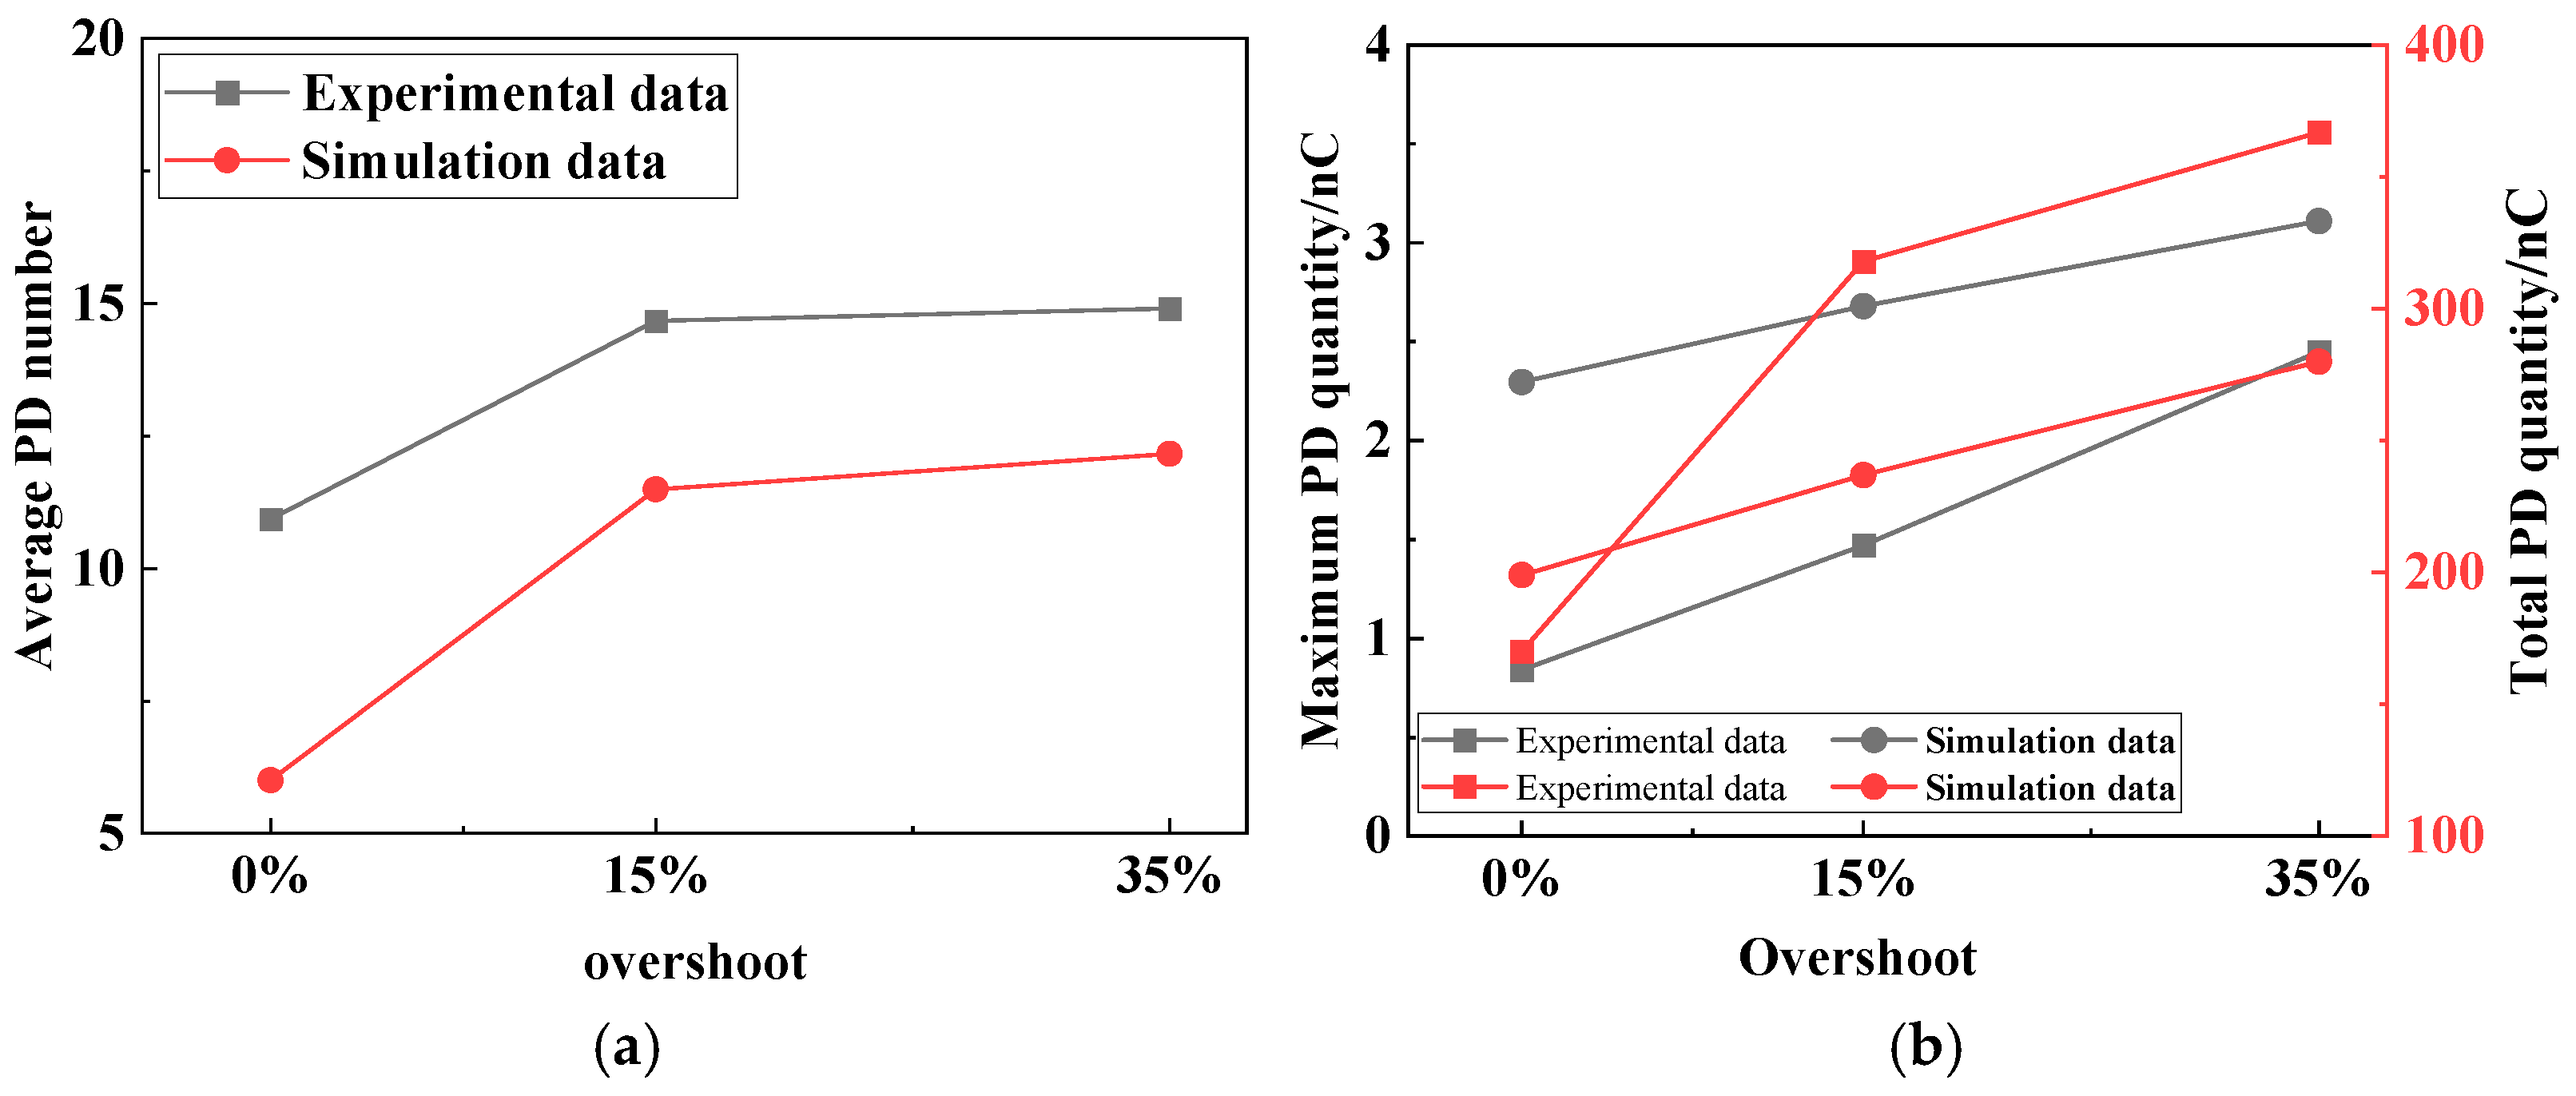
Figure 10 shows the simulation and experimental statistical characteristics of void PD under different overshoot rates. The results show that the average PD number, the maximum PD quantity, and the total PD quantity increase with increasing overshoot rates. The trend in the simulation results is consistent with that in the experimental results. Comparing the characteristics of the overshoot increases from 0 to 15% and from 15% to 35%, it was found that the average PD number increased dramatically when the overshoot rate increased from 0 to 15%, which indicates that the presence of the overshoot portion had a significant effect on the average PD number. In contrast, once overshoot occurred, its amplitude had a weaker effect on the average PD number. Additionally, both the maximum PD quantity and the total PD quantity depended on the presence overshoot and the amplitude of the overshoot rate, showing a positive correlation.

5. Analysis and Discussion

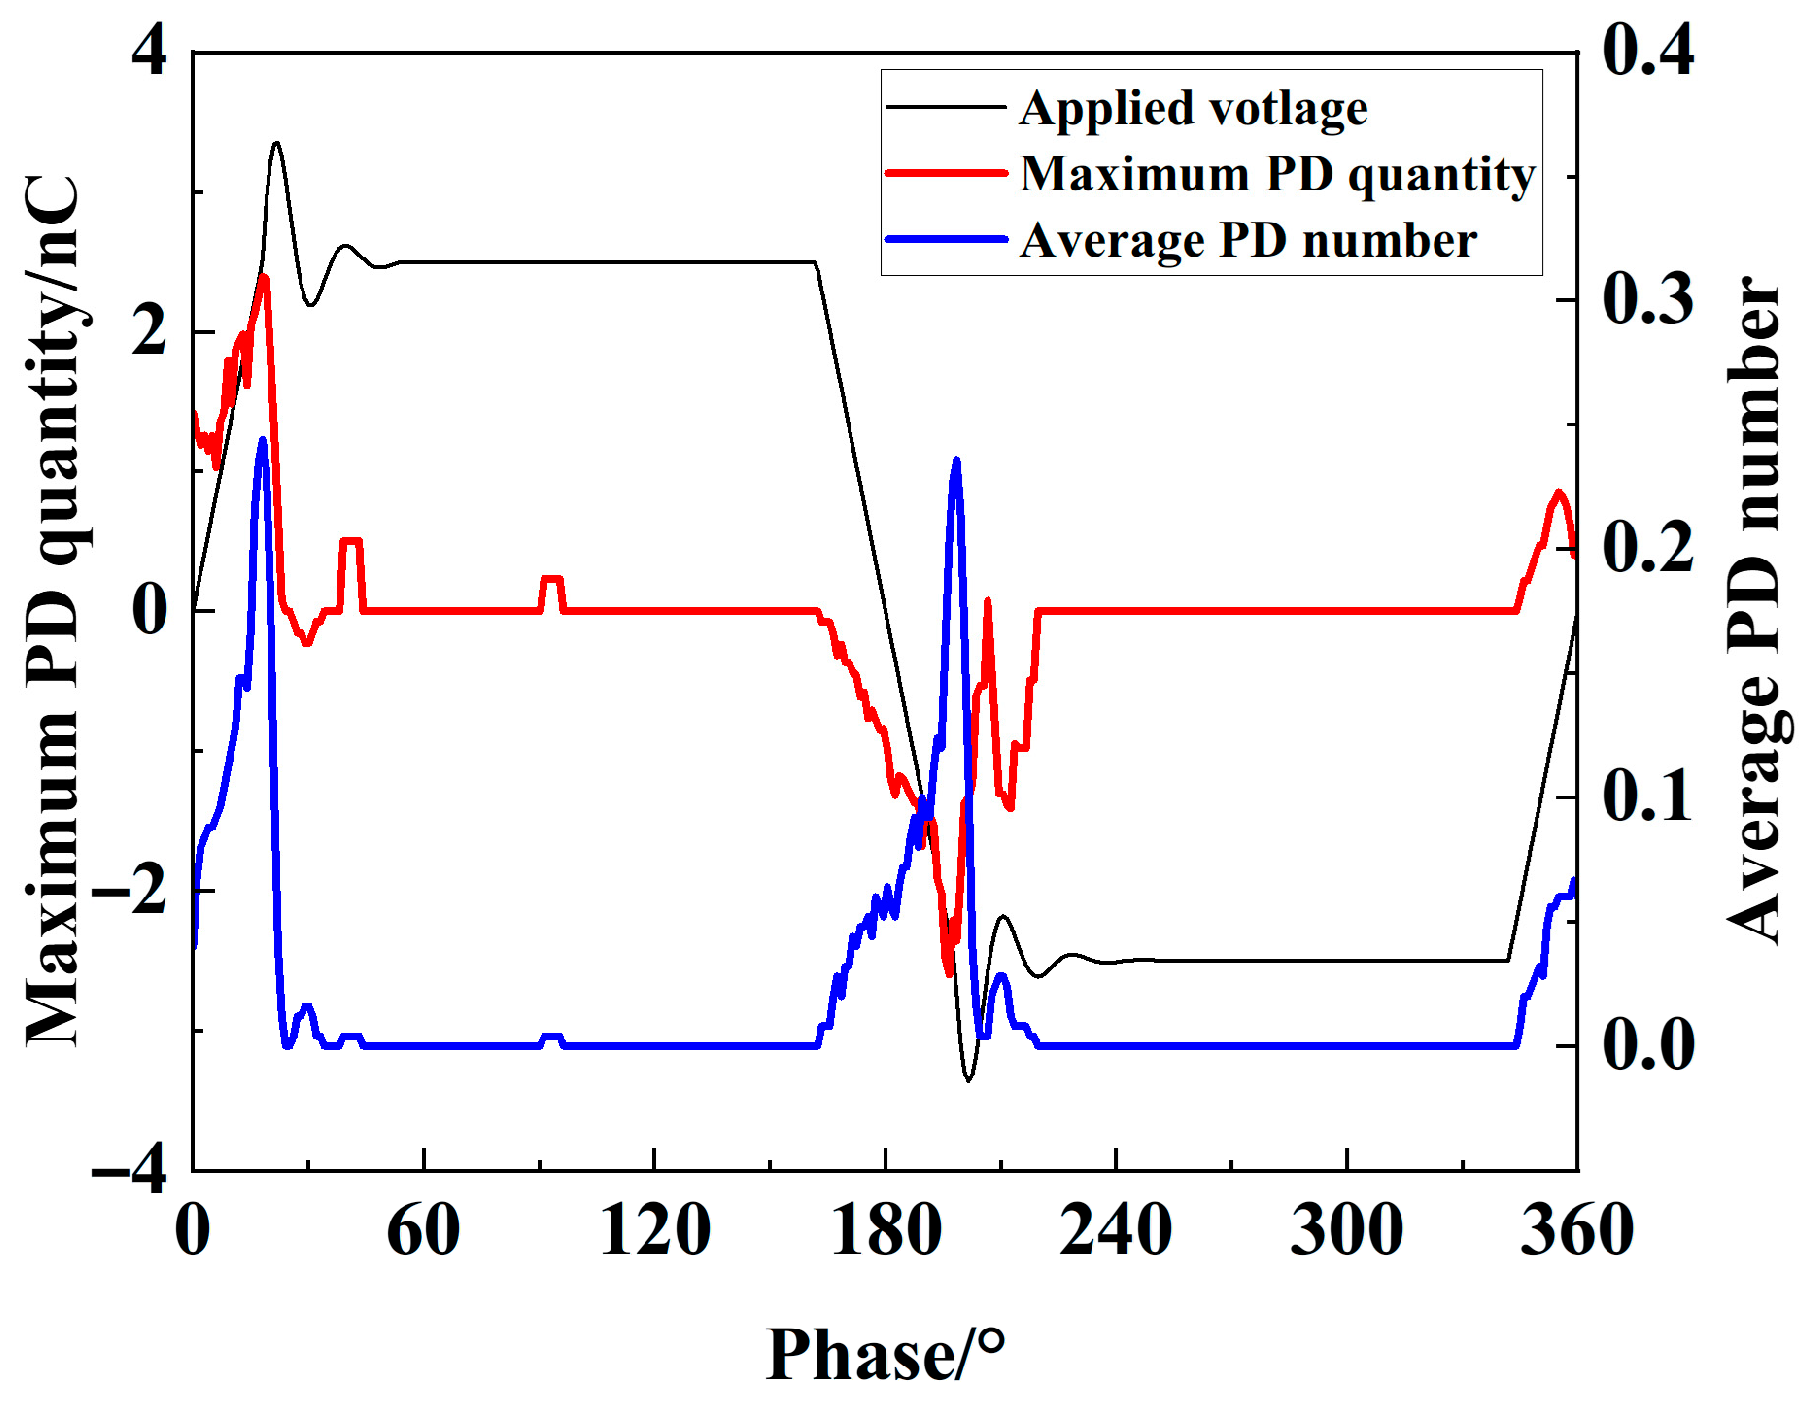
The simulation and experimental PRPD plots show an apparent “rabbit ear” shape distribution, which is related to the distribution of PD pulses with different amplitudes. Figure 11 shows the normalized average PD number and maximum PD quantity of the simulation results under different phases when the overshoot rate was 35%. In the figure, the PD event phases can be easily differentiated. PD events mainly occurred at the rising and falling edges and the overshoot portions of the repetitive frequency square wave. In these phases, especially in the overshoot portions, the average PD number and the maximum PD quantity were higher. In contrast, at the steady voltage stage, the PD quantity was low, and the average PD number was small.
From the simulation results in Figure 5, it can be seen that the void electric field strength in the steady voltage stage was higher than that at the rising edge, but the PD number and quantity were low, which is related to the second condition for PD occurrence, i.e., a sufficient number of free electrons. When the voltage exceeds the void breakdown voltage, breakdown does not occur immediately. This time delay between the presence of the initial electron and voltage collapse is called the PD time lag. Compared with the steady voltage stage, the voltage change rate (dU/dt) at the rising edge was faster, allowing the electric field strength of the void to quickly reach the void breakdown threshold. In addition, the diffusion ability of the residual surface charge on the void was lower, making it easier to provide an initial electron. However, in the steady voltage stage, the electric field of the void, Ecav, was almost constant, so it could not trigger a PD event. In conclusion, PD events along the rising and falling edges occur more easily than during the steady voltage stage.
For an ideal spherical void in a solid medium, the PD quantity, q, can be expressed as follows [21]:
q = ε 0 π 2 1 + ε r K a b 1 E cav ( t )
where K(a/b) is the shape parameter of the void; a and b are the semi-minor and semi-major axes of the cross-section of a spheroid; εr is the relative permittivity of the insulation; and Ecav(t) is the electric field strength of the void.
As shown in Equation (11), the PD quantity is mainly related to the electric field strength of the void, Ecav, which is affected by the applied electric field, the electric field of the surface charges in the void, and so on. As shown in Figure 12, Ecav is higher when the applied voltage polarity changes and the applied voltage amplitude is high. Therefore, in the simulation results, PD events with the maximum PD quantity were more likely to appear in the overshoot voltage portion.

6. Conclusions

In this study, void PD and its characteristics under a repetitive frequency square wave with different overshoot rates were simulated and experimentally investigated. The results show that the maximum PD quantity and the average PD number rose to ~15 and ~3110 pC, when the overshoot rate increased to 35%. The overshooting voltage is harmful to the insulating material. A repetitive frequency square wave with an overshoot voltage is more likely to have higher instantaneous void electric field strength during the overshoot portion, where PD pulses with a high amplitude are more likely to occur. Because the gas pressure, volume, and temperature in the void were kept constant, the PRPD distribution obtained by simulation under the repetitive frequency square wave was a hollow “Δ” shape, which is different from the solid “Δ” shape distribution of the measured PRPD, but the statistical trends of PD characteristics were consistent. The overshoot portion of the repetitive frequency square wave can cause the average PD number and the maximum PD quantity to increase, which will accelerate the insulation deteriorate. In the future, the simulation can be improved by incorporating multi-physical field coupling, including electric field, thermal field, plasma, and so on, which will provide more accurate PD simulating results for theoretical analysis and prediction of PD development. Moreover, the high-performance groundwall insulation, such as high thermal conductivity resin (>1 W/(m·K)), PD-resistant, and so on, should be applied to bear the PD corrosion.

Author Contributions

This paper is the result of a collaboration among all co-authors. Formal analysis, R.G.; investigation, R.G., T.J. and W.W.; methodology, R.G.; software, R.G. and R.A.; validation, R.G., P.W. and L.C.; data curation, R.G. and S.Y.; writing—original draft preparation, R.G. and Z.L.; writing—review and editing, W.W. and Z.L.; visualization, R.G. and Y.C.; funding acquisition, R.G. and W.W. All authors have read and agreed to the published version of the manuscript.

Funding

This work was supported in part by the Science and Technology Project of State Grid Shanxi Electric Power Co., Ltd., under grants 5205S124001 and 52053024000U.

Data Availability Statement

The original contributions presented in this study are included in the article. Further inquiries can be directed to the corresponding author.

Conflicts of Interest

The authors declare no conflicts of interest.

References

  1. Niu, F.; Zhang, P.; Zhou, F.; Huang, S.; Xu, Z.; Zhang, L.; Aggarwal, A. A novel method for monitoring stator interturn insulation degradation of inverter-fed motors based on impedance spectrum division. IEEE Trans. Ind. Electron 2025, 72, 6517–6529. [Google Scholar] [CrossRef]
  2. Rumi, A.; Righetti, L.; Cavallini, A.; Seri, P. Electromagnetic UHF emission of motor turn-turn insulation samples fed by SiC converter. In Proceedings of the IEEE Conference on Electrical Insulation and Dielectric Phenomena (CEIDP), Denver, CO, USA, 30 October–2 November 2022; IEEE: Piscataway, NJ, USA, 2022; pp. 1–4. [Google Scholar]
  3. Jarrar, I.; Cherney, E.; Jayaram, S. Effect of repetitive impulse waveform characteristics on partial discharges in type II turn-to-turn insulation. IEEE Trans. Dielectr. Electr. Insul. 2022, 29, 1183–1190. [Google Scholar] [CrossRef]
  4. Yang, D.; Lu, B.; Li, S.; Cui, Y.; Kang, Y.; Dong, H. PD measurement-based fatigue assessment of wind power cables under torsional and electrothermal aging. IEEE Trans. Instrum. Meas. 2025, 74, 201. [Google Scholar] [CrossRef]
  5. Ma, S.; Wang, P.; Cavallini, A.; Zhu, Y. PD electromagnetic emission of turn-to-turn insulation in inverter-fed motor. IEEE Trans. Dielectr. Electr. Insul. 2024, 31, 3049–3305. [Google Scholar] [CrossRef]
  6. Naderiallaf, H.; Degano, M.; Gerada, C. PDIV modeling for rectangular wire turn-to-turn insulation of inverter fed motors through thermal aging. Trans. Dielectr. Electr. Insul. 2024, 31, 550–559. [Google Scholar] [CrossRef]
  7. IEC 60034-18-41; Rotating Electrical Machines-Part 18-41: Partial Discharge Free Electrical Insulation Systems (Type I) Used in Rotating Electrical Machines Fed from Voltage Converters-Qualification and Quality Control Tests. IEC: Geneva, Switzerland, 2025.
  8. IEC TS 61934:2024; Electrical Insulating Materials and Systems—Electrical Measurement of Partial Discharges (PD) Under Short Rise Time and Repetitive Voltage Impulses. IEC: Geneva, Switzerland, 2024.
  9. Zheng, C.; Lei, Y.; Wang, P.; Wang, J.; Zhou, Q.; Lin, J. The effect of repetitive short pulse rise time on the statistical characteristics of insulation partial discharge in variable frequency motors. Insul. Mater. 2018, 51, 50–56. (In Chinese) [Google Scholar]
  10. Guo, H.; Wang, P.; Luo, Y.; Li, W.; Li, X. Study on the Influence of Repetitive Pulse Polarity and Duty Cycle on the Starting Voltage of Partial Discharge in Insulation of Variable Frequency Motors. New Technol. Electr. Eng. 2022, 41, 38–48. (In Chinese) [Google Scholar]
  11. Li, J.; Wang, P.; Wu, Q.; Zhou, W.; Yang, N. Study on the influence of repetitive pulse overvoltage on the initial and extinction voltage of insulation partial discharge of inverter fed motors. J. Electr. Eng. China 2019, 39, 4541–4550. (In Chinese) [Google Scholar]
  12. Li, P.; Wang, P.; Zhang, X.; Wang, J.; Zhang, H. Prediction of partial discharge onset voltage of variable frequency motor based on deep belief network. J. Instrum. 2021, 42, 121–130. (In Chinese) [Google Scholar]
  13. Zhou, W.; Diab, M.; Yuan, X.; Wei, C. Mitigation of motor overvoltage in SiC-based drives using soft-switching voltage slew-rate(dv/dt) profiling. IEEE Trans. Power Electron. 2022, 37, 9612–9628. [Google Scholar] [CrossRef]
  14. Madonna, V.; Giangrande, P.; Zhao, W.; Zhang, H.; Gerada, C.; Galea, M. Electrical machines for the more electric aircraft: Partial discharges investigation. IEEE Trans. Ind. Appl. 2021, 57, 1389–1398. [Google Scholar] [CrossRef]
  15. Illias, H.; Chen, G.; Lewin, P. Modeling of partial discharge activity in spherical cavities within a dielectric material. Electr. Insul. Mag. IEEE 2011, 27, 38–45. [Google Scholar] [CrossRef]
  16. Niemeyer, L. A generalized approach to partial discharge modeling. IEEE Trans. Dielectr. Electr. Insul. 1995, 2, 510–528. [Google Scholar] [CrossRef]
  17. Illias, H.; Chen, G.; Lewin, P. Partial discharge within a spherical cavity in a dielectric material as a function of cavity size and material temperature. IET Sci. Meas. Technol. 2012, 6, 52–62. [Google Scholar] [CrossRef]
  18. Musa, U.; Mati, A.; Mas’ud, A.; Shehu, G.; Albarracín-Sánchez, R.; Rodríguez-Serna, J. An improved technique for quantifying PD activity in cross-linked polyethylene (XLPE) power cables. Measurement 2023, 211, 112633. [Google Scholar] [CrossRef]
  19. Gutfleisch, F.; Niemeyer, L. Measurement and simulation of PD in epoxy voids. IEEE Trans. Dielectr. Electr. Insul. 1995, 2, 729–743. [Google Scholar] [CrossRef]
  20. Lei, Z.; Song, J.; Geng, P.; Tian, M.; Lin, L.; Xu, C. Influence of temperature on dielectric properties of EPR and partial discharge. IEEE Trans. Dielectr. Electr. Insul. 2015, 22, 3488–3497. [Google Scholar] [CrossRef]
  21. Wang, P.; Cavallini, A. The influence of repetitive square wave voltage parameters on PD statistical features. In Proceedings of the IEEE Conference on Electrical Insulation and Dielectric Phenomena, Shenzhen, China, 20–23 October 2013; IEEE: Piscataway, NJ, USA, 2013; pp. 1282–1285. [Google Scholar]
Figure 1. Repetitive frequency square wave.
Energies 19 00135 g001
Figure 2. Two-dimensional axisymmetric geometric model.
Energies 19 00135 g002
Figure 3. Movement of free charge: (a) fcE0 is opposite in direction to Es. (b) fcE0 is in the same direction as Es.
Energies 19 00135 g003
Figure 4. Flowchart for PD simulation.
Energies 19 00135 g004
Figure 5. Electric field strength distribution curves at different voltages.
Energies 19 00135 g005
Figure 6. Void PD under different overshoot rates.
Energies 19 00135 g006
Figure 7. PRPD plots of void PD simulation under different overshoot rates.
Energies 19 00135 g007
Figure 8. Experimental circuit connection diagram.
Energies 19 00135 g008
Figure 9. PRPD plot of void PD under different overshoot rates.
Energies 19 00135 g009
Figure 10. Statistical characteristics of void PD from simulation results and experimental results. (a) Average PD number; (b) maximum and total PD quantity.
Energies 19 00135 g010
Figure 11. Maximum PD quantity and average PD number in one period.
Energies 19 00135 g011
Figure 12. Simulation results of the void electric field.
Energies 19 00135 g012
Table 1. PD simulation parameters.
ParameterValueParameterValue
A/(V/Pa/m)24.2σs0/(S/m)10−13
B/(Pa0.5·m0.5)8.6σsmax/(S/m)6 × 10−10
p/kPa101α/(mm/kV)10
Nev120β/(1/K)1/293
τdec/ms2σcav0/(S/m)0
Nes0L300σcavmax/(S/m)5 × 10−3
Nes0H2100Δt1/μs40
Tmat/Tamb1Δt2/ns1
Table 2. PD statistical characteristics under different overshoot rates.
Uosnqmax/pCqtotal/nC
010.762297198.6
15%12.22680237.8
35%14.523110280.7
Disclaimer/Publisher’s Note: The statements, opinions and data contained in all publications are solely those of the individual author(s) and contributor(s) and not of MDPI and/or the editor(s). MDPI and/or the editor(s) disclaim responsibility for any injury to people or property resulting from any ideas, methods, instructions or products referred to in the content.