Article

Comparative Sensitivity Analyses of Energy Consumption in Response to Average Speed Between Electric Vehicles and Conventional Vehicles: Case Study in Beijing, China

1
Key Laboratory of Transport Industry of Big Data Application Technologies for Comprehensive Transport, Ministry of Transport, Beijing Jiaotong University, 3 Shangyuan Cun, Haidian District, Beijing 100044, China
2
School of Civil and Environmental Engineering, Georgia Institute of Technology, 790 Atlantic Drive, Atlanta, GA 30332, USA
3
Beijing Capital Highway Development Group Company Limited, 9A, Liuliqiao Nanli, Fengtai District, Beijing 100161, China
4
MOE Engineering Research Center of Clean and Low-Carbon Technology for Intelligent Transportation, Beijing Jiaotong University, 3 Shangyuan Cun, Haidian District, Beijing 100044, China
*
Authors to whom correspondence should be addressed.
Energies 2025, 18(9), 2268; https://doi.org/10.3390/en18092268
Submission received: 17 March 2025 / Revised: 25 April 2025 / Accepted: 25 April 2025 / Published: 29 April 2025
(This article belongs to the Section E: Electric Vehicles)

Abstract

:
Understanding the sensitivity of vehicle energy consumption to average speed variations is critical for accurately assessing the environmental impacts of urban transportation systems. While the energy consumption patterns of conventional vehicles (CVs) have been extensively studied, the response characteristics of electric vehicles (EVs) and their fundamental differences from CVs remain insufficiently explored. This knowledge gap may lead to misguided policy interventions—for instance, implementing congestion mitigation strategies that may paradoxically increase EV energy demand. To address this research gap, we developed an energy consumption model based on vehicle-specific power (VSP) distribution analysis, calibrated with over 25 million second-by-second driving records from Beijing. The proposed comparative framework systematically evaluates the sensitivity of EV and CV energy consumption across different speed regimes. The results indicated that EV energy use exhibits a distinctive parabolic trend, with high energy use at both low and high speeds, and a notable increase beyond approximately 70 km/h. A case study indicates that, during the pandemic lockdown, which led to a significant increase in average speed, CV energy use generally decreased, whereas EV energy consumption increased. This discrepancy is primarily attributed to differences in energy consumption rates rather than variations in driving behavior, as reflected in VSP distributions.

1. Introduction

As a fundamental traffic flow parameter, the average speed is often used as an indicator of traffic conditions in traffic control and management (ramp metering, roadway tolling, etc.), and it is also one of the most important parameters in vehicle energy consumption modeling that links vehicle engine load fractions (e.g., vehicle specific power and opMode distributions) with on-road traffic operations [1,2]. Generally, vehicles driving at low average speeds (stop-and-go driving) and high average speeds (heavy engine load for cruising) both consume more energy and produce more emissions. The energy use rate–speed curve has a distinctive parabolic shape, with high energy use rates on both ends and low energy use rates at moderate speeds (e.g., approximately from 40 to 60 mph). An example of the energy use rate-speed curve (fleet average at Atlanta, GA) from MOVES-Matrix (which generates the same results as EPA’s Motor Vehicle Emission Simulator model, MOVES) [3,4] is shown in Figure 1.
Understanding the sensitivity of vehicle energy consumption to average speed is crucial for environmental assessments of transportation systems, as misinterpretations could lead to ineffective policies. For instance, alleviating traffic congestion (i.e., increasing average speed) typically reduces energy consumption by minimizing stop-and-go driving. While further speed increases (e.g., exceeding 75 mph on highways) may reverse this trend due to higher engine loads required to maintain speed.
Electric vehicles (EVs) differ from conventional vehicles (CVs) in terms of engine dynamics and efficiency. EVs exhibit superior acceleration (owing to the high-speed capability of electric motors), higher powertrain efficiency, and regenerative braking systems. These distinctions necessitate a separate analysis of EV energy sensitivity compared to CVs. Although studies confirm that EVs generally consume less energy than CVs under identical driving conditions [5,6,7,8], few have examined how their energy sensitivity differs, particularly in critical scenarios. For example, EVs may reach their “turning point” (where energy use begins rising again with speed) at lower speeds than CVs. Consequently, policies promoting higher average speeds could inadvertently increase energy consumption for EVs in certain speed ranges.
A comparative analysis of EV and CV energy sensitivity is essential to avoid contradictory or counterproductive policies. By investigating the sources of these differences—whether from vehicle dynamics (e.g., acceleration patterns) or energy use rates (e.g., powertrain efficiency)—policymakers can develop targeted strategies for universal energy savings across both vehicle types. This requires modeling energy consumption as a function of two distinct factors: (1) vehicle activity (e.g., speed profiles) and (2) energy use rates, with explicit consideration of how EVs decouple these influences differently than CVs.
This study was motivated by three questions, as follows.
(1)
How does EV energy consumption vary with average speed, and how is the sensitivity of EV energy use different from that of CVs?
(2)
What is the impact of the sensitivity differences (if there are any) on energy use modeling and policy-making?
(3)
How do vehicle activity and energy use rates contribute to the sensitivity discrepancies, and what do the contributions tell us?
In this study, the energy use sensitivity in response to the average speed of EVs and CVs was comparatively analyzed based on more than 25 million records of second-by-second field vehicle activity data in Beijing, China. The energy use factors (in kWh/100 km) by average speed were developed separately for EVs and CVs by integrating vehicle-specific power (VSP) distributions [9] vs. energy use rate profiles, and the sensitivity was compared by facility type (Expressway vs. Non-expressway). A case study in Beijing (during the pandemic lockdown in 2019) was performed to investigate the impact of the sensitivity differences on policy effectiveness (i.e., did the congestion mitigation increase EV energy use while it reduced CV energy use?) based on large-scale link-by-link monitored speed and traffic volume profiles by hour. The contributions of vehicle activity and energy consumption rate to the sensitivity differences were analyzed separately by setting the other variable as constant (i.e., integrating CV activity data and EV energy use rates vs. integrating EV activity data and CV energy use rates).

Literature Review

As the market share of EVs continues to rise [10], energy consumption modeling of passenger EVs has been a rather mature field, making key contributions in the literature [11,12,13]. Ahn et al. [11] proposed an eco-look-ahead controller for the lead vehicle of a platoon of BEVs to predict the optimum speed and acceleration levels. Chen and Rakha [13] developed a connected eco-driving controller for BEVs, with which the BEV could traverse signalized intersections with minimal energy consumption. Ahn et al. [12] quantified the impact of intersection control approaches on BEVs’ energy consumption.
Despite this importance, existing models are not properly capturing the sensitivity of EV and its differences vs. CV. EV energy consumption models can be divided into two categories: forward models and backward models [14]. Forward models (modeling energy use based on vehicle dynamics such as engine operating parameters (e.g., ADVISOR vehicle simulator developed by NREL [15])) do not properly couple with traffic operating parameters [16] (most of which serve as important references in the decision-making processes), and therefore cannot be used for a valid sensitivity analysis.
Sensitivity analysis can only be appropriately performed using backward models. While most of the backward models also suffer from the deficiency mentioned above when under the circumstance of requiring a large amount of data to find the accurate relationships among EV’s power, speed, acceleration, and driving conditions [17]. To provide a speed–time profile that is representative of urban driving, many city-specific driving cycles were developed [18]. They are used to assimilate driving conditions on a laboratory chassis dynamometer for the evaluation of energy consumption, exhaust emissions, and emission coefficients [19]. Rezaei et al. [20] evaluated the impact of a novel heating, ventilation, and air conditioning (HVAC) system on electric vehicle (EV) range using a Nissan Leaf tested with the Urban Dynamometer Driving Schedule (UDDS) driving cycle. Al-Wreikat et al. [21] employed Real Driving Cycles (RDCs) test protocols to assess the effects of driving behavior, trip distance, ambient temperature, traffic conditions, and road gradient on EV energy consumption under different operational modes. Shen et al. [22] examined the influence of a new integrated empirical mode decomposition-fuzzy logic control energy management strategy on EV battery aging through testing under HWFET, UDDS, US06, and combined driving cycles. Zhao et al. [18] developed EV-specific representative driving cycles based on Xi’an city test data and subsequently investigated EV energy consumption patterns. City-specific driving cycles can simulate the general characteristics of traffic and are effective for estimating the average fuel consumption for a certain area. However, using driving cycles in these backward models largely limits the sensitivity analysis, given that fixed driving cycles are not sufficient to capture the dynamic characteristics of the traffic.
Integrating engine load and on-road traffic operations using key parameters such as vehicle-specific power can be used to denote sensitivity. There has been much focus on energy consumption modeling and estimation of CVs based on VSP distribution. Zhang et al. [9] used field data of 26,082 drivers to discuss the intra- and inter-heterogeneity of driving behavior. Fan et al. [23] developed an instantaneous fuel consumption model with a second-scale time resolution to capture road grade-related fuel consumption differences.
While the research aiming at EVs is still far from mature. The impacts of EVs’ characteristics (such as braking energy recovery systems) on energy consumption and energy sensitivity need to be thoroughly discussed. In this paper, the proposed EV energy consumption model based on VSP distribution could address the deficiency mentioned above, as it results in a function between energy consumption and travel speed, which could well combine the effect of vehicle activities and traffic conditions on energy use sensitivity. Our study builds upon these established frameworks and introduces methodological innovations through the systematic integration of multi-source data. Specifically, we have combined Beijing’s extensive high-resolution vehicle trajectory data with laboratory-grade energy consumption rate measurements from chassis dynamometer tests. This hybrid approach overcomes the limitations of conventional energy assessment methods constrained by standardized driving cycles, enabling more realistic evaluations of vehicle energy consumption under actual urban traffic conditions. By georeferencing the trajectory data to Beijing’s road network with precise latitude/longitude coordinates, we achieved granular road-type classification (e.g., expressways vs. arterial roads), allowing explicit analysis of infrastructure-level impacts on energy consumption patterns. Furthermore, through controlled variable methodology, we structured the attribution of energy-speed curve disparities between EVs and CVs, providing new traffic engineering insights for EV-oriented transportation management strategies.

2. Methods

2.1. Energy Consumption Model for EVs

2.1.1. Facility- and Speed-Specific VSP Distribution

This section describes the methodology for constructing vehicle VSP distributions under different average speeds across various road types, utilizing vehicle trajectory data. The content includes (1) the dataset employed in this study, (2) spatiotemporal matching of trajectory data on Beijing GIS maps, (3) segmentation of trajectory, and (4) calculation of VSP.
(1)
Data Preparation
This study leverages real-world second-by-second vehicle operating data gathered between March 2020 and March 2022 in Beijing, China. These data were collected through the Statistics and Monitoring Platform for Energy and Emissions in Transportation (SMPEET), an initiative launched by the Beijing Municipal Commission of Transportation. The trajectory database utilized is not static but a dynamically updated system incorporating continuous data collection efforts across Beijing [9]. The SMPEET involves the installation of onboard diagnostics (OBD) devices in thousands of vehicles, capturing engine data and GPS information on a second-by-second basis following each vehicle ignition. In this paper, more than 25 million seconds of light-duty vehicle records are collected, including almost 8 million for EVs and 17 million for CVs. The trajectory data in the text come from 198 light-duty vehicles, including 22 pure electric vehicles. Previous studies have demonstrated that, for light-duty vehicles, brand type has little impact on VSP distribution [24], so our sample data do not distinguish between brand types. The data fields are as follows: vehicle ID, GPS speed, GPS time, longitude, and latitude. The dataset is matched with the road network covering all road types, including expressways, major arterial roads, minor arterial roads, and local roads, which can be used to develop facility- and speed-specific VSP distributions.
The vehicle’s acceleration range is constrained by engine capabilities and traffic conditions. Trajectories exhibiting an absolute acceleration value exceeding 3 m/s2 are excluded from further analysis, as they may not align with typical driving behaviors and could introduce inaccuracies in the analysis.
(2)
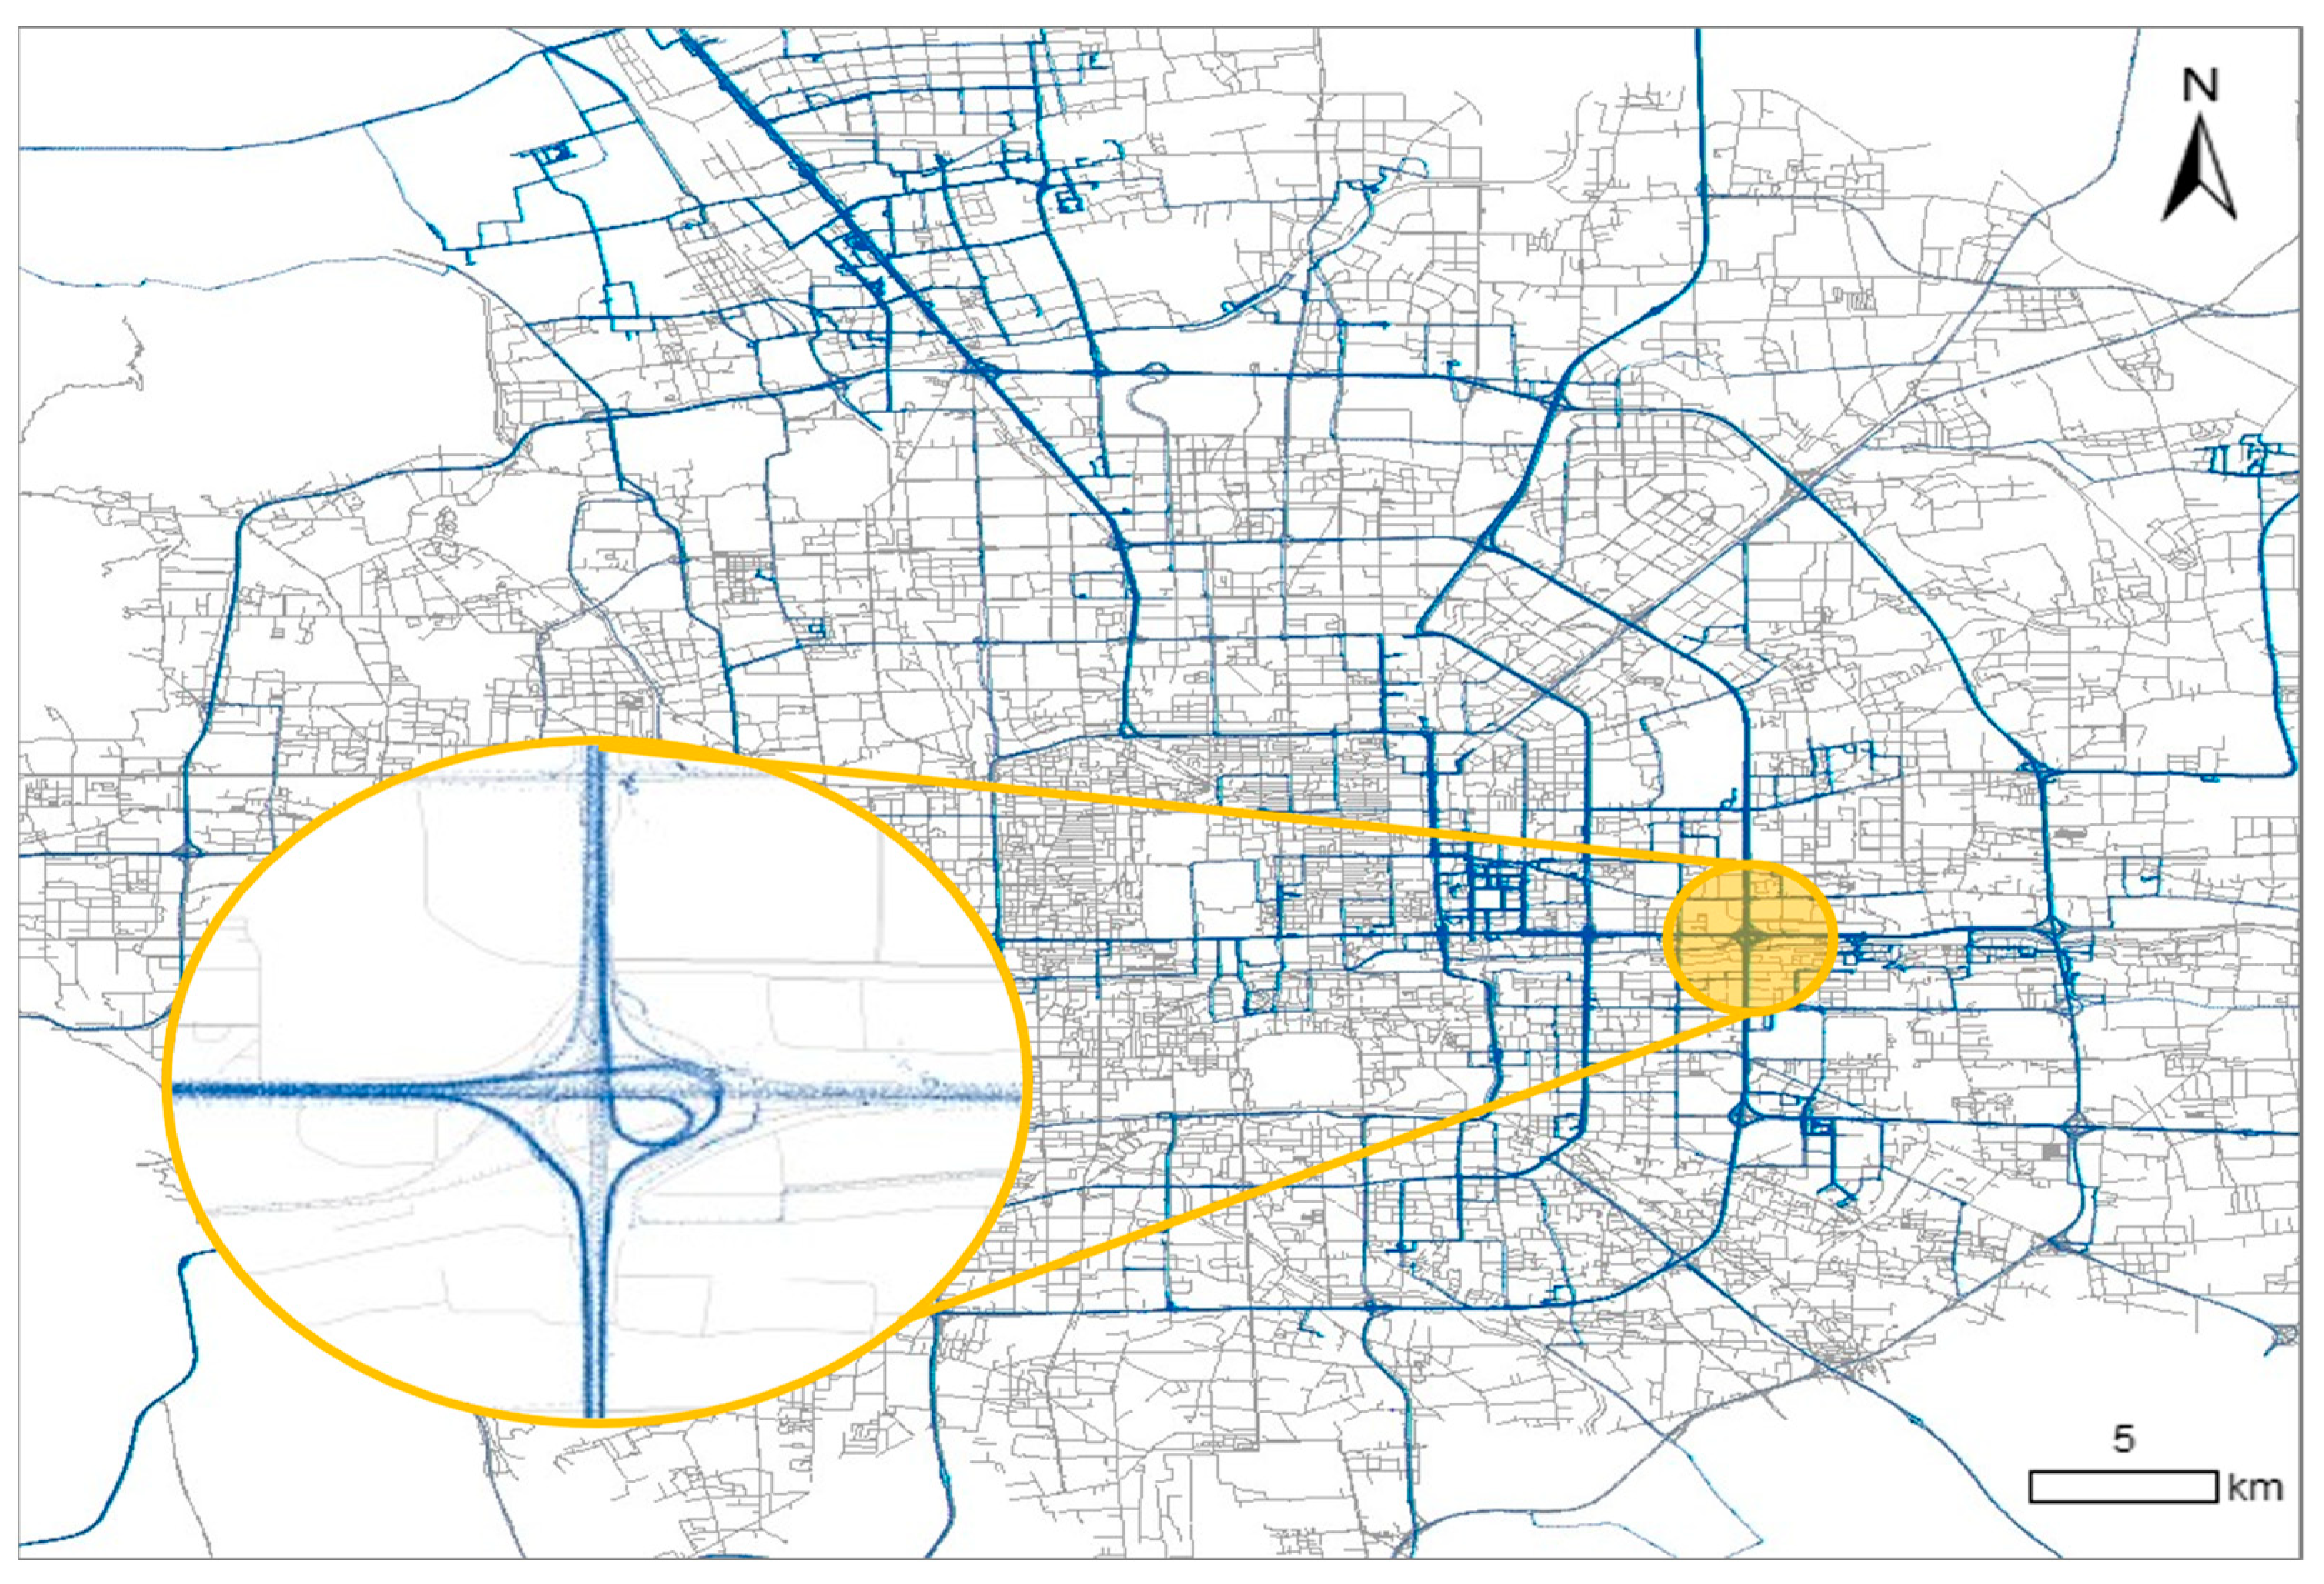
Spatiotemporal Trajectory–Road Network Integration
This study performs high-precision map matching between second-by-second vehicle trajectory data (containing GPS coordinates, timestamps, and kinematic parameters) and Beijing’s urban road network. This process enables the systematic annotation of road type attributes for every temporal instance in the trajectory dataset. The derived road-type-labeled trajectory data establish a critical foundation for subsequent transportation pattern analysis, including but not limited to trajectory segmentation by road hierarchy and driving behavior analysis. Figure 2 illustrates the three-stage workflow: (1) preprocessing of raw GPS signals with Kalman filtering for noise reduction, (2) topological matching considering both spatial proximity and temporal continuity constraints, and (3) post-matching validation through trajectory-speed vs. road-type plausibility checks.
(3)
Trajectory segmentation
The second-by-second vehicle trajectory data were segmented using road-type-specific temporal thresholds to establish speed-specific VSP distributions. For expressways characterized by uninterrupted flow, 60 s trajectory segments were adopted to ensure speed stability while filtering out transient driving maneuvers such as lane-changing or overtaking. Conversely, 180 s segments were implemented for arterial and secondary roads to encapsulate complete signal cycle phases (typically 120–180 s), thereby capturing multimodal driving conditions including acceleration, deceleration, and idling behaviors at signalized intersections. The segment-averaged speed V t was computed through Equation (1)):
V t = 1 t V i t
where V t is average speed of each trip segment, (m/s); t is the time duration of the trip segment (60 for expressways and 180 for non-expressways); V i is instantaneous vehicle speed at time i (m/s), i = 1, 2, …… t.
To obtain the speed-specific VSP distribution, the average speed of each trajectory segment is classified into a speed bin with an interval of 2 km/h, as shown in Equation (2)).
V t n , n + 2 , V t B i n = n
(4)
Definition and Clustering Analysis of VSP
VSP, defined as instantaneous tractive power normalized by vehicle mass (kW/ton), has been widely recognized as a robust metric for characterizing vehicular energy demand dynamics [25]. Unlike conventional kinematic parameters, such as speed or acceleration, VSP intrinsically integrates powertrain load characteristics through its explicit dependence on road grade, aerodynamic drag, and inertial forces, thereby providing superior resolution in operational mode classification. The methodology quantifies vehicle activities by discretizing continuous speed profiles into 2 km/h intervals, with each interval’s energy consumption modeled as a temporal distribution across 1 kW/ton VSP bins. This binning strategy assigns a homogeneous energy consumption rate (ECR) to trajectories within identical VSP ranges, effectively resolving the nonlinear relationship between driving dynamics and energy consumption. Implementation follows the MOVES model specifications [26], where VSP values are calculated through the coupled solutions of Equations (3) and (4), incorporating vehicle-type-specific coefficients for rolling resistance and aerodynamic drag adjustments.
a t = v t + 1 v t
V S P t = ( A v t + B v t 2 + C v t 3 ) + m v t ( a t + g s i n θ ) m
where v t is instantaneous vehicle speed at t second (m/s); a t is instantaneous acceleration at t second (m/s2); m is weight of individual test vehicle (tons); g is acceleration due to gravity (9.8 m/s2); s i n θ is the road grade; A, B, and C are road load coefficients, representing rolling resistance, rotational resistance, and aerodynamic drag, in the units of kW∙s/m, kW∙s2/m2, and kW∙s3/m3, respectively. The values of A, B, and C are, respectively, 0.156461, 0.00200193, and 0.000492646, which are referenced from the MOVES technical documentation.
Previous studies revealed significant dispersion in ECR under identical VSP conditions, attributable to heterogeneous driving behaviors and battery thermal transients. To establish deterministic VSP-ECR correlations, we implemented a stratified binning protocol through Equation (6), segmenting the VSP continuum into 1 kW/ton intervals (−30 ≤ VSP ≤ 30 kW/ton). This threshold encapsulates 98.2% of observed operational regimes while excluding extreme recuperation/acceleration outliers (<1.8% occurrence).
ACC n 0.05 ,   n + 0.05 , A c c B i n = n ( n 3 , + 3 n )
VSP n 0.5 ,   n + 0.5 , V S P B i n = n ( n 30 , + 30 n )

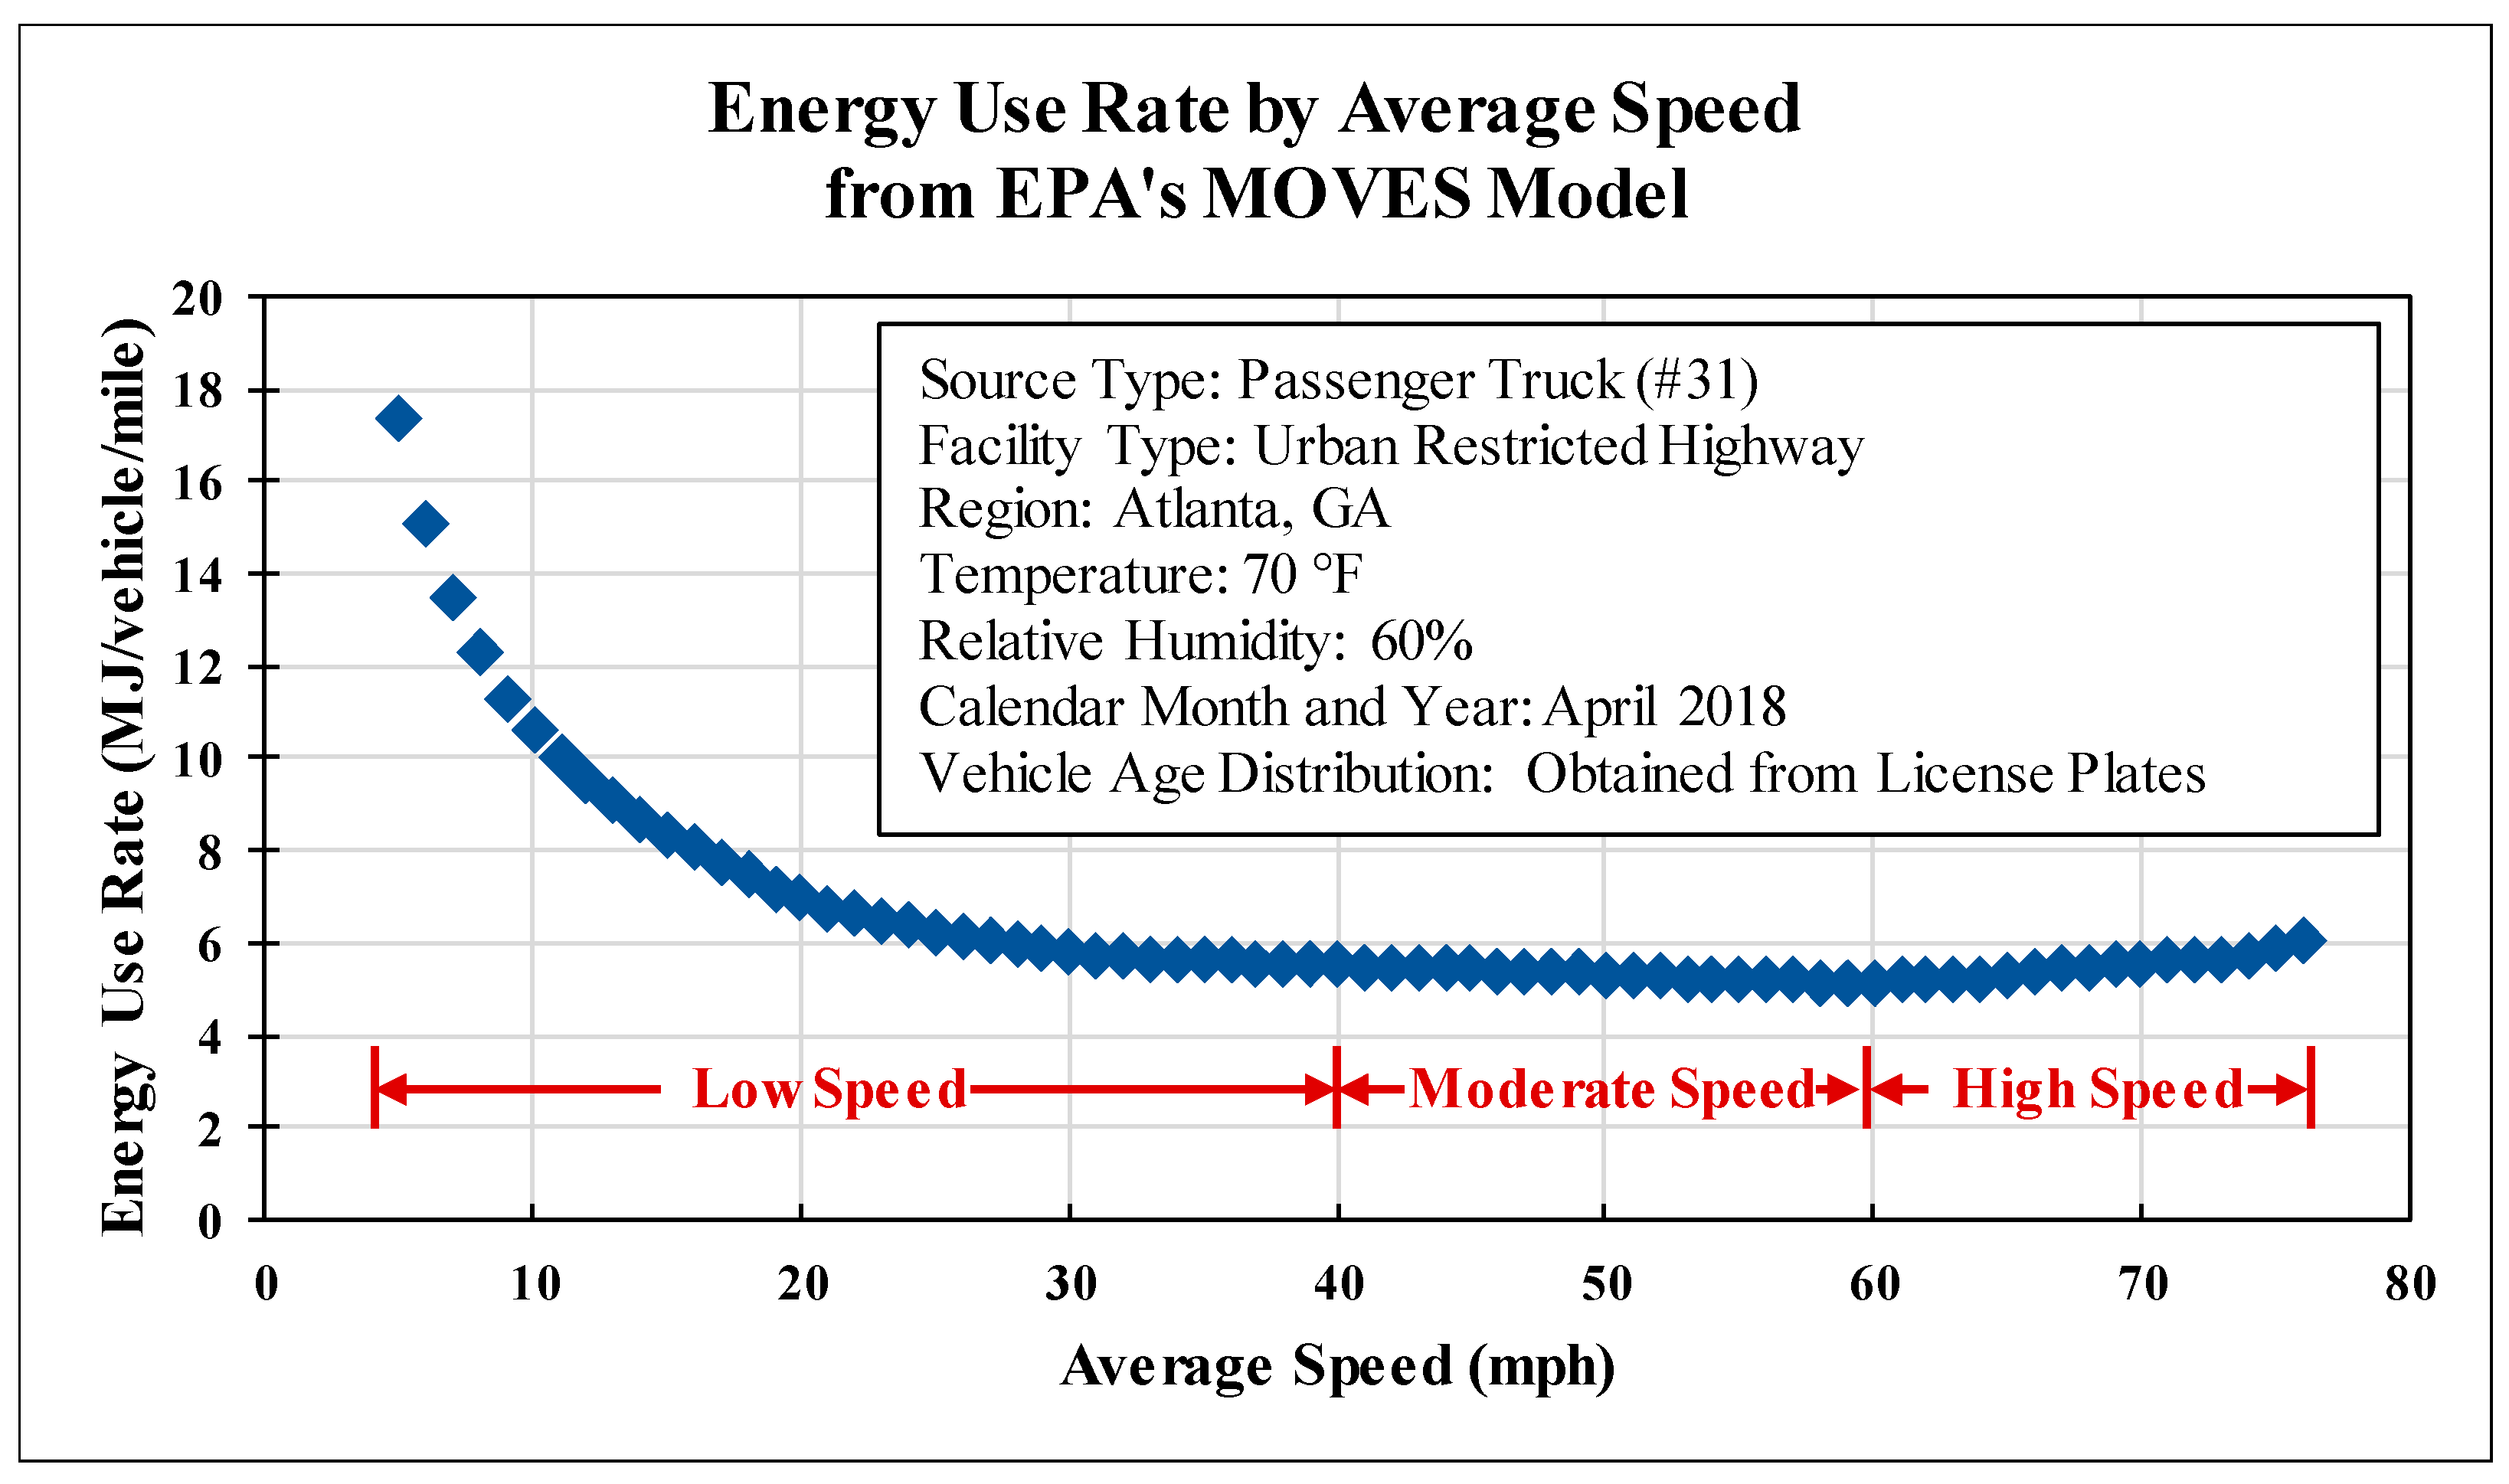
2.1.2. Facility- and Speed-Specific Energy Factor

(1)
Data Preparation
The energy consumption rate data for EVs used to calculate the energy consumption factors were obtained from the downloadable dynamometer database [27] funded by the U.S. Department of Energy, with primary datasets sourced from the Advanced Powertrain Research Facility (APRF) at Argonne National Laboratory, compliant with SAE J1634-202104 standards [28]. The test vehicle was a 2015 Mercedes-Benz B-Class Electric Drive (equipped with an 82 kW PMSM motor and 28 kWh lithium-ion battery pack), which underwent 76 repetitions of the Urban Dynamometer Driving Schedule (UDDS) at a 10 Hz sampling resolution.
The fuel consumption rates of CVs were derived based on the carbon balance principle, calculated from their CO2 emission rates. In this study, the emission rates were sourced from the pollutant database developed by Beijing Jiaotong University, which contains emission test results for 166 gasoline vehicles [9].
This vehicle was selected as a representative case for three reasons. (1) As an early-generation mass-produced EV, its performance reflects conservative estimates of energy-saving potential compared to newer technologies. (2) The dataset provides complete drive-cycle-level measurements with validated instrumentation, ensuring traceability. (3) Its mid-size luxury segment characteristics offer a balanced reference point between efficiency and real-world usage patterns. While this approach ensures analytical rigor for baseline comparisons, we note that technological heterogeneity across EV brands/vintages is not captured here, a limitation addressed in the conclusions.
Instantaneous energy consumption rates were computed through coupled electrothermal measurements, as shown in Equations (7) and (8):
P i n s t = I p a c k ( t ) V p a c k ( t )
E C R i = 1 N i k = 1 N i t k t k + Δ t P i n s t ( t ) d t
where I p a c k and V p a c k denote battery terminal current and voltage, respectively, monitored via ISO 6469-3 [29] certified sensors (±0.2% FS accuracy).
(2)
Definition of Energy Factor
An energy factor (EF) is defined to indicate the energy consumption per unit distance, as shown in Equation (9), in which the unit of average travel speed is km/h. The importance of the energy factor lies in the fact that for the environmental impact assessment of traffic management and control strategies, the indicator of energy consumption per unit of distance is more meaningful than the indicator per unit of time.
E F v = 1 L t = 1 T E C R i d t = 1 L j = 1 n E C R i T D j
= 1 L j = 1 n E C R i 3600 L v D j = ( j = 1 n E C R i D j ) 3600 v
where v denotes the average vehicle speed (km/h); E F v represents the energy factor (kWh/km).

2.2. Definition and Influence Factors of Energy Consumption Sensitivity Against Speed

2.2.1. Definition of Energy Consumption Sensitivity Against Speed

Sensitivity analysis facilitates the identification of critical control points, prioritizes supplemental data collection or research efforts, and supports model verification and validation [30,31]. This section defines energy consumption sensitivity to speed. Given that speed and traffic flow can be mutually derived via the Macroscopic Fundamental Diagram (MFD)—which directly captures variations in road network operational states—this study conceptualizes energy consumption sensitivity to speed as the relationship between energy usage dynamics and traffic flow conditions. The sensitivity coefficient quantifies the proportional change in energy factors per unit variation in average speed, calculated using Equation (10).
S v = E F v 1 E F v Δ v 100 %
where S v is the sensitivity coefficient under average travel speed v (km/h); E F v is the energy factor (kWh/km).

2.2.2. Influence Factors of Energy Consumption Sensitivity Against Speed

To investigate the underlying causes of energy sensitivity differences between EVs and CVs, this study develops a dual-path attribution analysis framework using a controlled variable approach. The methodology separately examines two critical dimensions: (1) vehicle activity patterns characterized by VSP distributions, and (2) powertrain efficiency characteristics quantified through ECR. When controlling for energy conversion characteristics, both vehicle types adopt the baseline ECR parameters, isolating the contribution of driving patterns to energy sensitivity disparities. Conversely, when maintaining fixed VSP distributions, the two vehicle classes utilize typical EV operational profiles to disentangle the influence of powertrain efficiency differences [32]. This decoupling methodology quantitatively reveals the independent mechanisms through which mobility patterns and energy conversion efficiency govern energy sensitivity, providing theoretical foundations for charging infrastructure planning, mixed-fleet energy prediction, and carbon accounting model optimization.
While the controlled-variable analysis of VSP distribution vs. energy consumption rate represents an idealized scenario unattainable in real-world data, this methodological approach provides critical theoretical insights. The comparative curves (fixed-VSP vs. fixed-ECR) were never intended as practical references for energy prediction, but rather as analytical tools to disentangle the dual influences of vehicle dynamics and powertrain efficiency on EV energy sensitivity.

3. Results

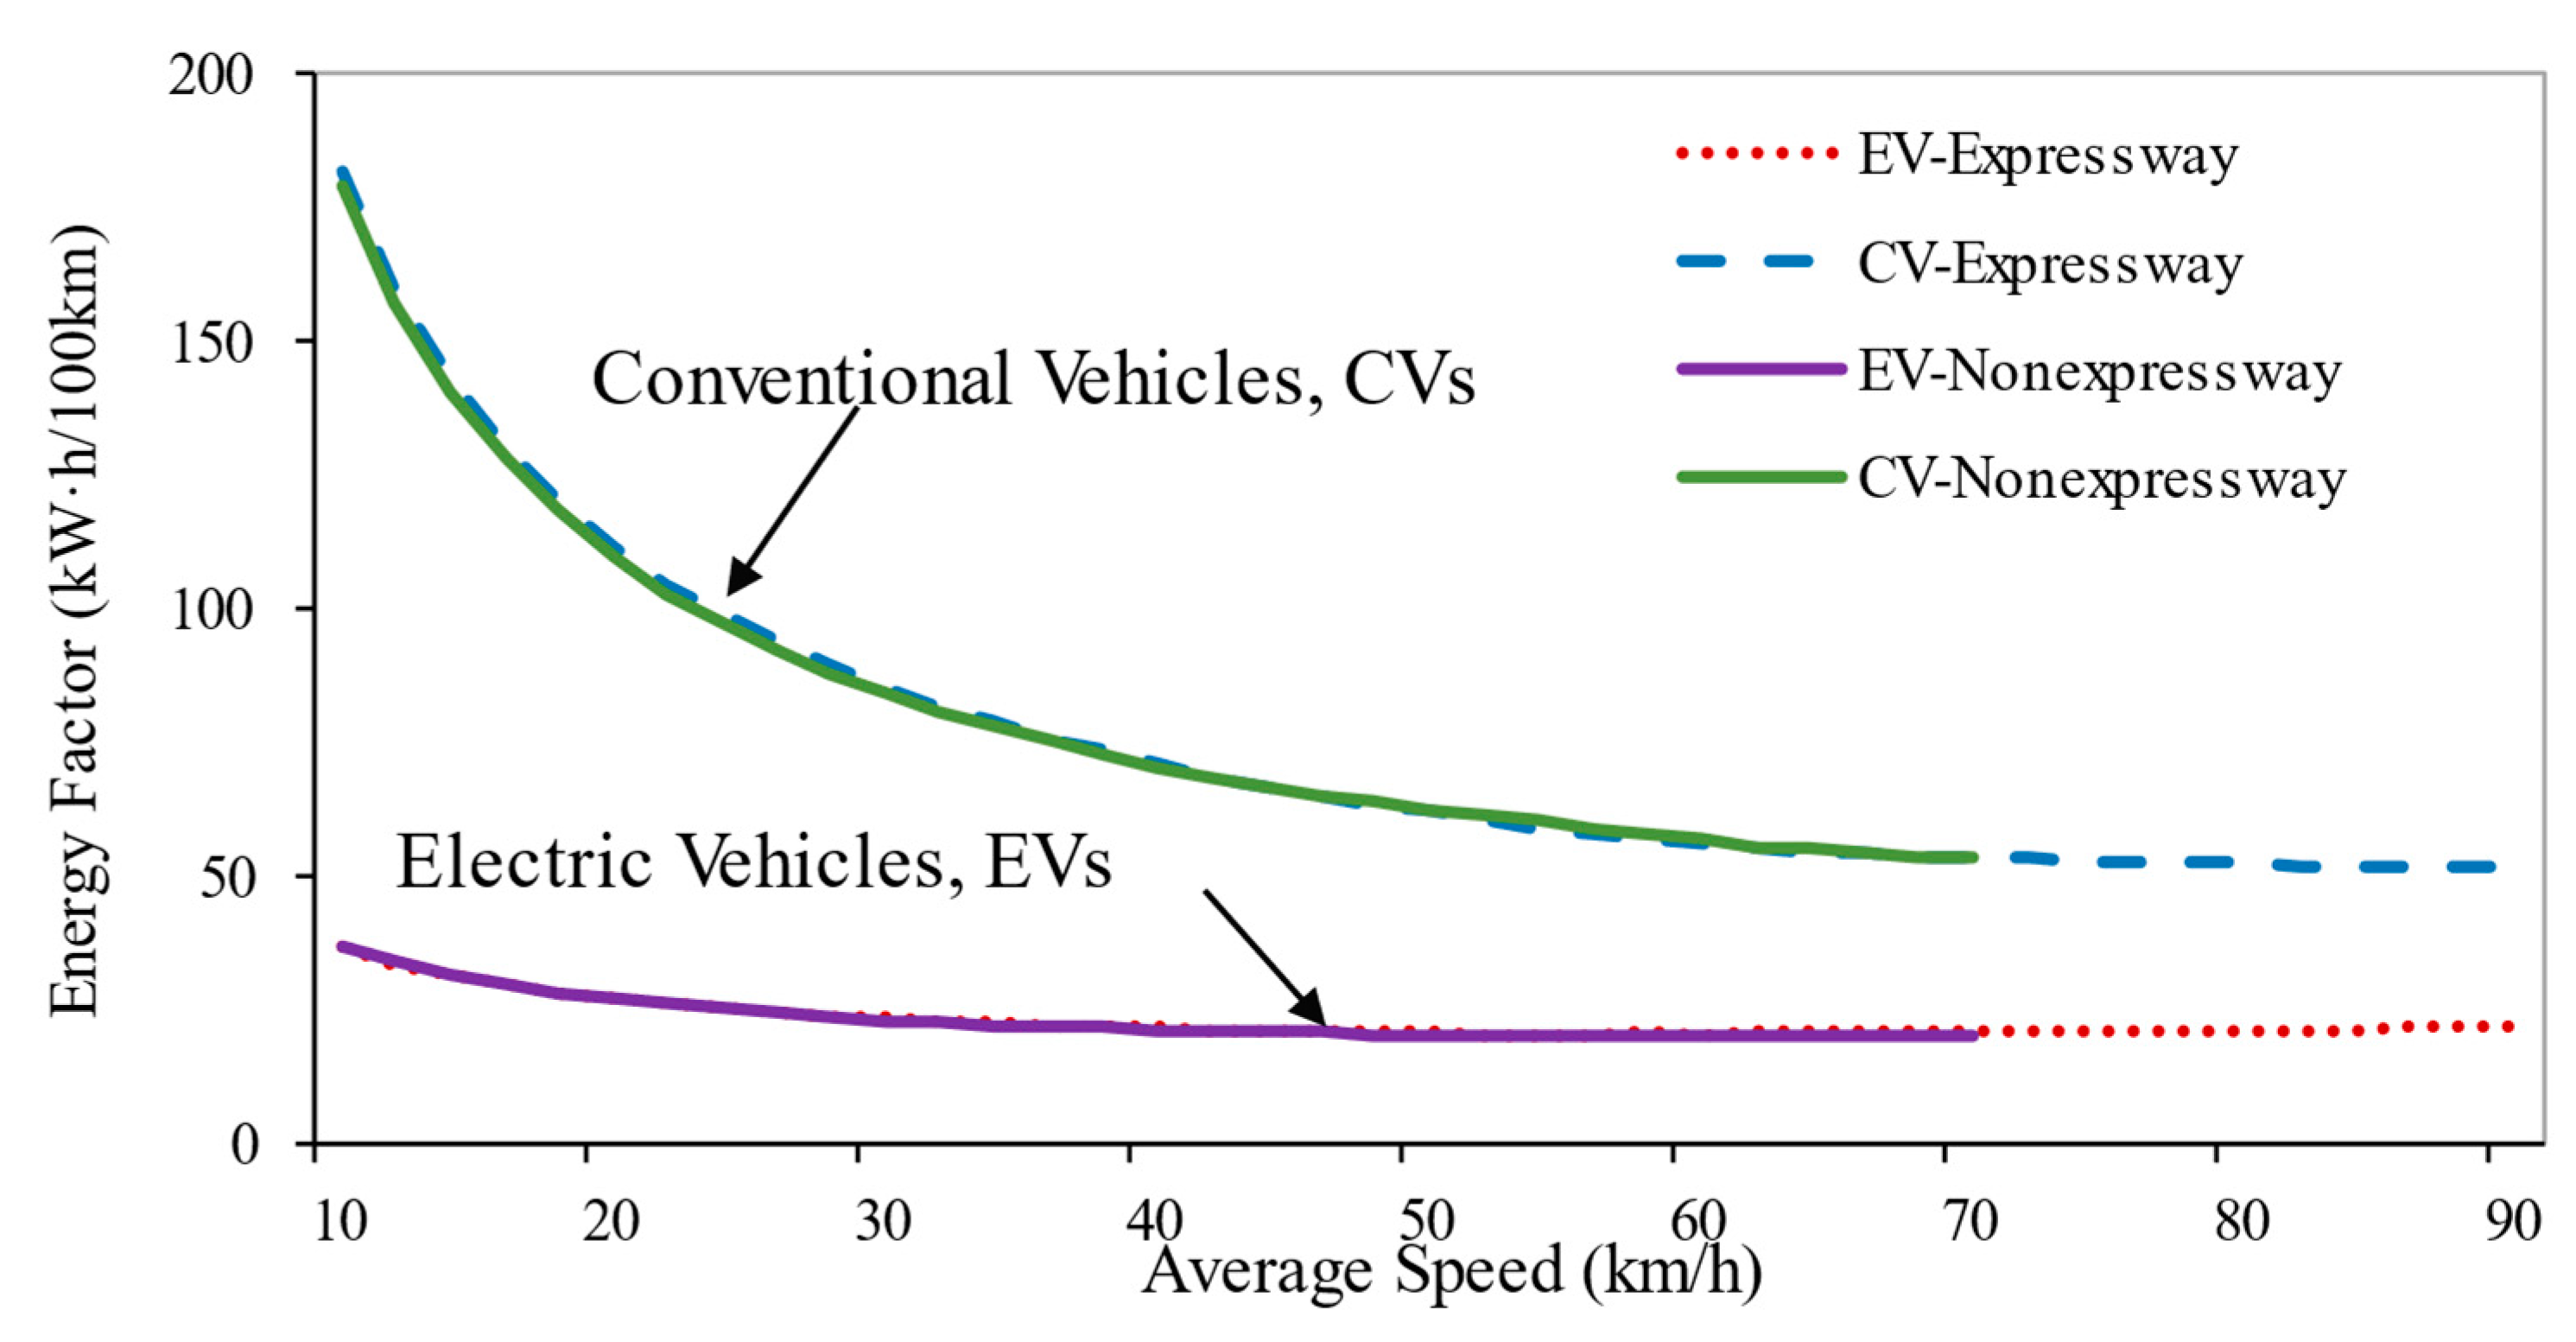
3.1. Comparison of Energy Consumption Between EVs and CVs

3.1.1. Absolute Energy Consumption

Figure 3 illustrates the EFs of EVs and CVs across distinct road categories (expressways vs. non-expressways). At identical average speeds, CVs demonstrate markedly higher EFs than EVs. Notably, the absolute energy consumption gap between the two vehicle types diminishes progressively as speed increases.
Energy consumption is influenced by driving patterns, which are predominantly shaped by traffic conditions. Even trips with identical average speeds involve intricate combinations of driving behaviors, leading to variable ranges of absolute energy consumption. To quantify this variability, three datasets are analyzed:
(1)
Worldwide Light-duty Test Cycle (WLTC) proposed by the United Nations in 2017 [33], as shown in Figure 4a;
(2)
China Light-duty Vehicle Test Cycle-Passenger (CLTC-P) developed by China in 2019, as shown in Figure 4b;
(3)
Real trip segment obtained from second-by-second trajectory data collected in 2022, Beijing, as shown in Figure 4c.
Driving cycles are designed to simulate representative urban speed–time profiles. Notably, the Beijing trip segment in Figure 4c does not aim to reflect a typical driving cycle for the city but serves as a localized supplementary example to complement the standardized WLTC and CLTC-P frameworks. Key parameters of these datasets are summarized in Table 1.
As indicated in Table 1, CVs exhibit energy consumption levels 2.8–3.5 times higher than EVs, underscoring the substantial energy conservation potential of EV adoption. To evaluate road-network-level energy savings for EVs in Beijing, daily energy consumption is calculated using the city’s daily vehicle kilometers traveled (VKT) and visualized in Figure 5. For instance, at a 20% EV penetration rate, 20% of total VKT is paired with the EV energy factor to derive EV energy use (572.7 × 10⁴ kWh). A full transition from 0% to 100% EV penetration reduces total energy consumption by 66.4%.

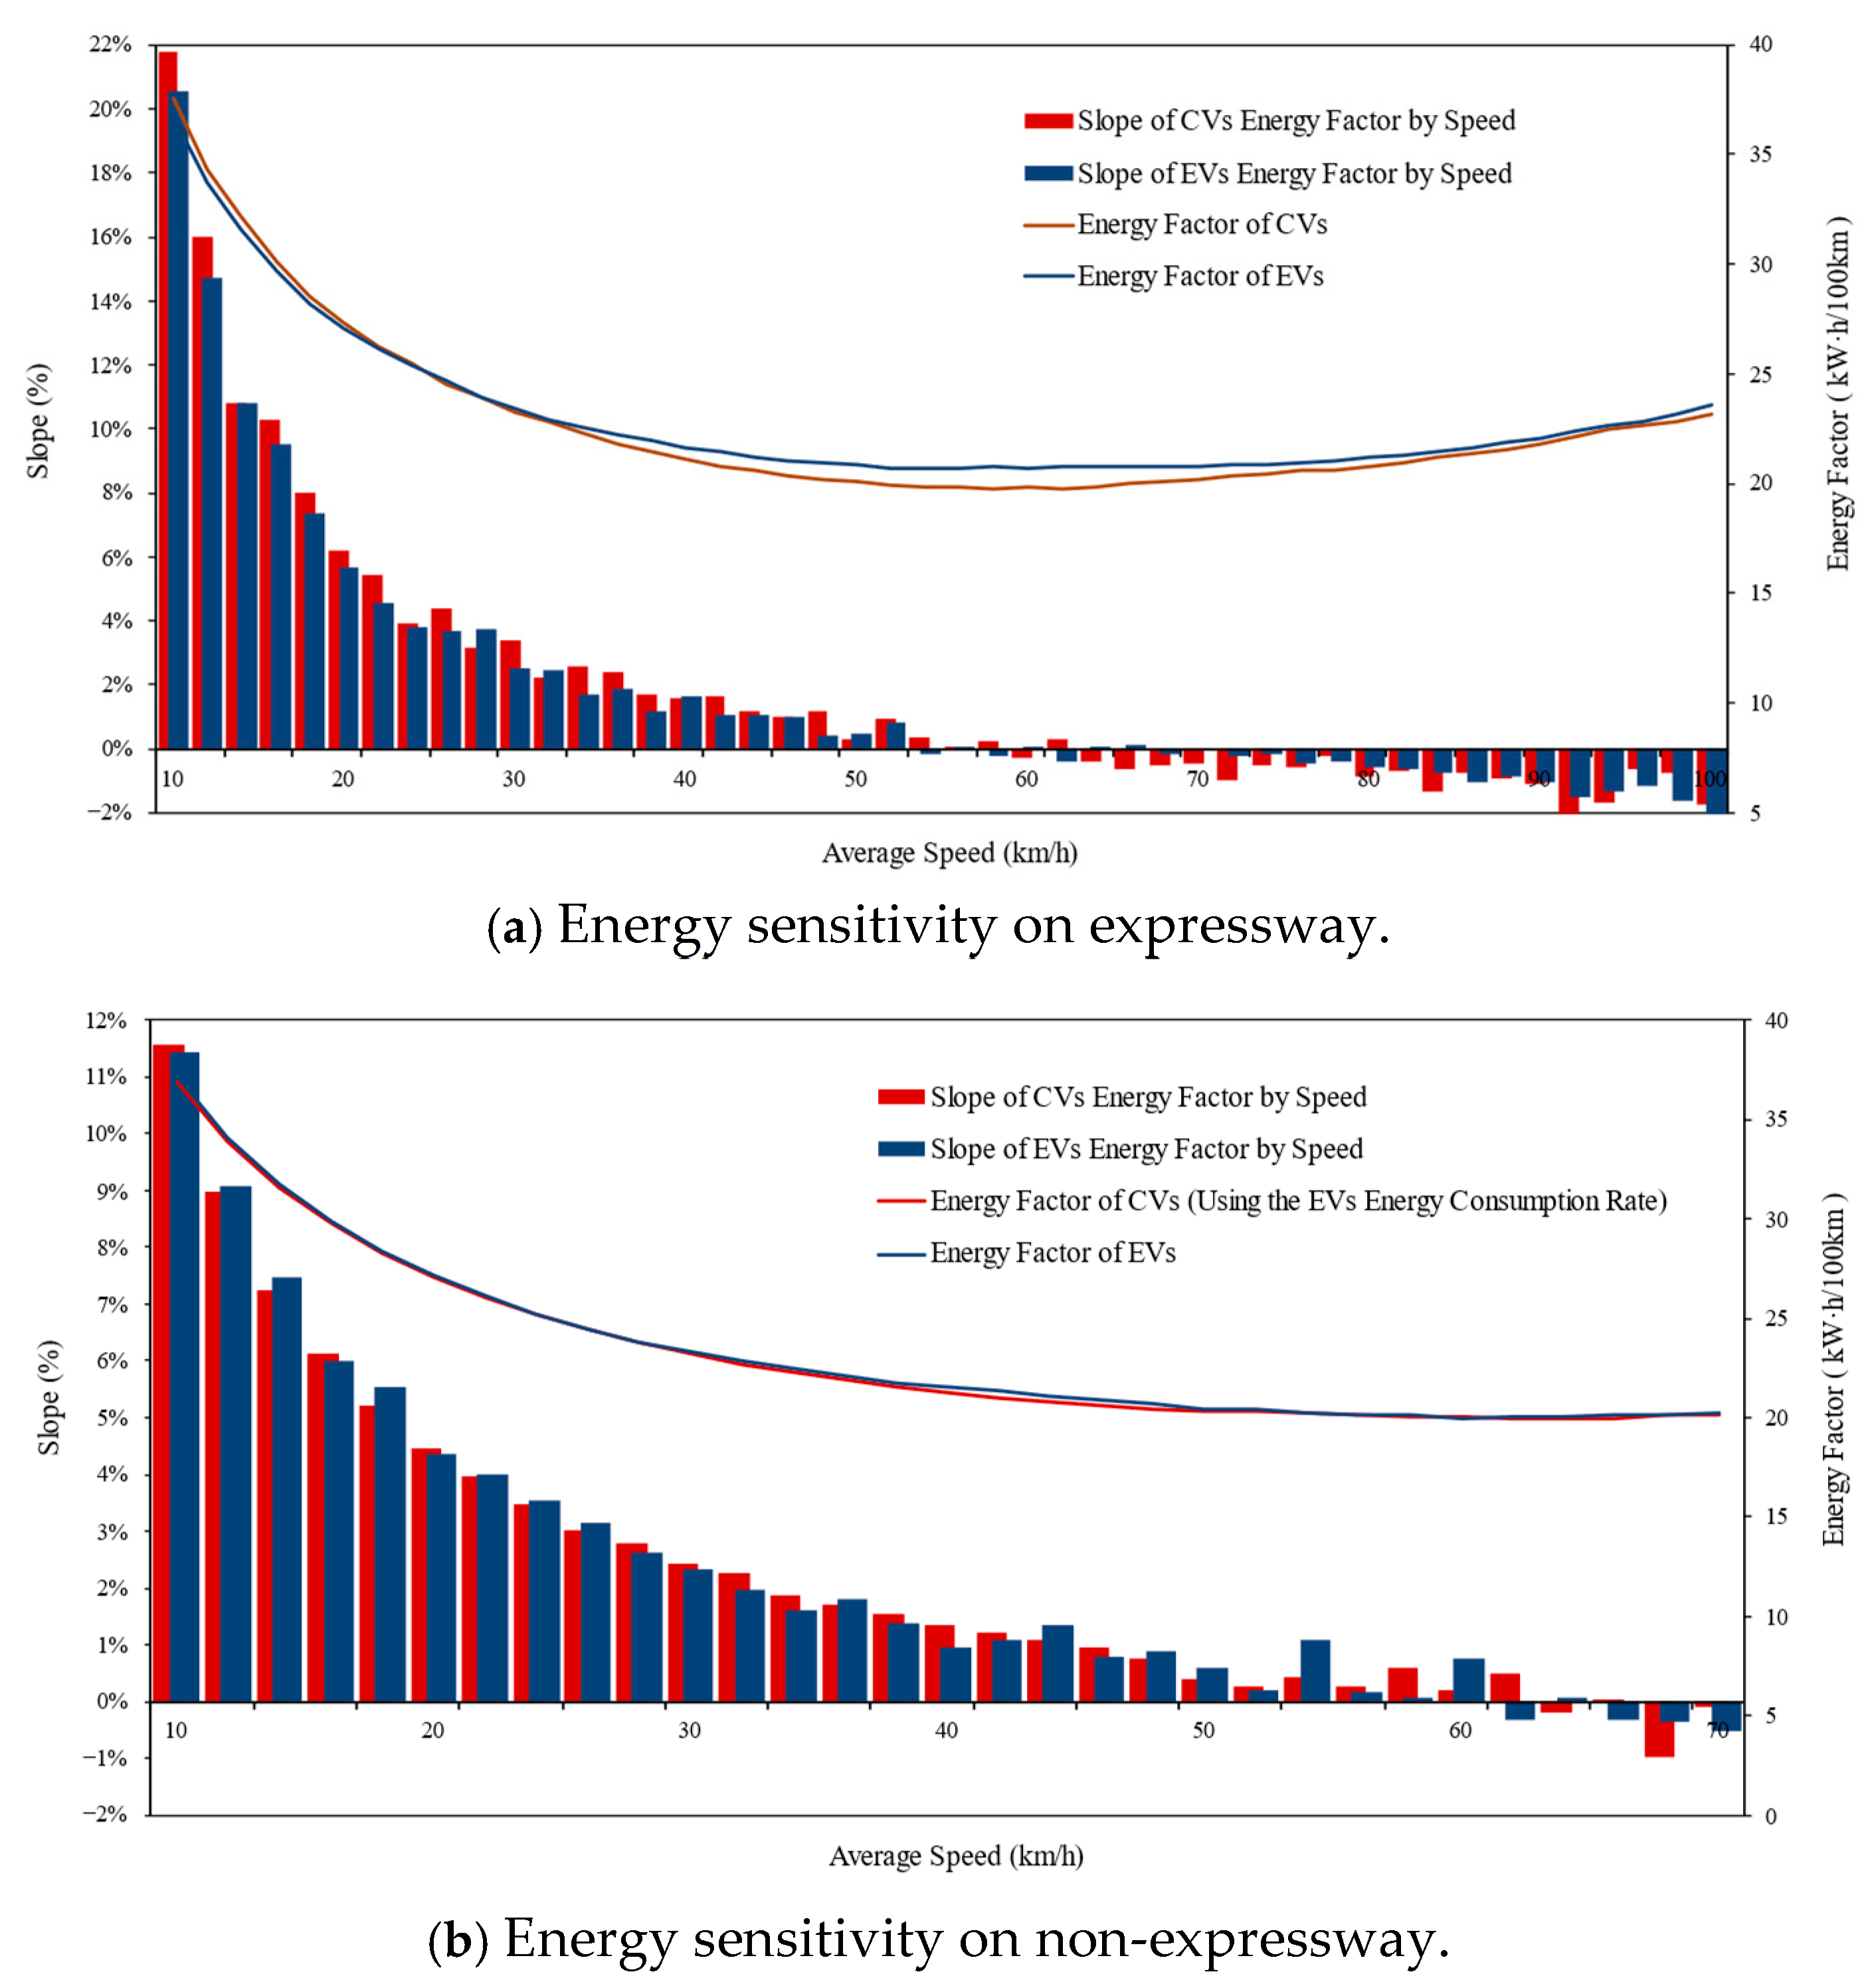
3.1.2. Energy Consumption Sensitivity Against Speed

To isolate the influence of absolute energy consumption (as previously analyzed), the EF is normalized relative to its value at 30–32 km/h, a baseline chosen for its alignment with Beijing’s representative urban traffic speed [9] and analytical stability in energy-speed relationships. This speed range minimizes transient acceleration artifacts (<15 km/h) and aerodynamic dominance (>60 km/h). Normalization preserves the sensitivity metric despite altering the absolute intersection positions of CV and EV normalized energy trends. Critically, such intersections are artifacts of scalar normalization and hold no mechanistic significance, as the slope (Δenergy/Δspeed) remains invariant to baseline selection. Figure 6 illustrates this dynamic through scatter plots of normalized energy versus speed for EVs and CVs, complemented by a histogram of sensitivity slopes. The key observations are as follows.
EVs exhibit non-monotonic energy consumption patterns across the studied speed range [10, 90) km/h—a domain selected based on urban road operational objectives where target speeds rarely exceed 90 km/h. As shown in Figure 6a, three distinct regimes emerge: (1) In low-speed conditions [10, 40) km/h, energy consumption decreases with speed (average slope = 4.3%/km·h−1), reflecting reduced idling losses. (2) Between 40 and 70 km/h, consumption stabilizes (slope = 0.3%/km·h−1), indicating balanced efficiency trade-offs. (3) At higher speeds [70, 90) km/h (shaded region), aerodynamic drag dominates, reversing the trend to a positive energy-speed relationship (slope = −0.5%/km·h−1). In contrast, CVs demonstrate monotonic energy reduction across all speed ranges, with phase-specific slopes of 7.3%/km·h−1 ([10, 40) km/h), 2.0%/km·h−1 ([40, 70) km/h), and 0.6%/km·h−1 ([70, 90) km/h). This divergence is most pronounced below 40 km/h, where the CVs’ steeper decline (7.3% vs. 4.3%) underscores their inefficiency in low-speed transient operation. Notably, within the non-expressway speed limit ([10, 70) km/h), energy sensitivity shows no statistically significant variation between expressway and non-expressway driving conditions, suggesting road-type independence of the energy–speed relationship.
The identified divergence in energy–speed sensitivity carries significant implications for sustainable traffic management. While conventional congestion mitigation strategies prioritizing road network speed elevation (e.g., signal coordination, lane management) inherently benefit CVs through monotonic energy savings (7.3%/km·h−1 below 40 km/h), they risk unintended consequences for EV fleets. As demonstrated in Figure 6, EV energy consumption exhibits a 0.5%/km·h−1 increase above 70 km/h—a counterintuitive relationship that could negate emission reduction goals during speed-focused interventions. To empirically validate this trade-off, we leverage Beijing’s COVID-19 pandemic lockdown (January–March 2020) as a natural experiment, where traffic volume reductions induced 22.5% average speed increases across urban arterials, as shown in Figure 7.
The energy consumption of CVs by hour is shown in Figure 8. It is obtained by combining the network-level average speed for four road types and the CVs energy factor. The results are as follows. (1) The hourly energy consumption of CVs declines with ascending road hierarchy. This pattern confirms that CVs achieve optimal fuel efficiency on high-grade roadways. (2) During pandemic-induced lockdown, road network-wide average speeds increase, consequently triggering a systemic reduction in CV energy consumption across all road hierarchy levels. (3) During the COVID-19 period, CVs exhibited energy consumption reductions of 1% on expressways, 14% on major arterial roads, 13% on minor arterial roads, and 9% on local roads, respectively.
The energy consumption of EVs by hour is shown in Figure 9. Several key findings can be observed. (1) During the pandemic, the implementation of lockdown policies led to an increase in the road network’s average speed. As a result, EVs exhibited reduced energy consumption on non-expressways, while their hourly energy consumption on expressways showed an opposing trend, with an increase. (2) Throughout the COVID-19 period, EVs demonstrated energy consumption changes of −1% (increase) on expressways, 1% reduction on major arterial roads, and 4% reduction on both minor arterial roads and local roads, respectively. (3) The sensitivity of EV energy consumption to average speed was significantly lower than that of CVs.

3.2. Impact of Vehicle Activities Based on VSP Distribution

3.2.1. VSP Distribution Comparison Between EVs and CVs

Since there are significant differences in CVs in terms of VSP distribution patterns on the different facilities (expressway vs. non-expressway), the VSP distributions on the expressway and non-expressway are developed separately. As an illustrative example, ten-speed bins of 10–12, 20–22, 30–32, 40–42, 50–52, 60–62, 70–72, 80–82, 90–92, and 100–102 km/h are plotted for demonstrating the general characteristics and variation patterns of VSP distributions against average travel speed, as shown in Figure 10. Several interesting characteristics and variation patterns could be observed:
The VSP distributions of EVs and CVs have a similar trend, varying with the average speed. The VSP distribution in the positive part (that is, VSP > 0) is larger than that in the negative part (that is, VSP < 0), and the higher average travel speed is associated with the larger positive VSP distribution. In the low-speed range (average speed is less than 20 km/h), a large percentage of VSP appears in the 0th bin. The VSP bin with the highest percentage increases monotonically with the average travel speed.
Although the distributions of EVs and CVs have a similar trend, there are still some interesting differences that could be observed. For EVs, the percentage of the 0th VSP bin is higher than CVs on the expressway when the speed is less than 50 km/h. Taking the average travel speed of 10–12 km/h as an example, the percentage of the 0th VSP bin is 61.2% for EVs and 55.7% for CVs. Typical traffic behavior of VSP values around 0 is idling (only for CVs) or queuing for congestion.
In addition to the difference mentioned above, compared with the distribution of CVs, that of EVs is a more platykurtic distribution (that is, a flat-topped curve with a thinner tail), especially when the average speed is more than 40 km/h. Taking the average travel speed of 60–62 km/h as an example, the percentage over the ninth VSP bin is 21.9% for EVs and 13.9% for CVs on the expressway. On a non-expressway, the VSP distribution discrepancy between EVs and CVs is not so obvious.

3.2.2. Energy Sensitivity Discrepancy Caused by VSP Distribution

The variable control method is used to comparatively analyze the impact factors of energy consumption separately. The speed-dependent energy consumption sensitivity plot was constructed as follows:
(1)
For CVs, by applying CV-specific VSP distributions with EV energy consumption rates.
(2)
For EVs, by applying EV-specific VSP distributions with corresponding EV energy consumption rates
The results indicate that the energy consumption factor–speed curves of CVs and EVs nearly coincide under these conditions. The line graph of energy factor against speed is shown in Figure 11a for EVs and CVs, respectively. Additionally, the slope of the energy factor–speed curve, which can be used to describe the energy consumption sensitivity against speed, is presented with a histogram in Figure 11b. Several results could be observed:
On the expressway, VSP distribution could result in up to a 5% discrepancy in absolute energy consumption between EVs and CVs, especially at the average speed of 30–70 km/h. On the non-expressway, the discrepancy of VSP distributions between EVs and CVs is not obvious, resulting in nearly equivalent energy consumption between them. Compared with the expressway, the energy consumption of EVs on the non-expressway decreases while that of CVs increases, leading to the unobvious discrepancy in the energy factor on the non-expressway between EVs and CVs that is shown in Figure 11b. This confirms that the EV could achieve its maximum energy conservation benefit on the low-class road, while the maximum CV benefit is achieved on the high-class road. Overall, the VSP distribution has no obvious impact on the discrepancy in energy consumption sensitivity against speed between EVs and CVs on both expressways and non-expressways.

3.3. Impact of Energy Characteristics Based on Energy Consumption Rate

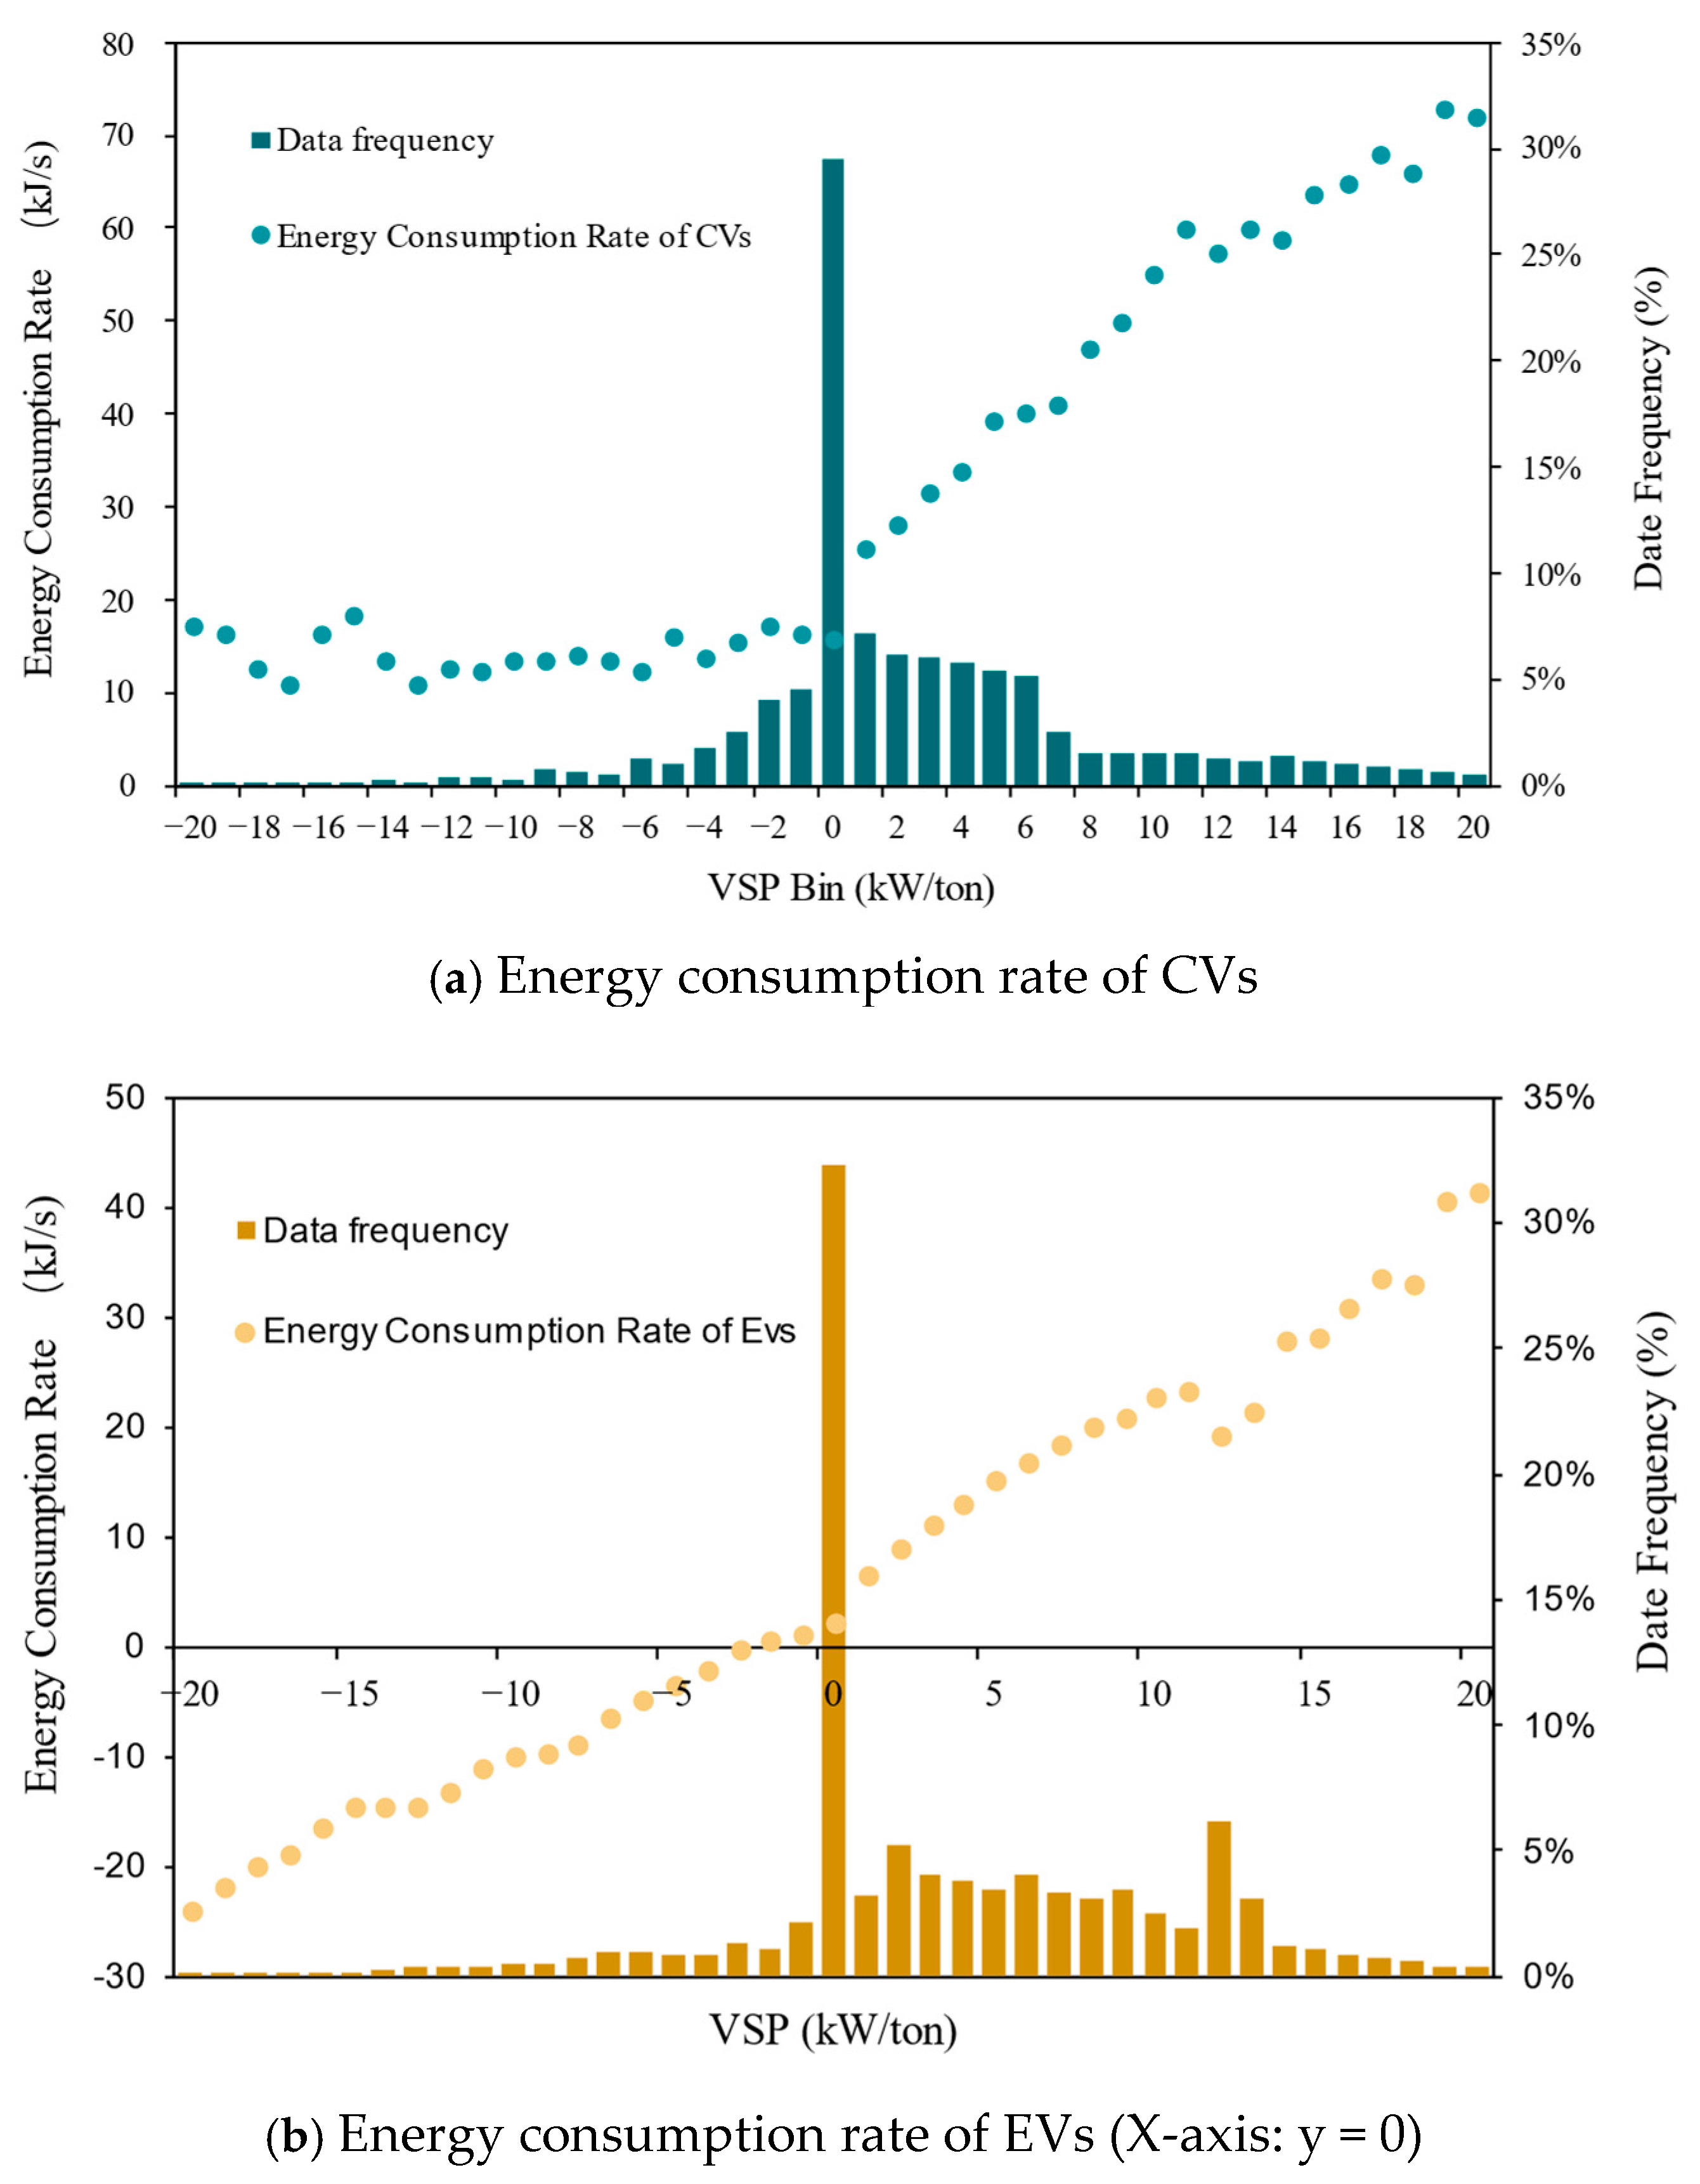
3.3.1. Energy Consumption Rate Comparison Between EVs and CVs

The ECR of EVs and CVs is shown in Figure 12. From the frequency histogram, it is shown that most of the data concentrate on the bins that are close to the 0th VSP bin. Several interesting characteristics could be observed:
When the VSP bin is positive, the ECR of EVs is lower than that of CVs. That is possible thanks to the high efficiency (more than 90%) of the electric powertrain. When the VSP bin is negative, the ECR of CVs is relatively low and roughly constant, while that of the EVs is negative due to the energy recovery system, which means the motor charges the battery during braking. In the 0th VSP bin, the ECR of CVs is 15.8 kJ/s, which is only 2.1 kJ/s for the EVs.

3.3.2. Energy Sensitivity Discrepancy Caused by Energy Consumption Rate

The significant discrepancy in absolute energy consumption between EVs and CVs is presented in Table 1. In the section above, it is proven that EVs would consume up to 5% more energy than CVs on the assumption that EVs and CVs have the same ECR. In this section, the impact of ECR on both absolute energy consumption and energy sensitivity against speed will be discussed. The absolute energy consumption discrepancy between EVs and CVs (shown in Table 2) is explained by the ECR by VSP bins. For each trip, the absolute energy consumption is grouped into three parts by VSP bin (positive bins, the 0th bin, and negative bins).
In negative VSP bins, the energy consumption for EVs is negative, which means the motor charges the battery during braking. The percentage of energy consumption discrepancy of positive, 0th, and negative VSP bins for the three trips is shown in Figure 13. Take Figure 13d as an example.
(1)
Motor efficiency dominance (59%, in VSP > 0). The majority of EV energy advantage stems from electric motors’ inherently higher energy conversion efficiency during acceleration and steady-speed operation, a phenomenon robustly observed across all three driving cycles (WLTC, CLTC, and Beijing Driving Cycle).
(2)
Idle loss elimination (24%, in VSP = 0). The absence of fuel consumption during stops—a well-documented CV inefficiency—is concretely quantified here through our VSP-bin analysis framework.
(3)
Regenerative braking contribution (17%, in VSP < 0). While modest relative to motor efficiency, this negative energy rate regime uniquely characterizes EV energy recovery potential. Though its magnitude is expected to vary with braking algorithms and battery SOC management in newer models.
These proportions, derived from a controlled comparison of ECR effects (Section 3.3), should be interpreted as mechanistic indicators of how distinct physical processes govern EV energy savings, rather than fleet-averaged values. It can be seen that ECR in positive VSP bins contributes the most to the absolute energy consumption discrepancy between EVs and CVs. The high efficiency of the electric powertrain is the key point of EV energy conservation.
The variable control method is used to comparatively analyze the impact of ECR on energy sensitivity. The speed-dependent energy consumption sensitivity plot was constructed by:
(1)
For CVs: Applying EV-specific VSP distributions with CV energy consumption rates
(2)
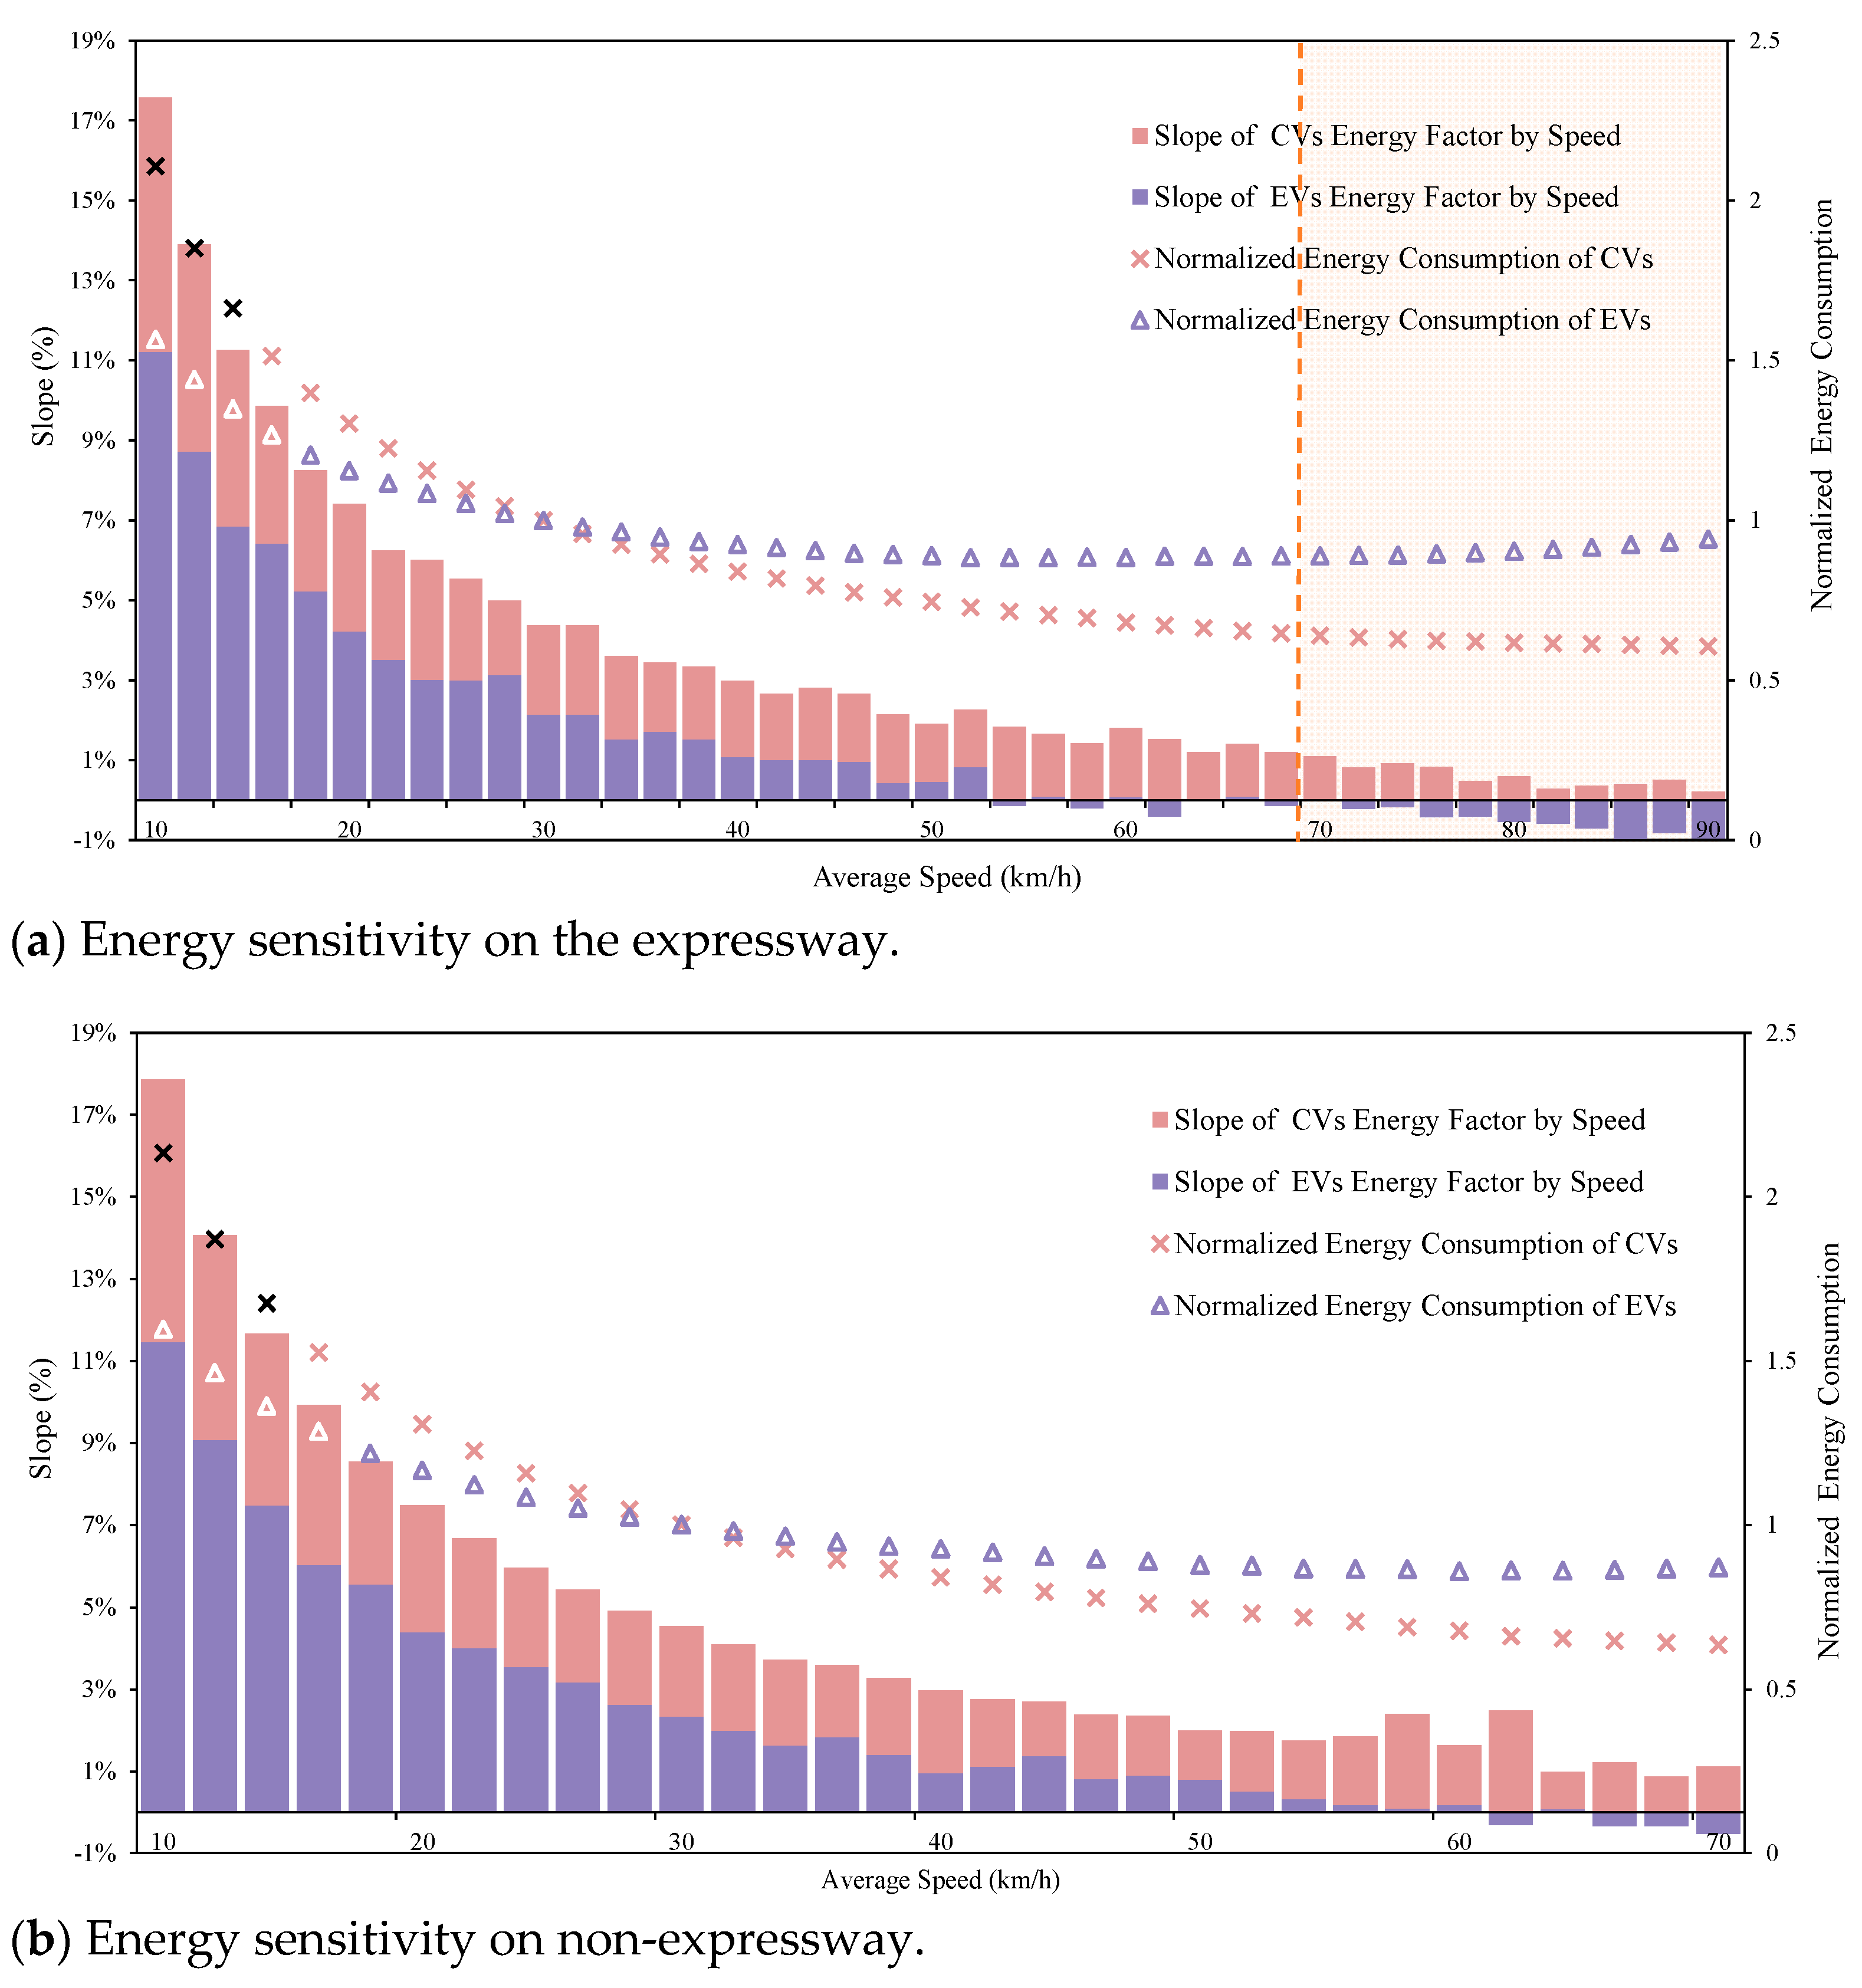
For EVs: Applying EV-specific VSP distributions with corresponding EV energy consumption rates. The scatter plots of the normalized energy factor by speed are shown in Figure 14 for EVs and CVs, respectively. Additionally, the slope of the energy factor-speed curve, which can be used to describe the energy consumption sensitivity caused by ECR, is presented with a histogram in Figure 14. The average energy factor slopes in the three phases (4.3%, 0.3%, −0.5%) are approximately equal to those in Figure 6. The results demonstrate significant divergence between the energy consumption factor–speed curves of CVs and EVs under these conditions, consistent with the patterns observed in Figure 6. This confirms that the sensitivity differences shown in Figure 6 are primarily determined by vehicle-type-specific energy consumption rates.
As a consequence, the discrepancy in energy consumption sensitivity between EVs and CVs is mainly determined by the characteristics of ECR, and it is almost independent of VSP distribution.

4. Discussion

It should be noted that the energy consumption analysis in this study is based on a single-vehicle case (2015 Mercedes-Benz EV), which provides a conservative estimate but may not fully represent the broader EV landscape. While this provides a rigorously validated benchmark, it represents a conservative estimate that may not fully reflect. For instance, the efficiency gains of newer EV models and brand-specific optimizations in battery management or regenerative braking. While this limitation does not invalidate our core findings on VSP-based energy estimation, future studies should incorporate cross-brand comparisons to assess how generalizable the observed trends are. Expanding the dataset to include diverse EV types (e.g., Tesla, BYD, Nissan Leaf) would help establish more universally applicable energy-saving principles.
For further practical application of this study’s findings, more nuanced policy design and infrastructure optimization research are required. Specifically, the following:
(1)
Eco-routing planning: EV energy-optimal routes should avoid road segments with excessively high average speeds (e.g., urban expressways), as high-speed conditions significantly increase power consumption. EVs demonstrate superior energy economy primarily in urban low-to-medium speed driving scenarios (average speed <50 km/h), with limited benefits in highway conditions.
(2)
Policy effectiveness variation. Unlike CVs, speed-increase strategies (e.g., >50 km/h) may yield diminishing energy-saving returns for EVs.
While these findings provide a theoretical basis for differentiated traffic management policies, their implementation requires systematic optimization, incorporating cross-disciplinary factors like charging infrastructure deployment and battery technology advancement. We acknowledge that quantifying the impacts of such policies remains beyond the scope of this paper, but will be critical for future research.

5. Conclusions

This study develops an energy consumption model for EVs based on VSP distribution and conducts a comparative analysis of key influencing factors, including speed, VSP distribution, and ECR. The results indicate that, under equivalent conditions, such as identical average speeds or the same trip/driving cycle, EVs exhibit significantly lower energy consumption compared to CVs. Across the three tested scenarios—WLTC, CLTC, and a real-world trip in Beijing—CVs consumed from 2.8 to 3.5 times more energy than EVs. This discrepancy is primarily attributed to differences in ECR, as well as the more dispersed VSP distribution observed in EVs, which reflects a greater tendency for aggressive acceleration and deceleration. Further analysis reveals that EV energy savings are largely driven by high powertrain efficiency (accounting for approximately 59% of the total savings), regenerative braking energy recovery (17%), and the absence of idling energy consumption (24%).
Unlike CVs, whose energy consumption consistently decreases as speed increases, EV energy consumption follows a non-monotonic pattern across the speed range of from 10 to 90 km/h. Specifically, energy consumption decreases with speed at low speeds (10–40 km/h), with an average slope of −4.3%, remains relatively stable in the medium-speed range (40–70 km/h), with an average slope of −0.3%, and increases with speed at high speeds (70–90 km/h), with an average slope of +0.5%. In contrast, CV energy consumption exhibits a monotonic decline across all speed intervals, with average energy factor slopes of −7.3%, −2.0%, and −0.6%, respectively, in the three speed ranges.
CVs exhibit substantially greater speed-dependent sensitivity in energy consumption factors compared to EVs. Under identical road network speed improvements, CVs demonstrate a maximum energy consumption reduction of 14% (observed on major arterial roads), whereas EVs achieve up to 4% reduction (on local roads). Notably, this study finds that the differences in energy consumption sensitivity between EVs and CVs are primarily driven by differences in ECR rather than variations in VSP distributions, underscoring the fundamental distinctions in energy conversion mechanisms between internal combustion engine vehicles and electric powertrains.
The findings of this study have significant implications for transportation energy policy and urban traffic management. Since EV energy consumption exhibits a non-monotonic relationship with speed, traditional traffic management strategies designed to improve fuel efficiency in CVs may not necessarily yield similar benefits for EVs and could even increase their energy consumption under certain conditions. Policies aimed at optimizing urban traffic flow should incorporate EV-specific energy models to ensure effective energy savings. Furthermore, given that EVs tend to experience higher energy consumption at both lower and higher speeds, the strategic deployment of charging infrastructure should prioritize locations where vehicles frequently operate under these conditions, such as urban slow-speed zones and high-speed highway corridors. In addition, since regenerative braking contributes significantly to energy savings in EVs, promoting driving behaviors that maximize energy recovery, such as eco-driving programs and the development of advanced driver assistance systems (ADAS) optimized for regenerative braking, could further enhance overall EV efficiency.
Future research should aim to expand the analysis to a broader range of driving conditions, including high-speed highway travel above 90 km/h and stop-and-go traffic scenarios in congested urban environments. Additionally, integrating large-scale real-world traffic data into EV energy consumption models could improve the accuracy of predictions and offer deeper insights into the impact of urban mobility patterns on energy use [34,35,36]. Moreover, different EV models may exhibit varying sensitivity to speed and VSP distributions due to differences in motor efficiency, battery technology, and regenerative braking capabilities. Exploring these vehicle-specific variations will be essential for refining energy consumption models and developing targeted policies that maximize the energy efficiency of diverse EV fleets [37]. Addressing these research gaps will contribute to a more comprehensive understanding of EV energy consumption dynamics and provide valuable insights for the transition toward sustainable and electrified transportation systems.

Author Contributions

Conceptualization, X.L. and G.S.; methodology, X.L.; resources, S.L. and R.L.; data curation, S.L. and R.L; writing—original draft preparation, X.L. and H.L.; writing—review and editing, X.L. and P.F.; visualization, X.L. and Y.W.; supervision, P.F. and Y.W.; funding acquisition, Y.W. and G.S. All authors have read and agreed to the published version of the manuscript.

Funding

This research was funded by the National Natural Science Foundation of China (52272340).

Data Availability Statement

The trajectory data used in this paper were collected through the Statistics and Monitoring Platform for Energy and Emissions in Transportation (SMPEET), an initiative launched by the Beijing Municipal Commission of Transportation.

Conflicts of Interest

Authors Rui Liu, Songsong Li were employed by the company Beijing Capital Highway Development Group Company Limited. The remaining authors declare that the research was conducted in the absence of any commercial or financial relationships that could be construed as a potential conflict of interest.

References

  1. Boriboonsomsin, K.; Vu, A. Real-World Activity Patterns of Heavy-Duty Battery Electric Trucks from Regional Distribution Fleets in Southern California. In Proceedings of the 2024 Forum for Innovative Sustainable Transportation Systems (FISTS), Riverside, CA, USA, 26–28 February 2024; pp. 1–6. [Google Scholar]
  2. Liu, H.; Hao, P.; Liao, Y.; Tanvir, S.; Boriboonsomsin, K.; Barth, M.J. Eco-Friendly Crowdsourced Meal Delivery: A Dynamic On-Demand Meal Delivery System with a Mixed Fleet of Electric and Gasoline Vehicles. IEEE Trans. Intell. Transport. Syst. 2024, 25, 11397–11410. [Google Scholar] [CrossRef]
  3. Le Hong, Z.; Zimmerman, N. Air Quality and Greenhouse Gas Implications of Autonomous Vehicles in Vancouver, Canada. Transp. Res. Part D Transp. Environ. 2021, 90, 102676. [Google Scholar] [CrossRef]
  4. Liu, H.; Guensler, R.; Lu, H.; Xu, Y.; Xu, X.; Rodgers, M.O. MOVES-Matrix for High-Performance on-Road Energy and Running Emission Rate Modeling Applications. J. Air Waste Manag. Assoc. 2019, 69, 1415–1428. [Google Scholar] [CrossRef] [PubMed]
  5. Wu, X.; Aviquzzaman, M.; Lin, Z. Analysis of Plug-in Hybrid Electric Vehicles’ Utility Factors Using GPS-Based Longitudinal Travel Data. Transp. Res. Part C Emerg. Technol. 2015, 57, 1–12. [Google Scholar] [CrossRef]
  6. Hamza, K.; Laberteaux, K.P. Utility Factor Curves for Plug-in Hybrid Electric Vehicles: Beyond the Standard Assumptions. World Electr. Veh. J. 2023, 14, 301. [Google Scholar] [CrossRef]
  7. Goebel, D.; Plötz, P. Machine Learning Estimates of Plug-in Hybrid Electric Vehicle Utility Factors. Transp. Res. Part D Transp. Environ. 2019, 72, 36–46. [Google Scholar] [CrossRef]
  8. Zheng, J.; Yu, R.; Liu, Y.; Zou, Y.; Zhao, D. The Technological Progress of the Fuel Consumption Rate for Passenger Vehicles in China: 2009–2016. Energies 2019, 12, 2384. [Google Scholar] [CrossRef]
  9. Zhang, Z.; Song, G.; Zhang, L.; Zhai, Z.; He, W.; Yin, H.; Yu, L. Impact of Lockdown Policies on Urban Traffic Conditions and Carbon Dioxide Emissions Based on an Emission Model on the Link Level in Hour Granularity. J. Clean. Prod. 2024, 437, 140426. [Google Scholar] [CrossRef]
  10. Kapustin, N.O.; Grushevenko, D.A. Long-Term Electric Vehicles Outlook and Their Potential Impact on Electric Grid. Energy Policy 2020, 137, 111103. [Google Scholar] [CrossRef]
  11. Ahn, K.; Bichiou, Y.; Farag, M.; Rakha, H.A. Multi-Objective Eco-Routing Model Development and Evaluation for Battery Electric Vehicles. Transp. Res. Rec. J. Transp. Res. Board 2021, 2675, 867–879. [Google Scholar] [CrossRef]
  12. Ahn, K.; Rakha, H.A.; Park, S. Eco Look-Ahead Control of Battery Electric Vehicles and Roadway Grade Effects. Transp. Res. Rec. J. Transp. Res. Board 2020, 2674, 429–437. [Google Scholar] [CrossRef]
  13. Chen, H.; Rakha, H.A. Battery Electric Vehicle Eco-Cooperative Adaptive Cruise Control in the Vicinity of Signalized Intersections. Energies 2020, 13, 2433. [Google Scholar] [CrossRef]
  14. Miri, I.; Fotouhi, A.; Ewin, N. Electric Vehicle Energy Consumption Modelling and Estimation—A Case Study. Int. J. Energy Res. 2021, 45, 501–520. [Google Scholar] [CrossRef]
  15. Fiori, C.; Marzano, V. Modelling Energy Consumption of Electric Freight Vehicles in Urban Pickup/Delivery Operations: Analysis and Estimation on a Real-World Dataset. Transp. Res. Part D Transp. Environ. 2018, 65, 658–673. [Google Scholar] [CrossRef]
  16. Fiori, C.; Ahn, K.; Rakha, H.A. Power-Based Electric Vehicle Energy Consumption Model: Model Development and Validation. Appl. Energy 2016, 168, 257–268. [Google Scholar] [CrossRef]
  17. Rakha, H.A.; Ahn, K.; Moran, K.; Saerens, B.; Bulck, E.V.D. Virginia Tech Comprehensive Power-Based Fuel Consumption Model: Model Development and Testing. Transp. Res. Part D Transp. Environ. 2011, 16, 492–503. [Google Scholar] [CrossRef]
  18. Zhao, X.; Zhao, X.; Yu, Q.; Ye, Y.; Yu, M. Development of a Representative Urban Driving Cycle Construction Methodology for Electric Vehicles: A Case Study in Xi’an. Transp. Res. Part D Transp. Environ. 2020, 81, 102279. [Google Scholar] [CrossRef]
  19. Achour, H.; Olabi, A.G. Driving Cycle Developments and Their Impacts on Energy Consumption of Transportation. J. Clean. Prod. 2016, 112, 1778–1788. [Google Scholar] [CrossRef]
  20. Rezaei, H.; Ghomsheh, M.J.; Kowsary, F.; Ahmadi, P. Performance Assessment of a Range-Extended Electric Vehicle under Real Driving Conditions Using Novel PCM-Based HVAC System. Sustain. Energy Technol. Assess. 2021, 47, 101527. [Google Scholar] [CrossRef]
  21. Al-Wreikat, Y.; Serrano, C.; Sodré, J.R. Driving Behaviour and Trip Condition Effects on the Energy Consumption of an Electric Vehicle under Real-World Driving. Appl. Energy 2021, 297, 117096. [Google Scholar] [CrossRef]
  22. Shen, Y.; Xie, J.; He, T.; Yao, L.; Xiao, Y. CEEMD-Fuzzy Control Energy Management of Hybrid Energy Storage Systems in Electric Vehicles. IEEE Trans. Energy Convers. 2024, 39, 555–566. [Google Scholar] [CrossRef]
  23. Fan, P.; Song, G.; Zhu, Z.; Wu, Y.; Zhai, Z.; Yu, L. Road Grade Estimation Based on Large-Scale Fuel Consumption Data of Connected Vehicles. Transp. Res. Part D Transp. Environ. 2022, 106, 103262. [Google Scholar] [CrossRef]
  24. Song, G.; Yu, L.; Tu, Z. Distribution Characteristics of Vehicle-Specific Power on Urban Restricted-Access Roadways. J. Transp. Eng. 2012, 138, 202–209. [Google Scholar] [CrossRef]
  25. Jiménez-Palacios, J.L. Understanding and Quantifying Motor Vehicle Emissions with Vehicle Specific Power and TILDAS Remote Sensing. Ph.D. Thesis, Massachusetts Institute of Technology, Cambridge, MA, USA, 1999. [Google Scholar]
  26. US EPA Overview of EPA’s MOtor Vehicle Emission Simulator (MOVES4). Available online: https://nepis.epa.gov/Exe/ZyPDF.cgi?Dockey=P10186IV.pdf (accessed on 24 October 2023).
  27. Hayes, J.G.; Davis, K. Simplified Electric Vehicle Powertrain Model for Range and Energy Consumption Based on EPA Coast-down Parameters and Test Validation by Argonne National Lab Data on the Nissan Leaf. In Proceedings of the 2014 IEEE Transportation Electrification Conference and Expo (ITEC), Dearborn, MI, USA, 15–18 June 2014; pp. 1–6. [Google Scholar]
  28. SAE J1634_202104; Battery Electric Vehicle Energy Consumption and Range Test Procedure. SAE International: Warrendale, PA, USA, 2021.
  29. ISO 6469-3:2021; Electrically propelled road vehicles—Safety specifications. International Organization for Standardization: Geneva, Switzerland, 2021.
  30. Hamby, D.M. A Review of Techniques for Parameter Sensitivity Analysis of Environmental Models. Environ. Monit. Assess. 1994, 32, 135–154. [Google Scholar] [CrossRef] [PubMed]
  31. Neubauer, J.; Brooker, A.; Wood, E. Sensitivity of Battery Electric Vehicle Economics to Drive Patterns, Vehicle Range, and Charge Strategies. J. Power Sources 2012, 209, 269–277. [Google Scholar] [CrossRef]
  32. Fan, P.; Yin, H.; Lu, H.; Wu, Y.; Zhai, Z.; Yu, L.; Song, G. Which Factor Contributes More to the Fuel Consumption Gap between In-Laboratory vs. Real-World Driving Conditions? An Independent Component Analysis. Energy Policy 2023, 182, 113739. [Google Scholar] [CrossRef]
  33. Tutuianu, M.; Bonnel, P.; Ciuffo, B.; Haniu, T.; Ichikawa, N.; Marotta, A.; Pavlovic, J.; Steven, H. Development of the World-Wide Harmonized Light Duty Test Cycle (WLTC) and a Possible Pathway for Its Introduction in the European Legislation. Transp. Res. Part D Transp. Environ. 2015, 40, 61–75. [Google Scholar] [CrossRef]
  34. Fan, P.; Song, G.; Lu, H.; Yin, H.; Zhai, Z.; Wu, Y.; Yu, L. Impact of Ambient Temperature on Light-Duty Gasoline Vehicle Fuel Consumption under Real-World Driving Conditions. Int. J. Sustain. Transp. 2024, 18, 589–604. [Google Scholar] [CrossRef]
  35. Xu, X.; Aziz, H.M.A.; Guensler, R. A Modal-Based Approach for Estimating Electric Vehicle Energy Consumption in Transportation Networks. Transp. Res. Part D Transp. Environ. 2019, 75, 249–264. [Google Scholar] [CrossRef]
  36. Zhang, Y.; Fan, P.; Lu, H.; Song, G. Fuel Consumption of Hybrid Electric Vehicles under Real-World Road and Temperature Conditions. Transp. Res. Part D Transp. Environ. 2025, 142, 104691. [Google Scholar] [CrossRef]
  37. Boggio-Marzet, A.; Monzon, A.; Rodriguez-Alloza, A.M.; Wang, Y. Combined Influence of Traffic Conditions, Driving Behavior, and Type of Road on Fuel Consumption. Real Driving Data from Madrid Area. Int. J. Sustain. Transp. 2021, 16, 301–313. [Google Scholar] [CrossRef]
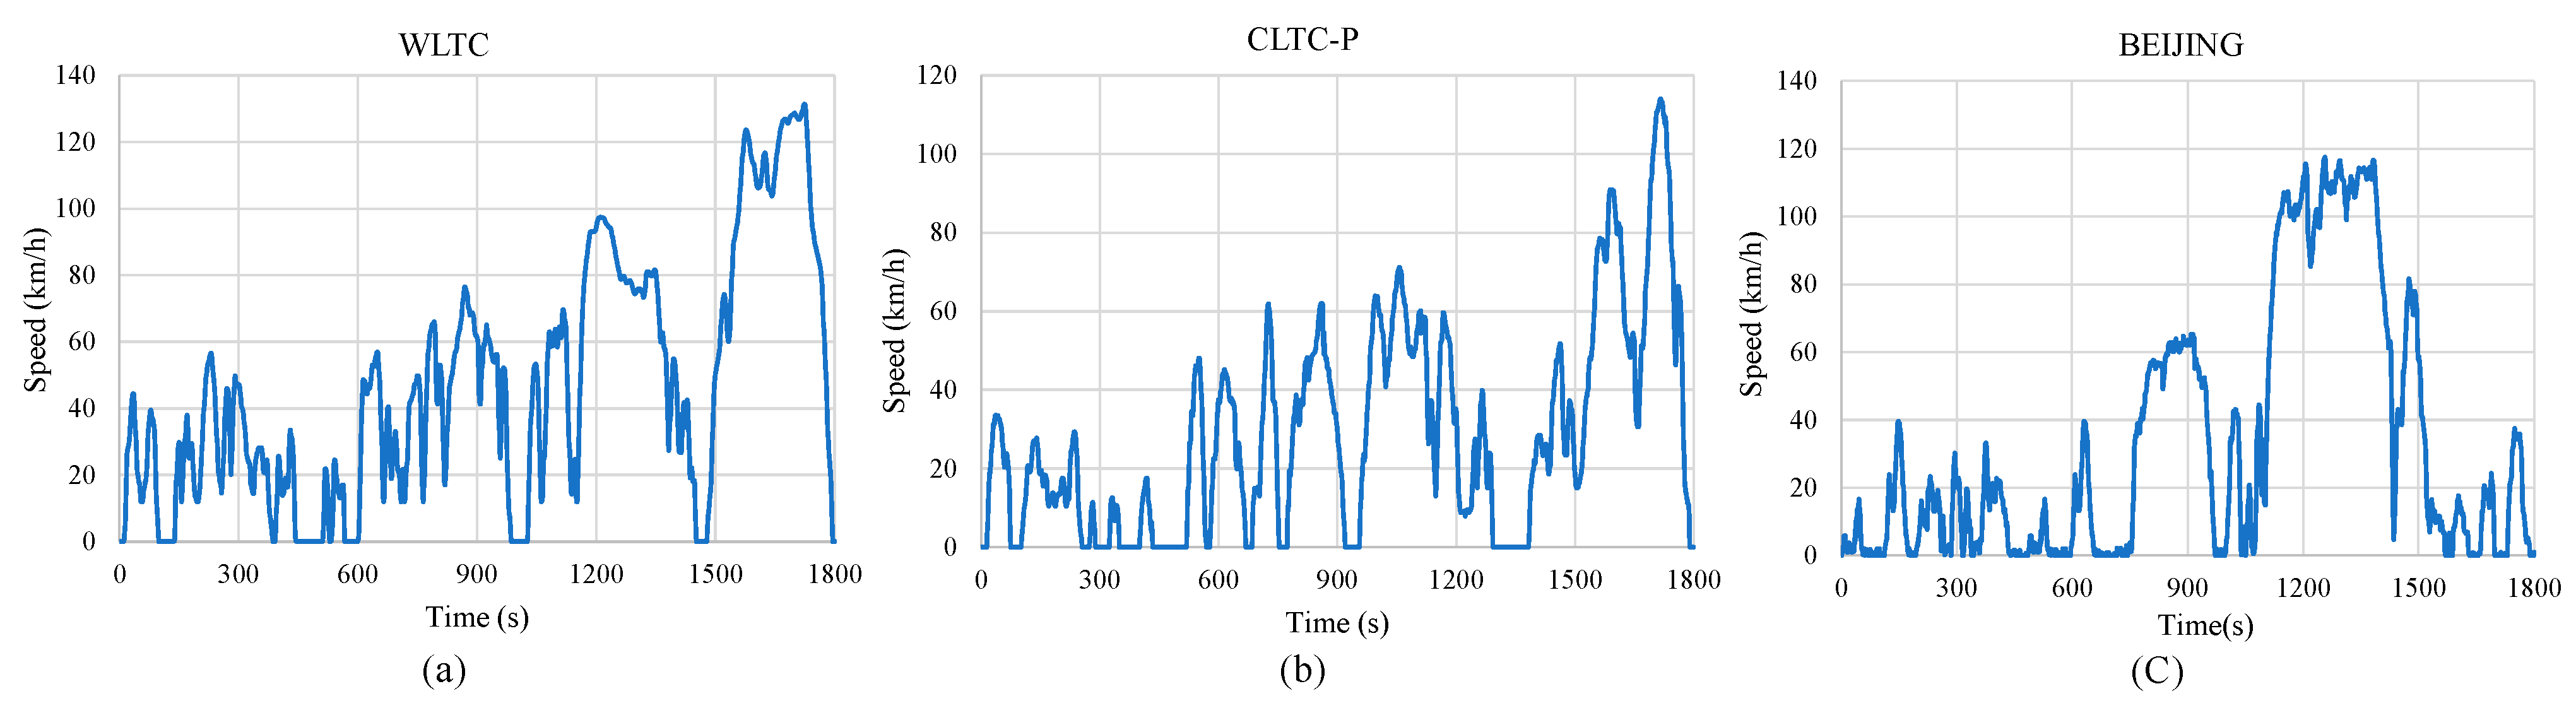
Figure 1. Energy use rate by average speed from MOVES-Matrix.
Energies 18 02268 g001
Figure 2. Geospatial matching and road type classification of second-by-second trajectory data in Beijing.
Energies 18 02268 g002
Figure 3. Energy consumption of EVs and CVs by speed.
Energies 18 02268 g003
Figure 4. Driving cycle of WLTC (a), CLTC-P (b), and Beijing (using Real World Operation Data) (c).
Energies 18 02268 g004
Figure 5. Total energy consumption of Beijing’s road network varies with EV penetration rates.
Energies 18 02268 g005
Figure 6. Energy consumption sensitivity between EVs and CVs against speed.
Energies 18 02268 g006
Figure 7. The road network speed and VKT in the pre-pandemic urban mobility pattern and the pandemic lockdown-enabled uncongested pattern: (a) Expressway; (b) Major arterial road; (c) Minor arterial road; (d) Local roads.
Energies 18 02268 g007
Figure 8. CV energy consumption by hour in pre-pandemic urban mobility pattern and pandemic lockdown-enabled uncongested pattern.
Energies 18 02268 g008
Figure 9. EV energy consumption by hour in pre-pandemic urban mobility pattern and pandemic lockdown-enabled uncongested pattern.
Energies 18 02268 g009
Figure 10. VSP distributions comparison between EVs and CVs.
Energies 18 02268 g010aEnergies 18 02268 g010b
Figure 11. Discrepancy in energy sensitivity caused by VSP distribution.
Energies 18 02268 g011
Figure 12. Energy consumption rate of EVs and CVs.
Energies 18 02268 g012
Figure 13. Percentage of energy consumption discrepancy in positive, 0th, and negative VSP bins.
Energies 18 02268 g013
Figure 14. Discrepancy in energy sensitivity caused by energy consumption rate.
Energies 18 02268 g014aEnergies 18 02268 g014b
Table 1. Typical parameters of WLTC, CLTC-P, and Beijing trip segment.
Test Time
/s
Test Distance
/km
Maximum Speed
/(km/h)
Average Speed
/(km/h)
Energy Consumption of EVs
/(kWh/100 km)
Energy Consumption of CVs
/(kWh/100 km)
WLTC180023.3131.346.524.968.7
CLTC-P180014.5114.029.020.288.3
BEIJING180016.5117.532.919.381.2
Table 2. Energy consumption discrepancy in positive, 0th, and negative VSP bins.
Energy Consumption of WLTC
/(kW·h per Trip)
Energy Consumption of CLTC-P
/(kW·h per Trip)
Energy Consumption of Beijing Trip Segment
/(kW·h per Trip)
EVsCVsEVsCVsEVsCVs
Positive VSP Bins5.912.93.58.64.28.9
0th VSP bin0.21.60.42.70.43.2
Negative VSP Bins−0.31.5−0.21.4−0.11.4
SUM5.816.03.712.84.513.4
Disclaimer/Publisher’s Note: The statements, opinions and data contained in all publications are solely those of the individual author(s) and contributor(s) and not of MDPI and/or the editor(s). MDPI and/or the editor(s) disclaim responsibility for any injury to people or property resulting from any ideas, methods, instructions or products referred to in the content.

