Communication

Analytical Diagnostic and Control System of Energy and Mechanical Efficiency of Electric Drives

Educational Center for Digital Technologies, Empress Catherine II Saint Petersburg Mining University, 2, 21 Line of Vasilyevsky Island, 199106 St. Petersburg, Russia
Energies 2025, 18(9), 2266; https://doi.org/10.3390/en18092266
Submission received: 31 March 2025 / Revised: 23 April 2025 / Accepted: 25 April 2025 / Published: 29 April 2025

Abstract

:
The electric drive is strategically placed in the power industry. It is exposed to wear and tear, defects, and constructional damage, as is any technical device. An information–analytical system is presented in this work. It performs the tasks of monitoring, diagnostics, general assessment of technical condition, and continuous assessment of energy and mechanical efficiency of the electric drive based on the analysis of immediate values of currents and voltages. The system modules are finished products with practical application, which are supported by experimental validation. This article contains a detailed description of the methods implemented in the system development, as well as a description of the laboratory bench and equipment used in our experiments. The information–analytical system is shown and proved on the basis of a fault reconstruction example with electric drive misalignment. According to the obtained results, recommendations for preventive control and proposals for development in this direction are formulated.

1. Introduction

Automated electric drives are crucial parts of most production processes across all industries [1]. The electric drive is both the largest consumer and the largest generator of electric power. The power capacity of such units varies from 10 to 100 kW up to 10 MW or more, and they are involved in many areas of human activity [2,3].
The integration of wind turbines into power systems that use synchronous generator drives is increasingly being developed nowadays [4,5]. A significant segment of the market is represented by electric vehicles, including low-power electric scooters, electric bicycles, and electric motorbikes [6,7]; medium-power passenger cars of leading brands in the automotive industry [8]; public urban transport [9]; and large and ultra-large capacity conveyor transport and lifting equipment [10,11], as well as dump trucks with electric transmission, excavators [12,13], and many other machines in the mining industry.
The electric drive is an electromechanical transformer with electrical, mechanical, electromagnetic, and electronic subsystems. Its main function is to drive machine actuators and mechanisms with automatic control. Their efficiency depends on the qualitative indicators of electric drives [14,15]. The electric drive, like many technical devices, is exposed to wear and tear and faults at the stages of design, assembly, and operation. These phenomena undoubtedly lead to a decrease in drive efficiency, which in the period of operation leads to various technical problems, in particular to a decline in performance, reliability, and economic efficiency [16].
Since the electric drive is made up of many parts, the main causes of wear and malfunctions are as follows:
(1)
Mechanical wear. Wear of bearings, gears, belts, and other mechanical components due to friction and loads. Deformation and component damage due to mechanical impacts [17,18].
(2)
Electrical wear and tear. Overheating and ageing of wire insulation and motor windings. Semiconductor elements, such as diodes and transistors, are damaged due to overheating or overvoltage [19,20].
(3)
Malfunctions of the control system. Malfunctions of sensors, controllers, and other control system elements due to damage or incorrect settings. Software and control algorithm failures [21].
(4)
External factors. Environmental effects, such as dust, moisture, temperature, and vibrations. Improper operation and maintenance of the drive [22].
Reduced efficiency of the electric drive can take the following forms [23]:
(1)
A decrease in power and torque of the electric drive motor.
(2)
Increased power consumption.
(3)
A decrease in the accuracy and stability of motion control.
(4)
Deterioration of the electric drive dynamic characteristics.
Regular maintenance is generally practised to prevent the wear, malfunction, and reduced efficiency of a drive, including inspection and replacement of worn parts, cleaning and lubrication of mechanical components, diagnostic measurements, and inspection and adjustment of the control system. It is also essential to follow the drive operating instructions. However, a review of drive failure statistics in industries such as the road transport [24], mining [25], and oil [26] industries confirms that these measures are not sufficient. In addition to the main damage caused during an unexpected or emergency stop of the drive, there are consequential damages and risks. Consequential damage consists of partial or total destruction of mechanical equipment connected with the electric drive [27]. In this case, there are risks of personal injury in the area of such equipment and the development of an emergency situation at a technogenic level, as well as downtime and shortfalls in planned profits [28].
It is worth mentioning that cascade transformers with a modular system increase reliability and maintainability [29,30,31]. The solutions designed to improve the energy efficiency of transformers are based on control algorithms at different levels, from the drivers of power transistors up to the level of inverter control, and, in some cases, they operate together with a controlled rectifier. Efficiency improvement issues require a special, comprehensive study. It should be acknowledged, however, that the achieved efficiency indicators in design and commissioning works decrease with operation time.
Control, protection, monitoring, and diagnostic systems are implemented to control wear processes, accidental defects, or design faults at various stages of operation. The quality and functionality of such systems depend on the drive’s capacity. Monitoring and diagnostics of electrical machines are required to provide reliable and efficient operation. There are several methods that can be used to monitor this and prevent possible malfunctions.
Vibration analysis is mainly based on measuring and analysing the vibrations that occur in a machine during operation. Vibrations can be caused by various factors, such as rotor unbalance, bearing wear, gear defects, etc. Analysing vibrations allows the identification of potential faults and allows corrective measures to be taken to eliminate them [32].
Thermography is a method used for measuring the temperature of different parts of an electrical machine with the help of infrared cameras or thermal imaging cameras. Increased temperature indicates overheating, possibly caused by overloading, malfunctions in the cooling system, or other faults [33].
The stator current spectrum method involves analysing the spectrum of the current consumed by an electrical machine. Different variations may indicate such faults as bearing wear, winding defects, or fan failure [34,35].
Insulation is an essential component of an electrical machine, and its condition can affect reliability and operation safety. Insulation condition analysis methods include insulation resistance measurement, electrical strength testing, and partial discharge analysis [36].
The acoustic analysis method is based on the analysis of sound signals that occur when the electrical machine is running. Abnormal sounds such as knocking, grinding, or noise indicate problems with bearings, gears, or other components [37].
Despite the presented solutions, there are still tasks related to real-time diagnostics without loss of quality and reliability of results, such as detection of faults at early stages of development, tracking and assessment of defects’ impact on the characteristics of the drive, and assessment of the total technical condition as a production unit. Moreover, tasks of predicting technical condition and residual life remain relevant.
This article gives an integrated approach for solving several challenges in monitoring, diagnostics, general technical condition assessment, and continuous assessment of energy and mechanical efficiency based on current and voltage analysis.
This paper has the following structure. Section 2: the structure of the information–analytical system with a detailed description of the principle of operation and functionality of each module separately. Section 3: description of the laboratory bench with experimental evidence of the modules’ operation. Section 4: the main conclusions and results.

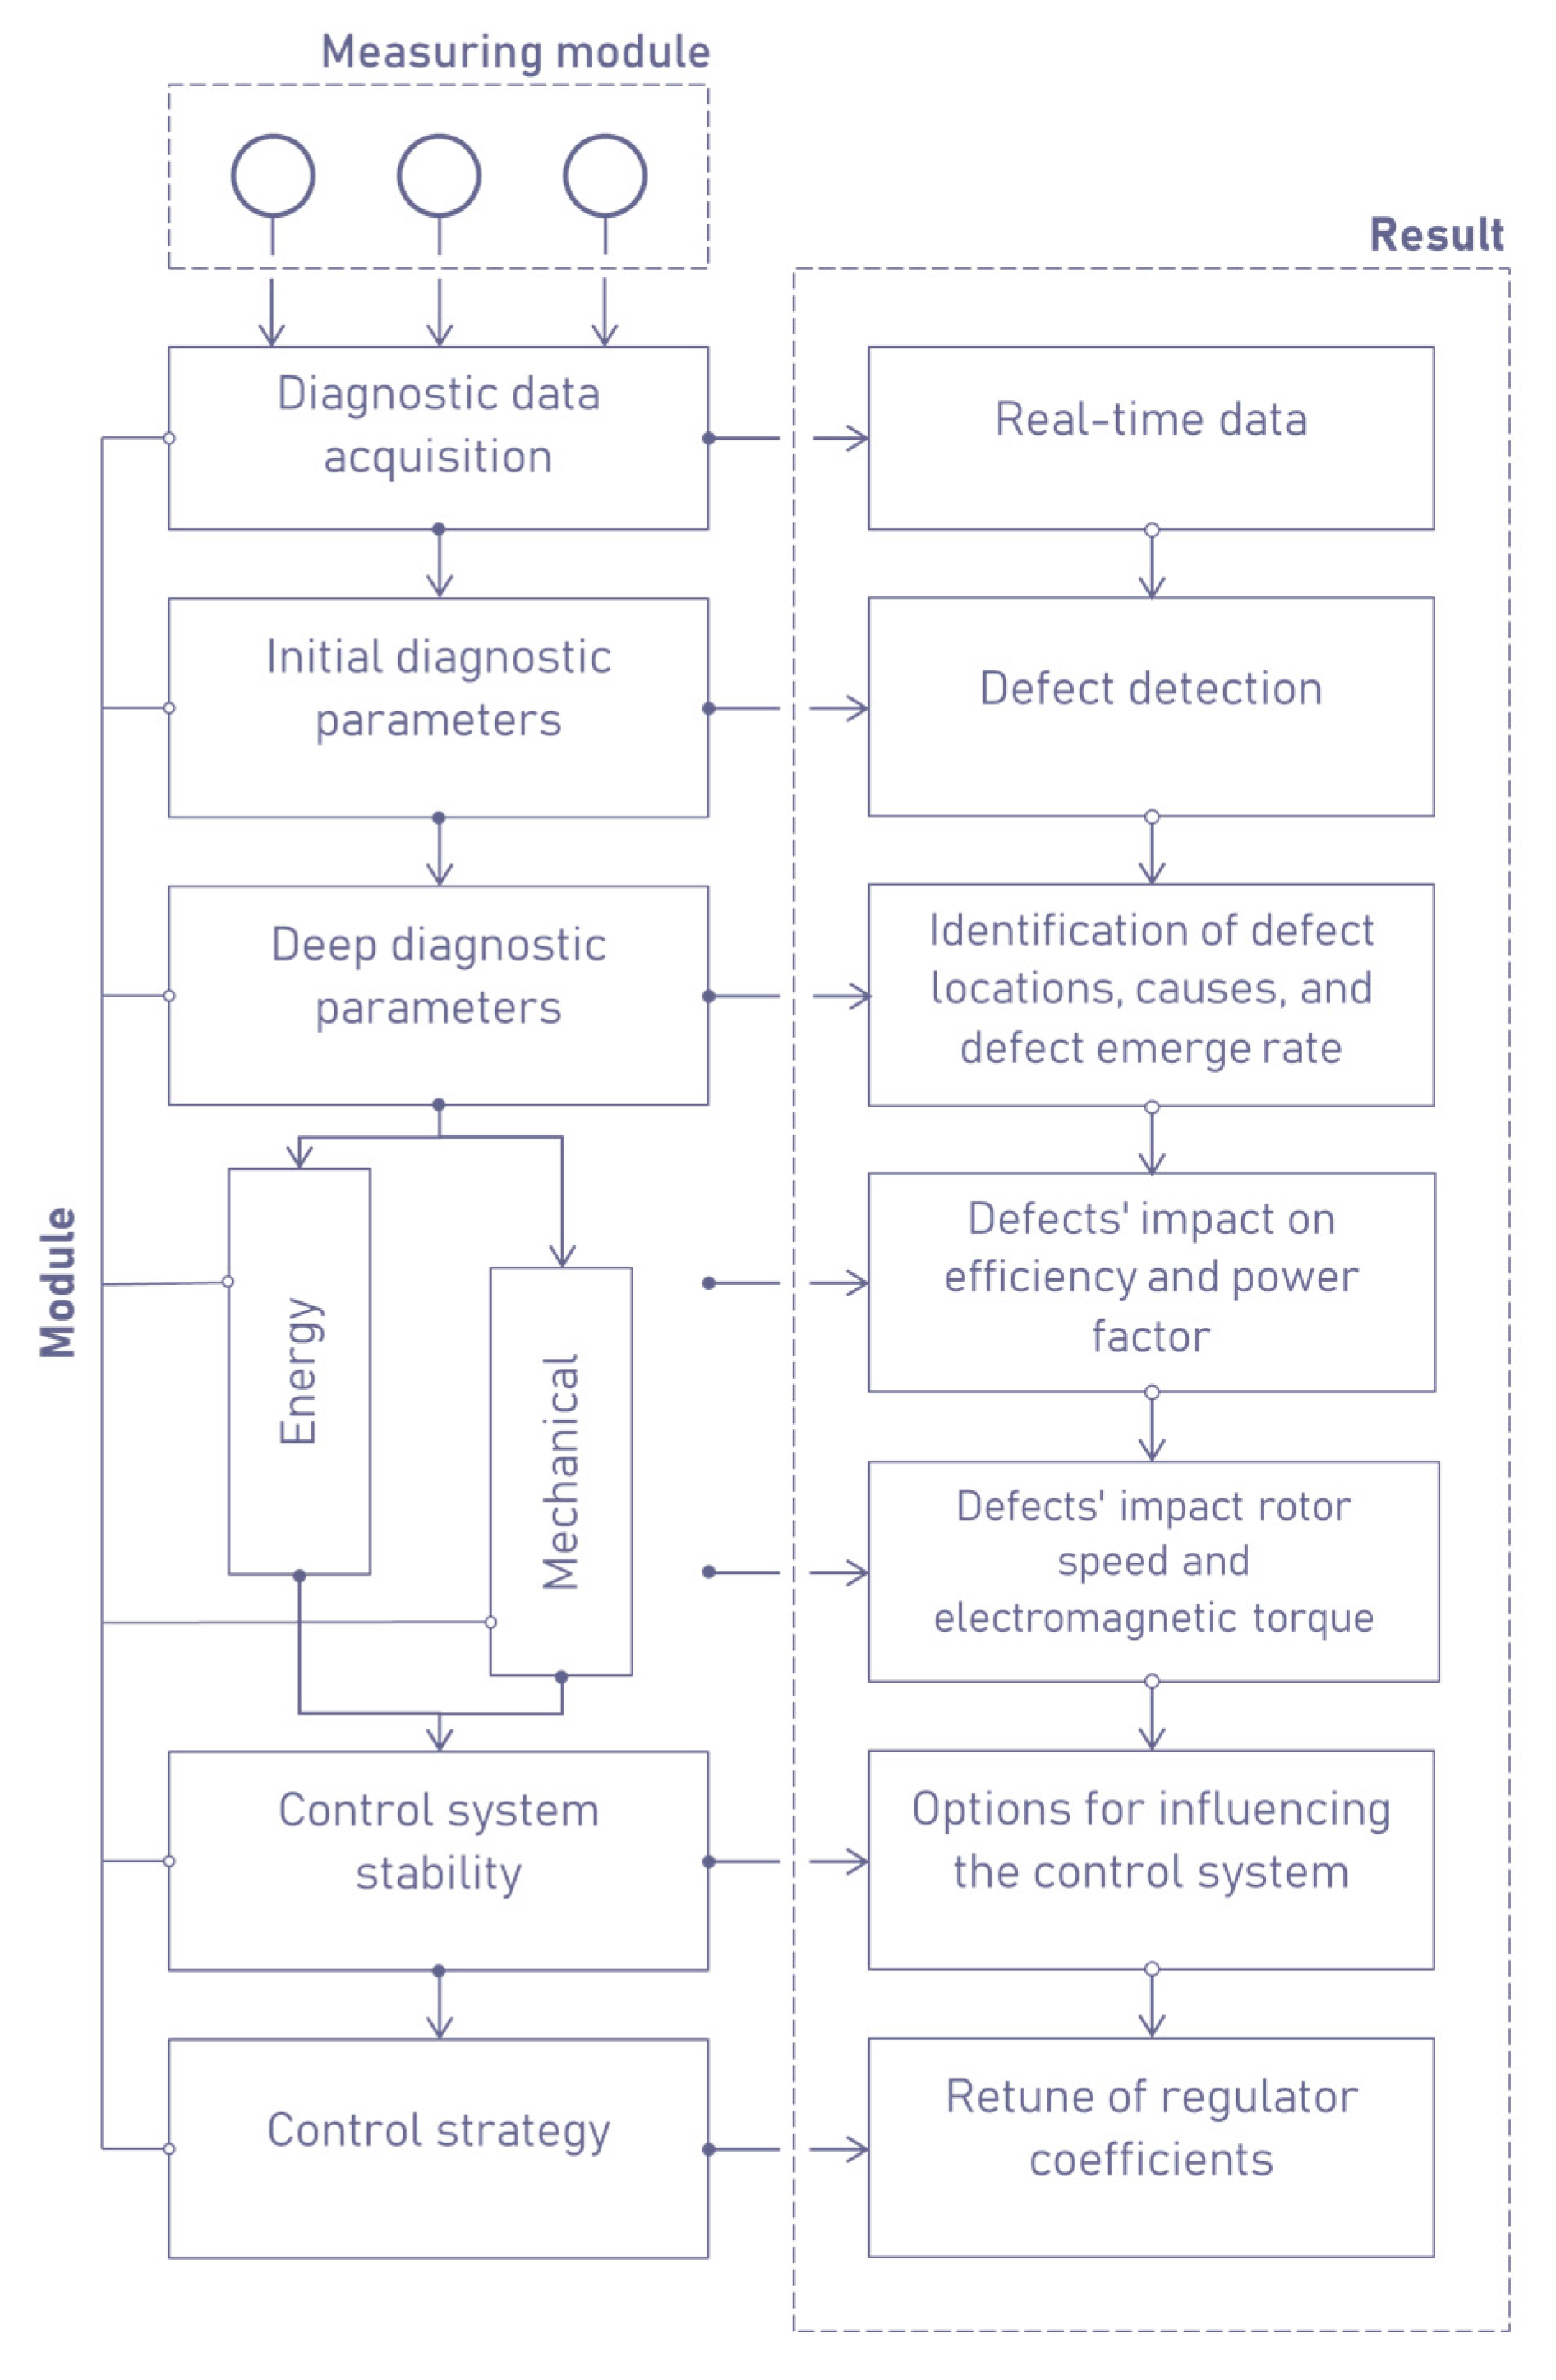
2. Materials and Methods

The object of study is an electric drive. Its general structure can be represented as in Figure 1a. The common structure consists of an electrical network the drive is connected to via a step-down transformer. A wire frequency converter with an uncontrolled rectifier with a direct current (DC) link and a voltage inverter is then connected to it. The amplitude and frequency of the AC voltage applied to the motor are regulated by control algorithms of the inverter power keys (transistors). Thus, rotor speed is adjusted. A process-dependent mechanical load is connected to the drive accordingly. It is posited that the results obtained in this study can be applied to any type of load, irrespective of the rotor speed and torque diagram. It was taken into account that the power connection of diodes/transistors and the number of semiconductor levels were not considered. The measuring module in Figure 1b is installed between the frequency inverter and motor. One measuring module consists of a current sensor (CS) and a voltage sensor (VS) per phase (L1). As a result, for a 3-phase system, the measuring module consists of 3 current sensors and 3 voltage sensors. The sensors’ operational mechanism is predicated on the Hall effect. The physical manifestation of the system under investigation is constituted by a ferromagnetic ring, which is locked around the conductor. The results obtained from the implementation of such a system can be applied to any type of load, and are independent of the rotor speed and torque diagrams. The shown advantage is that the system does not require additional modification of the electric drive to connect the control and measuring equipment. The measuring module can be installed in one of two ways: either on an already operating actuator or integrated into one that is to be designed.
The structure of the information–analytical system (Figure 2) consists of 7 modules:
(1)
Diagnostic data acquisition;
(2)
Initial diagnostic parameters calculation;
(3)
Deep diagnostic parameter calculation;
(4)
Evaluation of energy efficiency;
(5)
Evaluation of mechanical efficiency;
(6)
Control system stability;
(7)
Control strategy.
Each module represents a fully fledged and stand-alone solution. However, the input data of each module are the output data of the previous one. The results that are presented in Figure 2 illustrate the functional purpose of each module. The development of each module was built on the basis of a scientific and practical task.
The following section provides a more detailed description of the operation principle and functional capabilities of these modules.

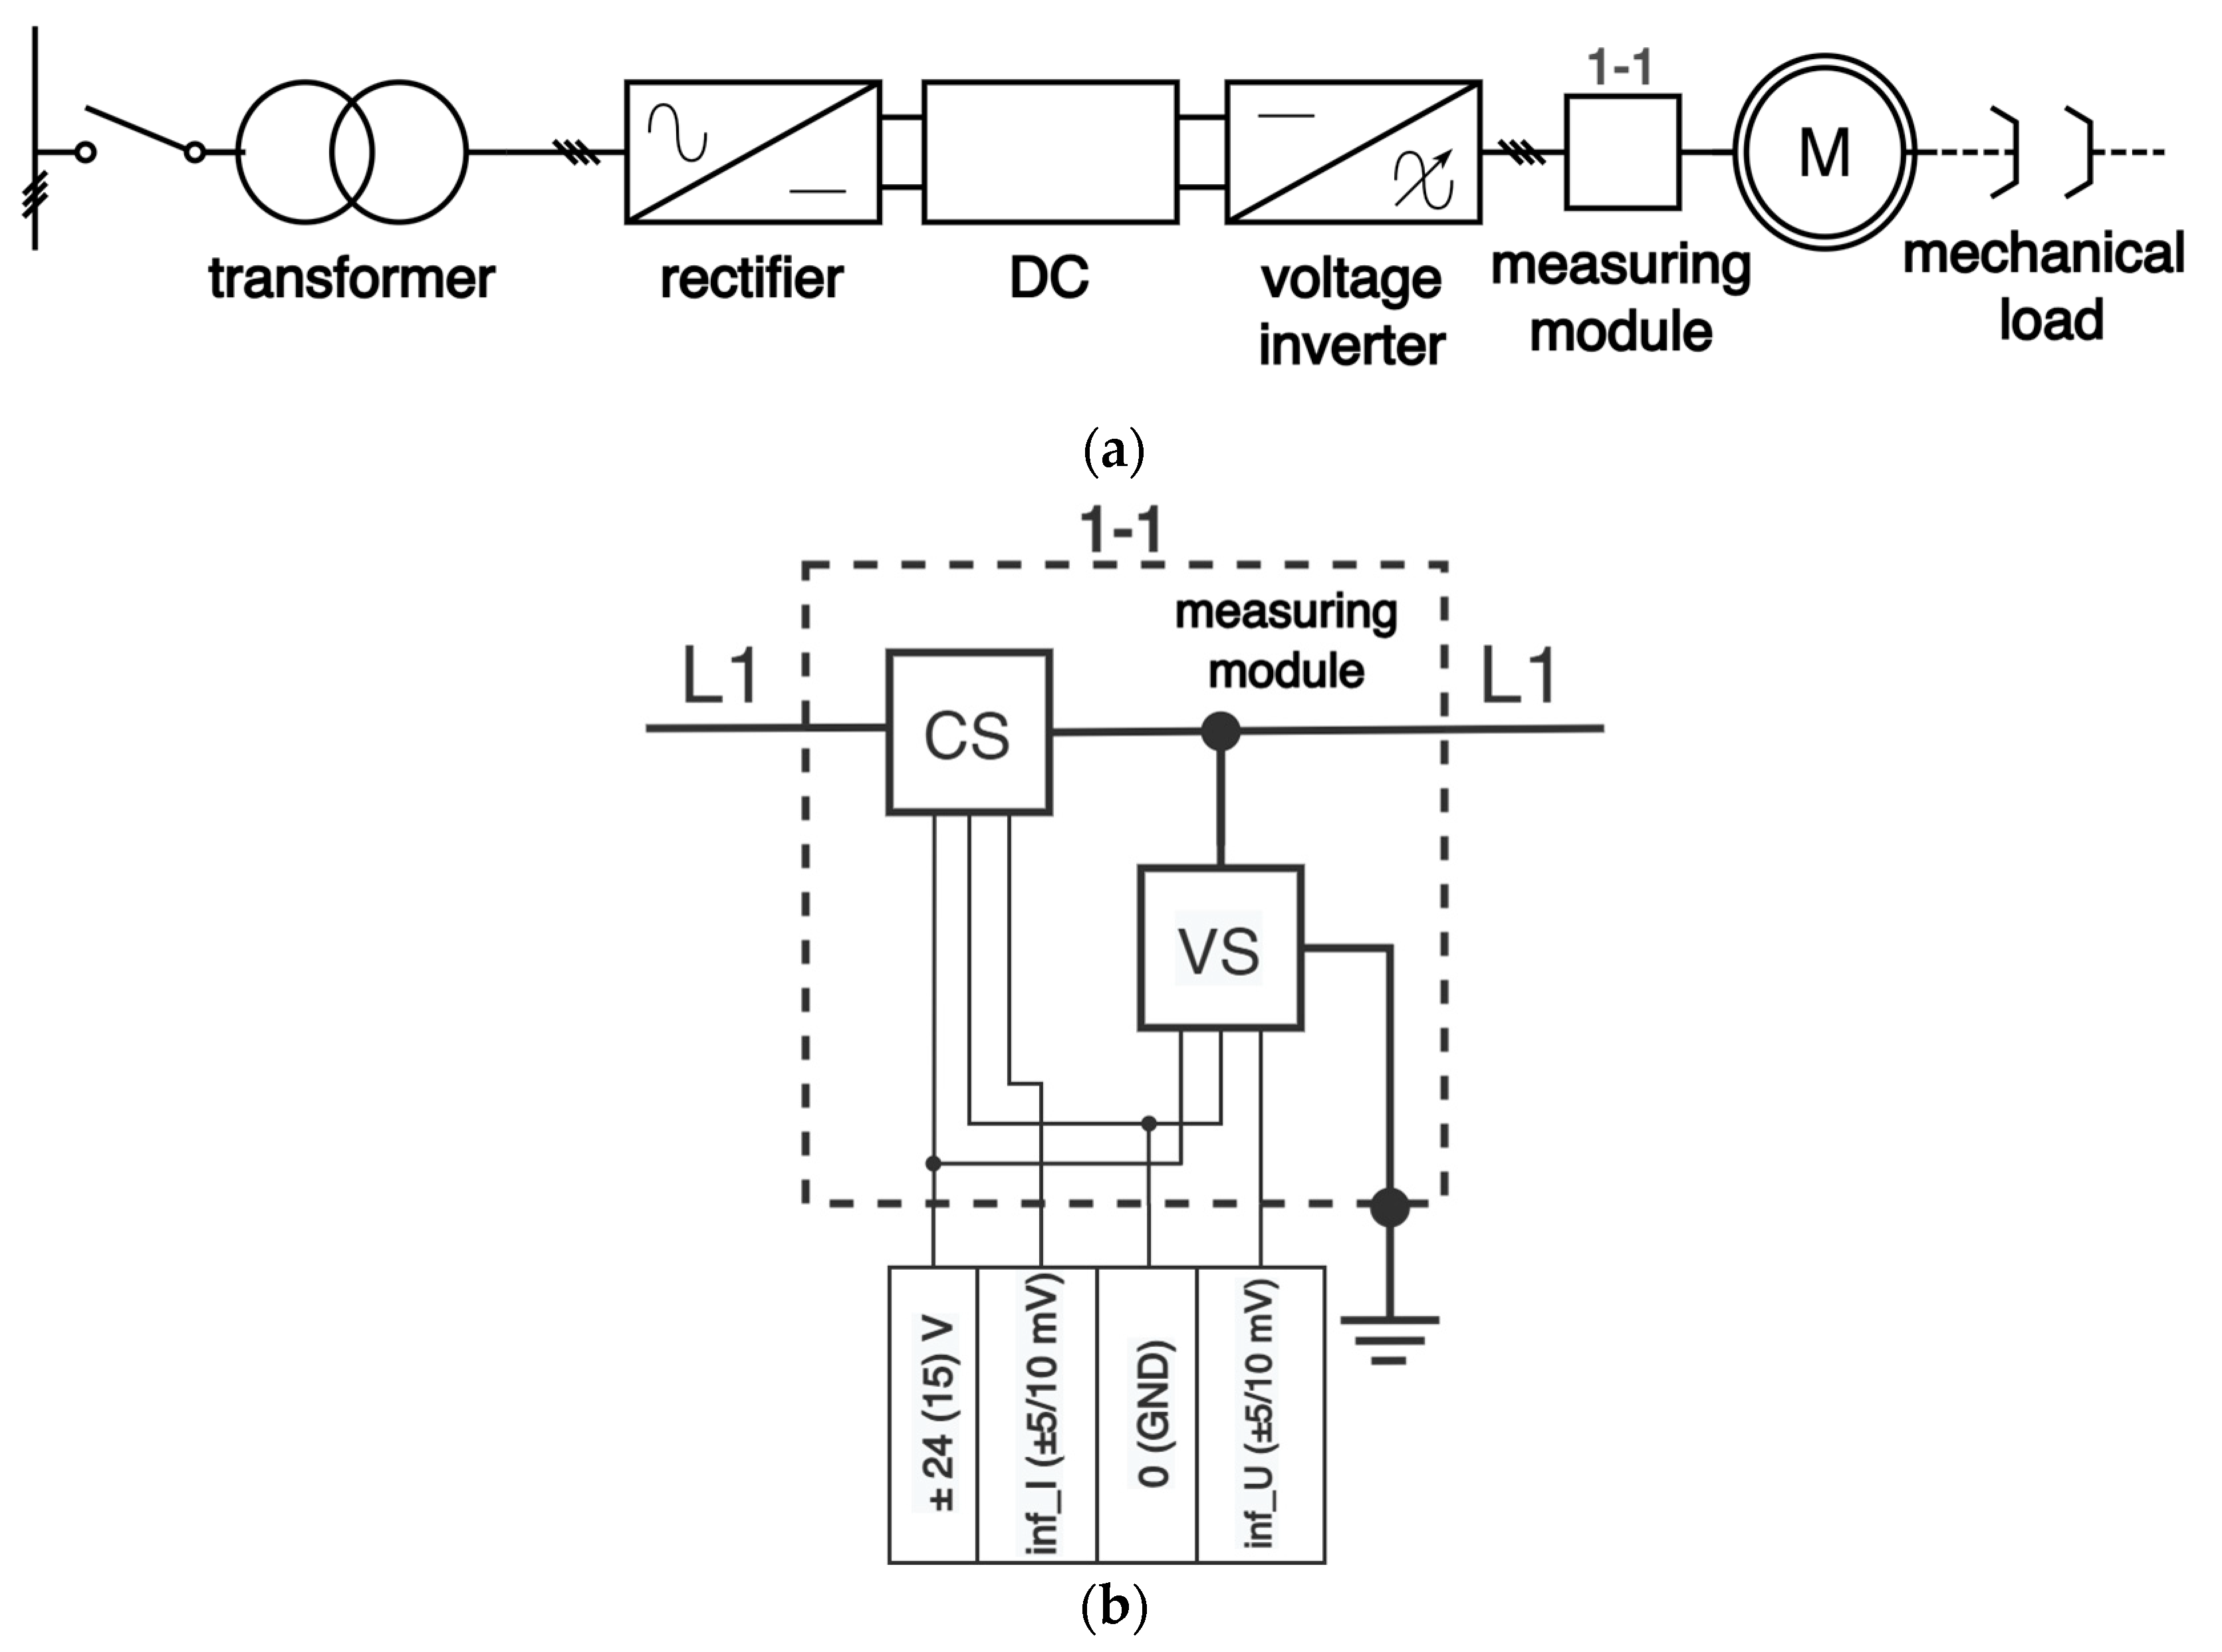
2.1. Measuring Module

Initial measurement sensors are current sensors (CSs) and voltage sensors (VSs), according to Figure 1b. The operation of sensors is predicated on the Hall effect and compensation type. The configuration under consideration facilitates the registration of signals with a broad spectrum of sampling frequencies, reaching up to 10 kHz per channel. In addition, it is designed to minimise the impact of noise and electromagnetic interference, which are phenomena caused by the semiconductor converter. The subsequent stage of the process involves equalising the levels of recorded signals. This is achieved by means of an analogue-to-digital converter (ADC). The ADC’s function is to convert the analogue signal into a digital one, which is then stored, processed, and reproduced (Figure 3).
The generation of a database of instantaneous values of AC motor currents and voltages is shown in Figure 4.

2.2. Calculation Module of Primary Diagnostic Parameters

Analysis oscillograms of instantaneous values of currents and voltages (Figure 3) give little usable information. A method of generalised current and voltage vectors is proposed as a fast-acting tool that does not require large computing power.
Generalised current and voltage vectors (Park’s hodograph) [38] are produced by transferring from the rotating three-phase system of currents drawn by the induction motor and source (uA, uB, uC, iA, iB, iC) [39] to the two-phase system of currents (Ud, Uq, Id, Iq) of the rotating coordinate system dq using mathematical Formulas (1)–(4). These equations are valid for asymmetric systems, as is the case with AC motors, due to their imperfect design [40,41,42].
U d = 2 3 × u A 1 6 × u B 1 6 × u C ;
U q = 1 2 × u B 1 2 × u C ;
I d = 2 3 × i A 1 6 × i B 1 6 × i C ;
I q = 1 2 × i B 1 2 × i C ;
where
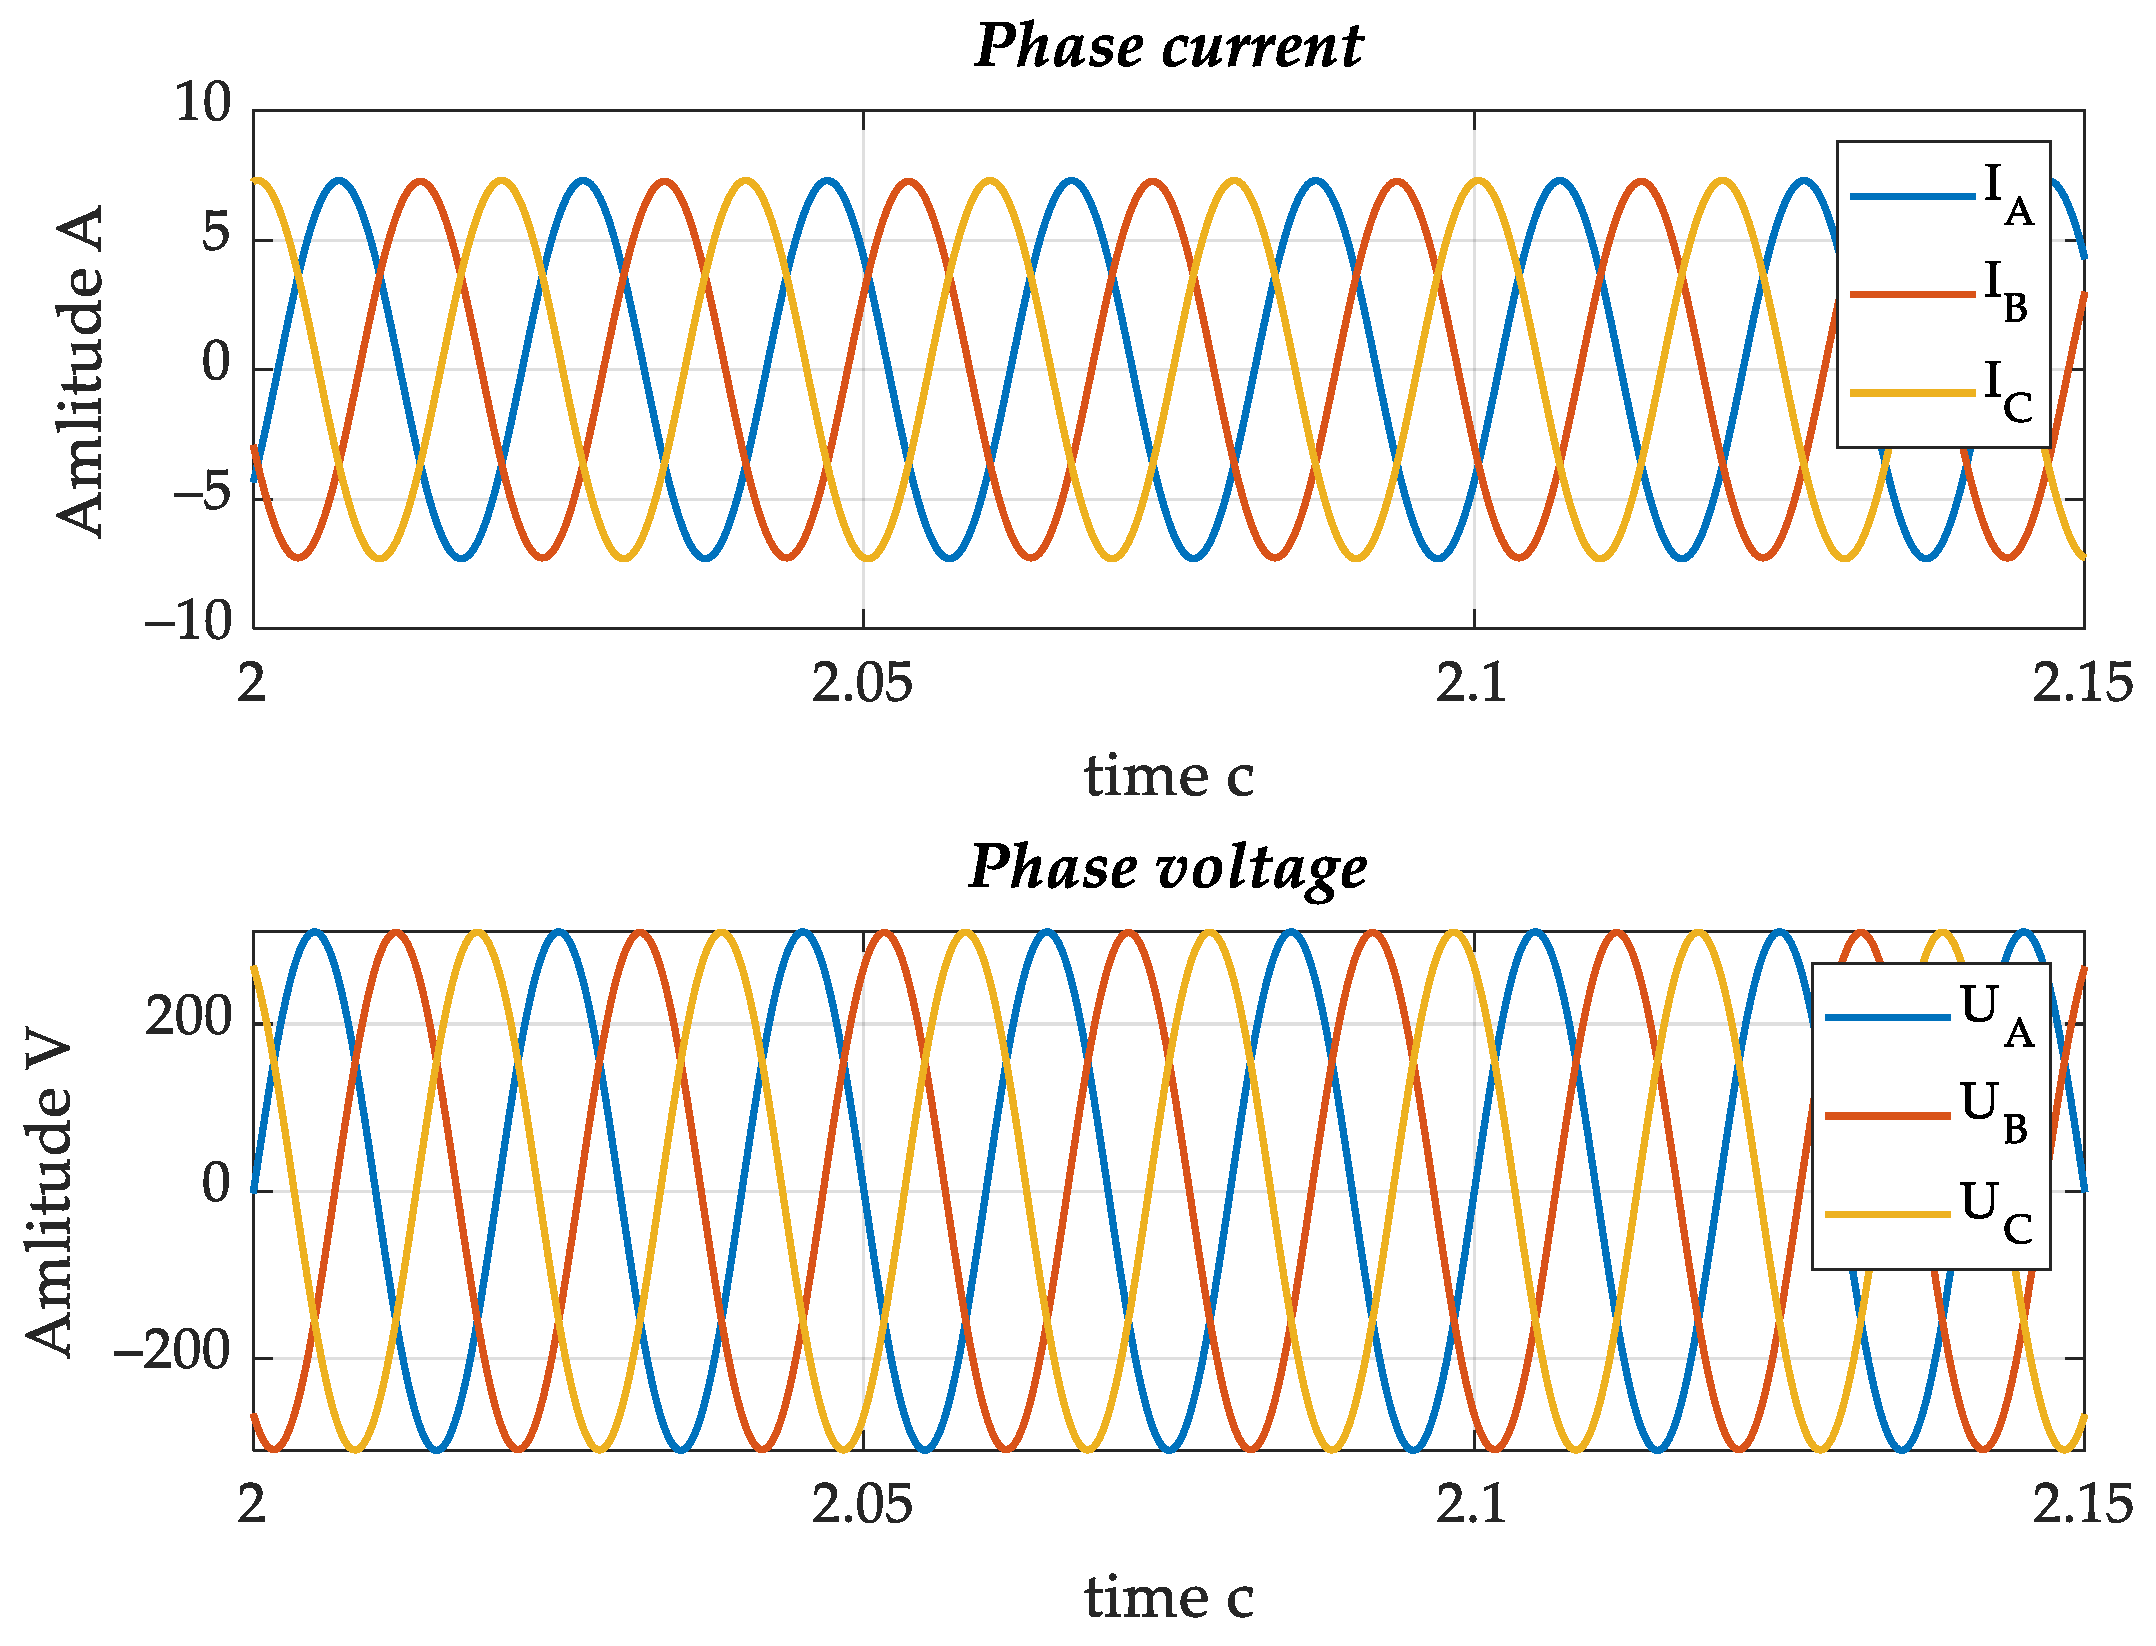
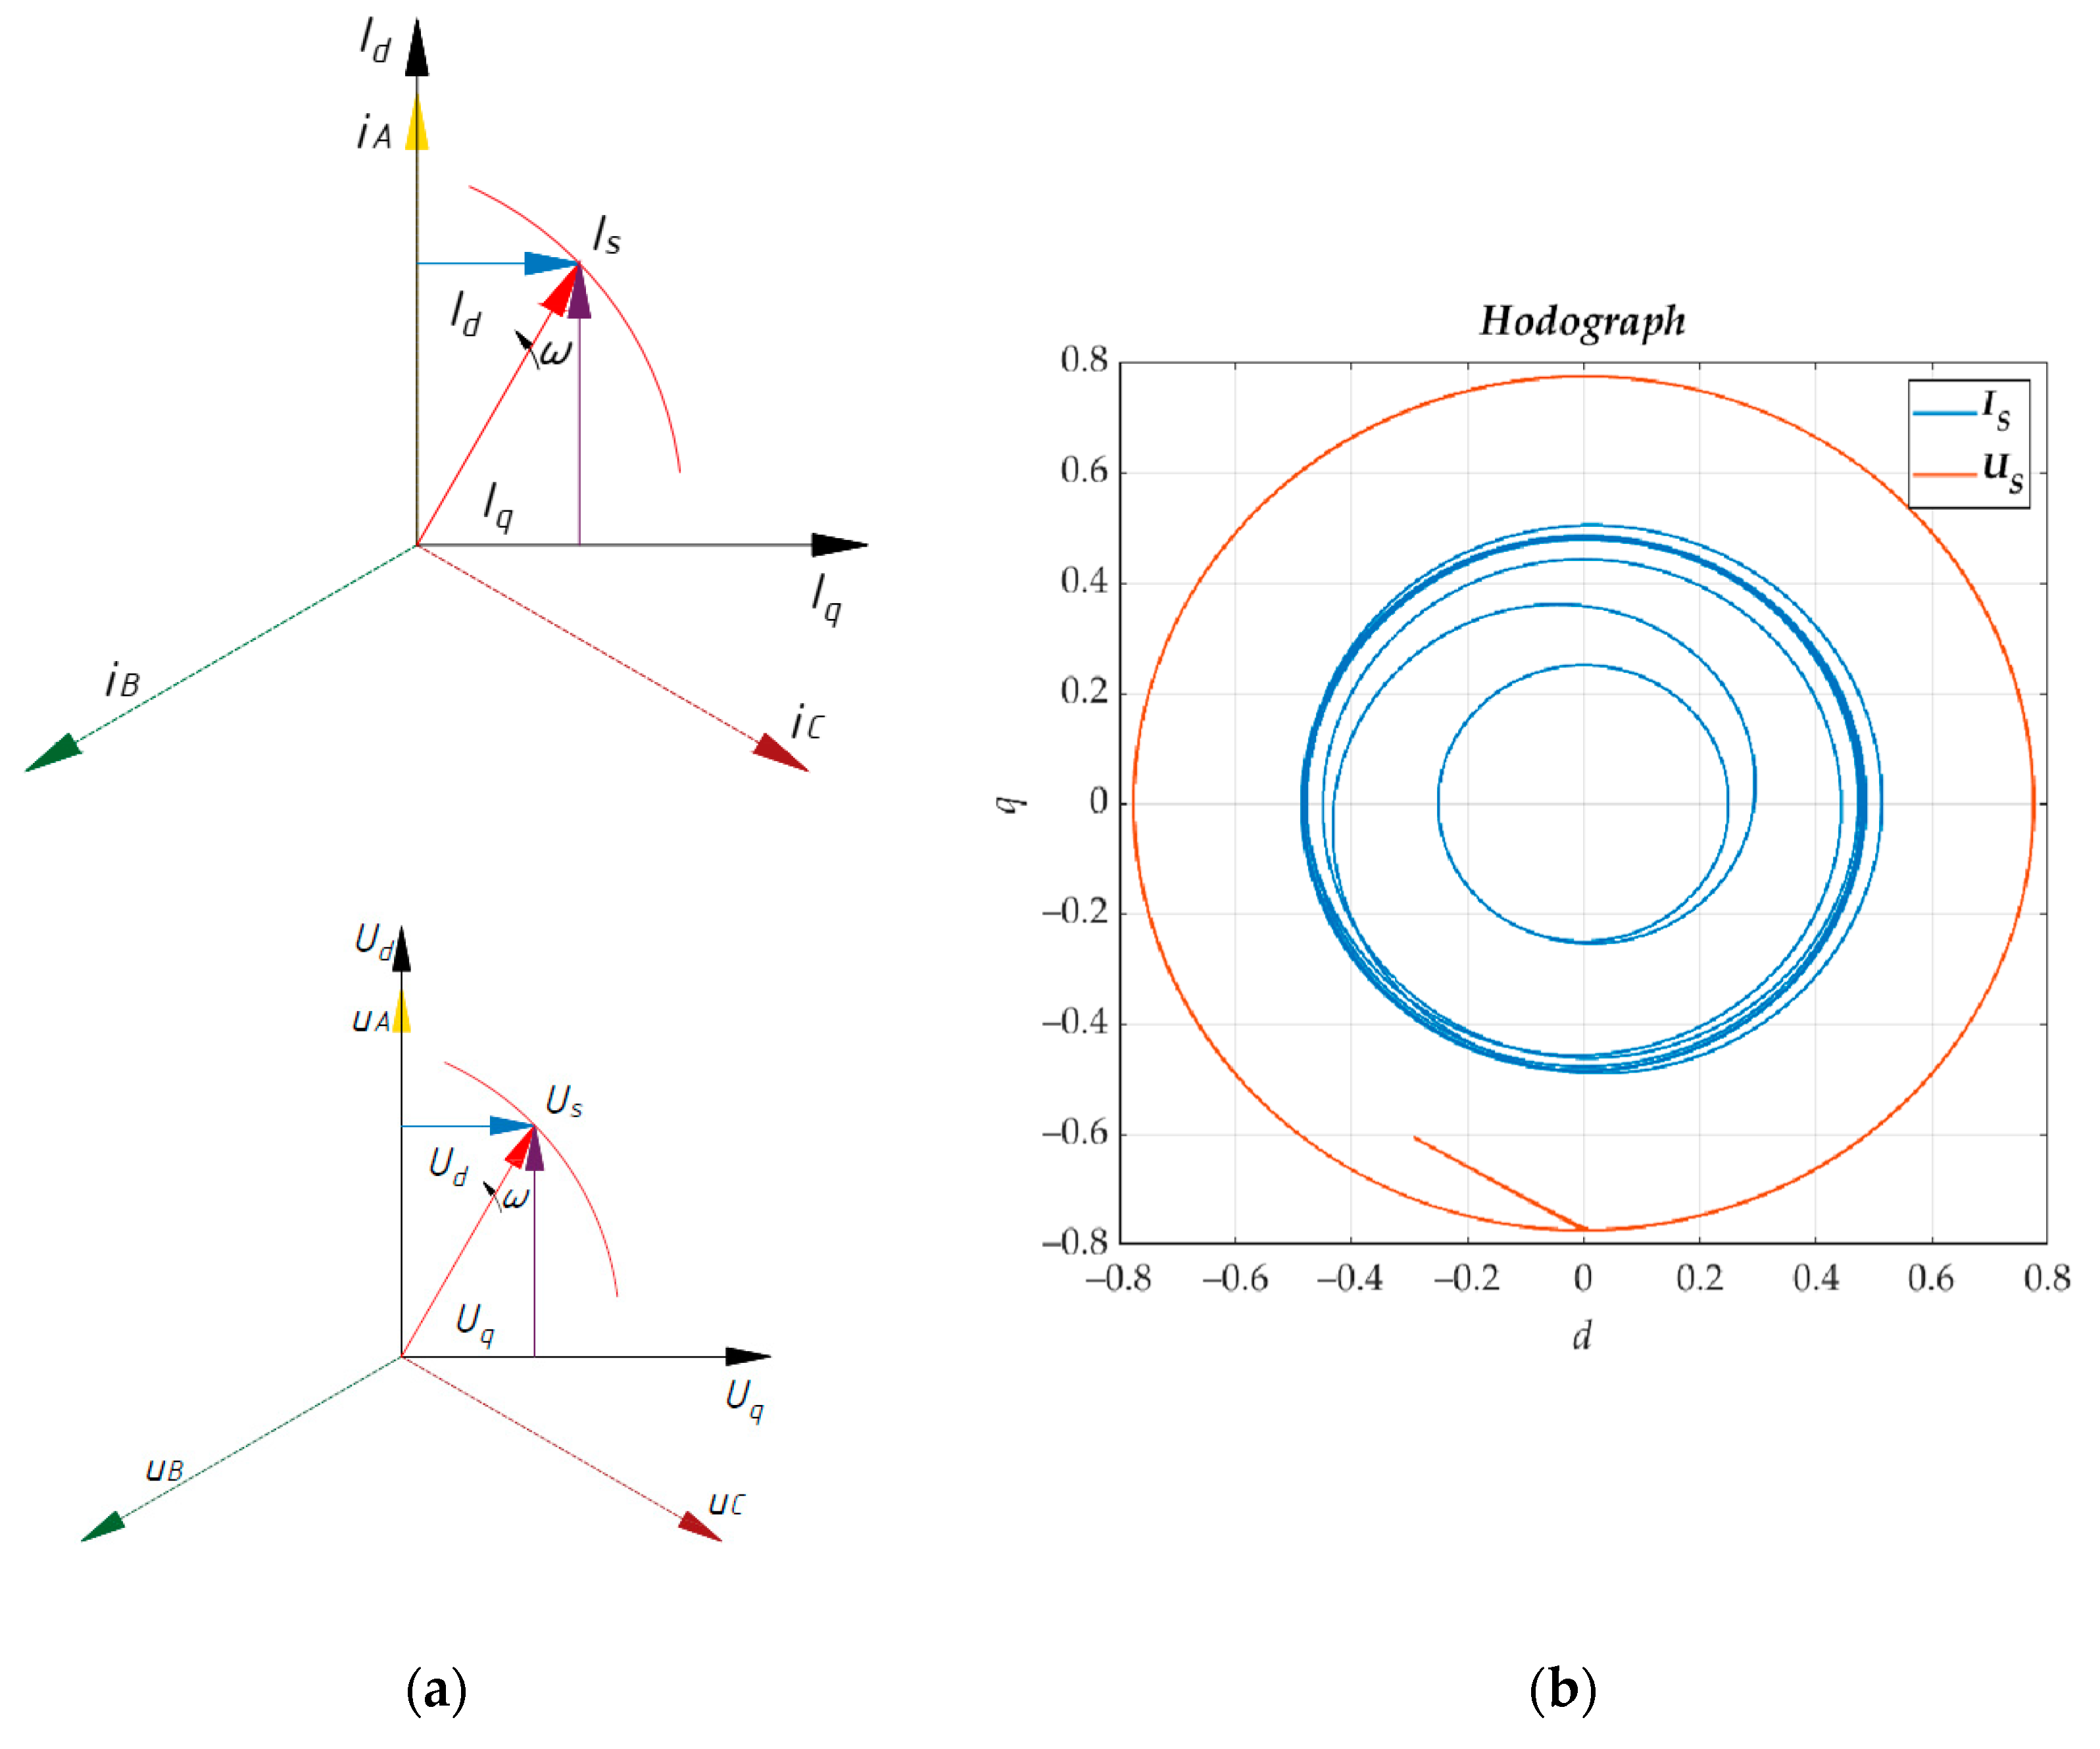
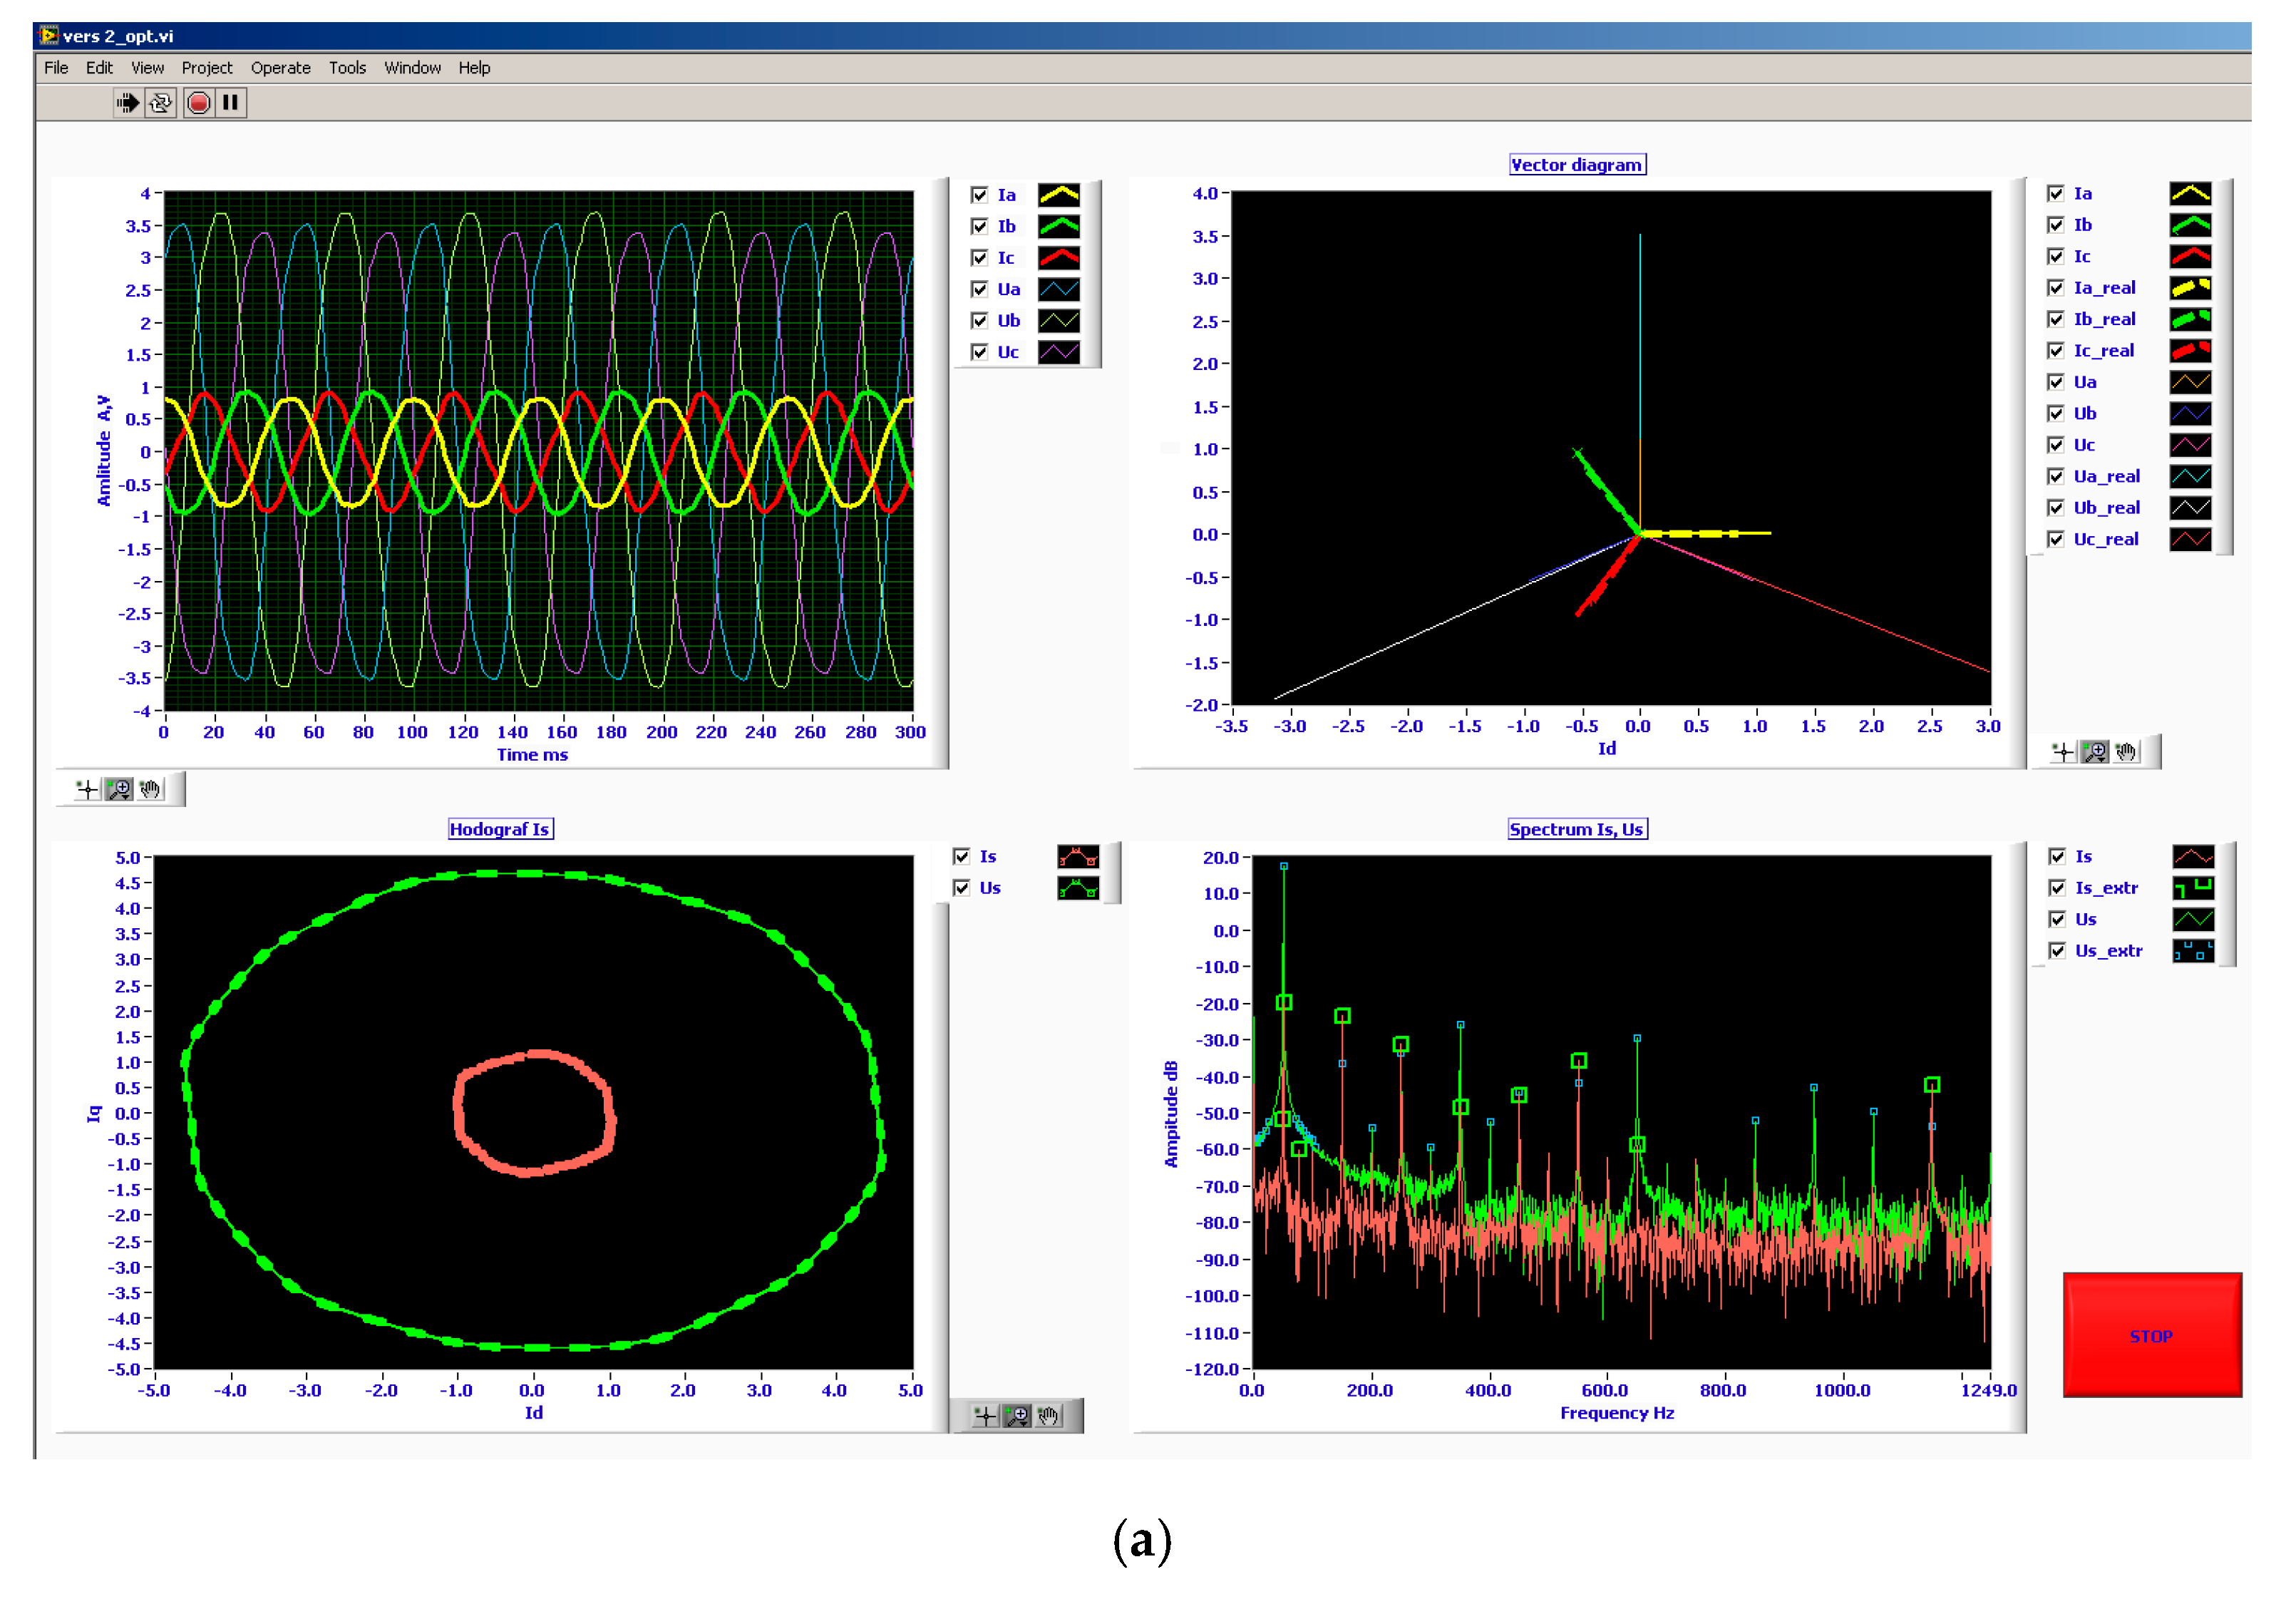
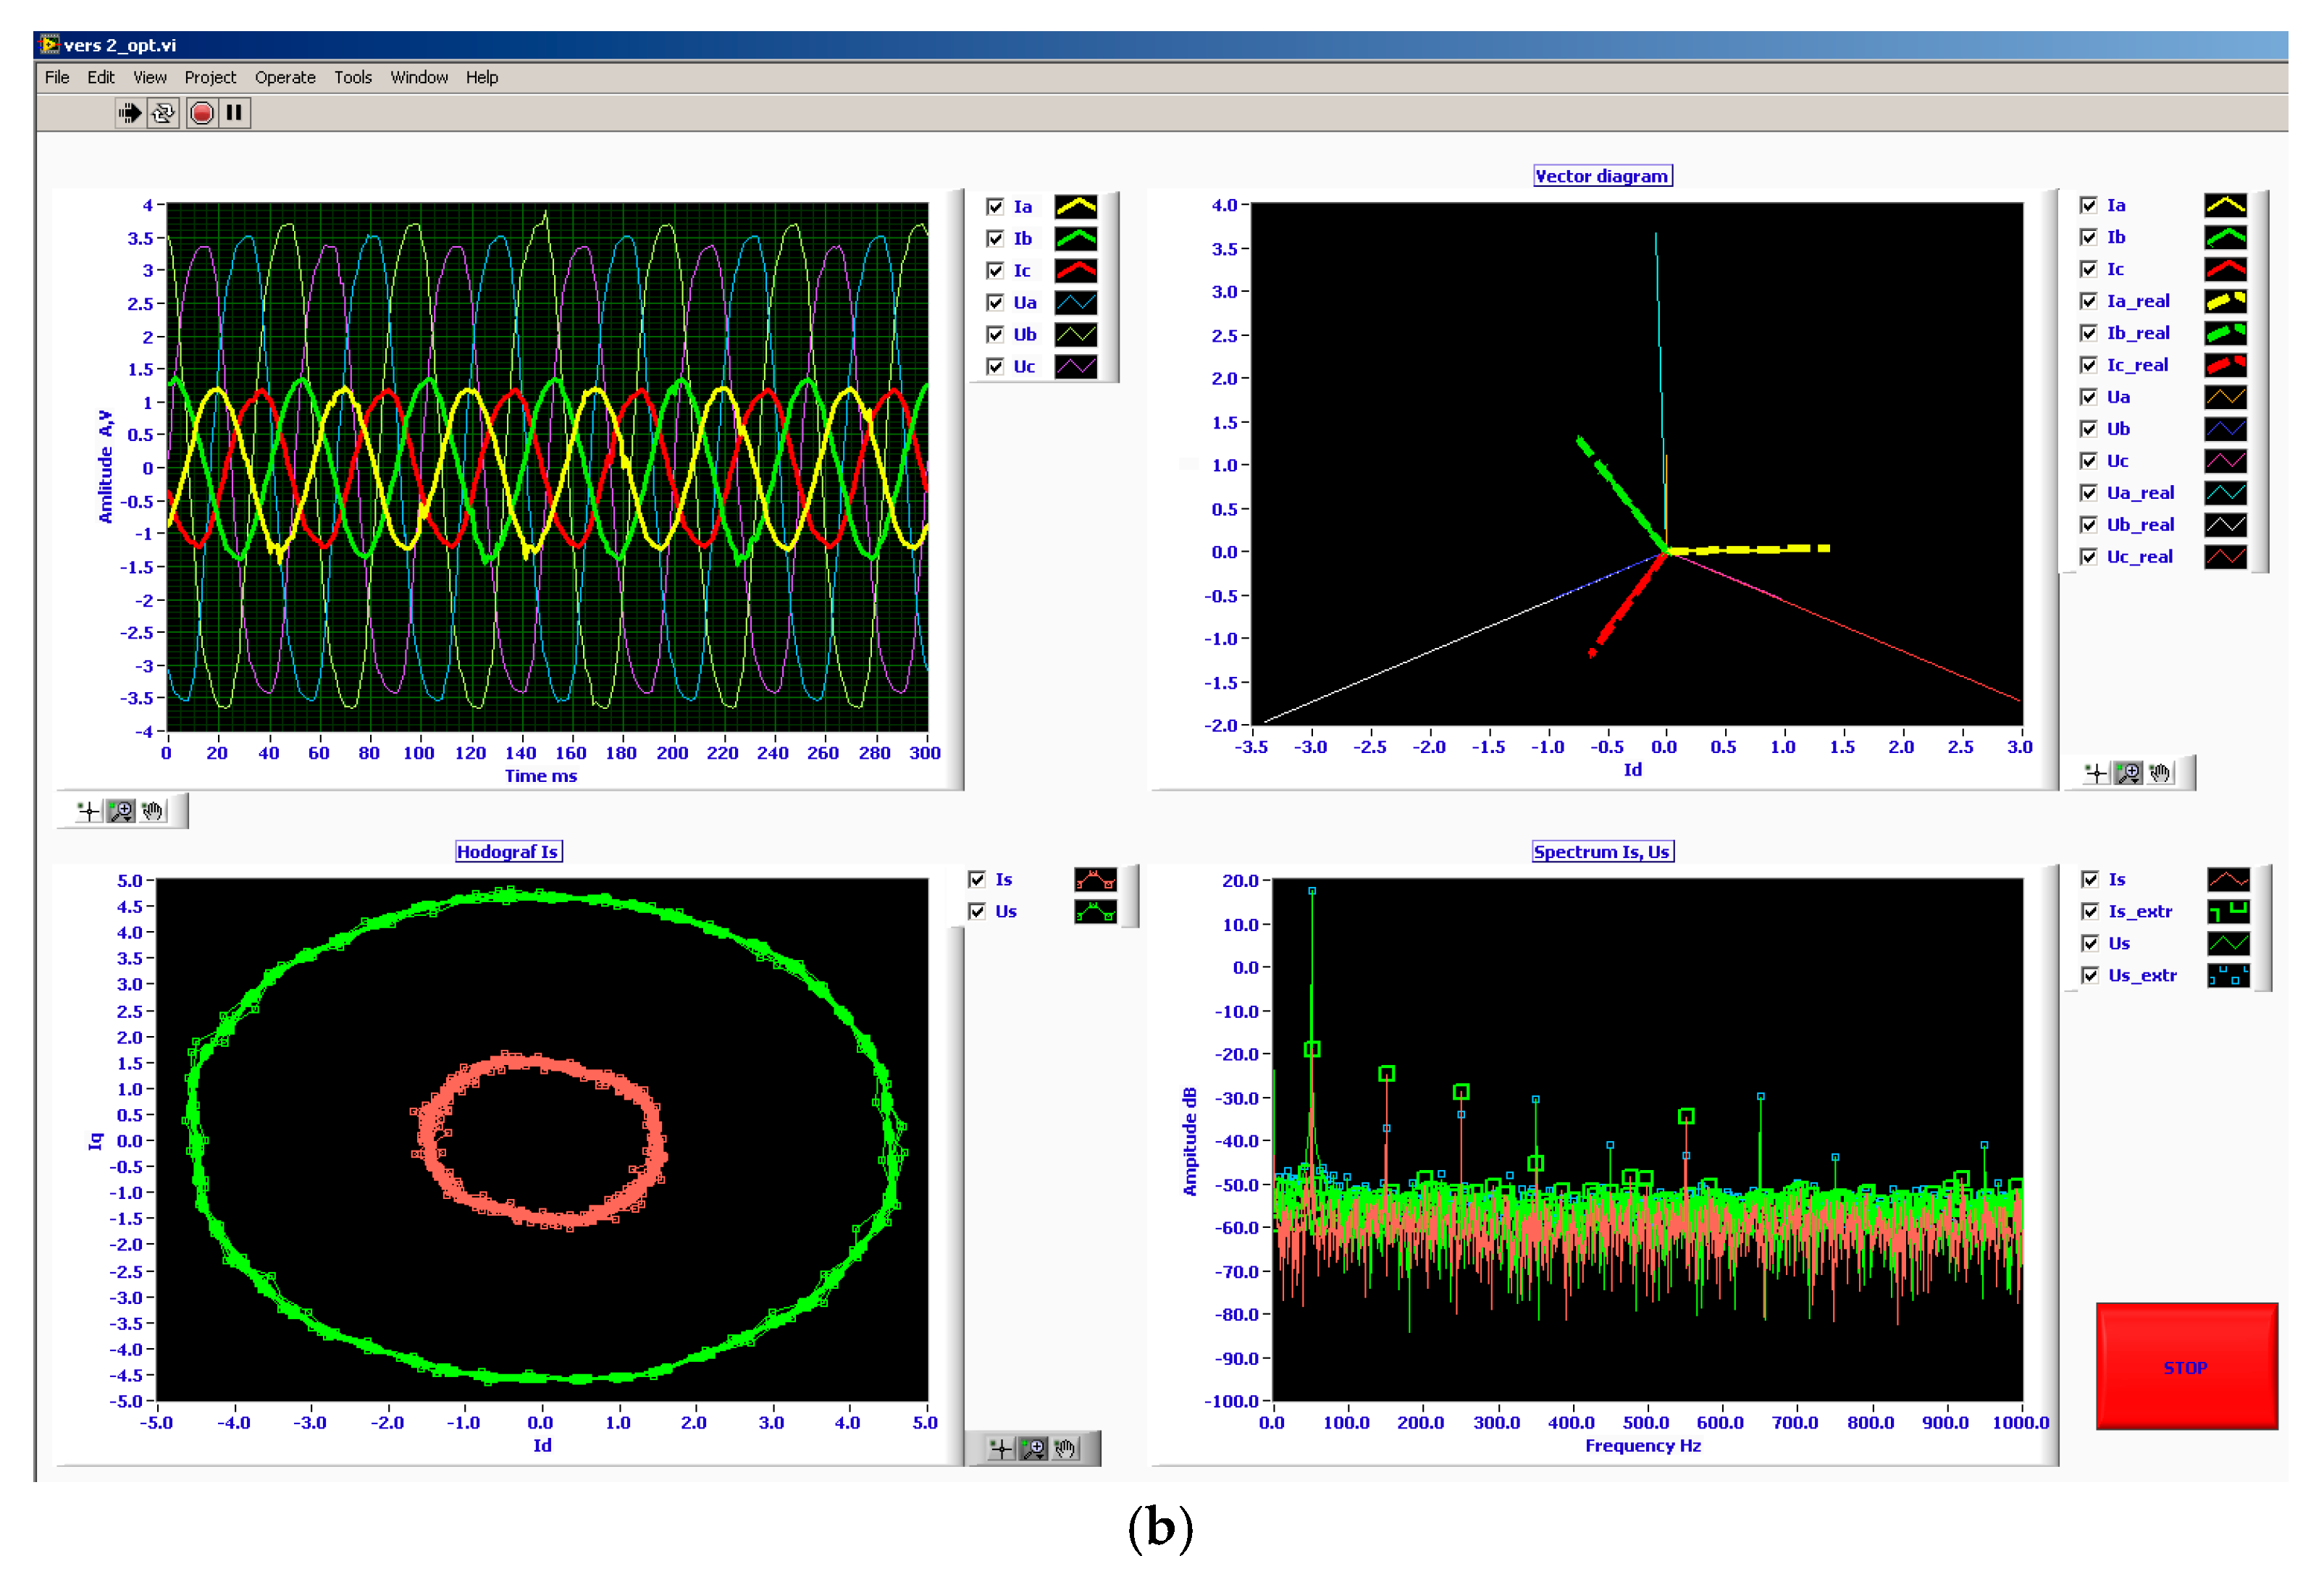
  • Ud, Uq, Id, Iq—voltage and currents consumed by an AC motor in the 2-phase rotating coordinate system, dq;
  • uA, uB, uC, iA, iB, iC—voltage and currents consumed by an AC motor in the 3-phase rotating coordinate system, ABC.
Based on the coordinate system dq, the generalised current vectors IS and voltage vectors US are represented as (5) and (6) and according to (1)–(4).
I S = I d + j × I q ;
U S = U d + j × U q ;
Current IS and voltage vectors US characterise the trajectory—hodographs (Figure 5a). If we assume that the power supply has unlimited power and the drive power is relatively insufficient, the IS current and US voltage hodographs will change shape in the same way in relation to the phase shift between each other under power quality conditions. In the event of electrical machines malfunctioning, undergoing a change in mode or load, a variation pattern is observed in the IS current hodograph alone, while the US voltage hodograph remains constant (Figure 5b). This effect allows us to separate the diagnostic data of the electric drive motor and the power supply. Variations in current hodograph shape allow real-time detection of abnormalities. In the case of abnormal deviations’ absence, no further calculation is required.
In addition to hodographs, vector diagram calculations (Figure 6a) are performed for determining the phase angle between the current and voltage, which is essential for analysing system operation and power calculations. The estimation of amplitudes and phase shift facilitates identification of asymmetric modes and types of short-circuits, as well as the estimation of the intensity of zero-sequence signals’ (I0, U0) impact on a given system.

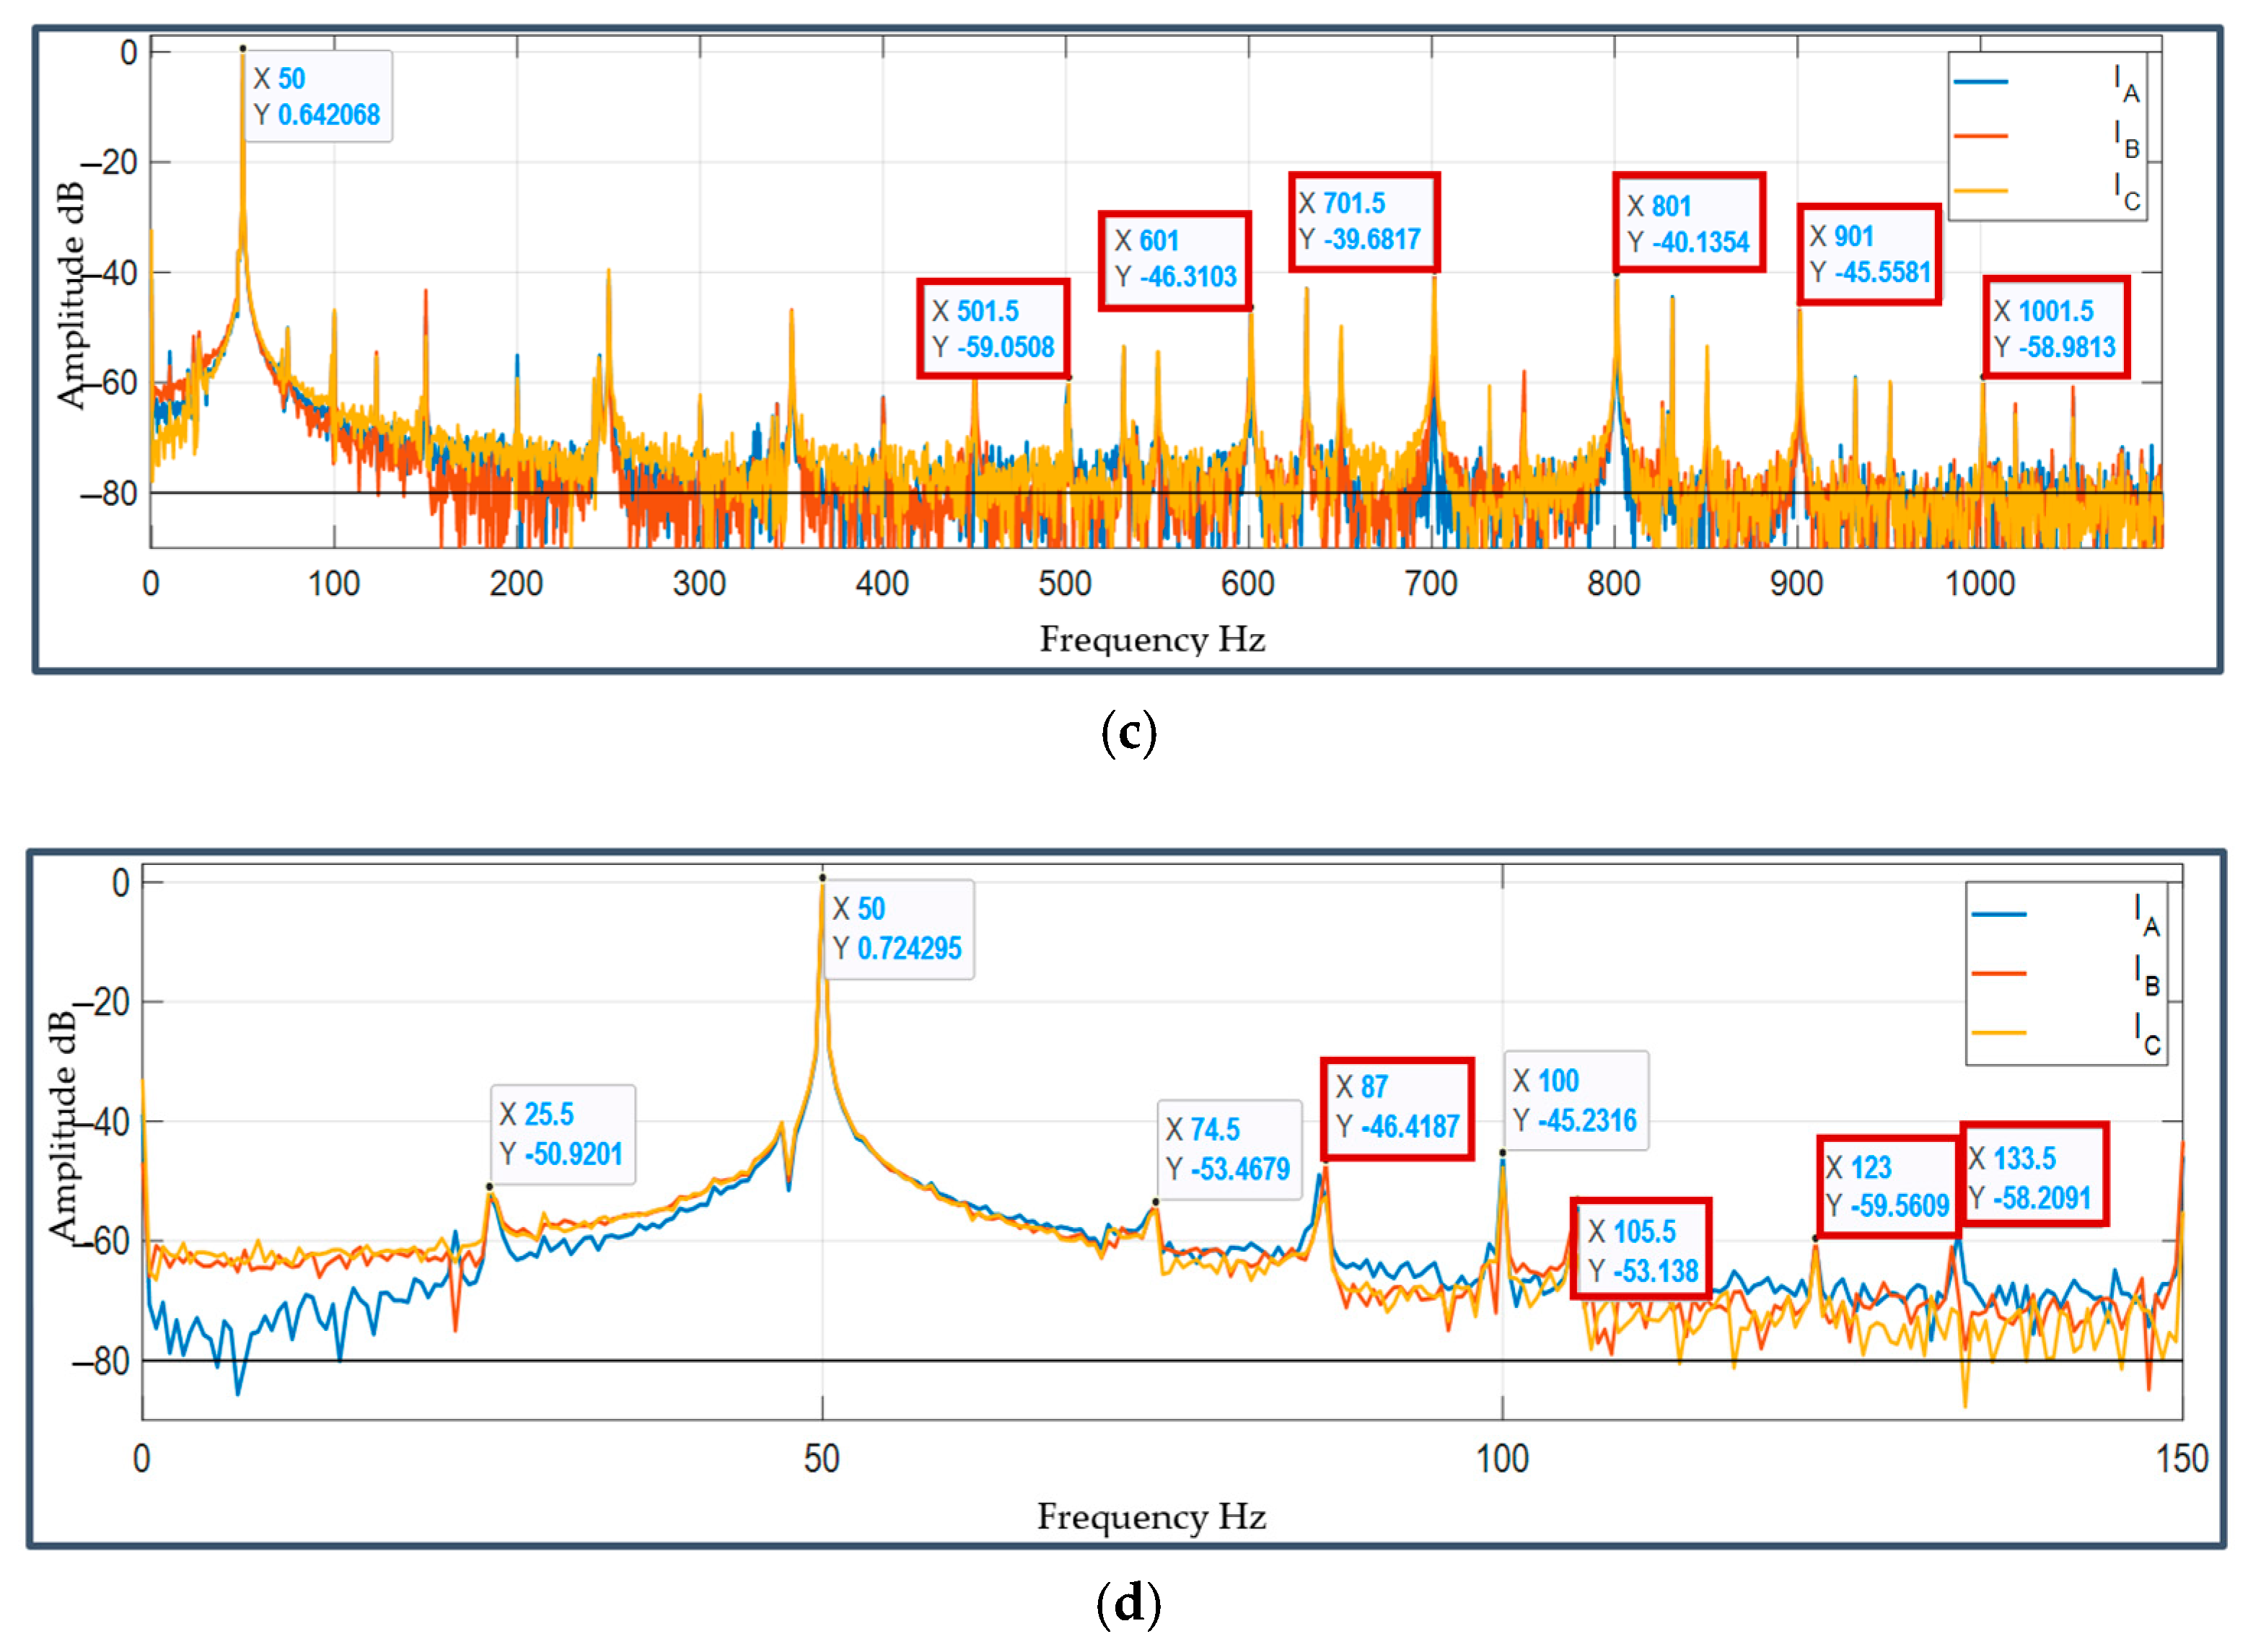
2.3. Calculation Module of Deep Diagnostic Parameters

Spectral analysis of electrical drive parameters (current and voltage) makes it possible to identify fundamental frequencies and harmonics formed by the semiconductor frequency converter and design frequencies (Table 1). In this case, they correspond to a defect in the electric machine. The individual components of the unit have their own rotational frequencies, which are determined by design dimensions. These depend on both electrical and mechanical parameters. The presence of defects is caused by new frequency components, which make it possible to identify defect types. However, it is impractical to detect the defect level in the current spectrum and assess its effect on the electrical drive.
In order to qualitatively assess the influence of defects on the electric drive’s function as an electromechanical converter, the criteria of energy and mechanical efficiency have been formulated. They are given in corresponding efficiency assessment modules.

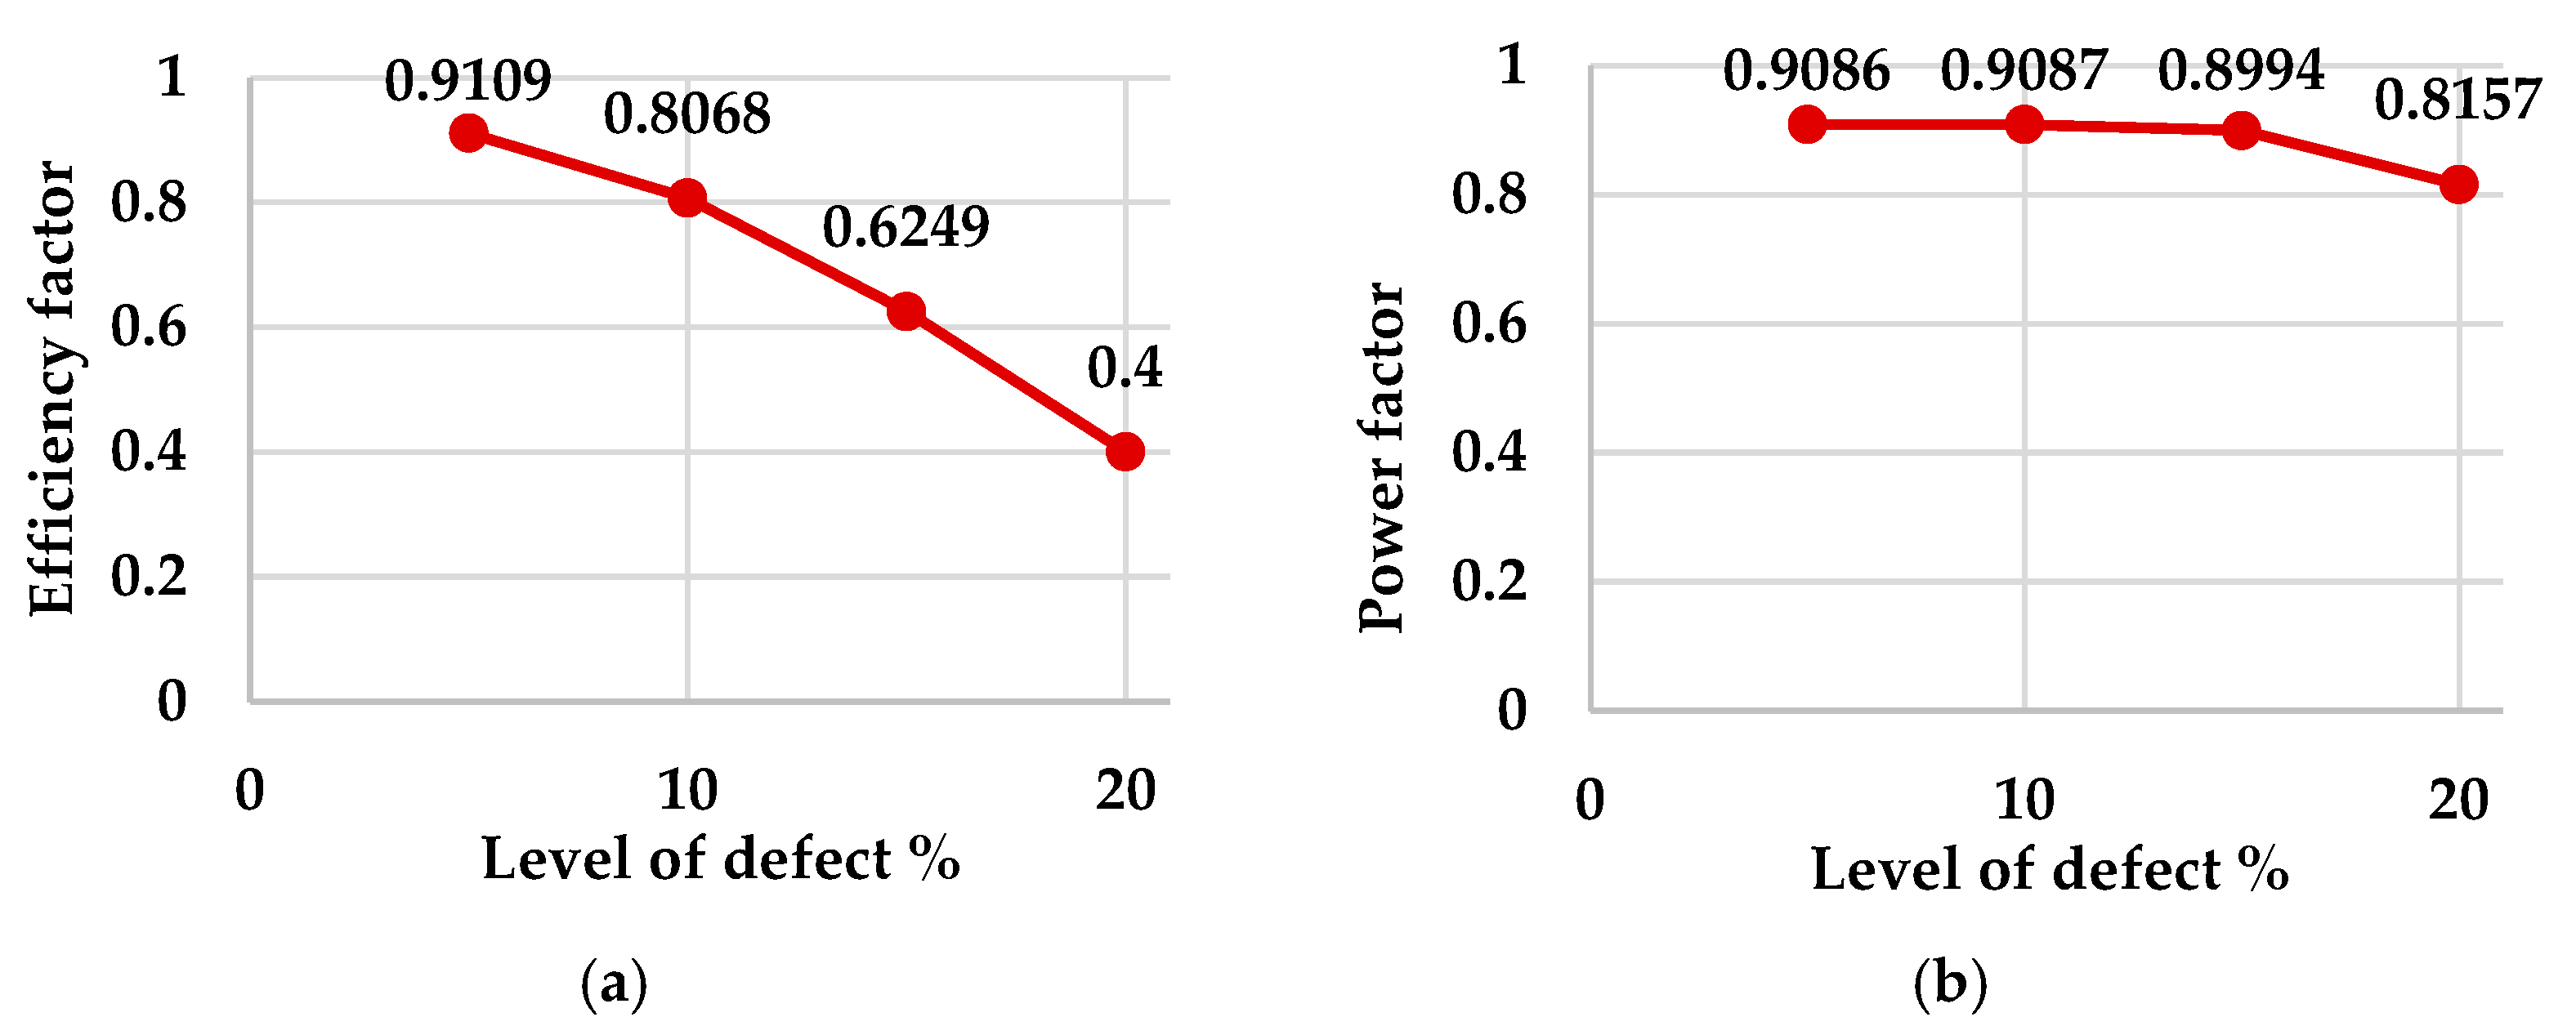
2.4. Energy Efficiency Assessment Module

The main parameters of the energy efficiency of the electric drive are as follows:
(1)
An efficiency factor (7).
(2)
A power factor including harmonic distortion of signals introduced by the semiconductor frequency converter (8).
η = P m ( t ) P e l   ( t ) ;
K M = K I × K U × c o s φ ;
where
  • P m ( t ) —mechanical power at the drive shaft;
  • P e l   ( t ) —electrical power capacity consumed from the supply network by the electric drive;
  • K I —current sinusoidality factor current;
  • K U —voltage sinusoidality factor.

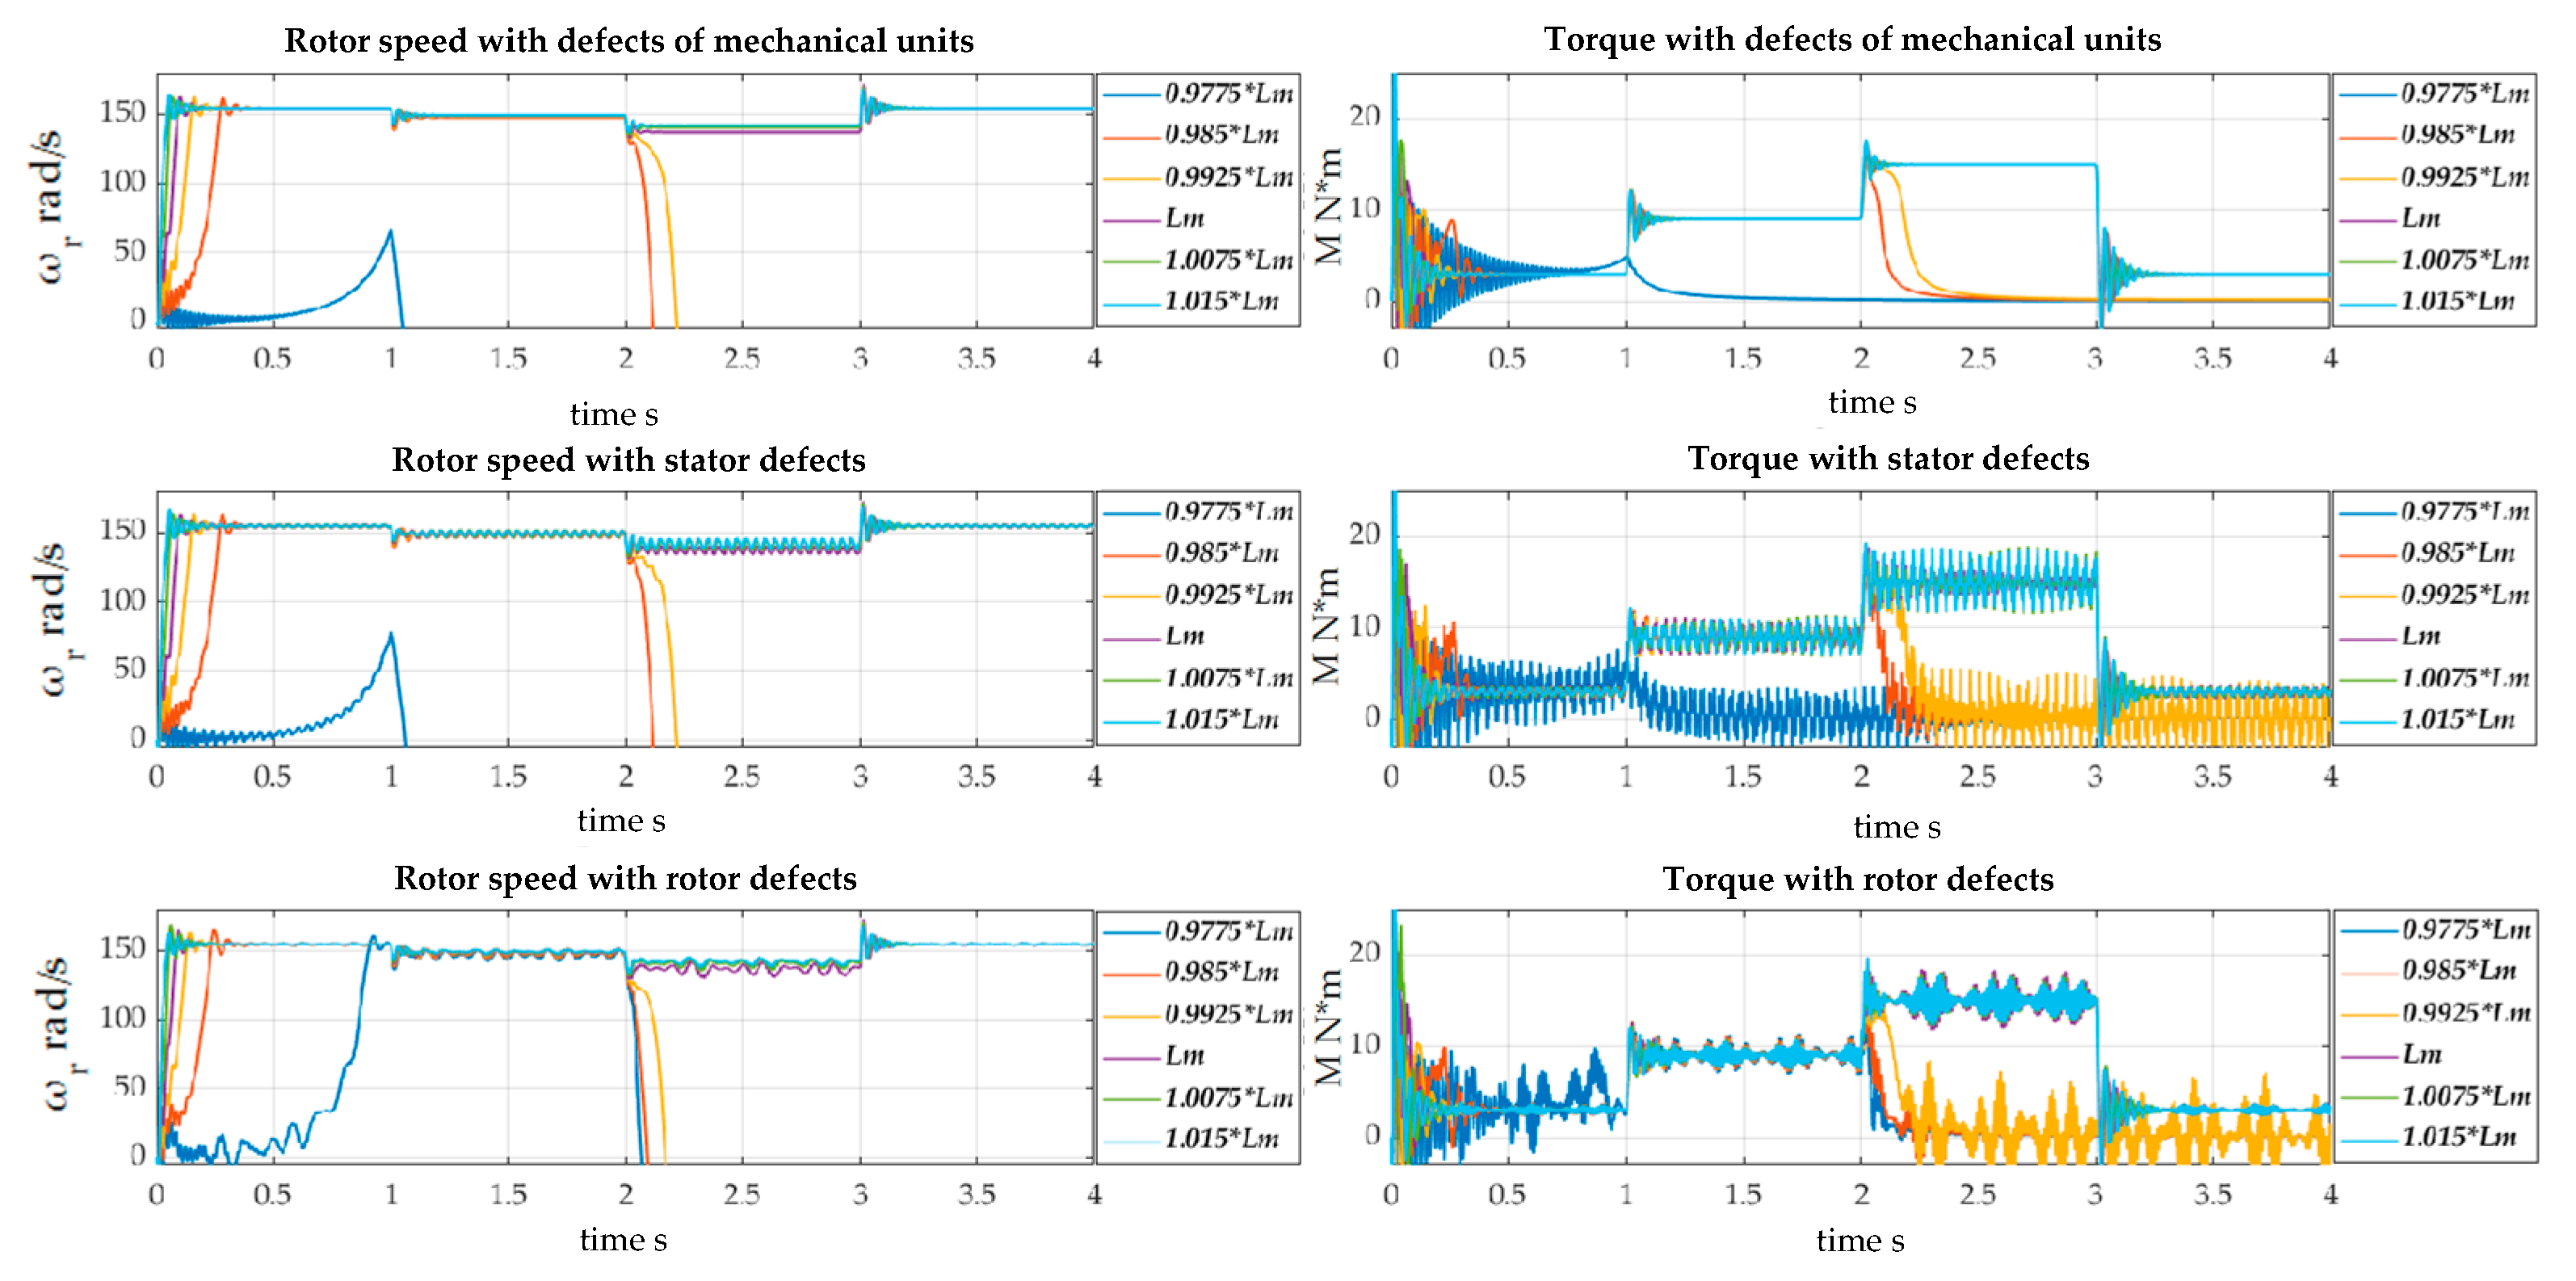
2.5. Mechanical Efficiency Evaluation Module

Mechanical characteristics include rotor speed and electromagnetic torque. As a static evaluation, it is sufficient to determine the drive speed (9) and shaft torque deviations (10).
ω = ω a c t ω n o r m ;
M = M a c t M n o r m ;
where
ω a c t , ω n o r m —actual measured value and nominal value set by the drive speed control system;
M a c t , M n o r m —actual measured value and nominal value set by the torque control system.
The electromagnetic torque ripple coefficient K M e is a dynamic index for evaluating the mechanical efficiency of the electric drive, which is defined according to [8,9]:
K M e = n = 2 n = M ( n ) 2 / M a v ,
where
  • M ( n ) —electromagnetic torque components generated as a result of stator current harmonic interaction;
  • M a v —average value of electromagnetic torque of induction drive.

2.6. Module for Assessing the General Technical Condition of the Electric Drive

The electric drive is a multi-component electrical system including electrical, electromechanical, and mechanical converters; in addition, it is also a complex system. The electric drive is a key element in most technological production processes. Depending on the factory, the number of electrical drives is estimated to be up to 1000 units. Adequate management of electric drive facilities can be ensured through the implementation of a generalised assessment methodology. A diagnostic map is built on the basis of diagnostic, primary, and secondary design parameters of the electric drive, considering its energy and mechanical efficiency (Figure 7). In the context of design features, the calculation of limits of defect detection, permissible states, and maximum permissible states is possible [43]. The determination of these limits is dependent upon the protection settings of the automation system and the frequency converter. Such limits are also set during physical experiments at the boundary of possibilities for measurements, considering safety or loss of serviceability.
The CTS is introduced as a general quantitative assessment of the electric drive’s technical condition (12).
K T C = g 1 K d 1 + g 2 K d 2 + g 3 K d 3 + g 4 K d 4 ;
where
  • g i —weighting functions based on the assessment of energy and mechanical efficiency;
  • K d i —condition level of a single point: stator, rotor, shaft, or bearings.
Following identification of the boundaries (Figure 7) and subsequent assessment of energy and mechanical efficiency, the standardisation of general technical condition levels of the electric drive was performed (Table 2).

2.7. Module for Assessing Control System Stability

As a result of performed calculations and evaluations, the actual parameters of the electric drive equivalent circuit scheme are determined. They define the qualitative setting of control system regulators (scalar, vector, and direct torque control). This module compares actual and calculated values. According to the variation in equivalent circuit scheme parameters, deviation in the rotor speed-regulated characteristics and electromagnetic torque is determined. The key parameter for evaluating drive function is the magnetising inductance L m . It has been demonstrated that the eventual manifestation of any fault results in symmetry violation of the electromagnetic field within the air gap. This deviation L m can be observed and measured.
The next step is to perform mathematical modelling of the electric drive and plot oscillograms (Figure 8). These modelling results will estimate the electric drive’s ability to generate starting (t = 0–6 s), nominal (t = 6–7 s), or overload (t = 7–8 s) electromagnetic forces. The data obtained suggest the possibility of exerting an influence on the control system in a manner that is conducive to productivity.

2.8. Control Strategy Selection Module

The primary function of this module is to generate control output to the drive. In achieving this objective, it is imperative that the primary control strategy should be determined during the preliminary phase of operations. There are two main strategies for maintaining the power or mechanical characteristics of the drive by the control system. Simultaneous support is excluded. Therefore, it is vital to ensure that maintenance of power characteristics in case of fault is implemented in order to prevent a decrease in torque and rotor speed. Servicing mechanical characteristics involves monitoring and addressing any faults that may emerge, as they can lead to inefficient power consumption. In the absence of a beneficial influence on the control system from the critical level of the defect, a signal is generated for the automation system to promptly halt the electric drive.

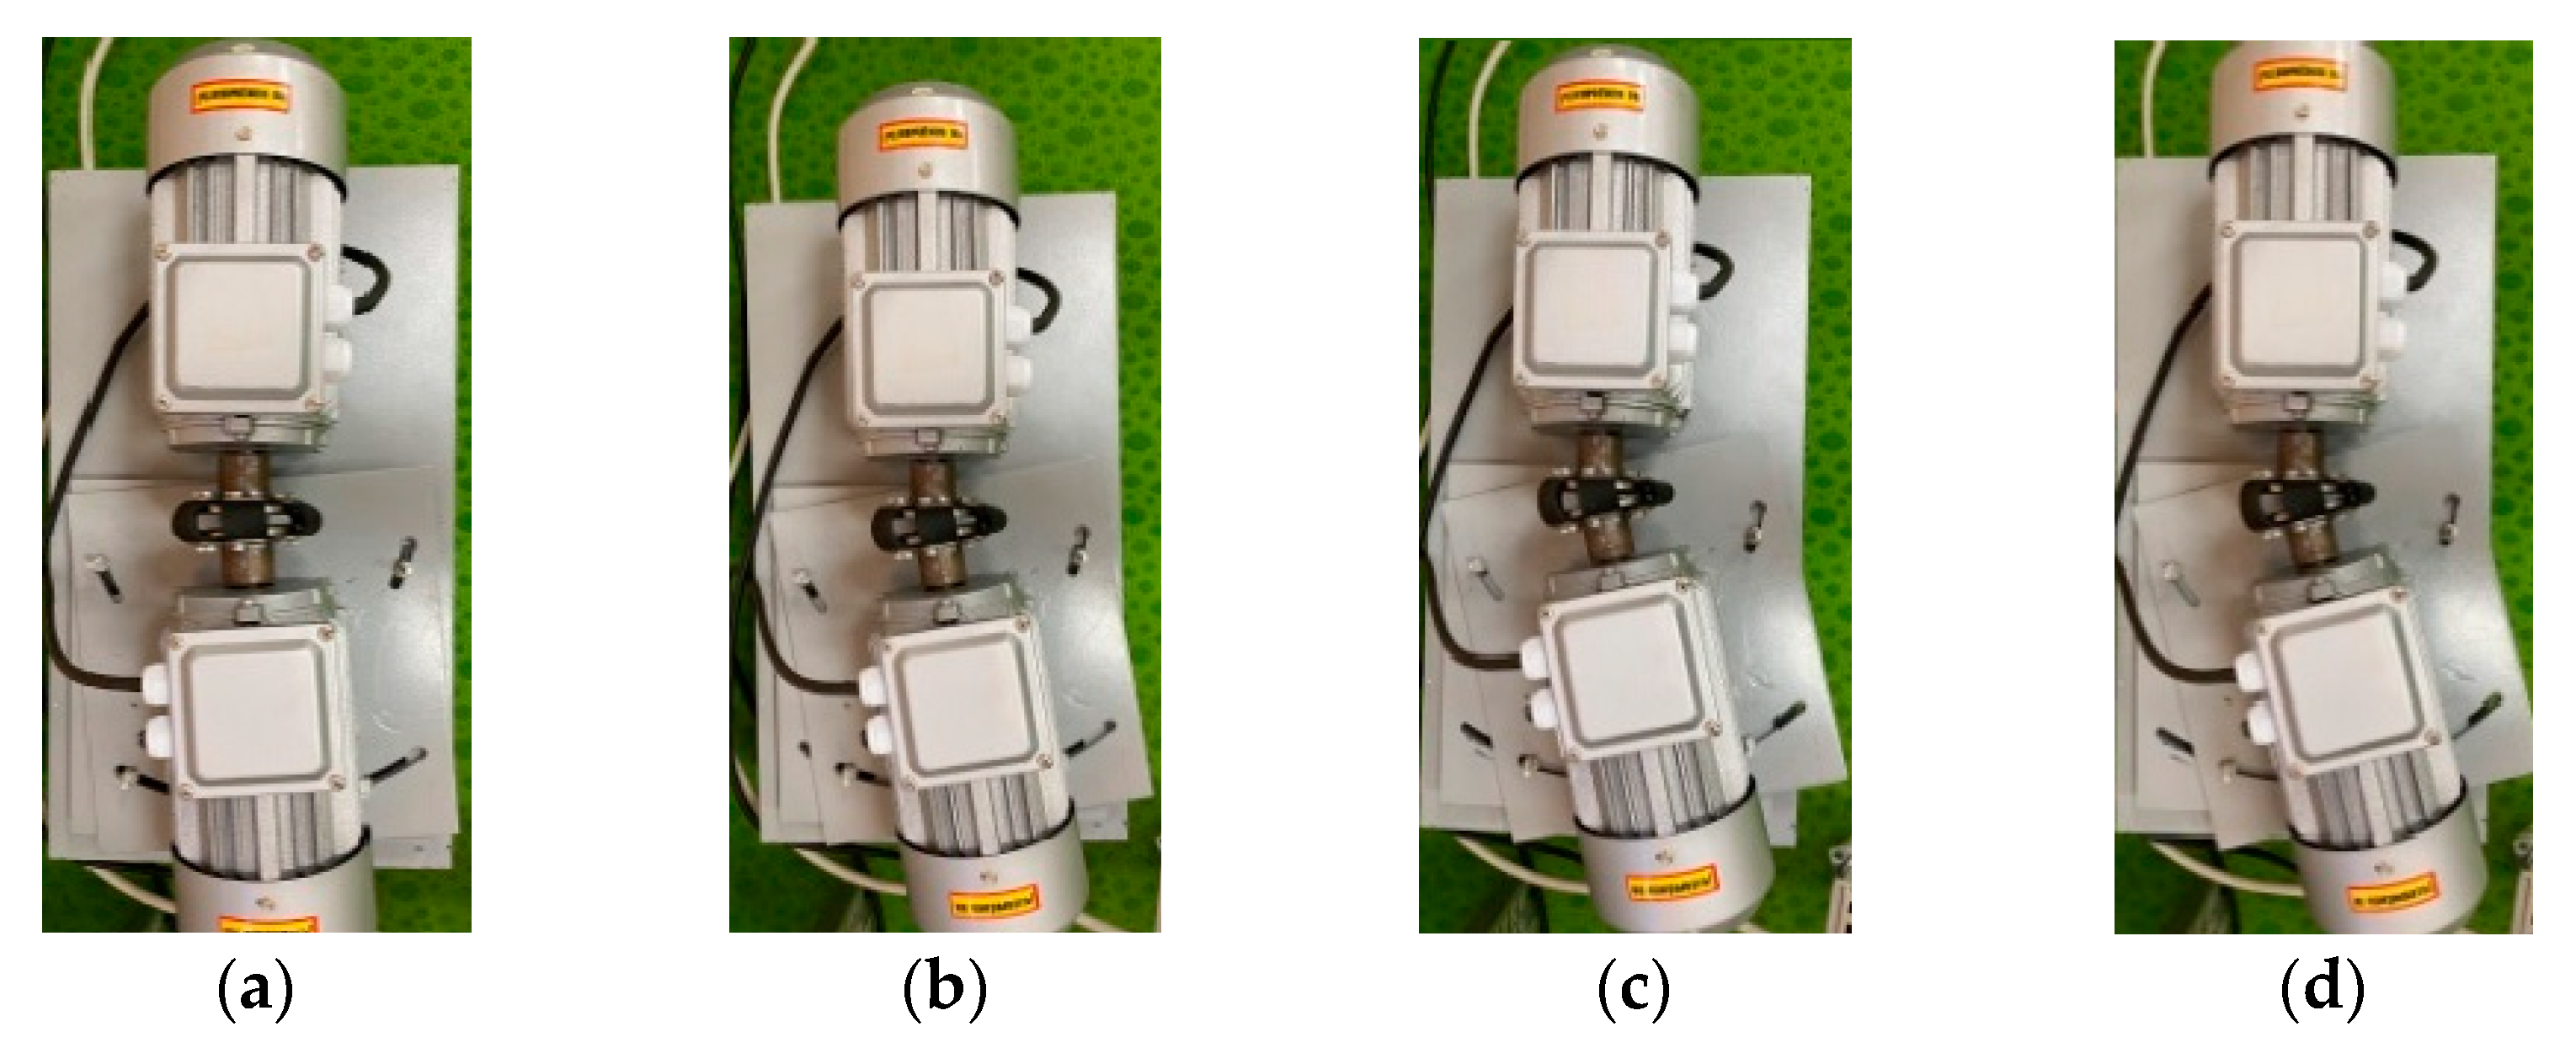
3. Results and Discussion

To confirm the results of the information–analytical system, a laboratory bench was designed (Figure 9). It has the following main components:
(1)
A power supply panel (voltage level 380/220 V);
(2)
A frequency converter (ATV900 Schneider Electric) with a process level controller (M340) scalar control system with speed feedback;
(3)
An ADC with a wide frequency response resolution (National instruments PXI-6251);
(4)
A measurement module connection diagram;
(5)
Test and load induction drives (power 1.5 kW and speed 1390 rpm);
(6)
A measurement board prototype.
The fundamental principle of operation entails the reproduction of faults on the test electric drive. In this instance, the level of faults can be modified. The drive facilitates seamless load regulation within the range from 0 to 200% of the rated torque. Each phase is connected to a supply cable, and a measuring module consisting of Hall effect current and voltage sensors is linked to the drive input. Subsequently, the analogue signals from the sensors are converted by an analogue-to-digital converter (ADC) to form a data array.
Misalignment between the load and the test drive leads to an eccentricity level change (Figure 10). It is hypothesised that the level of eccentricity, irrespective of the standard state of the axis, is likely to be no greater than 20%. However, it should be noted that creating a higher level of eccentricity can result in failure, which in turn can lead to serviceability loss.
Using PXI in LabVIEW software 2014, an electronic device was developed (Figure 11) that realises the functions of modules 1–3 given in paragraphs 2.1–2.3 [44,45]. The given approach allows real-time evaluation of the electric drive operation. This stage visually presents distortions in the form of phase currents iA, iB, iC and a current hodograph IS.
Further detailed processing of the spectral analysis results allowed us to identify diagnostic markers (Figure 12) based on the calculated frequencies (Table 1). This enables the identification of the defect type. As demonstrated in Figure 12c, the range of eccentricity levels (from 0 to 20%) appears to exhibit no discernible correlation with either the change in amplitude or frequency. Consequently, the spectral analysis of instantaneous current values facilitates the identification of defects in the stator, rotor, shaft, and bearing, and mechanical loosening.
The power factor decreases from 0.9 to 0.4 as the eccentricity is artificially varied from 0 to 20% (Figure 13a). However, as the defect level increases, the power factor remains stable due to the control system (Figure 13b). It is evident that the primary cause of this phenomenon is the fact that the majority of the electrical energy consumed by the electric drive is lost through mechanical and thermal losses. For serving the drive shaft rated mechanical power, it is necessary to increase the power by 50% above the rated power. From a technical and economic point of view, operation of the electric drive is not reasonable, for the total cost of power losses exceeds the cost price. A similar case is observed with the mechanical characteristics of the electric drive (Table 3).
In accordance with (12), the technical condition index is calculated at each defect level (see Table 4), and the subsequent steps are taken (Table 2).
Considering the established diagnostic parameters and the technical data given in the drive passport, we modelled operating modes, changing the control system parameters according to the fault (Figure 14). This determines possible options of energy or mechanical characteristic maintenance. When there are no positive options, it is necessary to stop the electric drive.

4. Conclusions

The present work proposes a comprehensive approach to diagnostics and the assessment of the technical condition of an electric drive, including the introduction of an information–analytical system. It provides following solutions:
(1)
Installation of the measuring module does not require any additional modifications provided that the supply network is not interrupted or disconnected.
(2)
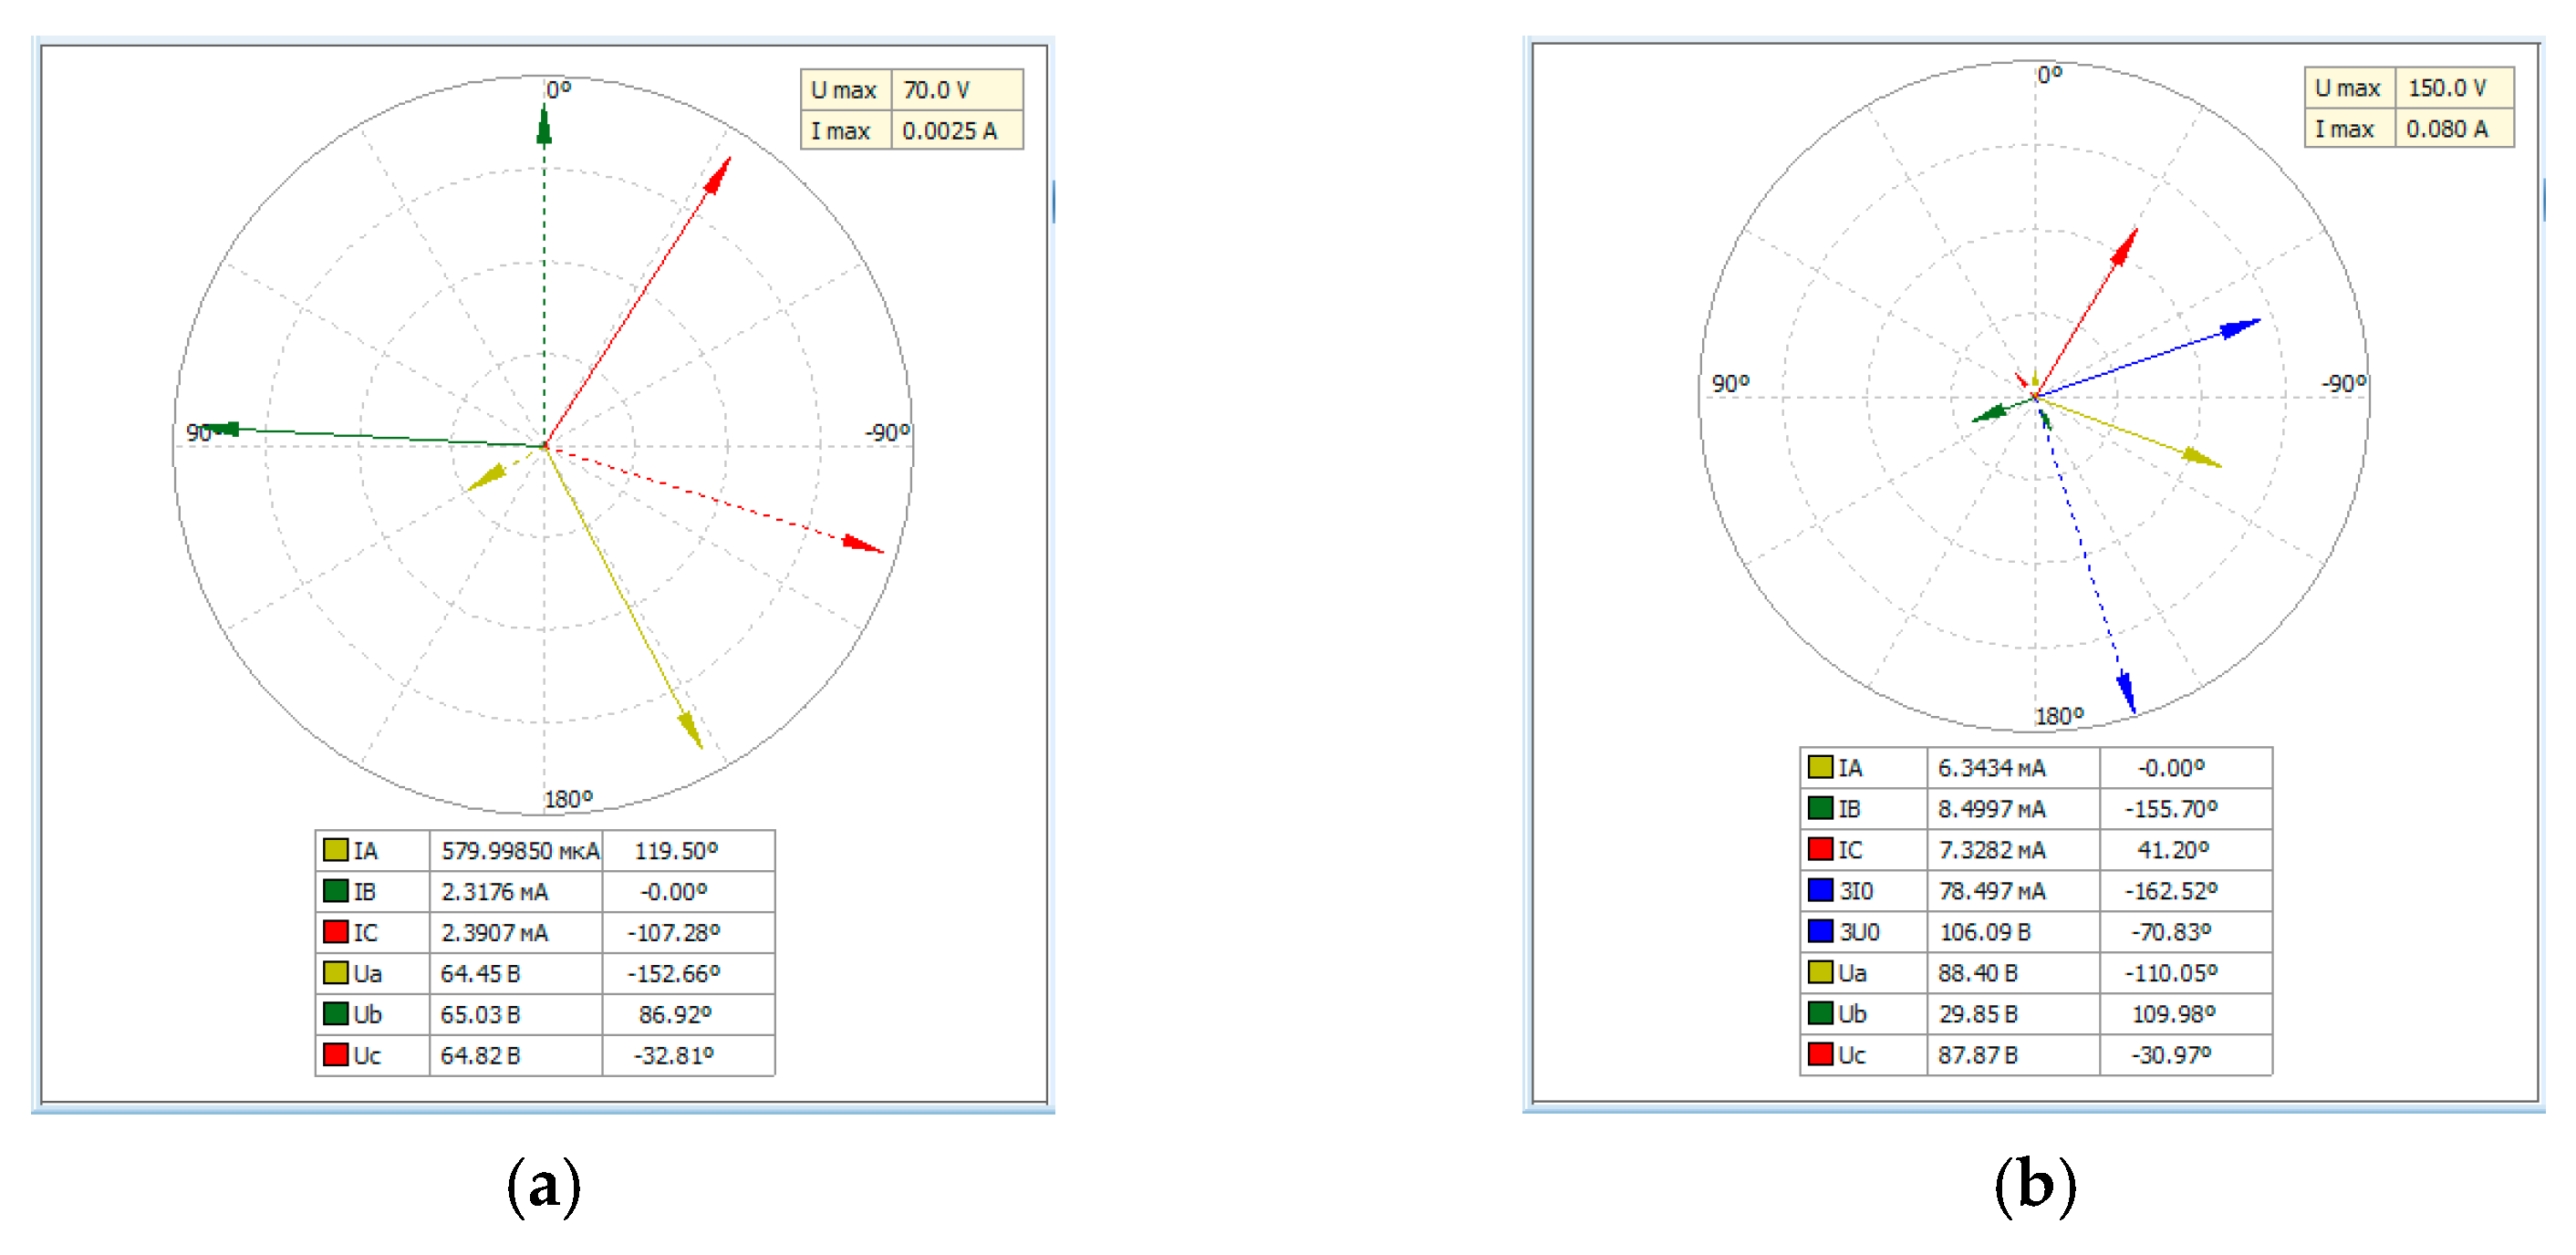
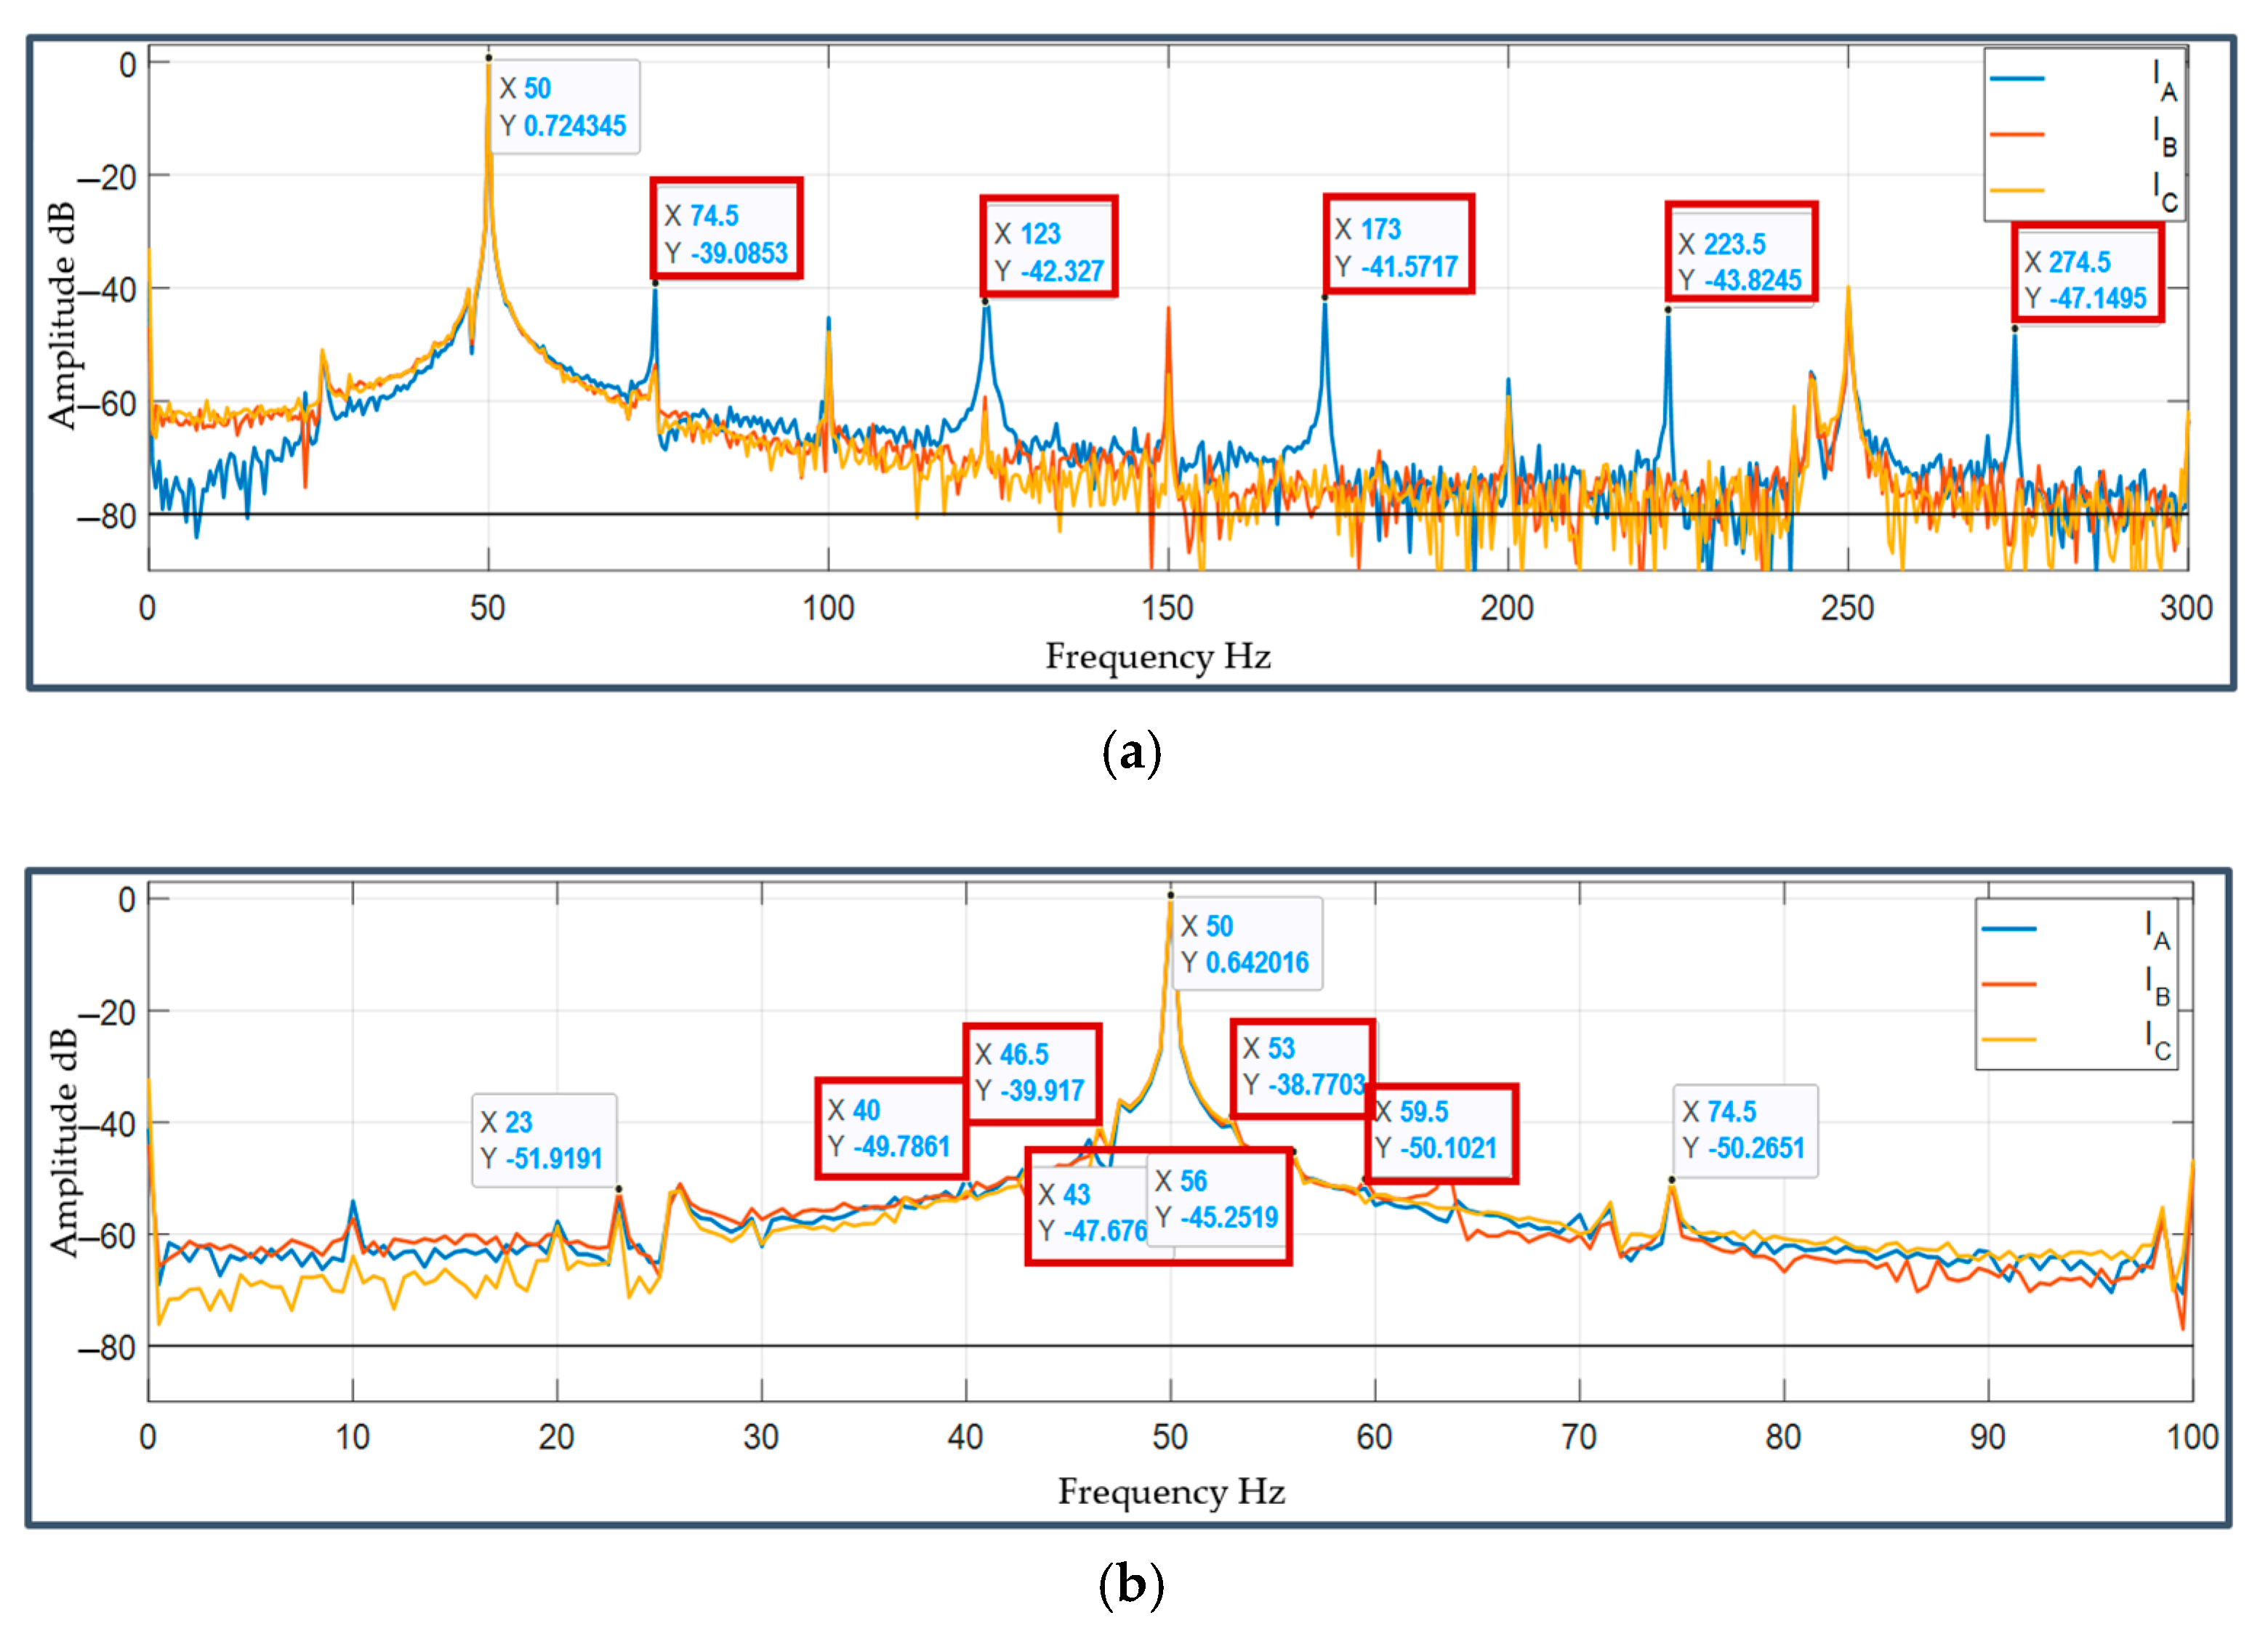
The analysis of generalised current and voltage vectors enables the distinction between distortions introduced by the electrical network and the diagnostic features of the drive.
(3)
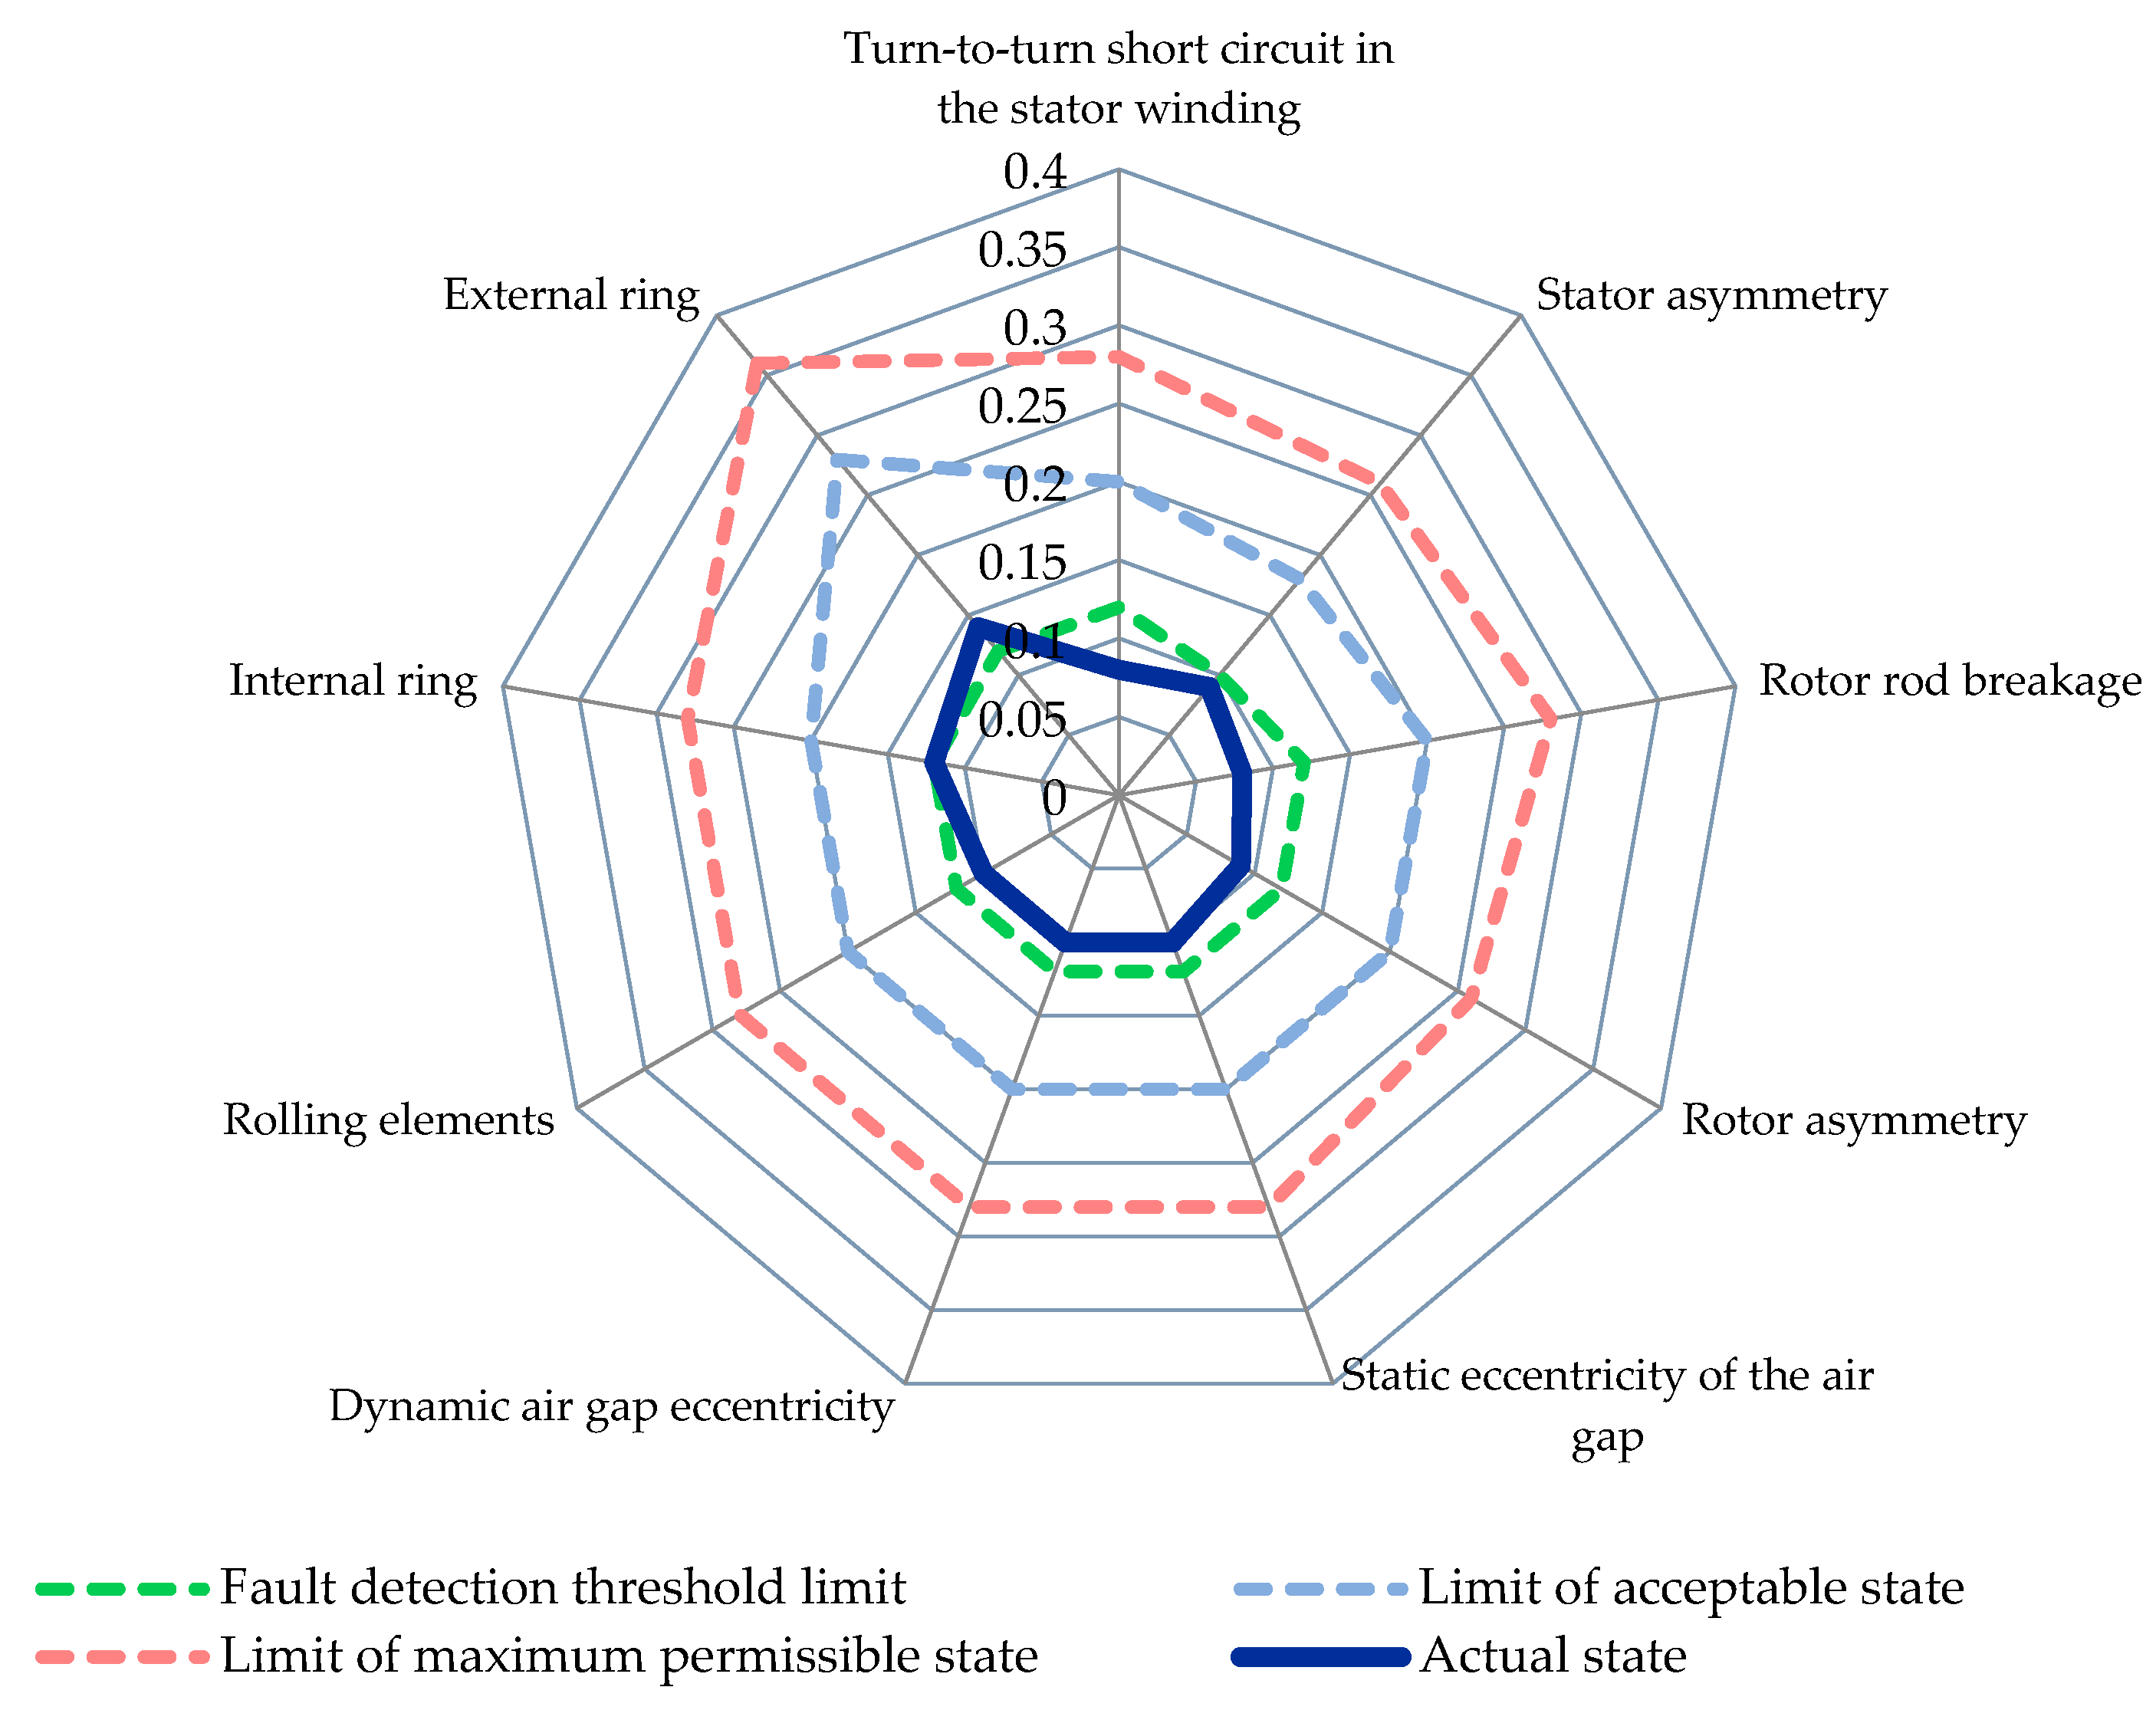
A comprehensive list of defect types has been identified, and their negative impact on energy and mechanical characteristics has been evaluated.
(4)
The technical state of the drive is assessed using a corresponding index, thus facilitating more efficient and timely maintenance, repair, and control work.
(5)
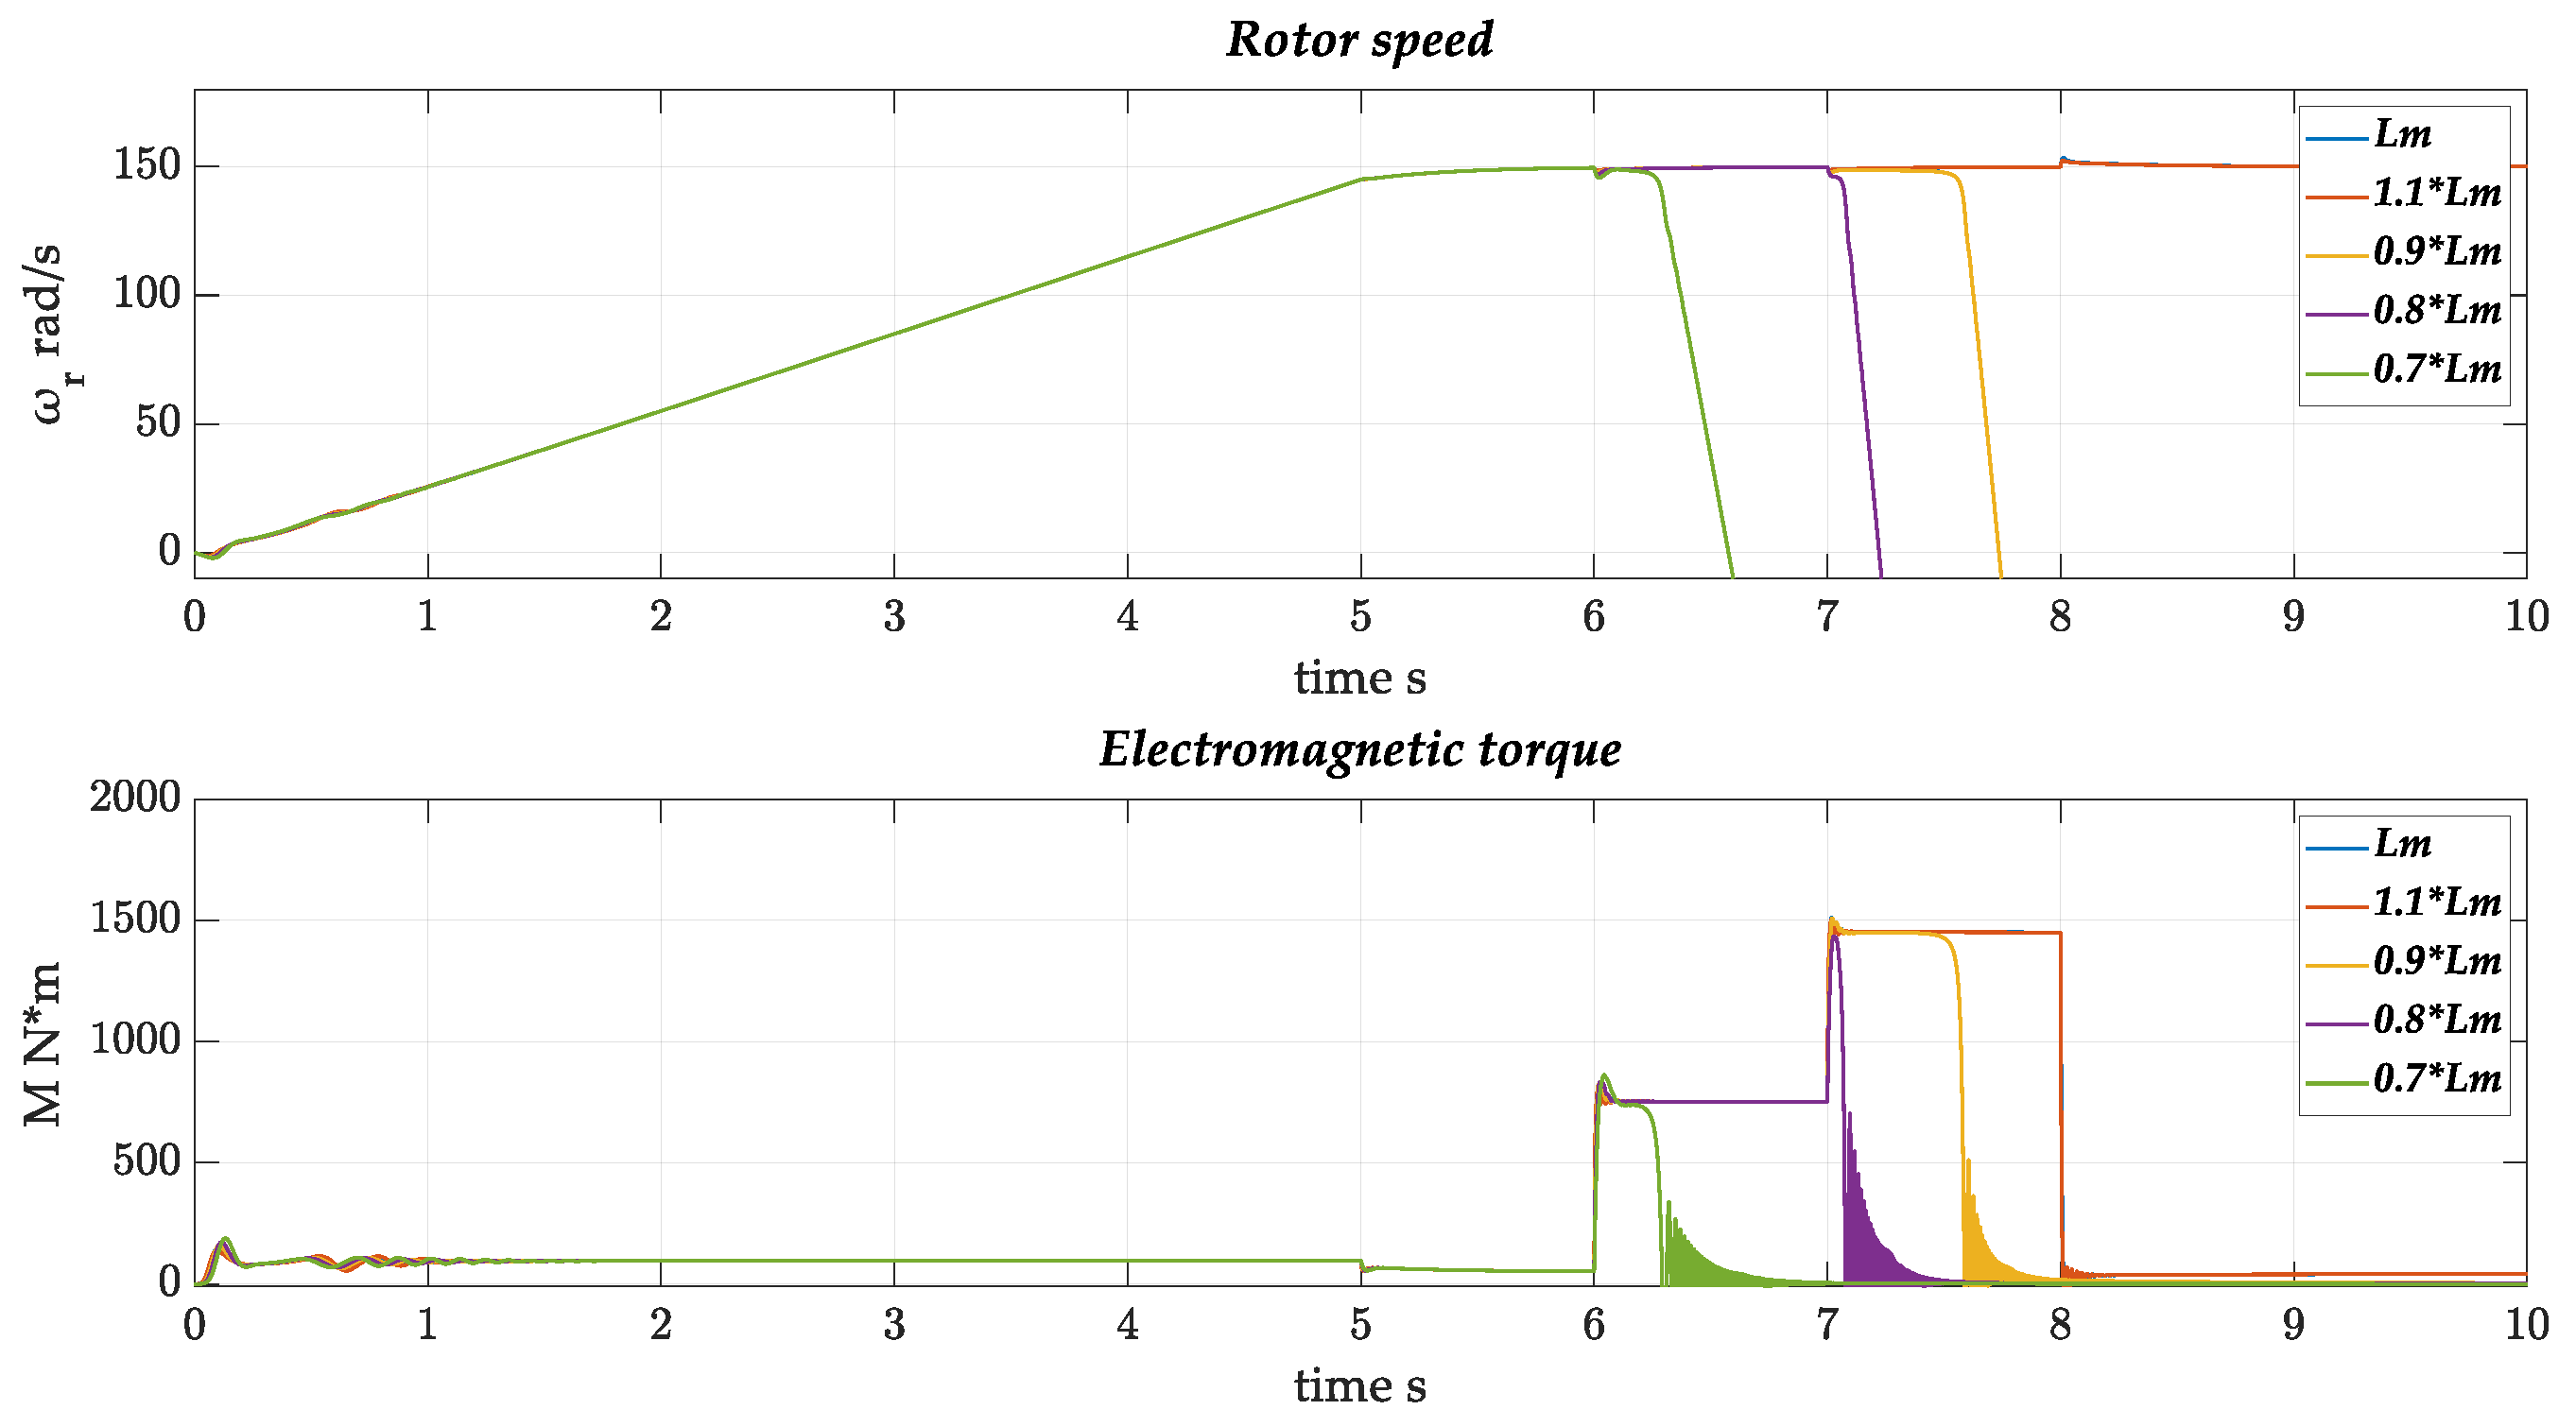
A mathematical model of the electric drive has been performed using the current parameters of the substitution diagram. All possible control options are modelled simultaneously.
(6)
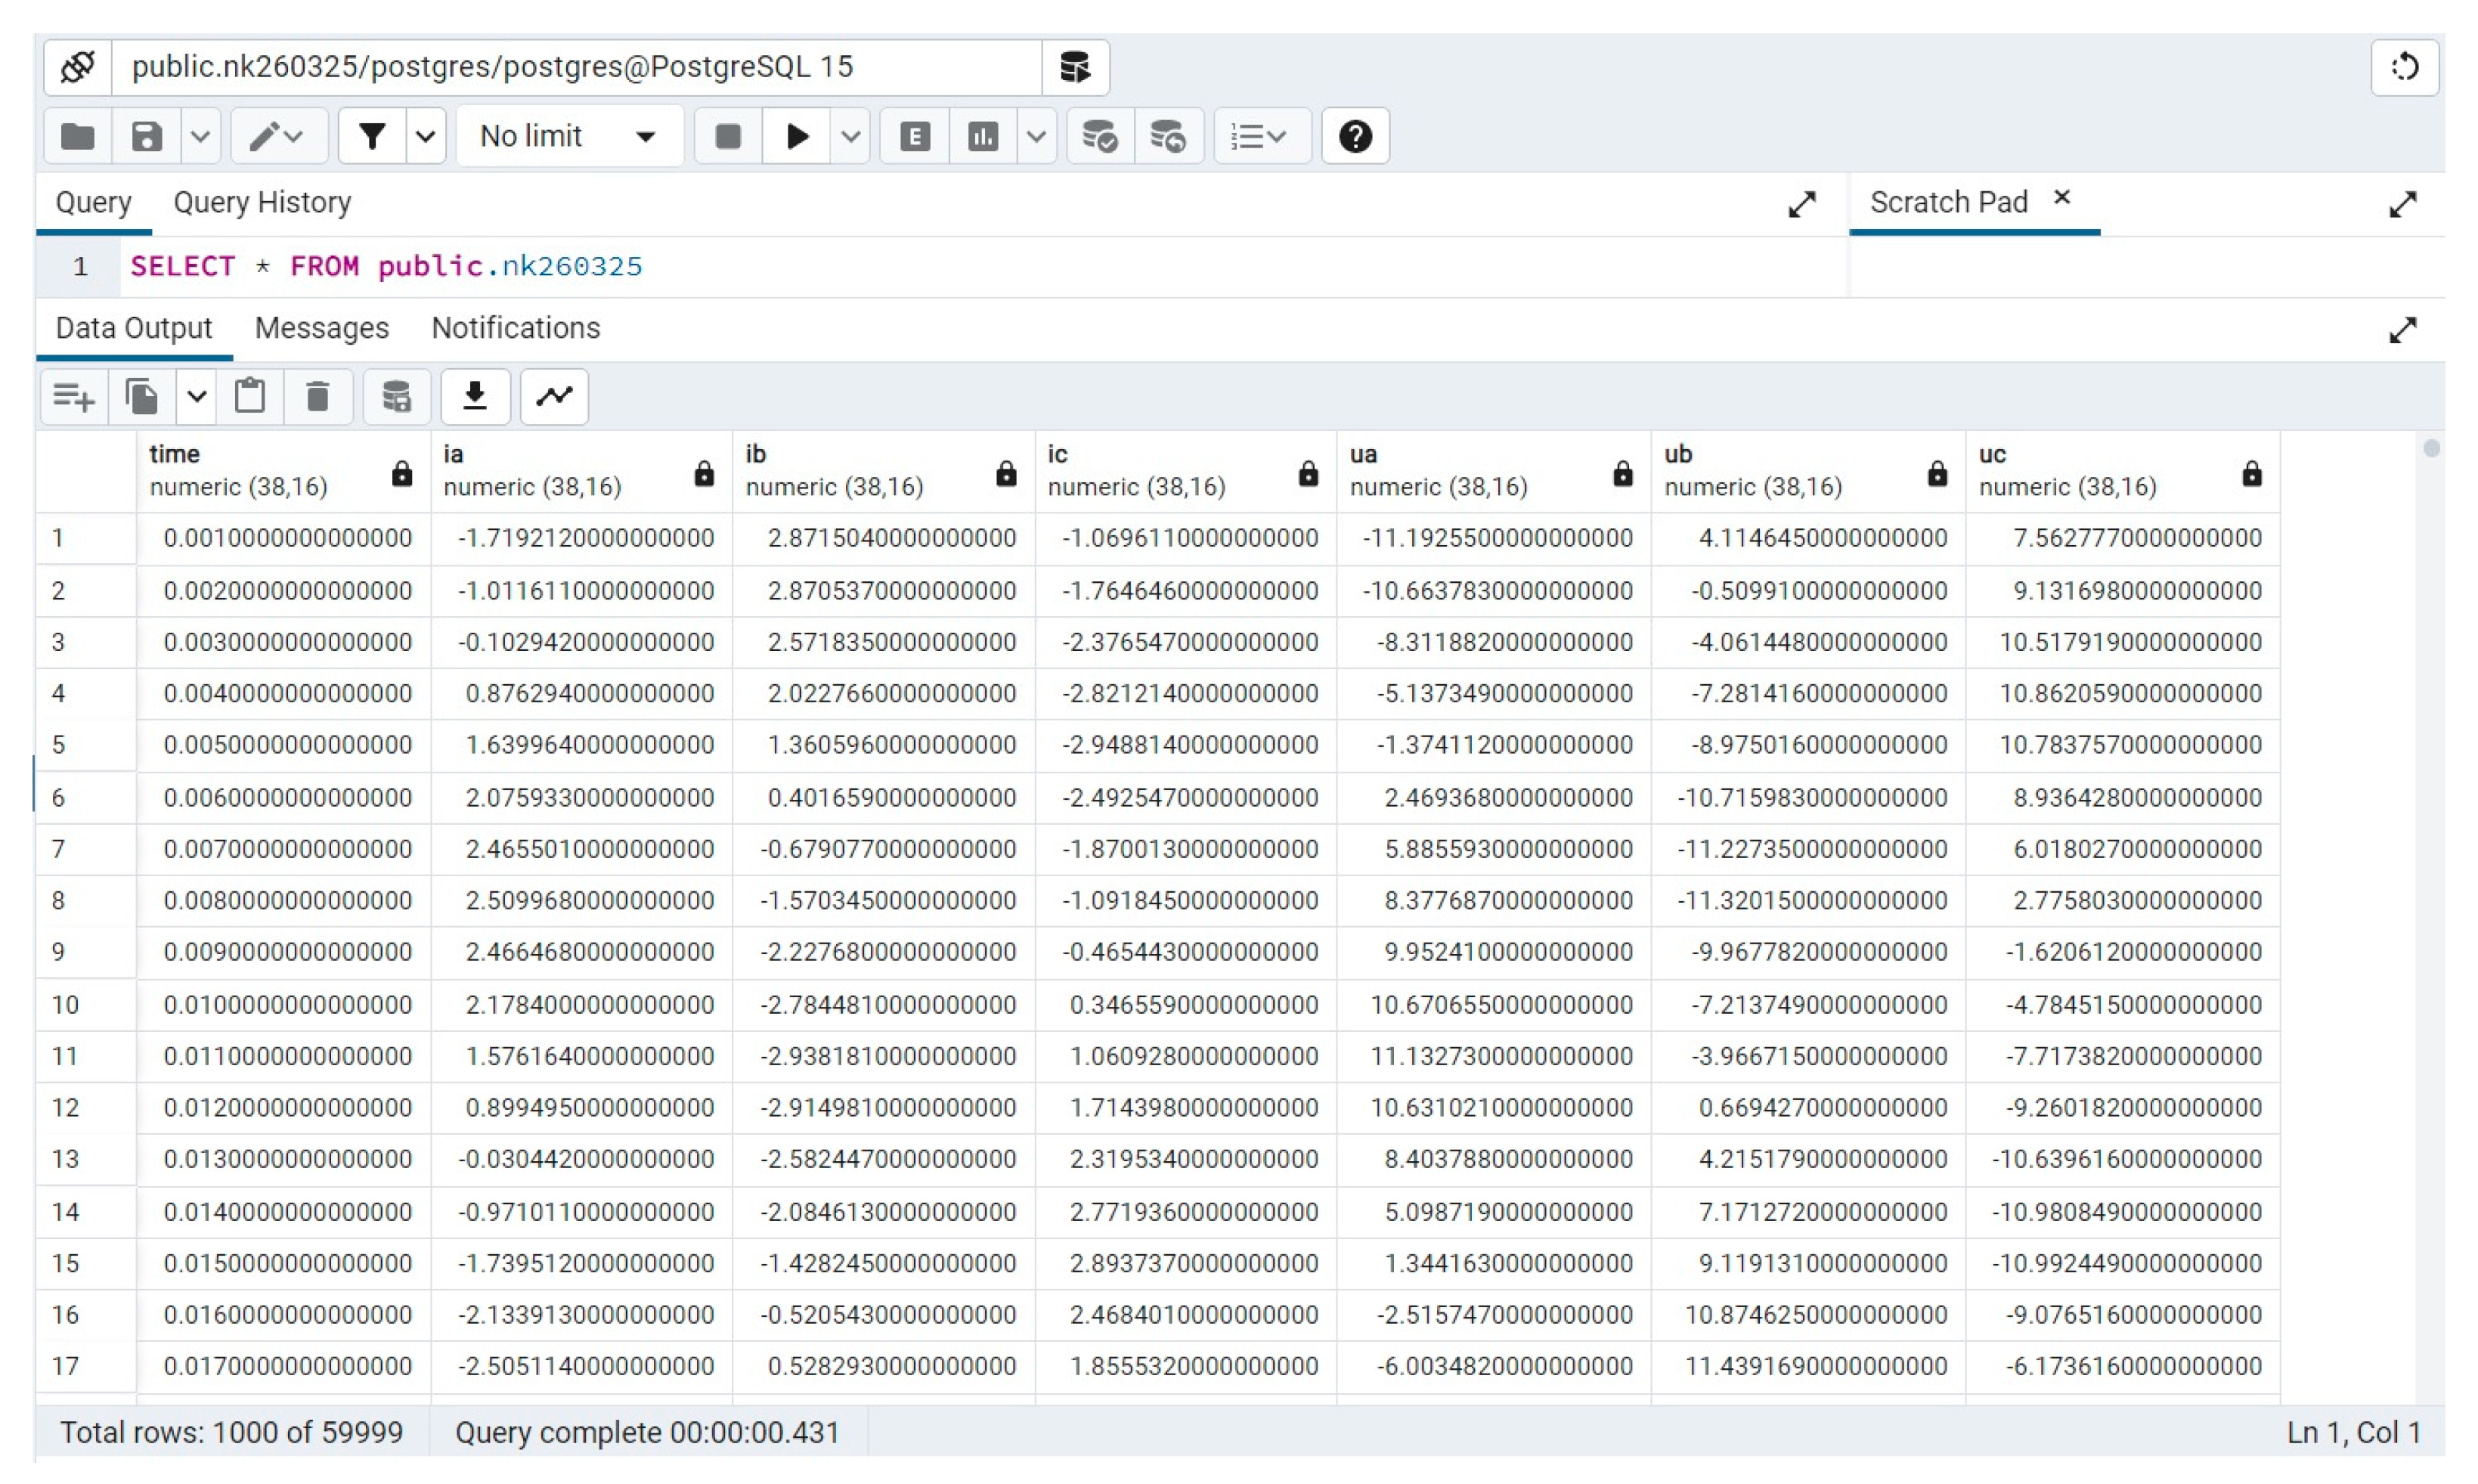
The electronic measuring device is used for real-time collection and analysis of diagnostic data from electric drives.
(7)
The effective control of individual and groups of drives is of key importance in minimising energy and economic costs. Such control is achieved by the prevention of unforeseen plant downtime and emergencies.
The presented approach enables additional module integration into the structure. It depends on the task, such as prediction or evaluation of the electric drive residual life. In order to enhance the quality of modules, it is possible for the system to complement them with vision and machine learning tools. Additional tools of technical vision and machine learning will improve the accuracy of fault detection and the system response time. Nevertheless, the proposed solution does not necessitate substantial computing resources and is comparatively inexpensive. It is advisable to use technical vision and machine learning algorithms at the next stages of platform development related to the tasks of assessing the residual life and predicting the electric drive technical state.
Significant scientific potential is attributed to these areas, which are regarded as promising directions for future research.

5. Patents

Patent No. 2626231 Russian Federation. Method for diagnosing the technical condition and assessing the residual life of an electromechanical unit with an asynchronous motor/Yu. L. Zhukovsky, I.S. Babanova, N.A. Korolev; applicant and copyright holder “Empress Catherine II Saint Petersburg Mining University”.
Certificate of state registration program for computers No. 2023614972 Russian Federation. Program for monitoring diagnostic data of asynchronous electric drive by current and voltage/N.A. Korolev, A.V. Boykov; applicant and copyright holder “Empress Catherine II Saint Petersburg Mining University”.—No. 2023613721; declared 02.03.2023; published 09.03.2023.—1.
Certificate of state registration program for computers No. 2024616314 Russian Federation. Program for identifying diagnostic characteristics of AC electric drives in real time/N.A. Korolev, N.I. Koteleva; applicant and copyright holder “Empress Catherine II Saint Petersburg Mining University”.—No. 2024614818; declared 12.03.2024; published 12.03.2024.—1.

Funding

The research was performed with a grant from the Russian Science Foundation № 23-79-01292, https://rscf.ru/en/project/23-79-01292/, accessed on 29 February 2024.

Data Availability Statement

The original contributions presented in this study are included in the article. Further inquiries can be directed to the corresponding author.

Conflicts of Interest

The author declare no conflicts of interest.

References

  1. Nikolaev, A.V.; Vöth, S.; Kychkin, A.V. Application of the cybernetic approach to price-dependent demand response for underground mining enterprise electricity consumption. J. Min. Inst. 2023, 261, 403–414. [Google Scholar] [CrossRef]
  2. Zhukovskiy, Y.L.; Suslikov, P.K. Assessment of the potential effect of applying demand management technology at mining enterprises. Sustain. Dev. Mt. Territ. 2024, 16, 895–908. [Google Scholar] [CrossRef]
  3. Pavel, T.; Polina, S.; Liubov, N. The research of the impact of energy efficiency on mitigating greenhouse gas emissions at the national level. Energy Convers. Manag. 2024, 314, 118671. [Google Scholar] [CrossRef]
  4. Mseddi, A.; Dhouib, B.; Zdiri, M.A.; Alaas, Z.; Naifar, O.; Guesmi, T.; Alshammari, B.A.; Alqunun, K. Exploring the Potential of Hybrid Excitation Synchronous Generators in Wind Energy: A Comprehensive Analysis and Overview. Processes 2024, 12, 1186. [Google Scholar] [CrossRef]
  5. Shpenst, V.A.; Belsky, A.A.; Orel, E.A. Improving the efficiency of autonomous electrical complex with renewable energy sources by means of adaptive regulation of its operating modes. J. Min. Inst. 2023, 261, 479–492. [Google Scholar]
  6. Monteiro, J.; Sousa, N.; Coutinho-Rodrigues, J.; Natividade-Jesus, E. Challenges ahead for sustainable cities: An urban form and transport system review. Energies 2024, 17, 409. [Google Scholar] [CrossRef]
  7. Zhang, X.; Zhang, Z.; Liu, Y.; Xu, Z.; Qu, X. A review of machine learning approaches for electric vehicle energy consumption modelling in urban transportation. Renew. Energy 2024, 234, 121243. [Google Scholar] [CrossRef]
  8. Uy, J.R.R.; Ong, A.K.S.; German, J.D. Marketing strategy and preference analysis of electric cars in a developing country: A perspective from the Philippines. World Electr. Veh. J. 2024, 15, 111. [Google Scholar] [CrossRef]
  9. Behnia, F.; Schuelke-Leech, B.A.; Mirhassani, M. Optimizing sustainable urban mobility: A comprehensive review of electric bus scheduling strategies and future directions. Sustain. Cities Soc. 2024, 108, 105497. [Google Scholar] [CrossRef]
  10. Petrov, V.L.; Pichuev, A.V. Assessing the efficiency of measures to enhance electric power quality in variable-frequency drive for scraper conveyors. Min. Sci. Technol. 2024, 9, 60–69. [Google Scholar] [CrossRef]
  11. Jin, H.; Huo, H.; Wang, C.; Wang, S.; Xu, H. Design and experimental study of electrical and mechanical brake for mine hoist. Mech. Ind. 2021, 22, 36. [Google Scholar]
  12. Malafeev, S.I. Electric Drive for Opening the Bottom of an Excavator Bucket: Design and Analysis of the Control System. Russ. Electr. Eng. 2023, 94, 223–227. [Google Scholar] [CrossRef]
  13. Ahmadi Khiyavi, O.; Seo, J.; Lin, X. New design of an electrical excavator and its path generation for energy saving and obstacle avoidance. Vehicles 2024, 6, 832–849. [Google Scholar] [CrossRef]
  14. Koteleva, N.; Valnev, V. Automatic Detection of Maintenance Scenarios for Equipment and Control Systems in Industry. Appl. Sci. 2023, 13, 12997. [Google Scholar] [CrossRef]
  15. Yurievich, V.B.; Hien, N.T. Stochastic Pulse-Width Modulation and Modification of Direct Torque Control Based on a Three-Level Neutral-Point Clamped Inverter. Energies 2024, 17, 6017. [Google Scholar] [CrossRef]
  16. Shklyarskiy, Y.E.; Guerra, D.D.; Iakovleva, E.V.; Rassõlkin, A. The influence of solar energy on the development of the mining industry in the Republic of Cuba. J. Min. Inst. 2021, 249, 427–440. [Google Scholar] [CrossRef]
  17. Shishlyannikov, D.; Zverev, V.; Ivanchenko, A.; Zvonarev, I. Increasing the Time between Failures of Electric Submersible Pumps for Oil Production with High Content of Mechanical Impurities. Appl. Sci. 2022, 12, 64. [Google Scholar] [CrossRef]
  18. He, F.; Xie, G.; Luo, J. Electrical bearing failures in electric vehicles. Friction 2020, 8, 4–28. [Google Scholar] [CrossRef]
  19. Zafarani, M.; Goktas, T.; Akin, B. A comprehensive magnet defect fault analysis of permanent-magnet synchronous motors. IEEE Trans. Ind. Appl. 2015, 5, 1331–1339. [Google Scholar]
  20. Campean, E.; Serban, C.A.; Ciupan, M.; Pop, G. Detecting Motor Defects Using Noise Analysis. In International Scientific-Technical Conference Manufacturing; Springer Nature: Cham, Switzerland, 2024; pp. 122–132. [Google Scholar]
  21. Hölsch, L.; Brosch, A.; Steckel, R.; Braun, T.; Wendel, S.; Böcker, J.; Wallscheid, O. Insights and challenges of co-simulation-based optimal pulse pattern evaluation for electric drives. IEEE Trans. Energy Convers. 2024, 39, 2094–2105. [Google Scholar] [CrossRef]
  22. Habyarimana, M.; Adebiyi, A.A. A Review of Artificial Intelligence Applications in Predicting Faults in Electrical Machines. Energies 2025, 18, 1616. [Google Scholar] [CrossRef]
  23. Wróblewski, A.; Krot, P.; Zimroz, R.; Mayer, T.; Peltola, J. Review of linear electric motor hammers—An energy-saving and eco-friendly solution in industry. Energies. 2023, 16, 959. [Google Scholar] [CrossRef]
  24. Liu, C.; Zhao, L.; Lu, C. Exploration of the characteristics and trends of electric vehicle crashes: A case study in Norway. Eur. Transp. Res. Rev. 2022, 14, 6. [Google Scholar] [CrossRef]
  25. Duarte, J.; Marques, A.T.; Santos Baptista, J. Occupational accidents related to heavy machinery: A systematic review. Safety 2021, 7, 21. [Google Scholar] [CrossRef]
  26. Wasim, M.; Djukic, M.B. External corrosion of oil and gas pipelines: A review of failure mechanisms and predictive preventions. J. Nat. Gas Sci. Eng. 2022, 100, 104467. [Google Scholar] [CrossRef]
  27. Babyr, K.V.; Ustinov, D.A.; Pelenev, D.N. Improving electrical safety of the maintenance personnel in the conditions of incomplete single-phase ground faults. Occup. Saf. Ind. 2022, 8, 55–61. [Google Scholar] [CrossRef]
  28. See, K.W.; Wang, G.; Zhang, Y.; Wang, Y.; Meng, L.; Gu, X.; Xie, B. Critical review and functional safety of a battery management system for large-scale lithium-ion battery pack technologies. Int. J. Coal Sci. Technol. 2022, 9, 36. [Google Scholar] [CrossRef]
  29. Liang, J.; Feng, J.; Fang, Z.; Lu, Y.; Yin, G.; Mao, X.; Wang, F. An energy-oriented torque-vector control framework for distributed drive electric vehicles. IEEE Trans. Transp. Electrif. 2023, 9, 4014–4031. [Google Scholar] [CrossRef]
  30. Bonnett, A.H.; Yung, C. Increased efficiency versus increased reliability. IEEE Ind. Appl. Mag. 2008, 14, 29–36. [Google Scholar] [CrossRef]
  31. Ferreira, F.J.T.E.; Baoming, G.; de Almeida, A.T. Reliability and operation of high-efficiency induction motors. In Proceedings of the 2015 IEEE/IAS 51st Industrial & Commercial Power Systems Technical Conference (I&CPS), Calgary, AB, Canada, 5–8 May 2015; pp. 1–13. [Google Scholar] [CrossRef]
  32. Teng, W.; Ding, X.; Tang, S.; Xu, J.; Shi, B.; Liu, Y. Vibration analysis for fault detection of wind turbine drivetrains—A comprehensive investigation. Sensors 2021, 21, 1686. [Google Scholar] [CrossRef]
  33. Kirchgässner, W.; Wallscheid, O.; Böcker, J. Data-driven permanent magnet temperature estimation in synchronous motors with supervised machine learning: A benchmark. IEEE Trans. Energy Convers. 2021, 36, 2059–2067. [Google Scholar] [CrossRef]
  34. Gherabi, Z.; Toumi, D.; Benouzza, N.; Boudinar, A.H.; Koura, M.B. Discrimination between demagnetization and eccentricity faults in PMSMs using real and imaginary components of stator current spectral analysis. J. Power Electron. 2021, 21, 153–163. [Google Scholar] [CrossRef]
  35. Skamyin, A. Method for determining the harmonic contribution of consumer installations based on the application of passive filters. IET Gener. Transm. Distrib. 2024, 18, 2464–2479. [Google Scholar] [CrossRef]
  36. Kudelina, K.; Vaimann, T.; Asad, B.; Rassõlkin, A.; Kallaste, A.; Demidova, G. Trends and challenges in intelligent condition monitoring of electrical machines using machine learning. Appl. Sci. 2021, 11, 2761. [Google Scholar] [CrossRef]
  37. Mohd Ghazali, M.H.; Rahiman, W. Vibration analysis for machine monitoring and diagnosis: A systematic review. Shock. Vib. 2021, 2021, 9469318. [Google Scholar] [CrossRef]
  38. Errigo, A.; Choi, J.K.; Kissock, K. Techno-economic-environmental impacts of industrial energy assessment: Sustainable industrial motor systems of small and medium-sized enterprises. Sustain. Energy Technol. Assess. 2022, 49, 101694. [Google Scholar] [CrossRef]
  39. RJunior, R.F.R.; dos Santos Areias, I.A.; Campos, M.M.; Teixeira, C.E.; da Silva, L.E.B.; Gomes, G.F. Fault detection and diagnosis in electric motors using 1d convolutional neural networks with multi-channel vibration signals. Measurement 2022, 190, 110759. [Google Scholar] [CrossRef]
  40. Duda, A.; Drozdowski, P. Induction Motor Fault Diagnosis Based on Zero-Sequence Current Analysis. Energies 2020, 13, 6528. [Google Scholar] [CrossRef]
  41. Andreev, D.A.; Nazarychev, A.N.; Folvarchuk, A.S. Methods for Reducing Short-Circuit Currents in the Generator Circuit When Designing High-Power Units in Nuclear Power Plants. Power Technol. Eng. 2023, 56, 711–717. [Google Scholar] [CrossRef]
  42. Wang, Z.; Shi, D.; Xu, Y.; Zhen, D.; Gu, F.; Ball, A.D. Early rolling bearing fault diagnosis in induction motors based on on-rotor sensing vibrations. Measurement 2023, 222, 113614. [Google Scholar] [CrossRef]
  43. Zhukovsky, Y.L.; Babanova, I.S.; Korolev, N.A. Method for Diagnosing the Technical Condition and Assessing the Residual Life of an Electromechanical Unit with an Asynchronous Motor. Patent No. 2626231, 10 November 2016. [Google Scholar]
  44. Korolev, N.A.; Boykov, A.V. Certificate of State Registration Program for Computers No. 2023614972 Russian Federation. Program for Monitoring Diagnostic Data of Asynchronous Electric Drive by Current and Voltage; Applicant and Copyright Holder “Empress Catherine II Saint Petersburg Mining University”. Patent No. 2023613721, 9 March 2023. [Google Scholar]
  45. Korolev, N.A.; Koteleva, N.I. Certificate of State Registration Program for Computers No. 2024616314 Russian Federation. Program for Identifying Diagnostic Characteristics of AC Electric Drives in Real Time; Applicant and Copyright Holder “Empress Catherine II Saint Petersburg Mining University”. Patent No. 2024614818, 12 March 2024. [Google Scholar]
Figure 1. General drive structure: (a) power part; (b) measuring part.
Energies 18 02266 g001
Figure 2. Structure of the information–analytical system of diagnostics and management.
Energies 18 02266 g002
Figure 3. Oscillograms of instantaneous values of phase currents and voltages.
Energies 18 02266 g003
Figure 4. Example of organising a diagnostic signal database.
Energies 18 02266 g004
Figure 5. Park’s hodograph: (a) theoretical curves; (b) experimental curves.
Energies 18 02266 g005
Figure 6. Vector diagrams of the phase angles between currents and voltages: (a) normal mode; (b) emergency mode.
Energies 18 02266 g006
Figure 7. Diagnostic diagram.
Energies 18 02266 g007
Figure 8. Rotor speed and electromagnetic torque oscillograms: t = 0–5 s no-load acceleration; t = 5–6 s idle; t = 6–7 s nominal electromagnetic force; t = 7–8 s overload electromagnetic force; and t = 3–4 s idle.
Energies 18 02266 g008
Figure 9. Schematic diagram of the test bench for building and detecting defects of the variable frequency drive: 1—overall view; 2—power supply panel; 3—frequency converter with process level controller; 4—wide-frequency-resolution ADC; 5—measurement module connection diagram; 6—test and load electric drives; and 7—measurement board prototype.
Energies 18 02266 g009
Figure 10. Simulation of eccentricity level: (a) 5%; (b) 10%; (c) 15%; and (d) 20%.
Energies 18 02266 g010
Figure 11. Example of drive performance measurement results: (a) idle mode without defect; (b) rated load mode with 20% eccentricity.
Energies 18 02266 g011aEnergies 18 02266 g011b
Figure 12. Phase current spectra: (a) turn-to-turn short circuit; (b) rotor bar breakage; (c) eccentricity; and (d) bearing failure.
Energies 18 02266 g012aEnergies 18 02266 g012b
Figure 13. Power performance with mechanical defects of the joint coupling: (a) efficiency factor; (b) Power factor.
Energies 18 02266 g013
Figure 14. Rotor speed and electromagnetic torque oscillograms: t = 0–0.5 s no-load acceleration; t = 0.5–1 s idle; t = 1–2 s nominal electromagnetic force; t = 2–3 s overload electromagnetic force; and t = 3–4 s idle.
Energies 18 02266 g014
Table 1. Estimated frequencies of defects.
PointDefectEstimated FrequencyVariable
StatorTurn-to-turn faults in stator windingsfd11 = f1∙(kz2∙(1 − s)/p ± n)f1—fundamental harmonic, Hz;
k—number of frequency component in the sideband, k = 1, 2, 3…;
z2—rotor rod number;
p—number of pole pairs; s—slip;
n—odd integer, n = 1, 3, 5, 7…;
r—odd integer, r = 1, 3, 5, 7…
Stator asymmetryfd12 = f1∙(n∙(1 − s)/p ± r)
RotorRotor rod breakagefd21 = f1∙(1 ± 2∙ks)f1—fundamental harmonic, Hz;
s—slip; n—odd integer, n = 1, 3, 5, 7…;
k—number of frequency component in the sideband, k = 1, 2, 3…
Stator asymmetryfd22 = f1∙(n∙(1 − s) ± s)
ShaftStatic eccentricity of the air gapfd31 = f1∙[(kR ± nd)∙(1 − s)/p ± v]f1—fundamental harmonic, Hz;
nd—dynamic order
eccentricity nd = 1, 2, 3…;
p—number of pole pairs; s—slip;
R—number of rotor slots;
v—order of stator time harmonics, v = 1, 3, 5, 7…;
k—number of frequency component in the sideband, k = 1, 2, 3…
Dynamic eccentricity of air gapfd32 = f1∙[kR (1 − s)/p ± v]
BearingRolling elementfd41 = f1snb/2∙[1 − (Db/Dccosβ)2]f1—fundamental harmonic, Hz;
s—slip; nb—number of balls in the bearing;
β—ball contact angle, degrees;
Dc—diameter of ball centres circle, mm;
Db—rolling element diameter, mm.
External ringfd42 = f1snb/2∙[1 + (Db/Dccosβ]
Internal ringfd43 = f1snb/2∙[1− (Db/Dccosβ])
Table 2. General technical state of the electric drive.
Technical Condition Index
K T C
Technical Condition FeatureOperating Recommendations
0 < K T C ≤ 0.1Functional condition up to the defect thresholdNormal operation
0.1 < K T C ≤ 0.2Functional condition with deviations not affecting energy and mechanical characteristicsNormal operation with decreasing measuring interval
0.2 < K T C ≤ 0.4Partially faulty state with a defect affecting energy and mechanical characteristicsIt is allowed with constant monitoring and implementation of preventive control algorithms
0.4 < K T C ≤ 1Faulty conditionEmergency stop
Table 3. Mechanical efficiency evaluation.
IndicatorEccentricity Level %
5101520
ω , rad/s67.610.412
M , N·m9.68.27.05.6
K M e 4.86.18.110.4
Table 4. General technical drive condition.
Technical Condition IndexEccentricity Level %
5101520
K T C 0.080.120.160.21
Disclaimer/Publisher’s Note: The statements, opinions and data contained in all publications are solely those of the individual author(s) and contributor(s) and not of MDPI and/or the editor(s). MDPI and/or the editor(s) disclaim responsibility for any injury to people or property resulting from any ideas, methods, instructions or products referred to in the content.

