Article

Impact Investigation of Structural Parameters and Inlet Exhaust Gas Boundary Conditions on Particles Trapping Efficiency of Carrier Wall in GPF Based on a Non-Homogeneous Dynamic Extended Capture Model

School of Automotive Studies, Tongji University, Shanghai 201804, China
*
Author to whom correspondence should be addressed.
Energies 2025, 18(9), 2255; https://doi.org/10.3390/en18092255
Submission received: 31 March 2025 / Revised: 24 April 2025 / Accepted: 25 April 2025 / Published: 28 April 2025

Abstract

:
To accurately predict the performance of GPF trapping, this study proposes a non-homogeneous dynamic extended capture model for a gasoline particulate filter (GPF). The model consists of a non-homogeneous filter wall sub-model, a filter wall temperature sub-model, a particle size distribution sub-model, and a capture unit sub-model. The distribution of pore size, inlet particles, and growth of the trapping unit were considered in the model to improve its accuracy. A bench test was conducted to validate the model on a GS61 1.5 L direct injection gasoline engine, combined with three particle filters of different structural parameters. Based on the proposed model, the influence of structural parameters and inlet tail gas boundary conditions, as well as the inlet particle’s properties, on the filtration efficiency of the carrier wall was investigated. The results show that the length, cell density, and wall thickness of the carrier wall have a significant effect on the filtration efficiency of the filter wall, while the porosity, mean, and variance in pore size distribution of the carrier wall have a greater effect on the initial filtration efficiency. As for the inlet tail gas boundary conditions and the inlet particle’s properties, the inlet tail gas flow rate and the amount of particles have a significant impact on the filtration efficiency of the GPF. Specifically, GPFs with shorter length, smaller cell density, and thicker walls, while appropriately reducing the porosity and the mean and variance of pore size of the carrier wall, can effectively improve the filtration efficiency. The larger the number of particles, the larger the average particle diameter, and the more dispersed the particle size distribution, the higher the filtration efficiency of the GPF.

1. Introduction

Gasoline direct injection (GDI) engines have the characteristics of a large compression ratio, high thermal efficiency, and good fuel economy. However, GDI engines have the problems of local rich combustion in the cylinder [1] and pool fire combustion [2], which result in much higher particulate matter (PM) and particle number (PN) emissions than port fuel injection (PFI) engines [3]. In addition, GDI engines produce more ultrafine particles than diesel engines fitted with diesel particulate filters (DPFs) [4], which may enter the blood circulatory system or lymphatic system, inducing diseases related to cardiopulmonary dysfunction [5]. Therefore, the research on the control of particle emissions from GDI engines is of great significance for reductions in PM and PN to improve environmental quality [6]. The use of a gasoline particulate filter (GPF) can significantly reduce PM and PN emissions compared with in-engine purification technologies (e.g., Exhaust Gas Recirculation (EGR)) [7,8].
A GPF is a wall–flow structure, and the particle trapping process is a process in which the porous media trap discrete particles from the engine exhaust [9], and the filtration efficiency is directly correlated with the physicochemical characteristics of the discrete particles, the fluid state, and the parameters of the porous media [10]. And the carbon loadings [11], exhaust flow rates, and particle sizes [12] also affect the filtration efficiency of GPFs. To investigate the mechanism of GPF trapping and accurately predict the performance of GPF trapping, scholars are constantly trying to model the performance of particle filters. At present, the capture model of wall–flow particle traps is mainly based on the assumption of classical spherical unit-filled bed, combining Brownian diffusion, direct interception, inertial collision, gravity deposition capture mechanism, solving particle convection–diffusion equations, analyzing the trajectory of particles in the trap, and obtaining the filtration efficiency of the trapping unit [13]. The filtration efficiency of the trapping unit is then obtained by aggregating the trapping units, forming hypothetical filter walls and sedimentary layers, and synthesizing the Kuwabara flow field around the spherical trapping units [14]. In summary, particle trapping models based on the assumption of spherical unit-filled beds assume a predictive equation between porous wall permeability and porosity for different particle deposition states [15]. At the same time, there is a functional correspondence between the porous medium properties and the amount of particle deposition [16]. However, the prediction accuracy of the model is low if the non-homogeneous nature of the porous medium is not taken into account.
The non-homogeneous capture model, in which the pore size distribution on the capture wall is taken into account, has been applied to the prediction of particle filter pressure drop, as well as the filtration efficiency of GPFs. For example, Bollerhoff et al. [17] showed that the simultaneous consideration of non-homogeneous capture wall structure parameters of porous media can improve the calculation accuracy of the particle trapping model. Jian et al. [18] analyzed the effect of non-homogeneous of pore size distribution on GPF filtration efficiency by introducing a pore size probability density function. Vaclavik et al. [19] compared the porosity and pore size distribution results obtained from X-ray tomography, scanning electron microscope, and mercury intrusion porosimetry (MIP), respectively. The establishment of an extended particle trapping model, which takes into account the growth mechanism of the trapping unit and the transformation mechanism of the trapping course and responds to the dynamic trapping process of the particles, is the trend of the current particle trapping models [20].
In summary, non-homogeneous capture models have begun to be used to elucidate the internal capture mechanism of GPFs and to predict the trapping performance of GPFs. However, current non-homogeneous models do not consider variations in exhaust and wall temperatures during the capture process and do not accurately describe the number of particles in the particle filter inlet, and these simplifications increase the inaccuracy of the capture performance prediction.
This paper consists of an introduction, a non-homogeneous dynamic extended capture model of GPFs, results and discussion, and a conclusion. Specifically, a non-homogeneous dynamic extended capture model for wall–flow GPFs is established and experimentally validated in Section 2, through which the influence of physical parameters of GPFs and inlet tail gas boundary conditions on the capture efficiency of the carrier wall is investigated in Section 3. Finally, conclusions are drawn in Section 4. The results of this paper can provide theoretical references and insights into the design and layout of GPFs.

2. Non-Homogeneous Dynamic Extended Capture Model of GPFs

The proposed non-homogeneous dynamic extended capture model of GPFs includes four sub-models: a non-homogeneous filter wall sub-model, a filter wall temperature sub-model, a particle size distribution sub-model, and a GPF trapping unit sub-model. The model framework is shown in Figure 1. In the model, the direct interception, inertial collision, and Brownian diffusion capture efficiency of the GPF trapping units are calculated in real time using the four sub-models described above.

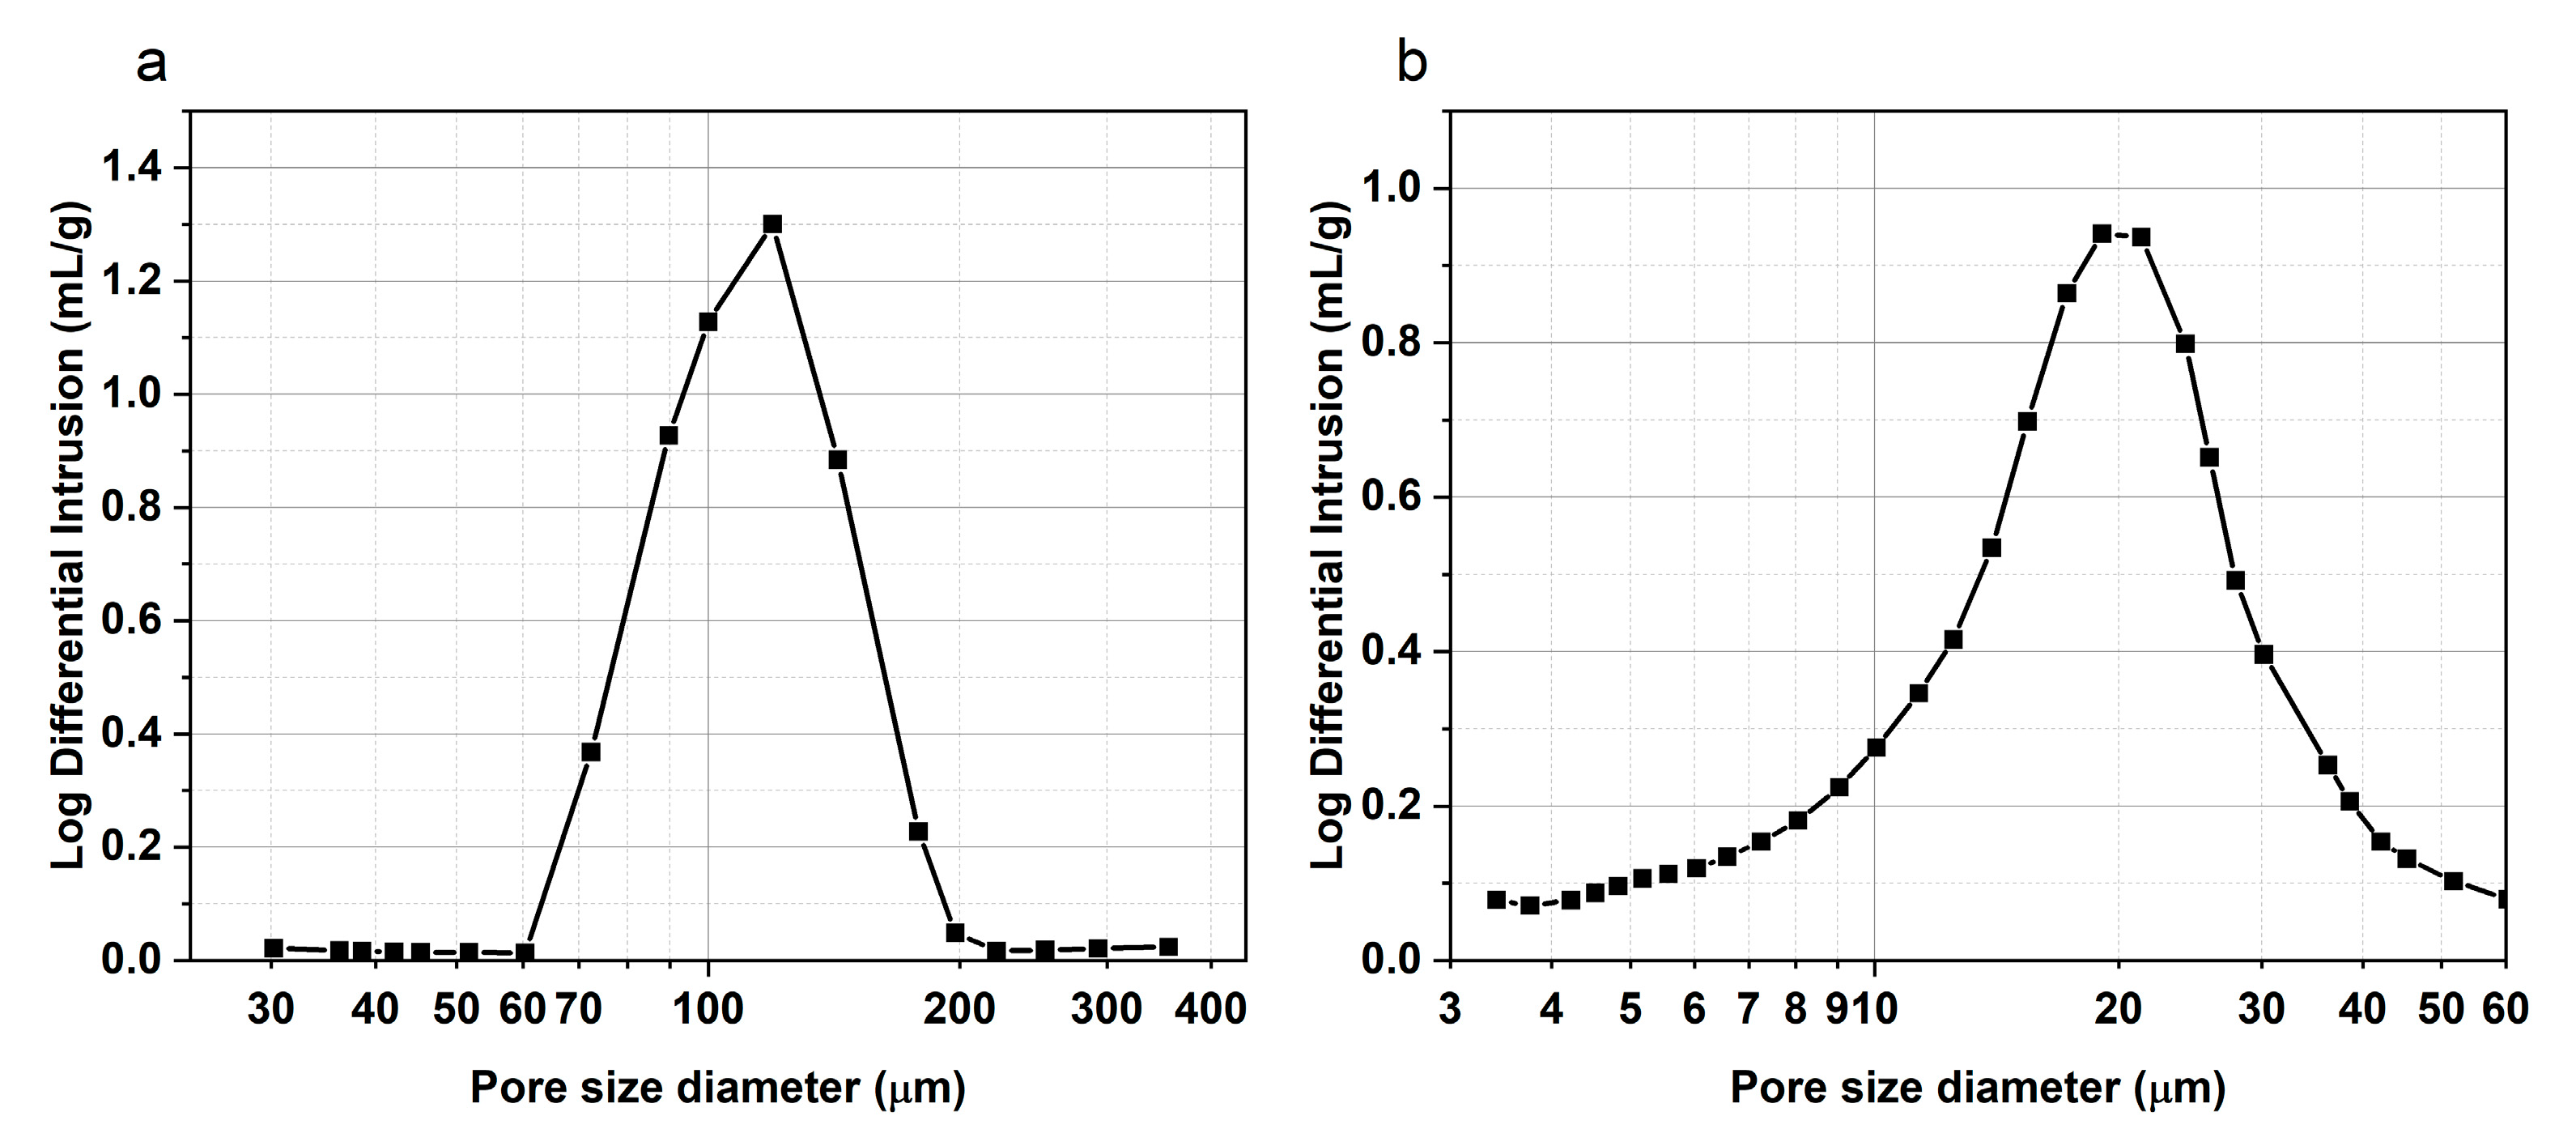
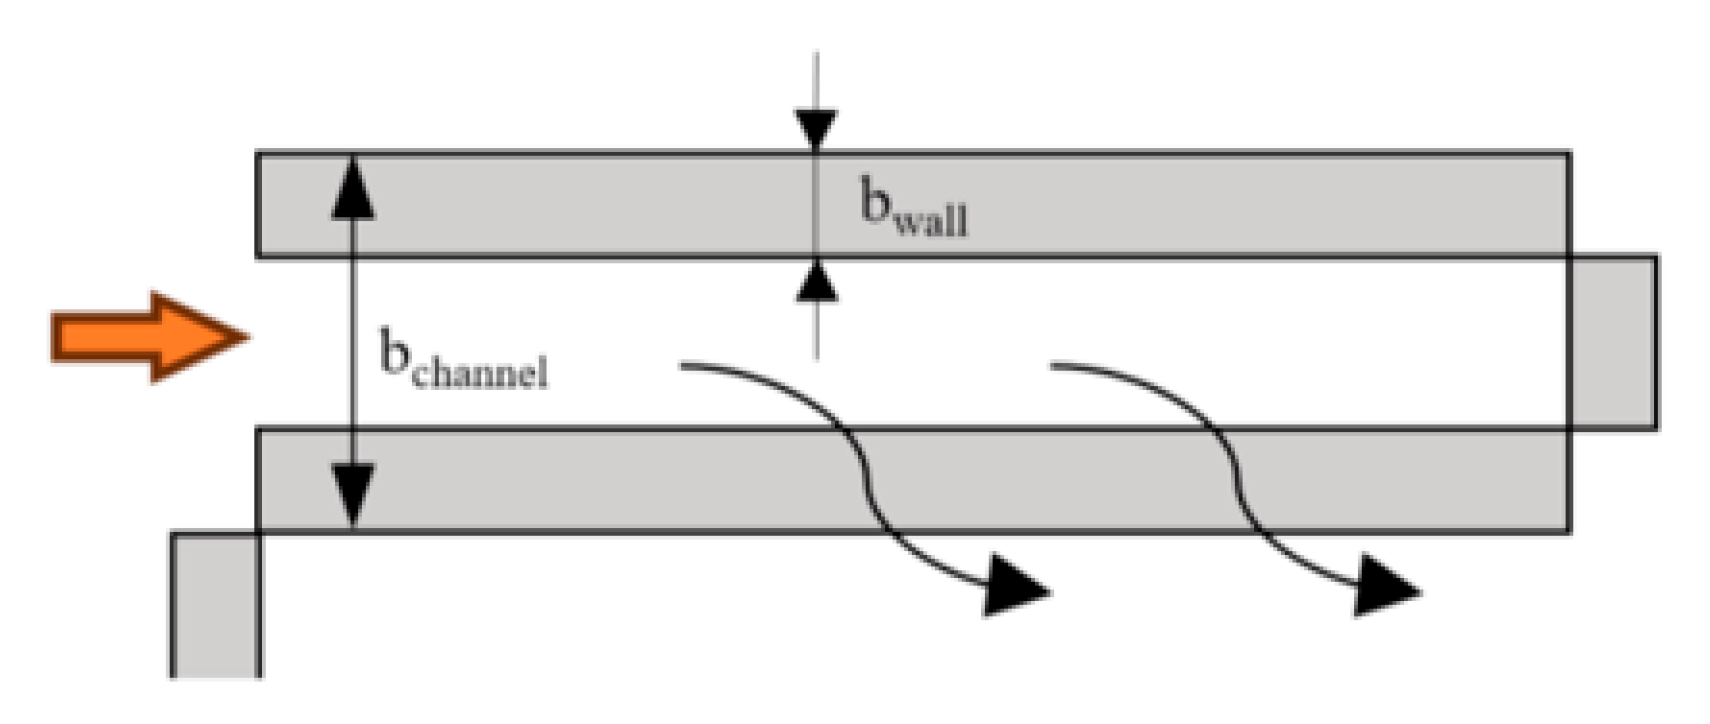
2.1. Non-Homogeneous Filter Wall Sub-Model

The capture process of particle filters mainly occurs within the pores of the filter wall, so the structural parameters such as the number of pores and porosity of the GPF have a great influence on the particle capture efficiency, and an accurate grasp of the pore size distribution of the carrier wall surface is conducive to improving the accuracy of the capture model. Particle filters made from cordierite can efficiently remove PM and PN from exhaust and have been used on a large scale [21]. The porosity and pore size distribution of ceramic carriers are mainly related to the processing technology [22,23], including template content and the sintering additive composition. Existing studies have shown that the pores in the GPF filter wall are non-homogeneously distributed. Belot et al. [24] measured the effect of different coating amounts on the pore size in the carriers. The pore size inside the carrier of the GPF showed a unimodal distribution, with the diameter of micropores ranging from 1 μm to 100 μm, and the peak pore size was around 20 μm.
The wall porosity and pore size distribution can be measured by the Mercury intrusion porosimetry (MIP method), 3D X-ray computed tomography [25], or reconstructed through a quartet structure generation set (QSGS) [26,27]. The MIP method is a method to measure the pore size distribution of mesopores and macropores in solid powders. The main principle is that mercury does not infiltrate solids; it requires an applied pressure to cause the mercury to overcome surface tension and enter the solid, i.e., a contact angle greater than 90°. By measuring the volume of mercury immersed in the micropores, the volume of the corresponding micropores can be obtained [19,28]. The pore size distributions of 100/300 cpsi and 200 cpsi carriers measured by the MIP method are shown in Figure 2. Similar to Gong’s study [18], the pore sizes of both GPF carrier materials showed a unimodal distribution. The peak micropore diameter of the 100 cpsi carrier was located at 119.3 μm, with the main distribution of pore sizes ranging from 60.3 μm to 221.3 μm, and that of the 200 cpsi carrier was located at 21.3 μm, with its pore sizes ranging from 0 to 51.7 μm.
The Gaussian distribution model is used to fit the pore size distribution within the GPF carrier. The probability density function of the Gaussian model is shown in Equation (1). This study uses as an estimate of the expectation and variance of the Gaussian distribution, which is calculated as shown in Equations (2) and (3).
f x = 1 2 π σ e x μ 2 2 σ 2
d ¯ p o r e = 1 k i = 1 k d p o r e , k
σ ¯ p o r e 2 = 1 k 1 i = 1 k d p o r e , k d ¯ p o r e 2
where dpore is the average pore size, σpore2 is the variance of the pore size.
Different samples of the same carrier will have slightly different pore size distributions. In order to improve the applicability of the model, this study reconstructs the wall pore size based on the average porosity by setting the mean and variance of the pore size. The block diagram of the construction process is shown in Figure 3. Firstly, a set of micropores is generated according to the Gaussian distribution determined by the input parameters, and whether the wall porosity reaches the preset porosity is calculated. If not, the microporous diameters satisfying the set Gaussian distribution are generated again until the wall porosity reaches the preset porosity. After that, the number of micropores and the diameter of micropores are output, which are used to construct the non-homogeneous capture wall, which is subsequently used for the calculation of the filtration efficiency.

2.2. Filter Wall Temperature Sub-Model

There is spatial variability in the temperature distribution during the warming process inside the particle filter. The carrier temperature affects the Brownian diffusion of fine particles in the exhaust, which in turn significantly affects the trapping effect and soot loading characteristics [29]. In this paper, the temperature change inside the GPF is simulated by the axial convective heat transfer from the GPF, combined with the finite element analysis method, during the warming process.
The modeling assumptions have been made as follows:
(1)
The gas inside the GPF is assumed to be an ideal gas, and intermolecular interactions are ignored.
(2)
The oxidative regeneration process inside the GPF is not considered; only the heat exchange between the gas and the GPF wall is considered.
(3)
The gas inside the GPF is considered to be an incompressible fluid.
(4)
Neglecting the difference in flow rate in different micropores of GPF [30].
Since the axial length inside the GPF is much larger than the radial distance and the wall porosity is very small, the gas flow inside the GPF can be treated as a one-dimensional pipe flow. Based on the principle of finite element analysis (FEA), the GPF is divided into k cells with equal spacing in the axial direction. The convective heat transfer process between the gas and the filtered wall of the GPF in each basic cell is calculated separately, and the output of part (i − 1) is used as the input of part i. The output of part i is used as the input of the next part. The calculation schematic is shown in Figure 4 and Figure 5. The arrows point to the direction of gas flow and the arrow color indicates the temperature from high (orange) to low (blue).
The gas in the process of movement and the carrier wall convective heat transfer, according to the convective heat transfer Equation (4), can be obtained from the carrier wall and the amount of heat exchange of the gas.
Q = h A Δ T
where Q is the heat transfer between the gas and the carrier wall per unit time, A is the contact area between the gas and the carrier wall, ΔT is the temperature difference between the two, and h is the convective heat transfer coefficient of the gas.
d Q = ρ g c g v g S g d T g
where ρg is the gas density; cg is the constant pressure specific heat capacity of the gas; vg is the gas flow rate; Sg is the cross-sectional area of a single orifice of the carrier through which the gas flows; and Tg is the gas temperature.
A = 4 b c h a n n e l 2 b w a l l x
where bchannel is the length of the orifice side; bwall is the wall thickness, and x is the distance from the GPF inlet.
Organizing Equations (4)–(6), the formula for the gas temperature as a function of GPF inlet distance can be derived.
T g x = 4 h b c h a n n e l 2 b w a l l × T g T w a l l ρ g c g v g S g
T g , x = T g , x = 0 T w , x e 4 h b c h a n n e l 2 b w a l l t ρ g c g v g S g + T w , x
where Twall is the temperature of wall, Tg,x denotes the gas temperature at distance x from the GPF inlet, and Tw,x denotes the carrier wall temperature at distance x from the GPF inlet. Due to the convective heat transfer between the carrier and the gas, the carrier temperature changes continuously with time. According to the same method, the temperature change in the carrier on the wall surface can be obtained, as shown in Equations (9) and (10).
T w t = 4 h b c h a n n e l 2 b w a l l × T g T w a l l ρ w c w b c h a n n e l 2
T w , t = T w , t = 0 T g , t e 4 h b c h a n n e l 2 b w a l l t ρ w c w v g b c h a n n e l 2 + T g , t
where ρw is the density of the carrier; cw is the specific heat capacity of the carrier; Tw,t is the temperature of the wall at time t; and Tg,t is the temperature of the gas at time t. In the GPF trapping process, its internal temperature varies over a wide range, and the convective heat transfer coefficient h can be calculated by Nusselt number, as shown in Equation (11).
N u f = h λ d
where λ is the thermal conductivity of the fluid, and d is the characteristic length. Liu et al. [30] showed that the Nusselt number Nuf of a fluid in a tiny channel is related to the flow state, which can be calculated from the Reynolds number Ref and the Prandtl number Prf of the gas in the particle filter, and the equations for Ref and Prf are shown in Equation (12) [30]. Reynolds number is the ratio between the inertial and viscous forces of the fluid, and the Prandtl number is defined as the ratio of momentum diffusivity to thermal diffusivity.
R e f = ρ g v g b channel μ g             P r f = c g μ g λ
where μg is the viscosity coefficient of the gas, and the Reynolds number of the gas in the GPF is less than the laminar critical value of 2300, so the gas inside the GPF can be considered as a laminar flow state. At the same time, the Planck’s number ranges from 0.5 to 17,000, so the Hausen laminar flow state is applied to calculate the Nusselt’s number, as shown in Equation (13) [31].
N u f = 3.66 + 0.19 Re f P r f b c h a n n e l L 0.8 1 + 0.117 Re f P r f b c h a n n e l L 0.467
where L is the length of the GPF. The variation in temperature with time and distance from the inlet after convective heat transfer can be obtained by coupling Equations (8), (10), (11) and (13), as well as the variation in temperature and temperature gradient at the capture wall.

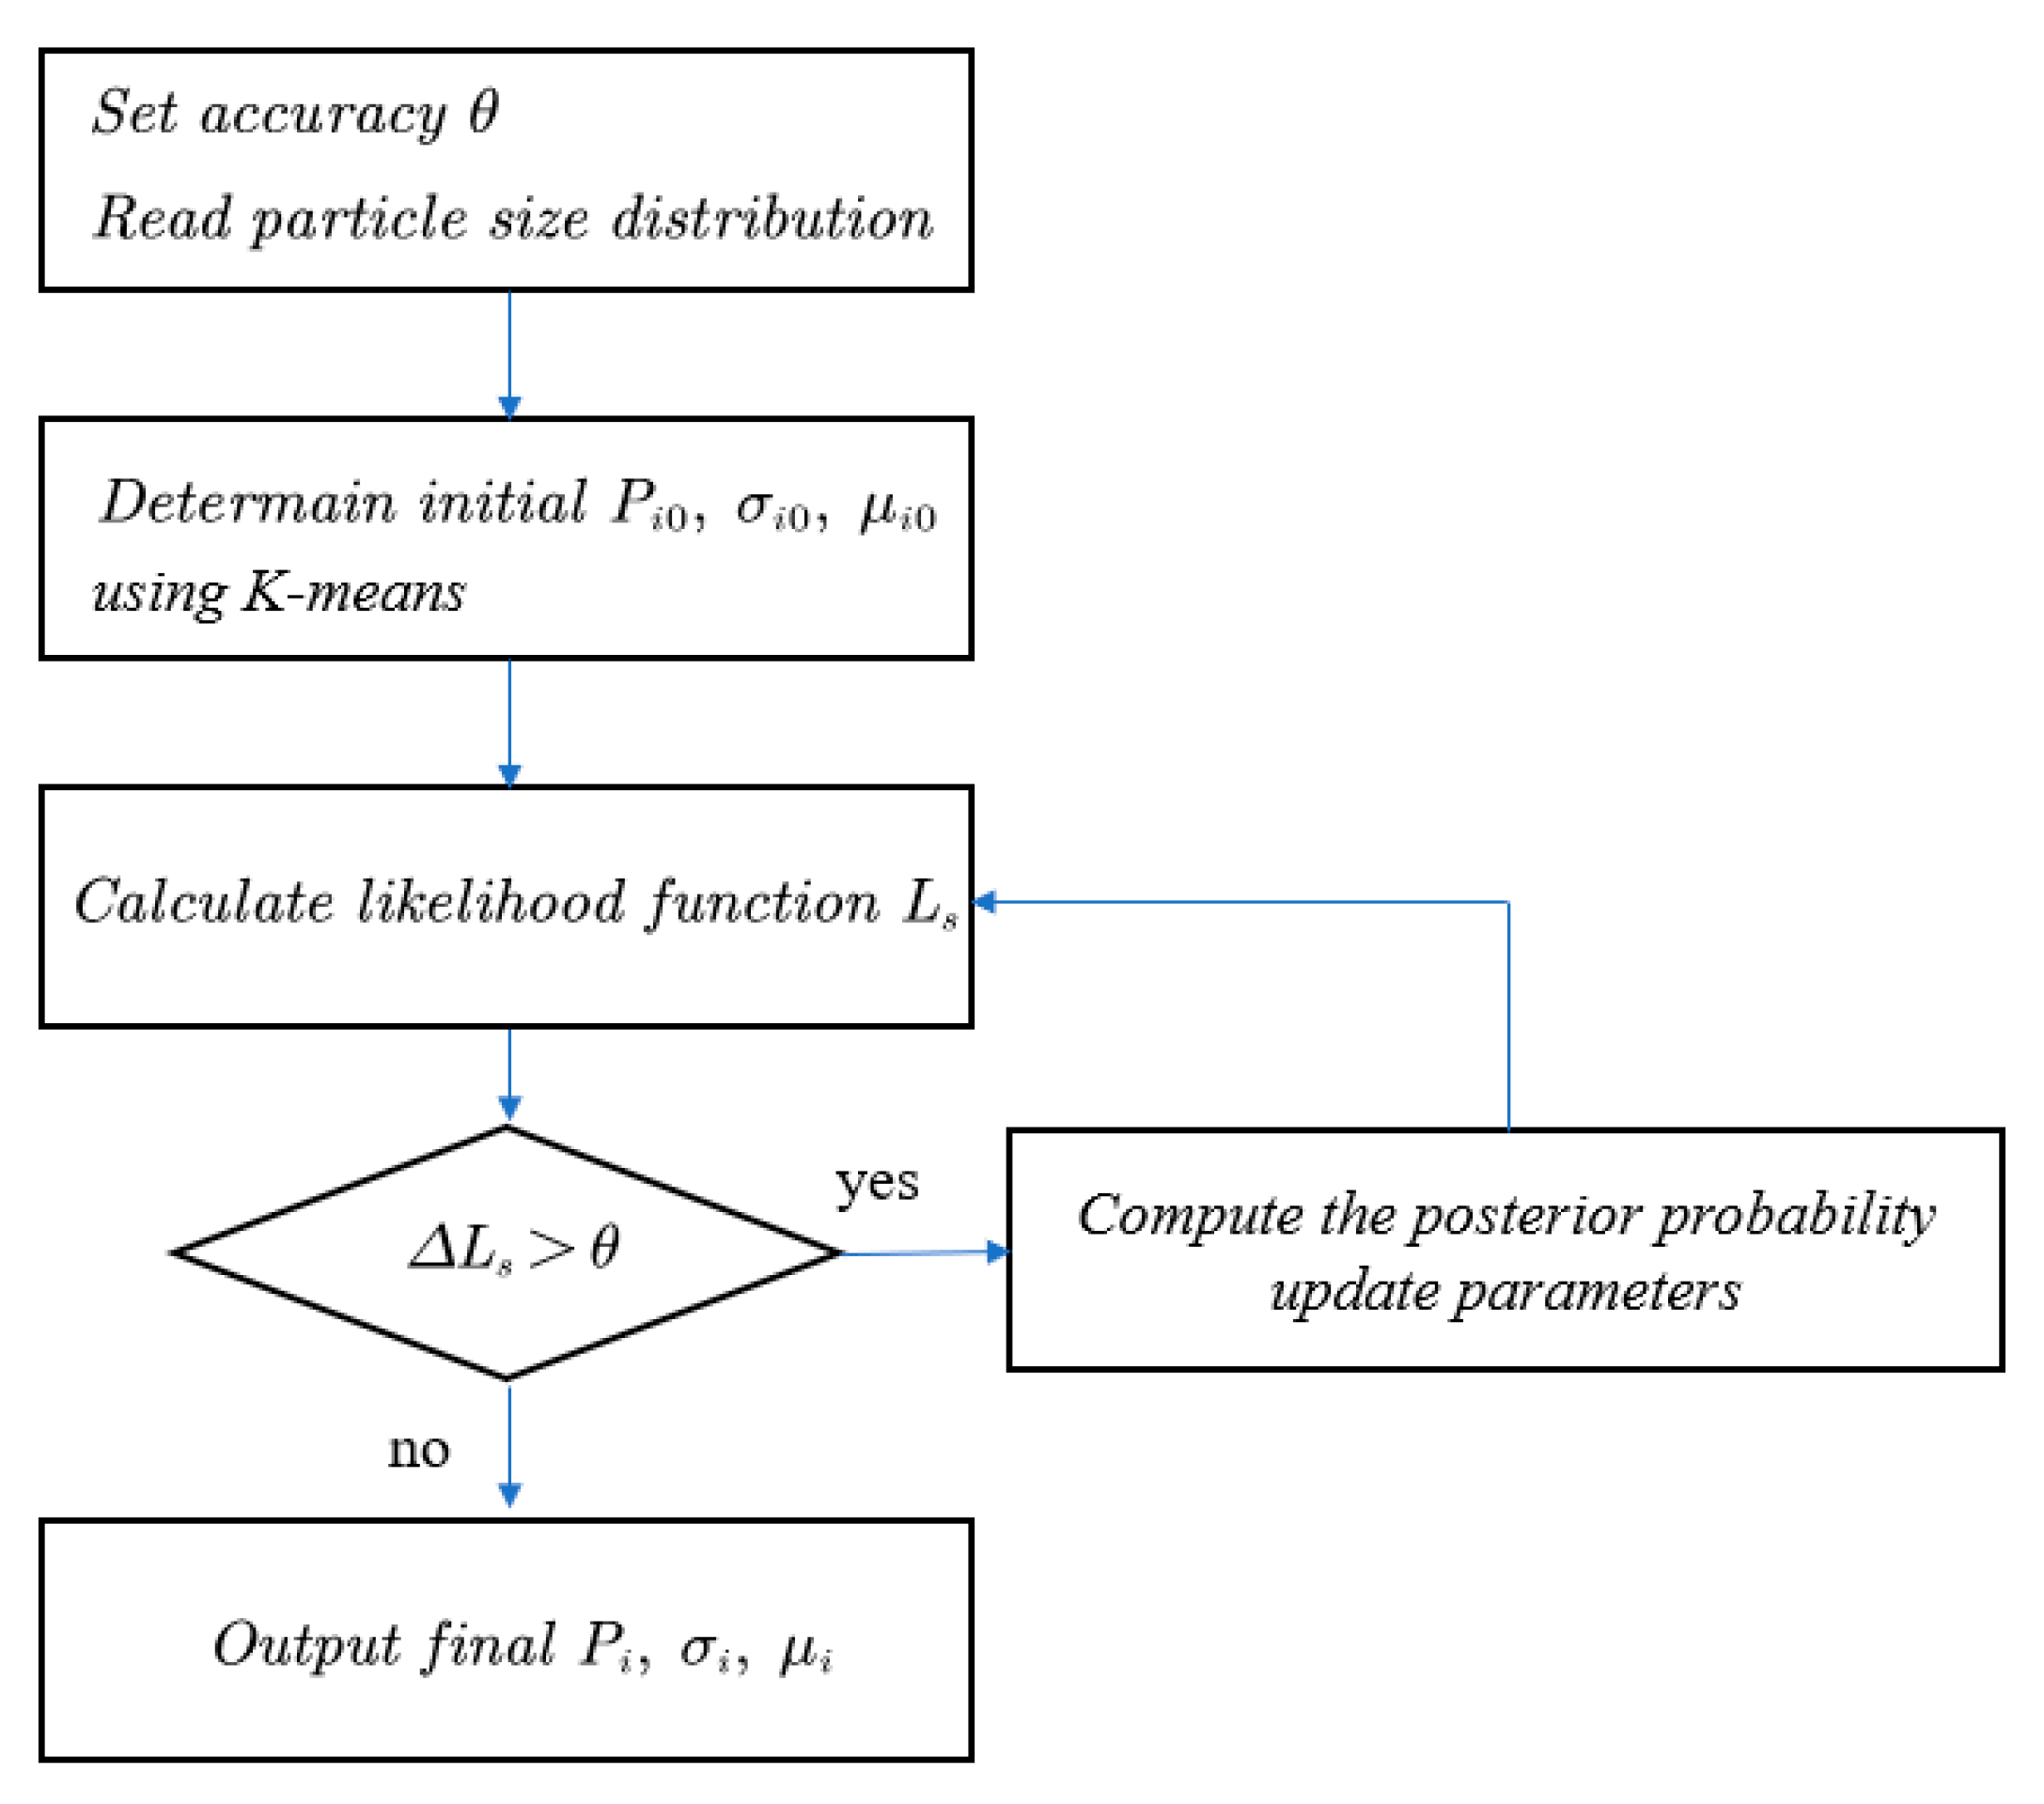
2.3. Particle Size Distribution Sub-Model

Generally, PN from the GDI engine shows a bimodal distribution with peaks near 10 nm and 60 nm [32], including nucleation and accumulation modes [33]. Similar to the capture wall pore size distribution, a mathematical description of the particle size distribution is beneficial for modeling the GPF trapping process [34].
In this study, a Gaussian mixture distribution was used to transform the particle size distribution into a superposition of three Gaussian distributions. The probability density function of the Gaussian mixture distribution is shown in Equation (14)
f x i = 1 3 P i 1 2 π σ i e x μ i 2 2 σ i 2
where Pi denotes the contribution of each Gaussian distribution, and the value ranges from 0 to 1; σi and μi denote the standard deviation and mean of the ith Gaussian distribution, respectively. Figure 6 shows the block diagram of the algorithm for the Gaussian mixture distribution.
Firstly, the K-mean clustering method is used to initially classify the particle size data into three categories, and the sample mean and sample variance of each category are used as the initial values of the three Gaussian distributions, μi,0, σi,0, and the initial value of Pi,0 is set to 1/3. Next, the likelihood function Ls and the posterior probability of each Gaussian distribution γi are calculated as shown in Equations (15) and (16).
L s = i = 1 3 ln P i f x i
γ i = P i f i x i = 1 3 P i f i x
After that, it is judged whether the difference in the likelihood function in the two iterations is less than the preset accuracy. If not, the parameters are updated according to Equations (17)–(19) until the difference in the iterative likelihood function is within the preset accuracy, and finally, the results are exported.
μ i = i = 1 3 γ i x i i = 1 3 γ i
σ i = i = 1 3 γ i x i μ i 2 i = 1 3 γ i
P i = i = 1 3 γ i 3

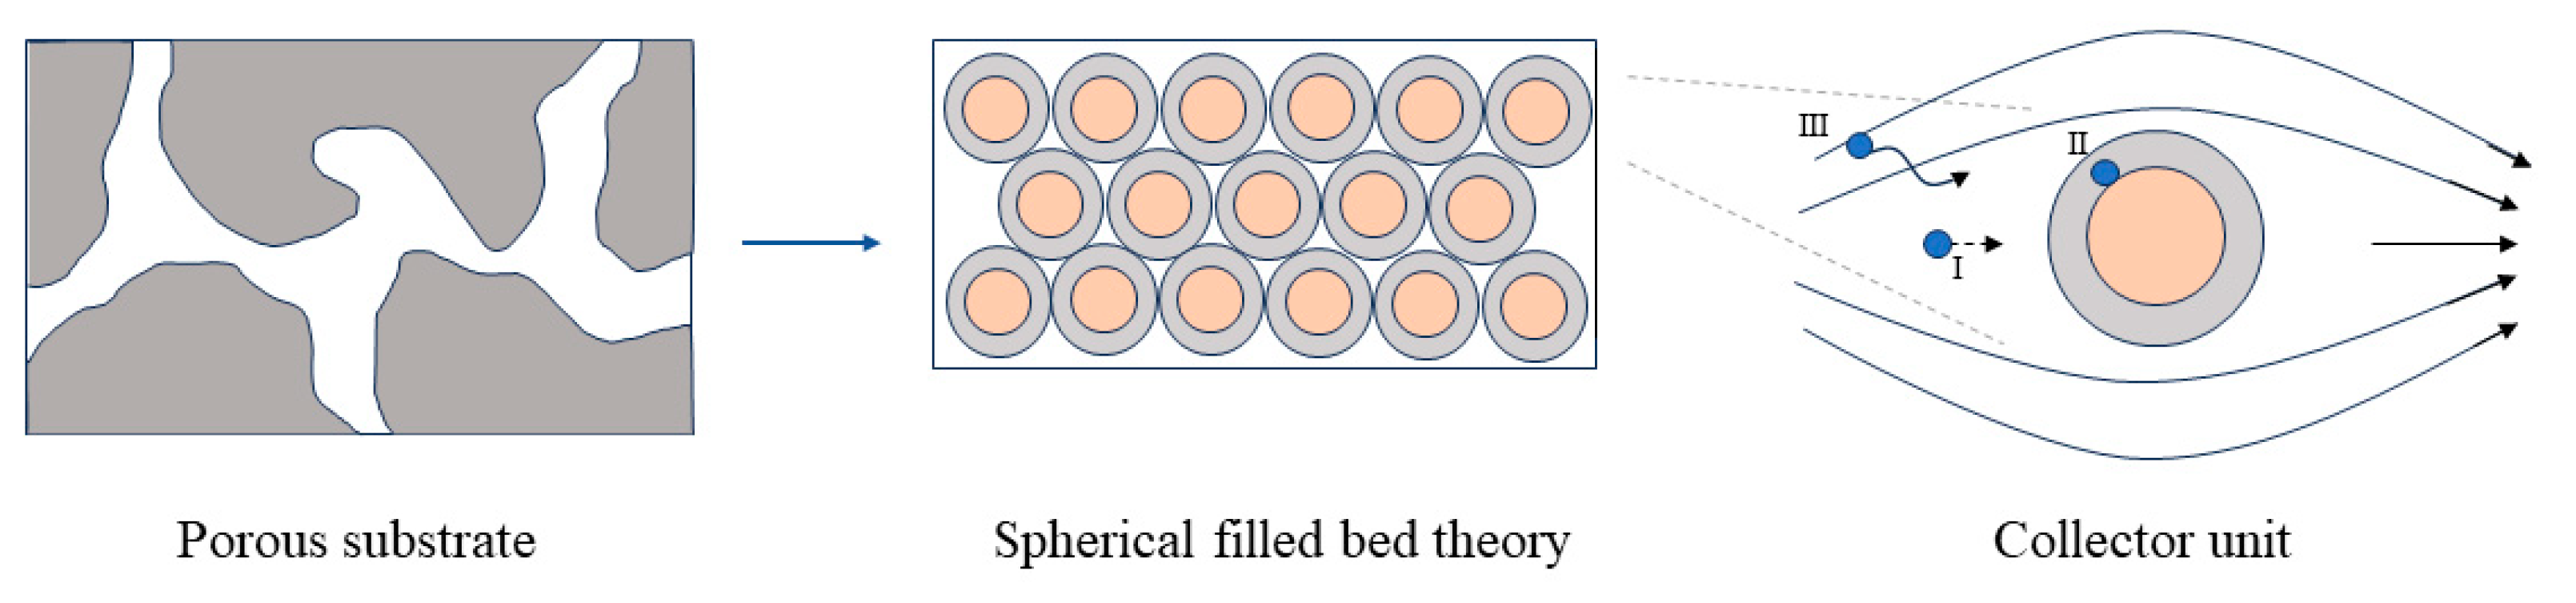
2.4. Capture Unit Sub-Model

As the exhaust gas stream carrying particles flows inside the GPF carrier, the particles are captured in the wall micropores, as shown in Figure 7. Then, the trapping model presented here is the unit collector model of Lee and Gieseke [35] and was first applied to DPFs by Konstandopoulos and Johnson [36].
The trapping mechanisms of GPFs mainly include (i) Brownian diffusion, (ii) direct interception, (iii) inertial collision, and (iv) gravitational deposition [16,37]. The first three mechanisms are considered to be the most important, and they were considered in this study, as shown in Figure 7 Collector unit subgraph ((I) inertial collision, (II) direct interception, (III) Brownian diffusion,). The specific assumptions are as follows:
(1)
The average porosity of the spherical capture volume is equal to the porosity of the porous medium.
(2)
The sphere-filled bed has the same surface area to pore volume ratio as a pore of the mean pore diameter.
Specifically, the initial diameter df,0 of the spherical capture group can be calculated by Equation (20).
d f , 0 = 1.5 1 ε w ε w d p o r e , 0
where εw is the porosity and dpore is the average pore size.
In the process of particles being captured, the three capture mechanisms act simultaneously on the same capture unit. Under the individual action of the three capture mechanisms, the capture efficiency ηq of a single spherical trapping unit is given by Equation (21).
η q = 1 1 η b l 1 η l j 1 η g x
where ηq is the capture efficiency of a single trapping unit, and ηbl, ηli, and ηgx are the filtration efficiency of Brownian diffusion, direct interception, and inertial collision, respectively.

2.4.1. Brownian Diffusion

The Brownian diffusion trapping principle refers to the irregular thermal movement of nanoscale particles in a gas, which are captured when the particles are close to the trapping unit. The Brownian diffusion filtration efficiency is calculated by Equation (22).
η b l = 3.5 ε w K w 1 3 P e w 2 3
where ηbl is the Brownian diffusion capture efficiency, and Kw is the Kuwabara factor, which can be calculated as in Equation (23).
K w = 2 1 5 1 ε w 2 ε w 9 5 1 ε w 1 3
where Pew is the Péclet number, which characterizes the ratio of the convection rate to the diffusion rate and is calculated from Equation (24).
P e w = v g d q ε w C D , p
where vg is the superficial velocity, dq is the diameter of the trapping unit, and CD,p is the Brownian diffusion coefficient of the particle matter in the pores, calculated from Equation (25).
C D , p = K B T g S t c 3 π d p μ g
where KB is the Boltzmann constant with a value of 1.381 × 10⁻²³, Tg is the gas temperature, dp is the diameter of the particle matter, μg is the viscosity of the gas passing through the filter wall, and Stc is the Stokes–Cunningham factor, which is calculated from Equation (26) [16,17].
S t c = 1 + K g 1.26 + 2 5 e 1.1 K g
where Kg is the Knudsen number of the particle matter, characterizing the continuous medium nature of the gas, calculated from Equation (27).
K g = 2 λ lg d p o r e
where λlg is the mean free range of the particle matter. By combining the above equations, the capture efficiency of a GPF unit corresponding to a certain wall pore diameter can be obtained at a specific temperature and particle size.

2.4.2. Direct Interception

Particles with large diameters and trajectories that do not deviate from the flow line can be collected by a single collector using a cut-off filtering mechanism. The direct interception capture efficiency is calculated by Equation (28).
η l j = 3 ε w N r 2 2 K w 1 + N r 1 ε w 2 3
where ηlj is the capture efficiency of particle matter by direct interception, Kw is the Kuwabara factor, and Nr is the intensity factor of direct interception, calculated from Equation (29).
N r = L p , g a t h e r d q
According to the fractal theory of particle matter [38], the maximum length Lp,gather of particle matter aggregates is related to the radius of agglomeration Rg diameter, as shown in Equation (30) [17,37].
L p , g a t h e r = 1.5 ± 0.05 × 2 R g
According to the previous research of our team [29], the ratio of the agglomeration radius of particle matter aggregates, Rg, to the average diameter of the basic carbon particles of particle matter, rp, ranges from e0.7 to e0.9, and the value of e0.8 is taken in the present study, from which the maximum length of particle matter aggregates is obtained, and the direct interception efficiency of a certain diameter of the trapping unit on the particle matter aggregates is calculated according to Equation (28).

2.4.3. Inertial Collision

When the mass of the particles is large, in the process of movement due to inertia, the original direction of movement is maintained for direct collision on the surface of the trapping unit so as to be arrested. This capture effect is the inertial collision effect. Equation (31) gives the calculation of the inertial collision capture efficiency [37].
η g x = N s t 2 0.25 + N s t 2
where Nst is the Stokes number of the particle matter, indicating the ratio of inertial to diffusive action of the particle matter, calculated as in Equation (32).
N s t = S t c v g ρ p d p 2 9 μ g d q ε w
where Stc is the Stokes–Cunningham factor calculated by Equation (26), vg is the gas flow rate, ρp is the soot packing density of the particle matter, μg is the viscosity of the gas, and dq and dp correspond to the diameter of the trapping unit and the diameter of the particle matter, respectively.

2.5. Non-Homogeneous Dynamic Extended Capture Model

2.5.1. Growth of Trapping Units

As the particle trapping process proceeds, the trapped particle matter is adsorbed inside the micropores of the GPF wall, equivalently attached to the surface of the trapping unit. The variation in the diameter of the spherical trapping unit with the deposition of particle matter is shown in Equation (33). The presented trapping unit collector’s increase in diameter with soot deposition was first pointed out by Konstandopoulos [14].
d q , n e w = 2 3 m p 4 π ρ p + 1 2 d q , 0 3 3
where dq,new is the changed diameter of the spherical trapping unit after deposition of particles; mp is the mass of particles; and ρp is the soot packing density. The maximum mass of particles that can be attached to the surface of a clean spherical trapping unit is calculated by Equation (34).
m q , max = π 6 ρ g Ψ d Q 3 d q , 0 3 3
where ψ is the pore bridging onset factor; a value of 0.92 was taken in this study [14,39]. dQ is the diameter of the spherical trapping group, which is calculated by Equation (35).
d Q = d q 1 ε w 1 3

2.5.2. Filter Wall

Introducing the wall porosity and the diameter of the spherical trapping units, the filtration efficiency of a filter wall containing a plurality of spherical trapping units can be calculated [36].
η w = 1 e 3 n q 1 ε w b w a l l S 2 ε w d q
where bwall is the wall thickness, and S is an empirical parameter used to correct the model.
In particular, by considering spherical trapping units of different diameters, the pore size distribution is reflected in the calculation of the wall filtration efficiency in this paper.

2.5.3. The Whole GPF

With the sub-model constructed in the above subsection, the relationship between the filtration efficiency of the trapping unit and the diameter of the particle inlet, the temperature distribution, and the pore size of the filter wall can be obtained, as demonstrated in Equation (37).
η q , i = f d p , T w , T g , d p o r e
where ηq, i is the capture efficiency of trapping unit i, dp is the diameter of the particle, Tw is the temperature of the wall, Tg is the temperature of gas, and dpore is the average pore size of filter wall.
The overall capture efficiency of GPFs can be obtained at each time point by integrating each trapping unit. Considering the dynamic growth mechanism of the trapping units and particle deposition, the overall capture efficiency of the GPF changes with time, i.e., the non-homogeneous dynamic extended capture model, as shown in Equation (38).
η t o t a l = η q , i d t

2.6. Model Validation

In this paper, an engine test was carried out to validate the non-homogeneous dynamic extended capture model of the GPF.

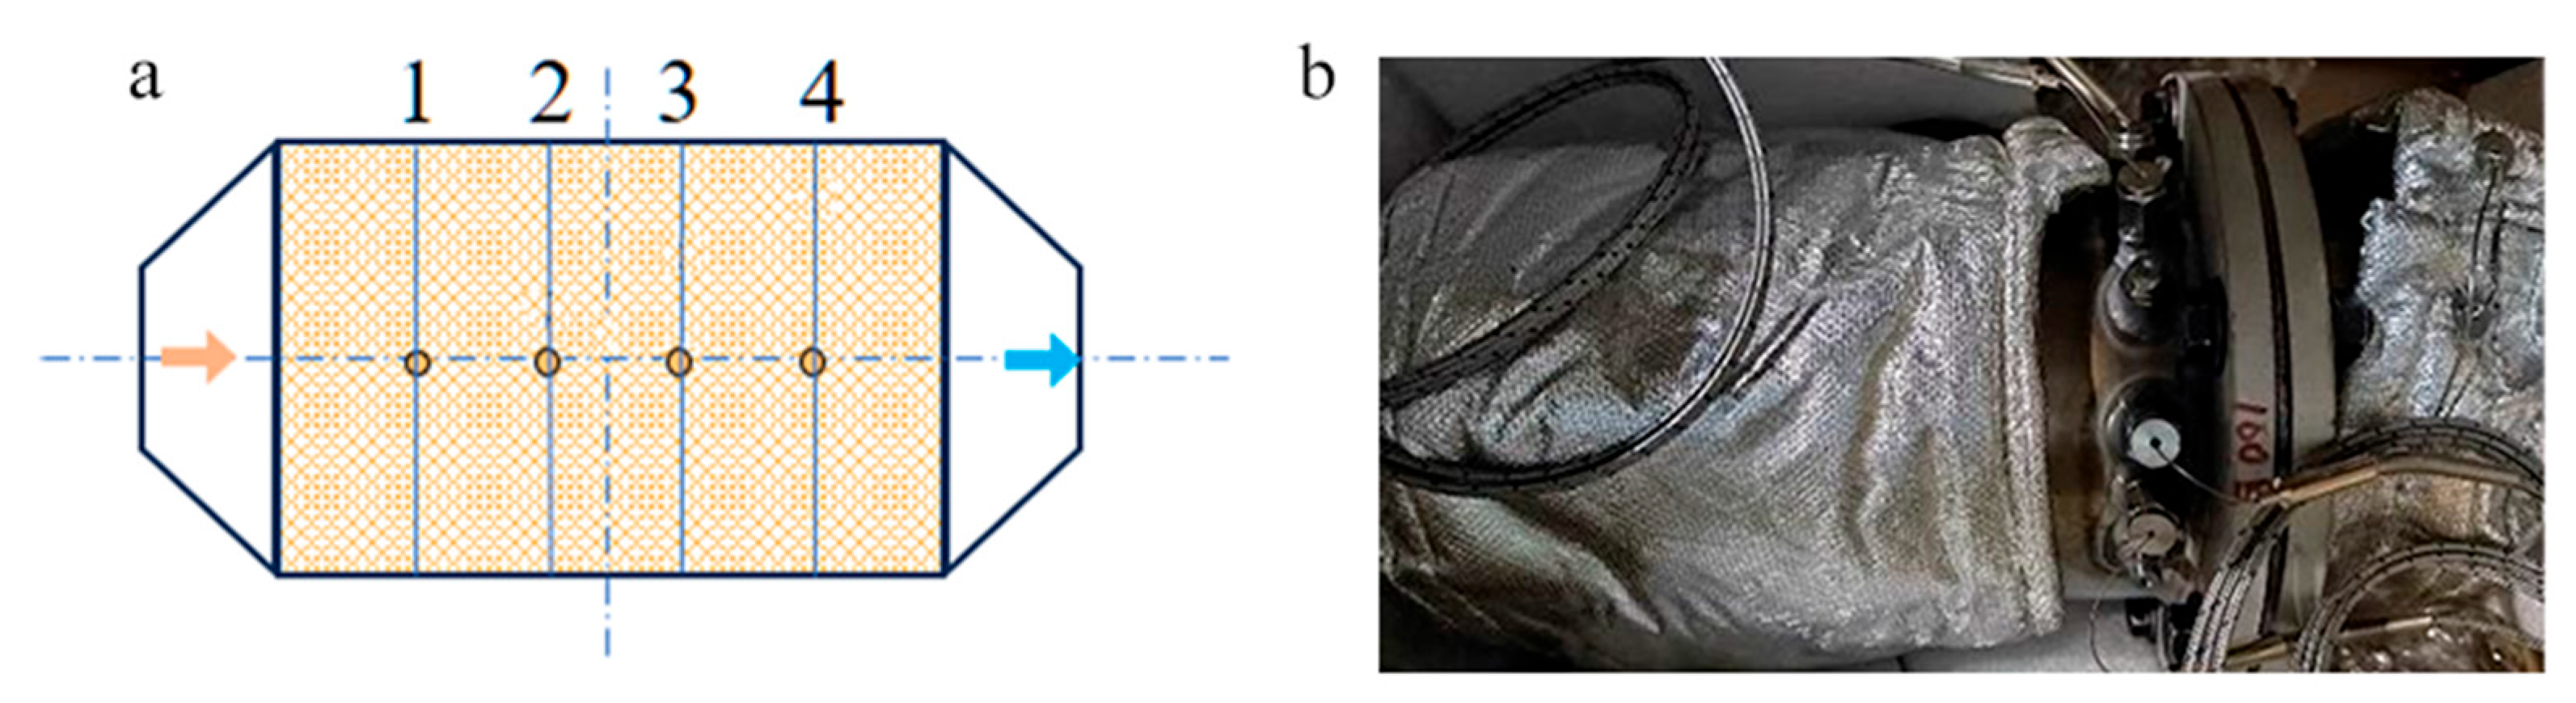
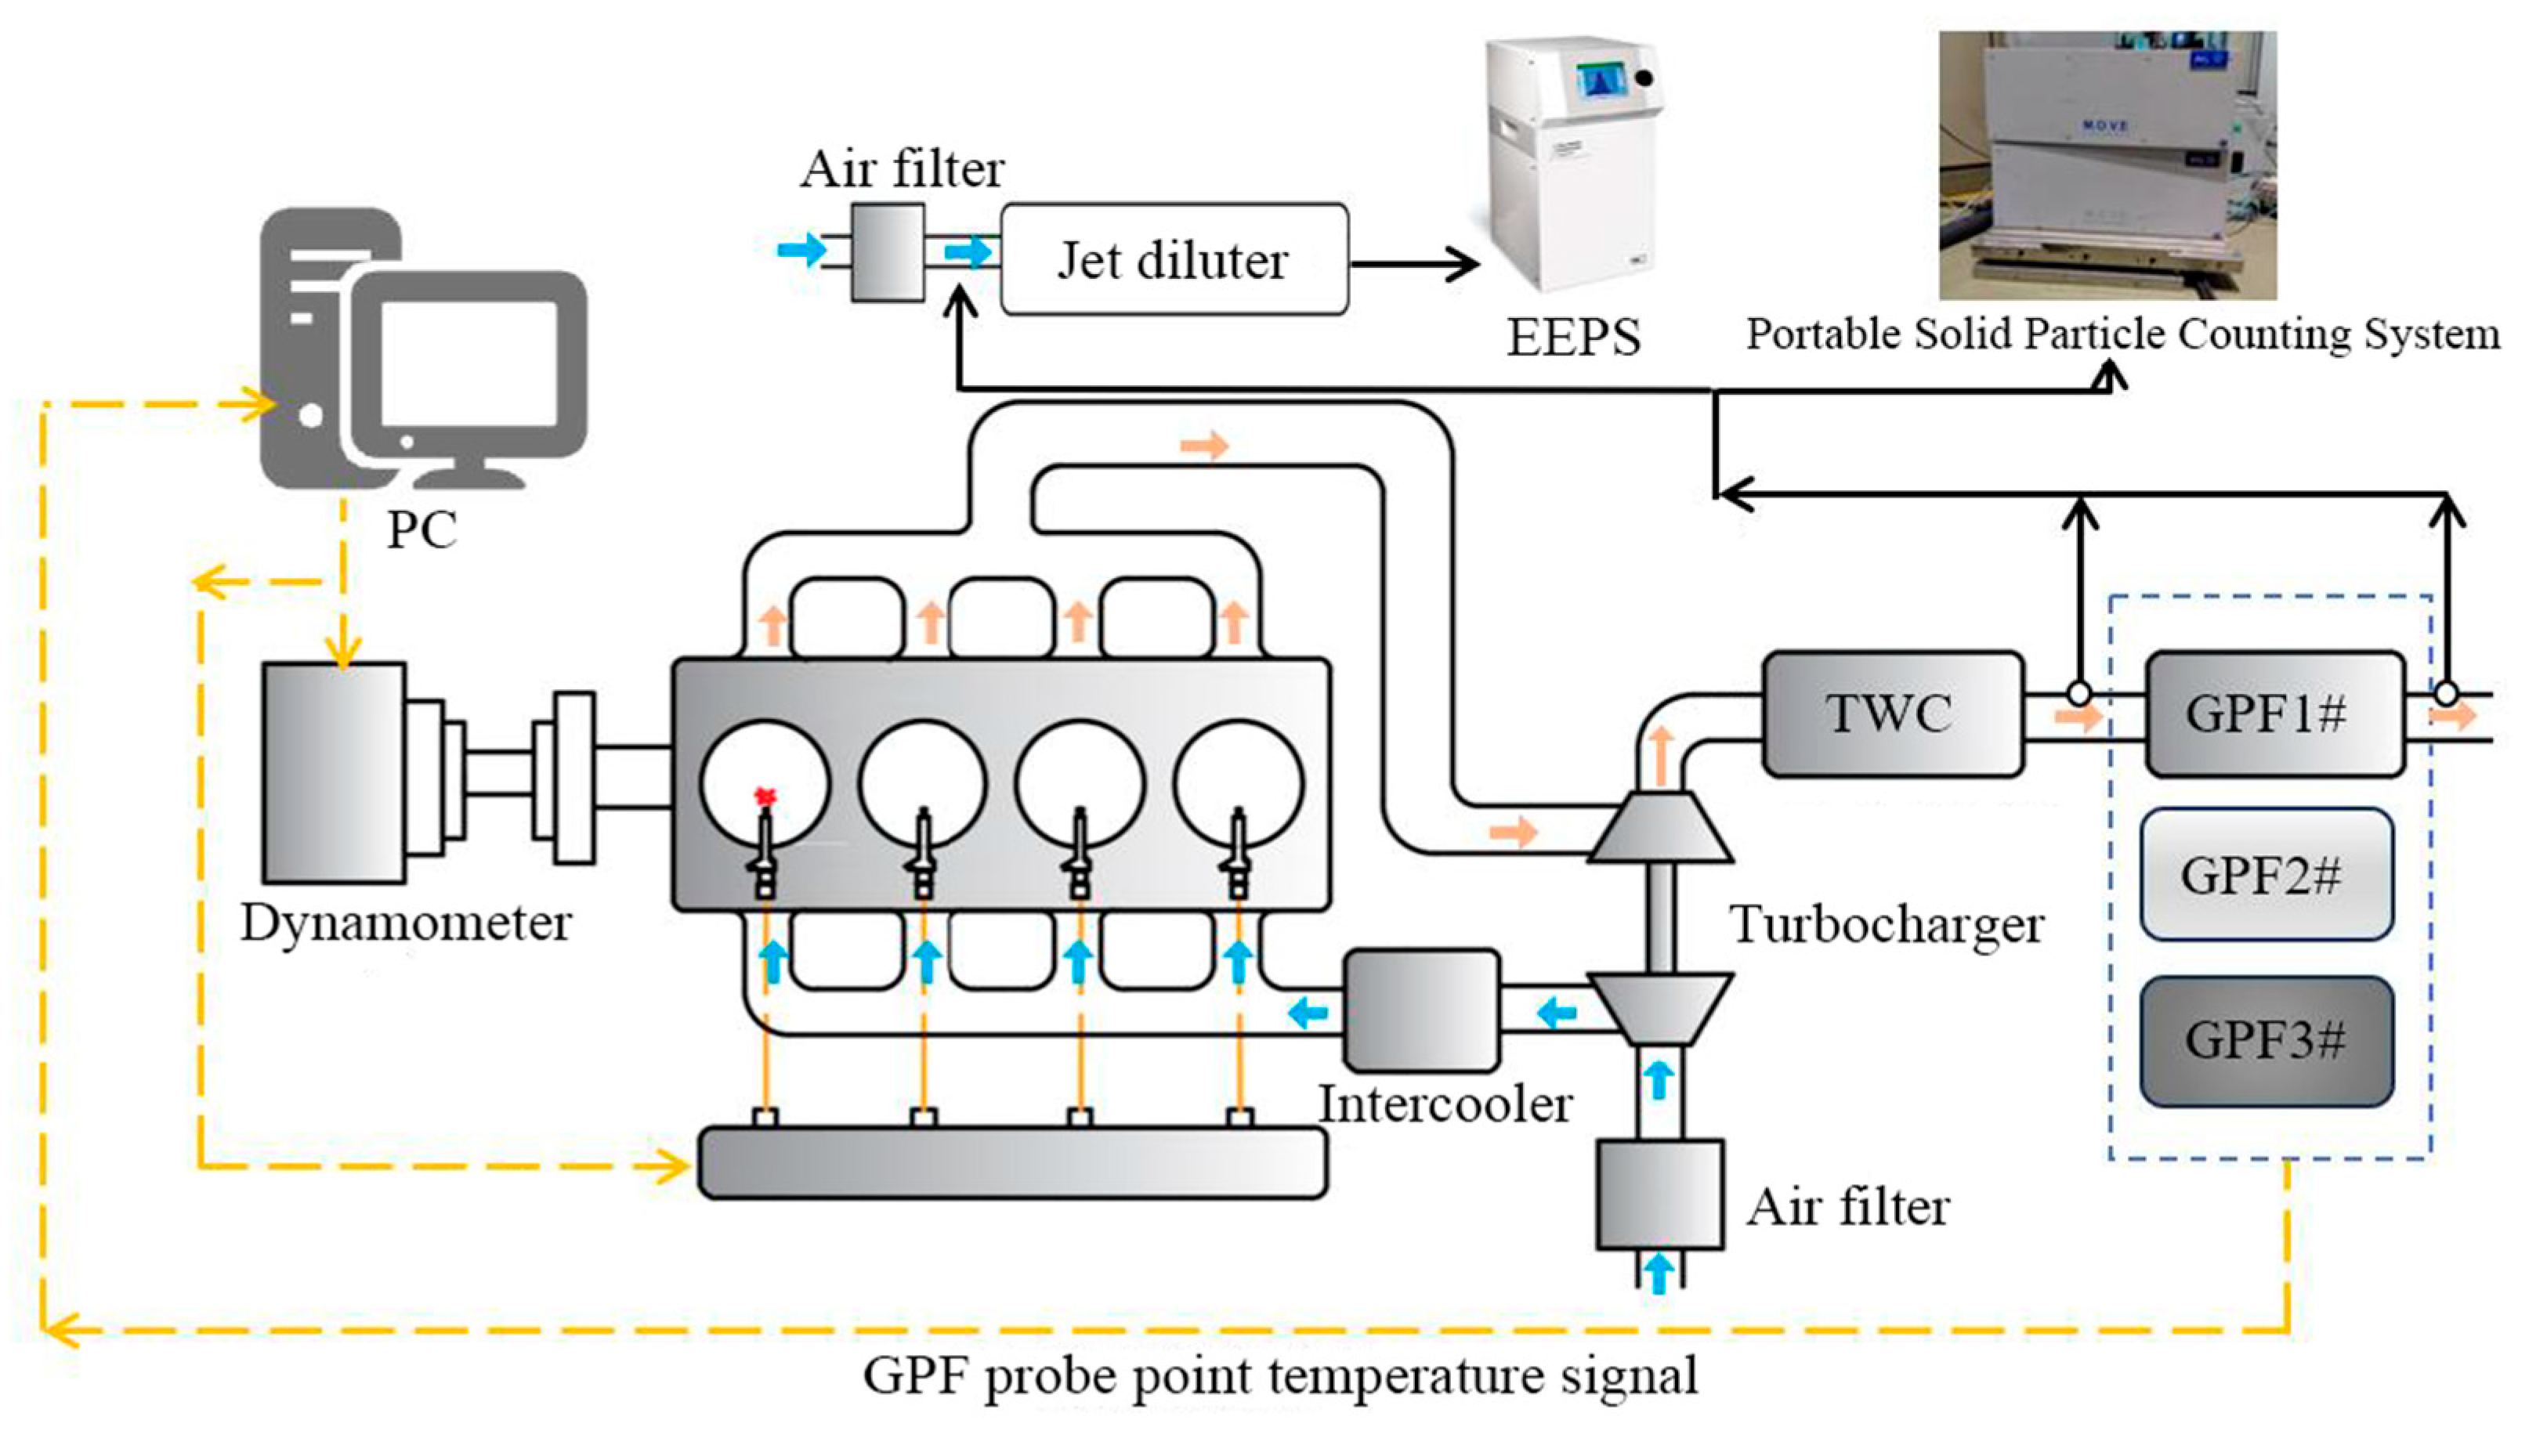
2.6.1. Experimental Setup

The test engine is a turbocharged 4-cylinder GDI engine with a displacement of 1.5 L, a calibrated power of 125 kW, and a compression ratio of 10.5. Three GPFs with different carrier cell densities, i.e., 100, 200, 300 cpsi, are chosen to obtain the effect of pore size of filter wall on capture efficiency of the GPF. The specific parameters of the GPF are listed in Table 1.
The installation locations of thermocouples are shown in Figure 8a. The arrows point to the direction of gas flow and the arrow color indicates the temperature from high (orange) to low (blue). Four high-temperature thermocouples (0–1000 °C) with different probe lengths were installed inside the channels of the carrier and held in place by a hexagonal nut with a hole in the center, as shown in Figure 8b, to obtain the temperature distribution of GPF along the central axis.
The test equipment includes an engine bench and PN measurement system. A Horibar engine bench is used for engine control and bench data collection. A portable Solid Particle Counting System (SPCS) of AVL was used to measure the solid PN with a diameter of 23 nm–2.5 μm released from engine exhaust. Meanwhile, the measurements of PN with a diameter of 5.6–560 nm and particle size distribution are performed by Engine Exhaust Particle Size Spectrometer (EEPS 3090) from TSI® Incorporated, the sampling tube for the EEPS was installed after jet diluter (FPS-4000) from Dekati Ltd. with a diluter ratio of 8.21 and diluter temperature of 120 °C. Two sampling positions for PN measurement are set after the three-way catalyst (TWC), one before and one after the GPF. The schematic view of the experimental setup is shown in Figure 9. The arrows indicate the direction of gas flow and the arrow color represents high-temperature gas (orange) and low-temperature gas (blue).
Five operating conditions listed in Table 2 and Figure 10 were selected to validate the GPF capture model. PN sampling started after 5 min of stable engine operating conditions, and the sample time is 30 s.

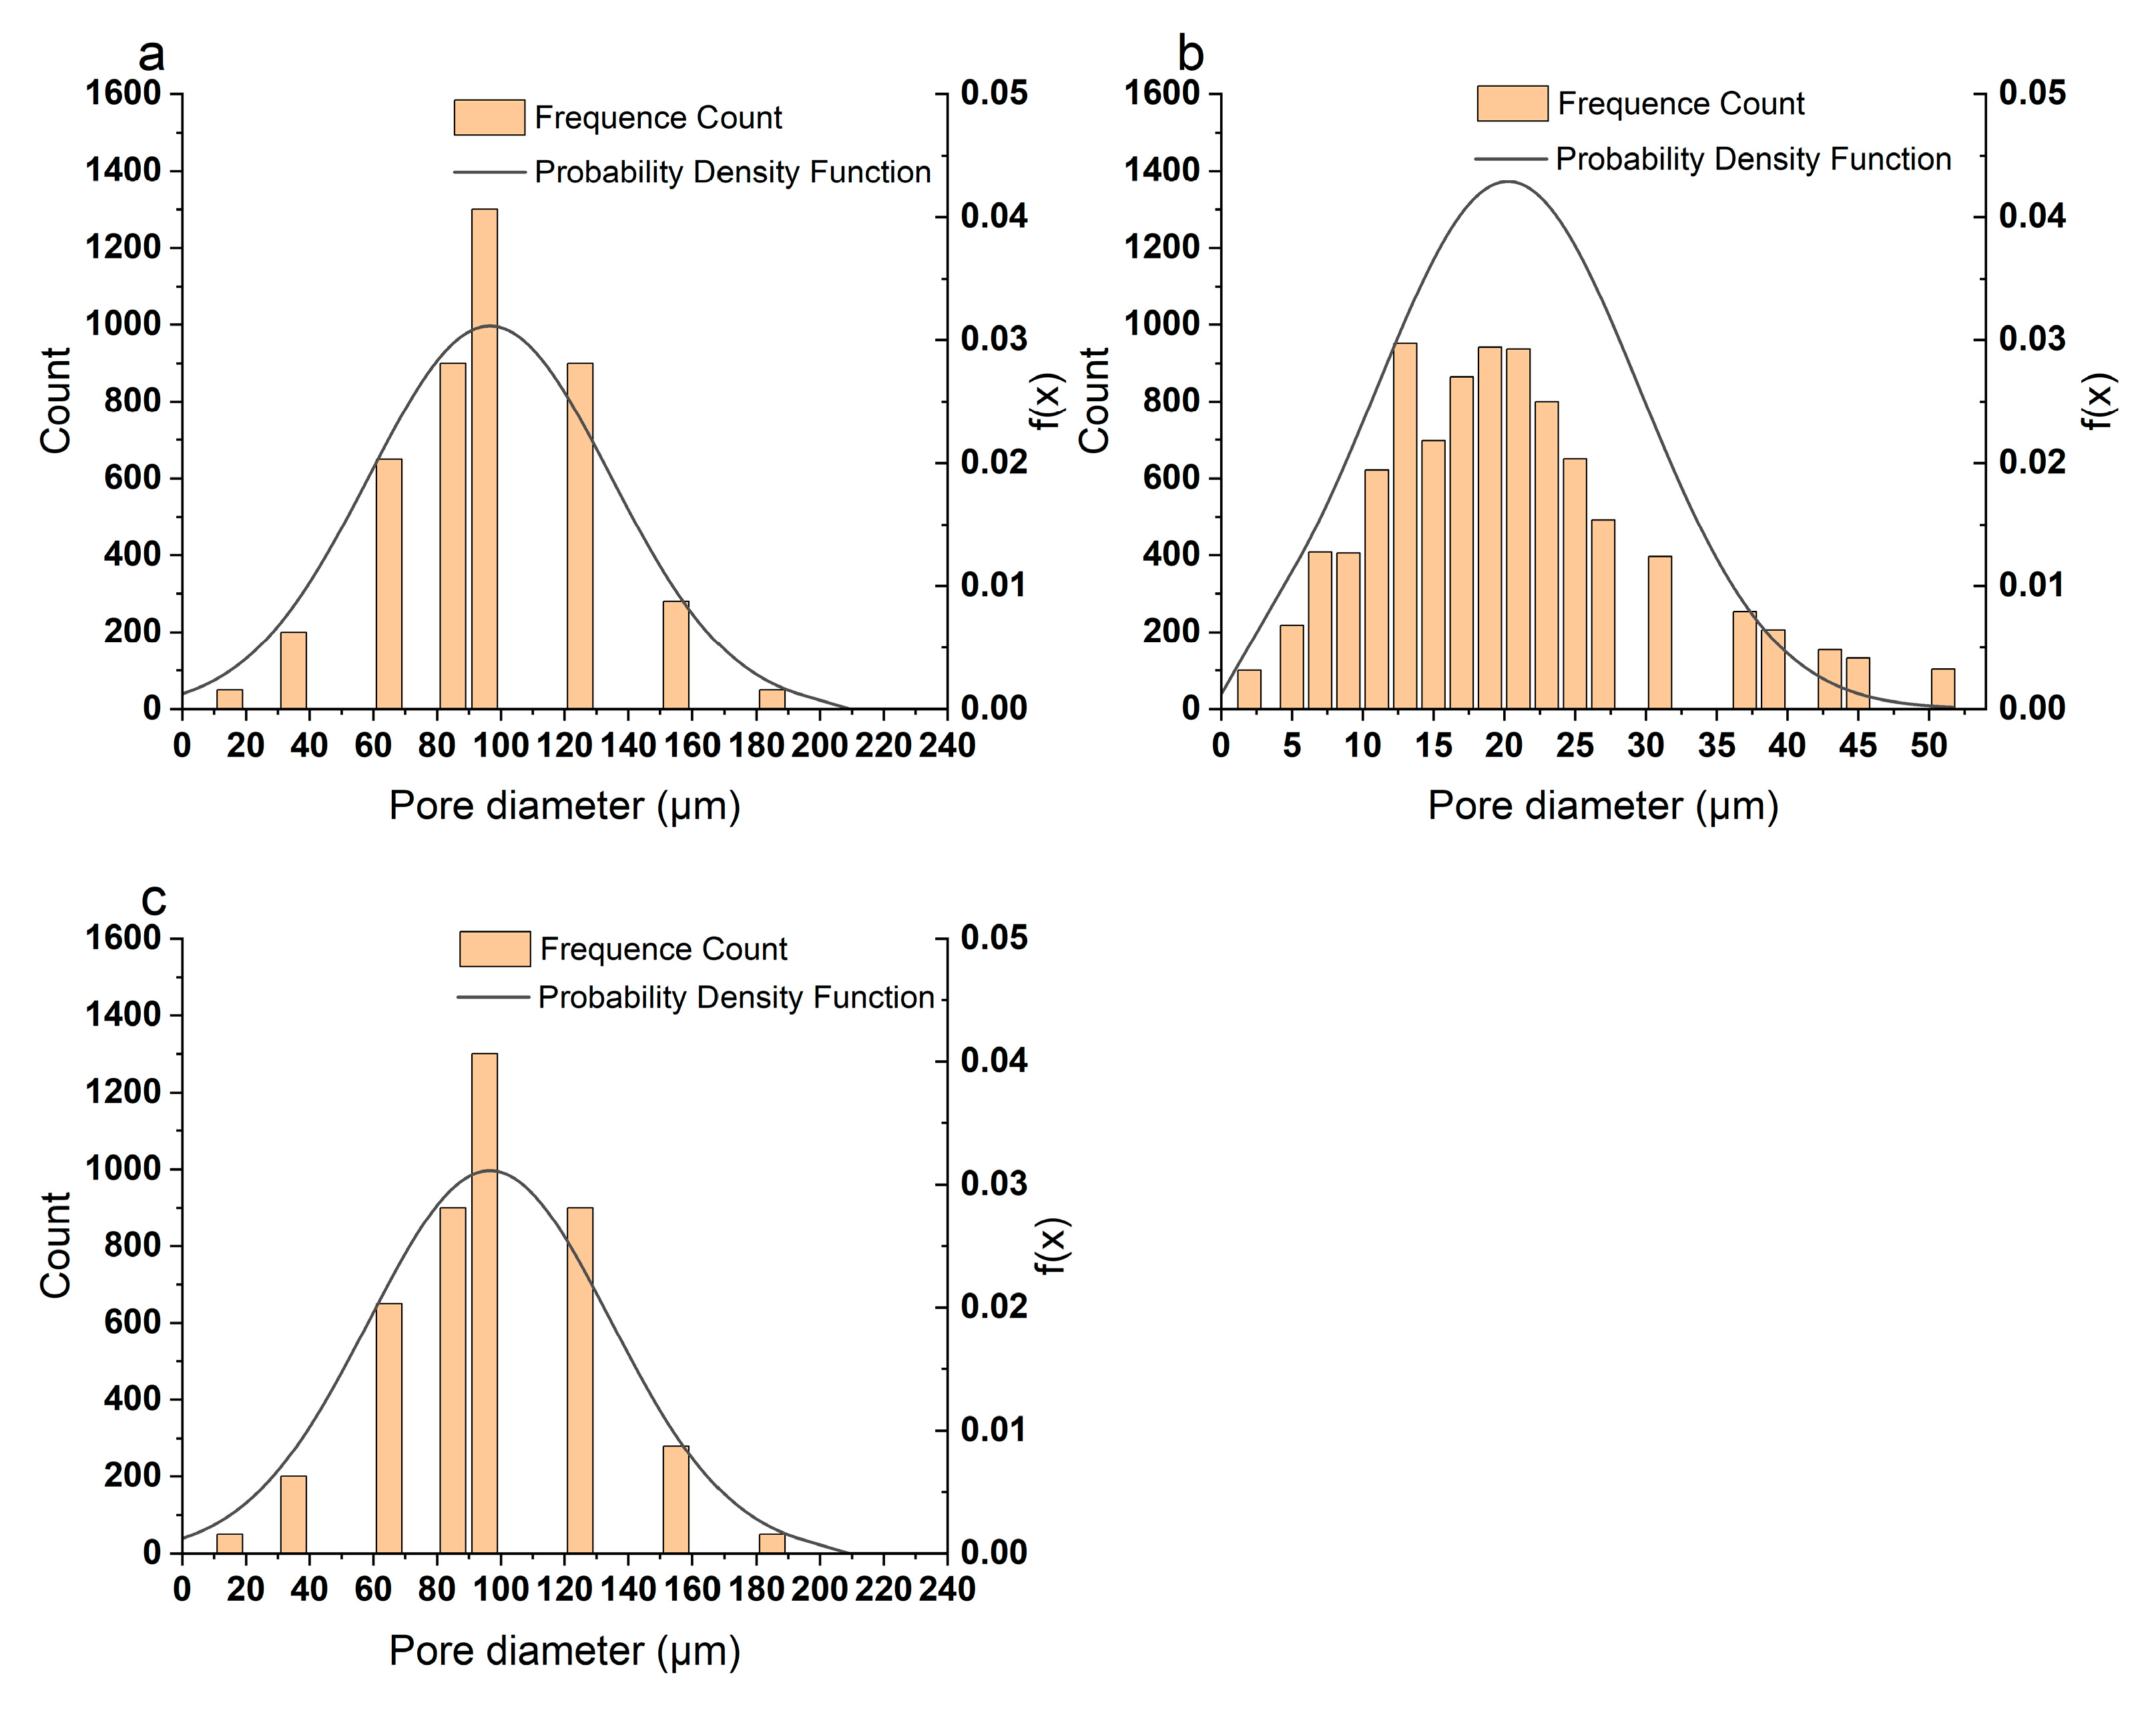
2.6.2. Non-Homogeneous Filter Wall Sub-Model Validation

The pore size distribution of three GPFs obtained by the MIP method and the Gaussian fit result are shown in Figure 11. Table 3 lists the pore size mean value, standard deviation fitting results, and errors. As listed in Table 3, the Gaussian fitting errors (the error between fitting mean and measured mean) of the pore size of the three GPFs are within 10%. So, the non-homogeneous filter wall sub-model is verified as valid.

2.6.3. Filter Wall Temperature Sub-Model Validation

Figure 12 shows the comparison between the actual temperature and the model-predicted temperature of four installation locations of thermocouples inside 100, 200, and 300 cpsi GPFs under five selected engine operating conditions. The installation locations are expressed as No. 1, 2, 3, and 4 according to the location of thermocouples shown in Figure 8. And the five engine operating conditions are named as a, b, c, d, and e, respectively, as listed in Table 2.
It can be seen from Figure 12 that at high loads, the temperature inside the GPF can exceed 600 °C. At a certain speed, the GPF inlet temperature rises with the load increasing, while at a certain load, the GPF inlet temperature increases with the speed increasing. When the particle filter inlet temperatures are below 600 °C, the model-predicted temperatures fit the actual temperatures well, with errors within 1%. Meanwhile, in the case of high speed and small load conditions (3000 and 4500 rpm, 40% load), the model predicts the temperature with a slightly larger error, which does not exceed 6% and is still within acceptable limits. This deviation is due to the uneven flow distribution caused by the increased local flow resistance in the GPF. A 300 cpsi GPF has denser pores (increase in the number of pores per unit area) but smaller individual pore diameters, which leads to a significant increase in the local pressure drop, and the airflow may be bypassed, resulting in a decrease in the airflow actually passing through the 300 cpsi region, and a weakening of the convective heat transfer. And the model defaults to uniform flow inside the GPF, which will overestimate the heat transfer in the high-temperature region. Future research could refine the model to address this issue. Overall, it can be concluded that the established wall temperature model can make a good prediction of the particle filter wall heat-up process.

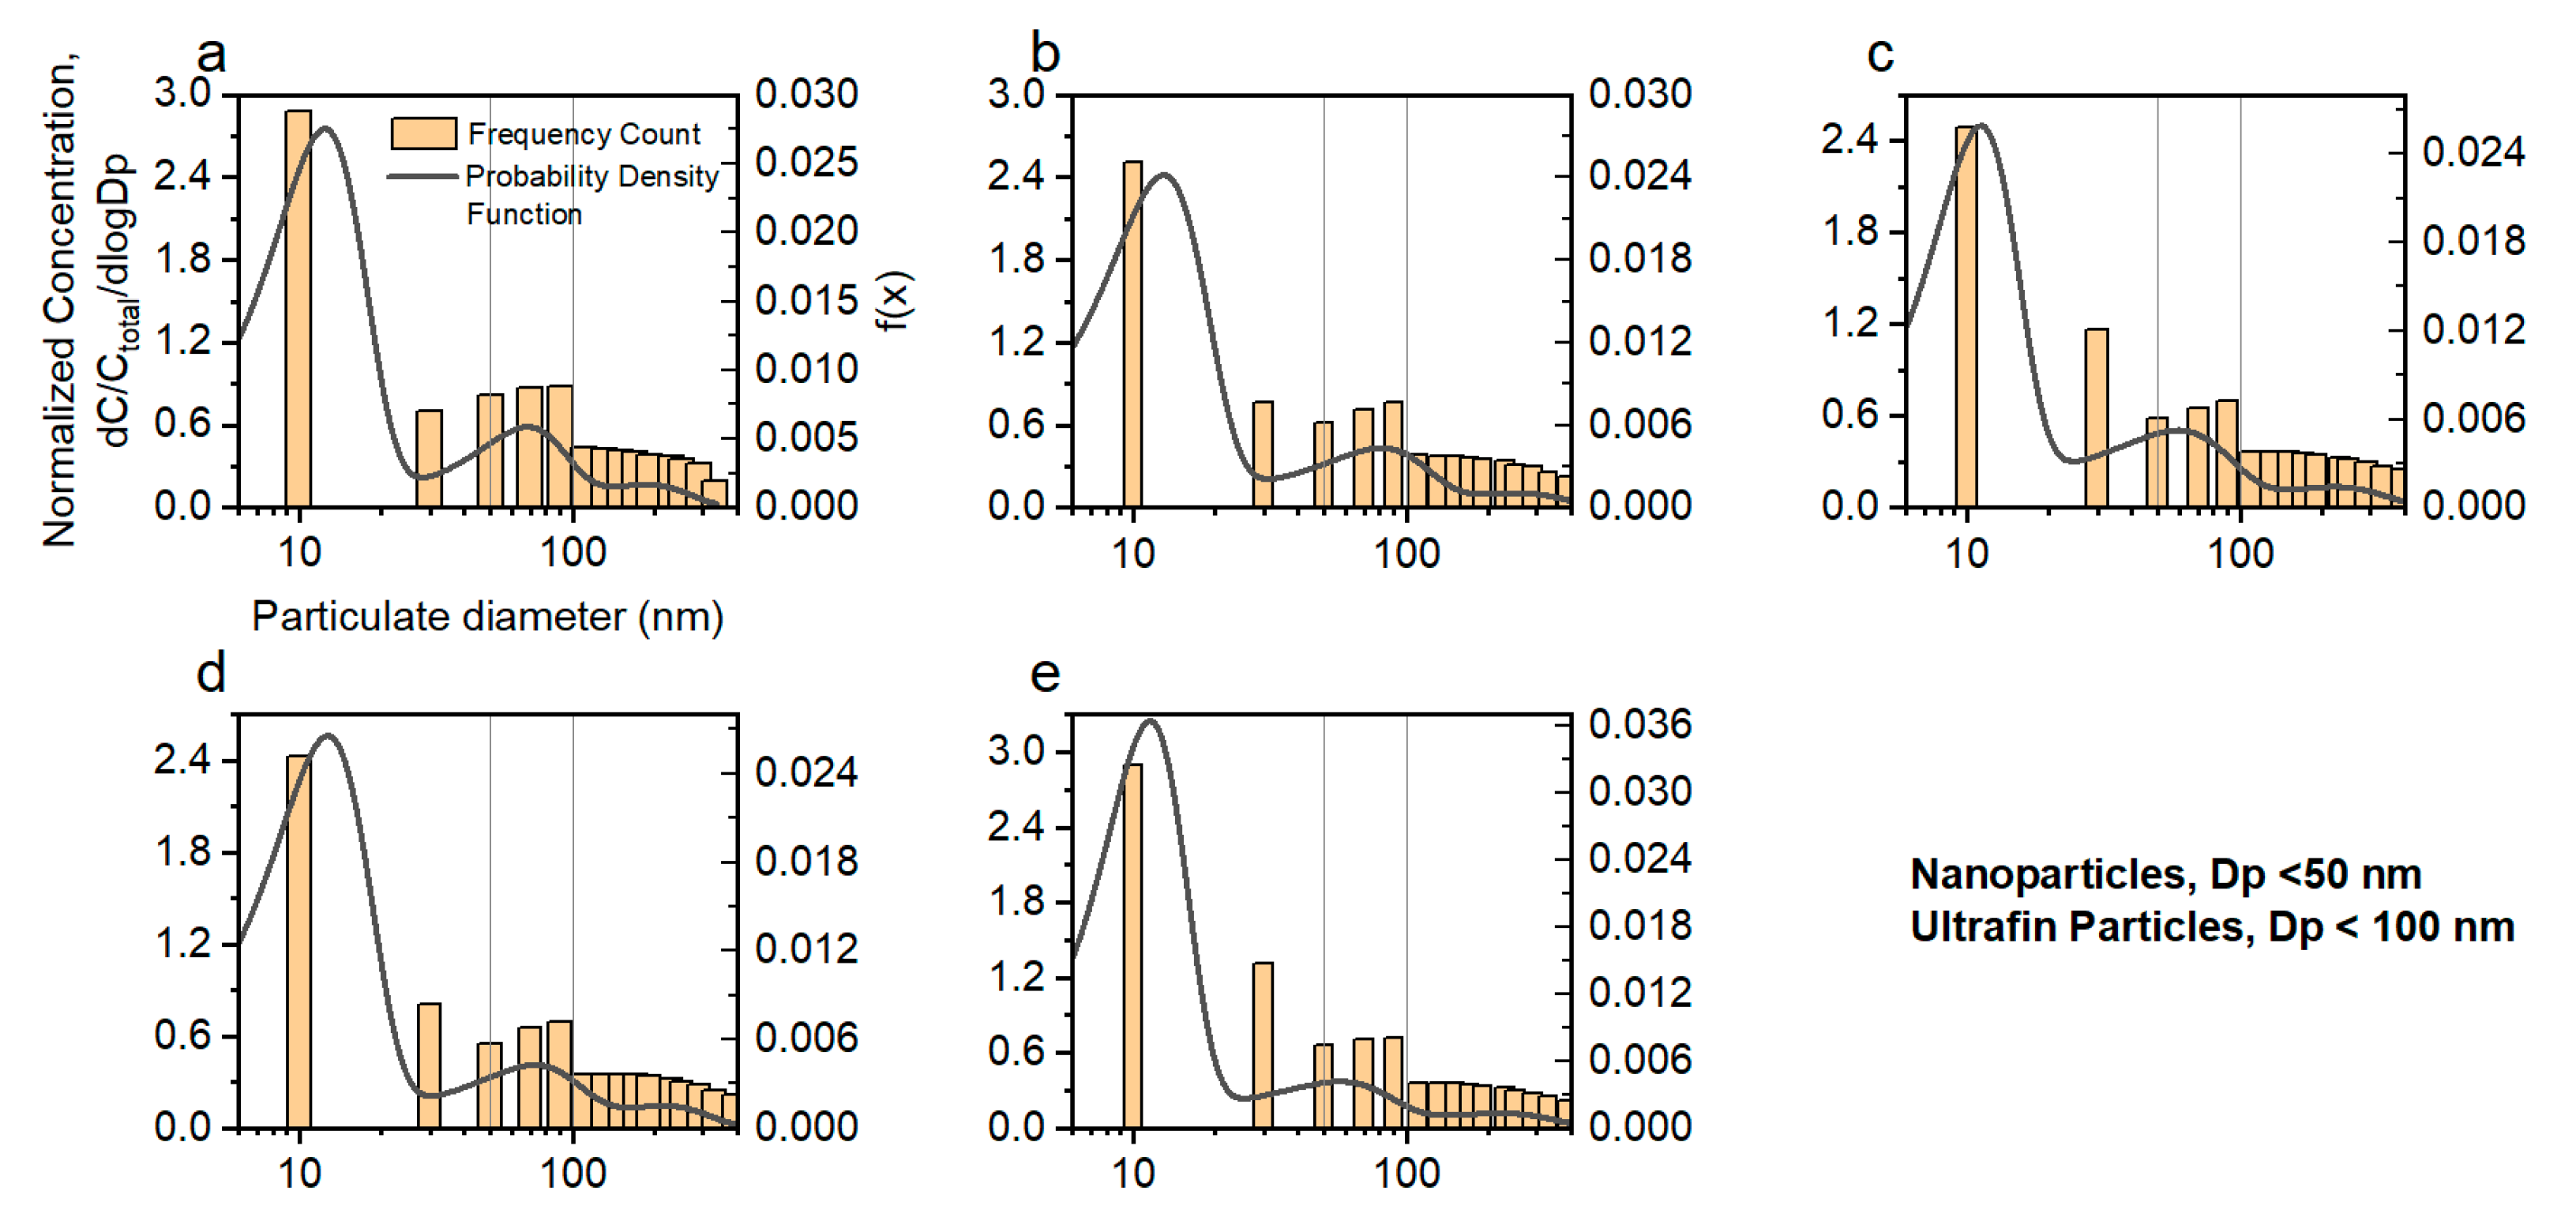
2.6.4. Particle Size Distribution Sub-Model Validation

Figure 13 shows the particle size distribution and fitting results before the GPFs underwent the selected five operating conditions. The yellow bars are the measurement result, and the curved line is the Gaussian fit line. The Gaussian fitting results are listed in Table 4. It can be seen that three Gaussian distributions with three regions, 10–15 nm for nucleation mode particles, 55–80 nm for accumulation mode particles, and 170–250 nm for large-size particles, are acceptable to fit the size distribution of particles before GPFs. The relative error of the mathematical distribution model of particle size distribution is within 10% (Sum-Squared Error, SSE), and the model can describe the particle size distribution of particles well.

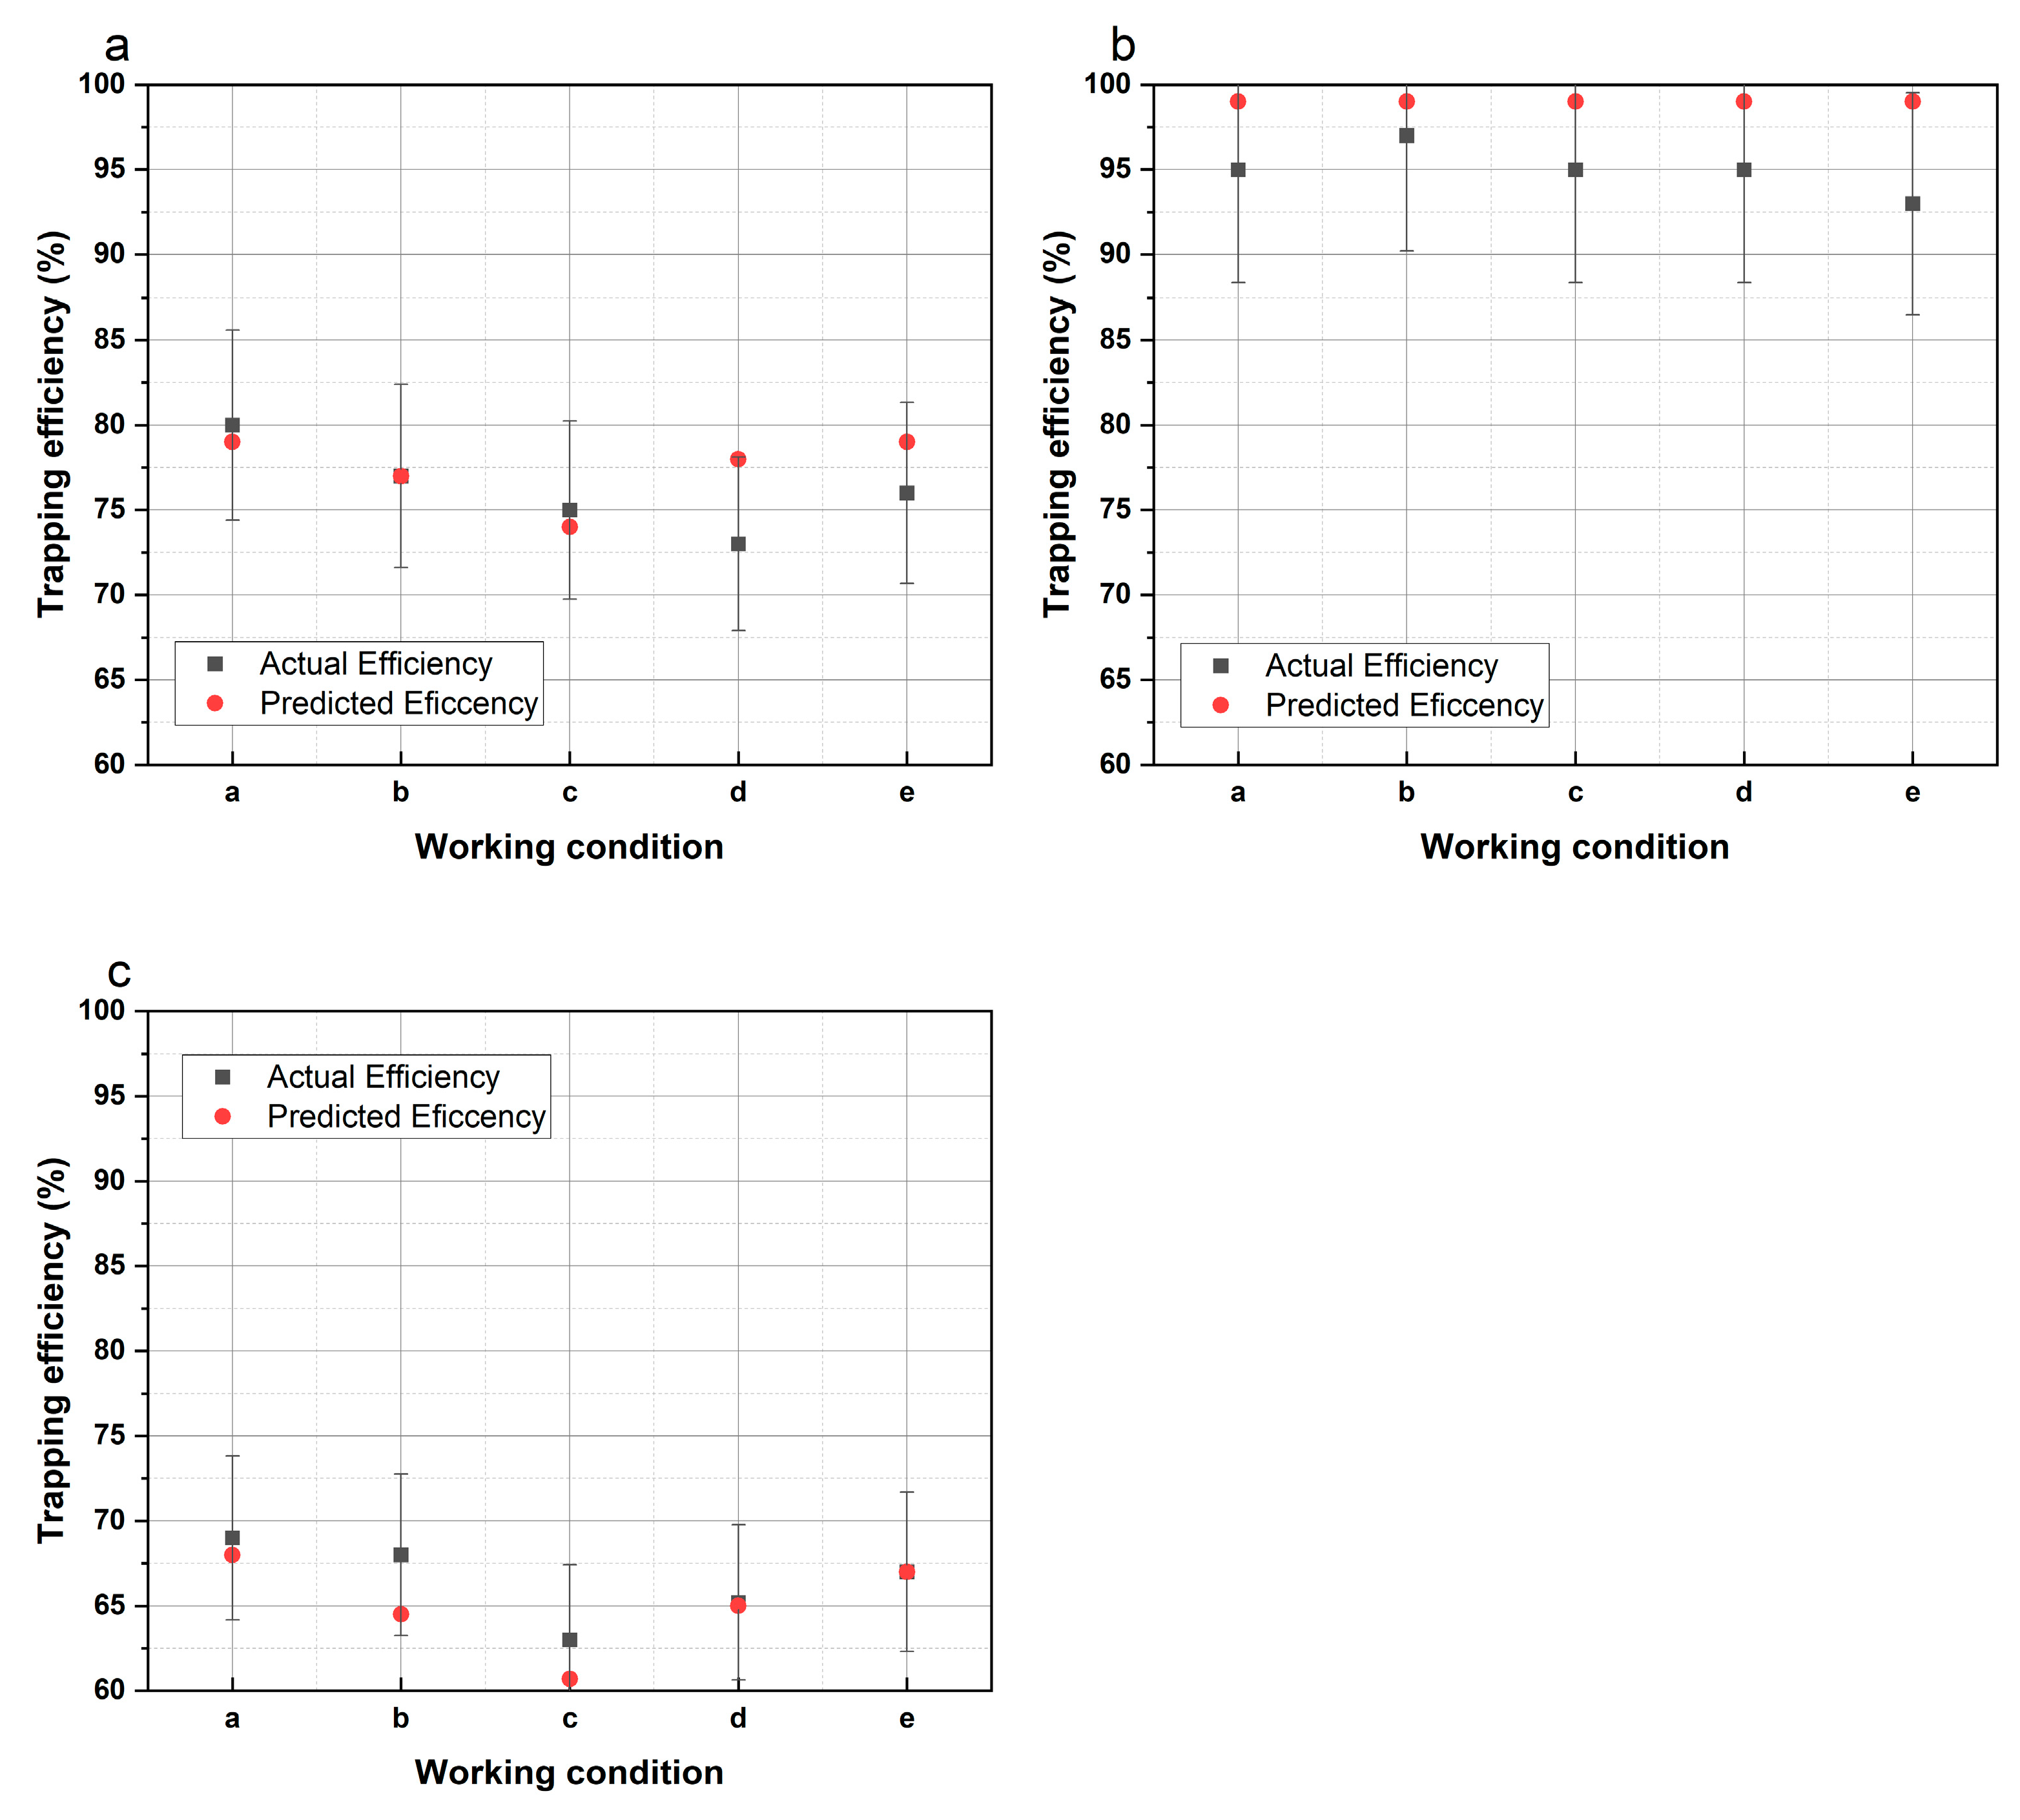
2.6.5. Filtration Efficiency Validation

For validating the constructed non-homogeneous dynamic extended capture model, the actual capture efficiency of the GPF was calculated by using the PN data obtained from the bench test, and the equation is given in Equation (39).
η G P F = c b G P F c a G P F c b G P F
where ƞGPF is the filtration efficiency of the GPF, and cbGPF and caGPF are the concentrations of solid PN measured before and after the GPF, respectively.
Figure 14 compares the actual capture efficiencies of the three GPFs under different conditions with the predicted capture efficiencies of the original (particle size distribution using normal distribution) and proposed models (particle size distribution using Gaussian mixture distribution).
As can be seen in Figure 14, the capture efficiency of all three GPFs exceeds 70% under all test conditions. The proposed model can well predict the trapping efficiency of GPFs with 100 cpsi and 300 cpsi but suffers from some deviation for GPFs with 200 cpsi. This may be due to the fact that the average pore size value of the 200 cpsi GPF in the experiment was 18.2 μm, while the other two averages were 110 μm. Therefore, the particulate may more likely form a loose cake layer on the surface of the filter body, which facilitates the subsequent penetration of the particulate matter and leads to a decrease in the trapping efficiency. In contrast, the model assumes that the formed cake layer is uniform and dense, so the simulated capture efficiency is close to 100%. In general, the average error between the proposed model and the experimental results is less than 7%, which indicates that the model can well predict the capture efficiency of GPF.

3. Results and Discussion

3.1. Impact of Structural Parameters of Carrier Wall on Its Filtration Efficiency

The structural parameters of a carrier of GPFs include length, cell density, wall thickness, porosity, pore size, etc. Based on the proposed non-homogeneous dynamic extended capture model, the influence of structural parameters of the carrier on its filtration efficiency was investigated in this paper. The baseline and planned parameters for the carrier, inlet tail gas, and particles are listed in Table 5. We performed the simulation for each planned parameter while keeping the other parameters as a baseline to analyze the effect of each planned parameter.
The effect of carrier length, cell density, wall thickness, porosity, pore size, mean, and variance of pore size on the filtration efficiency of the carrier wall is shown in Figure 15. It can be seen from Figure 15a that as the length of a GPF increases, the filtration efficiency decreases. This is due to the fact that with the increase in carrier length, constant porosity causes the overall internal microporous volume to increase, but the pore size distribution remains the same, the number of internal trapping units increases, and therefore, the average filtration efficiency decreases. When the inlet exhaust conditions are the same, the larger the length of the carrier, the fewer particles are deposited by the wall trapping units, and thus, the filtration efficiency decreases.
As shown in Figure 15b, the cell density has less effect on the initial filtration efficiency of the carrier wall. This is due to the increase in the cell density, the cross-section of the carrier channel becomes smaller, but it does not affect the wall microscopic properties and the change in particle properties, and it has little effect on the interception and inertial collision effects of the trapping unit. Moreover, the cell density of the carrier also affects the amount and distribution of trapping units in a single cross-section of the carrier. That is, the higher the cell density, the shorter the side length of a single cross-section, the lower the amount but the larger the non-uniformity of trapping units, and the filtration efficiency of the carrier is not improved.
It can be seen from Figure 15c that the increase in wall thickness increases the filtration efficiency of the carrier wall. The carrier with a wall thickness of 0.5 mm has the highest filtration efficiency, which remains above 90%, while the carrier with a wall thickness of 0.2 mm has a filtration efficiency of less than 62.5%. This is due to the time for particles to pass through the carrier wall increasing with the increase in the wall thickness. Then, the filtration efficiency was improved because of the increase in the contact probability of the particle with the trapping unit.
It can be seen from Figure 15d that the filtration efficiency of the carrier decreased with the increase in porosity. This is due to the higher porosity, indicating that the unit volume of the inside micropores increased, which means that it is easier for particles to pass through the carrier, and the probability of collision between particles and trapping units is reduced, so the capture efficiency decreases too.
It can be seen from Figure 15e that the filtration efficiency decreased with the increase in mean pore size. Firstly, the increase in the mean pore size decreases the influence of the slip effect on the particle flow dynamics, which causes an increase in the Péclet number and a weakening of the diffusion rate of the particles, and therefore, the filtration efficiency through the Brownian action of the particles decreases. Secondly, due to the increase in the mean pore size, the direct interception coefficient decreases, resulting in a decrease in the capture efficiency through direct interception. Finally, as the mean pore size increases, the Stokes number of particle matter becomes significantly small, more particles flow with the airflow, and the probability of maintaining the inertial direction to be captured by the wall micropores is further reduced, so the capture efficiency through inertial collision is reduced.
It can be seen from Figure 15f that there is a negative correlation between the variance of pore size and the filtration efficiency carrier. The increase in the number of pores will weaken the diffusion, interception, and inertial collision effects. At the same time, the distribution of micropore diameters is more uneven. Specifically, the small-diameter micropores can capture a limited number of particles and quickly reach the limit. Large-diameter micropores play a major role in capture, but their capture efficiency is relatively low.

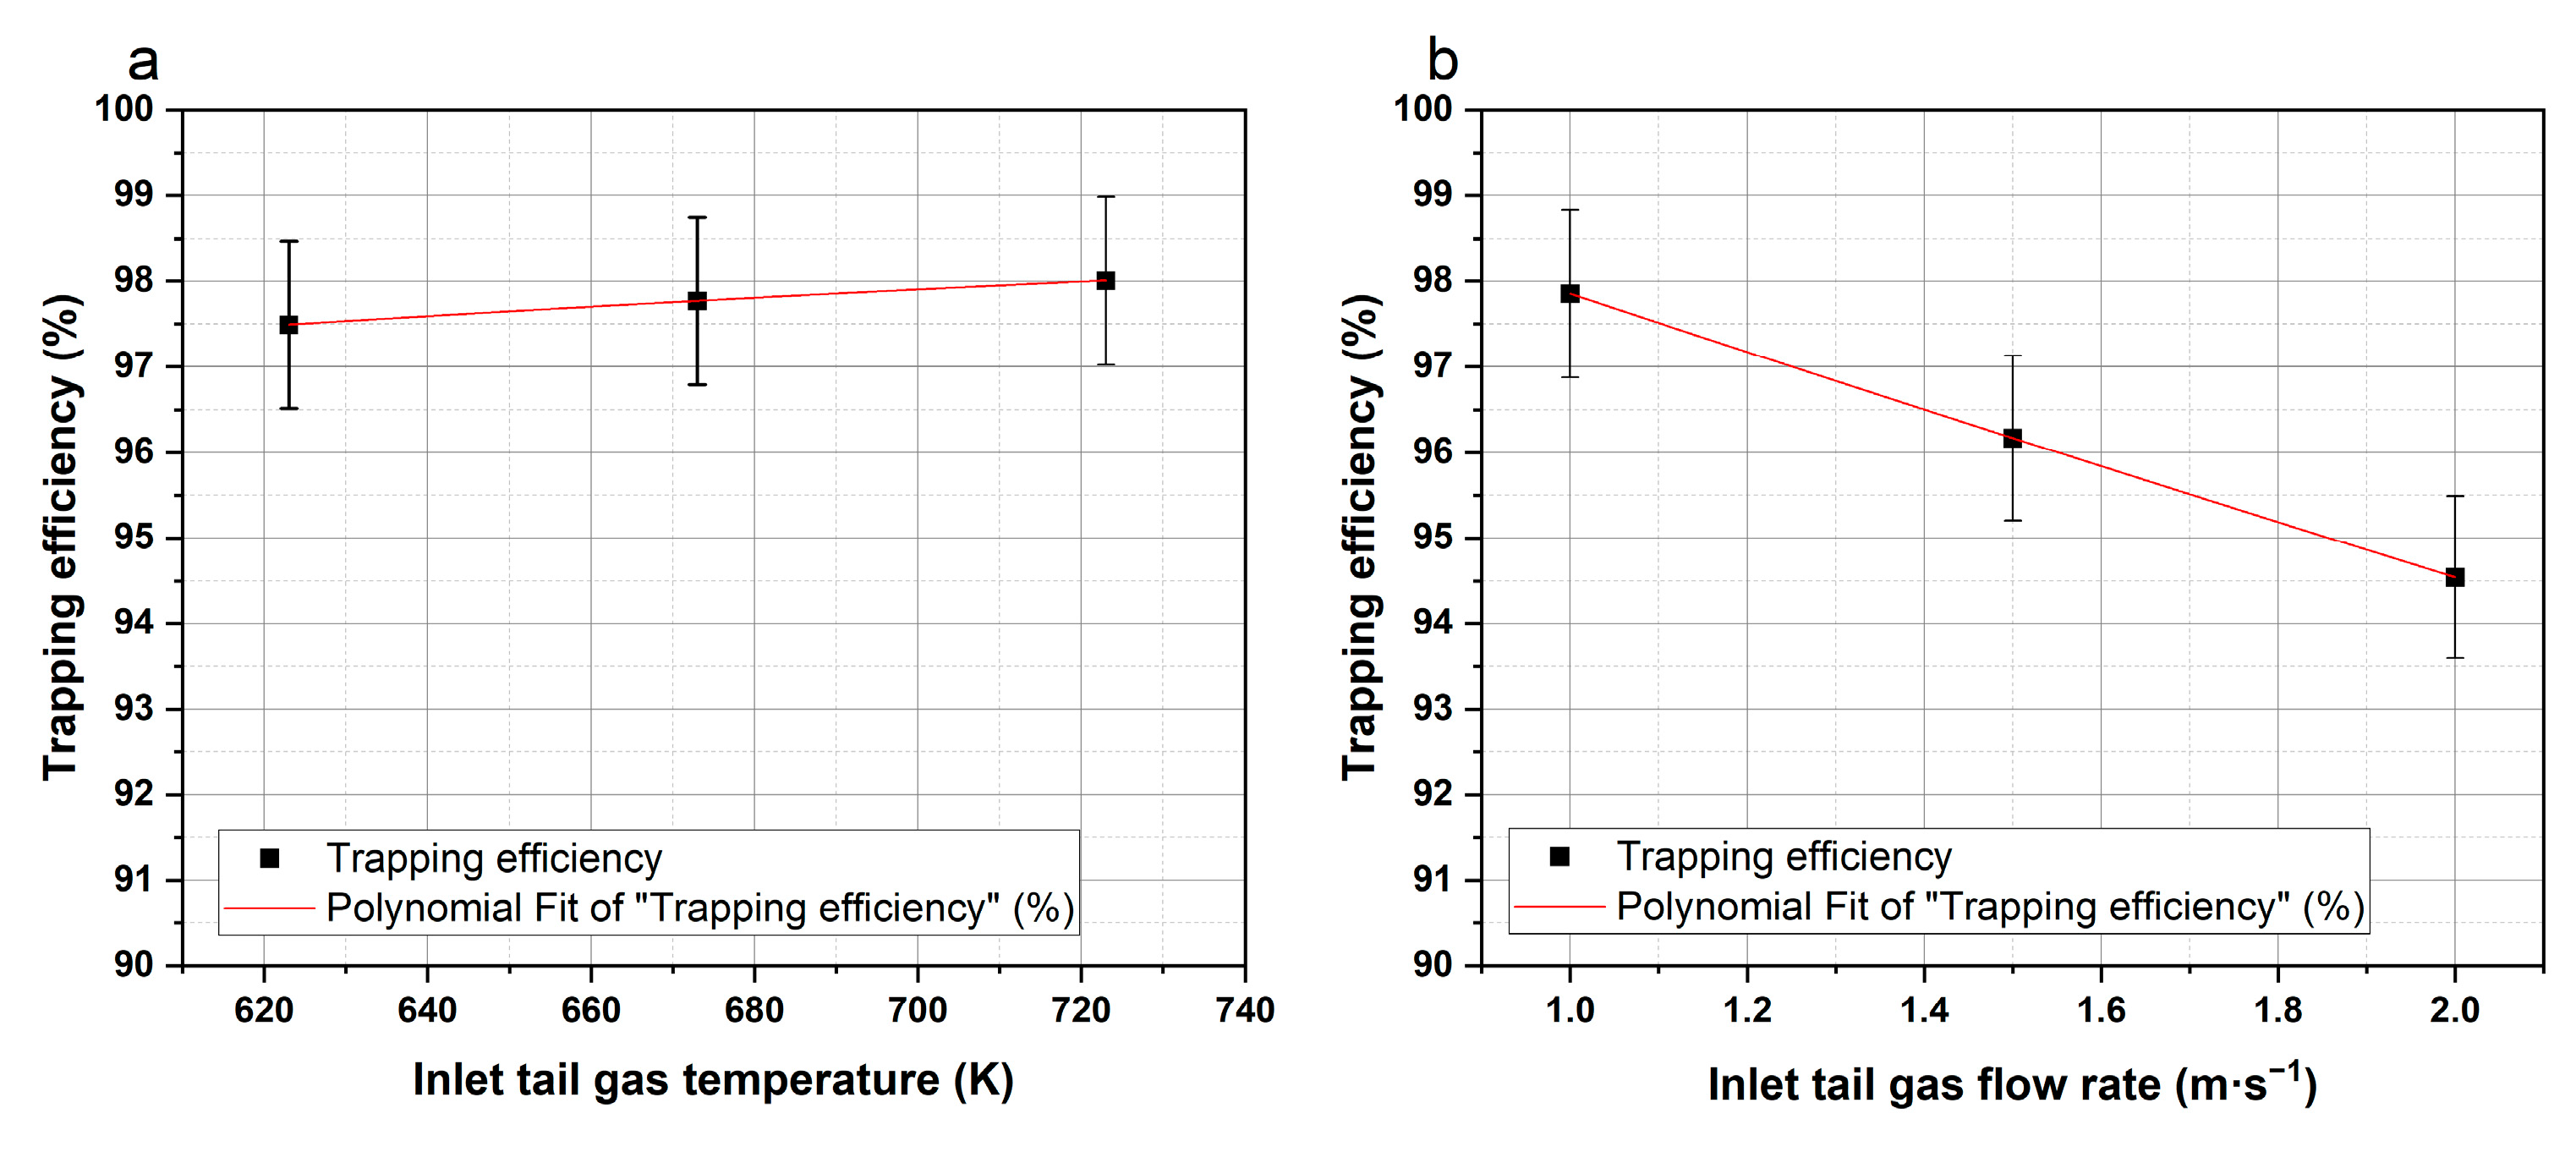
3.2. Influence of Inlet Tail Gas Boundary Conditions on Filtration Efficiency of Carrier Wall

The effect of inlet tail gas flow rate and temperature on the filtration efficiency of the carrier wall is shown in Figure 16. It can be seen that the filtration efficiency of the carrier wall decreases with the increase in the inlet tail gas flow rate. On the one hand, with the increase in inlet tail gas flow rate, the number of particles entering inside the carrier would become larger, and beneficial for improving filtration efficiency. On the other hand, due to the increase in inlet gas velocity, gas and wall convection heat transfer intensity becomes higher, and the gas temperature loss leads to a decrease in the gas temperature, which unfavorable with the particles’ Brown diffusion, reducing the contact probability of particle and trapping unit, and the filtration efficiency of carrier wall decreases as well.
Moreover, the increase in the inlet tail gas temperature is favorable to the improvement of the filtration efficiency of the carrier, but the improvement effect is not as significant as the change in the inlet tail gas flow rate. This is mainly due to the elevated inlet tail gas temperature’s tendency to enhance the Brownian motion of the particles in the gas and the particles’ diffusion coefficient, improving filtration efficiency.

3.3. Influence of Inlet Particles’ Properties on Filtration Efficiency of Carrier Wall

Another important factor affecting the filtration efficiency of GPFs is the characteristics of inlet particles, including the number of particles as well as the particle size distribution. In order to investigate the relationship between the quantity of particles and the filtration efficiency, three concentrations of inlet particles, i.e., 107 #/cm3, 106 #/cm3, and 105 #/cm3, were selected in this study. Meanwhile, in order to investigate the influence of particle size distribution on the filtration efficiency, this paper constructs five kinds of particle size distribution patterns on the basis of experimental data; the specific parameters are listed in Table 6. Pattern A was used to investigate the effect of an increased proportion of fine particles, pattern B was used to investigate the effect of increasing the proportion of particles smaller than 50 nm, pattern C was together pattern A and B to investigate the effect of increasing mean particle size, and pattern D and E are the same as those of pattern A but with larger variances.
The effect of particles’ properties on the filtration efficiency of the carrier wall is shown in Figure 17.
As shown in Figure 17a, the filtration efficiency of the carrier increased with the increase in the number of inlet particles. When the number concentration of inlet particles increased from 105 #/cm3 to 106 #/cm3, the filtration efficiency increased from 74.2% to 96.5% after 120 s of trapping started. This is due to the probability of particles contacting the trapping unit through diffusion, interception, and collision increases with the increase in concentrations of inlet particles, so the filtration efficiency of the carrier also increases.
Figure 17b shows the effect of Particle size distribution pattern on filtration efficiency. Firstly, the filtration efficiency of the carrier increases with the increase in the mean value of the particles’ diameter, i.e., patterns A, B, and C. This is because particles with larger diameters can form larger aggregates, and the direct interception effect of the capture unit is stronger. At the same time, the larger the mass of particles with larger diameters, the probability of collision with the capture unit increases due to inertia, so the capture efficiency of the GPF for them increases. Secondly, the filtration efficiency of the carrier also increases with the increase in the standard deviation of the particles’ diameter, i.e., patterns A, D, and E. This is due to the fact that with a larger standard deviation, the percentage of large particle sizes in the particulate matter increases, and the average particle diameter also increases. Due to the higher mass and capture efficiency of particulate matter with larger diameters, the mass of particulate matter deposited in the wall micropore increases, and the porosity and diameter of the wall micropore, compared with the small particulate matter, change more significantly, which will increase the filtration efficiency of the GPF.

4. Conclusions

In this paper, a non-homogeneous dynamic extended capture model for wall–flow GPFs was carried out. The proposed model is validated on an engine test bench, combined with three particle filters of different structural parameters. And then, the influence of structural parameters, inlet tail gas boundary conditions, and inlet particles on the filtration efficiency of the carrier is studied based on the model. The results are as follows.
Firstly, the non-homogeneous dynamic extended capture model is proposed, and according to our validation on the engine test bench, the accuracy of the model is improved by considering the impact of pore size distribution, inlet particle number, diameter distribution, and growth of the trapping unit. The proposed model was able to predict the filtration efficiency with an average error of less than 7%.
Secondly, the influence of physical parameters and inlet tail gas boundary conditions on the filtration efficiency of the carrier wall in GPFs was investigated. The results show that the length, cell density, and wall thickness have a significant effect on the change in filtration efficiency, while the porosity, mean, and variance of pore size have greater effects than the other parameters. That is, GPFs with shorter length, smaller cell density, and thicker wall thicknesses, while reducing the porosity, mean, and variance of pore size of the carrier wall, can effectively improve the filtration efficiency. Besides, the higher the inlet tail gas flow rate and temperature, the higher the filtration efficiency. Inlet tail gas flow rate plays a stronger role in the change in filtration efficiency than that of tail gas temperature.
Finally, the impact of the number of inlet particles and diameter distribution on the filtration efficiency of the carrier wall was investigated. The results show that both the number and diameter distribution of inlet particles have a positive impact on the filtration efficiency of the carrier wall. That is, the higher the inlet particle number, diameter, mean value, and standard deviation, the larger the filtration efficiency of the carrier wall.

Author Contributions

Methodology, Z.H.; Validation, P.T.; Formal analysis, D.L.; Investigation, X.G. and J.S.; Writing—original draft, J.S.; Writing—review & editing, Z.H.; Project administration, Z.H. All authors have read and agreed to the published version of the manuscript.

Funding

This research was funded by the Municipal Natural Science of Shanghai (22ZR1463500).

Data Availability Statement

The original contributions presented in the study are included in the article; further inquiries can be directed to the corresponding author.

Conflicts of Interest

The authors declare no conflicts of interest.

References

  1. Kittelson, D.; Khalek, I.; McDonald, J.; Stevens, J.; Giannelli, R. Particle Emissions from Mobile Sources: Discussion of Ultrafine Particle Emissions and Definition. J. Aerosol Sci. 2022, 159, 105881. [Google Scholar] [CrossRef] [PubMed]
  2. Lee, Z.; Kim, T.; Park, S.; Park, S. Review on Spray, Combustion, and Emission Characteristics of Recent Developed Direct-Injection Spark Ignition (DISI) Engine System with Multi-Hole Type Injector. Fuel 2020, 259, 116209. [Google Scholar] [CrossRef]
  3. Shuai, S.; Dong, Z.; Zheng, R.; Wang, B.; Fu, H.; Xu, H.; Wang, J. Review of Formation Mechanism and Emission Characteristics of Particulate Matter from Automotive Gasoline Engines. Trans. Csice 2016, 34, 105–116. [Google Scholar]
  4. Raza, M.; Chen, L.; Leach, F.; Ding, S. A Review of Particulate Number (PN) Emissions from Gasoline Direct Injection (GDI) Engines and Their Control Techniques. Energies 2018, 11, 1417. [Google Scholar] [CrossRef]
  5. Gu, Y.; Xu, H.; Feng, R.; Zhang, B.; Gao, M.; Sun, J.; Shen, Z.; Qu, L.; Ho, S.S.H.; Cao, J. Insight into Personal Exposure Characteristics and Health Effects of PM2.5 and PM0.25-Bound PAHs and Their Derivatives with Different Heating Ways in the Fenwei Plain, China. Environ. Pollut. 2023, 338, 122699. [Google Scholar] [CrossRef]
  6. Tiegang, F.; Libing, W.; Zhi, W. Particulate Matter Emissions from Gasoline Direct Injection Engines: Research Review. J. Automot. Saf. Energy 2017, 8, 226–238. [Google Scholar]
  7. Samuel, S.; Hassaneen, A.; Morrey, D.; Samuel, S.; Hassaneen, A.; Morrey, D. Particulate Matter Emissions and the Role of Catalytic Converter During Cold Start of GDI Engine; SAE International: Warrendale, PA, USA, 2010. [Google Scholar]
  8. Yang, J.; Roth, P.; Durbin, T.D.; Johnson, K.C.; Cocker, D.R.I.; Asa-Awuku, A.; Brezny, R.; Geller, M.; Karavalakis, G. Gasoline Particulate Filters as an Effective Tool to Reduce Particulate and Polycyclic Aromatic Hydrocarbon Emissions from Gasoline Direct Injection (GDI) Vehicles: A Case Study with Two GDI Vehicles. Environ. Sci. Technol. 2018, 52, 3275–3284. [Google Scholar] [CrossRef]
  9. Matteson, M.J.; Orr, C. Filtration: Principles and Practices; Routledge: London, UK, 2017. [Google Scholar]
  10. Liu, X.; Matti Maricq, M.; Dobson, D.A. Statistical Capillary Tube Model for Porous Filter Media: An Application in Modeling of Gasoline Particulate Filter. Sep. Purif. Technol. 2022, 286, 120393. [Google Scholar] [CrossRef]
  11. Chen, W.; Ou, Q.; Chang, C.; Pei, C.; Liu, X.; Maricq, M.; Kittelson, D.; Pui, D.Y.H. Using Aerosols to Create Nano-Scaled Membranes That Improve Gasoline Particulate Filter Performance and the Development of Wafer-Based Membrane Coated Filter Analysis (WMCFA) Method. Sep. Purif. Technol. 2022, 284, 120310. [Google Scholar] [CrossRef]
  12. Nain Singh, G.; Singh Bharj, R. Experimental Study of Filtration Behavior of Diesel Particulate Filter in a Diesel Engine to Meet BS-VI Emission Norms in INDIA. J. Phys. Conf. Ser. 2019, 1276, 012078. [Google Scholar] [CrossRef]
  13. Gong, J.; Rutland, C. PDF-Based Heterogeneous Multiscale Filtration Model. Environ. Sci. Technol. 2015, 49, 4963–4970. [Google Scholar] [CrossRef] [PubMed]
  14. Konstandopoulos, A.G.; Kostoglou, M.; Skaperdas, E.; Papaioannou, E.; Zarvalis, D.; Kladopoulou, E. Fundamental Studies of Diesel Particulate Filters: Transient Loading, Regeneration and Aging. J. Fuels Lubr. 2000, 109, 683–705. [Google Scholar]
  15. Uenishi, T.; Tanaka, E.; Fukuma, T.; Kusaka, J.; Daisho, Y. A Quasi Two Dimensional Model of Transport Phenomena in Diesel Particulate Filters—The Effects of Particle Diameter on the Pressure Drop in DPF Regeneration Mode. 2016, p. 2016-01-2282. Available online: https://www.sae.org/publications/technical-papers/content/2016-01-2282/ (accessed on 18 August 2024).
  16. Payri, F.; Arnau, F.J.; Piqueras, P.; Ruiz, M.J. Lumped Approach for Flow-Through and Wall-Flow Monolithic Reactors Modelling for Real-Time Automotive Applications; SAE International: Warrendale, PA, USA, 2018. [Google Scholar]
  17. Bollerhoff, T.; Markomanolakis, I.; Koltsakis, G. Filtration and Regeneration Modeling for Particulate Filters with Inhomogeneous Wall Structure. Catal. Today 2012, 188, 24–31. [Google Scholar] [CrossRef]
  18. Gong, J.; Stewart, M.L.; Zelenyuk, A.; Strzelec, A.; Viswanathan, S.; Rothamer, D.A.; Foster, D.E.; Rutland, C.J. Importance of Filter’s Microstructure in Dynamic Filtration Modeling of Gasoline Particulate Filters (GPFs): Inhomogeneous Porosity and Pore Size Distribution. Chem. Eng. J. 2018, 338, 15–26. [Google Scholar] [CrossRef]
  19. Václavík, M.; Plachá, M.; Kočí, P.; Svoboda, M.; Hotchkiss, T.; Novák, V.; Thompsett, D. Structure Characterisation of Catalytic Particulate Filters for Automotive Exhaust Gas Aftertreatment. Mater. Charact. 2017, 134, 311–318. [Google Scholar] [CrossRef]
  20. Tan, P.; Wang, D.; Yao, C.; Zhu, L.; Wang, Y.; Wang, M.; Hu, Z.; Lou, D. Extended Filtration Model for Diesel Particulate Filter Based on Diesel Particulate Matter Morphology Characteristics. Fuel 2020, 277, 118150. [Google Scholar] [CrossRef]
  21. Zhang, Y.; Lou, D.; Tan, P.; Hu, Z.; Fang, L. Effect of Catalyst Diesel Particulate Filter Aging and Catalyst Loadings on Particulate Emission Characteristics from a Diesel Vehicle. J. Environ. Sci. 2024, 136, 35–44. [Google Scholar] [CrossRef]
  22. Jang, D.-H.; Kim, Y.-W.; Kim, H.-D. Processing of Porous Cordierite Ceramics with Controlled Porosity. J. Ceram. Soc. Jpn. 2007, 115, 52–58. [Google Scholar] [CrossRef]
  23. Guan, B.; Zhan, R.; Lin, H.; Huang, Z. Review of the State-of-the-Art of Exhaust Particulate Filter Technology in Internal Combustion Engines. J. Environ. Manag. 2015, 154, 225–258. [Google Scholar] [CrossRef]
  24. Belot, I.; Vidal, D.; Votsmeier, M.; Hayes, R.E.; Bertrand, F. Numerical Investigation of the Impact of Washcoat Distribution on the Filtration Performance of Gasoline Particulate Filters. Chem. Eng. Sci. 2020, 221, 115656. [Google Scholar] [CrossRef]
  25. Bruno, G. Evaluating Porosity in Cordierite Diesel Particulate Filter Materials, Part 2 Statistical Analysis of Computed Tomography Data. J. Ceram. Sci. Technol. 2013, 5, 13–22. [Google Scholar] [CrossRef]
  26. Wang, J.; Kang, Q.; Wang, Y.; Pawar, R.; Rahman, S.S. Simulation of Gas Flow in Micro-Porous Media with the Regularized Lattice Boltzmann Method. Fuel 2017, 205, 232–246. [Google Scholar] [CrossRef]
  27. Lou, D.; Chen, Z.; Zhang, Y.; Yu, Y.; Fang, L.; Tan, P.; Hu, Z. A Novel Micro-Scale Structure Reconstruction Approach for Porous Media and Characterization Analysis: An Application in Ceramics-Based Diesel Particulate Filter. Process Saf. Environ. Prot. 2024, 186, 679–693. [Google Scholar] [CrossRef]
  28. Gribble, C.M.; Matthews, G.P.; Laudone, G.M.; Turner, A.; Ridgway, C.J.; Schoelkopf, J.; Gane, P.A.C. Porometry, Porosimetry, Image Analysis and Void Network Modelling in the Study of the Pore-Level Properties of Filters. Chem. Eng. Sci. 2011, 66, 3701–3709. [Google Scholar] [CrossRef]
  29. Wang, D.; Tan, P.; Zhu, L.; Wang, Y.; Hu, Z.; Lou, D. Novel Soot Loading Prediction Model of Diesel Particulate Filter Based on Collection Mechanism and Equivalent Permeability. Fuel 2021, 286, 119409. [Google Scholar] [CrossRef]
  30. Liu, Z.-G.; Liang, S.-Q.; Takei, M. Experimental Study on Forced Convective Heat Transfer Characteristics in Quartz Microtube. Int. J. Therm. Sci. 2007, 46, 139–148. [Google Scholar] [CrossRef]
  31. Nield, D.A.; Bejan, A. Convection in Porous Media; Springer: New York, NY, USA, 2017. [Google Scholar]
  32. Awad, O.I.; Ma, X.; Kamil, M.; Ali, O.M.; Zhang, Z.; Shuai, S. Particulate Emissions from Gasoline Direct Injection Engines: A Review of How Current Emission Regulations Are Being Met by Automobile Manufacturers. Sci. Total Environ. 2020, 718, 137302. [Google Scholar] [CrossRef]
  33. Pei, Y.Q.; Li, T.; Pan, S.Z. An Investigation on Size Distribution of Exhaust Particulate Emitted from Gasoline Engine. Mech. Electron. Eng. III 2012, 130, 2871–2875. [Google Scholar] [CrossRef]
  34. McLachlan, G.J.; Lee, S.X.; Rathnayake, S.I. Finite Mixture Models. Annu. Rev. Stat. Its Appl. 2019, 6, 355–378. [Google Scholar] [CrossRef]
  35. Lee, K.W.; Gieseke, J.A. Collection of Aerosol Particles by Packed Beds. Environ. Sci. Technol. 1979, 13, 466–470. [Google Scholar] [CrossRef]
  36. Konstandopoulos, A.G.; Johnson, J.H. Wall-Flow Diesel Particulate Filters—Their Pressure Drop and Collection Efficiency. J. Engines 1989, 98, 890405. [Google Scholar]
  37. Serrano, J.R.; Climent, H.; Piqueras, P.; Angiolini, E. Filtration Modelling in Wall-Flow Particulate Filters of Low Soot Penetration Thickness. Energy 2016, 112, 883–898. [Google Scholar] [CrossRef]
  38. Wentzel, M.; Gorzawski, H.; Naumann, K.-H.; Saathoff, H.; Weinbruch, S. Transmission Electron Microscopical and Aerosol Dynamical Characterization of Soot Aerosols. J. Aerosol Sci. 2003, 34, 1347–1370. [Google Scholar] [CrossRef]
  39. Choi, S.; Lee, K. Detailed Investigation of Soot Deposition and Oxidation Characteristics in a Diesel Particulate Filter Using Optical Visualization. 2013, p. 2013-01-0528. Available online: https://www.sae.org/publications/technical-papers/content/2013-01-0528/ (accessed on 18 August 2024).
Figure 1. Non-homogeneous dynamic extended capture model framework.
Energies 18 02255 g001
Figure 2. Pore size distribution of tested cordierite GPF carriers: (a) 100/300 cpsi and (b) 200 cpsi.
Energies 18 02255 g002
Figure 3. Flow chart of pore generation methodology.
Energies 18 02255 g003
Figure 4. GPF axial temperature calculation schematic.
Energies 18 02255 g004
Figure 5. Single GPF channel schematic.
Energies 18 02255 g005
Figure 6. Flow chart of Gaussian mixing distribution of particle sizes.
Energies 18 02255 g006
Figure 7. Spherical filled bed theory and trapping mechanisms on the collector unit.
Energies 18 02255 g007
Figure 8. Thermocouples and their arrangement: (a) Schematic. (b) Photo.
Energies 18 02255 g008
Figure 9. Engine test bench schematic.
Energies 18 02255 g009
Figure 10. Engine working conditions on carbon soot mass concentration MAP.
Energies 18 02255 g010
Figure 11. Pore size distribution and its fitting of different GPFs: (a) 100 cpsi; (b) 200 cpsi; and (c) 300 cpsi.
Energies 18 02255 g011
Figure 12. Comparison of actual and predicted temperatures inside GPFs at test points 1, 2, 3, 4, and engine working conditions a, b, c, d, e (error bar: 6% of the measured value): (a) 100 cpsi; (b) 200 cpsi; and (c) 300 cpsi.
Energies 18 02255 g012
Figure 13. Five particle size distribution before GPF at different working condition: (a) 1500 rpm-100% load; (b) 1500 rpm-70% load; (c) 1500 rpm-40% load; (d) 3000 rpm-40% load; and (e) 4500 rpm-40% load.
Energies 18 02255 g013
Figure 14. Comparison of actual and predicted filtration efficiency for different GPFs and engine working conditions as shown in Table 4 (error bar: 7% of the measured value): (a) 100 cpsi; (b) 200 cpsi; and (c) 300 cpsi.
Energies 18 02255 g014
Figure 15. The effect of structural parameters on filtration efficiency of carrier wall: (a) GPF length; (b) cell density; (c) wall thickness; (d) wall porosity; (e) mean pore size; and (f) variance of pore size.
Energies 18 02255 g015
Figure 16. The effect of inlet tail gas flow rate and temperature on filtration efficiency of carrier wall: (a) Inlet tail gas temperature. (b) Inlet tail gas flow rate.
Energies 18 02255 g016
Figure 17. The effect of particles’ properties of inlet tail gas on filtration efficiency of carrier wall: (a) Number of particles. (b) Particle size distribution pattern.
Energies 18 02255 g017
Table 1. Technical parameters of three GPFs.
ParameterGPF 1#GPF 2#GPF 3#
Diameter (mm)118.4118.4118.4
Length (mm)136136136
Carrier materialCordieriteCordieriteCordierite
Cell density (cpsi)100200300
Porosity (%)56.662.456.6
Wall thickness (mm)0.30.30.3
Table 2. Working conditions for GPF capture model validation.
Working ConditionEngine Speed (rpm)Engine Torque (N·m)Engine Load (%)
a150021290
b150014870
c15008540
d300010640
e45009440
Table 3. GPF pore size distribution fitting results.
GPF #Mean Value (μm)Standard Deviation (μm)COV (σ/μ)Error (%)
1113.326.770.24 7.8
218.210.40.57 9.1
3112.129.400.26 7.5
Table 4. Particle size distribution fitting results before GPF.
Working Conditionμ1
(nm)
μ2
(nm)
μ3
(nm)
σ1
(nm)
σ2
(nm)
σ3
(nm)
P1
(%)
P2
(%)
P3
(%)
Error
(%)
a12.3366.69185.374.9326.1777.110.320.330.356.10
b12.8479.09250.465.5837.60119.980.300.370.339.81
c11.1757.80220.704.0831.53110.370.240.380.388.22
d12.6370.15213.325.3433.0692.760.310.340.359.14
e11.4855.25219.164.0629.77116.420.270.370.368.72
Table 5. Baseline and planned parameters of carrier, inlet tail gas, and particles.
ItemsBaselinePlanned
Diameter (mm)118.4
Length (mm)130100, 130, 150
Cell density (cpsi)200100, 200, 300
Porosity (%)5550, 55, 60
Wall thickness (mm)0.250.2, 0.35, 0.5
Mean pore size (μm)10020, 100, 150
Variance of pore size (μm2)10020, 60, 120
Tail gas flow rate (m/s)1
Tail gas temperature (°C)350
Number concentration of inlet particles (#/cm3)8 × 106 #
Distribution patternbimodal
Peaks diameter (nm)12, 66.7
Nuclear particles ratio (%)65
Table 6. Constructed particle size distribution.
Particle Size Distribution Patternμ1
(nm)
μ2
(nm)
μ3
(nm)
σ1
(nm)
σ2
(nm)
σ3
(nm)
P1
(%)
P2
(%)
P3
(%)
A10501004.535126.50.350.320.33
B23802504.535126.50.350.320.33
C801503004.535126.50.350.320.33
D1050100151003000.350.320.33
E1050100453009000.350.320.33
Disclaimer/Publisher’s Note: The statements, opinions and data contained in all publications are solely those of the individual author(s) and contributor(s) and not of MDPI and/or the editor(s). MDPI and/or the editor(s) disclaim responsibility for any injury to people or property resulting from any ideas, methods, instructions or products referred to in the content.

