
Design of Multi-Objective Energy Management for Remote Communities Connected with an Optimal Hybrid Integrated Photovoltaic–Hydropower–Battery Energy Storage System (PV-HP-BESS) Using Improved Particle Swarm Optimization

 ,
,  ,
,  , and
, and 
Abstract
1. Introduction
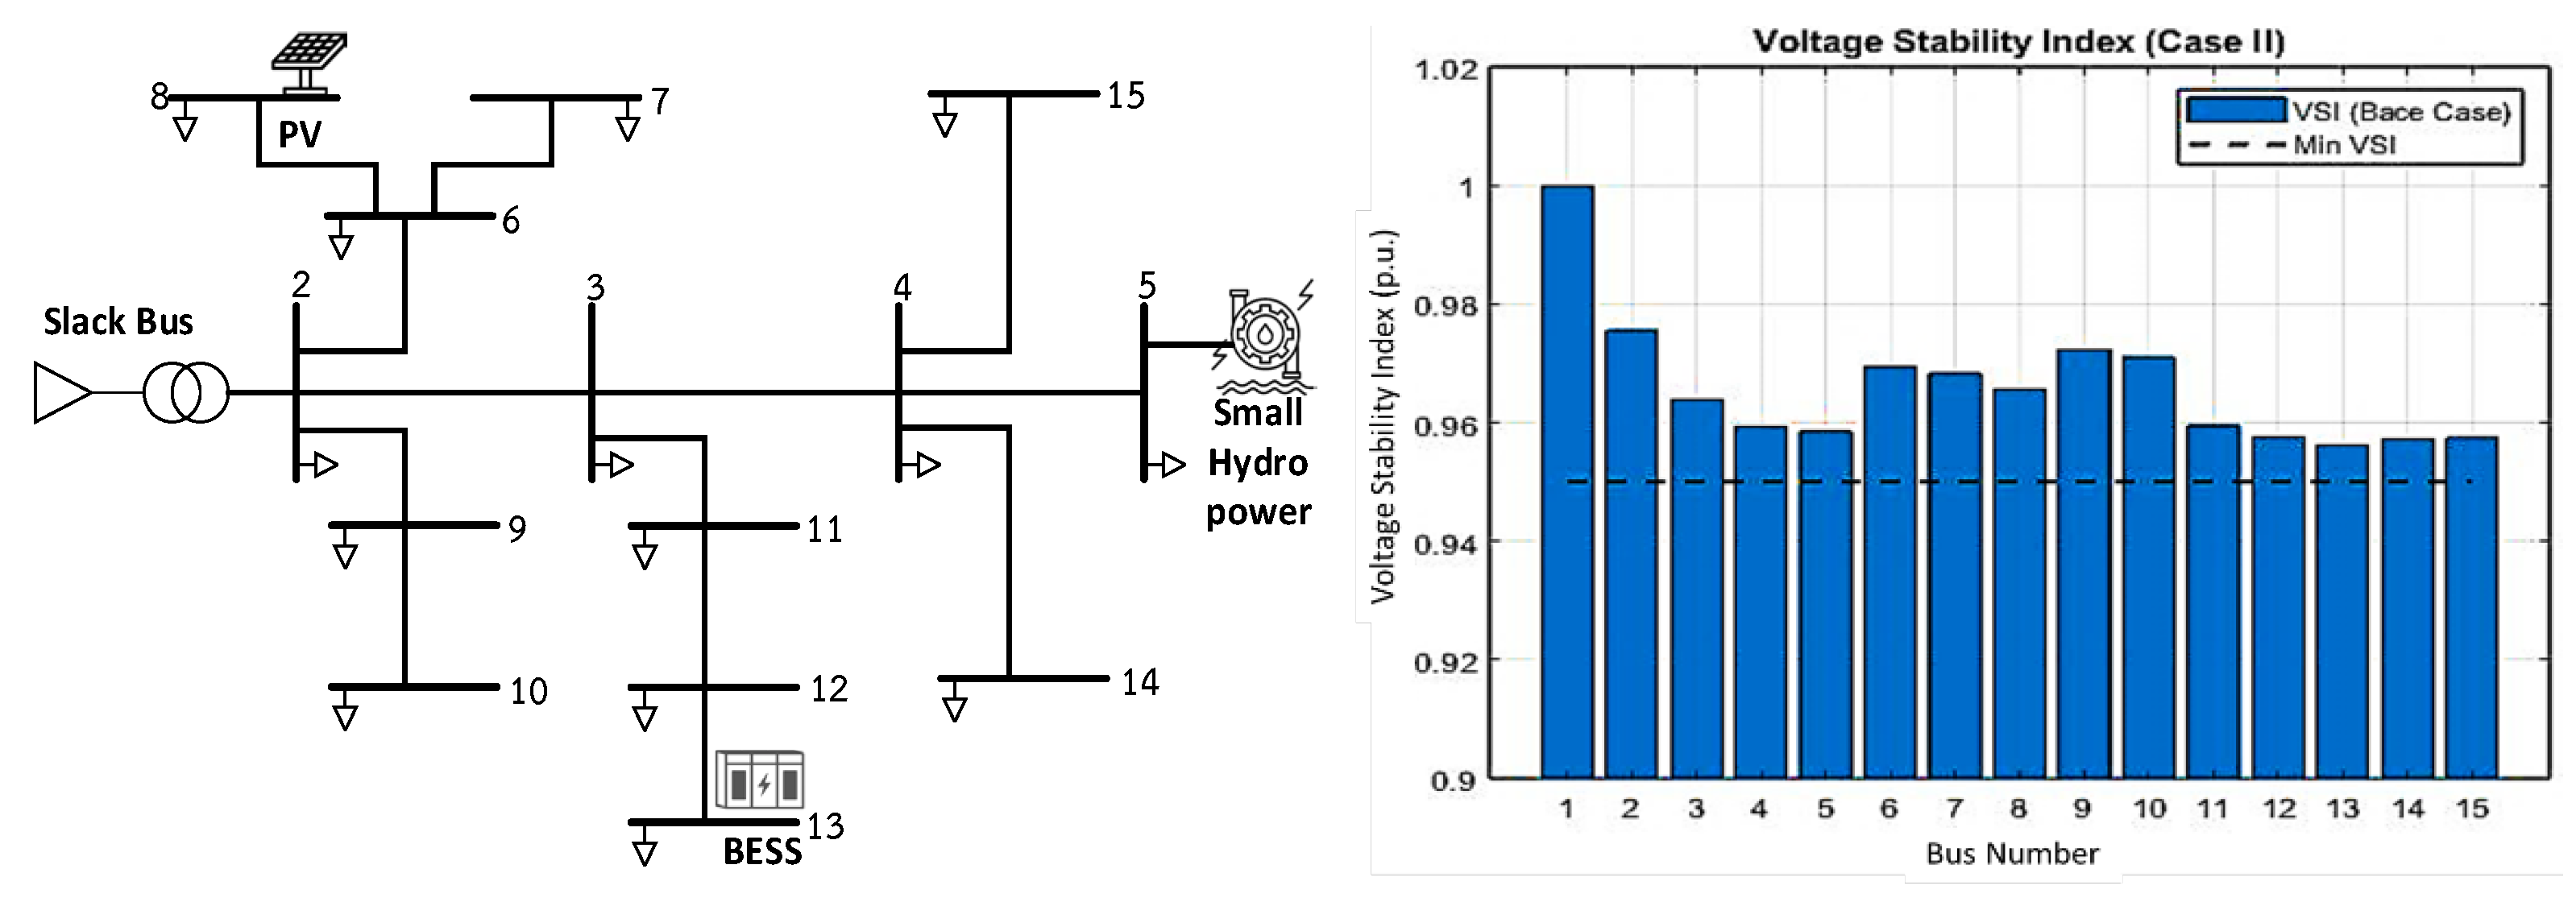
2. Remote Area Communities
2.1. Nodal Current
2.2. Backward Sweep
2.3. Forward Sweep
2.4. Convergence Criterion
3. Hybrid Energy System
3.1. Mathematical Analysis of Fluctuating PV Generation
3.2. Mathematical Analysis of Fluctuating HPP Generation
3.3. Mathematical Analysis of BESSs
4. Problem Statement
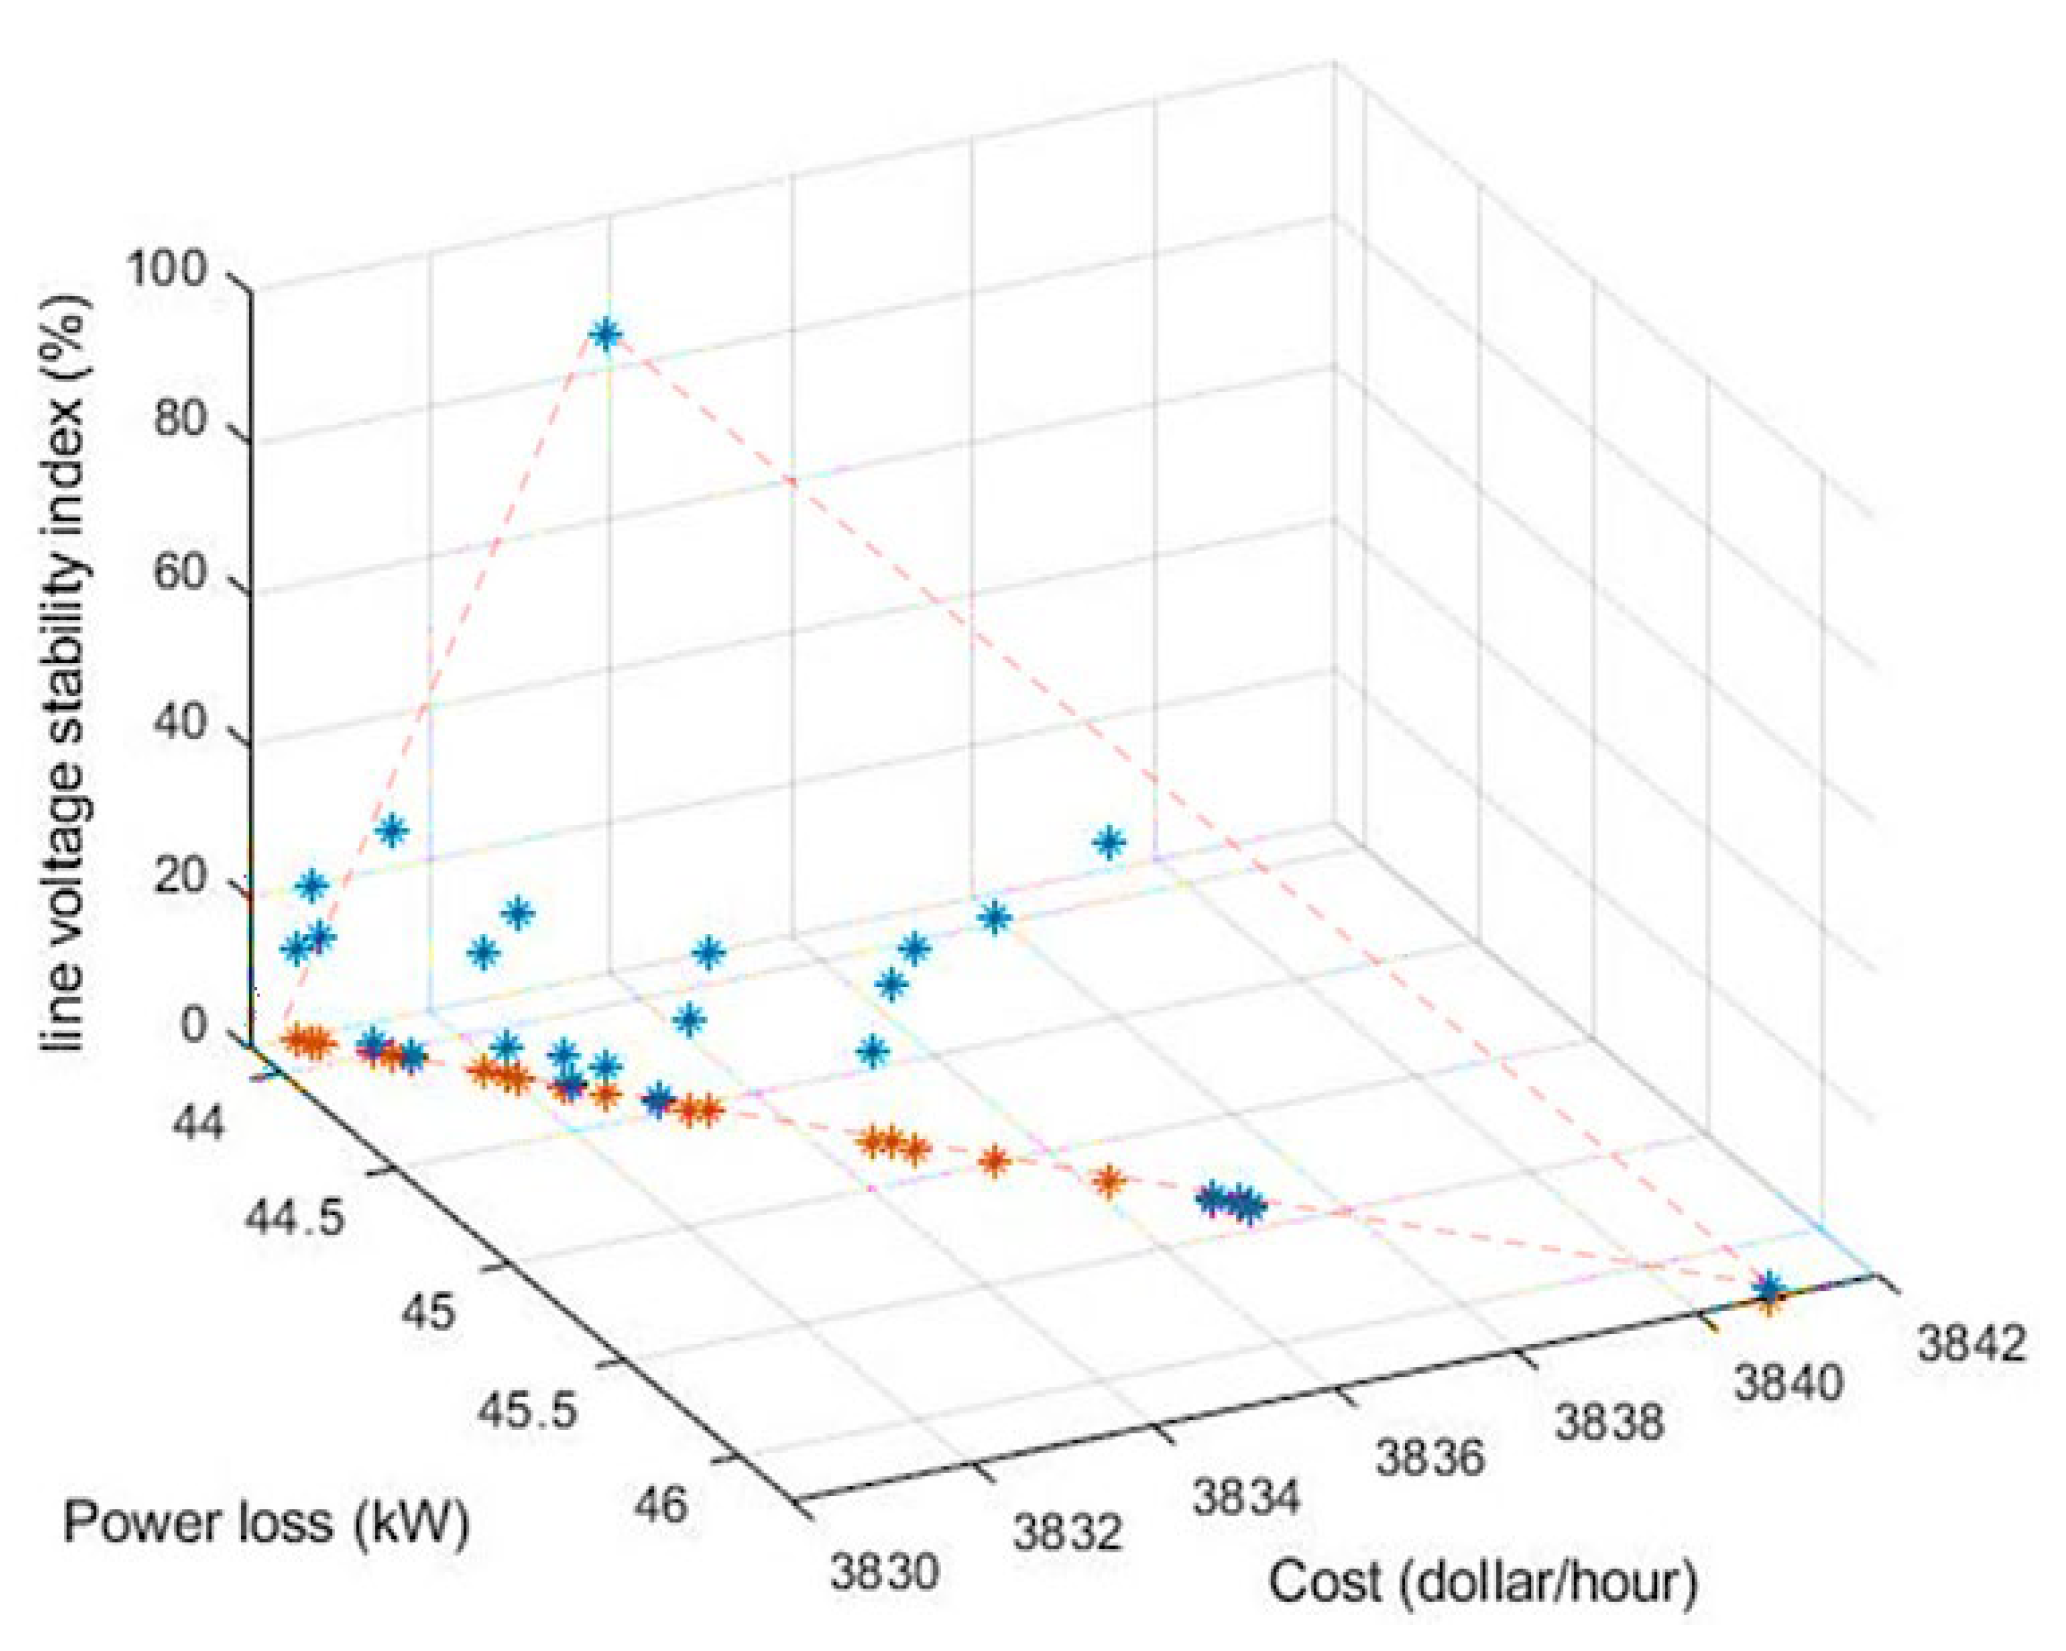
4.1. Multi-Objective Function Formulation
4.1.1. Active Power Loss Reduction
4.1.2. Fuel Cost Reduction
4.1.3. Line Voltage Stability Index
4.2. Constraints of Multi-Objective Function Formulation
4.2.1. Power Balance Formulation
4.2.2. Generation Limits
4.2.3. BESS Limits of Charging and Discharging
4.2.4. Voltage Constraints
5. Battery Energy Storage System Controller
6. The Proposed Improved Particle Swarm Optimization Technique
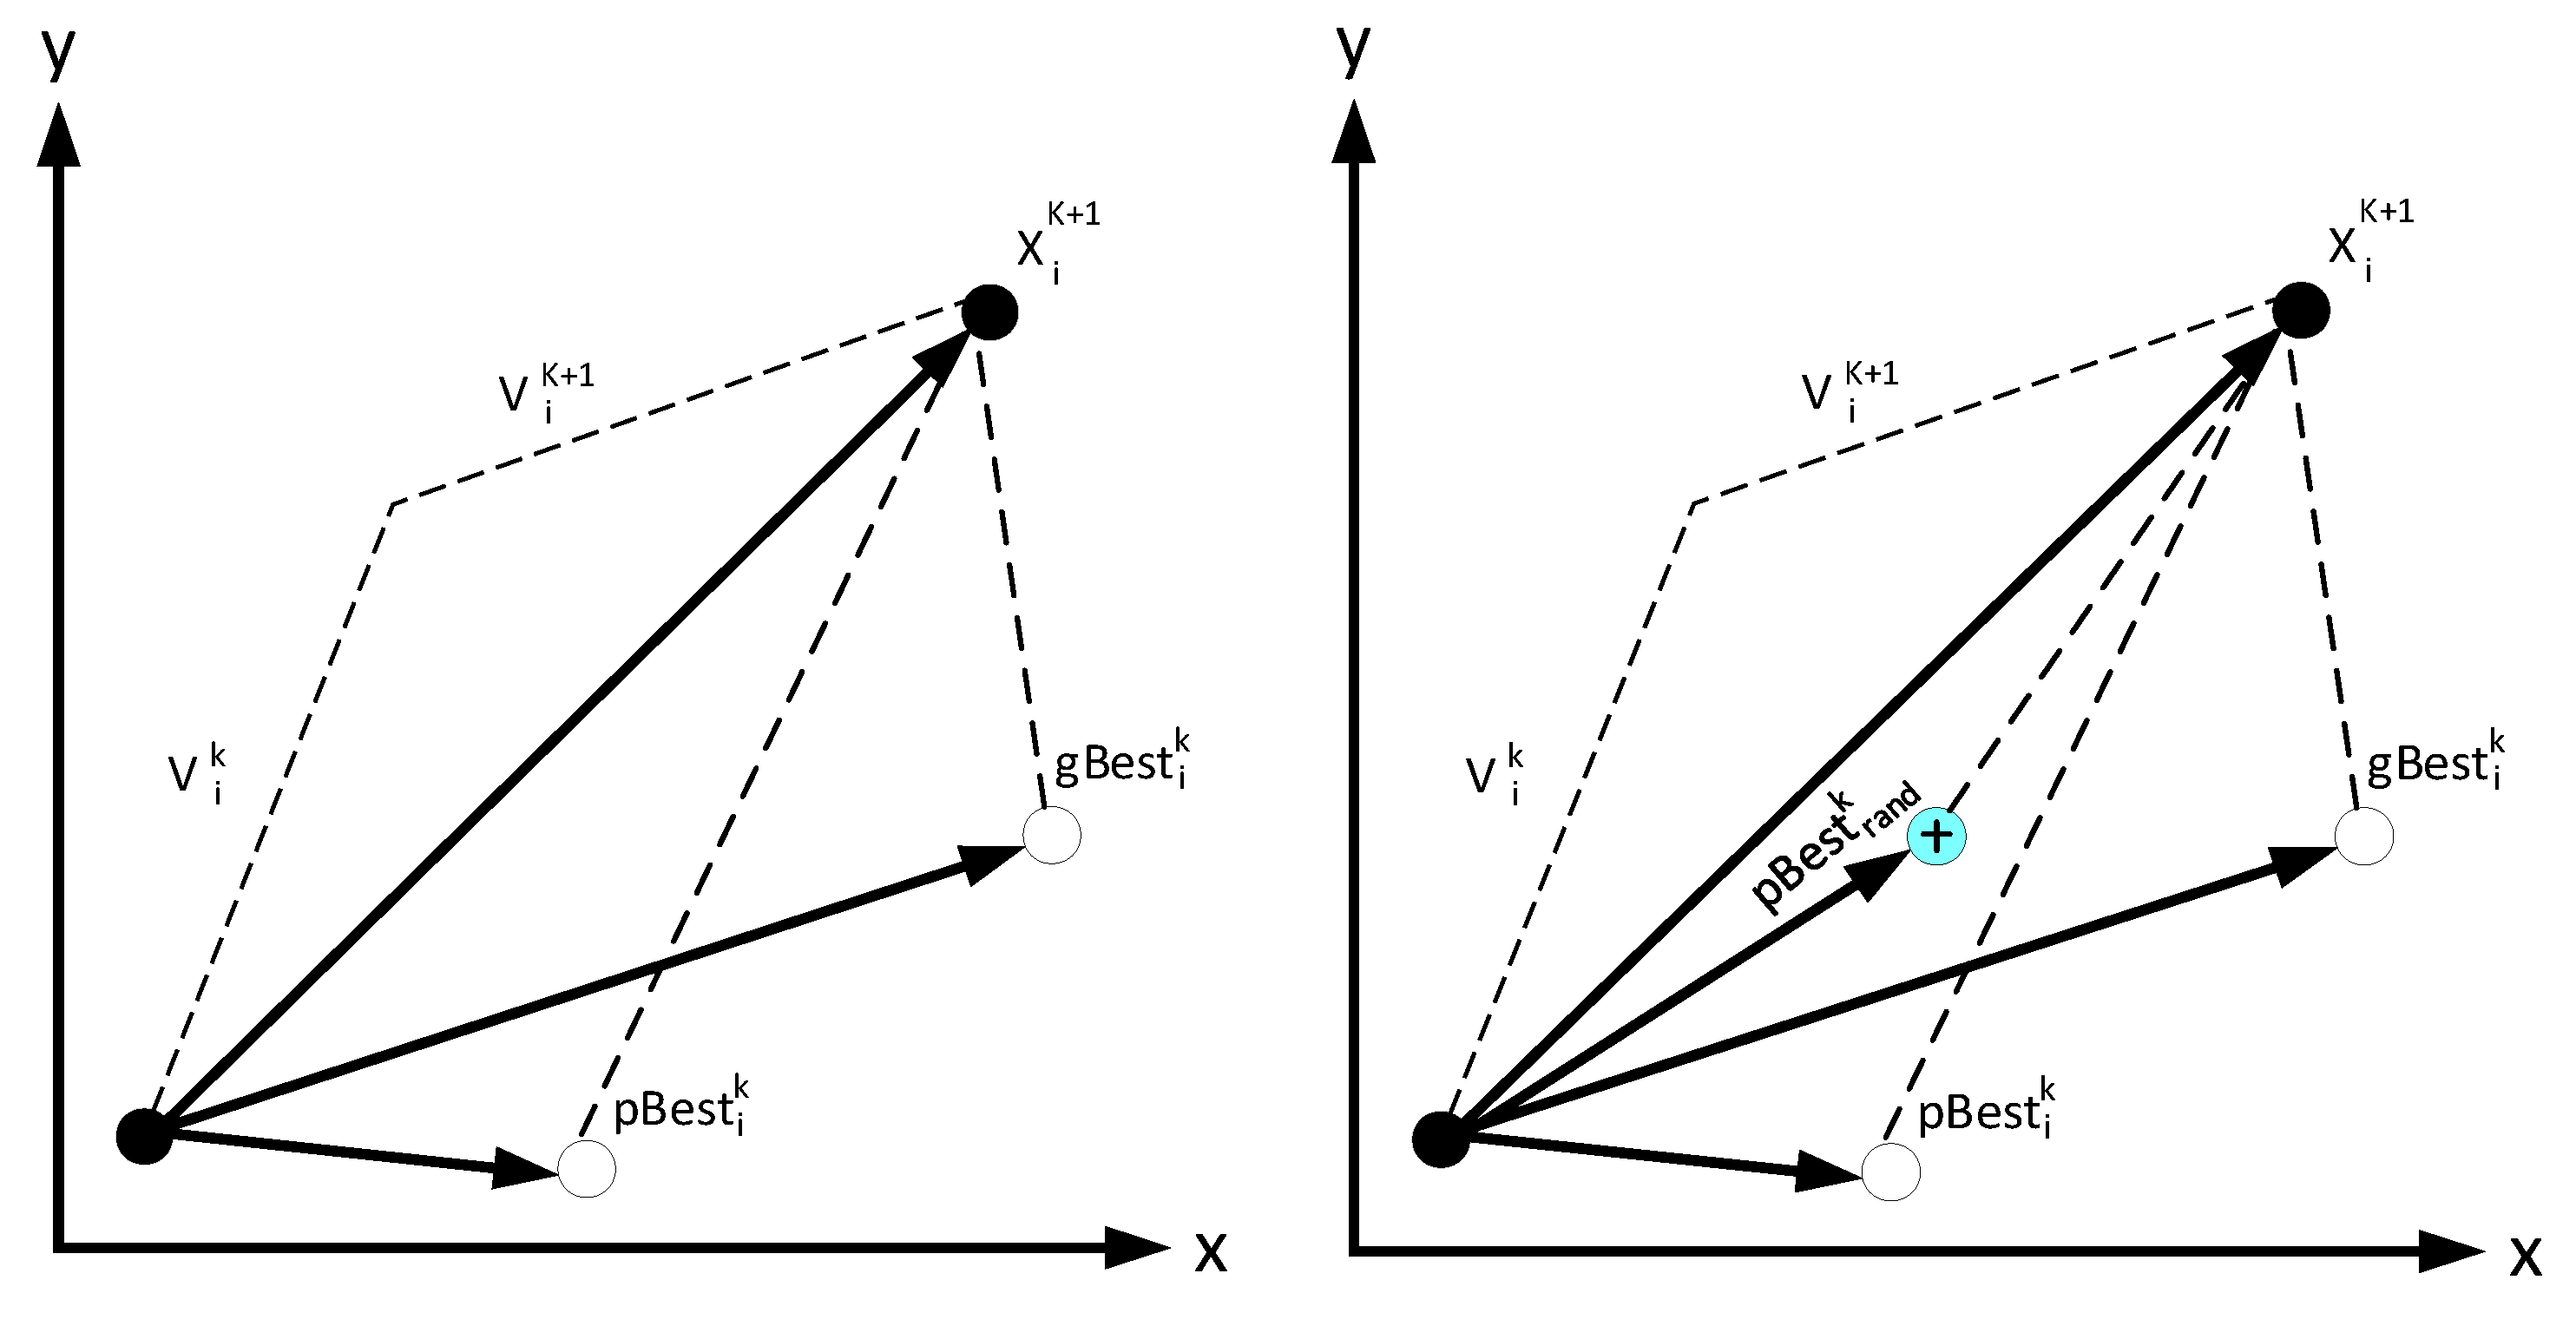
6.1. Conventional Particle Swarm Optimization Technique
6.2. Improved Particle Swarm Optimization (IPSO)
7. Simulation Results
7.1. Case I: Random Installation of PV-HP-BESS and PI Parameter Control of BESS
7.2. Case II: Optimal Location of PV-HP-BESS and PI Parameter Control of BESS
7.3. Case III: Sudden Short Circuit of Transmission Line
8. Discussion
9. Conclusions
Author Contributions
Funding
Data Availability Statement
Conflicts of Interest
Abbreviations
| BESS | Battery energy storage system |
| BFS | Backward–Forward sweep |
| DG | Distributed generation |
| EMS | Energy management system |
| FPA | Flower pollination algorithm |
| GA | Genetic algorithm |
| HESs | Hybrid energy systems |
| HIL | Hardware-in-the-loop |
| HPP | Hydropower plant |
| IHA | The indicators of hydrological alteration algorithm |
| IPSO | Improved particle swarm optimization |
| LCC | Life cycle cost |
| LVSI | Line voltage stability index |
| LLP | Loss of load probability |
| MOGA | Multi-objective genetic algorithm |
| PSO | Particle swarm optimization |
| PV | Photovoltaic |
| RACs | Remote area communities |
| RES | Renewable energy sources |
| TSM | Total Suspended Matter Algorithm |
| VSI | Voltage stability index |
| The grid constraints | |
| The constants associated with each node | |
| The energy stored in the BESS | |
| The total fuel cost of the grid system | |
| The gravitational | |
| The equality | |
| The global best position | |
| Constraints of all objective functions | |
| The hydraulic head | |
| The set of nodes | |
| Current flowing | |
| Reactive power load | |
| Controller of integral control | |
| Controller of proportional control | |
| Length of transmission line | |
| The set of connected nodes | |
| The number of points connected to the grid system | |
| The number of transmission lines | |
| The BESS power output | |
| The personal best position | |
| The total active power demand in first-time analysis | |
| The total active power demand in the grid system | |
| The power generated by the grid system | |
| The active power of the hybrid energy system | |
| Power output | |
| The position of the particle | |
| Active power load at nodes i and j | |
| Active power loss | |
| The active power generation at the receiving node | |
| PV panels rated power | |
| Water flow rate | |
| Reactive power at nodes i and j | |
| The resistance of the transmission lines | |
| Referent radiation intensity | |
| Radiation intensity | |
| State of charging | |
| Time interval | |
| Temperature of PV panels | |
| The reference test temperature for PV panels | |
| Complex bus voltage in round | |
| The voltage at the sending node | |
| The weights for the analysis function | |
| Parameter of proportional control | |
| Parameter of integral control | |
| The acceptable | |
| The plant efficiency | |
| The charging efficiency of the BESS | |
| The discharge efficiency of the BESS | |
| Frequency deviations | |
| The duration of each time interval | |
| The line impedance angle | |
| The different voltage phase angles between the start and end node | |
| The compression–expansion coefficient | |
| The acceleration coefficient |
References
- Smaoui, M.; Rekik, M.; Krichen, L. Optimal design of an off-grid electrical system in remote areas with different renewable energy scenarios. Energy 2025, 318, 134821. [Google Scholar] [CrossRef]
- Irshad, A.S.; Samadi, W.K.; Fazli, A.M.; Noori, A.G.; Amin, A.S.; Zakir, M.N.; Bakhtyal, I.A.; Karimi, B.A.; Ludin, G.A.; Senjyu, T. Resilience and reliable integration of PV-wind and hydropower based 100% hybrid renewable energy system without any energy storage system for inaccessible area electrification. Energy 2023, 282, 128823. [Google Scholar] [CrossRef]
- Ahmed, E.E.; Demirci, A. Multi-stage and multi-objective optimization for optimal sizing of stand-alone photovoltaic water pumping systems. Energy 2022, 252, 124048. [Google Scholar] [CrossRef]
- Prabpal, P.; Kongjeen, Y.; Bhumkittipich, K. Optimal Battery Energy Storage System Based on VAR Control Strategies Using Particle Swarm Optimization for Power Distribution System. Symmetry 2021, 13, 1692. [Google Scholar] [CrossRef]
- Ganesan, S.; Subramaniam, U.; Ghodke, A.A.; Elavarasan, R.M.; Raju, K.; Bhaskar, M.S. Investigation on Sizing of Voltage Source for a Battery Energy Storage System in Microgrid with Renewable Energy Sources. IEEE Access 2020, 8, 188861–188874. [Google Scholar] [CrossRef]
- Chegari, B.; Tabaa, M.; Simeu, E.; El Ganaoui, M. Optimal Energy Management of a Hybrid System Composed of PV, Wind Turbine, Pumped Hydropower Storage, and Battery Storage to Achieve a Complete Energy Self-Sufficiency in Residential Buildings. IEEE Access 2024, 12, 126624–126639. [Google Scholar] [CrossRef]
- Jeong, J.; Kim, S.W.; Kim, H. Deep Reinforcement Learning Based Real-Time Renewable Energy Bidding with Battery Control. IEEE Trans. Energy Mark. Policy Regul. 2023, 1, 85–96. [Google Scholar] [CrossRef]
- Liu, K.; Cai, Y.; Sun, W.; Feng, Q.; Wang, G.; Yang, W. Optimal configuration of a stand-alone PV/diesel/battery hybrid energy system based on modified PSO for a translational sprinkler irrigation machine applied in remote and water-scarce areas. Energy 2025, 320, 135113. [Google Scholar] [CrossRef]
- Mitrofanov, S.V.; Zubova, N.V.; Zhilnikova, M.M.; Anosova, E.I. Mode Optimization of a Hybrid Power Supply System Based on Criterion of Minimizing Fuel Consumption in a Diesel Power Plant. In Proceedings of the 2023 IEEE XVI International Scientific and Technical Conference Actual Problems of Electronic Instrument Engineering (APEIE), Novosibirsk, Russian, 10–12 November 2023; pp. 480–485. [Google Scholar] [CrossRef]
- Zhang, L.; Zhang, T.; Zhang, K.; Hu, W. Research on Optimal Allocation Strategy of Hybrid Energy Storage for Wind-Photovoltaic Hybrid Generation System. In Proceedings of the 2023 8th International Conference on Power and Renewable Energy (ICPRE), Shanghai, China, 22–25 September 2023; pp. 1321–1326. [Google Scholar] [CrossRef]
- Zhao, J.; Liang, Y.; Fan, D.; Ren, H.; Zhu, L.; Zhang, X. Capacity Optimization of lithium Battery-Flywheel Hybrid Energy Storage System. In Proceedings of the 2023 3rd International Conference on Energy Engineering and Power Systems (EEPS), Dali, China, 28–30 July 2023; pp. 186–189. [Google Scholar] [CrossRef]
- Hosseini, E.; Horrillo-Quintero, P.; Carrasco-Gonzalez, D.; García-Triviño, P.; Sarrias-Mena, R.; García-Vázquez, C.A.; Fernández-Ramírez, L.M. Optimal energy management system for grid-connected hybrid power plant and battery integrated into multilevel configuration. Energy 2024, 294, 130765. [Google Scholar] [CrossRef]
- Li, S.; Qin, W.; Zhu, Z.; Lu, R.; Zhang, Y.; Li, X. Transient Stability Assessment of Power Systems Containing Wind Power Based on Hybrid Simulation and Deep Learning. In Proceedings of the 2023 International Conference on Power System Technology (PowerCon), Jinan, China, 21–22 September 2023; pp. 1–5. [Google Scholar] [CrossRef]
- Du, C.; Guo, W.; Guo, S.; Cai, W.; Shi, Q. Transient Current Optimal Control of the Hybrid Three Level Dual Active Bridge Converters Based on Triple-Phase-Shifting Control. In Proceedings of the 2021 IEEE 12th International Symposium on Power Electronics for Distributed Generation Systems (PEDG), Chicago, IL, USA, 28 June–1 July 2021; pp. 1–8. [Google Scholar] [CrossRef]
- Li, Y.; Ding, Q.; Li, S.; Valtchev, S. Optimal controller design for non-affine nonlinear power systems with static var compensators for hybrid UAVs. Tsinghua Sci. Technol. 2022, 27, 196–206. [Google Scholar] [CrossRef]
- Saleh, A.; Magdy, G.; Ali, A.M. Multi-Trial Vector-Based Sine Cosine Algorithm-Based Optimal Frequency Control of Interconnected Hybrid Power Systems Including Renewables. In Proceedings of the 2024 25th International Middle East Power System Conference (MEPCON), Cairo, Egypt, 17–19 December 2024; pp. 1–6. [Google Scholar] [CrossRef]
- Koley, I.; Sarkar, B.; Datta, A.; Panda, G.K. Load Frequency Control of a Wind Energy Integrated Multiarea Power System With CSA Tuned PIDD Controller. In Proceedings of the 2020 IEEE First International Conference on Smart Technologies for Power, Energy and Control (STPEC), Nagpur, India, 25–26 September 2020; pp. 1–6. [Google Scholar] [CrossRef]
- Peng, J.; Fan, B.; Liu, W. Voltage-Based Distributed Optimal Control for Generation Cost Minimization and Bounded Bus Voltage Regulation in DC Microgrids. IEEE Trans. Smart Grid 2021, 12, 106–116. [Google Scholar] [CrossRef]
- Pengtem, C.; Janjamraj, N.; Romphochai, S.; Ngaemngam, S.; Bhumkittipich, K. Multi-Objective Hybrid LF-GWO based Optimal Location and Sizing of Multiple PV-DSG Units for Voltage Profile Improvement. In Proceedings of the 2024 International Conference on Power, Energy and Innovations (ICPEI), Nakhon Ratchasima, Thailand, 16–18 October 2024; pp. 1–6. [Google Scholar]
- Mthethwa, F.; Gomes, C.; Dorrell, D. Development of Optimal Algorithm to Interconnect Multiple Microgrids in an Agricultural-based Remote Community. In Proceedings of the 2021 IEEE AFRICAN, Arusha, Tanzania, 13–15 September 2021; pp. 1–6. [Google Scholar] [CrossRef]
- Saw, B.K.; Bohre, A.K. Multi DG Planning with Impact of Mixed-Load Models using Intelligent Methodologies: BF-PSO, PSO and GA. In Proceedings of the 2023 IEEE 3rd International Conference on Smart Technologies for Power, Energy and Control (STPEC), Bhubaneswar, India, 10–13 December 2023; pp. 1–5. [Google Scholar] [CrossRef]
- Pan, S.; Maleki, S.; Lakshminarayana, S.; Konstantinou, C. Optimal Placement and Power Supply of Distributed Generation to Minimize Power Losses. In Proceedings of the 2023 IEEE International Conference on Communications, Control, and Computing Technologies for Smart Grids (SmartGridComm), Glasgow, UK, 31 October–3 November 2023; pp. 1–6. [Google Scholar] [CrossRef]
- Kusuma, V.A.; Wibowo, R.S.; Putra, D.F.U. Optimizing Distributed Generator Placement in Distribution Networks Using Flower Pollination Algorithm with Self-Healing Integration. In Proceedings of the 2025 International Conference on Advancement in Data Science, E-learning and Information System (ICADEIS), Bandung, Indonesia, 3–4 February 2025; pp. 1–6. [Google Scholar] [CrossRef]
- Li, L.; Xu, S. Optimal Day-ahead Scheduling of Microgrid Participating in Energy and Spinning Reserve Markets. In Proceedings of the 2020 5th Asia Conference on Power and Electrical Engineering (ACPEE), Chengdu, China, 4–7 June 2020; pp. 1049–1055. [Google Scholar] [CrossRef]
- Xu, Z.; Zhu, Y.; Dong, R.; Wang, J.; Zhang, X.; Qin, W. Optimal Scheduling Strategy of Microgrid Participating in Upper Power Grid Based on Flexibility of Distributed Power. In Proceedings of the 2020 IEEE Sustainable Power and Energy Conference (iSPEC), Chengdu, China, 23–25 November 2020; pp. 2256–2261. [Google Scholar] [CrossRef]
- Chen, Z.; Zuo, X.; Hou, B.; Guo, Y.; Tian, N. Privacy-Preserving Optimal Schedule for Microgrid Cluster Based on Information Masking Method. In Proceedings of the 2023 IEEE Power & Energy Society General Meeting (PESGM), Orlando, FL, USA, 16–20 July 2023; pp. 1–5. [Google Scholar] [CrossRef]
- Hussien, A.M.; Hasanien, H.M.; Qais, M.H.; Alghuwainem, S. Hybrid Transient Search Algorithm With Levy Flight for Optimal PI Controllers of Islanded Microgrids. IEEE Access 2024, 12, 15075–15092. [Google Scholar] [CrossRef]
- Tu, Z.; Fan, B.; Khazaei, J.; Zhang, W.; Liu, W. Optimal Reset-Control-Based Load Frequency Regulation in Isolated Microgrids. IEEE Trans. Sustain. Energy 2022, 13, 2239–2249. [Google Scholar] [CrossRef]
- Khezri, R.; Mahmoudi, A.; Haque, M.H. A Comparative Study of Optimal Battery Storage and Fuel Cell for a Clean Power System in Remote Area. In Proceedings of the 2020 IEEE International Conference on Power Electronics, Drives and Energy Systems (PEDES), Jaipur, India, 16–19 December 2020; pp. 1–5. [Google Scholar] [CrossRef]
- Nugraha, S.D.; Ashari, M.; Riawan, D.C. Multi-Objective Approach for Optimal Sizing and Placement of EVCS in Distribution Networks With Distributed Rooftop PV in Metropolitan City. IEEE Access 2025, 13, 40883–40898. [Google Scholar] [CrossRef]
- Amraj, N.J.; Boonrach, N.; Bhumkittipich, K. Optimal Allocation and Sizing of Photovoltaic-Battery Energy Storage Systems in Distribution Network for Power Loss Minimization. In Proceedings of the 2021 International Conference on Power, Energy and Innovations (ICPEI), Nakhon Ratchasima, Thailand, 20–21 October 2021; pp. 33–36. [Google Scholar] [CrossRef]
- Manmai, S.; Romphochai, S.; Janjamraj, N.; Ngaemngam, S.; Bhumkittipich, K. Load Frequency Control of Large-Scale PV-BESS Generation Installation using Power System Stabilizer. In Proceedings of the 2021 24th International Conference on Electrical Machines and Systems (ICEMS), Gyeongju, Republic of Korea, 31 October–3 November 2021; pp. 2378–2381. [Google Scholar] [CrossRef]
- Alberizzi, J.C.; Estevez, M.A.P.; Renzi, M.; Jin, L.; Rossi, M.; Alberizzi, A. Optimal Management of a Hydro—Wind Energy System with Hydrogen Storage. In Proceedings of the 2023 12th International Conference on Power Science and Engineering (ICPSE), Eskisehir, Turkiye, 22–24 September 2023; pp. 46–50. [Google Scholar] [CrossRef]
- Deeum, S.; Charoenchan, T.; Janjamraj, N.; Romphochai, S.; Baum, S.; Ohgaki, H.; Mithulananthan, N.; Bhumkittipich, K. Optimal Placement of Electric Vehicle Charging Stations in an Active Distribution Grid with Photovoltaic and Battery Energy Storage System Integration. Energies 2023, 16, 7628. [Google Scholar] [CrossRef]
- Khan, R.A.; Yang, S.; Fahad, S.; Khan, S.U.; Kalimullah. A Modified Particle Swarm Optimization With a Smart Particle for Inverse Problems in Electromagnetic Devices. IEEE Access 2021, 9, 99932–99943. [Google Scholar] [CrossRef]
- Bin, W. A Novel Supply Chain Multi-level Inventory Model based on Improved PSO Algorithm. In Proceedings of the 2023 8th International Conference on Communication and Electronics Systems (ICCES), Coimbatore, India, 1–3 June 2023; pp. 1733–1737. [Google Scholar] [CrossRef]
- Abdelaziz, A.Y. Optimal sizing and locations of capacitors in radial distribution systems via flower pollination optimizationalgorithm and power loss index. Eng. Sci. Technol. Int. J. 2016, 19, 610–618. [Google Scholar]
- Tamilselvan, V. Optimal capacitor placement in radial distribution systems using flower pollination algorithm. Alex. Eng. J. 2018, 57, 2775–2786. [Google Scholar] [CrossRef]
- Ali, E.S. Improved harmony algorithm and power loss index for optimal locations and sizing of capacitors in radial distributionsystems. Int. J. Electr. Power Energy Syst. 2016, 80, 252–263. [Google Scholar] [CrossRef]
- Pengtem, C.; Taksana, R.; Bhumkittipich, K.; Ohgaki, H.; Romphochai, S. Optimizing V2G Charging Station Design for Improved Power Quality and Stability in Active Distribution Network. In Proceedings of the 16th Eco-Energy and Materials Science and Engineering Symposium (EMSES 2025), Kyoto, Japan, 8–10 January 2025. [Google Scholar]
- Pengtem, C.; Boonjiam, A.; Taksana, R.; Bhumkittpich, P.; Ohgaki, H.; Romphochai, S.; Bhumkittipich, K. Multi-Objective Energy Management in Hybrid PV-Hydro Power-BESS Integrated Remote Area Community Using Particle Swam Optimization Technique. In Proceedings of the 16th Eco-Energy and Materials Science and Engineering Symposium (EMSES 2025), Kyoto, Japan, 8–10 January 2025. [Google Scholar]


| Unit | Base Case | FPA [37] | TSM [38] | IHA [39] | GA [40] | PSO [41] | IPSO |
|---|---|---|---|---|---|---|---|
| No. of HES | - | 3 | 3 | 3 | 3 | 3 | 3 |
| Sum of size (kW) | - | 1000 | 1300 | 950 | 341.5 | 218.27 | 215 |
| (kW) | 53.679 | 30.7112 | 32.4262 | 31.1255 | 51.827 | 44.237 | 43.873 |
| (USD/h) | 3873 | 5510 | 5873 | 5179 | 3865.10 | 3832.10 | 3825.7 |
| Minimum Bus Voltage (p.u.) | 0.9445 | 0.9676 | 0.9695 | 0.9658 | 0.9542 | 0.9548 | 0.9525 |
| Unit | Base Case | Case I | Case II | ||||
|---|---|---|---|---|---|---|---|
| PV | HP | BESS | PV | HPP | BESS | ||
| Location | - | 13 | 5 | 12 | 8 | 15 | 13 |
| Size (kW) | - | 65 | 90.86 | 62.41 | 65 | 100 | 50 |
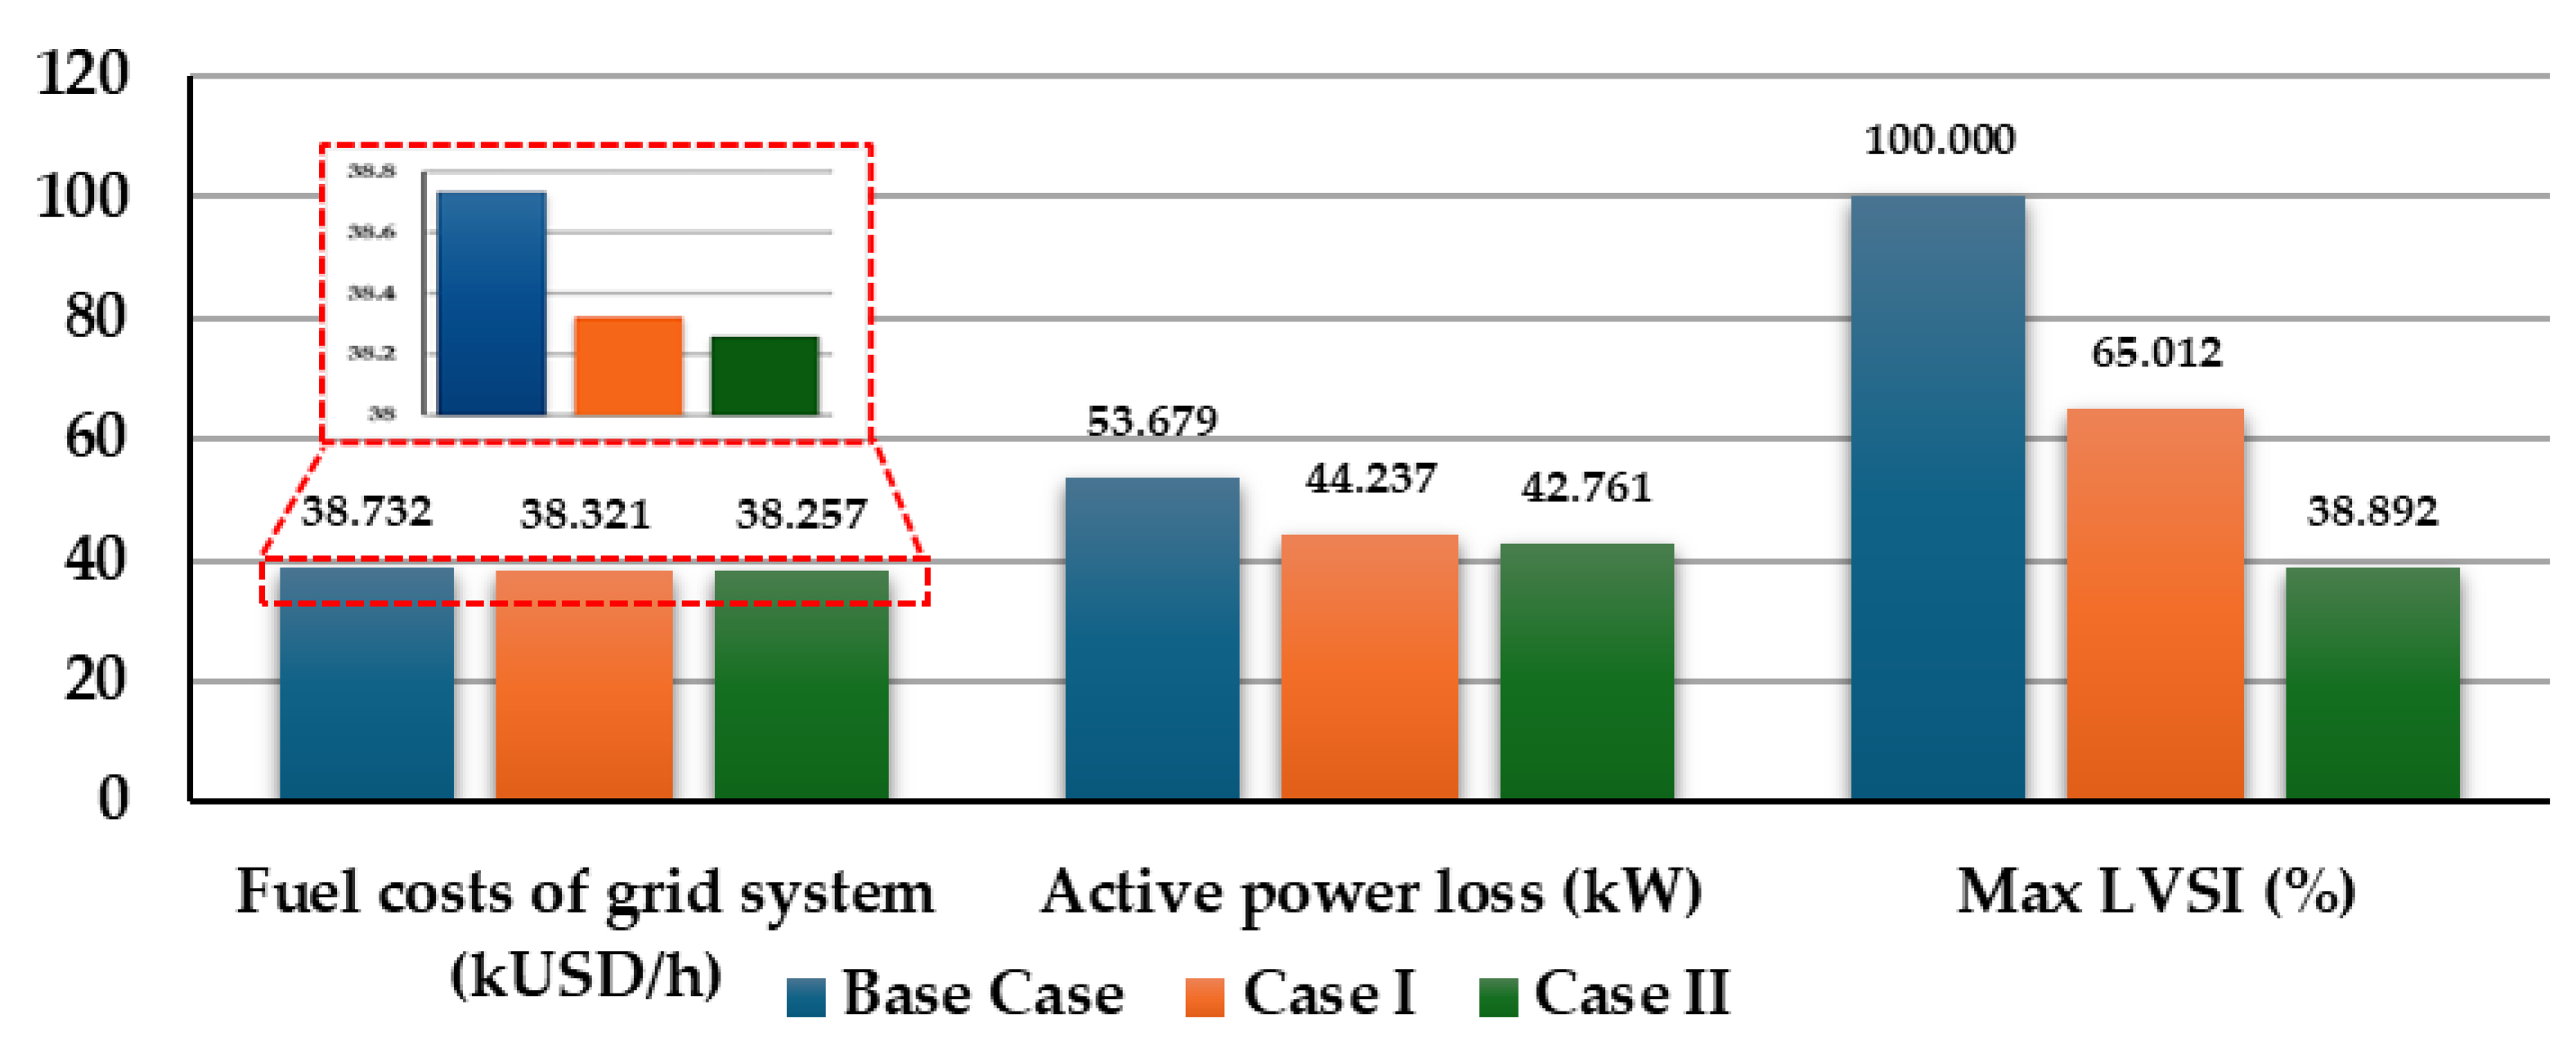
| (kW) | 53.679 | 44.237 | 43.873 | ||||
| (USD/h) | 3873 | 3832.1 | 3825.7 | ||||
| max LVSI (%) | <100 | 65.012 | 38.89 | ||||
| Case | ||||||||
|---|---|---|---|---|---|---|---|---|
| Base Case | 250 | 10,000 | 100 | 5000 | 250 | 10,000 | 100 | 5000 |
| Case I | ||||||||
| Case II | 680 | 643 | 617 | 601 | 417 | 214 | 675 | 346 |
Disclaimer/Publisher’s Note: The statements, opinions and data contained in all publications are solely those of the individual author(s) and contributor(s) and not of MDPI and/or the editor(s). MDPI and/or the editor(s) disclaim responsibility for any injury to people or property resulting from any ideas, methods, instructions or products referred to in the content. |
© 2025 by the authors. Licensee MDPI, Basel, Switzerland. This article is an open access article distributed under the terms and conditions of the Creative Commons Attribution (CC BY) license (https://creativecommons.org/licenses/by/4.0/).
Share and Cite
Pengtem, C.; Deeum, S.; Amirullah; Ohgaki, H.; Romphochai, S.; Bhumkittipich, P.; Bhumkittipich, K. Design of Multi-Objective Energy Management for Remote Communities Connected with an Optimal Hybrid Integrated Photovoltaic–Hydropower–Battery Energy Storage System (PV-HP-BESS) Using Improved Particle Swarm Optimization. Energies 2025, 18, 2250. https://doi.org/10.3390/en18092250
Pengtem C, Deeum S, Amirullah, Ohgaki H, Romphochai S, Bhumkittipich P, Bhumkittipich K. Design of Multi-Objective Energy Management for Remote Communities Connected with an Optimal Hybrid Integrated Photovoltaic–Hydropower–Battery Energy Storage System (PV-HP-BESS) Using Improved Particle Swarm Optimization. Energies. 2025; 18(9):2250. https://doi.org/10.3390/en18092250
Chicago/Turabian StylePengtem, Chaimongkol, Saksit Deeum, Amirullah, Hideaki Ohgaki, Sillawat Romphochai, Pimnapat Bhumkittipich, and Krischonme Bhumkittipich. 2025. "Design of Multi-Objective Energy Management for Remote Communities Connected with an Optimal Hybrid Integrated Photovoltaic–Hydropower–Battery Energy Storage System (PV-HP-BESS) Using Improved Particle Swarm Optimization" Energies 18, no. 9: 2250. https://doi.org/10.3390/en18092250
APA StylePengtem, C., Deeum, S., Amirullah, Ohgaki, H., Romphochai, S., Bhumkittipich, P., & Bhumkittipich, K. (2025). Design of Multi-Objective Energy Management for Remote Communities Connected with an Optimal Hybrid Integrated Photovoltaic–Hydropower–Battery Energy Storage System (PV-HP-BESS) Using Improved Particle Swarm Optimization. Energies, 18(9), 2250. https://doi.org/10.3390/en18092250