Article

Day-Ahead Optimal Scheduling of an Integrated Electricity-Heat-Gas-Cooling-Hydrogen Energy System Considering Stepped Carbon Trading

1
State Grid Xinjiang Electric Power Co., Ltd., Urumqi 830018, China
2
China Electric Power Research Institute, Beijing 100192, China
3
State Grid Xinjiang Economic Research Institute, Urumqi 830063, China
*
Author to whom correspondence should be addressed.
Energies 2025, 18(9), 2249; https://doi.org/10.3390/en18092249
Submission received: 25 March 2025 / Revised: 23 April 2025 / Accepted: 24 April 2025 / Published: 28 April 2025

Abstract

:
Within the framework of “dual carbon”, intending to enhance the use of green energies and minimize the emissions of carbon from energy systems, this study suggests a cost-effective low-carbon scheduling model that accounts for stepwise carbon trading for an integrated electricity, heat, gas, cooling, and hydrogen energy system. Firstly, given the clean and low-carbon attributes of hydrogen energy, a refined two-step operational framework for electricity-to-gas conversion is proposed. Building upon this foundation, a hydrogen fuel cell is integrated to formulate a multi-energy complementary coupling network. Second, a phased carbon trading approach is established to further explore the mechanism’s carbon footprint potential. And then, an environmentally conscious and economically viable power dispatch model is developed to minimize total operating costs while maintaining ecological sustainability. This objective optimization framework is effectively implemented and solved using the CPLEX solver. Through a comparative analysis involving multiple case studies, the findings demonstrate that integrating electric-hydrogen coupling with phased carbon trading effectively enhances wind and solar energy utilization rates. This approach concurrently reduces the system’s carbon emissions by 34.4% and lowers operating costs by 58.6%.

1. Introduction

Accelerated industrialization and climate governance pressure to form a double forcing mechanism: the traditional energy system faces a rigid growth in demand and carbon emissions constraints of the sharp contradiction, driving many countries to turn to wind power, photovoltaic, and other renewable energy strategy layouts [1,2]. Sources of green power, symbolized by solar and wind energy, have become a key alternative to traditional fossil fuels for power generation, reducing greenhouse gas and harmful pollutant emissions due to their cleanliness and sustainability [3]. Compared to coal-fired and gas-fired power generation, sources of clean energy can significantly reduce the emission intensity of SOx, NOx, and CO2 through zero-carbon power output, attaining the objective of cutting carbon emissions and environmental impact [4]. A comprehensive energy system through multi-energy complementary, synergistic optimization, breaking the traditional energy system of a single energy-independent supply mode, the organic integration of power, gas, heat, cooling, hydrogen, and other energy sources, and the formation of a source-network-charge-storage synergistic operation system [5,6] is a reliable way for overcoming a significant percentage of renewable energy usage [7].
Hydrogen energy is growing rapidly and has a promising development prospect [8]. Among them, the convergence of renewable energy with hydrogen technologies has garnered a great deal of interest [9]. Power-to-gas (P2G) technology turns surplus electric power into hydrogen-based fuel gasses via electrochemical conversion processes, establishing a bridge for mutual energy transfer between fossil fuel infrastructure and the electrical grid [10]. It enables high-capacity storage of excess power [11]. Giulio et al. [12] focused on evaluating the regulation capabilities of P2G in large wind farms. Wang et al. [13] constructed a coupled model of carbon capture and storage (CCS) and P2G in a wind-hydrogen energy generation system. Chen et al. [14] proposed a joint P2G-CHP-CCS operation strategy under carbon trading. Pan et al. [15] developed an integrated energy system (IES) model taking demand reaction and P2G into consideration. Zeng et al. [16] developed a coupled electricity and gas system using electricity-to-gas conversion as a hub, and the outcomes demonstrated the suggested model’s validity. Ma et al. [17] developed an IES model with P2G conversion and CCS-integrated combined heat and power (CHP) units, which synergistically addressed carbon source allocation for P2G operation and carbon emission mitigation in CHP through system optimal scheduling.
Carbon trading mechanisms are an effective measure for the creation of a society with low emissions [18,19]. The optimization of carbon trading prices has a significant role to play in promoting carbon emission reduction, energy efficiency, and technological innovation among enterprises [20]. Chen et al. [21] prove that carbon trading has a favorable effect on achieving dual-carbon goals. Zhang et al. [22] developed a regional IES model that takes carbon trading and demand response into account. Micho, P., et al. [23] carried out a number of case studies of integrated electric hydrogen markets and proposed a framework for modeling local electric hydrogen markets. Li et al. [24] synergized the running of carbon trading mechanisms with nuclear power units to improve system economics while reducing carbon emissions.
However, existing research focuses on the electricity-to-gas system, with less consideration given to the participation of hydrogen fuel cells, which fails to properly harness the advantages of hydrogen energy. The introduction of a carbon market system into the IES can effectively lessen the release of carbon from the structure, but little consideration has been given to the laddering of trading in carbon. Furthermore, although significant progress has been made in investigating electricity-heat-hydrogen integrated energy systems, the current research landscape still demonstrates scope for improvements regarding the systematic integration of cooling energy requirements.
In summary, the study provides an appropriate planning model that makes use of the stepped carbon market mechanism and applies to the IES of power, thermal energy, gas, cold, and hydrogen. The issue can be resolved using the MATLAB software CPLEX solver, which takes into account both the system’s cost-effective and environmentally friendly characteristics. By contrasting and examining the scheduling outcomes of multiple system operation techniques, the efficacy of the suggested operation strategy is confirmed. The following is a summary of this paper’s primary contributions:
  • The optimal scheduling model containing equipment such as P2G, hydrogen fuel cells, and cogeneration units is constructed, which enhances the coupling of electric, heat, gas, cold, and hydrogen subsystems.
  • The refined modeling of P2G, together with the inclusion of hydrogen fuel cells and CCS, improves the utilization of renewable energy and solves the carbon source problem of the hydrogen-to-methane process while lowering the system’s carbon emissions even more.
  • The implementation of a positive and negative tiered carbon trading mechanism, thereby establishing an effective market-based incentive system, demonstrates significant practical significance for advancing carbon-emission reduction through decreased CO2 emissions in integrated energy service systems at the market level.
The main research content of this paper is as follows. First, Section 2 introduces the integrated energy system architecture and establishes mathematical models for various energy conversion and storage devices. Section 3 develops an optimal dispatch model with the objective of minimizing operational costs. In Section 4, case studies are conducted to analyze the system benefits under three operational modes. Finally, conclusions are drawn in Section 5.

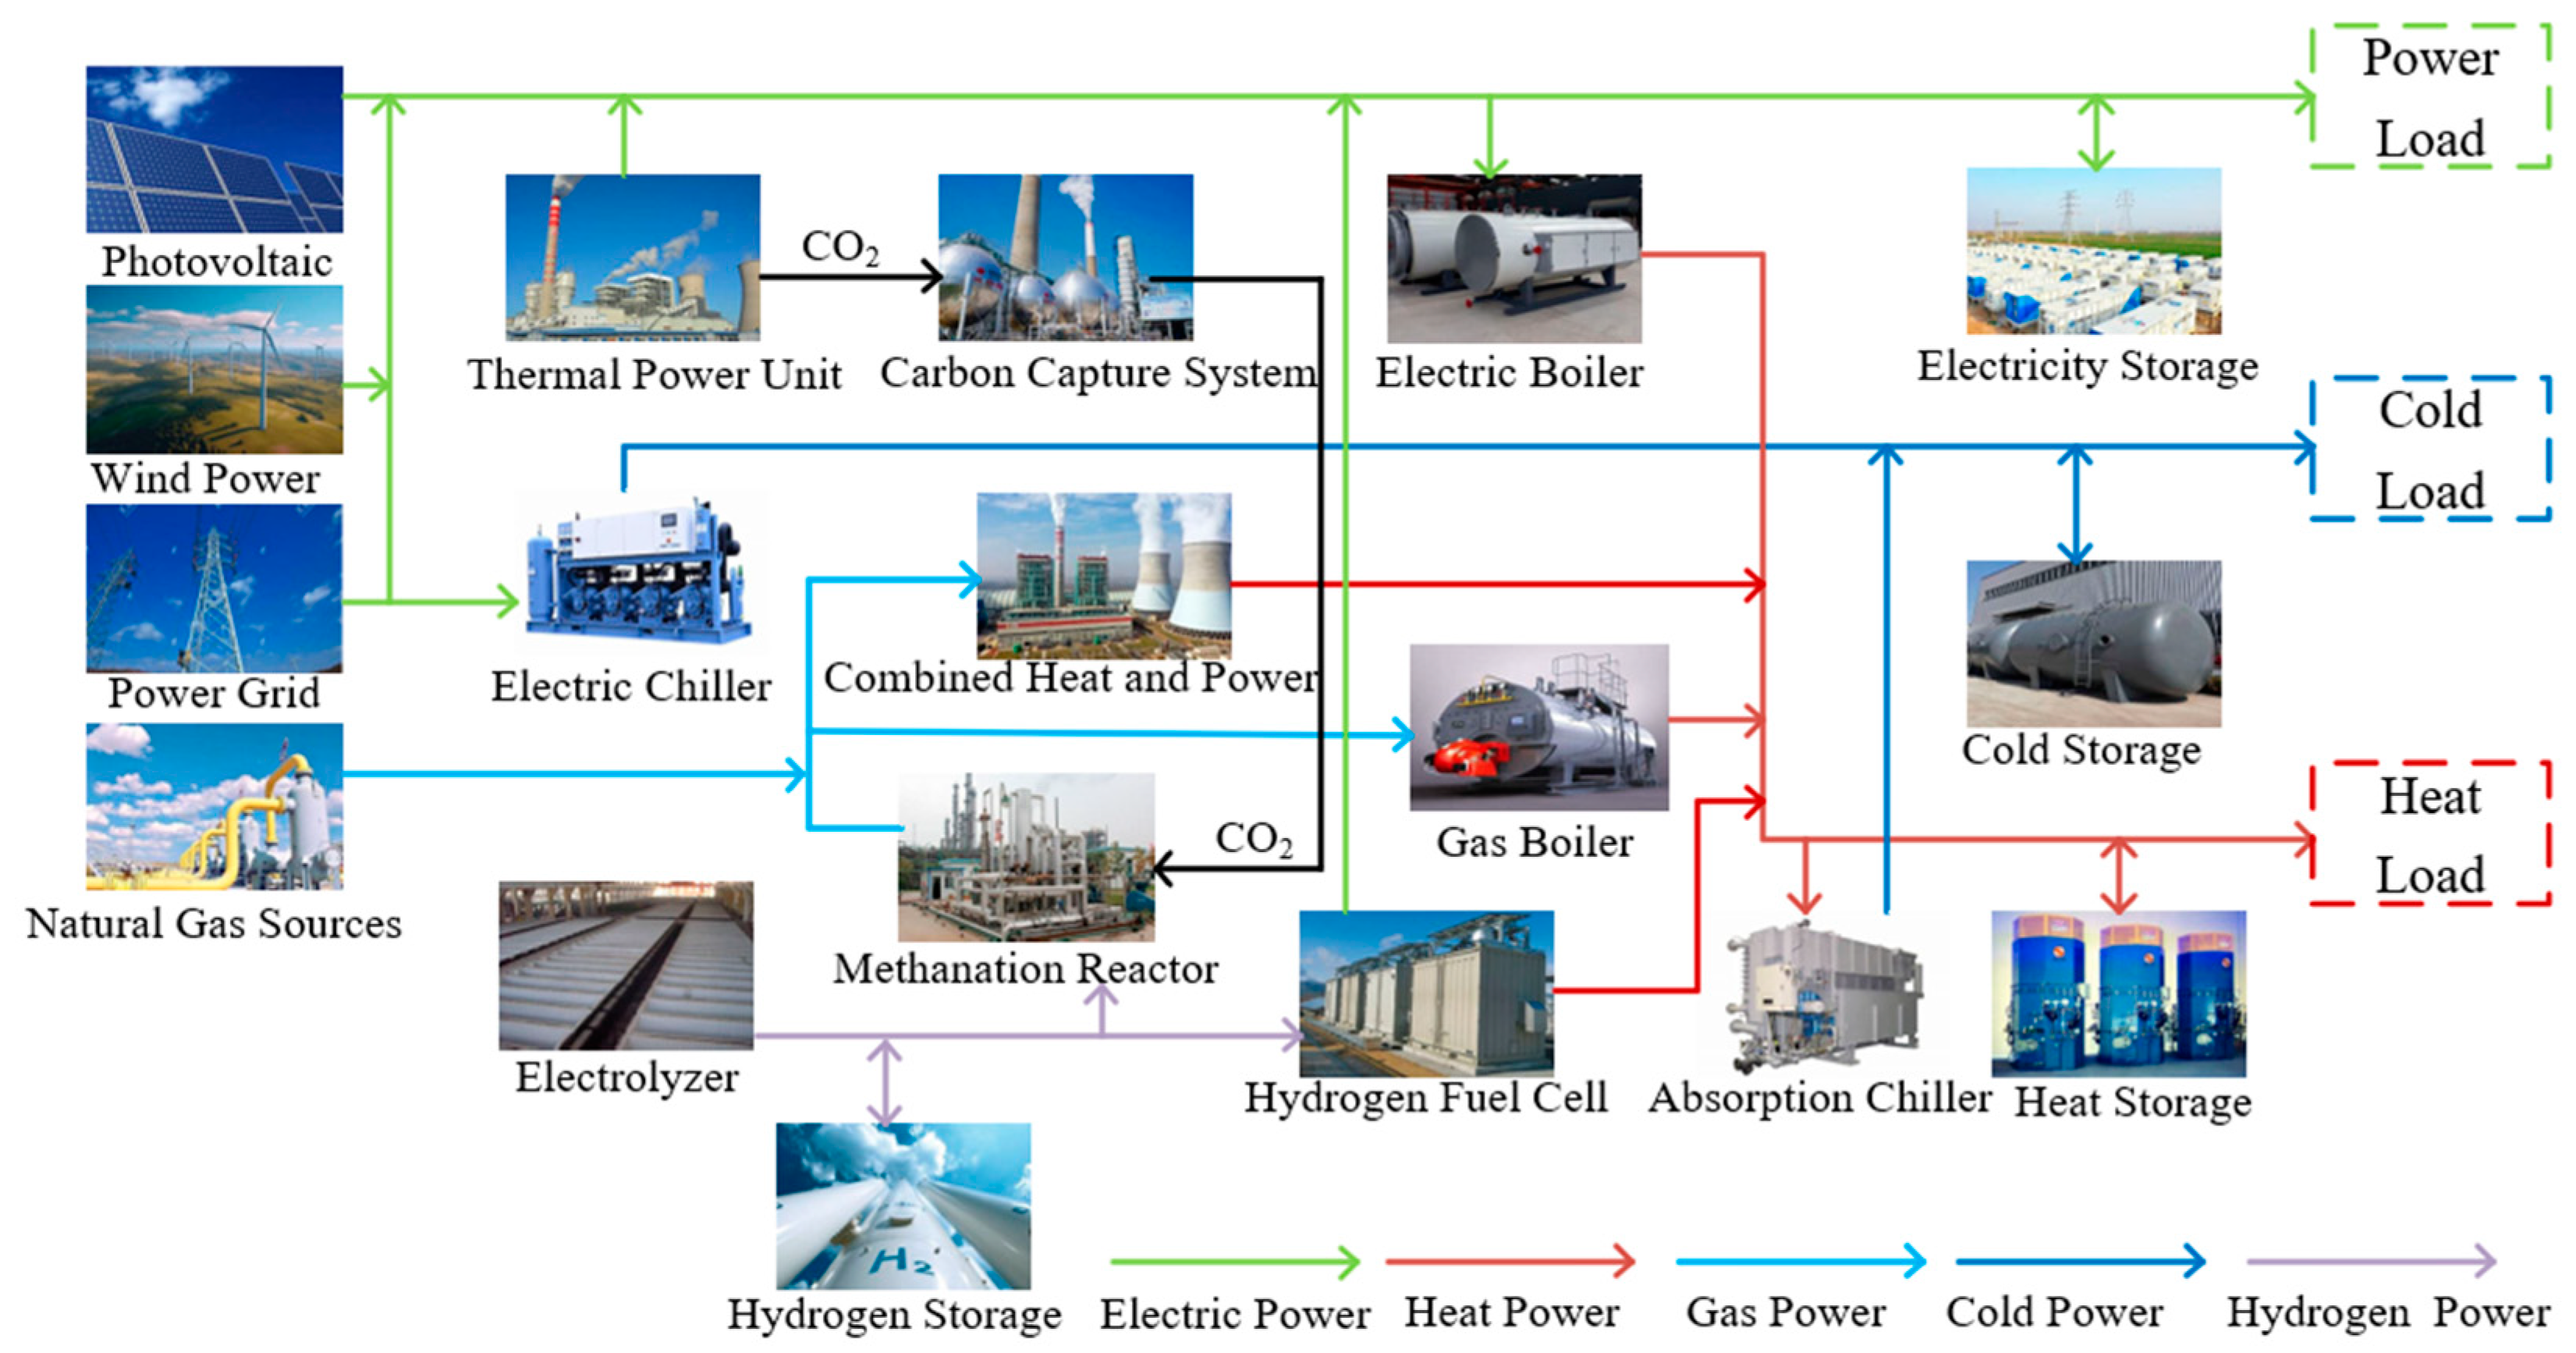
2. IES Architecture and Mathematical Modelling

Figure 1 depicts the structure of the IES investigated in this article, which internally couples electricity, heat, cold, hydrogen, and natural gas and achieves the conversion between multiple forms of energy through energy conversion equipment such as cogeneration units, in addition to the traditional P2G system decomposed into two parts: electrolysis tanks and methane reactors. IES energy inputs include photovoltaic (PV), wind power (WT), thermal power unit (TPU), and the upper grid/gas grid. Equipment for energy conversion consists of CHP, gas boiler (GB), electric boiler (EB), electric chiller (EC), absorption chiller (AC), electrolyzer (EL), hydrogen fuel cell (HFC), and methane reactor (MR); equipment for energy storage comprises electricity storage (ES), hydrogen storage (H2S), heat storage (HS), and cold storage (CS). Customer-side load, which is the energy consumed at the customer’s end. In this paper, we consider including electric load, heat load, and cold load.

2.1. IES Model Establishment

2.1.1. Electrolyzer (EL)

Electrolyzers electrolyze water using direct current to produce hydrogen and oxygen. From the perspective of energy conversion, electrolyzers transform electrical energy into hydrogen energy, and the reaction process does not emit carbon. Currently, there are four main electrolysis tank hydrogen production technologies, of which the most widely used is the production of hydrogen by inputting electrical energy in an alkaline environment [25]. Hydrogen production offers an effective method for integrating renewable energy sources. Due to its inherent physicochemical properties, hydrogen serves as an ideal energy carrier, enabling flexible energy redistribution. Furthermore, excess hydrogen can be stored in specialized tanks for interim utilization, thereby addressing intermittency challenges associated with renewable power generation [26]. This document includes the mathematical model and restrictions for producing hydrogen from electrolysis tanks:
PEL,H2(t) = ηELPEL,E(t),
P E L , E m i n P E L , E ( t ) P E L , E m a x ,
Δ P E L , E m i n P E L , E ( t + 1 ) P E L , E ( t ) Δ P E L , E m a x
where PEL,H2(t) is the electrolyzer’s ability to produce hydrogen energy at a time t, ηEL is the electrolyzer’s efficiency of generating hydrogen energy, PEL,E(t) is the amount of electricity that the electrolyzer uses at any one time, P E L , E m i n , P E L , E m a x are the electrolyzer’s lowest and maximum electrical power input, P E L , E m i n , P E L , E m a x are the electrolyzer’s climbing power’s lower and upper bounds.

2.1.2. Hydrogen Fuel Cell (HFC)

HFC is an electric-heat-hydrogen coupling device in the system, and its basic working principle is that the hydrogen produced by the electrolysis tank undergoes a redox reaction in the fuel cell, generating electrical and thermal energy in the process. Therefore, the HFC is different from the traditional sense of the battery; it is actually an energy conversion device [27] rather than an energy storage device.
PHFC,E(t) = ηHFC,EPHFC,H2(t),
PHFC,H(t) = ηHFC,HPHFC,H2(t),
P H F C , H 2 m i n P H F C , H 2 t P H F C , H 2 m a x ,
Δ P H F C , H 2 m i n P H F C , H 2 ( t + 1 ) P H F C , H 2 ( t ) Δ P H F C , H 2 m a x ,
κ H F C , H 2 m i n P H F C , H ( t ) / P H F C , E ( t ) κ H F C , H 2 m a x ,
where PHFC,E(t) is the HFC’s electrical power production at a time t, ηHFC,E is the fuel cell’s ability to transform hydrogen energy into electrical energy, PHFC,H2(t) is the hydrogen power input to the HFC at a time t, PHFC,H(t) is the thermal power output from the HFC at a time t, ηHFC,H is the efficiency of the fuel cell in converting hydrogen energy to thermal energy, P H F C , H 2 m i n , P H F C , H 2 m a x are the HFC’s input power’s lowest and greatest amounts. Δ P H F C , H 2 m i n , Δ P H F C , H 2 m a x are the lowest and largest amounts of the HFC’s climbing power. κ H F C , H 2 m i n , κ H F C , H 2 m a x are the adjustable thermoelectric power of the HFC ratio lower and upper limits.

2.1.3. Methane Reactor (MR)

The MR is an important piece of equipment in the P2G chain. For the regular operation of the gas equipment, natural gas is delivered into the fossil fuel pipeline supply system after the carbon dioxide from the carbon capture system reacts with the hydrogen created by the electrolysis tank.
PMR,G(t) = ηMRPMR,H2(t),
P M R , H 2 m i n P M R , H 2 ( t ) P M R , H 2 m a x ,
Δ P M R , H 2 m i n P M R , H 2 ( t + 1 ) P M R , H 2 ( t ) Δ P M R , H 2 m a x ,
where PMR,G(t) is the natural gas produced by the MR at a time t, ηMR is the energy conversion efficiency of the methane reactor, PMR,H2(t) is the hydrogen power input to the methane reactor at a time t, P M R , H 2 m i n , P M R , H 2 m a x are the maximum and minimum amounts of hydrogen power that can be added to the MR, Δ P M R , H 2 m i n , Δ P M R , H 2 m a x are the MR’s climbing power’s lower and upper bounds.

2.1.4. Carbon Capture Power Plants

Depending on the carbon capture plant’s operating conditions, some of the exhaust gas is released into the atmosphere through a flue gas bypass, while the remainder passes through the absorption tower, where the alcoholic amine solution absorbs the majority of it before it enters the rich liquid storage or regeneration tower [28].
E G ( t ) = e g P G ( t ) 0 δ 1 E total , CO 2 ( t ) = E CG ( t ) + β δ e g E G ( t ) 0 E total , CO 2 ( t ) η β e g P G , max P B ( t ) = ε E total , CO 2 ( t ) P G ( t ) = P J ( t ) + P D ( t ) + P B ( t ) E total , CO 2 ( t ) = E f ( t ) + E U ( t ) P G min U ( t ) P G ( t ) P G max U ( t ) P G min U ( t ) P G ( t + 1 ) P G ( t ) P G max U ( t ) E U ( t ) = β cc P MR , H 2 ( t )
where EG(t) is TPU’s total CO2 production at a point t, eg is the unit’s carbon intensity, PG(t) is the unit’s overall generation of power at a point t, and δ is the flue gas split ratio of the unit. Etotal,CO2(t) is the amount of CO2 that the unit has gathered overall at a point t, β is the degree of efficiency in carbon capture, η is the highest working condition factor of the compressor and regeneration tower, PB(t) is the energy used by the unit operating at a point t, ε is the energy consumption of the unit for capturing a unit of CO2, and PJ(t) is the net output power of the unit at a point t. PD is the fixed energy consumption of the unit. Ef(t) is the total amount of carbon sequestration at a point t. Eu(t) is the total amount of carbon utilization at a point t. Pmin,G, Pmax,G are the minimum and maximum output of the thermal power unit, U(t) is the operating state of the thermal power unit at point t and Δ P G m i n , Δ P G m a x are the unit’s creep rate, both uphill and downward. βcc is the conversion coefficient of electricity and carbon.
V CA ( t ) = E CG ( t ) M MEA M CO 2 θ C R ρ R V FY ( t ) = V FY ( t 1 ) V CA ( t ) V PY ( t ) = V PY ( t 1 ) + V CA ( t ) 0 V FY ( t ) V CR 0 V PY ( t ) V CR V FY ( 0 ) = V FY ( 24 ) V PY ( 0 ) = V FY ( 24 )
where VCA(t) is the amount of solution needed at a time t to release CO2 from the solution memory, MMEA is MEA’s molar mass, MCO2 is the molar mass of CO2, θ is the regeneration tower resolving volume, CR is the alkyd solution’s concentration, ρR is the density of the alkyd solution, VFY(t) is the volume of the unit’s rich solution memory at time t, VPY(t) is the volume of the unit’s lean solution memory at time t, and VC is the unit’s solution storage capacity.

2.1.5. Combined Heat and Power (CHP)

A gas turbine, a waste heat boiler, and a generator set make up the cogeneration unit. By burning natural gas, thermal energy is converted into mechanical energy, driving the generator to generate electricity and recovering the waste heat to supply the heat load with energy.
PCHP,E(t) = ηCHP,EPCHP,G(t),
PCHP,H(t) = ηCHP,HPCHP,G(t),
P C H P , G m i n P C H P , G ( t ) P C H P , G m a x ,
Δ P C H P , G m i n P C H P , H 2 ( t + 1 ) P C H P , H 2 ( t ) Δ P C H P , G m a x ,
κ C H P m i n < P C H P , H ( t ) / P C H P , E ( t ) κ C H P m a x ,
where PCHP,E(t) is the CHP unit’s electrical energy generated at time t; ηCHP,E is the CHP unit’s power utilization; PCHP,G(t) is the output electrical energy power of the CHP unit at a time t; PCHP,H(t) is the output thermal energy power of the CHP unit at a time t; ηCHP,H is the thermal efficiency of the CHP unit; P C H P , G m i n , P C H P , G m a x are the least and greatest natural gas power input limitations for the CHP unit; Δ P C H P , G m i n , Δ P C H P , G m a x are the creep power of the CHP unit’s lower and greater limits; κ C H P m i n , κ C H P m a x are the CHP unit’s configurable heat-to-electricity ratio’s bottom and top bounds.

2.1.6. Gas Boiler (GB)

Gas boilers complete this energy conversion process by burning fossil fuels and transmitting thermal power to the water in the boiler via radiant heat transfer or convective heat conduction.
PGB,H(t) = ηGBPGB,G(t),
P G B , G m i n P G B , G ( t ) P G B , G m a x
Δ P G B , G m i n P G B , G ( t + 1 ) P G B , G ( t ) Δ P G B , G m a x
where PGB,H(t) is the GB’s output thermal power at a time t, ηGB is the GB’s efficiency of energy conversion, PGB,G(t) is the input natural gas power of the GB at a time t, P G B , G m i n , P G B , G m a x are the lowest and maximum amounts of the input natural gas energy of the GB, and Δ P G B , G m i n , Δ P G B , G m a x are the lowest and maximum amounts of the climbing power of the GB.

2.1.7. Electric Boiler (EB)

Electric boilers use electrical energy to heat feed water, thus utilizing high energy conversion efficiency to transform great-grade electrical energy into poor-quality thermal energy.
PEB,H(t) = ηEB,EPEB,E(t)
P E B , E m i n P E B , E ( t ) P E B , E m a x
Δ P E B , E m i n P E B , E ( t + 1 ) P E B , E ( t ) Δ P E B , E m a x
where PEB,H(t) represents the thermal energy supply of the EB at a point t, ηEB,E is the EB’s energy conversion effectiveness, PEB,E(t) is the amount of electricity that the EB receives at point t, P E B , E m i n , P E B , E m a x are the electrical power input to the EB’s lowest and highest levels, and Δ P E B , E m i n , Δ P E B , E m a x are the EB’s climbing power’s lowest and highest levels.

2.1.8. Electric Chillers (EC)

The EC’s basic function is to use electric energy to power the compressor for refrigeration, which is effectively transformed into cold power to satisfy the system’s customers’ need for cold power [29].
PEC,C(t) = ηEC,EPEC,E(t)
P E C , E m i n P E C , E ( t ) P E C , E m a x
Δ P E C , E m i n P E C , C ( t + 1 ) P E C , C ( t ) Δ P E C , E m a x
where PEC,C(t) is the EC’s cold power output at point t, ηEC,E is the EC’s energy drilling conversion rate, PEC,E(t) represents the EC’s input electrical energy at point t and, P E C , E m i n , P E C , E m a x are the lowest and maximum electric power input restrictions set by the EC, Δ P E C , E m i n , Δ P E C , E m a x are the EC climbing power’s lowest and highest amounts.

2.1.9. Absorption Chiller (AC)

Absorption chillers are economical and ecological [30]. It uses heat as the input energy, and in addition to the heat generated by gas boilers and cogeneration units, it can also utilize poor-quality heat, such as waste heat.
PAC,C(t) = ηAC,HPAC,H(t)
P A C , H m i n P A C , H ( t ) P A C , H m a x
Δ P A C , H m i n P A C , H ( t + 1 ) P A C , H ( t ) Δ P A C , H m a x
where PAC,C(t) is the AC’s cooling power generation at point t, ηAC,H is the AC’s energy conversion effectiveness, PAC,H(t) is the AC’s thermal energy input at point t, P A C , H m i n , Δ P A C , H m a x are the AC’s smallest and largest constraints for cold power input, and Δ P A C , H m i n Δ P A C , H m a x are the AC’s climbing power’s lowest and highest levels.

2.1.10. Energy Storage Device

The energy device for storage for the IES established in this paper includes hydrogen storage equipment, heat storage equipment, cold storage equipment, and electricity storage equipment. It is considered that they work on the same principle.
Ei(t) = Ei(t−1)ηloss + Pi,in(t)ηi,inPi,out(t)/ηi,out
E i m i n E i ( t ) E i m a x
Ei(0) = Ei(24)
u i n ( t ) P i , i n m i n P i , i n ( t ) u o u t ( t ) P i , i n m i n
u o u t ( t ) P i , o u t m i n P i , o u t ( t ) u o u t ( t ) P i , o u t m a x
uin(t) + uout(t) 1
where Ei(t) is the energy storage device’s capacitance at point t, i denotes the hydrogen, electricity, cold, and heat storage equipment, ηloss is the hydrogen storing tank’s wasted energy coefficient. Pi,in(t), Pi,out(t) are the energy storage device’s ability to store and release energy at a time t, and ηi,in, ηi,out are the energy storage equipment’s efficiency in storing and releasing energy. E i m i n , E i m a x are the energy-storing devices with the smallest and largest capacity, and uin(t) and uout(t) are the binary variables that define the energy storage equipment’s ability to store and release energy at point t.

2.2. Carbon Emission Model

Carbon trading, additionally referred to as the emission of carbon trading, is a product of the carbon trading market, which is becoming more and more significant in addressing the challenge of global climate change by giving carbon emission rights a commodity attribute and allowing companies to buy or sell carbon emission rights, thereby achieving the goal of controlling emissions of carbon [31].
The following is a description of the carbon quota model:
E all = E e , buy + E G + E CHP + E GB E e , buy = χ e t = 1 T P e , buy ( t ) E G = χ e t = 1 T P G ( t ) E CHP = χ h t = 1 T σ e , h P CHP , e ( t ) + P CHP , h ( t ) E GB = χ h t = 1 T P GB , h ( t )
where χe and χe represent the amount of carbon credits obtained for each unit of heat and electricity produced; σe,h is the factor that converts the production of electricity into the production of thermal.
The real emissions of the carbon model used by the IES are shown below:
E all , a = E e , buy , a + E CHP , a + E GB , a + E G ( t ) E total , CO 2 E e , buy , a = δ e t = 1 T P e , buy ( t ) E CHP , a = δ h t = 1 T ( P CHP , e ( t ) + σ e , h P CHP , h ( t ) ) E G B , a = δ h t = 1 T P GB , h ( t )
where Eall,a, Ee,buy,a, ECHP,a, EGB,a is the real carbon releases from the IES, upper power grid, CHP, and GB, δe, δh are the carbon releases per unit of electricity and heat generated.
The carbon releases market is trading as follows:
Eall,c = Eall,aEall
where Eall,c is the amount of carbon release traded.
The conventional carbon exchange system has a fixed carbon trading base price, while the laddered carbon exchange system divides the carbon releases involved in trading into multiple intervals of the same span, each of which sets the corresponding carbon trading price, forming a laddered price into a laddered price, thus forming a closer relationship between the systematic carbon emissions and their corresponding transaction costs [32].
F C O 2 = λ ( 1 + 3 α ) ( E IES , c + 3 l ) λ ( 2 + 3 α ) l ,             E I E S , c < 2 l λ ( 1 + 2 α ) ( E IES , c + l ) λ ( 1 + α ) l ,     2 l < E IES , c < l λ ( 1 + α ) E IES , c ,                                                                       l < E IES , c < 0 λ E IES , c ,                                                                                                         0 < E IES , c < l λ ( 1 + α ) ( E IES , c l ) + λ l ,                                             l < E IES , c < 2 l λ ( 1 + 2 α ) ( E IES , c 2 l ) + λ ( 2 + α ) l ,           2 l < E IES , c < 3 l λ ( 1 + 3 α ) ( E IES , c 3 l ) + λ ( 3 + 3 α ) l ,       3 l < E IES , c < 4 l λ ( 1 + 4 α ) ( E IES , c 4 l ) + λ ( 4 + 6 α ) l ,       4 l < E IES , c
where FCO2 is the phased carbon trading price; l is a length of the gap between carbon releases; α is the rate of rising prices for trading in carbon; and λ is the basic price of the trading of carbon cost.

3. Objective Functions and Constraint Conditions

3.1. Objective Functions

Minimizing the total cost of energy acquisition, carbon sequestration, thermal unit startup and shutdown, energy abandonment penalty, and phased carbon trading is the goal.
minFrun = Fbuy + Ff + FG + Fre + FCO2,
where Frun is the total expense of running the system, Fbuy is the network price of electricity that was purchased, Ff is the carbon storage unit cost, FG is a start-stop cost of TPU, Fre is this network’s cost of WT and PV loss penalties, and FCO2 is the price of exchanging carbon.
The following is the price of acquiring energy:
F buy = t = 1 T c e ( t ) P e , b u y ( t ) + t = 1 T c g ( t ) P g , b u y ( t ) + t = 1 T ( a 1 P G ( t ) + b 1 P G ( t ) + c 1 U ( t ) )
where ce(t) and cg(t) are the time-of-day electricity and natural gas prices at a time t, Pe,buy(t), and Pg,buy(t) are the total amounts of electricity and gas purchased at point time, and a1, b1, and c1 are the thermal unit coal consumption factors.
The cost of carbon sequestration is as follows:
F f = t = 1 T F f ( t ) c f
where cf is the expense of storing carbon per unit.
The cost of starting and stopping thermal power units is as follows:
F G = t = 1 T U ( t ) ( 1 U ( t ) ) c u ,
where cu is the cost of starting and stopping the unit.
The cost of WT and PV loss is included in the penalty cost of energy abandonment, as follows:
F re = t = 1 T ( c WT ( P WT ( t ) P WTa ( t ) ) + c PV ( P PV ( t ) P PVa ( t ) ) ,
where cWT is the wind desertion penalty cost per unit and cPV is the amount of the light departure penalty per unit.

3.2. Constraint Conditions
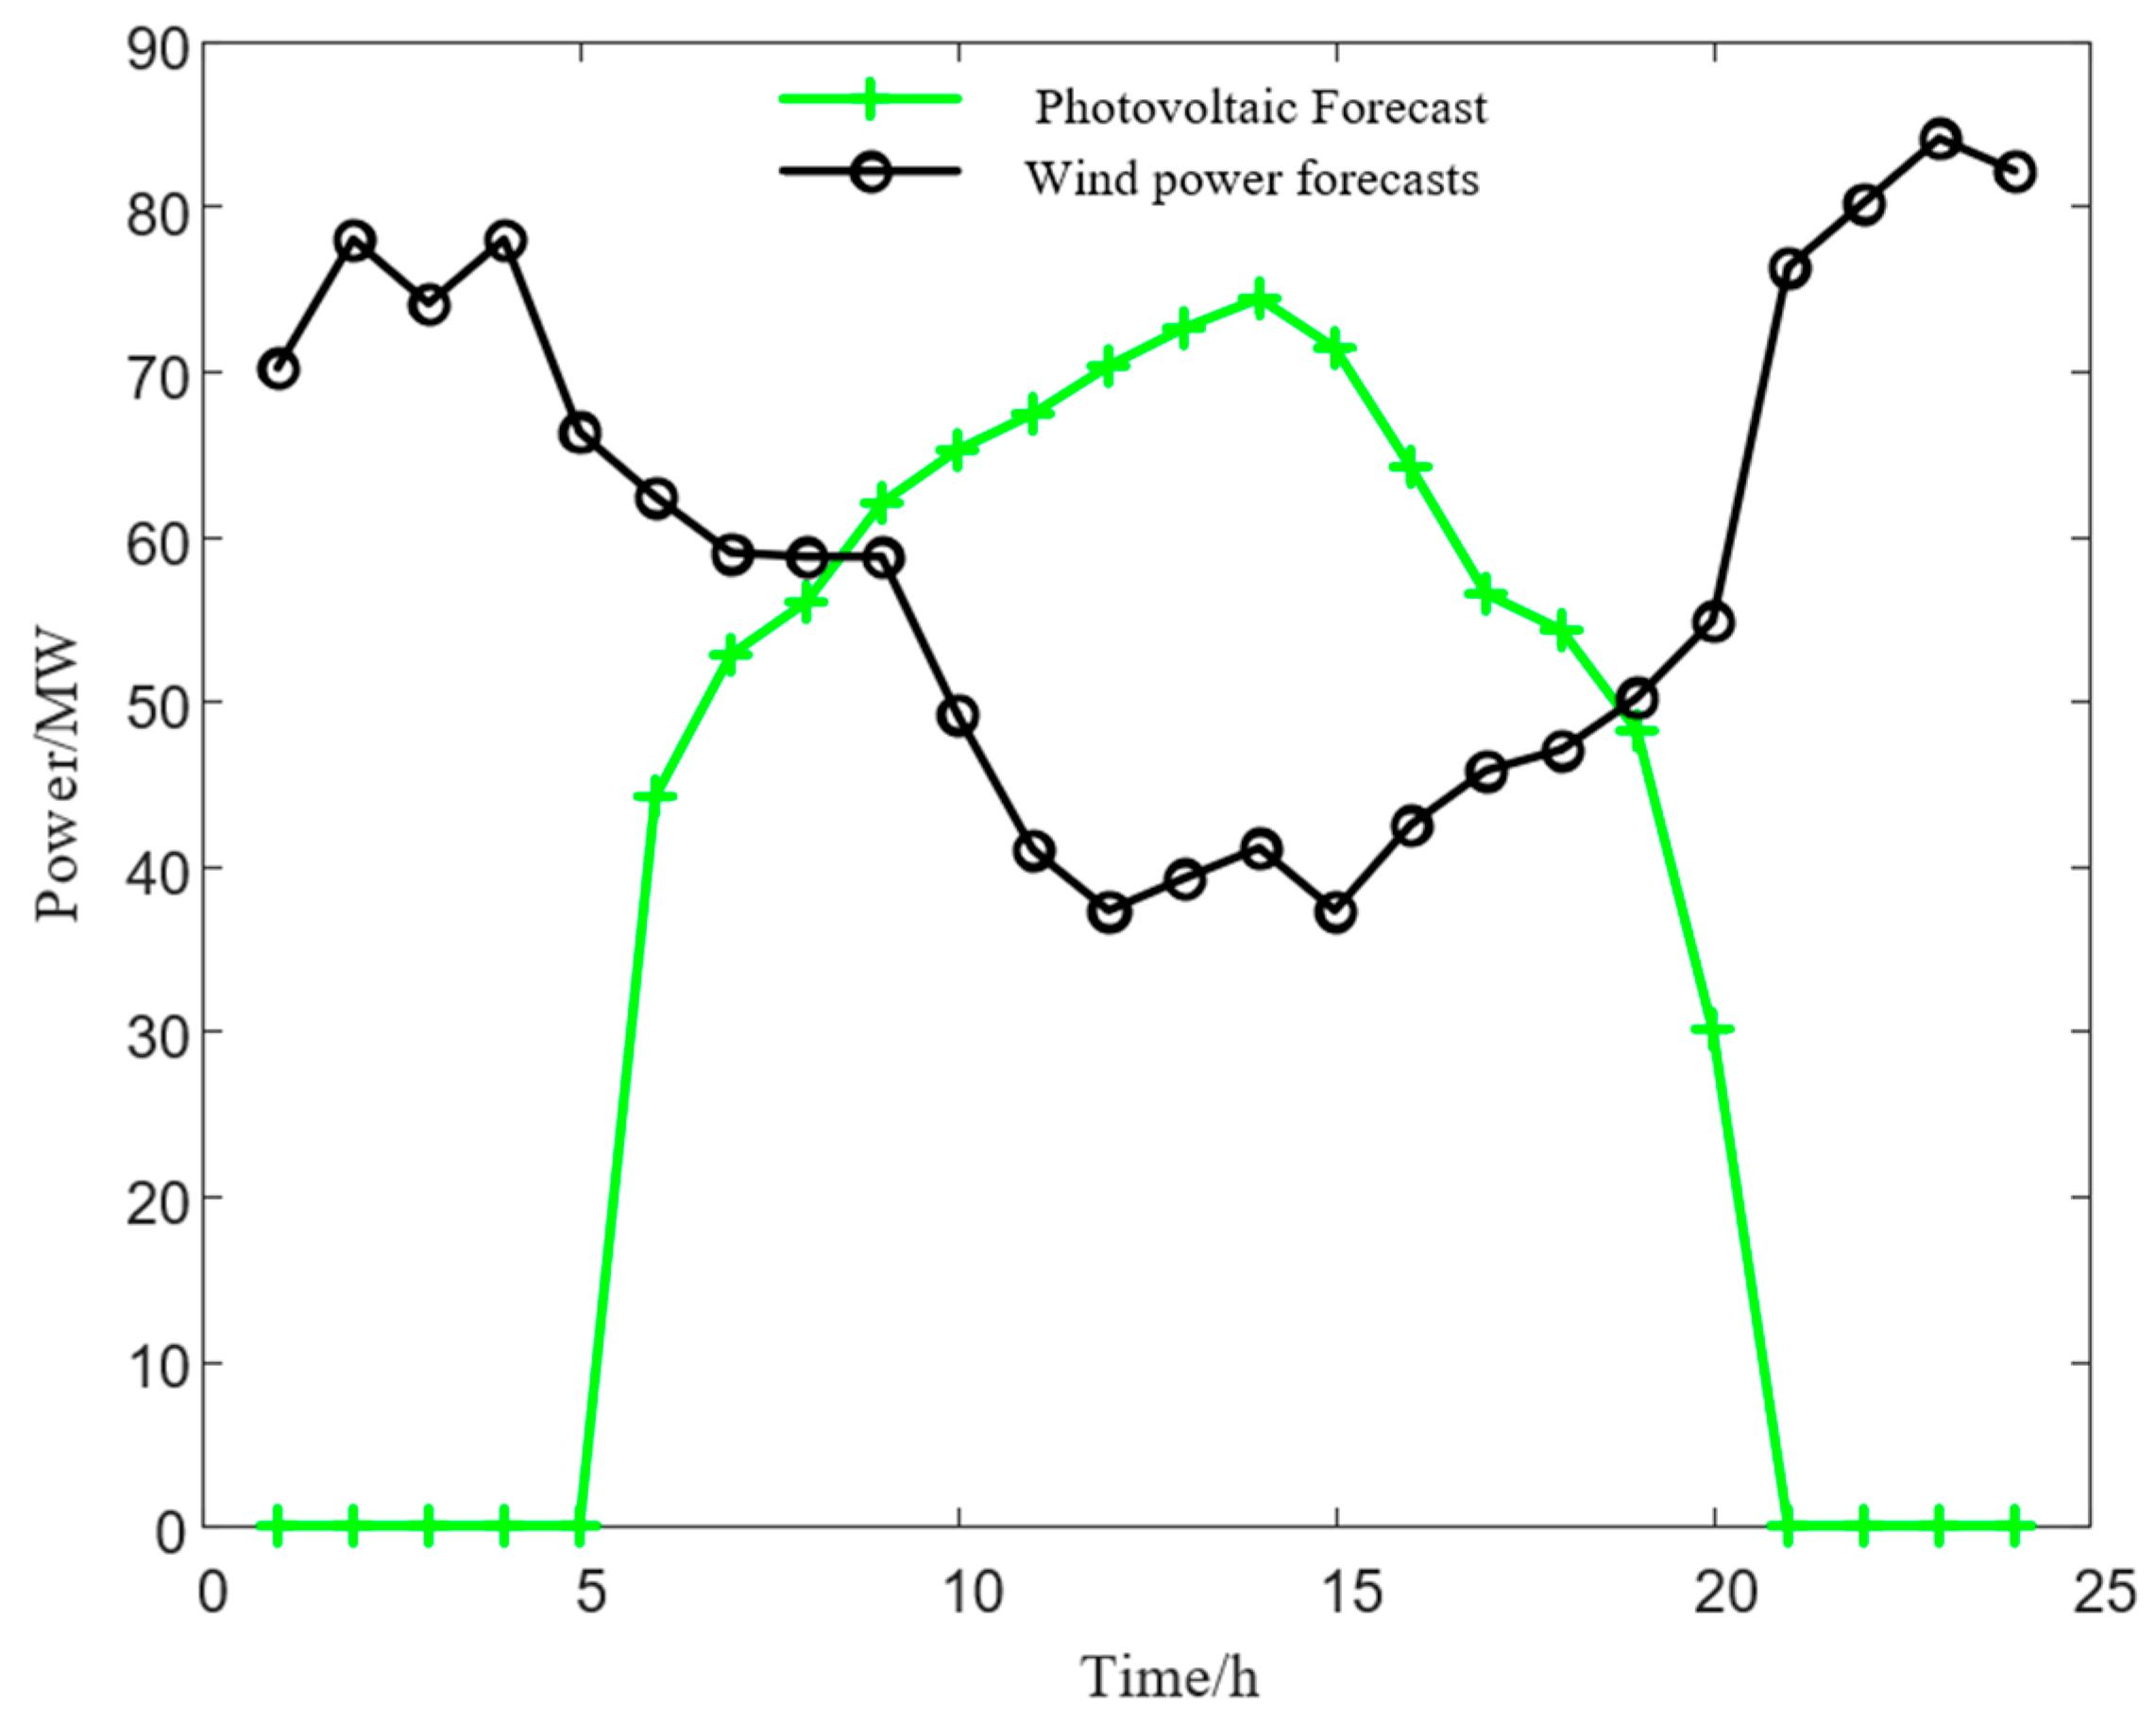
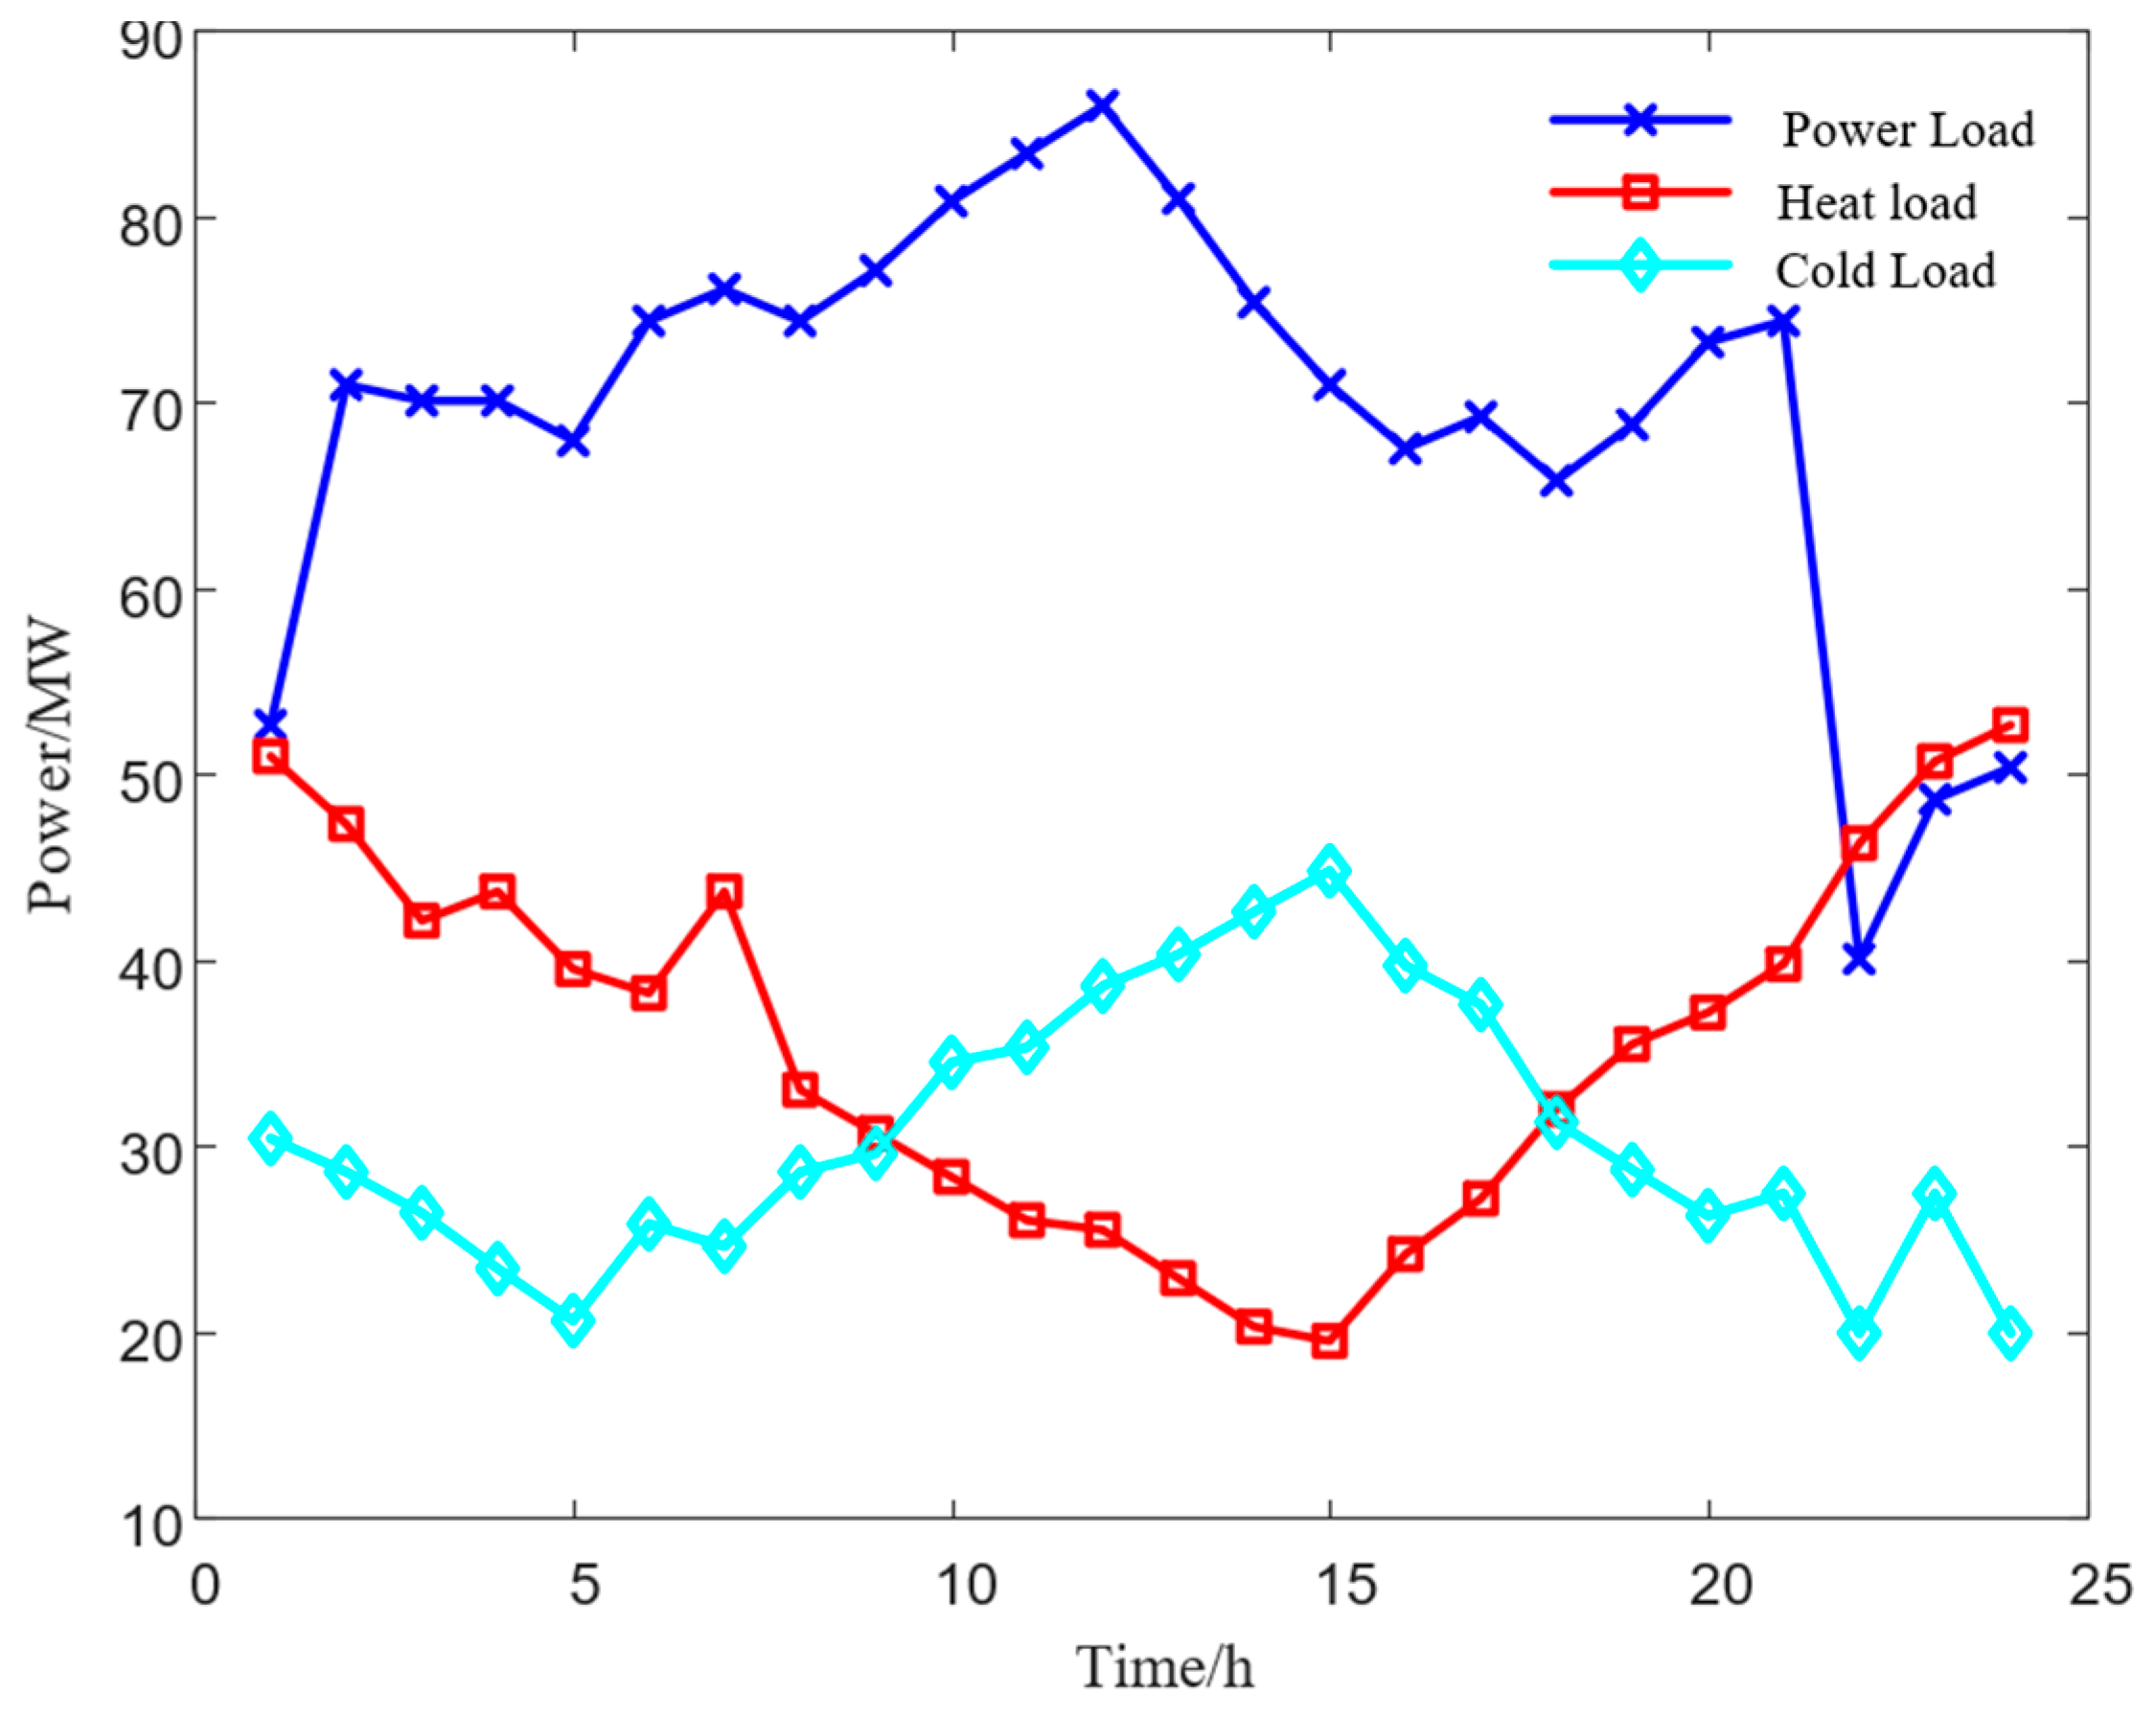
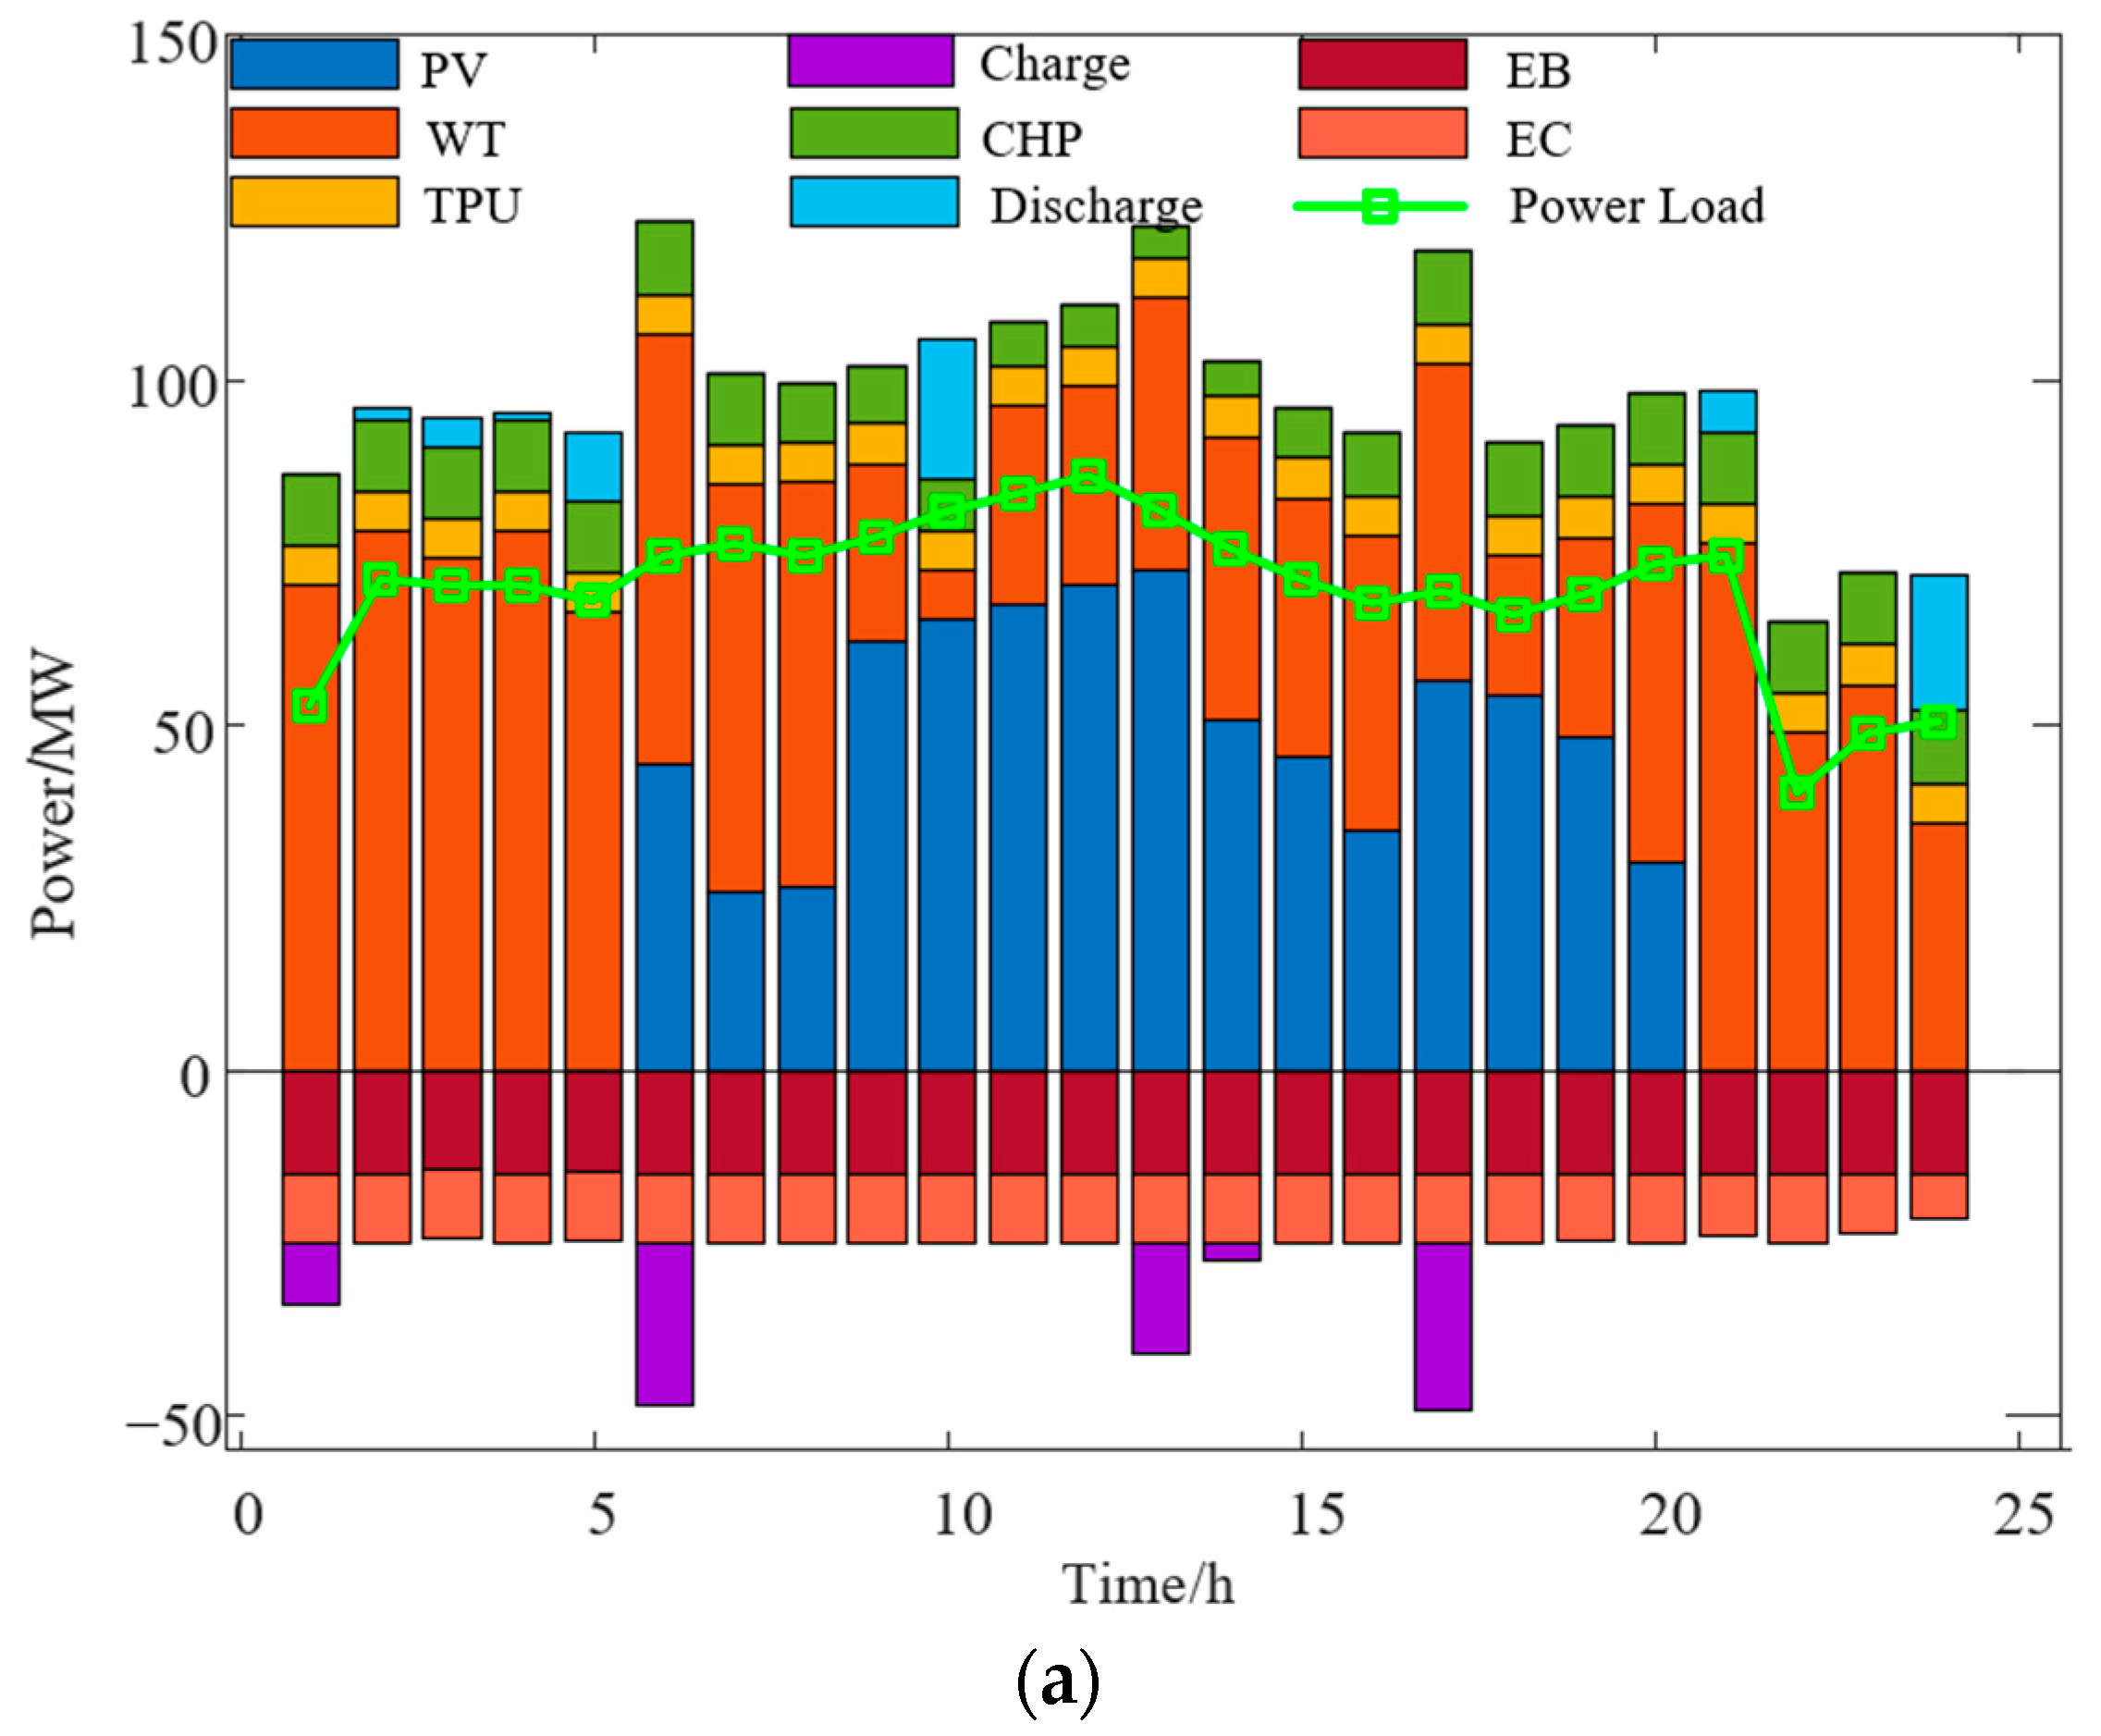
The maximum and minimum output thresholds and climbing power constraints of each energy conversion device of the system, as well as the energy-storing devices’ operational limitations, have already been covered in detail in Section 2 and will not be repeated here.
The following are the electric power equilibrium restrictions:
PE,load(t) = PPV(t) + PWT(t) + PJ(t) + Pequip,E(t) − PE,in(t)+ PE,out(t),
Pequip,E(t) = PHFC,E(t) − PEL,E(t) + PCHP,E(t) − PEB,E(t) − PEC,E(t)
The following are the thermal power equilibrium limitations:
PH,load(t) + PAC,H(t) + PH,in(t) = PCHP,H(t) + PGB,H(t) + PEB,H(t) + PH,out(t),
The gas power equilibrium constraints are as follows:
PG,buy(t) + PMR,G(t) + PG,out(t) = PCHP,G(t) + PGB,G(t) + PG,in(t),
The cold power equilibrium constraints are as follows:
PC,load(t) + PC,in(t) = PEC,C(t) + PAC,C(t) + PC,out(t),
The hydrogen power equilibrium constraints are as follows:
PEL,H2(t) + PH2,out(t) = PHFC,H2(t) + PMR,H2(t) + PH2,in(t),
The wind and solar output constraints are as follows:
0 P w i n d P W i n d m a x
0 P P V P P V m a x
where PWind is the WT’s output power, P W i n d m a x is the maximum output power of the WT, PPV is the energy that the solar power system produces, and P P V m a x is the maximum output power of the solar power generation.

4. Case Study

Basic Data

To confirm that the IES scheduling model developed in this paper is accurate, in this work, a park is chosen as the research site. The integrated energy system (IES) optimization dispatch model was implemented in MATLAB R2021b and executed on a computer equipped with an AMD Ryzen 7-4800U processor (Santa Clara, CA, USA) and 16 GB of RAM. The carbon trading mechanism cost was optimized using the Big-M method, rendering the problem a mixed-integer linear programming (MILP) formulation. The model was solved via the MATLAB R2021b/CPLEX 12.10.0 interface with the CPLEX solver, achieving a computational runtime of 0.670 s. Consider a 24-h day as the scheduling period, with an hourly scheduling step. Table 1 lists the basic parameters of the system. Table 2 lists the time-of-day tariffs for the system. Table 3 shows the three modes of operation of the system. Figure 2 illustrates the projected output of wind and photovoltaic installations in the park. Figure 3 shows the forecast load data for electricity, heat and cooling in the park.
Table 4 compares the results of the optimal scheduling of the amount of renewable energy used by the system, operating costs, and CO2 emissions for the three cases.
Case 1 ignores the electric and gas connecting equipment or carbon trading; the system running cost is CNY 312,737.89, and CO2 emission is 159.45 t. Case 2 considers the electric and gas coupling equipment and does not consider carbon trading; the system running cost is CNY 186,047.03, CO2 emission is 133.00 t, the clean energy utilization rate reaches 100%, and the IES inputs the remaining solar and wind energy into the electric-hydrogen coupling equipment to achieve full utilization of clean energy. In case 3, the operating cost of the system is CNY 129,423.99, and the CO2 emission is 104.65 t.
Figure 4 shows the electrical power equilibrium diagrams for the three cases. All three cases are mainly supplied by the WT to the system during the nighttime scheduling period, as the PV units are not working. During the daytime, wind and solar units are combined to produce power, and thermal units, cogeneration units, and storage devices take on the role of in-system peaking. EB and EC employ electrical energy to generate heat and cold energy to power the load at the customer’s location.
It is evident from comparing Cases 1 and 2 that Case 1 lacks a hydrogen-coupled unit, the PV power generation can not be better utilized in the period of 6:00–20:00, and the phenomenon of light abandonment is more serious, and the CHP unit is more out of power, which raises the system’s release of carbon. Following the fitting of P2G equipment and fuel cells into the system, the electrolyzer consumes surplus electrical energy to produce hydrogen, which makes better use of wind and light resources, and the system output is smoother, which plays the role of leveling the power load, thus facilitating the integration of large-scale renewable energy sources into the grid.
It is obvious when comparing Cases 2 and 3 that the electricity system is less affected by the implementation of phased trading of carbon. Firstly, the system reduces the output of CHP units while increasing the output of EB, thus reducing the use of natural gas and lowering the carbon emissions of the system.
In summary, from an economic standpoint, the two-stage refined modeling of the traditional electricity-to-gas equipment, followed by the introduction of HFC tanks for storing hydrogen and other apparatus, enables the hydrogen-coupled equipment to work independently, with more flexible operation and improved use of WT energy production. On the flip side, carbon dioxide from carbon capture plants is fed into MR to generate natural gas, which lowers the amount of natural gas purchased and thus the cost of purchased energy. From the perspective of the environment, HFC can use hydrogen energy to power the system, thus reducing the output of CHP units and GB, thus reducing the carbon emissions of the system.
Figure 5 displays the thermodynamic equilibrium diagrams for all three circumstances. Within the heating system, extra heat energy is stored by the heat storage apparatus during the daytime heat consumption trough time and is used for the nighttime peak period, which plays the role of system peak. AC converts heat energy into cold energy, which is delivered to the cooling system for use.
A comparison between Case 1 and Case 2 can be obtained. The system guarantees the lowest possible operational expenses, so after the introduction of hydrogen energy electrolysis tanks to dissipate the excess power, one of the uses of methanation equipment is to generate gas from natural sources, lowering the quantity of natural gas that is bought and lowering the energy expenses of the system. Excess wind energy is converted into hydrogen in this method; thus, it is a low-carbon operation. Secondly, part of the hydrogen produced is utilized by the HFC to generate electricity and heat, thus reducing the output of the CHP unit, which in turn reduces the amount of gas purchased and lowers the cost of purchasing coal and natural gas. Thirdly, the hydrogen produced in the electrolysis tank consumes a significant quantity of electrical energy, reducing the input electrical energy of the electric boiler.
A comparison between Case 2 and Case 3 can be obtained via the market for the trading of carbon. To further minimize the system’s release of carbon, the system first reduces the output of the cogeneration unit and chooses to prioritize the use of electric power equipment; in other words, the electric boiler’s output is raised, thus lowering the system’s release of carbon. In this process, the CHP unit minimizes heat output and thus reduces the system’s gas use, while the electrolyzer reduces its output.
Figure 6 depicts the cold equilibrium of power for all three cases. The electric refrigerator has a high energy conversion efficiency and therefore undertakes the main task of supplying cold to the users. Whenever the electric chiller hits its maximum power limit, the hydrogen storage tank starts to discharge the cold and performs in-system peak shifting together with the absorption refrigeration equipment. During the low peak hours, the hydrogen storage tanks store energy and realize the transfer of cold energy across time.
A comparison of Case 1 and Case 2 shows that the electric chillers are basically at full capacity to satisfy the user’s cold energy requirement. The storage tanks are not enough to fulfill peak energy consumption, so absorption refrigeration equipment is introduced to supply the system during peak hours.
Case 2 compared with Case 3 can be obtained, in the 2:00–3:00 time period, in the system of cooling in the trough section of the system for the discharge of energy. This is due to the fan, as the main source of power for equipment, solar generation, failing to operate out of power, resulting in the system power supply being tense. At this time, the electric chiller of the electric power transfer to other power-using equipment. Case 3 peak shifting is mainly met by absorption refrigeration equipment. This is due to the starting time of the day, when only the fan works to generate electricity. At this time, the system is in the tension of electricity, and in the cold peak hours, overlapping with the heat of the trough section, photovoltaic power generation and wind power generation synergistic power, thermal energy output, can be through the absorption refrigeration machine for the system to provide cold power and meet the needs for the cold load.

5. Conclusions

This study aims to enhance the capacity of the utilization of renewable energy and promote the power source carbon-neutral economic development of the energy system. By coupling electricity-heat-gas-cooling-hydrogen and other resources as a whole and integrating with the stepwise trading of carbon mechanism, an ideal scheduling model for the cooperative operation of power and heat units, electrolysis tanks, hydrogen fuel cells, and energy storage devices is established. Based on the numerical simulation study, the following results are drawn:
  • The traditional P2G equipment is refined into two parts: an electrolyzer and an MR, and an HFC is introduced to reduce carbon emissions by utilizing the CO2 produced by the system while promoting wind energy consumption. Through arithmetic simulation, the renewable energy consumption rate is increased from 83.16% to 100%, and the carbon emission is reduced from 159.45 tonnes to 133 tonnes.
  • Introduced a phased carbon trading mechanism to minimize emissions by adjusting the output of each part of the system, in which the penalty and reward mechanism of the market for trading in carbon can guide participants to prioritize the use of energy with minimal environmental impact, and the data reveal that the system’s releases of carbon have been decreased from 133 tonnes to 104.65 tonnes after implementing into consideration the phased trading of carbon.
This study focuses on the low-carbon and economic aspects of integrated energy system (IES) operation, specifically examining operational costs while excluding lifecycle investment cost considerations. The research scope encompasses generation-side and grid-side operational strategies, with load-side scheduling mechanisms remaining beyond current investigation. Building upon these foundational findings, subsequent research should incorporate demand response mechanisms to achieve synergistic optimization of system efficiency and sustainability objectives.

Author Contributions

Conceptualization, Z.Z.; Data curation, Z.Z. and J.B.; Formal analysis, J.B.; Funding acquisition, W.L. and X.R.; Investigation, Z.Z. and W.L.; Methodology, W.L. and J.B.; Project administration, Z.Z., J.B. and X.R.; Supervision, J.B. and X.R.; Validation, Z.Z. and W.L.; Visualization, X.R.; Writing—original draft, Z.Z. and X.R.; Writing—review and editing, W.L. All authors have read and agreed to the published version of the manuscript.

Funding

This research was funded by Science and Technology Project of State Grid Corporation of China (Research on the optimal planning and realization path of new power system construction in Urumqi, No. SGXJ0000FCJS2400101).

Data Availability Statement

The original contributions presented in this study are included in the article. Further inquiries can be directed to the corresponding author.

Conflicts of Interest

Author Zhuan Zhou was employed by the company State Grid Xinjiang Electric Power Co., Ltd. The remaining authors declare that the research was conducted in the absence of any commercial or financial relationships that could be construed as a potential conflict of interest.

Abbreviations

IESintegrated energy systemACabsorption chiller
CHPcombined heat and powerELelectrolyzer
PVphotovoltaicHFChydrogen fuel cell
WTwind turbineMRmethane reactor
TPUthermal power unitESelectricity storage
GBgas boilerH2Shydrogen storage
EBelectric boilerHSheat storage
ECelectric chillerCScold storage
P2Gpower-to-gasMILPmixed-integer linear programming

References

  1. Cheng, Y.; Liu, M.; Chen, H.; Yang, Z. Optimization of multi-carrier energy system based on new operation mechanism modelling of power-to-gas integrated with CO2-based electrothermal energy storage. Energy 2021, 216, 119269. [Google Scholar] [CrossRef]
  2. Chattopadhyay, A.; Witmer, A.-P.; Sauer, P.W. The Need for Teaching Place-Based Contextualization for Sustainable Power System Infrastructure Design. IEEE Trans. Power Syst. 2021, 36, 5846–5853. [Google Scholar] [CrossRef]
  3. Rabbi, M.F.; Popp, J.; Mate, D.; Kovacs, S. Energy Security and Energy Transition to Achieve Carbon Neutrality. Energies 2022, 15, 8126. [Google Scholar] [CrossRef]
  4. Gu, W.; Wang, Z.; Wu, Z.; Luo, Z.; Tang, Y.; Wang, J. An Online Optimal Dispatch Schedule for CCHP Microgrids Based on Model Predictive Control. IEEE Trans. Smart Grid 2017, 8, 2332–2342. [Google Scholar] [CrossRef]
  5. Qin, C.; Zhao, J.; Chen, L.; Liu, Y.; Wang, W. An adaptive piecewise linearized weighted directed graph for the modeling and operational optimization of integrated energy systems. Energy 2022, 244, 122616. [Google Scholar] [CrossRef]
  6. Wang, Y.; Wang, Y.; Huang, Y.; Yu, H.; Du, R.; Zhang, F.; Zhang, F.; Zhu, J. Optimal Scheduling of the Regional Integrated Energy System Considering Economy and Environment. IEEE Trans. Sustain. Energy 2019, 10, 1939–1949. [Google Scholar] [CrossRef]
  7. Zhang, J.; Kong, X.; Shen, J.; Sun, L. Day-ahead optimal scheduling of a standalone solar-wind-gas based integrated energy system with and without considering thermal inertia and user comfort. J. Energy Storage 2023, 57, 106187. [Google Scholar] [CrossRef]
  8. Ge, L.; Zhang, B.; Huang, W.; Li, Y.; Hou, L.; Xiao, J.; Mao, Z.; Li, X. A review of hydrogen generation, storage, and applications in power system. J. Energy Storage 2024, 75, 109307. [Google Scholar] [CrossRef]
  9. Laimon, M.; Yusaf, T. Towards energy freedom: Exploring sustainable solutions for energy independence and self-sufficiency using integrated renewable energy-driven hydrogen system. Renew. Energy 2024, 222, 119948. [Google Scholar] [CrossRef]
  10. Chen, Z.; Zhang, Y.; Ji, T.; Cai, Z.; Li, L.; Xu, Z. Coordinated optimal dispatch and market equilibrium of integrated electric power and natural gas networks with P2G embedded. J. Mod. Power Syst. Clean Energy 2018, 6, 495–508. [Google Scholar] [CrossRef]
  11. Walker, S.B.; van Lanen, D.; Fowler, M.; Mukherjee, U. Economic analysis with respect to Power-to-Gas energy storage with consideration of various market mechanisms. Int. J. Hydrogen Energy 2016, 41, 7754–7765. [Google Scholar] [CrossRef]
  12. Guandalini, G.; Campanari, S.; Romano, M.C. Power-to-gas plants and gas turbines for improved wind energy dispatchability: Energy and economic assessment. Appl. Energy 2015, 147, 117–130. [Google Scholar] [CrossRef]
  13. Wang, S.; Wang, S.; Zhao, Q.; Dong, S.; Li, H. Optimal dispatch of integrated energy station considering carbon capture and hydrogen demand. Energy 2023, 269, 126981. [Google Scholar] [CrossRef]
  14. Chen, M.; Lu, H.; Chang, X.; Liao, H. An optimization on an integrated energy system of combined heat and power, carbon capture system and power to gas by considering flexible load. Energy 2023, 273, 127203. [Google Scholar] [CrossRef]
  15. Pan, C.; Jin, T.; Li, N.; Wang, G.; Hou, X.; Gu, Y. Multi-objective and two-stage optimization study of integrated energy systems considering P2G and integrated demand responses. Energy 2023, 270, 126846. [Google Scholar] [CrossRef]
  16. Zeng, Z.; Ding, T.; Xu, Y.; Yang, Y.; Dong, Z. Reliability Evaluation for Integrated Power-Gas Systems with Power-to-Gas and Gas Storages. IEEE Trans. Power Syst. 2020, 35, 571–583. [Google Scholar] [CrossRef]
  17. Ma, Y.; Wang, H.; Hong, F.; Yang, J.; Chen, Z.; Cui, H.; Feng, J. Modeling and optimization of combined heat and power with power-to-gas and carbon capture system in integrated energy system. Energy 2021, 236, 121392. [Google Scholar] [CrossRef]
  18. Wang, Y.; Wang, Y.; Huang, Y.; Yang, J.; Ma, Y.; Yu, H.; Zeng, M.; Zhang, F.; Zhang, Y. Operation optimization of regional integrated energy system based on the modeling of electricity-thermal-natural gas network. Appl. Energy 2019, 251, 113410. [Google Scholar] [CrossRef]
  19. Lu, Z.; Bai, L.; Wang, J.; Wei, J.; Xiao, Y.; Chen, Y. Peer-to-Peer Joint Electricity and Carbon Trading Based on Carbon-Aware Distribution Locational Marginal Pricing. IEEE Trans. Power Syst. 2023, 38, 835–852. [Google Scholar] [CrossRef]
  20. Song, M.; Zheng, H.; Shen, Z. Whether the carbon emissions trading system improves energy efficiency-Empirical testing based on China’s provincial panel data. Energy 2023, 275, 127465. [Google Scholar] [CrossRef]
  21. Chen, X.; Lin, B. Towards carbon neutrality by implementing carbon emissions trading scheme: Policy evaluation in China. Energy Policy 2021, 157, 112510. [Google Scholar] [CrossRef]
  22. Zhang, J.; Liu, Z. Low carbon economic scheduling model for a park integrated energy system considering integrated demand response, ladder-type carbon trading and fine utilization of hydrogen. Energy 2024, 290, 130311. [Google Scholar] [CrossRef]
  23. Mochi, P.; Espegren, K.A.; Korpas, M. Short communication: Local electricity-hydrogen market. Int. J. Hydrogen Energy 2025, 116, 17–22. [Google Scholar] [CrossRef]
  24. Li, Y.; Bu, F.; Gao, J.; Li, G. Optimal dispatch of low-carbon integrated energy system considering nuclear heating and carbon trading. J. Clean Prod. 2022, 378, 134540. [Google Scholar] [CrossRef]
  25. Turner, J.; Sverdrup, G.; Mann, M.K.; Maness, P.-C.; Kroposki, B.; Ghirardi, M.; Evans, R.J.; Blake, D. Renewable hydrogen production. Int. J. Energy Res. 2008, 32, 379–407. [Google Scholar] [CrossRef]
  26. Mulky, L.; Srivastava, S.; Lakshmi, T.; Sandadi, E.R.; Gour, S.; Thomas, N.A.; Priya, S.S.; Sudhakar, K. An overview of hydrogen storage technologies—Key challenges and opportunities. Mater. Chem. Phys. 2024, 325, 129710. [Google Scholar] [CrossRef]
  27. Olabi, A.G.; Sayed, E.T. Developments in Hydrogen Fuel Cells. Energies 2023, 16, 2431. [Google Scholar] [CrossRef]
  28. Cui, Y.; Zeng, P.; Hui, X.; Li, H.; Zhao, J. Low-carbon Economic Dispatch Considering the Integrated Flexible Operation Mode of Carbon Capture Power Plant. Power Syst. Technol. 2021, 45, 1877–1885. [Google Scholar]
  29. Deng, Y.; Zeng, R.; Liu, Y. A novel off-design model to optimize combined cooling, heating and power system with hybrid chillers for different operation strategies. Energy 2022, 239, 122085. [Google Scholar] [CrossRef]
  30. Liu, M.; Cheng, Y.; Cheng, W.; Zhan, C. Dynamic performance analysis of a solar driving absorption chiller integrated with absorption thermal energy storage. Energy Conv. Manag. 2021, 247, 114769. [Google Scholar] [CrossRef]
  31. Shi, B.; Li, N.; Gao, Q.; Li, G. Market incentives, carbon quota allocation and carbon emission reduction: Evidence from China’s carbon trading pilot policy. J. Environ. Manag. 2022, 319, 115650. [Google Scholar] [CrossRef]
  32. Yang, C.; Dong, X.; Wang, G.; Lv, D.; Gu, R.; Lei, Y. Low-carbon economic dispatch of integrated energy system with CCS-P2G-CHP. Energy Rep. 2024, 12, 42–51. [Google Scholar] [CrossRef]
  33. Zhu, G.; Gao, Y. Multi-objective optimal scheduling of an integrated energy system under the multi-time scale ladder-type carbon trading mechanism. J. Clean Prod. 2023, 417, 137922. [Google Scholar] [CrossRef]
Figure 1. An IES structural diagram in the park.
Energies 18 02249 g001
Figure 2. Forecast output of wind and photovoltaics.
Energies 18 02249 g002
Figure 3. Load forecast in the park.
Energies 18 02249 g003
Figure 4. The electric power equilibrium. (a) The electric power equilibrium in Case 1; (b) the electric power equilibrium in Case 2; (c) the electric power equilibrium in Case 3.
Energies 18 02249 g004aEnergies 18 02249 g004b
Figure 5. The heat power equilibrium. (a) The heat power equilibrium in Case 1; (b) the heat power equilibrium in Case 2; (c) the heat power equilibrium in Case 3.
Energies 18 02249 g005aEnergies 18 02249 g005b
Figure 6. The cold power equilibrium. (a) The cold power equilibrium in Case 1; (b) the cold power equilibrium in Case 2; (c) the cold power equilibrium in Case 3.
Energies 18 02249 g006
Table 1. Model parameters.
ParametersValuesParametersValues
ηEL [22]0.87 P E L , E m i n 0 MW
P E L , E m a x 40 MWΔ P E L , E m i n −8 MW
Δ P E L , E m a x 8 MWηHFC,E0.87
P H F C , E m a x 15 MW P H F C , H 2 m i n 0 MW
Δ P H F C , E m a x 3 MWΔ P H F C , H 2 m i n −3 MW
κ H F C , H 2 m a x 1.2 κ H F C , H 2 m i n 0.5
P M R , H 2 m i n 0 MWηMR0.7 [22]
Δ P M R , H 2 m i n −4 MW P M R , H 2 m a x 20 MW
eg [28]1 (t/MW·h)Δ P M R , H 2 m a x 4 MW
β [28]0.9δ [28]0.8
ε [28]0.269 ((MW·h)/t)η [28]1.05
P G m i n 10 MWPD2 MW
Δ P G m i n −60 P G m a x 55 MW
P C H P , H 2 m i n 0 MWΔ P G m a x 60 MW
Δ P C H P , H 2 m i n −4 MW P C H P , E m a x 20 MW
κ C H P , H 2 m i n 0.5Δ P C H P , E m a x −4 MW
ηGB [22]0.9 κ C H P , H 2 m a x 1.8
P G B , B m a x 15 MW P G B , G m i n 0 MW
Δ P G B , B m a x 3 MWΔ P G B , G m i n −3 MW
P E B , E m i n 0 MWηEB,E0.99
Δ P E B , E m i n −3 MW P E B , E m a x 15 MW
ηEC,E [22]3Δ P E B , E m a x 3 MW
P E C , E m a x 10 MW P E C , E m i n 0 MW
Δ P E C , E m a x 2 MWΔ P E C , E m i n −2 MW
P A C , H m i n 0 MWηAC,H1.8
Δ P A C , H m i n −6 MW P A C , H m a x 15 MW
Δ P A C , H m a x 6 MWl200 t
λ [33]250 RMB/tα [33]0.25
ηi,in [22]0.95ηi,in [22]0.95
ηloss [15]0.01βcc [14]1.02
Table 2. Electricity costs vary depending on when it is used.
TypeTime (h)Price (RMB/MWh)
Peak data8:00–11:001000
19:00–24:00
Off-peak data11:00–13:00810
17:00–19:00
0:00–4:00
Valley data4:00–8:00670
13:00–17:00
Table 3. Case settings.
CaseCondition
Case 1An IES do not take into account carbon trading and hydrogen participation
Case 2An IES consider hydrogen participation based on case 1
Case 3An IES consider stepped carbon trading based on case 2
Table 4. Scheduling results of each case.
CaseRenewable Energy Consumption/%Cost/RMBCarbon Emissions/t
183.16%312,737.89159.45
2100.00%186,047.03133.00
3100.00%129,423.99104.65
Disclaimer/Publisher’s Note: The statements, opinions and data contained in all publications are solely those of the individual author(s) and contributor(s) and not of MDPI and/or the editor(s). MDPI and/or the editor(s) disclaim responsibility for any injury to people or property resulting from any ideas, methods, instructions or products referred to in the content.

