Article

CO2 Geothermal Power Generation: Laboratory Experiment on the Interaction Between Carbonated Water and Rishiri Island Basalt in the Vicinity of Injection Wells

1
Graduate School of Sustainability Studies for Research, University of Toyama, Gofuku 3190, Toyama 930-8555, Japan
2
Department of Natural and Environmental Sciences, Faculty of Science, Academic Assembly, University of Toyama, Gofuku 3190, Toyama 930-8555, Japan
3
Blue Earth Security, 3-1-3 Hatchobori, Chuo-ku, Tokyo 104-003, Japan
4
Technical Center, Taisei Corporation, 344-1 Naze, Tozuka, Yokohama, Kanagawa 245-0051, Japan
5
Japan Organization for Metals and Energy Security (JOGMEC), 2-10-1 Toranomon, Tokyo 150-0001, Japan
*
Author to whom correspondence should be addressed.
Energies 2025, 18(9), 2251; https://doi.org/10.3390/en18092251
Submission received: 23 March 2025 / Revised: 16 April 2025 / Accepted: 20 April 2025 / Published: 28 April 2025
(This article belongs to the Section H2: Geothermal)

Abstract

Novel geothermal power generation systems are being developed that use supercritical CO2 as the heat transfer medium. In this technology, some CO2 injected into the underground reacts with surrounding water and rocks to form secondary minerals, such as carbonate minerals and clay minerals; however, the reaction mechanism in the vicinity of the injection well, the subject of this study, has not been clarified. As the first laboratory test, Rishiri Island basalt was reacted with distilled water at 250 °C for 15 days at four different CO2 concentrations to investigate the difference in reaction depending on the CO2 concentration. Na, K and Ca increased rapidly until 5 days of the reaction, with higher values at higher CO2 concentrations; Mg showed characteristic behavior with higher values in the test without CO2 (using Ar gas). The saturation index of each secondary mineral was calculated, and it was found that carbonate minerals were unsaturated and clay minerals, such as smectite, were supersaturated under all test conditions, which was in agreement with the experimental results. It is concluded that a small amount of clay minerals was formed in this test due to the low pH of the reaction solution caused by the high CO2 concentration, indicating that dissolution was the main reaction for the rocks in the vicinity of the injection well.

1. Introduction

The Japanese government has set a carbon neutral policy to reduce CO2 emissions to zero by 2050 [1,2]. An important aspect of achieving this goal is renewable energy, of which geothermal power generation is attracting attention. The geothermal power generation potential of Japan is estimated to be approximately 20,000 MW, which could provide 20% of the country’s electricity; however, current geothermal power generation is only 530 MW (0.3% of the domestic electricity consumption) [3]. One of the reasons for the limited geothermal power generation is that most geothermal wells are drilled in high-temperature areas where there is no geothermal fluid. Although tests to inject water into high-temperature rock bodies from injection wells and gush out geothermal water at production wells have been conducted in Japan, this has not yet been put to practical use due to low water recovery rates and other reasons [4,5].
As a national policy, CO2 geothermal power generation, in which supercritical CO2 is injected into a geothermal reservoir and heated CO2 fluid is extracted from the production well to turn a turbine, has been proposed as a new power generation method for this unused geothermal resource [6,7]. CO2 has a lower boiling point than water and becomes a supercritical fluid under low temperature and low pressure conditions, which can contribute to expanding the power generation area and improving power generation efficiency [8,9,10]. In recent years, the development of such CO2-EGS has been considered worldwide [11,12,13,14]. However, there are no examples of practical applications yet. In addition, the dissolution of supercritical CO2 into existing geothermal fluids and the behavior of the produced carbonated water when injected into geothermal reservoirs are still unknown.
The injection of supercritical CO2 fluid into the subsurface has been reported to create fractures in the rock at elevated temperatures, creating new fluid flow paths [15,16]. This is an effective technique for CO2-EGS because the newly formed fracture provides a flow path for the CO2 fluid. In addition, a portion of the injected CO2 dissolves into the surrounding groundwater, producing acidic carbonated water. When this fluid reacts with the rock, several components, such as Ca2+, Mg2+, and Fe2+, are leached from the rock and eventually precipitate as carbonate and clay minerals. These carbonate and clay minerals form artificial caprock-like impermeable layers to prevent the deviation of CO2 fluid injected into the production well and increase the recovery rate (Georeactors) [17,18]. However, if precipitation of carbonate minerals and other substances is accelerated in the vicinity of the injection well, the permeability of the formation may rapidly decrease, making it impossible to inject CO2 fluid. This would be the same phenomenon as the reduction of brine reinjection rate due to precipitation of silica at scale at a geothermal power plant [19].
The purpose of this study is to determine what kind of water quality changes and what kind of minerals are precipitated around injection wells, especially carbonate minerals, when a portion of supercritical CO2 injected underground is dissolved in the geothermal fluid and reacts with rocks. This study is the result of the first rock–CO2–water reaction experiment in the CO2 geothermal power project, and the reaction time was set at 15 d to discuss the initial reaction when CO2–water comes into contact with rocks around the injection well. Several studies on the interaction of carbonated water with rocks at higher temperatures have been reported [20,21,22]. These experiments were conducted primarily with basalt glass, a rock with fine grains of 0.1 mm or less, to facilitate the reaction of CO2 with water. The idea is to study the conditions under which carbonated water is initially acidic; however, as the reaction with the rock progresses, it becomes nearly neutral and carbonate minerals precipitate. In contrast, the rock grains used in this study were 1–2 mm in size, and the reaction vessel was slowly rotated at 1 rpm to mimic the conditions around the reduction well. At higher temperatures, carbonated water and rocks react quickly, and carbonate minerals with low solubility are produced [23]. Therefore, when CO2 is injected into high-temperature areas, it reacts with the Ca and Mg content in rocks, thereby precipitating and immobilizing CO2 in the ground. As a natural analog study, in the Sumikawa Geothermal Field in Akita Prefecture, it is speculated that meteoric water containing CO2 infiltrated the ground and formed a caprock composed of carbonate minerals and clay layers at a depth of approximately 700 m [24].
In this CO2-EGS project, we plan to conduct experiments on the reaction of carbonate water with various types of rocks (basalt to granite) that constitute geothermal reservoirs in Japan. Since this study is the first report of its kind, tests were conducted on basaltic rocks for the conditions surrounding the injection well. Image analysis using an X-ray CT system was also attempted to observe the shape change of the rock surface before and after the reaction.

2. Materials and Methods

2.1. Rock and Test Equipment

The experimental flowchart is shown in Figure 1.
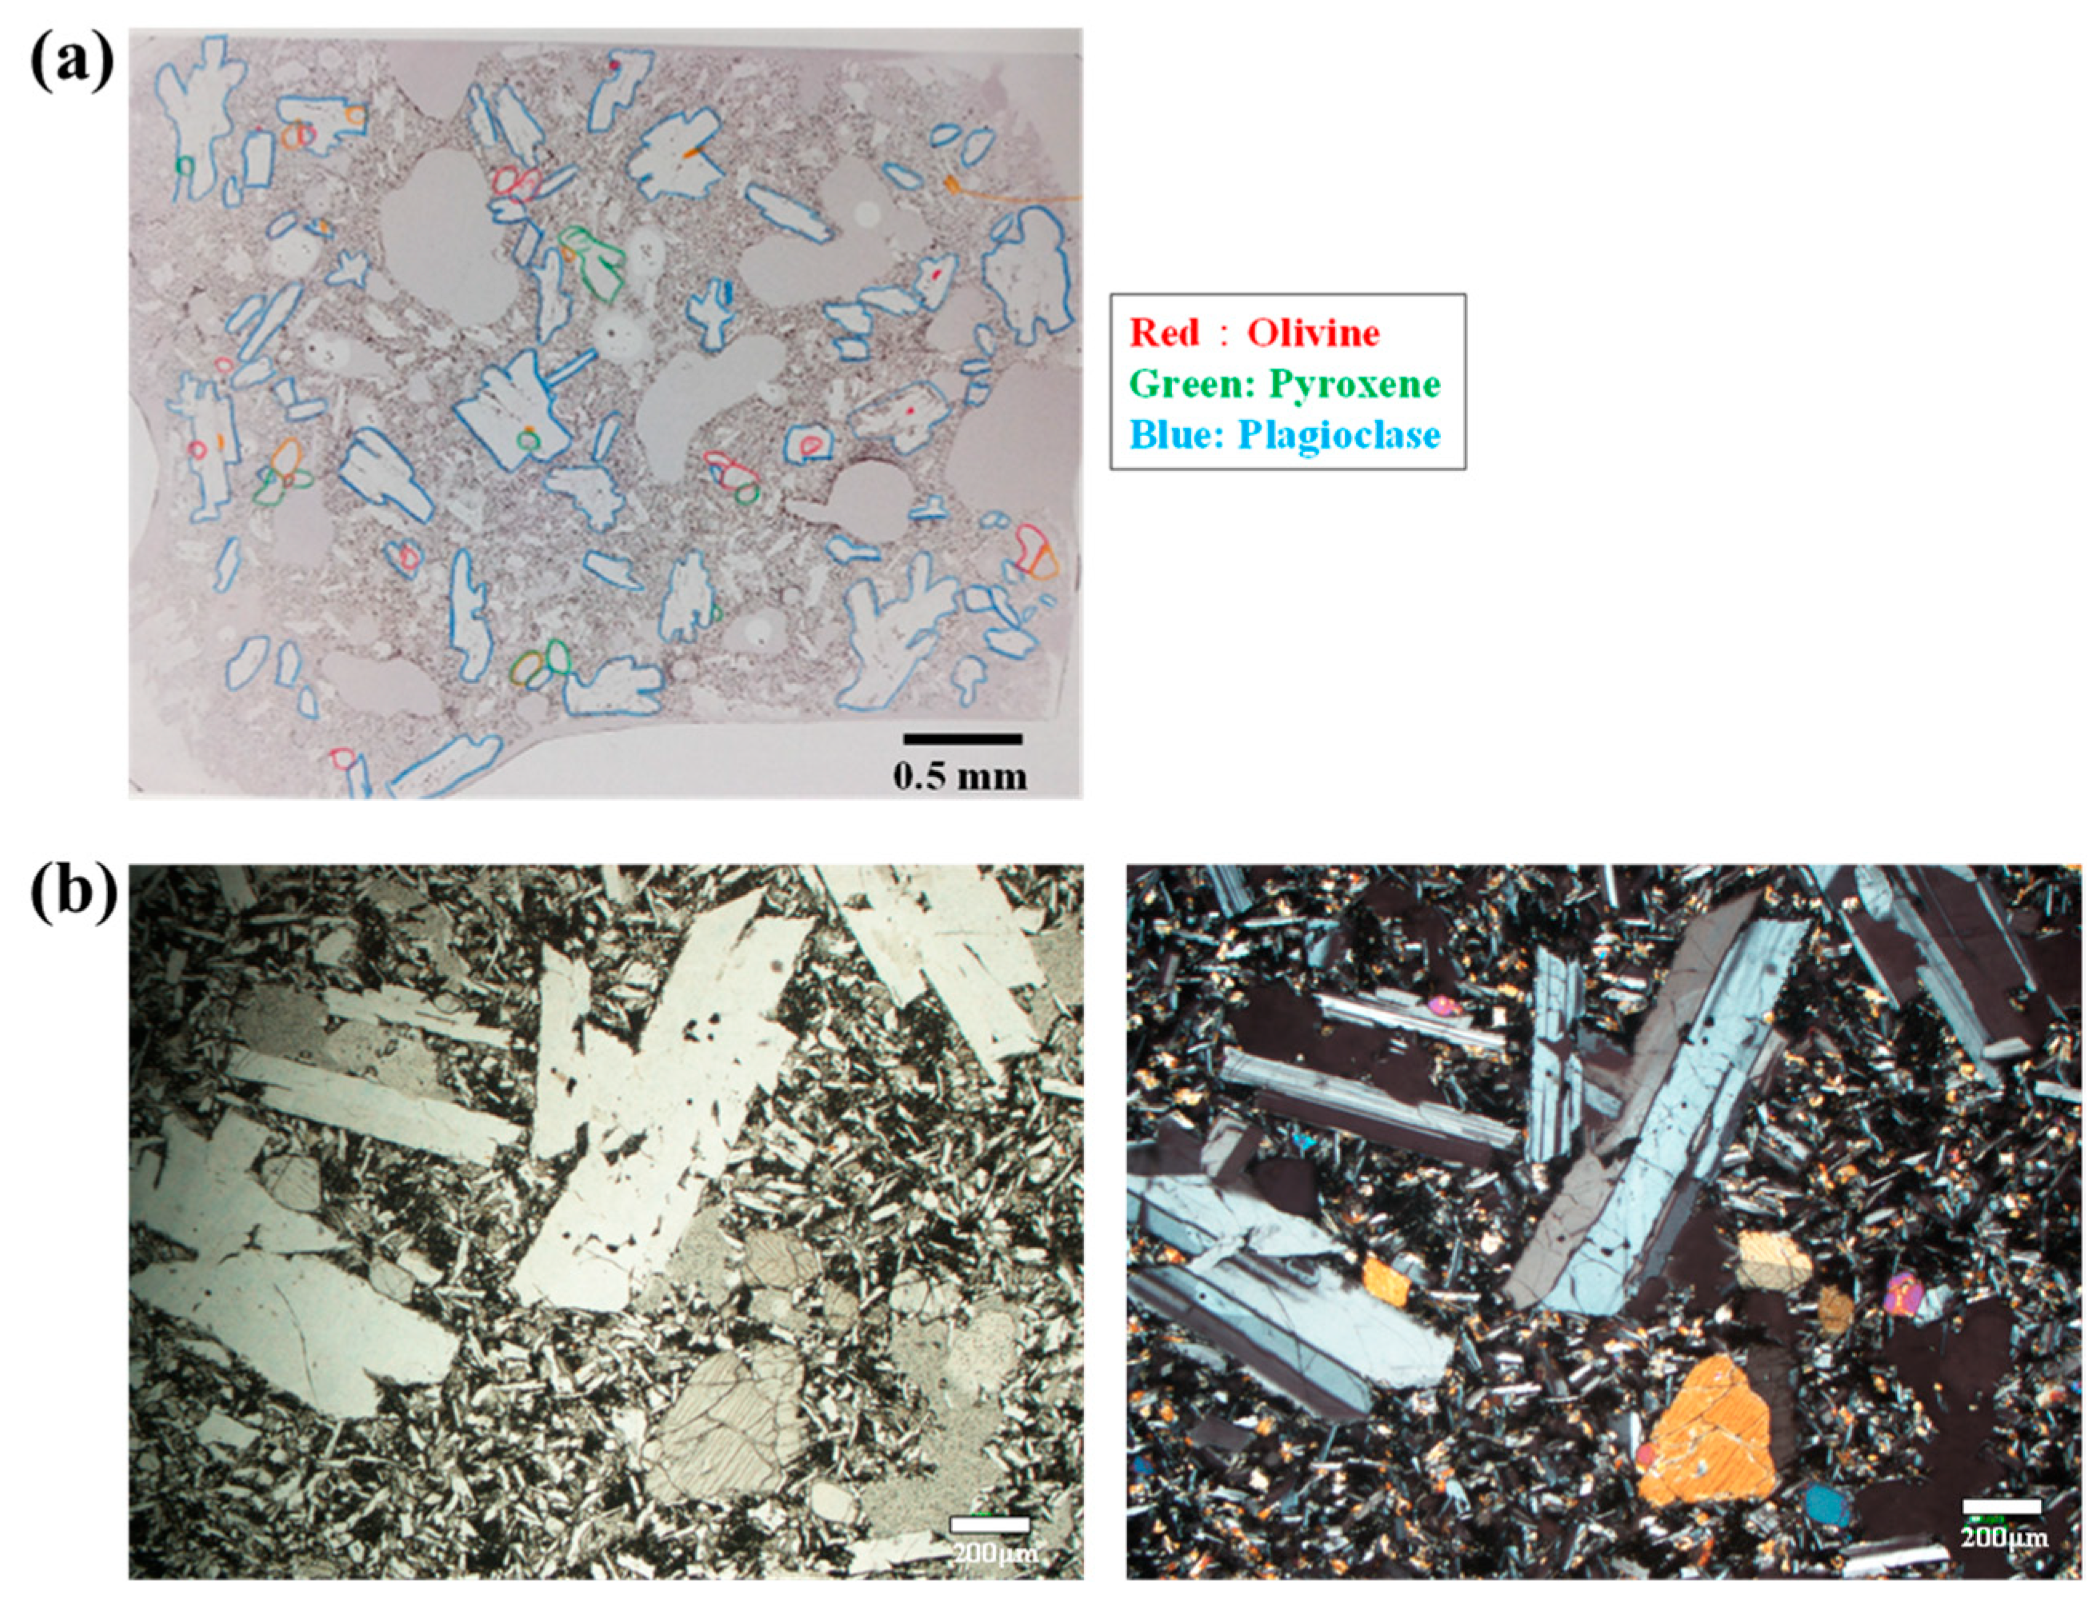
The rocks used for the laboratory tests were collected in October 2021 on Rishiri Island, a representative Quaternary volcano in Japan. Rishiri Island is a volcanic island located in northern Hokkaido with a 1721 m high Rishiri Volcano. The rock samples are fresh basaltic lava distributed along the western coast of Rishiri Island [25]. These rocks contain plagioclase, clinopyroxene, and olivine as phenocrysts, and the groundmass contains glass (Figure 2). The major components of the rock and chemical composition of the phenocrysts obtained by electron probe microanalysis (EPMA; JEOL JXA-8230, Tokyo, Japan; https://www.jeol.com/products/scientific/epma/JXA-8230.php, accessed on 28 March 2025) are shown in Table 1 and Table 2, respectively. The analysis error is about ±0.1% for each component. The rocks used in the laboratory tests were crushed and sieved to a grain size of 1–2 mm. Subsequently, the rock grains were ultrasonically washed several times with distilled water, dried at around 25 °C and stored in containers.
The distilled water from the laboratory was used in the laboratory tests. The test apparatus used was a SUS316 (stainless-steel) reaction vessel (nozzle-type stainless-steel inner tube, Sanai-Kagaku, Nagoya, Japan: https://www.sanai-kagaku.co.jp/index_english.html, accessed on 28 March 2025) with a built-in Teflon beaker (internal volume of 100 mL) (Figure 3). The apparatus is equipped with a valve on the lid to degas the air inside and inject CO2 or Ar gas.

2.2. Test Conditions and Procedures

The test conditions for the batch tests (Table 3) were set at 250 °C to simulate the reaction at a depth of approximately 1000 m. The gases injected were CO2 at different initial pressures at 25 °C (1, 2, and 4 MPa) and Ar for comparison, respectively. The CO2 concentration in the fluid at the reaction temperature is calculated by geochemical calculation code PHREEQC. The test periods were 1, 2, 5, 10, and 15 d for short periods of time to evaluate the response in the vicinity of the injection well. In this study, two tests were conducted at 250 °C (RUN-1 and RUN-2) to ensure the reproducibility of the results under the same test conditions. In the second test (RUN-2), rocks that had previously been reacted with distilled water at 90 °C for 2 d were used to examine the effect of the unevenness of the rock surface area after crushing on the reaction. The electrical conductivity (EC) of the solution after the reaction was <2 mS/m, much lower than that of the solution at 250 °C, indicating that the chemical components were hardly dissolved at 90 °C. This means that RUN-1 and RUN-2 confirmed the reproducibility of the study. The chemical composition analysis values obtained in these tests have an error of about ±5%, with slightly higher values for trace components such as Al (Table A1).
Subsequently, 7 g of crushed rock sample and 70 mL of distilled water were placed in a Teflon beaker, placed in a stainless steel (SUS) reaction vessel (Figure 2), and a vacuum pump was used to exhaust the air (about 30 mL in volume) in the vessel and the air dissolved in the water for 10 s. This vacuum pump has a displacement rate of 60 L/min and can degas in a few seconds. CO2 gas was injected at 1, 2, and 4 MPa, followed by Ar gas to an internal pressure of 4 MPa at 25 °C. The reaction vessel was placed in a high-temperature rotary electric furnace (rotating-reaction decomposition vessel; RDV-TM1, Sanai-Kagaku, Nagoya, Japan; https://www.sanai-kagaku.co.jp/rdv-tm_english.html, accessed on 28 March 2025) and allowed to react for a predetermined period (1–15 d). The reaction vessel was rotated at 1 rpm by an automatic rotary device (Figure 3). After the reaction, the vessel was cooled in water for approximately 15 min, opened, and the water and rock samples were removed. Approximately 10 mL of the water sample was filtered through a 0.22 µm membrane filter, and 1 mL of 1N HCl was added to achieve an acidic pH for the measurement of the Fe2+ and trace element concentrations. The other water samples were filtered by suction and stored in plastic stick bottles. The rocks were washed 2–3 times with distilled water, moistened with ethanol and air-dried at room temperature. The rock sample after the reaction was black in appearance, the same as before the reaction.

2.3. Analytical Methods

2.3.1. Chemical Analysis of the Solutions

The Na+, K+, Mg2+, Ca2+, Cl, and SO42− concentrations in the water samples after the reaction were analyzed using an ion chromatograph instrument (Compact IC 861, Compact IC 761, Metrohm, Herisau, Switzerland: https://www.metrohm.com/enus/search.html?q=Compact+IC+861&cat=All, accessed on 28 March 2025). The HCO3 concentration was determined using an analytical method that allows the measurement of sample volumes as low as approximately 0.1 mL [26]. SiO2 was analyzed using a molybdenum yellow colorimetric method by a spectrophotometer (UV-1280, Shimadzu, Kyoto, Japan https://www.shimadzu.com/an/products/molecular-spectroscopy/uv-vis/uv-vis-nir-spectroscopy/uv-1280/index.html, accessed on 28 March 2025). The concentrations of trace constituents, such as Mn2+, Al3+, and total Fe2+, were analyzed by inductively coupled plasma atomic emission spectroscopy (ICP-AES; Optima 7300DV, Perkin Elmer, Waltham, MA, USA https://resources.perkinelmer.com/lab-solutions/resources/docs/bro_optima7300vfamily.pdf, accessed on 28 March 2025). The analytical error for each component is ±5%.
For the pH and CO2 concentration of the reaction solution, values at the reaction temperature were calculated using PHREEQC.

2.3.2. Analysis of the Rock Sample

After the laboratory tests, surface morphology observation of the rocks was performed for all test conditions using SEM-EDS (JCM7000 + JED2300, JEOL, Tokyo, Japan https://www.jeol.com/products/scientific/sem/JCM-7000.php, accessed on 28 March 2025). The precipitates obtained by filtering the solution after the reaction at 250 °C (RUN-1) were analyzed using a field-emission transmission electron microscope (TEM; JEM-2100F; JEOL, Tokyo, Japan; https://www.jeol.com/products/scientific/tem/JEM-2100F.php, accessed on 28 March 2025) equipped with an energy-dispersive X-ray spectrometer at the Institute of Low Temperature Science, Hokkaido University and Analytical Facility, Faculty of Engineering, Hosei University. The acceleration voltage of the TEM was 200 kV, and Images A CMOS camera (OneView IS; Gatan, Tokyo, Japan; http://nanotech-solu.com/cmos-camera/, accessed on 28 March 2025) was used to record images. In addition, the changes in the surface area of the rock samples before and after the reaction were observed using an X-ray CT system (ScanXmate-RD300WSS900, ComscanTecno, Kanagawa, Japan; https://www.johnan.com/comscan-en/cse-products/, accessed on 28 March 2025) at Taisei Corporation’s Technical Center.

3. Results and Discussion

3.1. Chemical Composition of the Reaction Water

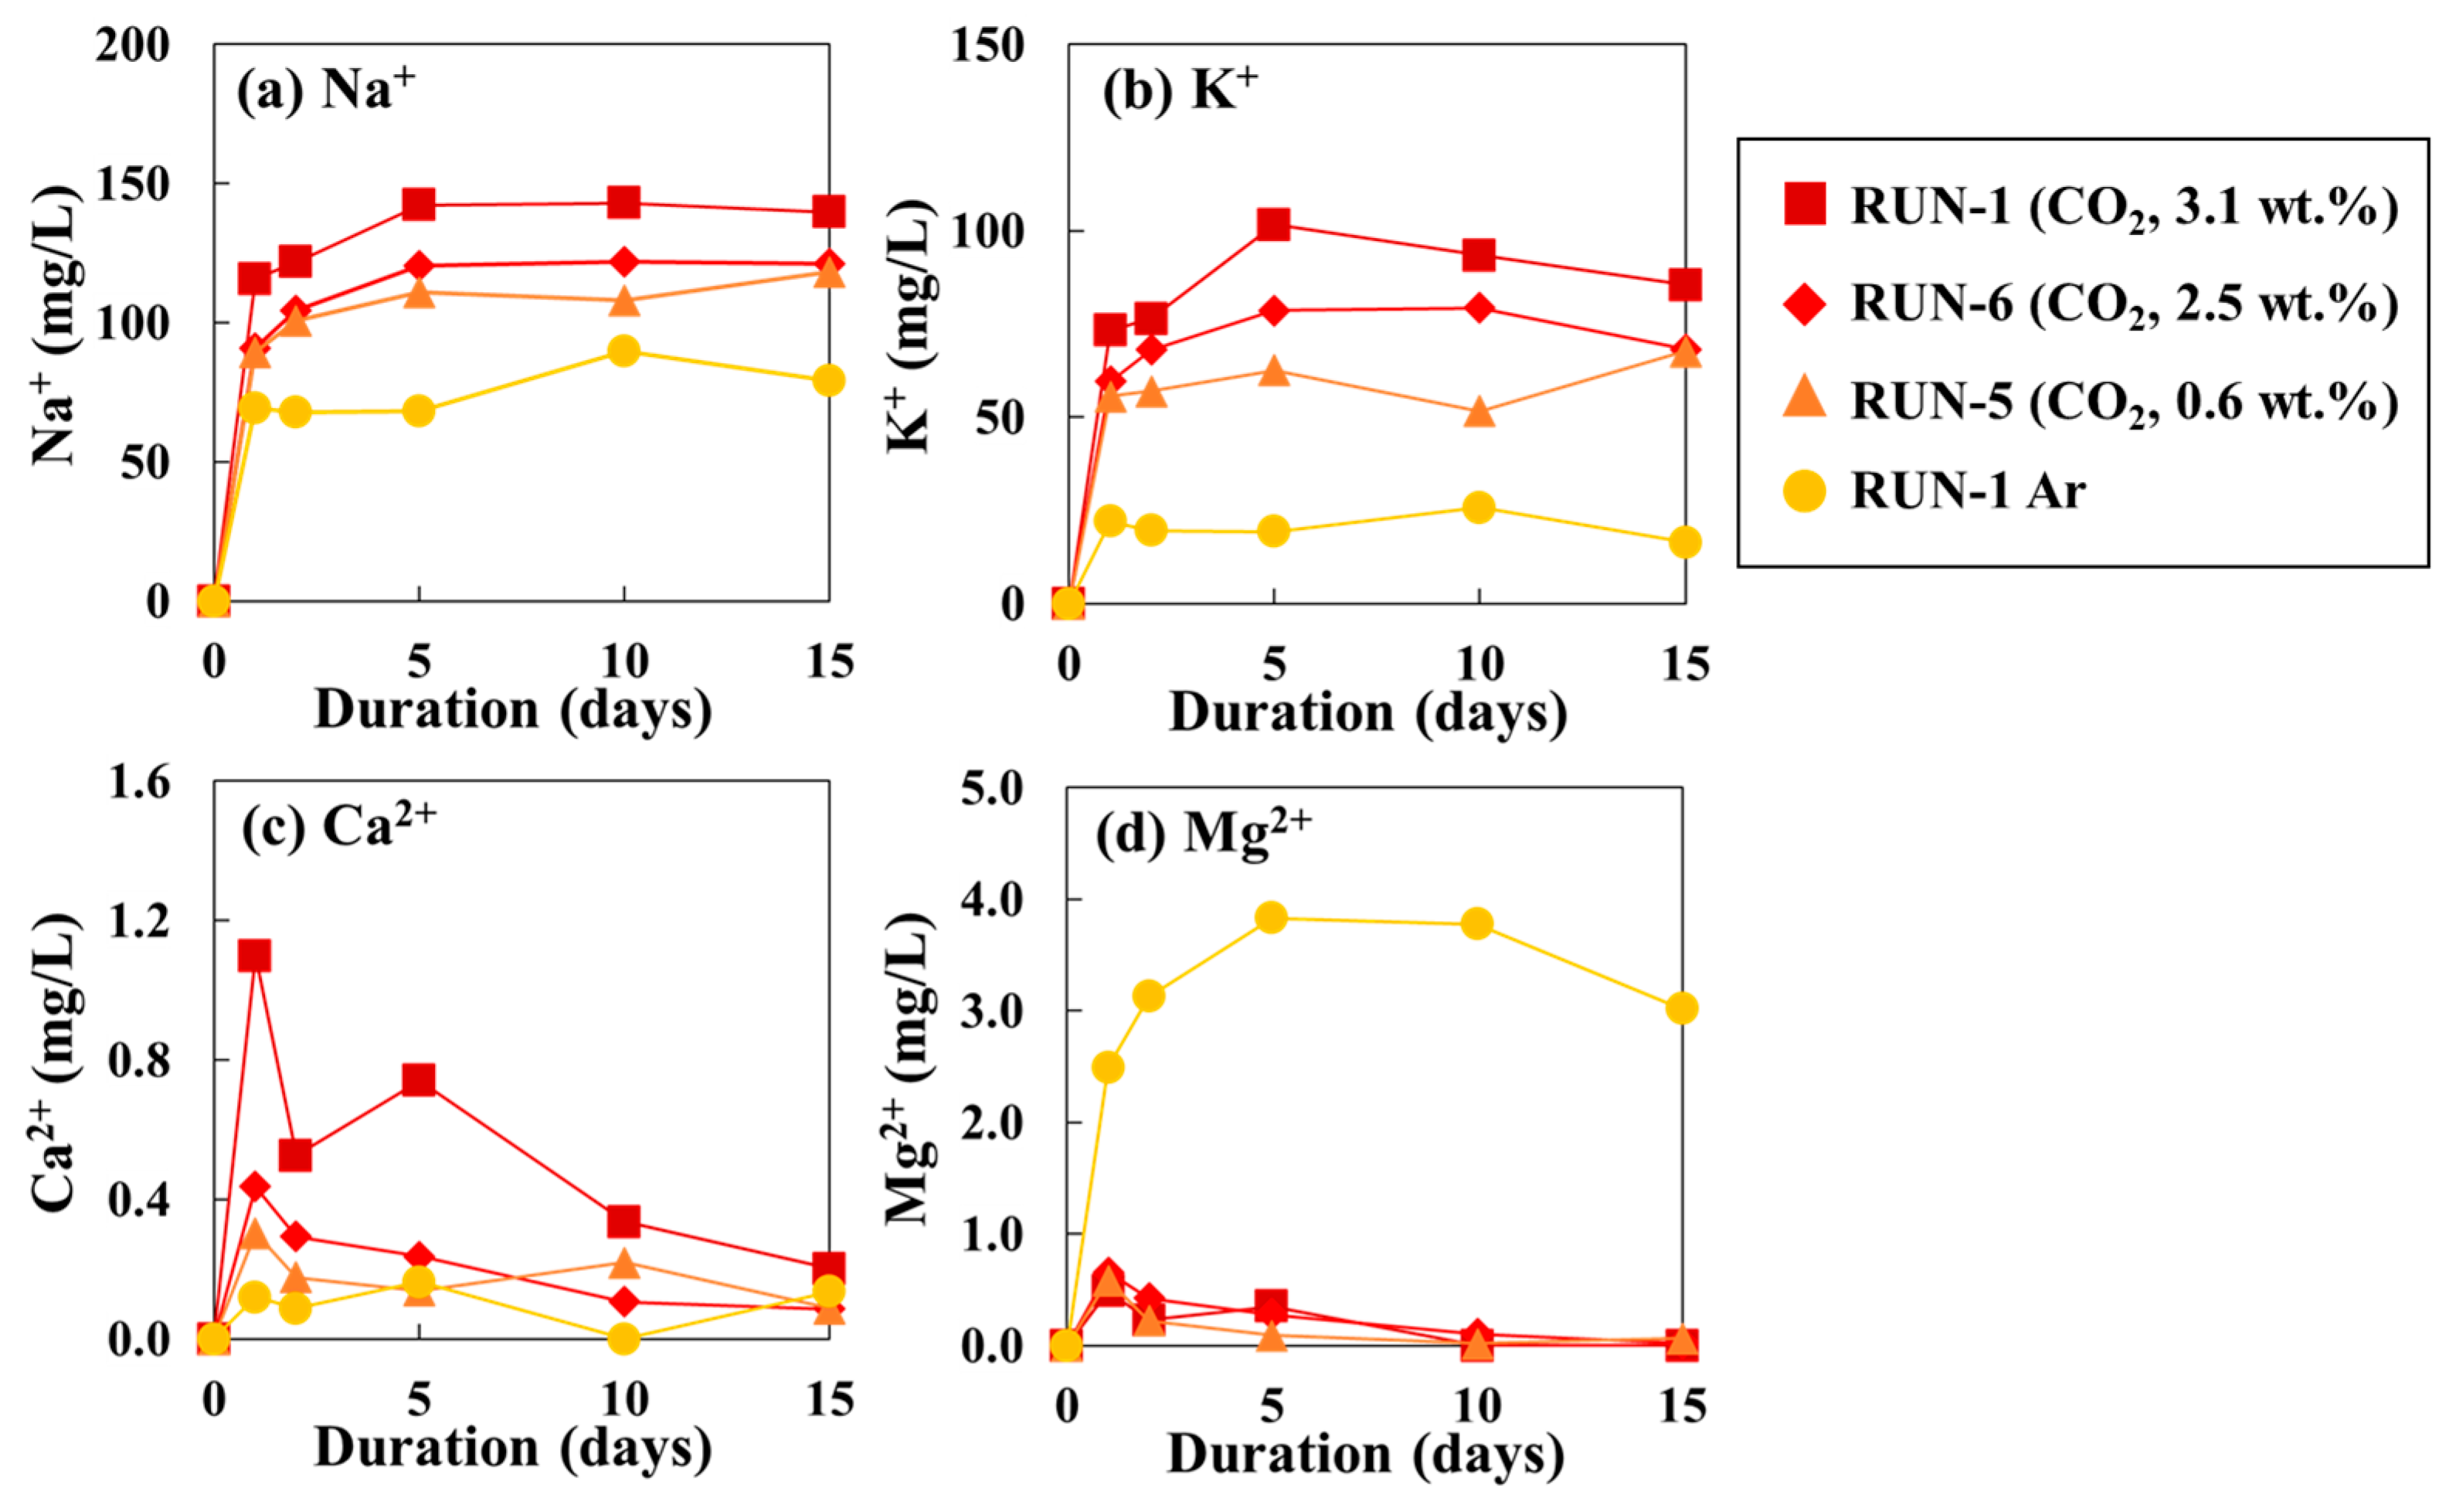
The results of the two batch tests at 250 °C (RUN-1 and RUN-2) are shown in Figure 4 and Table A1. In RUN-2, the rock samples were reacted with distilled water once at 90 °C for 2 d before the test to observe the effect of surface irregularities in the crushed rock fragments; however, the results obtained were not significantly different. The results of these two tests showed that the chemical composition of the water samples after the reaction had good reproducibility, even with slight differences in the measured results (Figure 4). The results of this study are characterized by the fact that the concentrations of chemical components after the reaction increased rapidly on the first day of the reaction period, and after 5 d, most of the components showed relatively constant values. The results of RUN-2 showed a similar elution pattern of each ion in RUN-1 and up to day 10. Therefore, since RUN-2 is a test to check reproducibility and error, it was not necessary to conduct the test on day 15. The concentrations of Na+, K+, and Ca2+ were 2 to 5 times higher in the CO2 gas atmosphere than in the Ar gas atmosphere. In contrast, Mg2+ concentrations were higher in the Ar gas atmosphere with a maximum of 4 mg/L (Figure 4). For Mg2+, there was no difference depending on the CO2 pressure, although the dissolution was higher under the Ar gas atmosphere, at about 4 mg/L (Figure 4). This is largely due to the fact that the pH of the solution is slightly alkaline under the Ar gas atmosphere, about 8, while it is acidic under the CO2 atmosphere, about pH 4. Dissolved Mg2+ precipitates as clay minerals in the presence of CO2, while it is only present in small amounts in the solution under an Ar gas atmosphere. The clay minerals are not present in large amounts as observed by SEM, indicating that they are dissolved on the solution side.
Of the chemical constituents leached from the rock, Ca2+ and Mg2+ were at most 1.4 mg/L and 0.7 mg/L on 1 d, respectively. In comparison with the results of existing similar laboratory tests, in a 49-day reaction at 250 °C with Icelandic basaltic glass by Gysi and Stefánsson, Ca2+ increased to 3.7 mg/L on day 1, but remained at 2 mg/L thereafter, while Mg2+ was around 0.3 mg/L [21]. The results were similar to those of the present study. In the reaction between artificial basalt mimicking Archean mid-ocean ridge basalt and seawater by Shibuya et al., the Ca2+ value was 0.6 mg/L after 15 days of reaction, similar to the results of this study, but increased to 223 mg/L during the 94-day reaction period [27]. On the other hand, Mg2+ remained almost constant at a maximum of 1.5 mg/L. From these results, it can be concluded that Ca2+ concentrations are low in the early stages of the reaction. The elution of Fe2+ was higher in the CO2 atmosphere than in the Ar atmosphere and as low as 1.5 mg/L. The concentrations of Cl and SO42− were less than 10 mg/L with no significant difference between the gas types, indicating that they were eluted by the dissolution of the glass part of the rock. On the other hand, SiO2 showed a high value of 800 mg/L regardless of the gas composition. This value is higher than the solubility of quartz (489 mg/L) and cristobalite (740 mg/L) at 250 °C and lower than that of amorphous silica (1320 mg/L: all solubility data from Fournier) [28]. Na+ and K+ concentrations were nearly constant at 140 mg/L and 100 mg/L after 5 d, respectively. Here, we investigated whether the Na+/K+ concentration ratio was in equilibrium with the rock, as the Na+/K+ concentration ratio is often used as a geochemical thermometer in geothermal exploration. The Na+/K+ concentration ratio after 5 d of reaction was 1.5 in solution under the CO2 gas atmosphere, and as high as 3.5–4.0 in Ar gas. However, literature values at 250 °C were as high as 6.1–8.1, indicating that the Na+ and K+ are not in chemical equilibrium with the rock [28,29,30,31,32,33].
Trace constituents were measured in RUN-2 water samples, and B3+ showed high values of 6–21 mg/L regardless of reaction temperature. B3+ is assumed to be present in the glassy portions of the basalts, reflecting the selective dissolution of glass in the reaction at high temperatures. Experimental cases have been reported in which boron is selectively dissolved on the solution side when CO2–water reacts with boron-containing minerals [34,35]. This is interpreted to mean that a large amount of B in the glass part is dissolved out by the reaction with CO2–water. In Iceland, B3+ concentrations have been continuously monitored in observation wells during CO2 injection in the Carbfix2 project. There, the B3+ concentration increased from 0.4 mg/L to approximately 0.6 mg/L at the start of fluid injection and then remained constant, which was interpreted to be due to the injection of boron-enriched geothermal brine into the injection well [36]. The high B3+ concentrations in this study may be due to the prolonged reaction of the rock with the limited amount of water in the batch tests, causing the B3+ to leach to the solution side.
In this study, tests were also conducted at initial CO2 gas pressures of 1 and 2 MPa (0.6 and 1.3 wt. % CO2 concentration) for reactions at 250 °C (Figure 5, Table A1). Na+ and K+ concentrations increased with increasing CO2 concentration, whereas the Mg2+ concentration increased rapidly under an Ar atmosphere and had low values of less than 0.5 mg/L in the presence of CO2 gas (Figure 5). Although its concentration increased with CO2 concentration, Ca2+ showed a low maximum value of 1.2 mg/L.

3.2. Surface Observation of Rocks

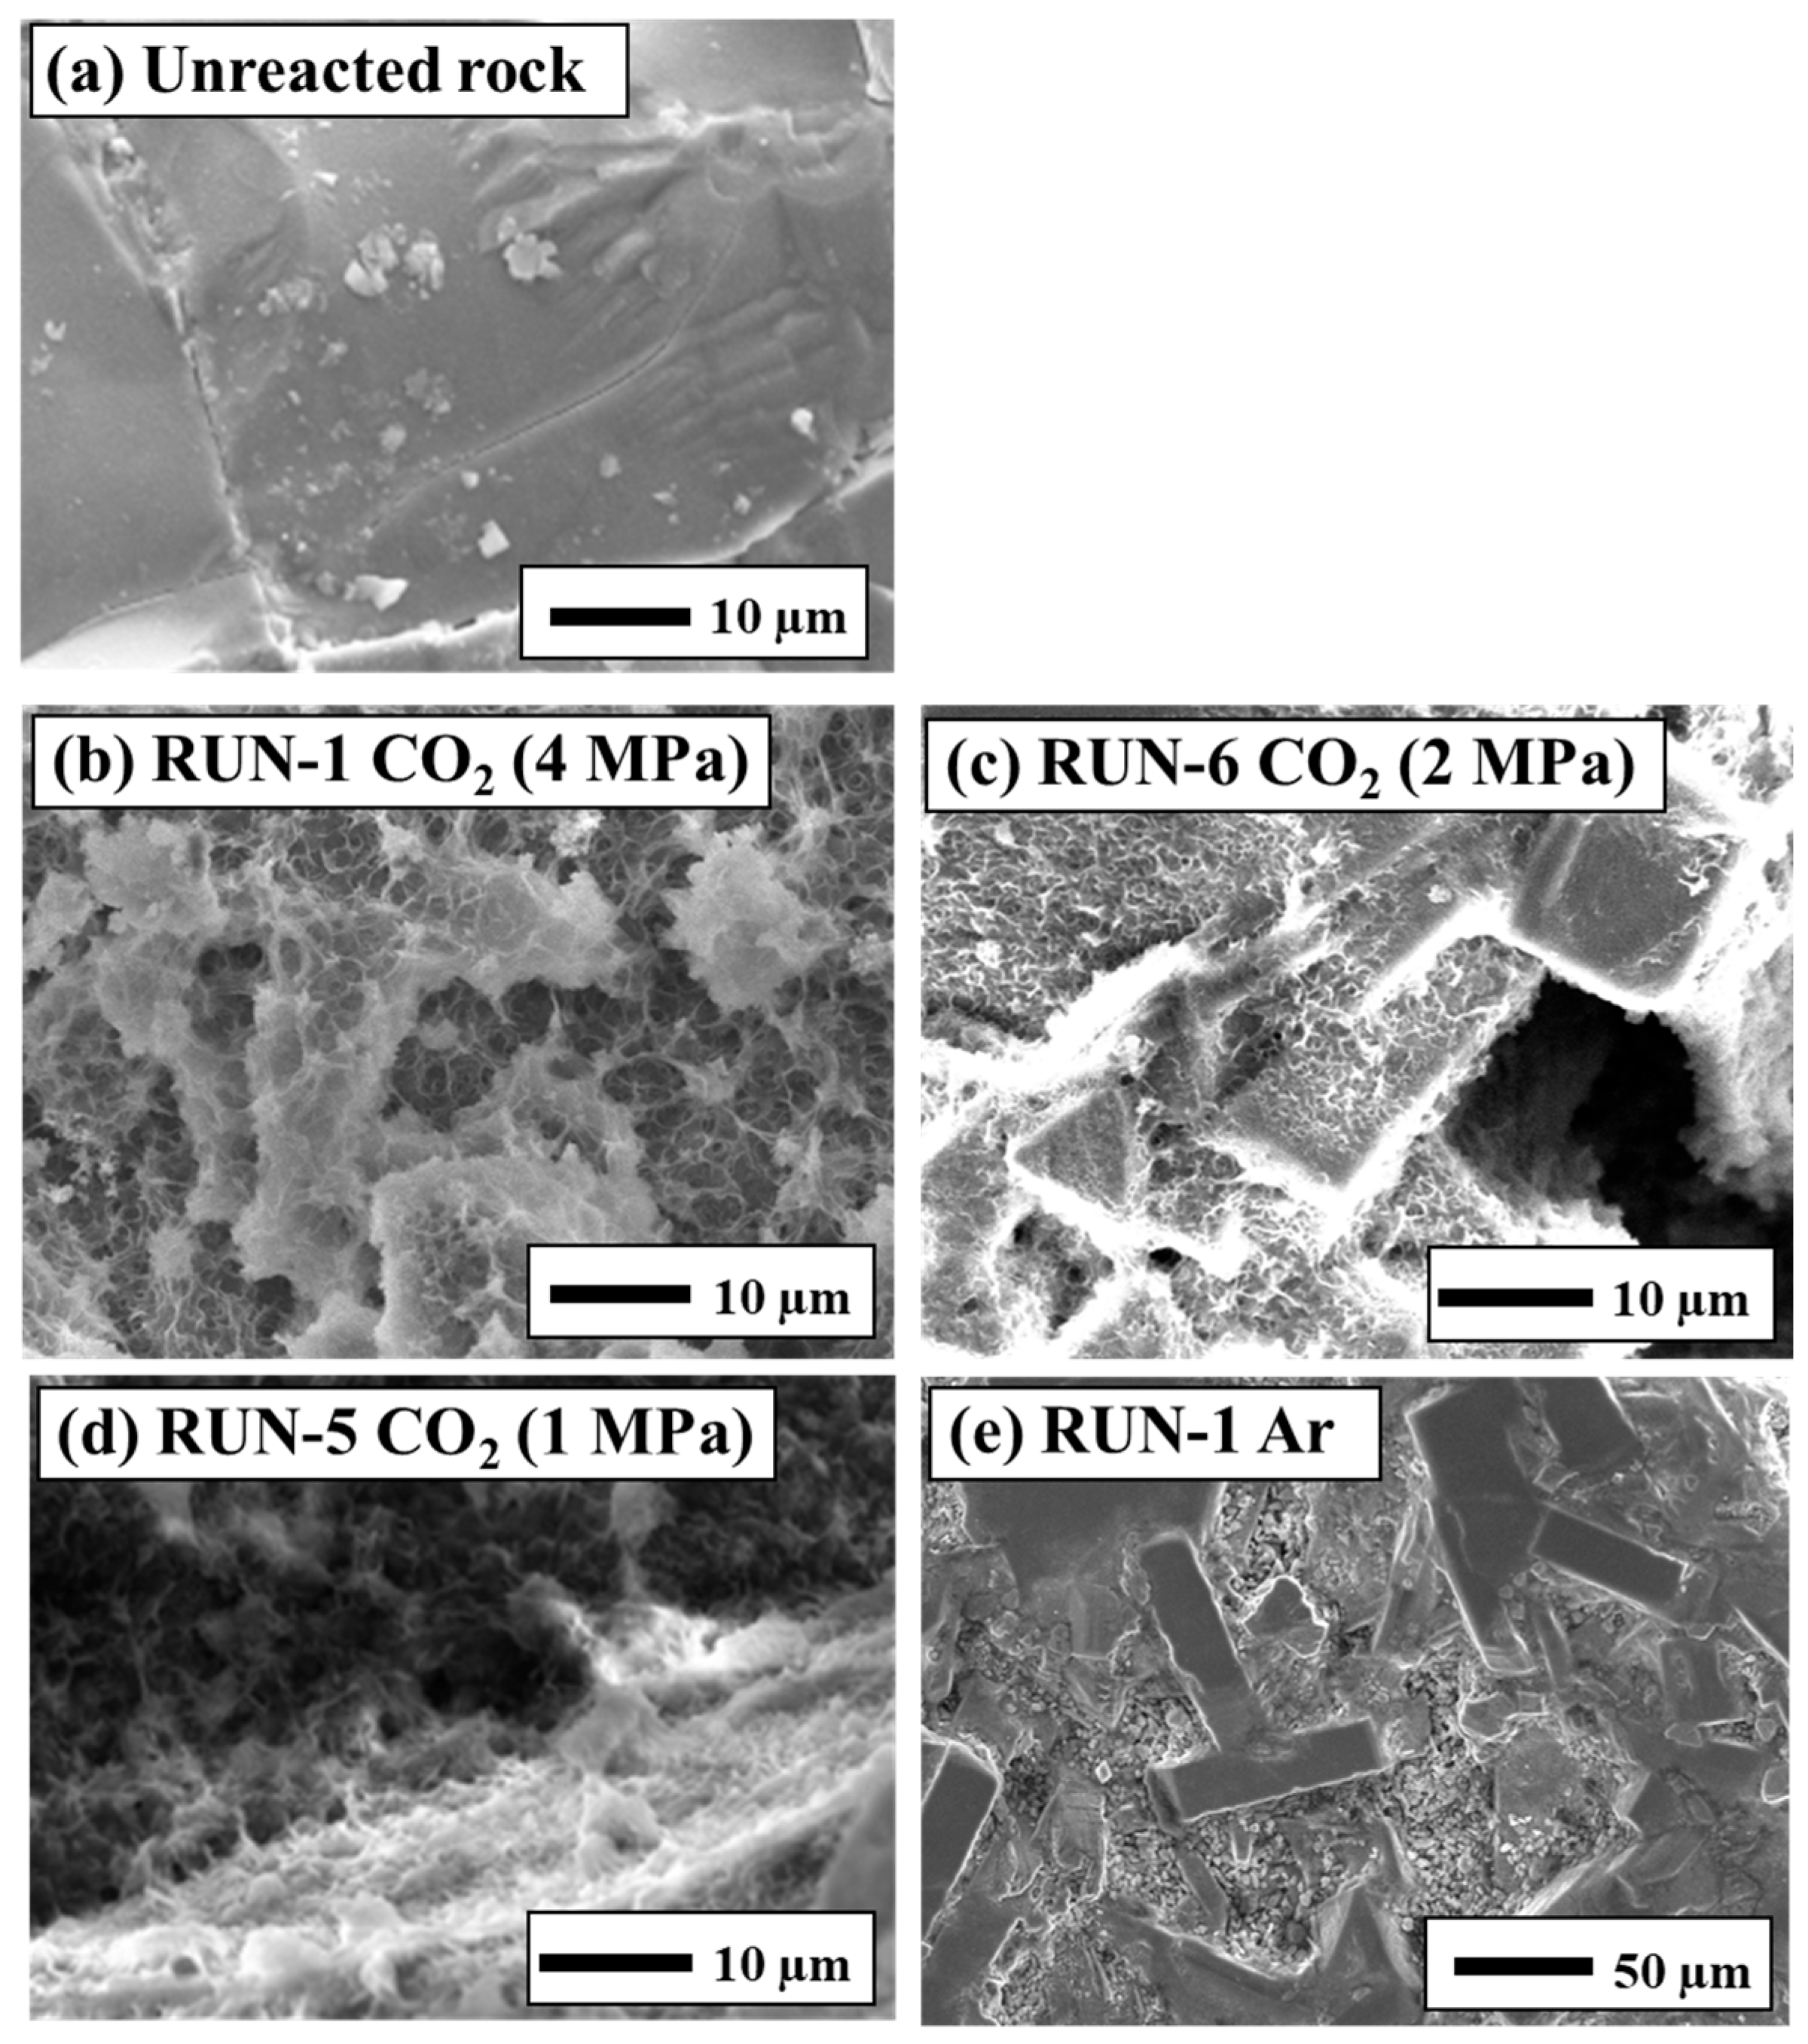
The SEM EDS results of the rock samples reacted at 250 °C for 15 d under a CO2 or Ar atmosphere are shown in Figure 6. As there was minimal difference between the results obtained for RUN-1 and RUN-2, only the analysis results for RUN-1 are shown. The shape of the rock sample surface after the reaction varies greatly with the gas used, reflecting differences in the secondary minerals produced. In particular, in the samples reacted under a CO2 atmosphere, the surface is coated with an amorphous material, which is most likely smectite based on its chemical composition. The amount of secondary minerals coating the rock surface increased with increasing reaction time. In contrast, in the samples reacted under an Ar atmosphere (Figure 6e), rectangular crystals with a length of a few micrometers were observed. Gysi and Stefansson (2012) [20] conducted a laboratory test on Icelandic basalt glass at 250 °C and an initial CO2 pressure of 1.7 MPa for 49 days, and observed that chlorite and smectite were precipitated along with calcite precipitation. As our test was conducted for a short period of time (15 days at 2 MPa), it is assumed that no calcite precipitation was observed, although smectite was observed. The test results of this study are interpreted to indicate that the reaction with distilled water first preferentially dissolved the glass of the groundmass, while plagioclase and other minerals remained. In the samples reacted for 15 d with the initial CO2 pressure of 1 MPa (RUN-5) and 2 MPa (RUN-6), amorphous material coated the rock surface (Figure 5c,d).
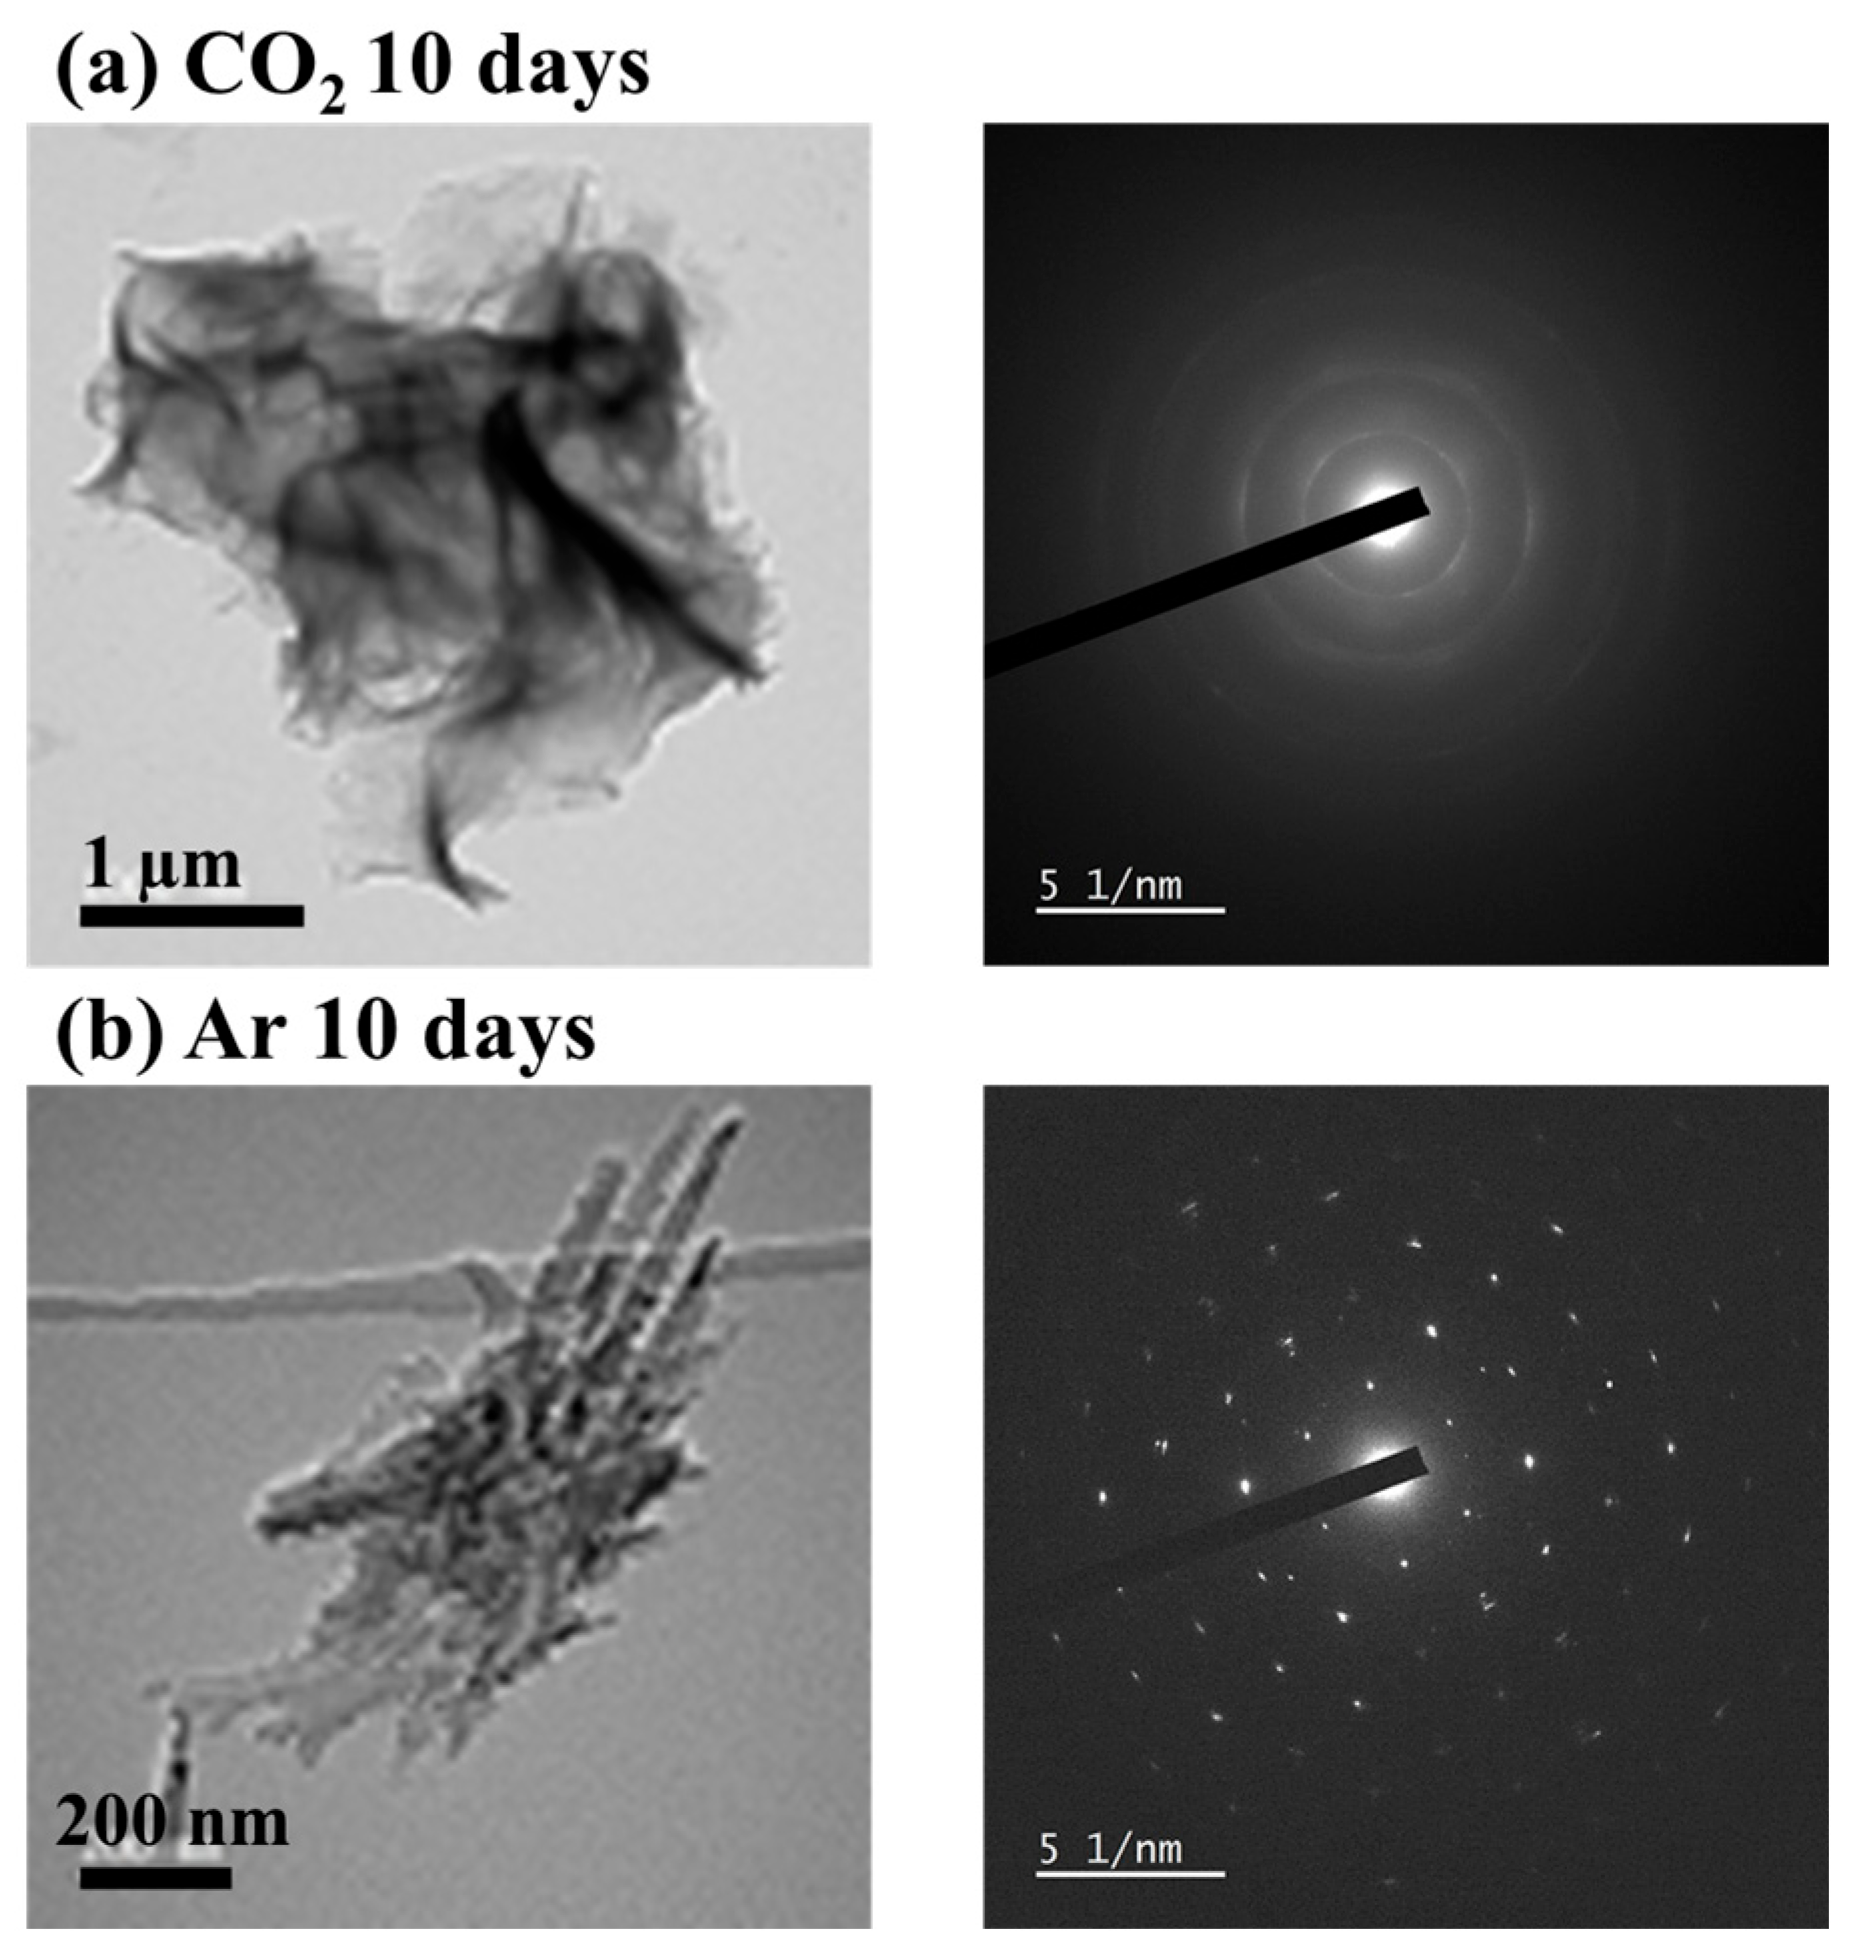
TEM analysis was performed on the precipitates from the water samples reacted at 250 °C for 10 d and filtered through a membrane filter to identify the material precipitated on the rock surface during the reaction in a CO2 atmosphere (Figure 7). As a result, the product in the CO2 atmosphere was smectite, although the type of smectite has not been identified. On the other hand, the sample in the Ar atmosphere was hexagonal, which is considered to be plagioclase contained in the original basalt.
In this study, observation by X-ray CT was examined for the RUN-1 test sample as a new method to study the shape and surface area changes of rock grains before and after the reaction (Figure 8). The surface area and volume changes of the rock grains before the reaction at RUN-1 were 20.2 ± 0.4 cm2/g (N = 30) and 0.356 ± 0.002 cm3/g (N = 24), respectively. For the reacted rocks, regardless of the gas type, the specific surface area and volume of the rock samples increased slightly (Figure 8). The rock grains used in this study had diameters of 1–2 mm. Assuming that the rock grains were spherical, the specific surface areas obtained were 22 cm2/g for a diameter of 1 mm and 11 cm2/g for a diameter of 2 mm. The observed values before and after the reaction were close to these values. Considering the SEM observations, the slight increase in surface area and volume is interpreted to reflect the formation of secondary minerals, primarily clay minerals, precipitated on the rock surface. This is interpreted to mean that under the conditions tested in this study, the amount of secondary minerals precipitated due to the leaching of chemical components from the rock was a trace. With X-ray CT technology, the resolution is said to be 29 µm, which we believe is useful for understanding changes in surface area and volume. In this study, we conducted a preliminary analysis using X-ray CT, and although some of the results are within the margin of error, we believe that we have observed changes before and after the reaction. The results showed a slight increase in volume; the reaction with CO2–water dissolves the chemical components in the rock, which is expected to reduce the particle size of the rock, and this result suggests that clay minerals coated the rock surface and slightly increased the volume. This technique will make it possible to monitor porosity changes due to secondary mineral precipitation in future water flow tests and to evaluate changes in the permeability of the formation in geothermal reservoirs.

3.3. Investigation of Saturation Degree of Secondary Minerals Using PHREEQC

The chemical composition of the solution after the batch test is estimated to be nearly constant from 5 d, although not in chemical equilibrium with the rock. To investigate the saturation status of the major minerals expected to contribute to the reaction based on the analytical values of the solutions, the saturation index (SI) was determined using the PHREEQC code and thermodynamic data from LLNL (Lawrence Livermore National Laboratory, Livermore, CA, USA) [37,38]. As input data, the CO2 concentration of the solution was assumed to equilibrate under the initial CO2 pressure at room temperature, and the pH and CO2 concentration at the reaction temperature were calculated. The total pressure at 250 °C was set to 10 MPa. SI is defined by the following equation:
SI = Log (Q/K),
where Q and K are the activity product and solubility of the mineral of interest, respectively. If SI > 0, the mineral is supersaturated, indicating its potential for precipitation; if SI < 0, the mineral is unsaturated and dissolution is the primary reaction.
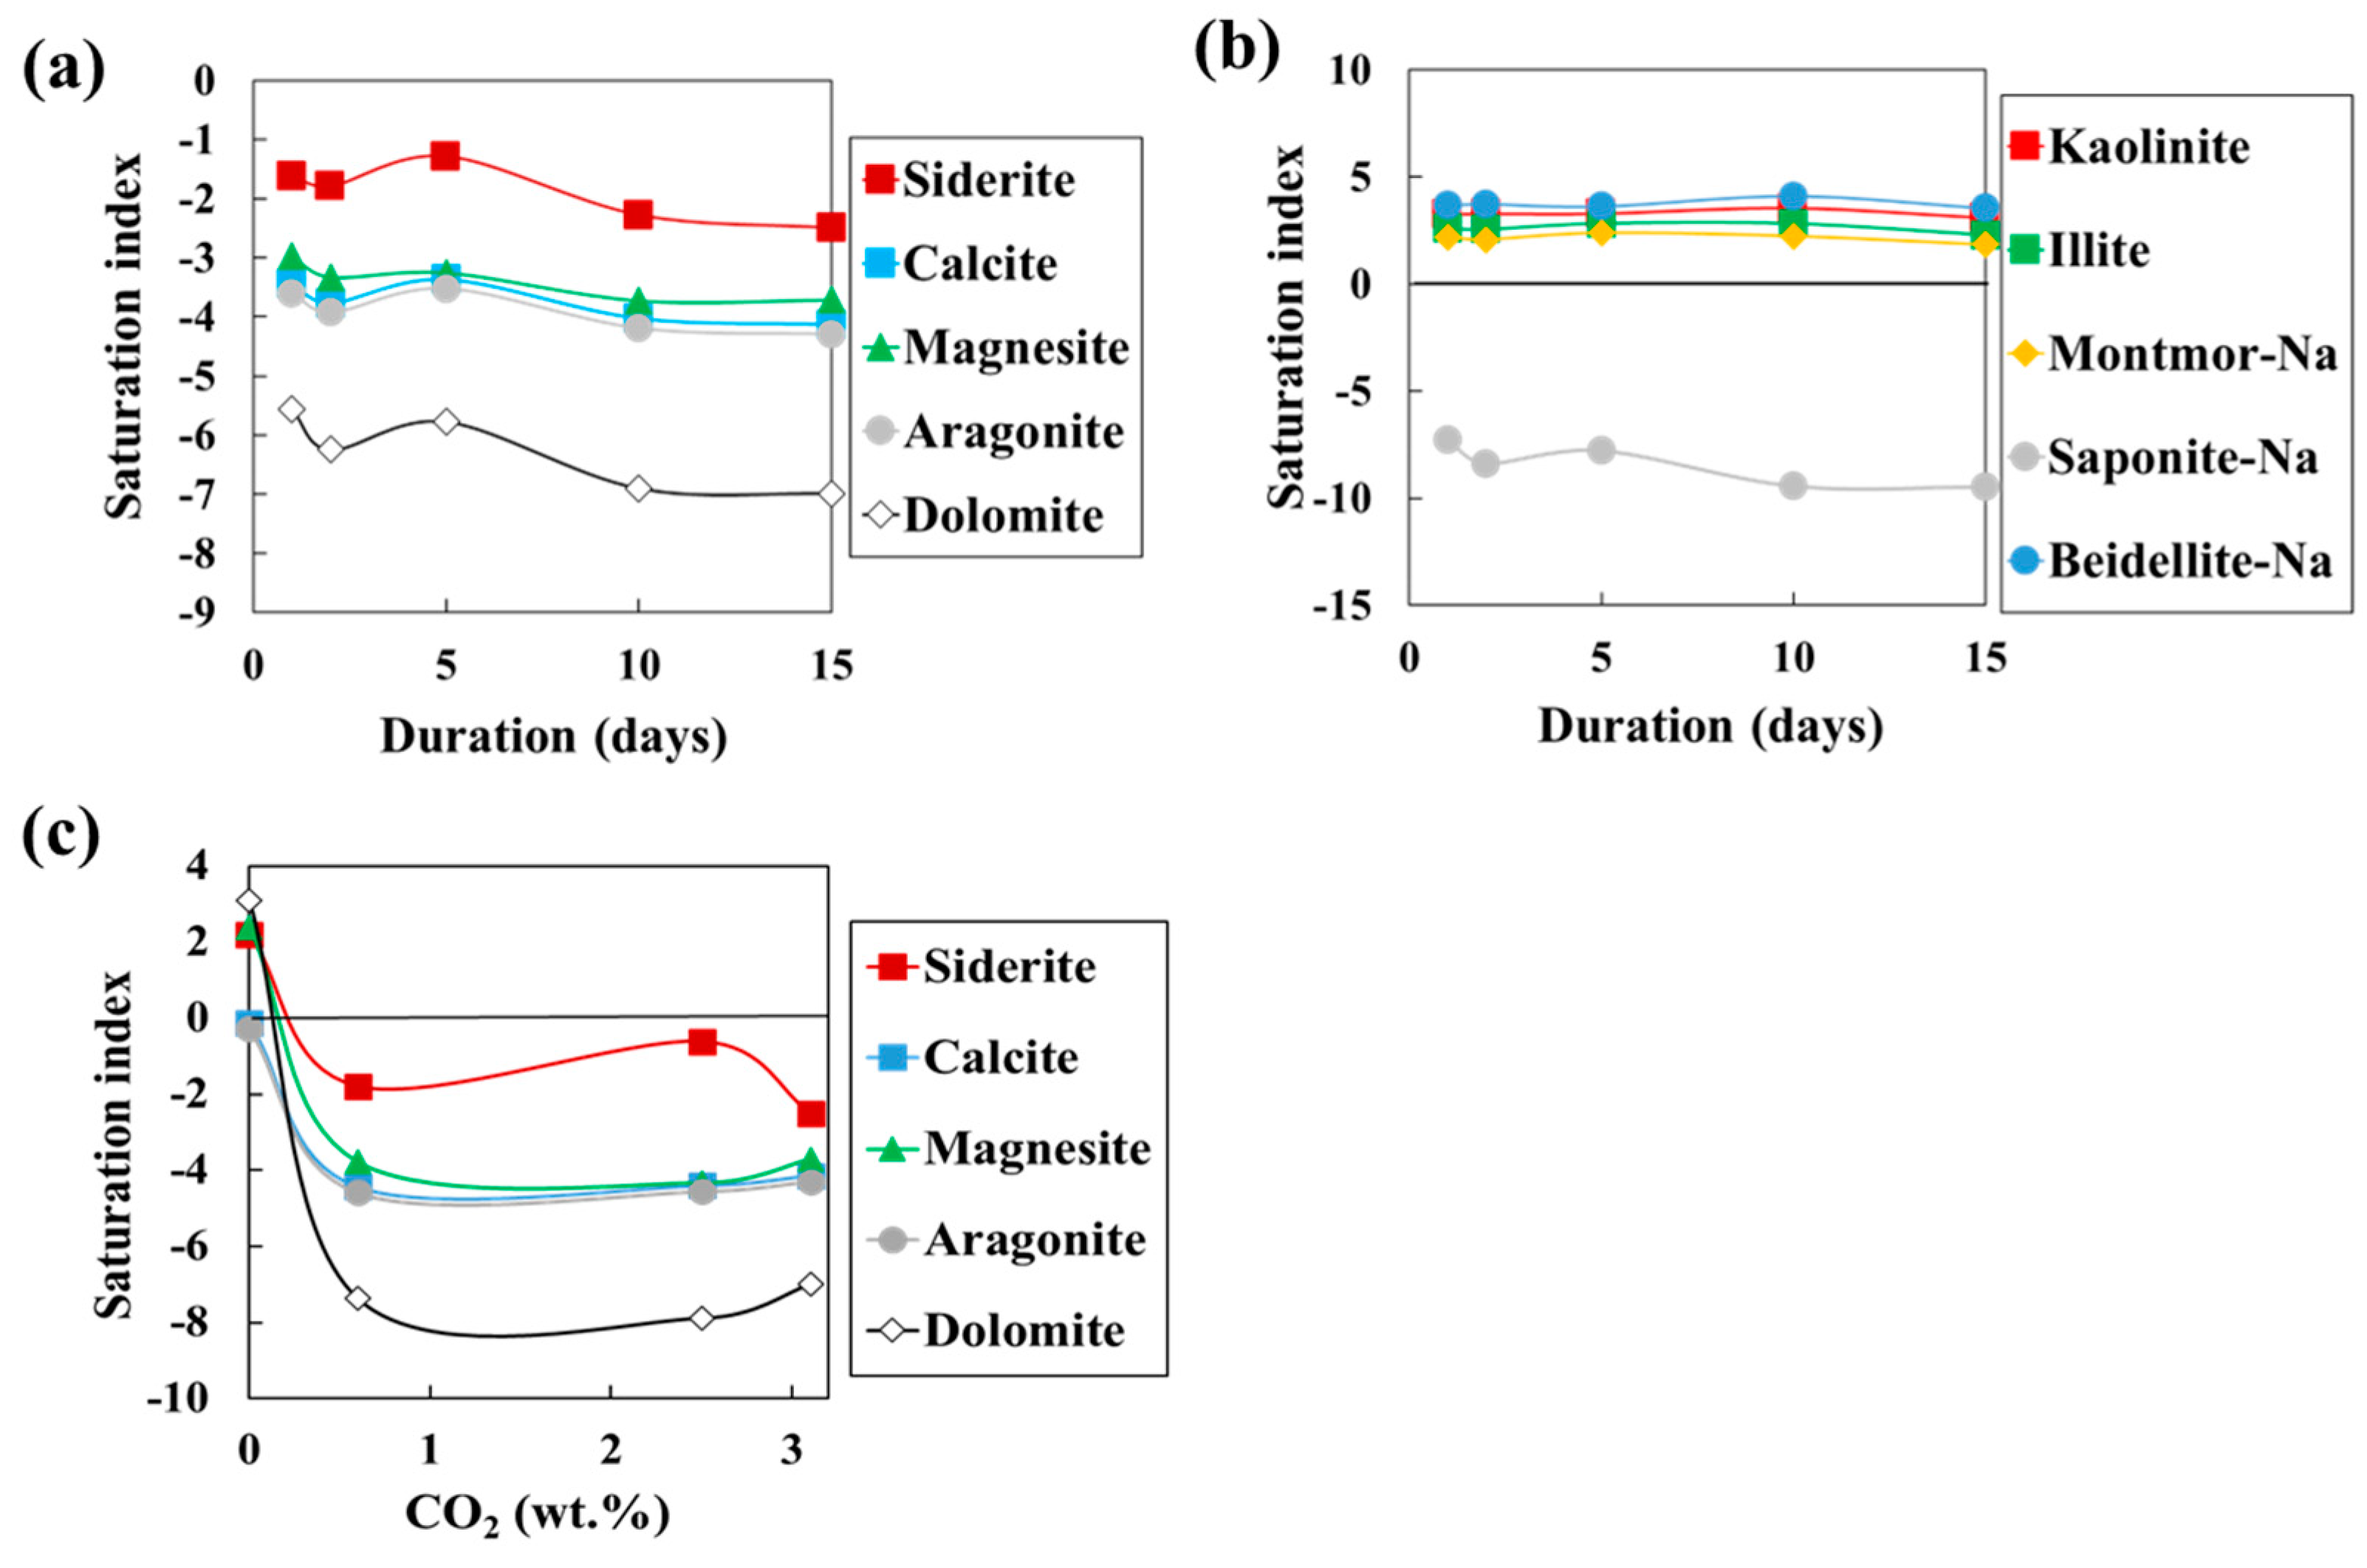
The SI of carbonate minerals was estimated to be unsaturated throughout the test period, which was judged to be due to the acidic pH of 3−4. On the other hand, clay minerals containing Mg2+ and Fe2+ were supersaturated except for saponite (Figure 9, Table A2). Clay minerals form solid solutions; however, only Na types are shown in Figure 9 because differences in chemical composition did not significantly affect SI values. The precipitates observed in the SEM and TEM are believed to be smectite, although the detailed mineral species have not been identified. The precipitates are similar to the results after CO2–basalt reaction tests described in the literature [20,21,22,39,40,41]. From the calculated SI, clay minerals such as montmorillonite and beidellite are supersaturated after 1 d of the reaction. This suggests that the chemical composition of the solution after the reaction is regulated by these clay minerals.
Based on the SI values of the reaction solutions under the various conditions in this study, the concentration of CO2 in the solution when the carbonate minerals precipitate was determined. The lower limit of CO2 pressure in the Ar gas atmosphere was set at 0.01 MPa. At initial CO2 pressures above 1 MPa, all carbonate minerals are unsaturated; however, below 0.5 MPa, siderite, dolomite, and magnesite are expected to be supersaturated, and the CO2 concentration is estimated to be below 0.3 wt. %. Laboratory tests under geothermal conditions in Iceland and elsewhere show that the pressure of CO2 is about 1 MPa [20,21,22]. The pH of the solution is expected to increase after several months of long-term reaction tests, and carbonate minerals such as calcite are expected to precipitate. The long-term reaction with the rock indicates that the reaction took place in a reservoir away from the injection well where supercritical CO2 was injected, and the initially acidic CO2–water gradually became neutral, which is judged to have resulted in supersaturation of the carbonate minerals. The study reflects the conditions in the vicinity of the injection well, with a reaction time of 15 days, and it is concluded that carbonate minerals were not precipitated during this period, as the pH of the solution remained acidic.

3.4. Approximation of Laboratory Test Results by PHREEQC Using Kinetic Model

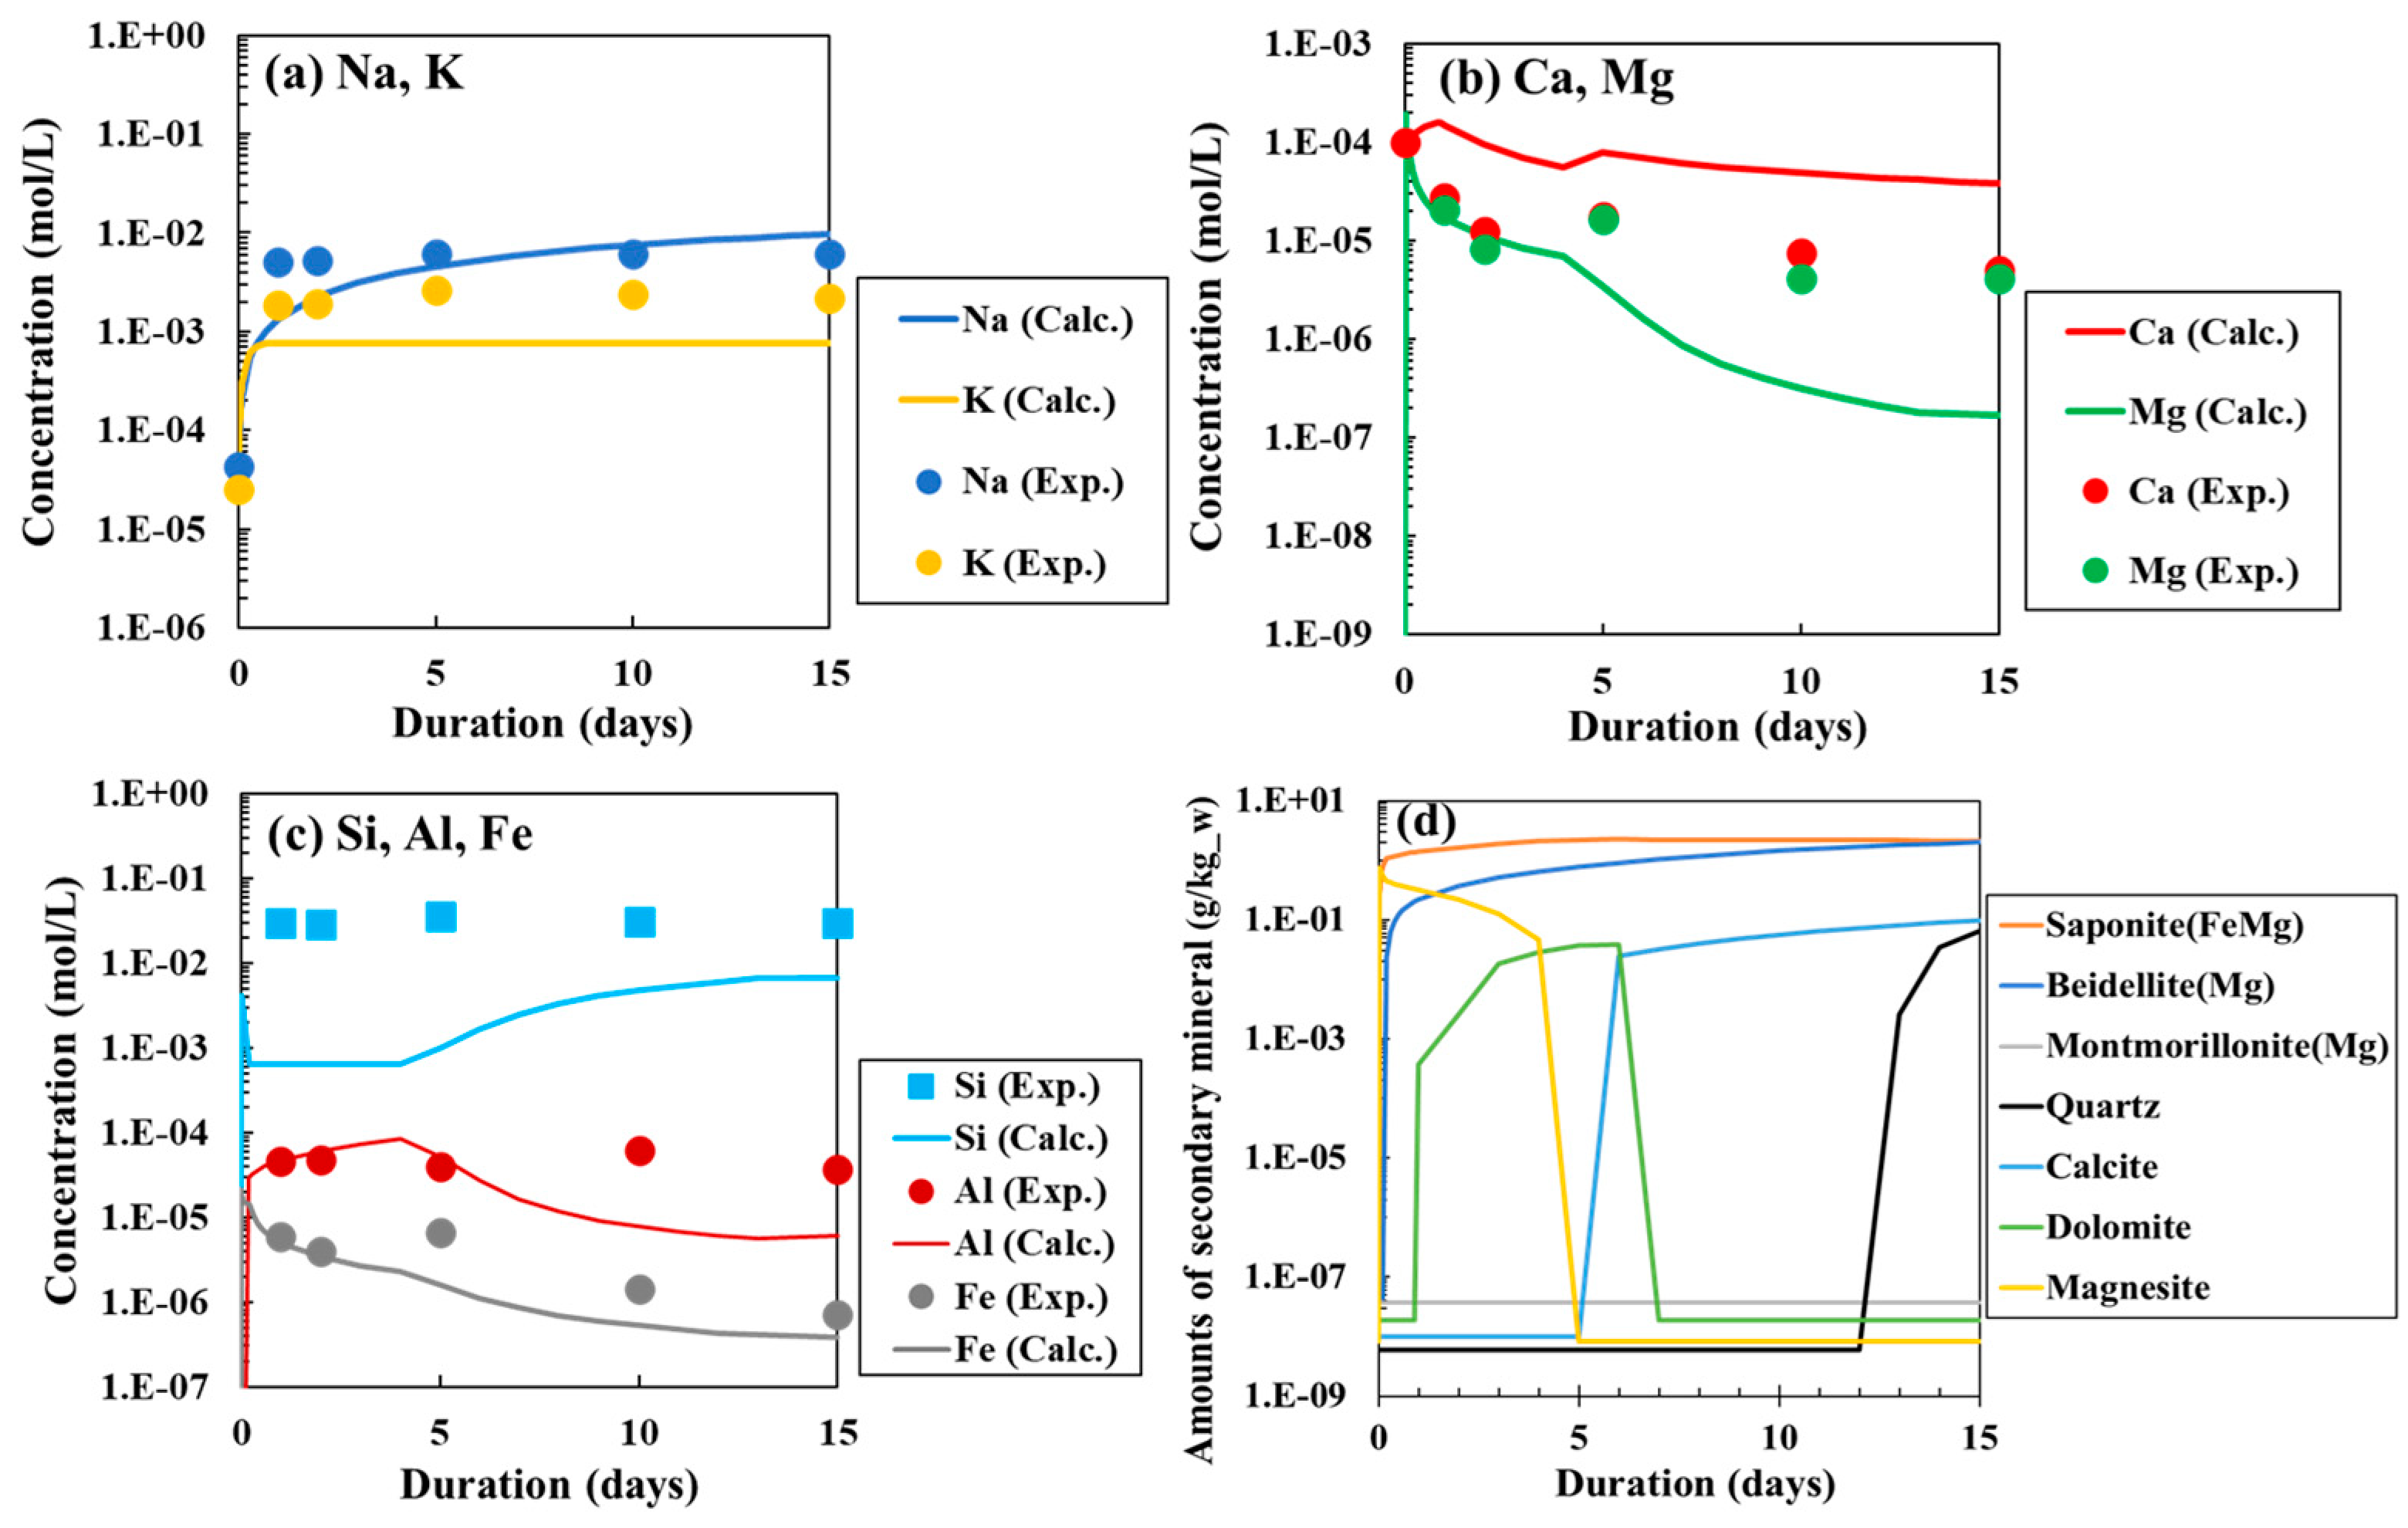
Based on the results of the SI change versus reaction time analysis, a rough reproducibility analysis was performed using a kinetic model to estimate the primary and secondary mineral species that contributed to reaction one. In order to develop a TOUGHREACT dataset applicable to the laboratory scale, we have compiled the basalt compositions (primary and secondary mineral species) considered in the modeling of each case study for the basalt–CO2–H2O reaction system. Among the most recent analytical cases, Marieni et al. performed reaction pathway modeling for a conceptual system using PHREEQC (v3) in the CarbFix2 project [41]. Similar to the case study described above, the effect of temperature on the efficiency of secondary mineral formation and CO2 fixation was investigated (250, 170, 100, and 25 °C), and basalt glass 0.2 mol was added 10 times (0.02 mol/time) in the analysis, assuming CO2 migration in the rock mass. Secondary minerals were assumed to be in local equilibrium and mineral redissolution was not considered. The results of studies of the effects of primary and secondary mineral species, pH, and temperature considered in these previous studies were used as baseline knowledge. Here, we cite thermodynamic data from Aradóttir et al., Pollyea and Rimstidt and Gysi et al. and perform a replicate analysis for the Pollyea and Rimstidt analysis case, where the set of analysis conditions is relatively clear [42,43,44,45]. The basic conditions of the targeted batch test system are shown in Table A3. The sample was assumed to be basalt and the liquid phase to be distilled water. The literature values were adopted for the initial solution composition, primary and secondary mineral composition [44]. In this study, the reaction mechanism was preliminarily analyzed for a CO2 open system (semi-batch), which continues to supply CO2 in the case of the Pollyea and Rimstidt analysis [44]. The code used for the calculations was PHREEQC, the thermodynamic data used were THERMODEM, (https://thermoddem.brgm.fr, accessed on 28 March 2025), and the input conditions are shown in Table A3. Figure 10a–c show the results of the reproducibility analysis of solution concentrations using these data. Also shown in Figure 10d is the temporal variation of mineral amounts associated with the formation and decomposition of secondary minerals. The analytical results for Na+ and K+ concentrations are in good agreement between the experimental and calculated values (Figure 10a). The results of the analysis of Ca2+ and Mg2+ concentrations are in close agreement from 1 to 10 d after the start of the experiment, and the differences are within one order of magnitude at 15 d, although the deviations become more pronounced thereafter (Figure 10b). The results of the analysis of Al3+ and Fe2+ concentrations are in good agreement between the experimental and calculated values; for Si4+, the values are far apart until 10 d, when they become closer to the measured values (Figure 10c). In our calculations, we tried not to change the rate constants for dissolution and precipitation involved in the reaction by using values from the literature. The parameters that have been verified are specific surface area and mineral species, especially secondary mineral species. As more experimental results become available and secondary mineral species, such as clay minerals, can be identified, we expect the calculations to become more accurate and in agreement with experimental values.
As for the formation of secondary minerals shown in Figure 10d, the precipitation of montmorillonite and beidellite is consistent with the high SI values calculated by equilibrium theory (Figure 9). In contrast, for saponite, the SI value for equilibrium theory is negative, although a large amount was expected to form based on kinetic calculations (Figure 10d). The difference in SI values is likely due to the difference between the SI value obtained from the chemical composition of the post-reaction solution and the kinetic simulation in which the mineral species were selected and the reaction was predicted. To investigate the cause of this difference, the kinetic model was calculated by varying the pH of the initial solution in the range of 2 to 6, although the results were almost the same. This difference in pH is also related to the Mg2+ concentration in solution, which is 2 × 10⁻⁴ mol/L for pH = 3 and 1 × 10⁻⁷ mol/L for pH = 7. The results of the kinetic model predict that the Mg2+ concentration in solution increases rapidly immediately after the start of the test due to dissolution from forsterite, which has a high dissolution rate. This Mg2+ concentration in solution is expected to affect the precipitation of saponite. Therefore, we performed chemical species distribution equilibrium calculations with different Mg2+ concentrations in the initial solution and found that the SI values were unsaturated when the Mg2+ concentration was below about 1 × 10⁻⁴ mol/L. Since the Mg2+ concentration in the experimental results after 1 d of reaction was about 2 × 10⁻⁵ mg/L, it was determined to be unsaturated according to the equilibrium theory calculation results. The validity of the Mg2+ concentration in solution obtained from the calculation results of the kinetic model (especially the increase in Mg2+ concentration earlier than 1 day after the start of the experiment) can only be evaluated by the actual analytical values of pH and solution concentration immediately after the experiment, and is judged to be a possibility at present.
Looking at the formation of secondary minerals shown in Figure 10d, the Si4+ concentration decreases with the rapid formation of saponite (FeMg) immediately after the start of the experiment. In other words, the Si concentration is not rate limited by the solubility of quartz (the amount of quartz produced is 1 × 10 −9 g/L up to 15 d). In this study, quartz was set as the mineral controlling the SiO2 concentration in solution; however, no significant changes were observed when other silica minerals, such as cristobalite, were added. Therefore, it is expected that SiO2 is most likely regulated by clay minerals. Solid phase surface analysis after the test shows that no carbonates are observed and that Fe- and Mg-rich clay minerals are formed. In this analysis, the formation of clay minerals is dominant during the 0–15-d period, as shown in Figure 10d, which is consistent with the facts confirmed by the solid phase analysis. Carbonate minerals (magnesite, calcite, and dolomite) are also formed, although at only about 1/100th the mass concentration of clay minerals.
The batch test will identify the dominant factors and reaction pathways involved in the extinction/production of the liquid and solid phases in a subsurface environment at high temperature and pressure with CO2. In particular, the extinction/production of the solid phase may be accompanied by porosity closure and permeability changes in the media, which can have a significant effect on the flow of moving fluid in the pores. Candidate secondary minerals causing porosity and permeability changes include silicate minerals (e.g., SiO2), carbonate minerals (e.g., CaCO3, FeCO3, and MgCO3), clay minerals (montmorillonites: (Na, Ca)0.33(Al, Mg)2Si4O10(OH)2∙nH2O, saponites: (Ca0.5, Na)0.33(Mg, Fe2+)3(Si, Al)4O10(OH)2·4H2O), and others are possible. Therefore, these secondary mineral candidates should be modeled with Na, Ca, Si, Al, Mg, K, etc., as target elements to be as consistent as possible with the experimental system.

3.5. Behavior of the Carbonated Water in the CO2 Geothermal Power Generation

In this study, the CO2 concentration in the fluid was as high as 3 wt. % in the test at 250 °C. In addition, the pH of the solution remained acidic during the 15 d reaction period based on the PHREEQC calculation results. This suggests that carbonate minerals remained unsaturated. The results were similar when the CO2 pressure was lowered to 1 and 2 MPa, suggesting that the carbonated water maintained its acidic state.
Hangx and Spiers reported that CO2–water reaction tests with plagioclase (anorthite and albite; grain size 25 μm) were conducted at 200 and 300 °C for up to 21 days, and no carbonate minerals were detected except some aragonite in small amounts [46]. The CO2 pressure ranged from 0.4 to 15 MPa. Kuroda et al. reacted with plagioclase (anorthite > 95 mol%) with tap water at 150 °C for 15 d at an initial CO2 pressure of 4 MPa [47]. From the first day of the reaction, the Ca2+ concentration in the solution increased rapidly, reaching a maximum of 228 mg/L. Calcite is detected to be formed on the plagioclase surface by a SEM-EDS analysis, and its amount increases with reaction time. In the CO2-free system (using N2 gas) tested at the same time, the maximum Ca2+ concentration was 35 mg/L, and calcite was not observed. In the Ca-rich plagioclase (anorthite) and CO2–water reaction tests, the precipitation of calcite was significantly different. This is presumably due to the significant effect of temperature, and it is highly likely that a large amount of calcite precipitated at 150 °C. This is consistent with the prediction by Oochi et al. that the Ca2+ concentration would be considerably lower under high-temperature conditions, based on the PHREEQC approximation of the reaction results between Oku-Aizu dacite and CO2–water at 150 °C and the parameters obtained from the PHREEQC [48]. As for the temperature at which large amounts of carbonate minerals precipitate, the amount of carbonate minerals in rocks from geothermal wells drilled in several geothermal areas has been studied in the Oku-Aizu and Sumikawa geothermal areas. The results reported that the maximum downhole temperature is around 150 °C [24,49].
Gysi and Stefansson have experimented with basaltic glass and CO2–water (CO2 concentration 0.3–1 wt. %, reaction period up to 4 months) at 75–250 °C and point out that the major divalent cations such as Ca2+, Mg2+, and Fe2+ are initially incorporated to smectite, which is gradually replaced by calcite and chlorite [20]. In particular, they note that the dissolution rate and dissolution mechanism of basaltic glass are also affected by temperature and reaction time, noting that at higher temperatures, the dissolution rate of basaltic glass was faster and driven primarily by the replacement and growth of secondary minerals.
In this study, we investigated the conditions under which acidic carbonated water reacts with Rishiri Island basalt in the vicinity of an injection well. We investigated what kind of water quality changes and what minerals precipitate. The results showed that under the reaction conditions of high CO2 concentration for about 15 days, the glassy part in the basalt was selectively dissolved, and only trace amounts of clay minerals, such as smectite, were precipitated. Considering this and the results of Gysi and Stefansson, it can be concluded that Ca and other elements fixed in clay minerals such as smectite may be converted to carbonate minerals and other elements at longer reaction times [20]. Thus, the results of this study suggest that clay minerals are predominantly formed in the vicinity of the injection well, although in such quantities that they only thinly cover the rock surface and are unlikely to cause significant changes in the permeability of the fluid. As the distance from the injection well increases, the CO2 concentration in the fluid is also expected to become saturated with calcium carbonate due to dilution by the existing fluid and an expected increase in pH due to the ongoing reaction with the rock. In the future, we plan to conduct water flow tests using grains of Rishiri Island basalt using a continuous flow test apparatus to examine how precipitation of clay minerals and other substances affects the permeability, and also to conduct reactions with andesite and granite, which also constitute geothermal reservoirs in Japan, to examine changes in fluid composition and mineral species precipitated due to differences in rock quality.

4. Conclusions

As the first laboratory rock reaction test for a CO2 geothermal power generation project in Japan, this study focused on analyzing the behavior of carbonate water in basaltic rocks in the vicinity of an injection well. To evaluate the effect of CO2 concentration in the fluid, the test was conducted under four conditions, ranging from 0 to a maximum of 3.1 wt. %. The reaction time was set to a maximum of 15 days, since the study was conducted in the vicinity of the injection well, but the pH of the fluid was always acidic. In this acidic condition, carbonate minerals were not formed. In geothermal reservoirs injected with supercritical CO2, the predominant reaction was the dissolution of chemical components from the rock (mainly the glass part in the groundmass), indicating that small amounts of secondary minerals, such as clay minerals, were precipitated. Therefore, in the vicinity of the injection well, the supercritical CO2 fluid and carbonate water will flow through the interstitial spaces between the rocks, and the permeability will not change significantly. Based on SI calculations from the experimental results with varying CO2 concentrations, further reaction of the carbonate water with the rocks or a decrease in concentration due to dilution by the existing fluid will occur. It is assumed that the pH will increase and precipitation of carbonates and other minerals will occur. While this study focuses on validating the response under short-term, high CO2 concentration conditions, future work will involve installing equipment capable of long-term responses and testing in a variety of geothermal reservoir rocks, from basalt to granite, such as in Japan.

Author Contributions

Conceptualization, K.M. (Koji Mori), H.K. and A.U.; methodology, S.S. and A.U.; validation, S.S., H.Y., A.U. and H.K.; formal analysis, S.S, H.Y., K.M. (Koji Mori), A.U., Y.H., H.E. and K.M. (Kentaro Masuoka); investigation, S.S., H.Y., K.M. (Koji Mori), Y.H., A.U., H.K., K.M. (Kentaro Masuoka), H.E. and A.T.; data curation, S.S., H.Y., K.M. (Koji Mori), Y.H., A.U., K.M. (Kentaro Masuoka), H.E. and A.T.; writing—original draft preparation, S.S., K.M. (Kentaro Masuoka) and A.U.; writing—review and editing, S.S., A.U. and H.K.; visualization, S.S.; supervision, H.K. and A.T.; project administration, H.K., K.M. (Kentaro Masuoka) and A.T.; funding acquisition, H.K. and A.T. All authors have read and agreed to the published version of the manuscript.

Funding

This research received no external funding.

Data Availability Statement

The data are contained within the article.

Acknowledgments

The authors would like to thank members of the University of Toyama, especially S. Kagaya, for his technical guidance on trace element analysis by ICP-AES. We also thank Y. Kimura of Hokkaido University and Y. Watanabe of Hosei University for the observation of minerals by TEM. The academic editor, editor, and four anonymous reviewers provided many critical, helpful, and constructive comments to improve the manuscript. We would like to express our sincere thanks to them. This study was re-commissioned by Taisei Corporation as a part of the JOGMEC project investigation in the R&D project “Carbon Recycling CO2 Geothermal Power Generation Technology”. We would like to thank the members of JOGMEC and Taisei Corporation for their cooperation.

Conflicts of Interest

The authors declare no conflicts of interest.

Appendix A

Table A1. Chemical composition of the solutions after the reactions (a) main components of RUN-1, 2, 5, 6, (b) Trace components of RUN-2.
(a) Run No.GasDuration
(days)
pHECNaKCaMgFeAlSiO2ClSO4HCO3pH *CO2 *
mS/mmg/L wt. %
RUN-1
(2022/1/13–2/4)
CO217.167.8116731.10.490.331.28465.53.53334.13.1
27.569.8122760.50.230.221.38219.24.25914.13.1
58.886.81421020.70.350.371.110009.517.55914.23.1
107.983.9143930.3<0.10.081.785610.74.16254.03.1
157.681.1140860.2<0.10.041.08499.65.76404.13.1
Ar18.732.665250.42.521.2921.46909.95.01668.1-
18.333.169220.12.491.3717.17147.44.11808.2-
28.432.968200.13.131.4719.37266.34.91828.2-
58.533.068190.23.831.5519.27486.74.11958.2-
109.235.69026<0.13.781.2916.97937.04.01788.3-
159.435.079160.13.021.8018.38997.74.01918.2-
RUN-2
(2022/7/11–7/22)
CO216.967.5117741.40.67<1.04.69255.96.73874.03.1
28.670.9132810.80.40<1.02.19825.93.84164.03.1
57.583.5156960.40.26<1.03.310348.87.24734.03.1
108.483.1165990.40.21<1.01.410407.93.94884.13.1
Ar 18.828.26119<0.12.281.2026.86844.02.91608.1-
28.930.87119<0.12.871.2423.87625.14.01718.1-
59.232.58018<0.13.061.2120.88295.92.81838.2-
109.234.08116<0.13.310.7323.78646.71.61818.2-
RUN-5
(2023/5/9–5/25)
CO217.851.289560.30.580.292.47757.24.42654.40.6
28.154.1101570.20.220.622.88427.03.22764.30.6
58.363.4111630.10.090.273.19137.73.73054.30.6
108.258.0108520.20.020.354.79107.33.52924.20.6
158.568.3118680.10.060.182.39469.25.13274.40.6
RUN-6
(2023/5/9–5/26)
CO217.853.591600.40.660.632.27795.83.12684.21.3
27.962.3104680.30.430.622.18636.33.23104.21.3
58.371.5120790.20.280.362.09527.53.73544.21.3
108.172.6122790.10.110.000.49388.33.53564.31.3
159.366.7121680.10.022.782.49869.23.53054.31.3
(b) Run No.GasDuration (days)MnCdBCrCuMoNiPb
mg/L
RUN-2
(2022/7/11–7/22)
CO21<1.0<1.016.1<1.0<1.01.8<1.0<1.0
2<1.0<1.06.0<1.0<1.00.9<1.0<1.0
5<1.0<1.08.0<1.0<1.00.8<1.0<1.0
10<1.0<1.06.7<1.0<1.00.6<1.0<1.0
Ar 1<1.0<1.014.8<1.0<1.00.5<1.0<1.0
2<1.0<1.014.5<1.0<1.00.5<1.0<1.0
5<1.0<1.07.5<1.0<1.00.4<1.0<1.0
10<1.0<1.018.4<1.0<1.00.4<1.0<1.0
*: calculated by PHREEQC.
Table A2. Saturation index of major minerals for solutions from the experiments (RUN-1, 2, 5, 6).
RUN NOGasDurationCalciteSideriteMagnesiteAragoniteDolomiteDawsoniteKaoliniteMontmor-NaIlliteNontronite-NaScoleciteSaponite-Na
NO.1CO21−3.4−1.6−3.0−3.6−5.5−4.93.22.32.7140.3−6.6
2−3.7−1.8−3.3−3.9−6.2−4.83.32.22.7140.0−7.7
5−3.3−1.2−3.3−3.4−5.7−4.73.22.52.9150.5−7.1
10−4.0−2.3−3.7−4.2−6.9−4.73.52.32.9130.0−8.8
15−4.1−2.5−3.7−4.2−7.0−4.93.11.92.412−0.6−8.8
NO.1Ar1------−0.63.02.5264.120
2------−0.92.82.3263.421
5------−0.73.02.5263.521
10------−0.73.12.5273.822
15------−1.12.92.3263.423
NO.2CO21−3.5−3.3−3.1−3.6−5.7−4.44.53.44.1101.5−6.6
2−3.6−3.2−3.1−3.8−5.9−4.63.82.93.5100.7−6.7
5−3.9−3.2−3.4−4.1−6.5−4.44.33.24.0110.9−7.5
10−3.9−3.2−3.4−4.0−6.4−4.73.52.73.1110.2−7.4
NO.2Ar1------−0.33.22.8263.820
2------−0.53.32.8263.821
5------−0.63.32.7263.722
10------−0.43.52.9263.922
NO.5CO21−4.0−1.7−3.1−4.2−6.3−5.23.72.83.5150.8−4.8
2−4.3−1.5−3.6−4.4−7.0−5.13.92.93.6160.8−6.1
5−4.6−1.8−4.0−4.8−7.7−5.04.13.03.8150.6−7.1
10−4.5−2.0−4.9−4.7−8.5−4.94.43.03.9151.1−10
15−4.4−1.8−3.9−4.6−7.4−5.03.82.93.6150.6−6.8
NO.6CO21−3.9−1.4−2.9−4.0−5.9−5.03.62.73.3150.5−5.2
2−4.0−1.4−3.1−4.1−6.3−4.93.72.83.4160.5−5.8
5−4.1−1.5−3.3−4.3−6.6−4.93.72.93.5150.5−6.0
10−4.3−2.0−3.6−4.4−7.1−5.52.31.61.814−1.1−7.3
15−4.3−0.5−4.3−4.5−7.8−4.73.92.83.4180.5−9.2
Table A3. Various parameters used in the kinetic calculations; (a) initial composition of the fluid, (b) primary and secondary minerals, (c) calculation parameters for each mineral and (d) precipitation/dissolved mineral volume.
(a) SpeciesConcentration (mol/kg_H2O)
pHCharge
Ca2+1.0 × 10⁻⁴
Mg2+1 × 10⁻²⁰
Na+4.30 × 10⁻⁵
K+2.50 × 10⁻⁵
Fe2+1 × 10⁻²⁰
SiO2(aq)1 × 10⁻²⁰
HCO3pCO2 = 4 MPa (equilibrated)
Al3+1 × 10⁻²⁰
(b)MineralFormulaPrimary Mineral
SilicatesAlbiteNaAlSi3O8
AnorthiteCa(Al2Si2)O8
ForsteriteMg2SiO4
K-FeldsparK(AlSi3)O8
Paragonite (=Glass part)NaAl2(AlSi3)O10(OH)2
Fayalite Fe2SiO4
Saponite(FeMg)Mg0.17Mg2FeAl0.34Si3.66O10(OH)2:5.039H2O
Beidellite(Mg)Mg0.3Mg0.6Al1.4Si4O10(OH)2:5.129H2O
Montmorillonite(Mg)Mg0.3Mg0.6Al1.4Si4O10(OH)2
OxidesQuartz SiO2
CarbonatesCalciteCaCO3
DolomiteCaMg(CO3)2
MagnesiteMgCO3
(c) InitialNeutralAcidBase
Primary Weight (g)Weight percent (%)Radius of mineral grain (m)Initial surface area (m2/m3)logKK (mol/m2/s)EAlogKK (mol/m2/s)EAnlogKK (mol/m2/s)EAn
AlbiteNaAlSi3O80.4832.3 *1 × 10−61 × 106 *−12.562.75 × 10−1369.8−10.166.92 × 10−11650.457−15.62.51 × 10−1671−0.572
AnorthiteCa(Al2Si2)O80.7711.11 × 10−61 × 105−9.127.59 × 10−1017.8−3.53.16 × 10−416.61.411----
FayaliteFe2SiO40.0490.7Equilibrium
ForsteriteMg2SiO40.0490.71 × 10−61 × 105−10.642.29 × 10−1179−6.851.41 × 10−767.20.47----
K-FeldsparK(AlSi3)O80.0141.0 *1 × 10−61 × 108 *−12.413.89 × 10−1338−10.068.71 × 10−1151.70.5−21.26.31 × 10−2294.1−0.823
ParagoniteNaAl2(AlSi3)O10(OH)25.6801 × 10−61 × 105−131.00 × 10−1322--------
(d)Si-Based Reactive MineralsState(Solid Phase⇔ Liquid Phase)Reaction-Dominant Mineral
Primary mineralAlbiteDissolution2.87 × 10−2
Anorthite2.41 × 10−3
Forsterite4.97 × 10−3
Microcline2.23 × 10−3
Paragonite1.08 × 10−6
Fayalite 2.10 × 10⁻³
Secondary minaeralQuartzPrecipitation7.84 × 10−4
Saponite(FeMg)1.54 × 10⁻²
Beidellite(Mg)1.76 × 10⁻²
* Calibrated. ✔ Primary minerals.

References

  1. Ministry of Economy, Trade, and Industry. Japan’s Newest “Strategic Energy Plan” Toward Carbon Neutrality by 2050. Available online: https://www.enecho.meti.go.jp/en/category/special/article/detail_168.html (accessed on 6 February 2025).
  2. Ministry of the Environment. 2050 Zero Carbon Cities in Japan. Available online: https://www.env.go.jp/en/earth/cc/2050_zero_carbon_cities_in_japan.html (accessed on 6 February 2025).
  3. Muraoka, H.; Sakaguchi, K.; Komazawa, M.; Sasaki, S. Assessment of Hydrothermal Resource Potentials in Japan. In Proceedings of the Geothermal Research Society of Japan, Kanazawa, Japan, 30 October–1 November 2008. [Google Scholar]
  4. Kaieda, H.; Kiho, K.; Motojima, I. Multiple Fracture Creation for Hot Dry Rock Development. Trends Geophys. 1993, 2, 127–139. [Google Scholar]
  5. Kaieda, H.; Yamamoto, T.; Kiho, K.; Kitano, K.; Hori, Y.; Ito, H.; Eguchi, Y.; Fujimitsu, Y.; Motojima, I. Development of Reservoir Construction Methods for Hot Dry Rock Geothermal Power-Two Stage Reservoir Creation and Its Evaluation at Ogachi; Central Research Institute of Electric Power Industry: Tokyo, Japan, 2000. [Google Scholar]
  6. Further Promotion of Geothermal Development. Available online: https://www.jogmec.go.jp/english/carbonneutral/carbonneutral_15_00006.html (accessed on 6 February 2025).
  7. Terai, A.; Ichinohe, T.; Tosha, T. Carbon Recycles CO2 Geothermal Power Generation Technology: (1) Project Overview (A22)(Abs.). In Proceedings of the Annual Meeting, Geothermal Research Society of Japan, Sendai, Japan, 26–29 October 2001. [Google Scholar]
  8. Brown, D.W. Hot Dry Rock Geothermal Energy Concept Utilizing Supercritical CO2 Instead of Water. In Proceedings of the Twenty-Fifth Workshop Geotherm Reservoir Engineering, Stanford, CA, USA, 24–26 January 2000; p. SGP-TR-165. [Google Scholar]
  9. Cabeza, L.F.; de Gracia, A.; Fernández, A.I.; Farid, M.M. Supercritical CO2 as Heat Transfer Fluid: A Review. Appl. Therm. Eng. 2017, 125, 799–810. [Google Scholar] [CrossRef]
  10. Okamoto, K.; Ota, J.; Sakurai, K.; Madarame, H. Transient Velocity Distributions for the Supercritical Carbon Dioxide Forced Convection Heat Transfer. J. Nucl. Sci. Technol. 2003, 40, 763–767. [Google Scholar] [CrossRef]
  11. Pajak, L.; Sowiżdżał, A.; Gładysz, P.; Tomaszewska, B.; Miecznik, M.; Andresen, T.; Frengstad, B.S.; Chmielowska, A. Multi-Criteria Studies and Assessment Supporting the Selection of Locations and Technologies Used in CO2-EGS Systems. Energies 2021, 14, 7683. [Google Scholar] [CrossRef]
  12. Zhao, W.; Yuan, Y.; Jing, T.; Zhong, C.; Wei, S.; Yin, Y.; Zhao, D.; Yuan, H.; Zheng, J.; Wang, S. Heat Production Performance from an Enhanced Geothermal System (EGS) Using CO2 as the Working Fluid. Energies 2023, 16, 7202. [Google Scholar] [CrossRef]
  13. Cong, L.; Lu, S.; Jiang, P.; Zheng, T.; Yu, Z.; Lü, X. Research Progress on CO2 as Geothermal Working Fluid: A Review. Energies 2024, 17, 5415. [Google Scholar] [CrossRef]
  14. Gładysz, P.; Pająk, L.; Andresen, T.; Strojny, M.; Sowiżdżał, A. Process Modeling and Optimization of Supercritical Carbon Dioxide-Enhanced Geothermal Systems in Poland. Energies 2024, 17, 3769. [Google Scholar] [CrossRef]
  15. Li, Q.; Li, Q.; Cao, H.; Wu, J.; Wang, F.; Wang, Y. The Crack Propagation Behaviour of CO2 Fracturing Fluid in Unconventional Low Permeability Reservoirs: Factor Analysis and Mechanism Revelation. Processes 2025, 13, 159. [Google Scholar] [CrossRef]
  16. Nianyin, L.; Jiajie, Y.; Chao, W.; Suiwang, Z.; Xiangke, L.; Jia, K.; Yuan, W.; Yinhong, D. Fracturing Technology with Carbon Dioxide: A Review. J. Pet. Sci. Eng. 2021, 205, 108793. [Google Scholar] [CrossRef]
  17. Aradóttir, E.S.P.; Sonnenthal, E.L.; Björnsson, G.; Jónsson, H. Multidimensional Reactive Transport Modeling of CO2 Mineral Sequestration in Basalts at the Hellisheidi Geothermal Field, Iceland. Int. J. Greenh. Gas. Control. 2012, 9, 24–40. [Google Scholar] [CrossRef]
  18. Ueda, A.; Kato, K.; Ohsumi, T.; Yajima, T.; Ito, H.; Kaieda, H.; Metcalfe, R.; Takase, H. Experimental Studies of CO2-Rock Interaction at Elevated Temperatures under Hydrothermal Conditions. Geochem. J. 2005, 39, 417–425. [Google Scholar] [CrossRef]
  19. Itoi, R.; Maekawa, H.; Fukuda, M.; Jinno, K.; Hatakenaka, K.; Yokoyama, T.; Shimizu, S. Study on Decrease of Reservoir Permeability Due to Deposition of Silica Dissolved in Reinjection Water. J. Geotherm. Res. Soc. Jpn. 1986, 8, 229–241. [Google Scholar]
  20. Gysi, A.P.; Stefánsson, A. Mineralogical Aspects of CO2 Sequestration during Hydrothermal Basalt Alteration-An Experimental Study at 75 to 250 °C and Elevated pCO2. Chem. Geol. 2012, 306–307, 146–159. [Google Scholar] [CrossRef]
  21. Gysi, A.P.; Stefánsson, A. Experiments and Geochemical Modeling of CO2 Sequestration during Hydrothermal Basalt Alteration. Chem. Geol. 2012, 306–307, 10–28. [Google Scholar] [CrossRef]
  22. Kumar, A.; Shrivastava, J.P.; Pathak, V. Mineral Carbonation Reactions under Water-Saturated, Hydrothermal-like Conditions and Numerical Simulations of CO2 Sequestration in Tholeiitic Basalt of the Eastern Deccan Volcanic Province, India. Appl. Geochem. 2017, 84, 87–104. [Google Scholar] [CrossRef]
  23. Chiba, H. Attainment of Solution and Gas Equilibrium in Japanese Geothermal Systems. Geochem. J. 1991, 25, 335–355. [Google Scholar] [CrossRef]
  24. Ueda, A.; Ajima, S.; Yamamoto, M. Isotopic Study of Carbonate Minerals from the Sumikawa Geothermal Area and Its Application to Water Movement. J. Geotherm. Res. Soc. Jpn. 2001, 23, 181–196. [Google Scholar] [CrossRef]
  25. Taniuchi, H. Recent Petrological Studies at Rishiri Volcano. Rishiri Stud. 2021, 40, 33–43. [Google Scholar]
  26. Yang, H.; Mishima, T.; Katazakai, S.; Kagabu, M. Analytical Approach Using a Chemical Equilibrium Formula and Geochemical Modeling for Alkalinity Measurements of Small Natural Water Samples. Appl. Geochem. 2023, 148, 105535. [Google Scholar] [CrossRef]
  27. Shibuya, T.; Yoshizaki, M.; Masaki, Y.; Suzuki, K.; Takai, K.; Russell, M.J. Reactions between Basalt and CO2-Rich Seawater at 250 and 350 °C, 500bars: Implications for the CO2 Sequestration into the Modern Oceanic Crust and the Composition of Hydrothermal Vent Fluid in the CO2-Rich Early Ocean. Chem. Geol. 2013, 359, 1–9. [Google Scholar] [CrossRef]
  28. Fournier, R.O. Chemical Geothermometers and Mixing Models for Geothermal Systems. Geothermics 1977, 5, 41–50. [Google Scholar] [CrossRef]
  29. Tonani, F.B. Some Remarks on the Application of Geochemical Techniques in Geothermal Exploration. In Proceedings of the 2nd International Seminar on the Results of EC Geothermal Energy Research, Ljubljana, Slovenia, 4–6 March 1980; pp. 428–443. [Google Scholar]
  30. Truesdell, A. Summary of Section Iii: Geochemical Techniques in Exploration. In Proceedings of the 2nd U.N. Symposium on the Development and Use of Geothermal Resources, Berkeley, CA, USA, 20–29 May 1975. [Google Scholar]
  31. Arnórsson, S.; Gunnlaugsson, E.; Svavarsson, H. The Chemistry of Geothermal Waters in Iceland. II. Mineral Equilibria and Independent Variables Controlling Water Compositions. Geochim. Cosmochim. Acta 1983, 47, 547–566. [Google Scholar] [CrossRef]
  32. Nieva, D.; Nieva, R. Developments in Geothermal Energy in Mexico—Part Twelve. A Cationic Geothermometer for Prospecting of Geothermal Resources. Heat. Recovery Syst. CHP 1987, 7, 243–258. [Google Scholar] [CrossRef]
  33. Giggenbach, W.F. Geothermal Solute Equilibria. Derivation of Na-K-Mg-Ca Geoindicators. Geochim. Cosmochim. Acta 1988, 52, 2749–2765. [Google Scholar] [CrossRef]
  34. Erdogan, Y.; Aksu, M.; Demirbaş, A.; Abali, Y. Analyses of Boronic Ores and Sludges and Solubilities of Boron Minerals in CO2-Saturated Water. Resour. Conserv. Recycl. 1998, 24, 275–283. [Google Scholar] [CrossRef]
  35. Budak, A.; Gönen, M. Extraction of Boric Acid from Colemanite Mineral by Supercritical Carbon Dioxide. J. Supercrit. Fluids 2014, 92, 183–189. [Google Scholar] [CrossRef]
  36. Ratouis, T.M.P.; Snæbjörnsdóttir, S.; Voigt, M.J.; Sigfússon, B.; Gunnarsson, G.; Aradóttir, E.S.; Hjörleifsdóttir, V. Carbfix2: A Transport Model of Long-Term CO2 and H2S Injection into Basaltic Rocks at Hellisheidi, SW-Iceland. Int. J. Greenh. Gas. Control. 2022, 114, 103586. [Google Scholar] [CrossRef]
  37. Parkhust, D.L.; Appelo, C.A.J. User’s Guide to PHREEQC (Ver2)-A Computer Program for Speciation, Batch-Reaction, One-Dimensional Transport, and Inverse Geochemical Calculations. U.S. Geol. Surv. 1999, 99–4259, 312. [Google Scholar] [CrossRef]
  38. Xu, T.; Sonnenthal, E.; Spycher, N.; Pruess, K. TOUGHREACT-A Simulation Program for Non-Isothermal Multiphase Reactive Geochemical Transport in Variably Saturated Geologic Media: Applications to Geothermal Injectivity and CO2 Geological Sequestration. Comput. Geosci. 2006, 32, 145–165. [Google Scholar] [CrossRef]
  39. Lo Ré, C.; Kaszuba, J.P.; Moore, J.N.; McPherson, B.J. Fluid-Rock Interactions in CO2-Saturated, Granite-Hosted Geothermal Systems: Implications for Natural and Engineered Systems from Geochemical Experiments and Models. Geochim. Cosmochim. Acta 2014, 141, 160–178. [Google Scholar] [CrossRef]
  40. Hellevang, H.; Haile, B.G.; Tetteh, A. Experimental Study to Better Understand Factors Affecting the CO2 Mineral Trapping Potential of Basalt. Greenh. Gases Sci. Technol. 2017, 7, 143–157. [Google Scholar] [CrossRef]
  41. Marieni, C.; Voigt, M.; Clark, D.E.; Gíslason, S.R.; Oelkers, E.H. Mineralization Potential of Water-Dissolved CO2 and H2S Injected into Basalts as Function of Temperature: Freshwater versus Seawater. Int. J. Greenh. Gas. Control. 2021, 109, 103357. [Google Scholar] [CrossRef]
  42. Aradóttir, E.S.P.; Sonnenthal, E.L.; Jónsson, H. Development and Evaluation of a Thermodynamic Dataset for Phases of Interest in CO2 Mineral Sequestration in Basaltic Rocks. Chem. Geol. 2012, 304–305, 26–38. [Google Scholar] [CrossRef]
  43. Aradóttir, E.S.P.; Sigfússon, B.; Sonnenthal, E.L.; Björnsson, G.; Jónsson, H. Dynamics of Basaltic Glass Dissolution-Capturing Microscopic Effects in Continuum Scale Models. Geochim. Cosmochim. Acta 2013, 121, 311–327. [Google Scholar] [CrossRef]
  44. Pollyea, R.M.; Rimstidt, J.D. Rate Equations for Modeling Carbon Dioxide Sequestration in Basalt. Appl. Geochem. 2017, 81, 53–62. [Google Scholar] [CrossRef]
  45. Gysi, A.P.; Stefánsson, A. CO2-Water-Basalt Interaction. Numerical Simulation of Low Temperature CO2 Sequestration into Basalts. Geochim. Cosmochim. Acta 2011, 75, 4728–4751. [Google Scholar] [CrossRef]
  46. Hangx, S.J.T.; Spiers, C.J. Reaction of Plagioclase Feldspars with CO2 under Hydrothermal Conditions. Chem. Geol. 2009, 265, 88–98. [Google Scholar] [CrossRef]
  47. Kuroda, Y.; Yamada, Y.; Ueda, A.; Matsuoka, T.; Yamada, N. Experimental Research of Plagioclase (Rock)-Gas-Water Interaction at Hyrrothrmal Conditions for CO2 Mineralization. J. Mineral. Petrol. Sci. 2009, 38, 111–121. [Google Scholar] [CrossRef]
  48. Oochi, R.; Aoyama, K.; Ueda, A. Zero-Emission Geothermal Power Generation: Experimental Study on Carbonate Mineralization through CO2-Andesitic Pyroclastic Rock Interaction at Oku-Aizu Geothermal Plant. J. Energy Power Technol. 2020, 2. [Google Scholar] [CrossRef]
  49. Mao, D.; Zhang, J.; Hoshino, Y.; Satake, S.; Yang, H.; Kuramitz, H.; Ueda, A.; Terai, A. Geochemical Study of Fluid Origin and Caprock Formation with Carbonate Mineral Precipitation in the Okuaizu Geothermal Area. Geothermics 2025, 127, 103242. [Google Scholar] [CrossRef]
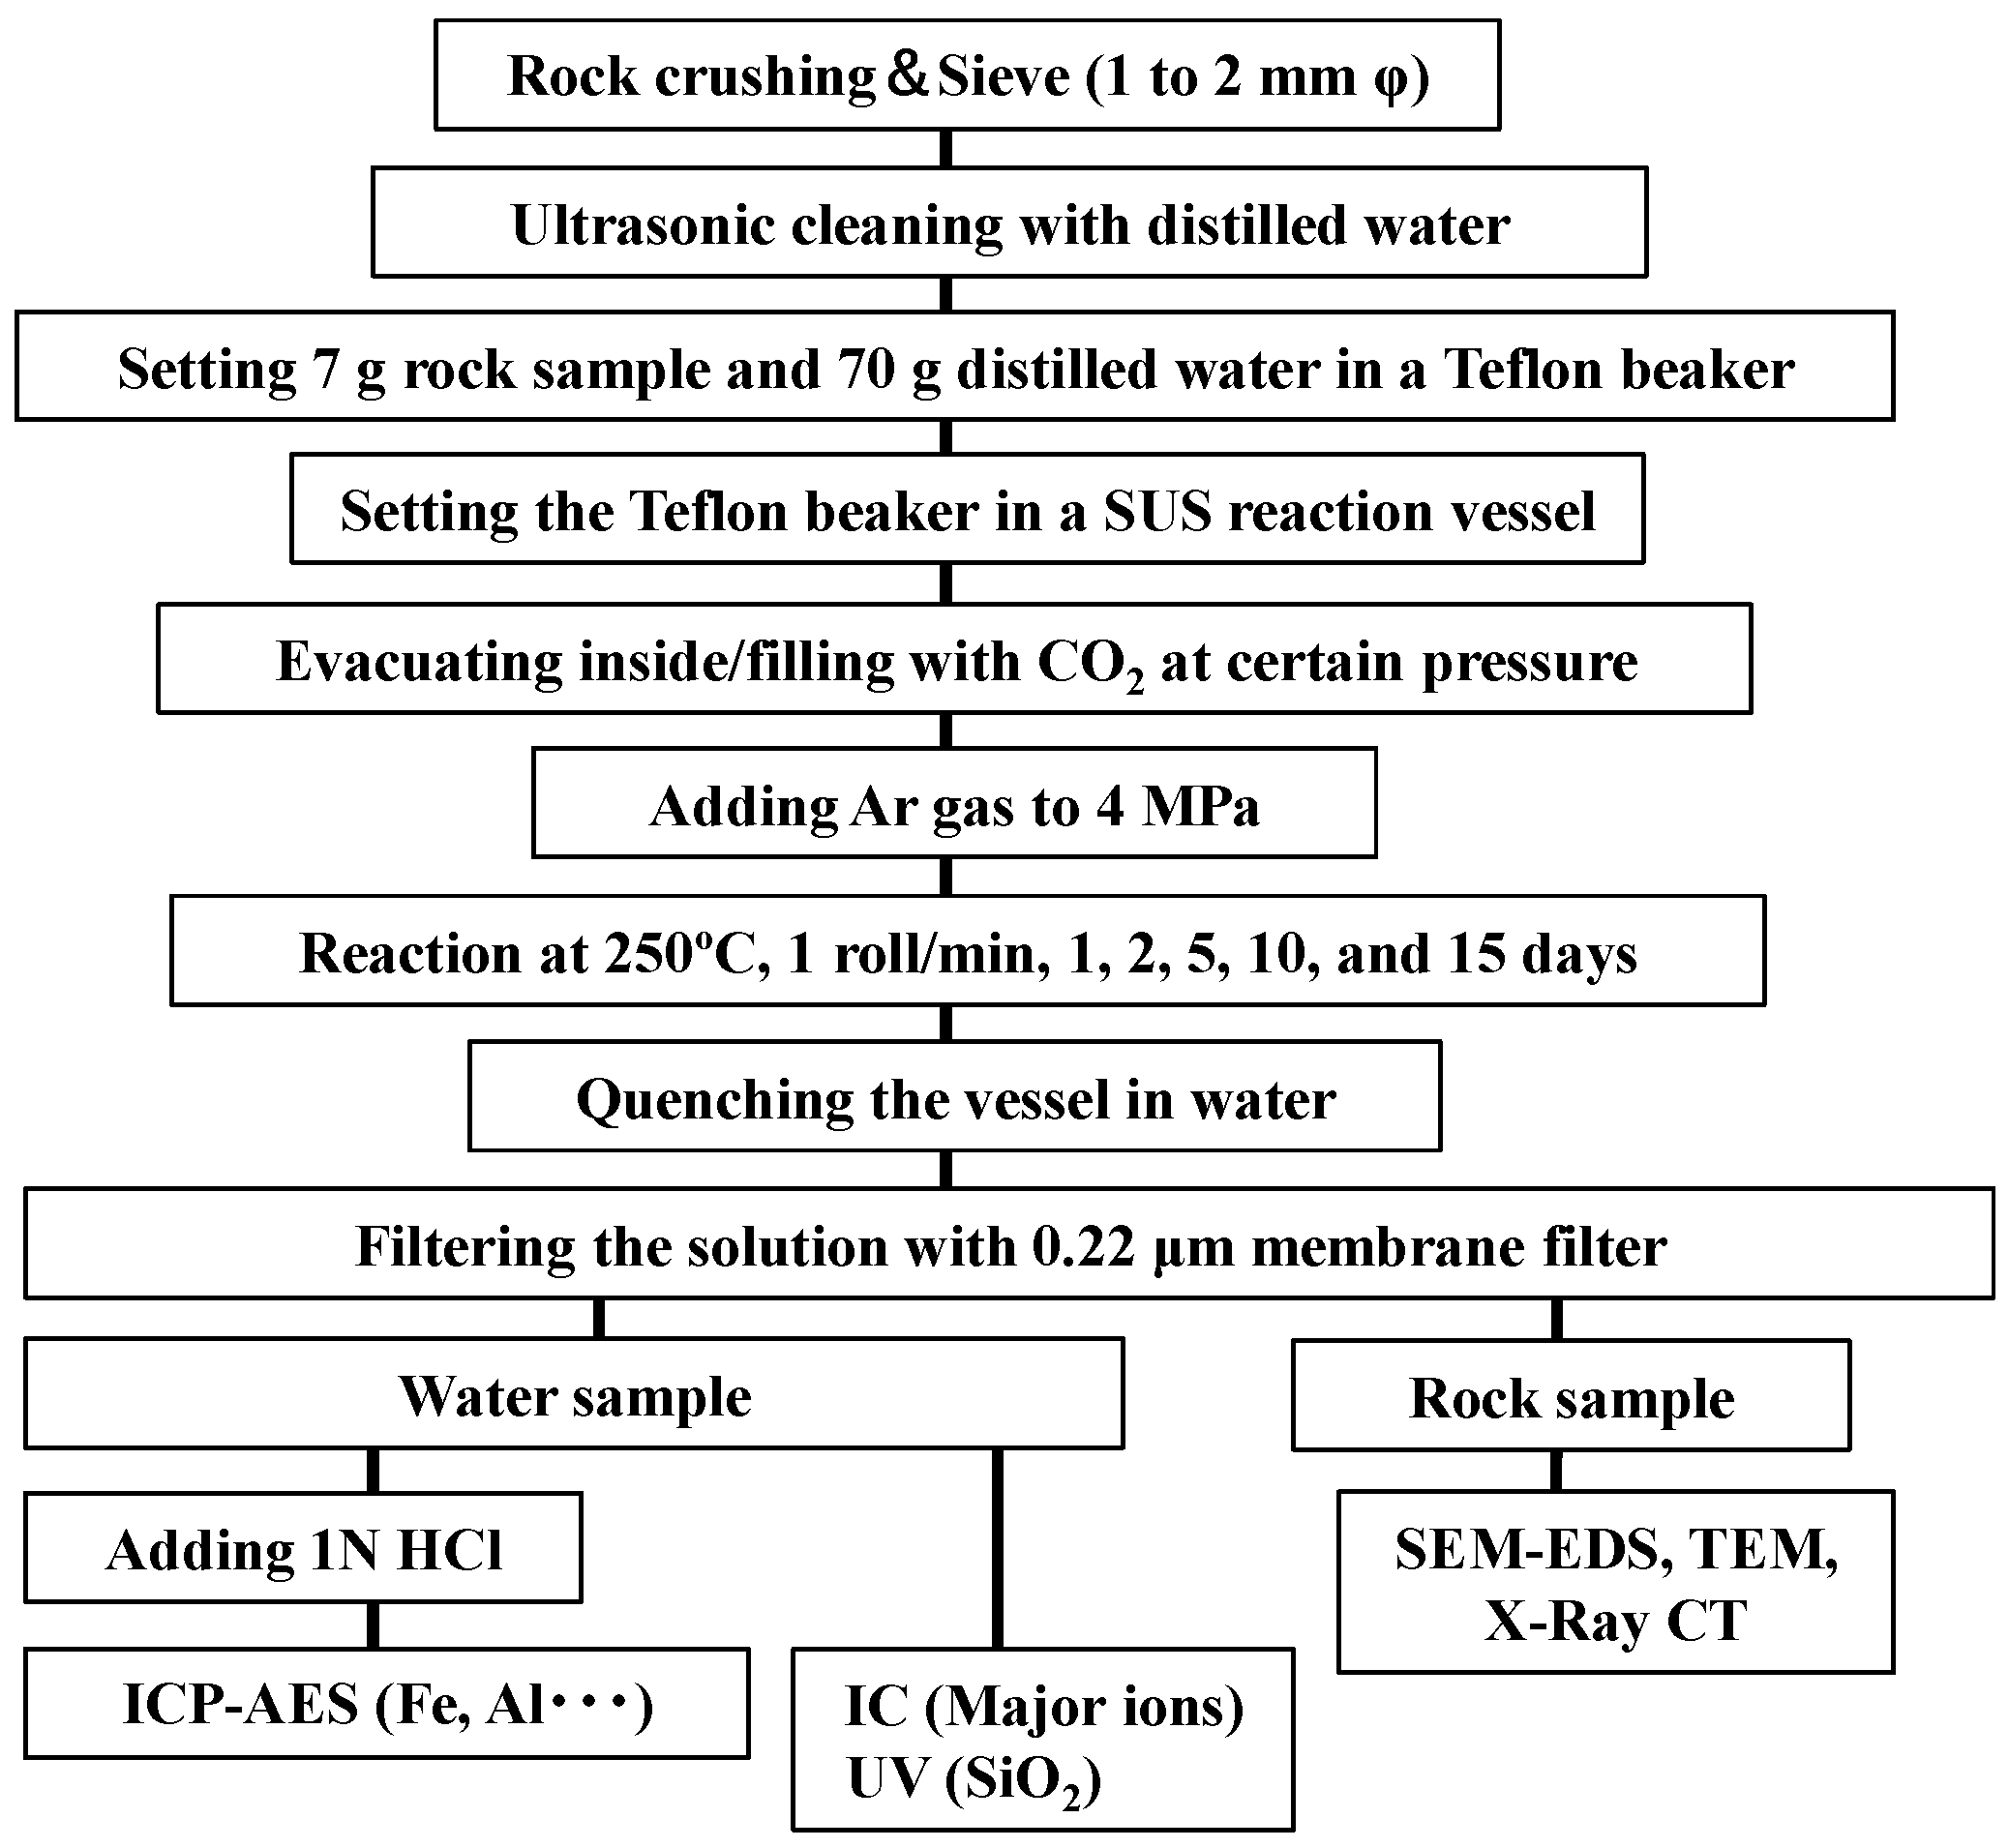
Figure 1. Flowchart of the experimental procedures.
Energies 18 02251 g001
Figure 2. (a) Photographs and (b) microscopic images of thin sections (left and right are open and crossed Nichol prism, respectively) of the Rishiri Island basalt used in laboratory tests.
Energies 18 02251 g002
Figure 3. Experimental device used for the batch-type laboratory experiments.
Energies 18 02251 g003
Figure 4. Chemical composition of the solution after the reaction under CO2 (blue) and Ar (orange) gas (□: RUN-1, ∆: RUN-2).
Energies 18 02251 g004
Figure 5. Chemical composition of the solution after the reaction under different initial CO2 concentrations (□: RUN-1 CO2, ◊: RUN-6, ∆: RUN-5, ○: RUN-1 Ar).
Energies 18 02251 g005
Figure 6. SEM images of the rock surfaces: (a) unreacted, reacted with the initial CO2 pressure of (b) 4, (c) 2, (d) 1 MPa and (e) Ar.
Energies 18 02251 g006
Figure 7. TEM image of the precipitates reacted for 10 d under a (a) CO2, (b) Ar atmosphere.
Energies 18 02251 g007
Figure 8. Surface area and volume of the rock grains during the batch experiments under a (a) CO2 and (b) Ar atmosphere (RUN-1).
Energies 18 02251 g008
Figure 9. Saturation index of the mineral phases calculated from the chemical compositions of the solutions after the reaction with CO2 at (a) SI of carbonate (RUN-1), (b) SI of clay mineral (RUN-1), (c) SI of carbonate minerals versus CO2 concentration.
Energies 18 02251 g009
Figure 10. Calculated major cation concentrations versus reaction time and comparison with experimental data (RUN-1). (a) Na, K, (b) Ca, Mg, (c) Si, Al, Fe, and (d) amounts of secondary minerals.
Energies 18 02251 g010
Table 1. Chemical composition of the rock sample used in the laboratory experiments.
Componentwt. %
SiO250.2
TiO21.1
Al2O314.8
CaO9.0
MgO3.4
MnO0.18
Total Fe as Fe2O316.1
Na2O3.3
K2O0.61
P2O50.22
H2O+<0.1
H2O0.20
Table 2. Chemical composition of the phenocryst minerals in Rishiri Island basalt analyzed by an EPMA: (a) plagioclase, (b) olivine, and (c) clinopyroxene.
(a) Olivine(b) Clinopyroxene(c) Plagioclase
Core 1Core 2 Core Rim Core Rim
ElementCations per 4 OxygensElementCations per 6 OxygensElementCations per 8 Oxygens
Si0.990.99Si1.941.93Si2.392.47
Ti0.000.00Ti0.020.02Ti0.000.00
Al0.000.00Al0.070.10Al1.581.50
Cr0.000.00Cr0.020.01Fe0.020.02
Fe0.510.51Fe0.210.22Mn0.010.01
Mn0.010.01Mn0.010.01Ca0.620.54
Ni0.000.00Mg0.920.89Na0.390.44
Mg1.481.49Ca0.800.82K0.010.01
Ca0.010.01Na0.030.03
Total cation3.003.01Total cation4.014.01Total cation5.025.00
mol % mol % mol %
Forsterite74.374.5Wollastonite41.342.4Anorthite61.054.5
Fayalite25.725.5Enstatite47.646.2Albite38.044.3
Ferrosilite11.111.3Orthoclase1.01.2
Table 3. Experimental conditions for the batch tests.
RUN No.GasInitial CO2 Pressure at 25 °C (MPa)Initial Total Pressure at 25 °C (MPa)Total Pressure at 250 °C (MPa)CO2 (wt. %) at 250 °CDuration (Days)
1CO2
or
Ar
44103.11–15
00
243.11–10
00
510.61–15
621.3
Disclaimer/Publisher’s Note: The statements, opinions and data contained in all publications are solely those of the individual author(s) and contributor(s) and not of MDPI and/or the editor(s). MDPI and/or the editor(s) disclaim responsibility for any injury to people or property resulting from any ideas, methods, instructions or products referred to in the content.