1. Introduction
The global climate crisis is accelerating, with increasingly severe impacts such as rising temperatures, extreme weather events, and shifting ecosystems. As a response, many countries have committed to achieving carbon neutrality by mid-century, driven by the urgent need to reduce greenhouse gas emissions and mitigate the effects of climate change [
1,
2]. The transition to renewable energy resources, particularly solar and wind power, is essential for reducing reliance on fossil fuels and curbing carbon emissions [
3]. However, the integration of these renewable energy sources into power grids presents significant challenges due to their intermittent and variable nature [
4]. Microgrids, which are localized energy systems capable of operating independently or alongside the main grid, have emerged as a key solution to improve the reliability and efficiency of renewable energy integration [
5]. By incorporating distributed renewable energy resources, such as solar and wind, microgrids enhance grid resilience and contribute to the broader goals of carbon neutrality and climate stabilization [
6]. However, the optimal operation of renewable energy-based microgrids relies heavily on accurate forecasting of both energy generation and consumer demand. In particular, solar and wind power generation can be highly variable due to changing weather conditions, making reliable prediction models essential for ensuring the stability of the microgrid [
7,
8].
The efficient operation of microgrids depends not only on the accurate forecasting of renewable energy generation but also on the precision of electricity demand predictions. Inaccurate forecasting of both generation and demand can lead to supply–demand imbalances, which, in turn, reduce the stability of energy supply, increase unnecessary power waste, and incur additional operational costs [
9]. In particular, when forecasting errors are significant, microgrid operators must secure additional energy storage systems (ESSs) and increase the capacity of auxiliary power generation, leading to higher initial investment and maintenance costs [
10]. Additionally, mismatches between power generation and demand necessitate frequent system adjustments to maintain stability, further escalating overall operational costs [
11]. Conversely, improving forecasting accuracy can maximize annual energy savings in microgrids while minimizing the infrastructure costs required for system deployment and operation. Enhanced prediction accuracy allows for optimal sizing of ESSs and power generation units, thereby preventing excessive capital investment in equipment [
12]. Moreover, from a maintenance perspective, higher forecasting precision reduces unnecessary system operations and maintenance activities, leading to improved operational efficiency and long-term cost savings. Therefore, to ensure the stable and cost-effective operation of microgrids, it is essential to enhance the accuracy of forecasting models for solar and wind power generation while reducing errors in electricity demand prediction.
This paper presents a hybrid modeling framework designed to optimize the operation of microgrids by improving the accuracy of renewable energy forecasts. The framework integrates high-resolution physical models, data-driven models, and a combination of both, allowing for enhanced prediction of solar and wind power generation. Specifically, hybrid models for solar and wind energy generation forecasting are crucial for ensuring the stability and efficiency of microgrids. Furthermore, integrating these models into digital twin platforms allows for real-time simulation and validation, ensuring that the models are both accurate and practical for real-world applications.
Building on this foundation, this paper focuses on the development of a hybrid modeling framework designed to optimize the operation of microgrids by enhancing the accuracy of renewable energy forecasts. The framework integrates physical and data-driven models for solar and wind energy forecasting, as well as consumer demand modeling, within a digital twin platform. Additionally, we established a validation system for the digital twin platform and each model based on SILS and Hardware-in-the-Loop Simulation (HILS). By improving forecasting accuracy, this research contributes to the broader goals of carbon neutrality and provides valuable insights into the future of sustainable energy systems.
This paper is structured as follows. In
Section 2, we review existing studies on hybrid models and the enhancement of renewable energy generation forecasting using hybrid models.
Section 3 provides a detailed description of the proposed system’s architecture, including the development of physical models and data models for predicting renewable energy (solar and wind) generation. Additionally, it discusses the development of the hybrid model, which combines the physical and data models to improve renewable energy forecasting accuracy.
Section 4 addresses the implementation of the renewable energy digital twin model, along with the simulation environment and performance validation. Finally,
Section 5 concludes with a summary of the developed work and suggestions for future research directions.
2. Related Work
Forecasting the variability of renewable energy sources has become increasingly critical for achieving reliable and efficient power system operation. Various artificial intelligence techniques have been actively studied to improve the accuracy of renewable energy generation forecasting, including solar and wind power prediction. Conventional forecasting models have primarily relied on data-driven approaches using collected historical and meteorological data. When data availability is limited, physics-based models have been adopted to simulate the physical behavior of energy systems. Recently, an increasing number of studies have focused on hybrid modeling frameworks that integrate both data-driven and physics-based methods to enhance predictive performance and generalizability. Ref. [
13] proposed a hybrid modeling structure that integrates machine learning with simulation-based models. Their study outlines several hybridization strategies and emphasizes the potential of combining physically interpretable and data-adaptive components for improved forecasting accuracy. Unlike this general-purpose framework, the current study constructs a task-specific hybrid model tailored for renewable energy forecasting by embedding a computational fluid dynamics (CFD) model with transfer learning-based data-driven modules. Similarly, Ref. [
14] presented a comprehensive review of hybrid modeling methodologies, emphasizing their strengths in combining data-driven learning with first-principles knowledge to enhance model accuracy, generalizability, and interpretability. Their study highlights the applicability of hybrid approaches across various domains, including energy systems, and provides methodological guidance for their effective implementation. This perspective further reinforces the value of hybrid models in renewable energy forecasting, where capturing both physical system dynamics and data-driven patterns is critical for accurate and reliable predictions. Ref. [
15] proposed a deep learning-based hybrid model for short-term load forecasting and smart grid information management. The model combines GRU, TCN, and attention mechanisms to effectively learn long-term dependencies and complex temporal patterns in load data. It demonstrated high prediction accuracy and computational efficiency across four public datasets, including GEFCom2014. This framework, which integrates multiple deep learning architectures, represents a strong example of balancing predictive performance, efficiency, and interpretability. This methodological approach, which is similar to our research, highlights the growing importance of hybrid modeling in energy systems, particularly in the context of smart grid operation and intelligent energy management. Ref. [
16] introduced a hybrid framework combining machine learning with finite element analysis to enhance the accuracy of a blade-bearing test bench model. Using random forest algorithms to estimate non-measurable parameters, their work demonstrated the effectiveness of integrating data-driven and physics-based methods.
Ref. [
17] developed a hybrid CNN-LSTM architecture in which CNNs extract spatial features from weather inputs, and LSTMs capture temporal patterns. Their model achieved a 21% improvement in forecasting accuracy over standalone deep learning models. However, their approach is limited to data-driven deep learning methods and does not incorporate physical system knowledge, which may affect generalization under unseen environmental conditions. Similarly, Ref. [
18] proposed an adaptive learning-based hybrid model for solar irradiance forecasting. This model integrates a Time-Series Linear Model (TMLM), a Genetic Algorithm-Based Neural Network (GABP), and an adaptive online learning algorithm. The TMLM analyzes short-term fluctuations in solar irradiance, while the GABP optimizes the neural network’s weights using a genetic algorithm. Additionally, the adaptive online learning algorithm continuously updates the model in real time to enhance performance in response to environmental changes. This approach demonstrated superior performance compared to conventional models in both short-term and long-term solar irradiance forecasting, maintaining high reliability, even under highly variable environmental conditions. Compared to this work, the present study emphasizes hybridization across modeling paradigms, combining physics-informed predictions with data-driven learning. Ref. [
19] introduced a pipeline integrating clustering, classification, and regression to improve PV forecasting under weather variability. This study aimed to address the issue of PV power fluctuations caused by varying weather conditions and emphasized the importance of accurate forecasting for effective grid operation management. The proposed method focused on improving PV forecasting accuracy by analyzing multiple machine learning models and weather parameters. Clustering and classification algorithms were utilized to group data points with similar weather conditions, followed by the application of segmented regression to these groups. The forecasting model was designed to utilize next-day weather predictions to determine the most suitable model for forecasting. Their approach proved effective in handling data-driven variability. However, it does not incorporate physical modeling. In contrast, our framework addresses this gap by combining synthetic data generation through CFD simulations with machine learning in a unified forecasting structure. Furthermore, whereas their model relies on post-clustering regression for prediction, our method integrates real-time physical simulation outputs directly into the learning process, enabling improved generalization under diverse and unseen environmental conditions. Ref. [
20] investigated short-term forecasting techniques for PV power generation, analyzing the impact of various weather conditions, such as solar irradiance and cloud cover, on power output prediction. To enhance forecasting accuracy, five different prediction models were developed and tested. These models included an Autoregressive Integrated Moving Average (ARIMA), a Support Vector Machine (SVM), an Artificial Neural Network (ANN), an Adaptive Neuro-Fuzzy Inference System (ANFIS), and a hybrid model utilizing a genetic algorithm (GA). The study results demonstrated that the GA-based hybrid model outperformed individual forecasting models in terms of accuracy and efficiency. However, all the methods evaluated were purely data-driven, whereas our framework incorporates physics-based simulations for better reliability under sparse data conditions. Ref. [
21] proposed an advanced hybrid ensemble learning framework for solar power forecasting, providing a reliable predictive model for grid stability and renewable energy integration. This study applied the Ensemble Averaging technique, which leverages the strengths of multiple machine learning models and integrates them into a single predictive model. The Ensemble Averaging model combined five individual forecasting models using a weighted-averaging approach to predict solar power generation. The models used in the forecasting process included the Nonlinear Autoregressive Neural Network (NAR-NN), Nonlinear Autoregressive Neural Network with Exogenous Signal (NARX-NN), Least Squares Boosted Decision Tree Model, Support Vector Regressor (SVR) with RBF Kernel, and Extreme Learning Machine (ELM). Ref. [
22] proposed a hybrid deep learning model combining Wavelet Packet Decomposition (WPD) and LSTM networks to forecast PV power generation one hour ahead at five-minute intervals. The proposed approach first utilizes WPD to decompose the original PV power time series into multiple sub-series. Then, four independent LSTM networks are trained separately on these sub-series. Finally, the predicted results from each LSTM model are reconstructed, and a linear weighting method is applied to obtain the final forecasting output. Although effective in handling temporal variation, the absence of physical insights limits the robustness of their approach in extreme weather scenarios. Moreover, in newly deployed or data-scarce sites where sufficient historical data are not available, the lack of a simulation-based physical model hinders the ability to ensure accurate forecasting and system reliability. Ref. [
23] proposed a novel forecasting method for solar irradiance, which is directly correlated with PV power generation, considering both short-term and medium-term forecasting horizons. The study introduced a hybrid framework based on the truncated-regularized kernel ridge regression model, applying a fast-trainable statistical learning technique to enhance prediction performance. By incorporating multiple weather parameters as input variables, the model demonstrated improved scalability and exhibited high forecasting accuracy, particularly in highly variable weather conditions. The proposed model was validated using real-world datasets collected from Seattle and Medford, USA, including both clear and cloudy weather conditions. In contrast, our model leverages simulation-driven data to supplement real-world measurements, addressing scenarios where field data are insufficient. Ref. [
24] conducted a study to enhance the accuracy of three-hour accumulated solar irradiance forecasts provided by Numerical Weather Prediction (NWP) systems using SVR, Gradient Boosted Regression (GBR), Random Forest Regression (RFR), and a hybrid approach combining these techniques. This study explores the potential application of machine learning (ML) and hybrid artificial intelligence systems in solar irradiance forecasting, demonstrating that ML-based hybrid models effectively complement NWP forecasts and improve the accuracy of solar irradiance predictions. Unlike post hoc correction methods, our model tightly integrates forecasting and simulation components within a unified predictive loop. Ref. [
25] developed a hybrid PV forecasting model that combines irradiance-based physical features with a two-stage data-driven framework, improving accuracy and efficiency in microgrid applications. This approach closely aligns with our method of integrating physical and machine learning components for renewable energy forecasting.
Ref. [
26] developed a machine learning-based hybrid model to improve the accuracy of wind power forecasting. This study proposed a hybrid forecasting approach integrating Gray Relational Analysis (GRA) and wind speed distribution characteristics. The model dynamically adjusted the weights of individual forecasting models based on wind speed intervals and similar wind speed frequencies, enabling more precise wind power predictions. The results demonstrated that the proposed forecasting model exhibited high applicability in very-short-term (15-minute-ahead) wind power forecasting. Their method has shown promise in improving predictive accuracy for wind power in ultra-short-term horizons; however, it does not incorporate model-based simulation or dynamic weighting—two central contributions of our framework. Without these components, the robustness and adaptability of the model may be limited, particularly in data-scarce environments or under dynamic system conditions. Ref. [
27] proposed the ESMD-PSO-ELM hybrid forecasting model, which integrates Extreme-Point Symmetric Mode Decomposition (ESMD), ELM, and Particle Swarm Optimization (PSO). The proposed approach first applies ESMD to decompose wind power data into multiple Intrinsic Mode Functions (IMFs) and a residual component (R). Then, the PSO-ELM method is employed to predict each IMF and R individually. Finally, the predicted values of these components are combined to generate the final wind power forecast. This study validated the model using real-world wind power data collected in Yunnan, China, from 1 April 2016 to 30 April 2016, comprising a total of 2880 observations. The empirical results confirmed that the ESMD-PSO-ELM model outperforms traditional forecasting methods, demonstrating greater robustness and higher prediction accuracy. Their modular design parallels our use of component-wise integration but differs in lacking a real-time digital twin validation environment. While their approach effectively decomposes complex time series and optimizes prediction through evolutionary algorithms, it does not incorporate real-time feedback from simulated system behavior. In contrast, our framework embeds the hybrid prediction model within a digital twin infrastructure, enabling continuous validation, monitoring, and adaptation of model predictions based on evolving system dynamics. Ref. [
28] proposed a hybrid ultra-short-term wind power forecasting model by integrating the strengths of data-driven and physics-based models. In this study, a wind power conversion model was developed to address periods of significant wind speed fluctuations, incorporating the inertial operating characteristics of wind turbines as a physics-based forecasting model. Conversely, during stable power output phases, a data-driven ultra-short-term forecasting framework utilizing a temporal attention mechanism was introduced. The proposed model was validated using real-world wind farm data from Inner Mongolia, China, and the experimental results demonstrated that the root mean square error (RMSE) remained below 13% for four-hour-ahead predictions. This approach shares conceptual similarities with our work; however, our model extends the principle further by applying it across both solar and wind energy forecasting domains. In addition, we employ the Weighted Inverse Error Weighting (WIEW) strategy for the real-time integration of physical and data-driven model outputs, allowing for enhanced adaptability and robustness under varying environmental conditions. Ref. [
29] proposed a high-precision hybrid approach that integrates historical wind farm data and NWP data for wind power forecasting. The forecasting process consists of three sequential stages: wind direction prediction, wind speed prediction, and wind power prediction, where the same hybrid methodology is applied in each stage, differing only in the input dataset. The proposed approach comprises outlier detection, time-series decomposition using wavelet transform, effective feature selection, and prediction using a Multilayer Perceptron (MLP) neural network. The model was validated using real-world data from the Sotavento wind farm in Spain, and the experimental results demonstrated exceptionally high forecasting accuracy. However, while the multi-stage design enhances the precision of wind power forecasts, it lacks a mechanism for integrating physical modeling or enabling real-time system feedback. In contrast, our framework embeds hybrid forecasting models within a digital twin environment, allowing for continuous performance validation and adaptation in response to dynamic environmental and operational changes. Unlike their static structure, our model adapts dynamically to data quality and availability, ensuring robust performance in both high-data and low-data regimes. Ref. [
30] proposed a novel hybrid forecasting approach by integrating the ARIMA model with a backpropagation neural network (BPNN). Their hybrid model was designed to enhance prediction performance by incorporating wind speed, wind direction, and the physical constraints of wind farms. The effectiveness of the proposed method was validated using real-world wind farm data, and the results indicated improved forecasting accuracy. However, the model lacks an adaptive mechanism that incorporates real-time physical simulation or continuous validation, limiting its scalability and flexibility under dynamic grid or weather conditions. In contrast, our framework leverages a digital twin structure to iteratively refine predictions based on ongoing system states, thereby enhancing robustness and adaptability in operational environments. Ref. [
31] proposed a hybrid approach that integrates elements of physical and statistical models to improve forecasting accuracy. This study developed three forecasting systems using Artificial Neural Networks (ANNs) to predict wind power generation at 1 h, 3 h, 6 h, 12 h, and 24 h horizons. Additionally, the study analyzed forecasting errors across different time horizons and evaluated the statistical distribution of the prediction errors. The results demonstrated that the hybrid model, which combines NWP data and real-time measurements, outperforms purely statistical models, particularly in long-term wind power forecasting. However, their framework lacks systematic integration with real-time simulation feedback and does not implement adaptive learning strategies that respond to changing system dynamics. In contrast, our proposed model operates within a digital twin environment, enabling continuous refinement of forecasting outputs based on real-time measurements and simulation feedback using the SILS and PHILS methodologies. Ref. [
32] proposed a hybrid forecasting model that integrates chaotic analysis and granular computing (GrC) for wind power prediction. The study conducted a physical analysis of the chaotic characteristics of wind power time series and applied data reconstruction in the chaotic phase space, generating low-dimensional input data with richer information to improve modeling accuracy. The proposed approach was validated using real-world wind farm data, demonstrating its effectiveness in enhancing short-term wind power forecasting accuracy. Our model differentiates itself by integrating these perspectives within a digital twin framework using SILS and PHILS for system-level validation. Ref. [
33] developed a hybrid wind power forecasting model combining EMD and ESN, which improved accuracy and efficiency across multiple datasets. Their approach aligns with our goal of integrating physical features and machine learning to enhance wind forecasting in microgrid and regional settings.
These related studies collectively demonstrate the importance of hybrid approaches in renewable energy forecasting. However, most prior works focus on model-level hybridization without leveraging simulation for training or real-time integration. Building on these studies, the proposed research advances the field by introducing a digital twin-based hybrid framework that not only combines data-driven and physical models but also utilizes simulation outputs as synthetic data and adaptively fuses predictions using the WIEW strategy.
3. Development of a Hybrid Modeling Framework
This chapter presents the development of solar and wind power forecasting models, which are the core components of the hybrid modeling framework. It details the construction of data-driven prediction models and simulation-based physical models for solar and wind power generation. Furthermore, it describes the process of integrating these models to develop a hybrid forecasting model for improved prediction accuracy. Additionally, this chapter discusses the establishment of a high-availability server infrastructure to efficiently collect and store data from the hybrid forecasting model and demonstration site.
3.1. Development Structure and Data Flow of the Hybrid Modeling Framework
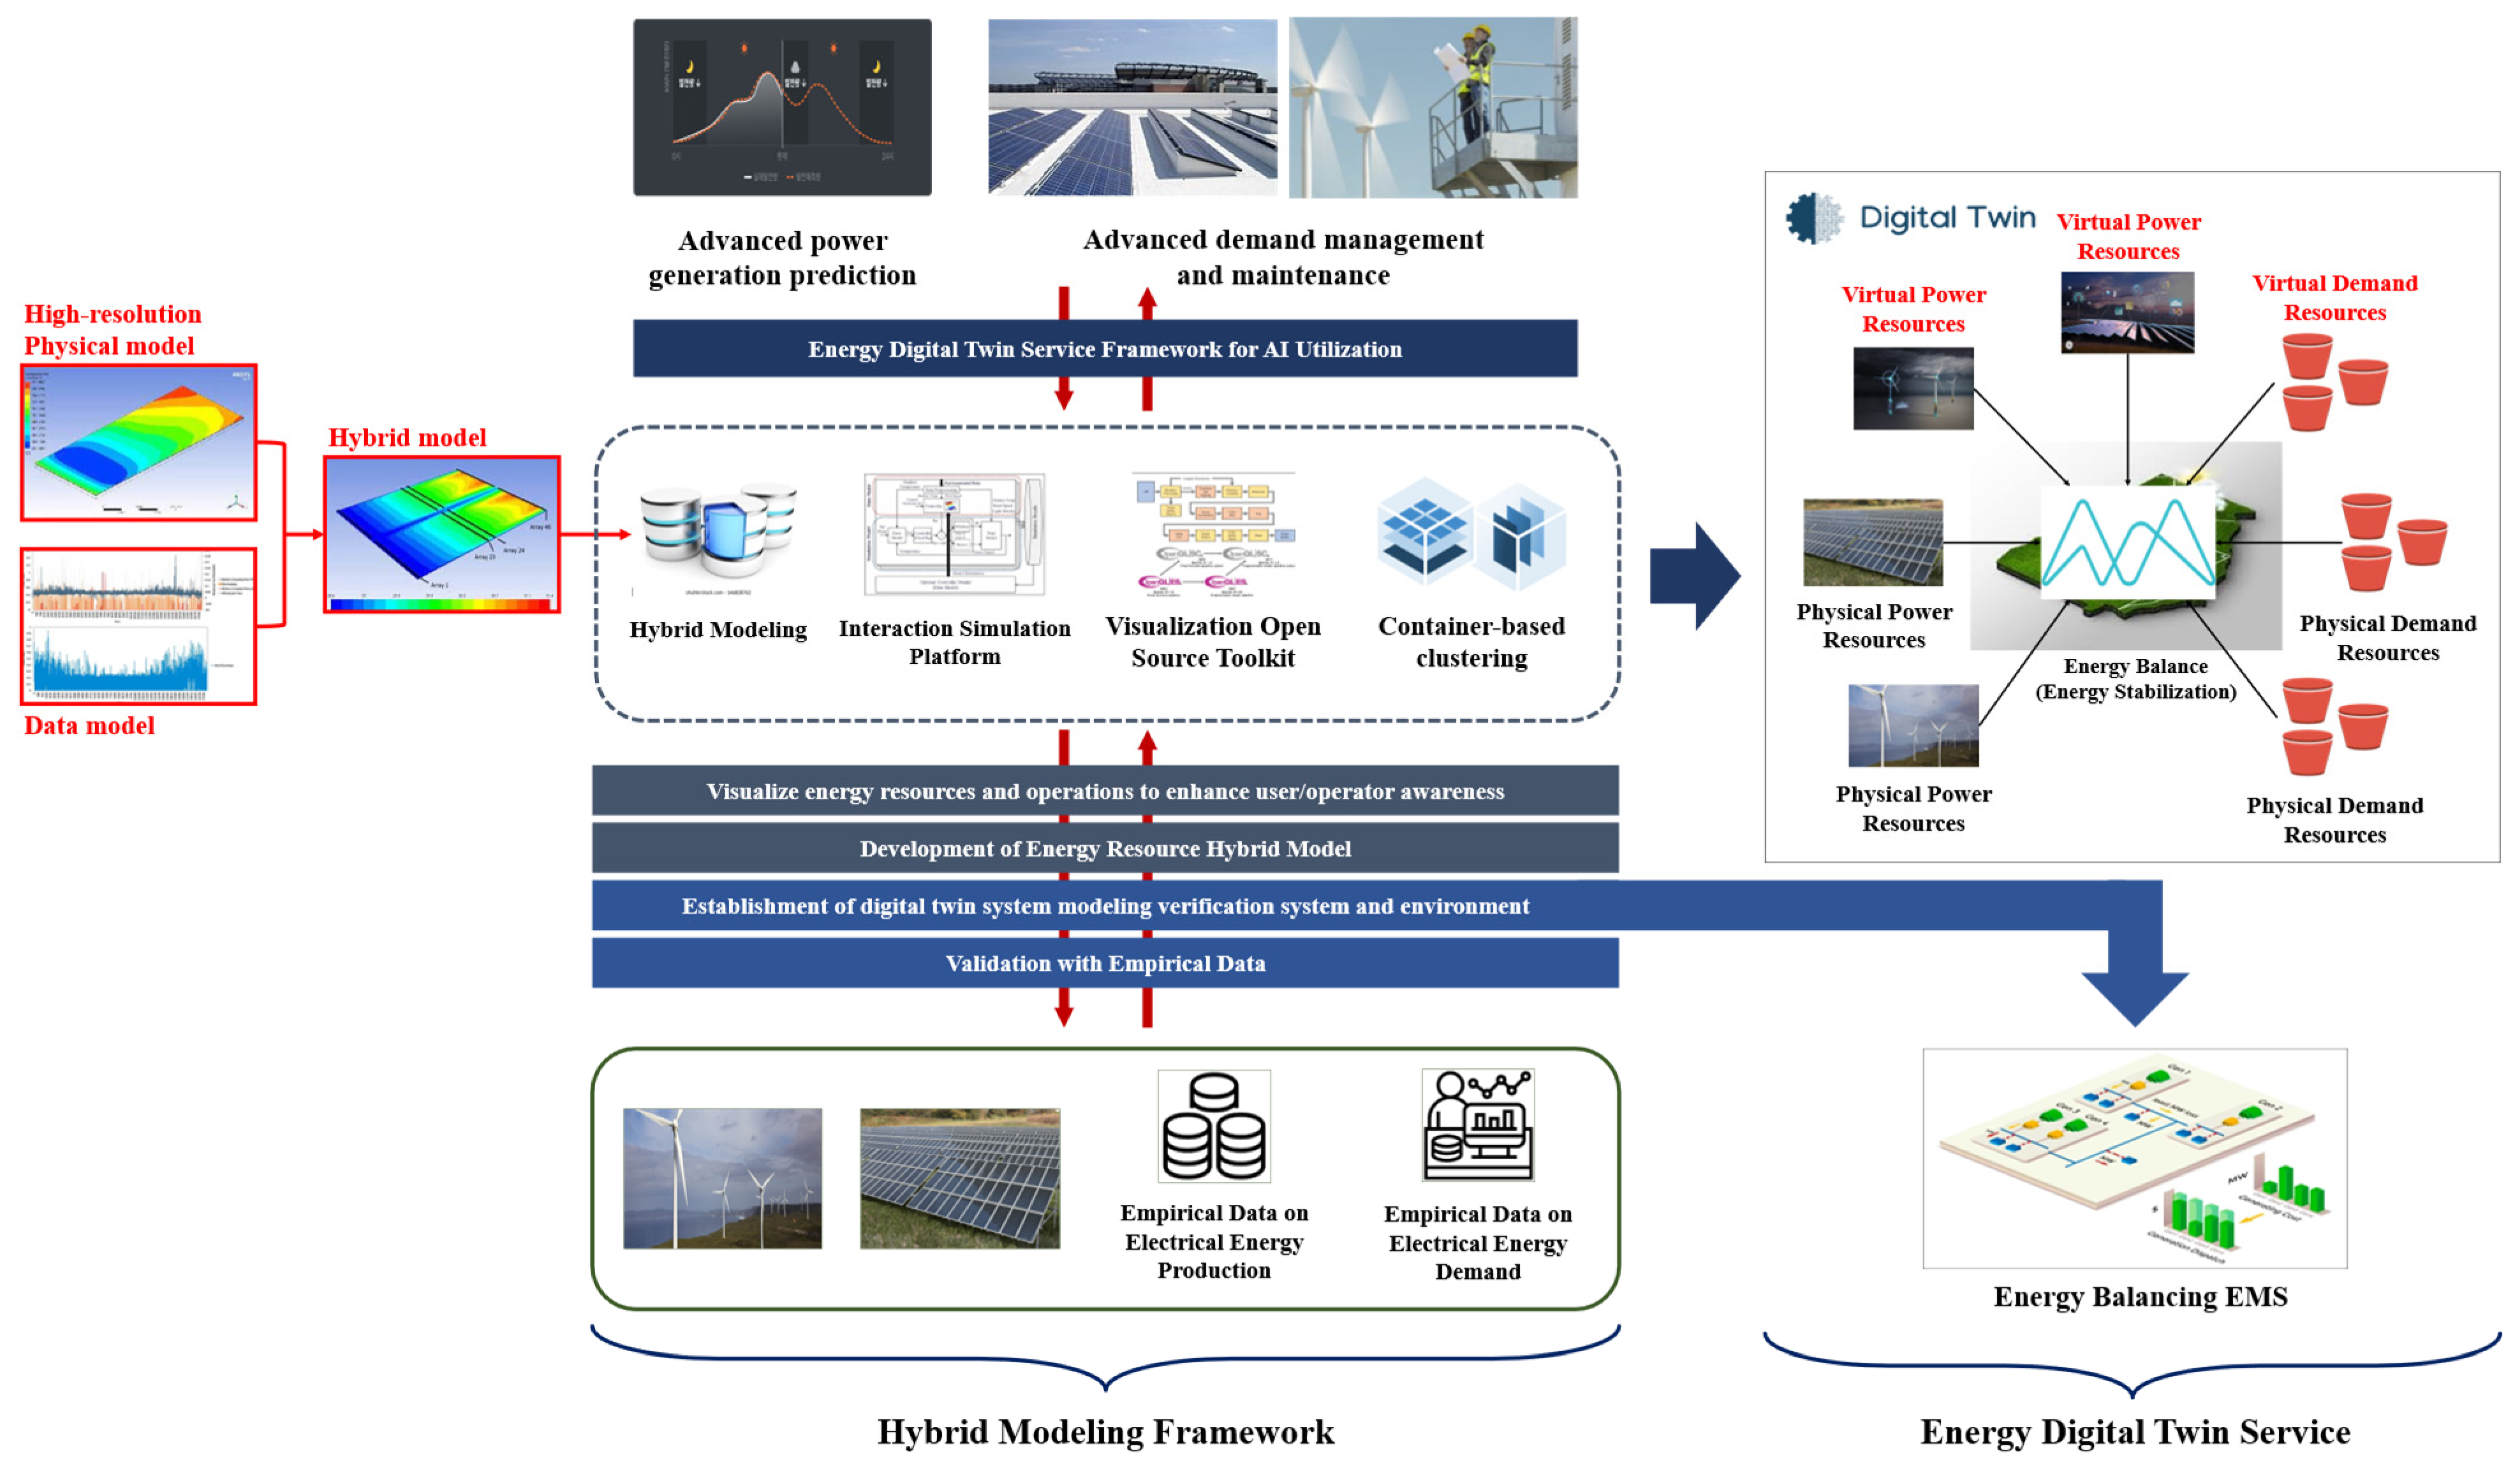
The development structure and data flow of the hybrid modeling framework are illustrated in
Figure 1. This architecture consists of two main components: the hybrid modeling framework and the energy digital twin service that utilizes this framework. The hybrid modeling framework incorporates a hybrid forecasting model for predicting renewable energy generation. Additionally, it provides key components such as:
A simulation library for integration with the digital twin (SILS);
Hybrid forecasting model for solar and wind power generation prediction;
A PHILS module for validating simulation data;
An Energy Management System (EMS) algorithm for managing electrical energy within microgrids;
A data acquisition module for collecting electrical energy data from renewable energy generation sites;
A visualization toolkit for real-time monitoring and analysis.
Figure 1.
Development structure and data flow of the hybrid modeling framework.
Figure 1.
Development structure and data flow of the hybrid modeling framework.
The energy digital twin service leverages the developed hybrid modeling framework to integrate both actual and virtual power generation assets, enabling energy balancing simulations. This allows the framework to perform pre-simulations of power generation and demand balancing across various microgrids or to receive real-time data from actual microgrids for continuous monitoring of grid conditions. The proposed hybrid modeling framework integrates predictive simulation and real-time system monitoring capabilities, maximizing microgrid operational efficiency and contributing to the optimization of power generation and consumption balance.
3.2. Development of a Physical Model
CFD-based physical models can numerically analyze complex fluid flows. It can simulate heat transfer, radiative heat effects, and wake effects, enabling the assessment of their impact on solar panels and wind turbines. Based on these analyses, the physical model can provide explanations for the predicted results and generate high-quality data when direct data collection is challenging. Additionally, CFD models allow for the generation of results under various conditions by adjusting parameters, offering significant advantages in predictive modeling.
3.2.1. Solar Power Physical Model
Figure 2 is a satellite image of an actual solar power plant. The solar physics model utilizes the design drawings of the solar panels from the real-world plant to create a 3D model for numerical analysis. By analyzing solar irradiance, the model estimates power generation. Consequently, the solar physics model can predict power generation values based on forecasted irradiance data.
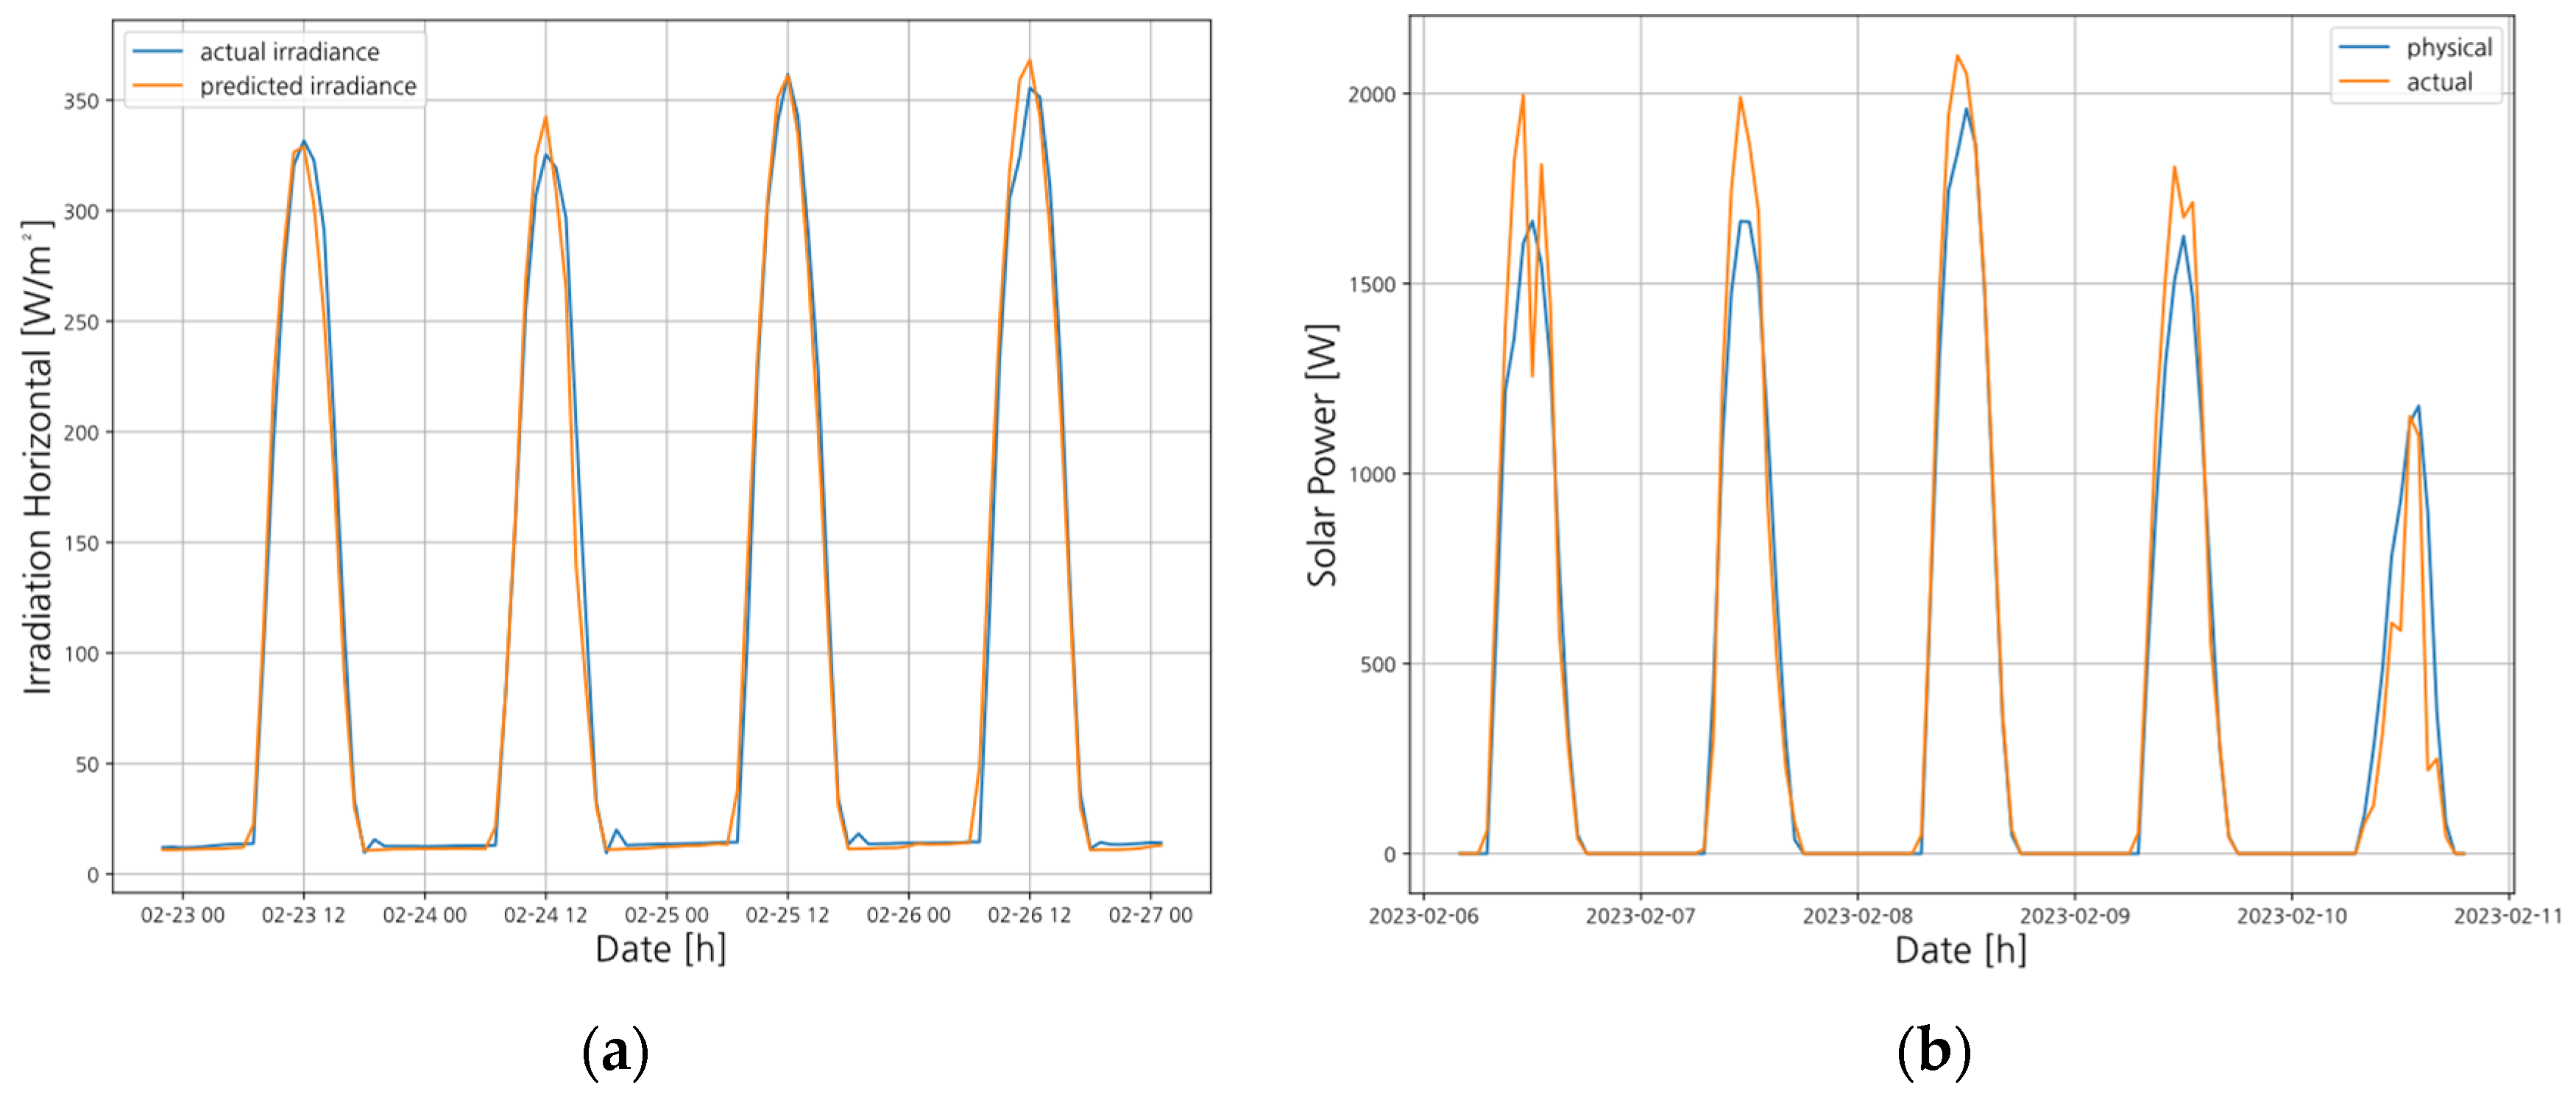
The prediction procedure based on the physical model begins by utilizing NWP to forecast solar irradiance. The predicted solar irradiance values are then used as input to the solar physical model to estimate solar power generation. The solar irradiance prediction model was developed using one year of NWP data from 2022 and was validated using the 2023 NWP dataset.
Figure 3a presents the results of the solar irradiance prediction, where the x-axis represents the timestamp and the y-axis represents irradiance. The blue line indicates the measured solar irradiance, while the orange line represents the predicted values.
Figure 3b shows the predicted solar power generation results. The x-axis denotes the timestamp, and the y-axis corresponds to the solar power generation. The blue line indicates the actual measured power output, whereas the orange line represents the predicted values calculated by the physical model.
3.2.2. Wind Turbine Physical Model
The wind turbine physical model interprets the blade rotation speed and wind speed to calculate the rotational torque and uses the resulting power coefficient for modeling wind power generation.
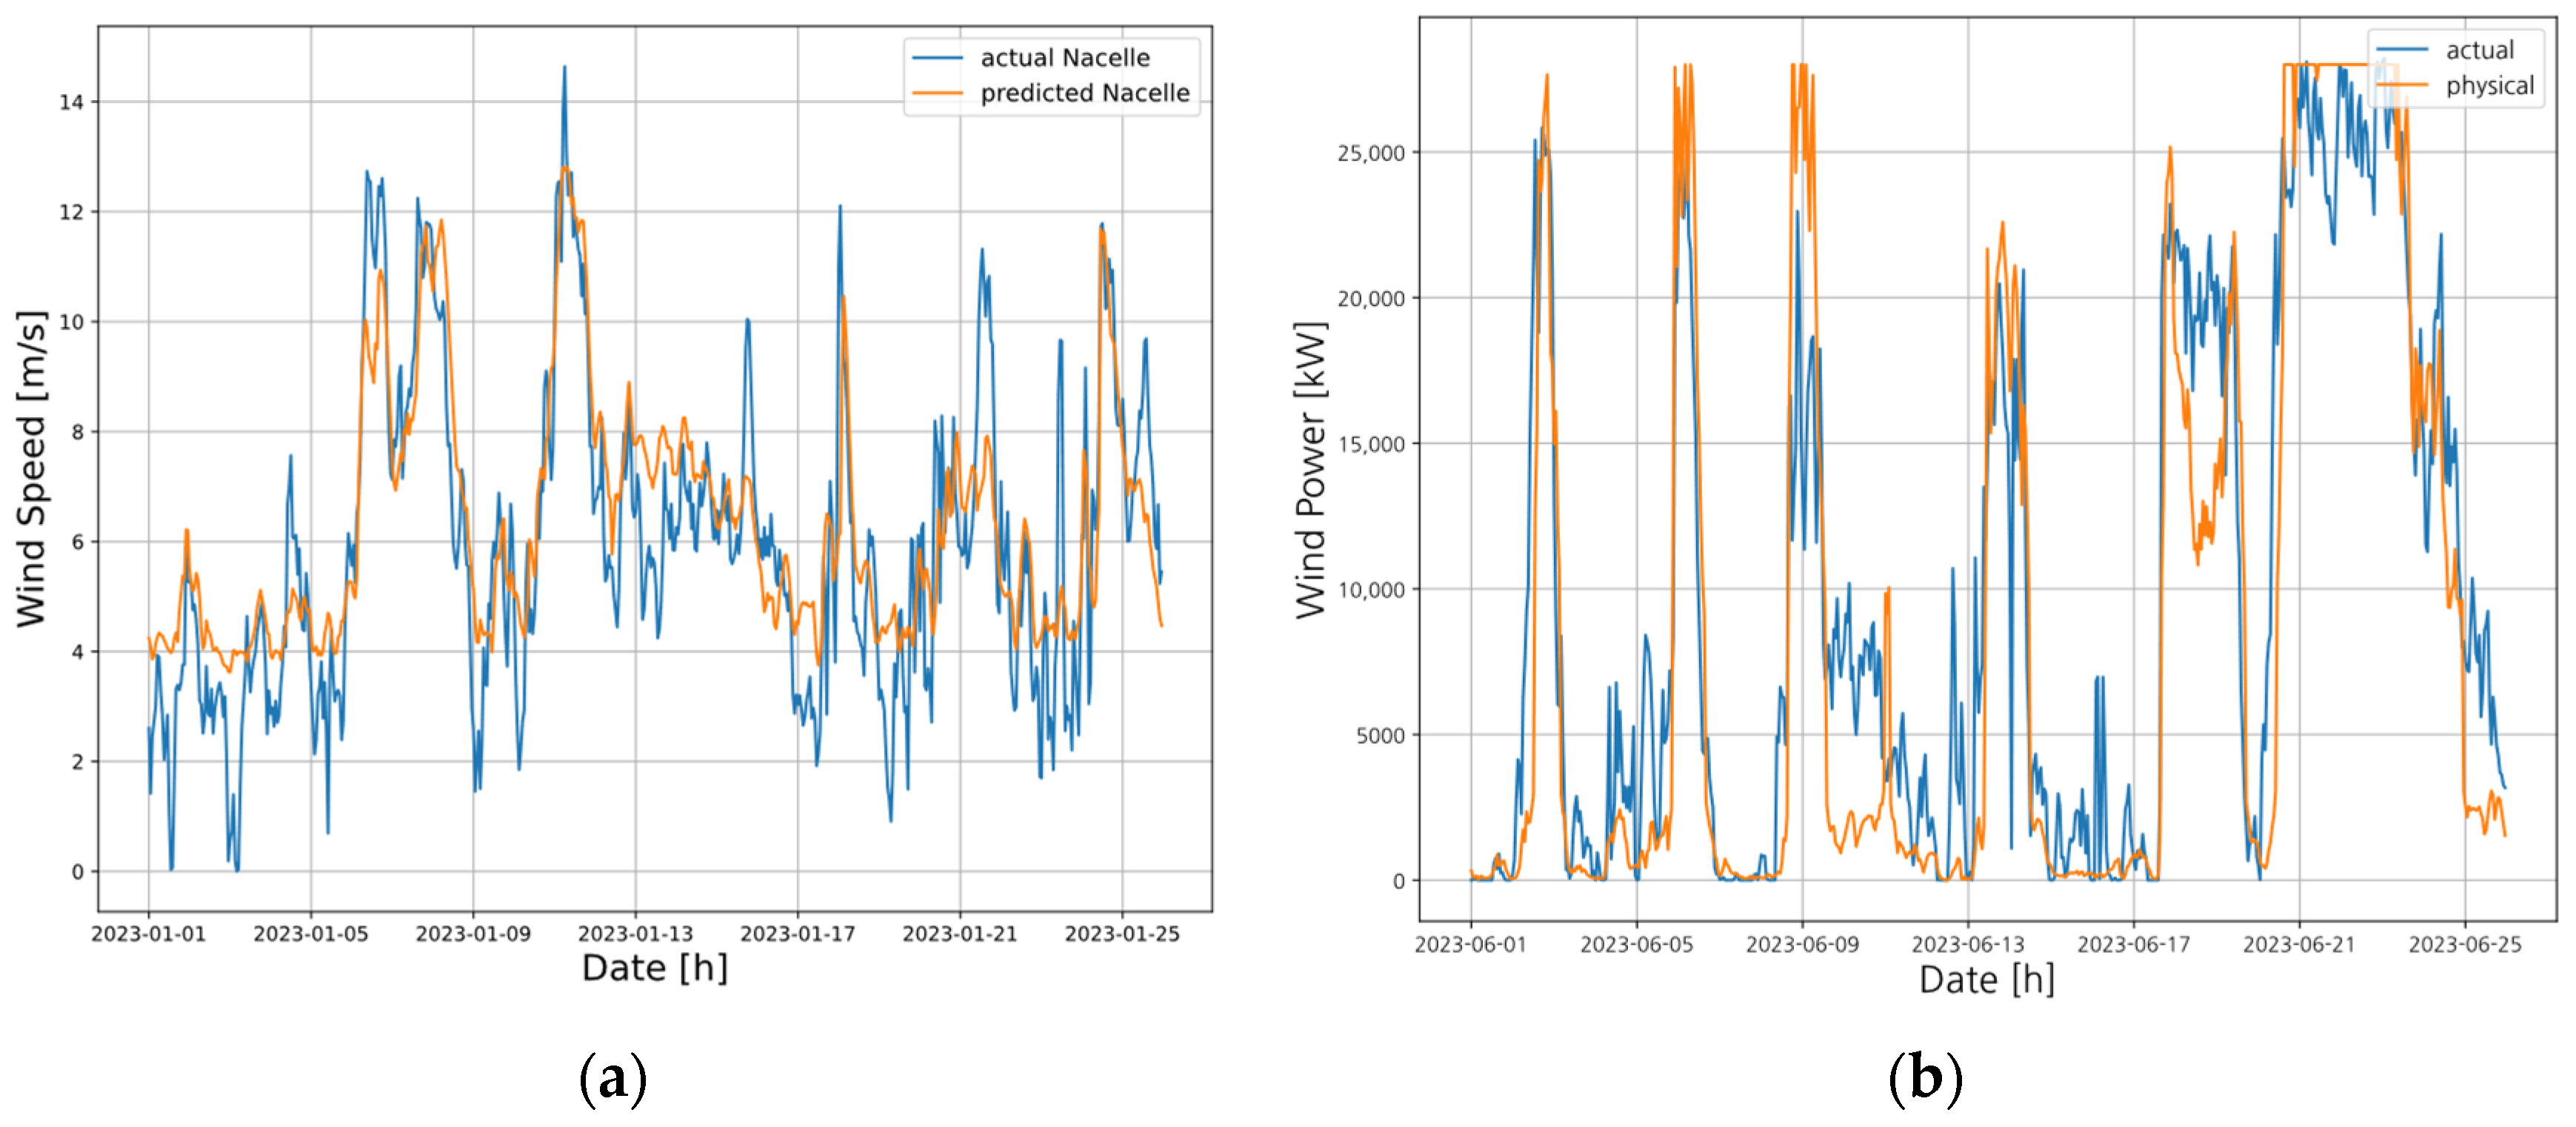
Figure 4 illustrates the geometry used for the wind turbine analysis. This model utilizes the wind speed measured at the nacelle of the wind turbine as input to estimate the wind power output. Similar to the solar physical model, NWP data are used to forecast the nacelle wind speed, and the predicted wind speed is then used to estimate the wind power generation. The nacelle wind speed prediction model was developed using one year of NWP data from 2022, and its performance was validated using the 2023 NWP dataset.
Figure 5a presents the prediction results for the nacelle wind speed, where the x-axis represents the timestamp, and the y-axis indicates the wind speed at the nacelle. The blue line shows the measured wind speed, while the orange line represents the predicted wind speed.
Figure 5b illustrates the wind power prediction results. The x-axis represents the timestamp, and the y-axis indicates the wind power generation. The blue line corresponds to the actual measured power, while the orange line indicates the predicted values calculated using the physical model.
3.3. Development of a Data Model
The data model uses datasets collected from solar inverters, wind turbines, power generation data, and NWP data and employs machine learning to analyze the pattern and predict power generation. The performance of the data model improves with the availability of high-quality data, and it has the advantage of faster execution compared to the physical model. The data model has been developed as either an integrated prediction model or individual models, depending on the size of the power generation plant.
3.3.1. Solar Power Data Model
To develop an effective solar power data model, we compared and analyzed various machine learning models and constructed a dataset that included NWP data and additional solar information to enhance prediction accuracy. Several algorithms were evaluated based on key performance metrics such as the normalized MAE (nMAE), the normalized RMSE (nRMSE), and the normalized Mean Absolute Percentage Error (nMAPE) to identify the model with the highest performance. Through iterative optimization and data preprocessing, we improved the dataset to maximize the predictive capability of the selected model. As a result, we successfully developed a high-performance solar power data model optimized for accurate and reliable predictions.
In this study, various machine learning models were selected and applied for solar power generation forecasting, including eXtreme Gradient Boosting (XGB) [
34], Support Vector Regression (SVR) [
35], Gradient Boosting Machine (GBM) [
36], Light Gradient Boosting Machine (LGBM) [
37], and a hybrid deep learning model combining Convolutional Neural Networks and Long Short-Term Memory (CNN-LSTM) [
17]. These models represent different algorithmic families. XGB, GBM, and LGBM are based on boosting ensemble learning techniques. SVR is a kernel-based regression model, while CNN-LSTM is a deep learning architecture specifically designed to capture spatiotemporal dependencies in time-series data. All of these models are suitable for learning complex nonlinear relationships between meteorological variables and solar power output.
XGB is recognized for its high prediction accuracy, regularization mechanisms that help prevent overfitting, and its ability to interpret feature importance. However, it requires complex hyperparameter tuning and can be computationally intensive when working with large datasets. GBM provides competitive performance but has a relatively slow training speed and can be prone to overfitting if not properly tuned. LGBM is appropriate for large-scale datasets due to its fast training speed and low memory consumption. However, it is sensitive to noise, which makes thorough data preprocessing essential. SVR performs well on small datasets and handles high-dimensional features effectively, but it has high computational costs for large datasets and is sensitive to kernel type and parameter settings. CNN-LSTM integrates the spatial feature extraction capability of a CNN with the sequential learning strength of LSTM. For example, a CNN can identify spatial patterns in input variables such as temperature, humidity, and solar irradiance. LSTM then models the temporal dependencies present in the data. This hybrid approach is particularly effective at capturing the complex spatiotemporal interactions involved in solar power generation and can significantly improve forecasting accuracy.
In particular, XGB has demonstrated strong predictive performance in previous studies. Rodriguez-Leguizamon et al. (2023) compared a statistical model (SARIMA), a deep learning model (LSTM), and a machine learning model (XGB) for photovoltaic forecasting and reported that XGB achieved the best [
38]. Building on these findings, we conducted comparative experiments using the above machine learning models. The results confirmed that XGB outperformed the other models, achieving the lowest prediction errors across all evaluation metrics: nMAE, nRMSE, and nMAPE.
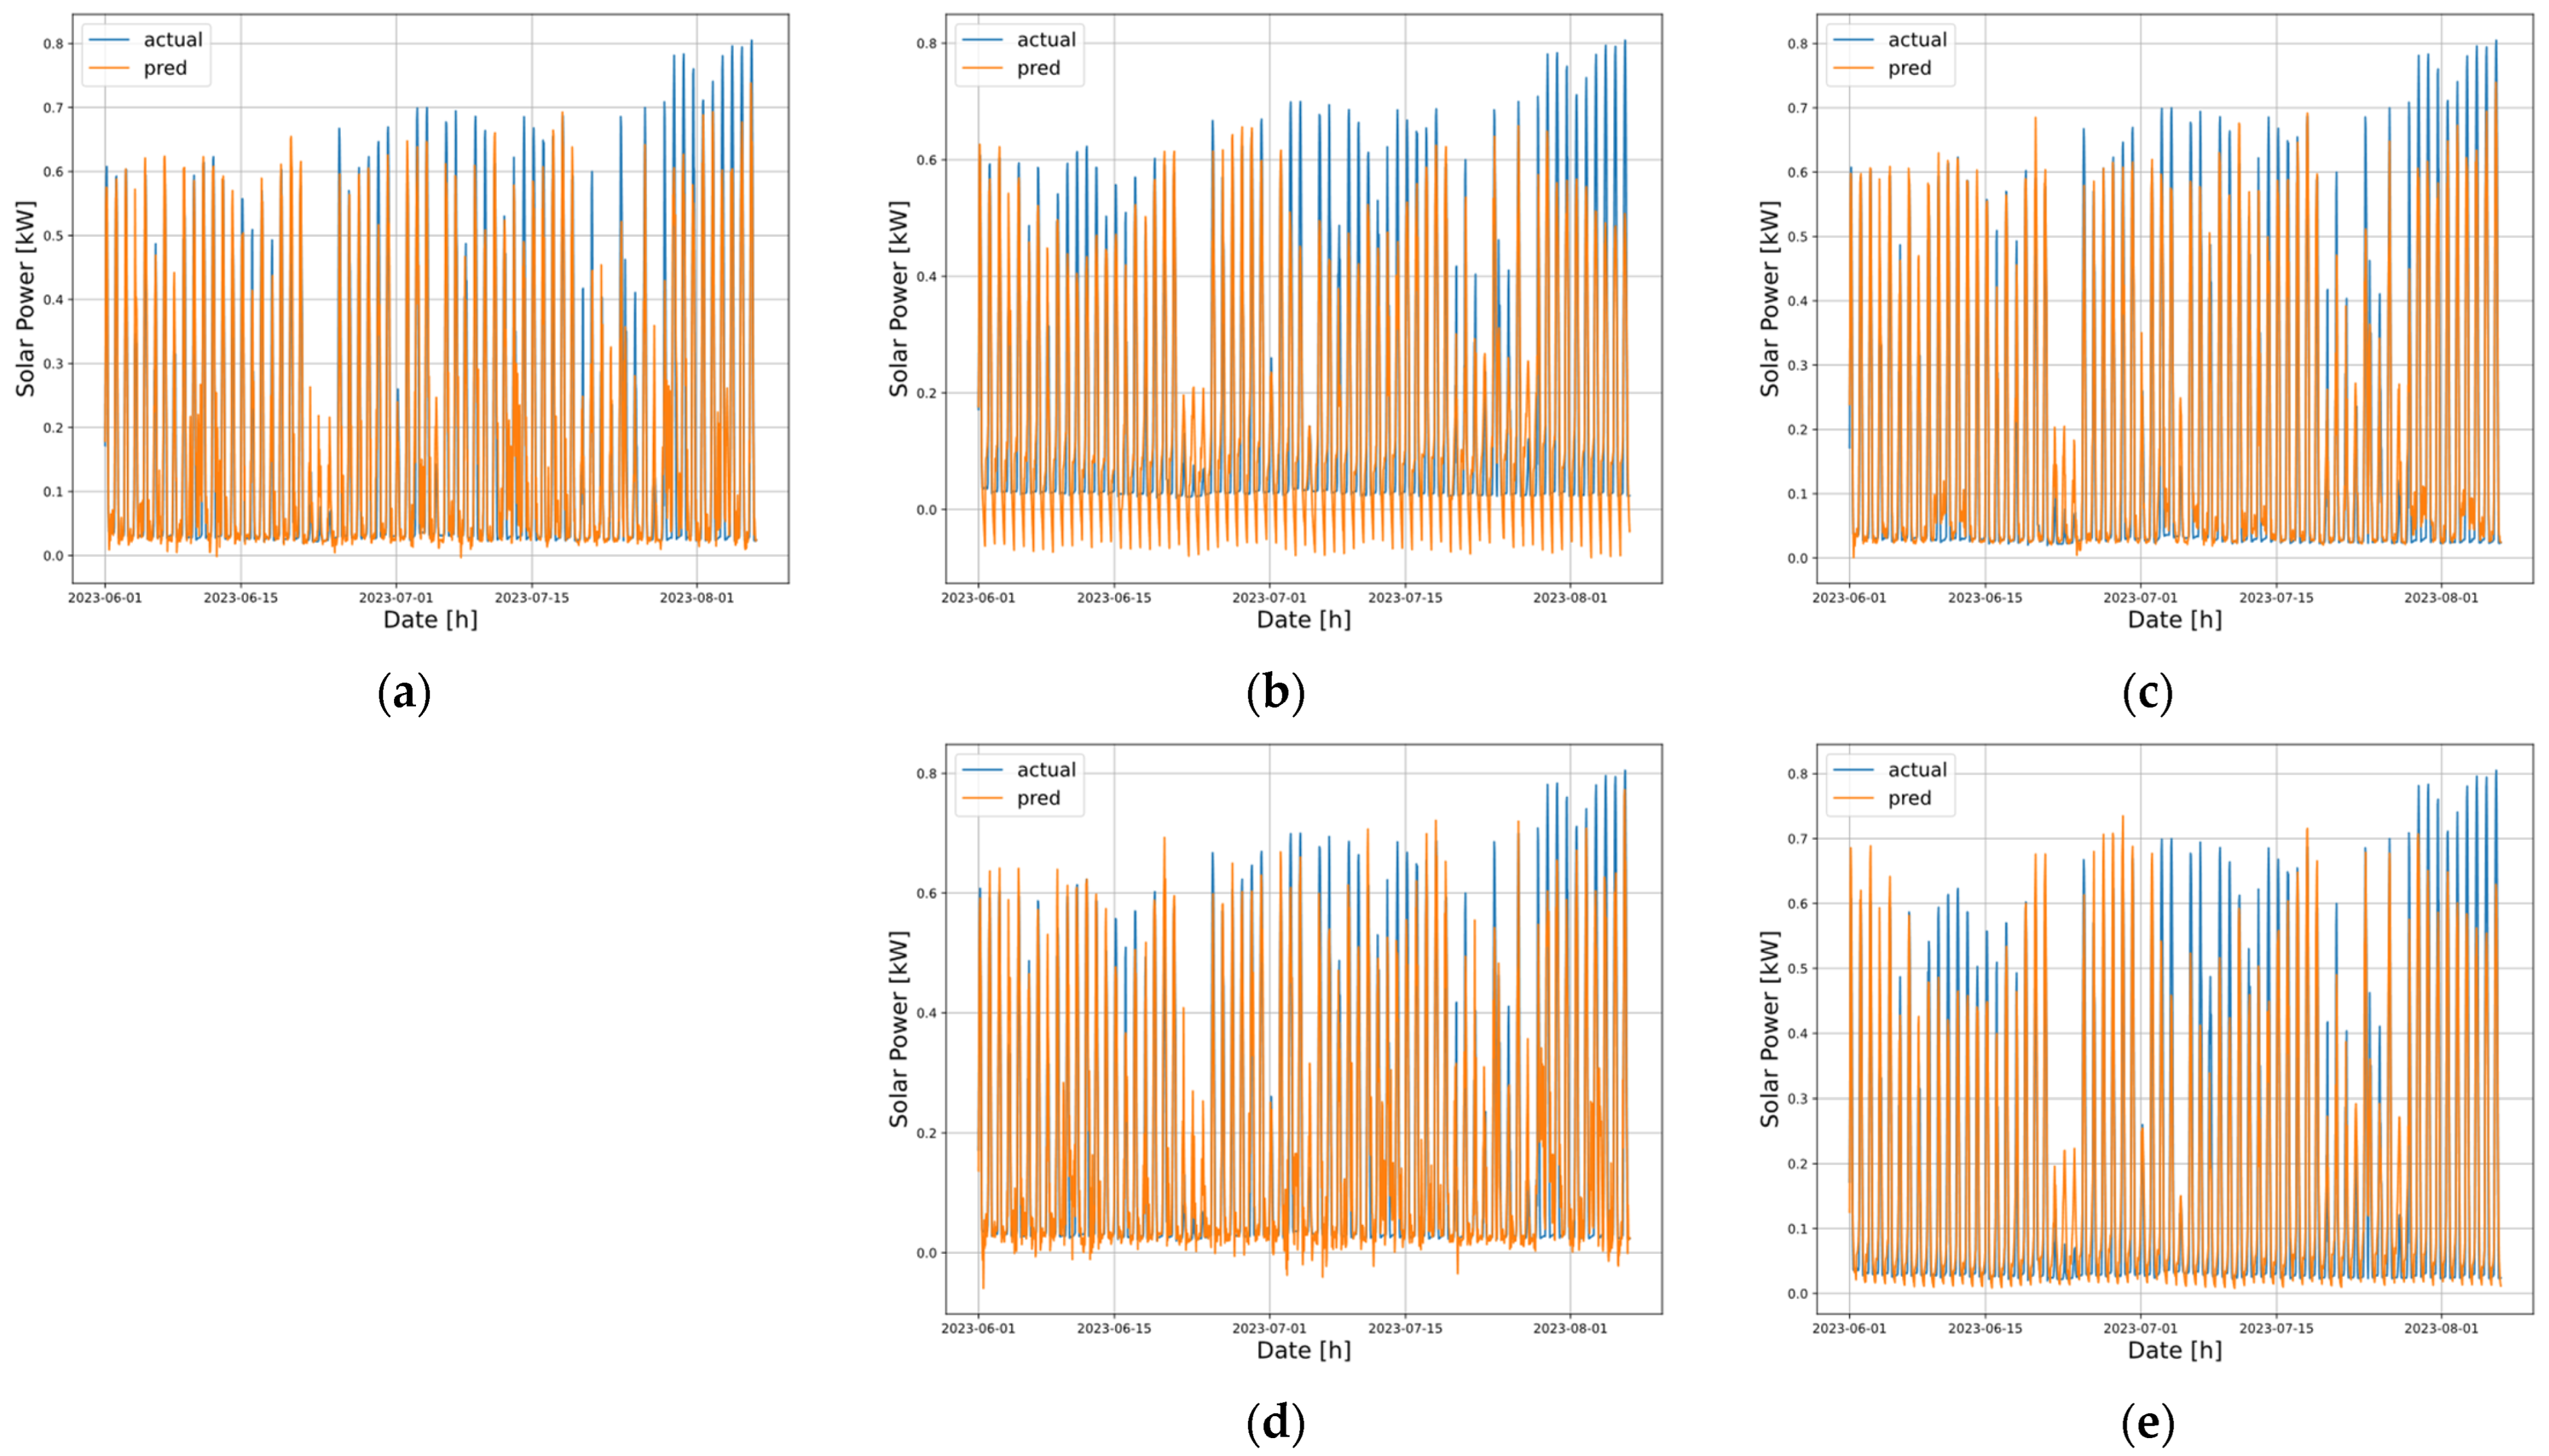
The dataset used for model training consisted of one year of NWP data from 2022, while testing was conducted using the NWP dataset from 2023.
Figure 6 visualizes the prediction results of the five models during the test period from June to August 2023. The x-axis represents the timestamp, and the y-axis indicates solar power generation. The blue line shows the actual measured power output, while the orange lines represent the predicted outputs of each model.
Table 1 presents a comparison of the three metrics (nMAE, nRMSE, nMAPE) across the entire test period. The lower values in these metrics indicate higher prediction accuracy. As shown, the XGB model (a) achieved the lowest error values across all metrics, confirming its superior predictive performance. Furthermore, the visual results in
Figure 6 show that the XGB model (a) more accurately captures the peak generation periods compared to the other models, demonstrating its strength in tracking rapid fluctuations in solar power output.
3.3.2. Wind Turbine Data Model
Unlike the solar demonstration site, where installations are concentrated within a 400 m radius, the wind power demonstration site consists of 14 wind turbines spaced approximately 1.5 km apart.
Figure 7 is a satellite image of the demonstration site, showing that the spacing between turbines is 1.5 km. Each wind turbine has unique characteristics that are influenced by factors such as terrain, wear, and location-specific conditions. Developing a unified data model for all turbines would make it challenging to account for these individual variations. Therefore, we developed separate data models for each wind turbine, enabling the models to learn and capture the distinct characteristics of each turbine more effectively. To develop the wind turbine data model, we employed CNN [
39] and XGB, both of which demonstrated strong predictive performance. Additionally, to assess the impact of time information on model performance in irregular time-series wind data, we conducted experiments by comparing the results with and without Time Embedding preprocessing. The findings revealed that the best performance was achieved when Time Embedding was not applied and the CNN model was used.
For model development, NWP data from 2022 were used for training, and data from 2023 were used for testing. We compared the total predicted power from individual wind turbine models with that from a unified model using three evaluation metrics.
Table 2 presents the nMAPE results across four scenarios, showing that the CNN model achieved the highest accuracy in 9 out of 14 turbines.
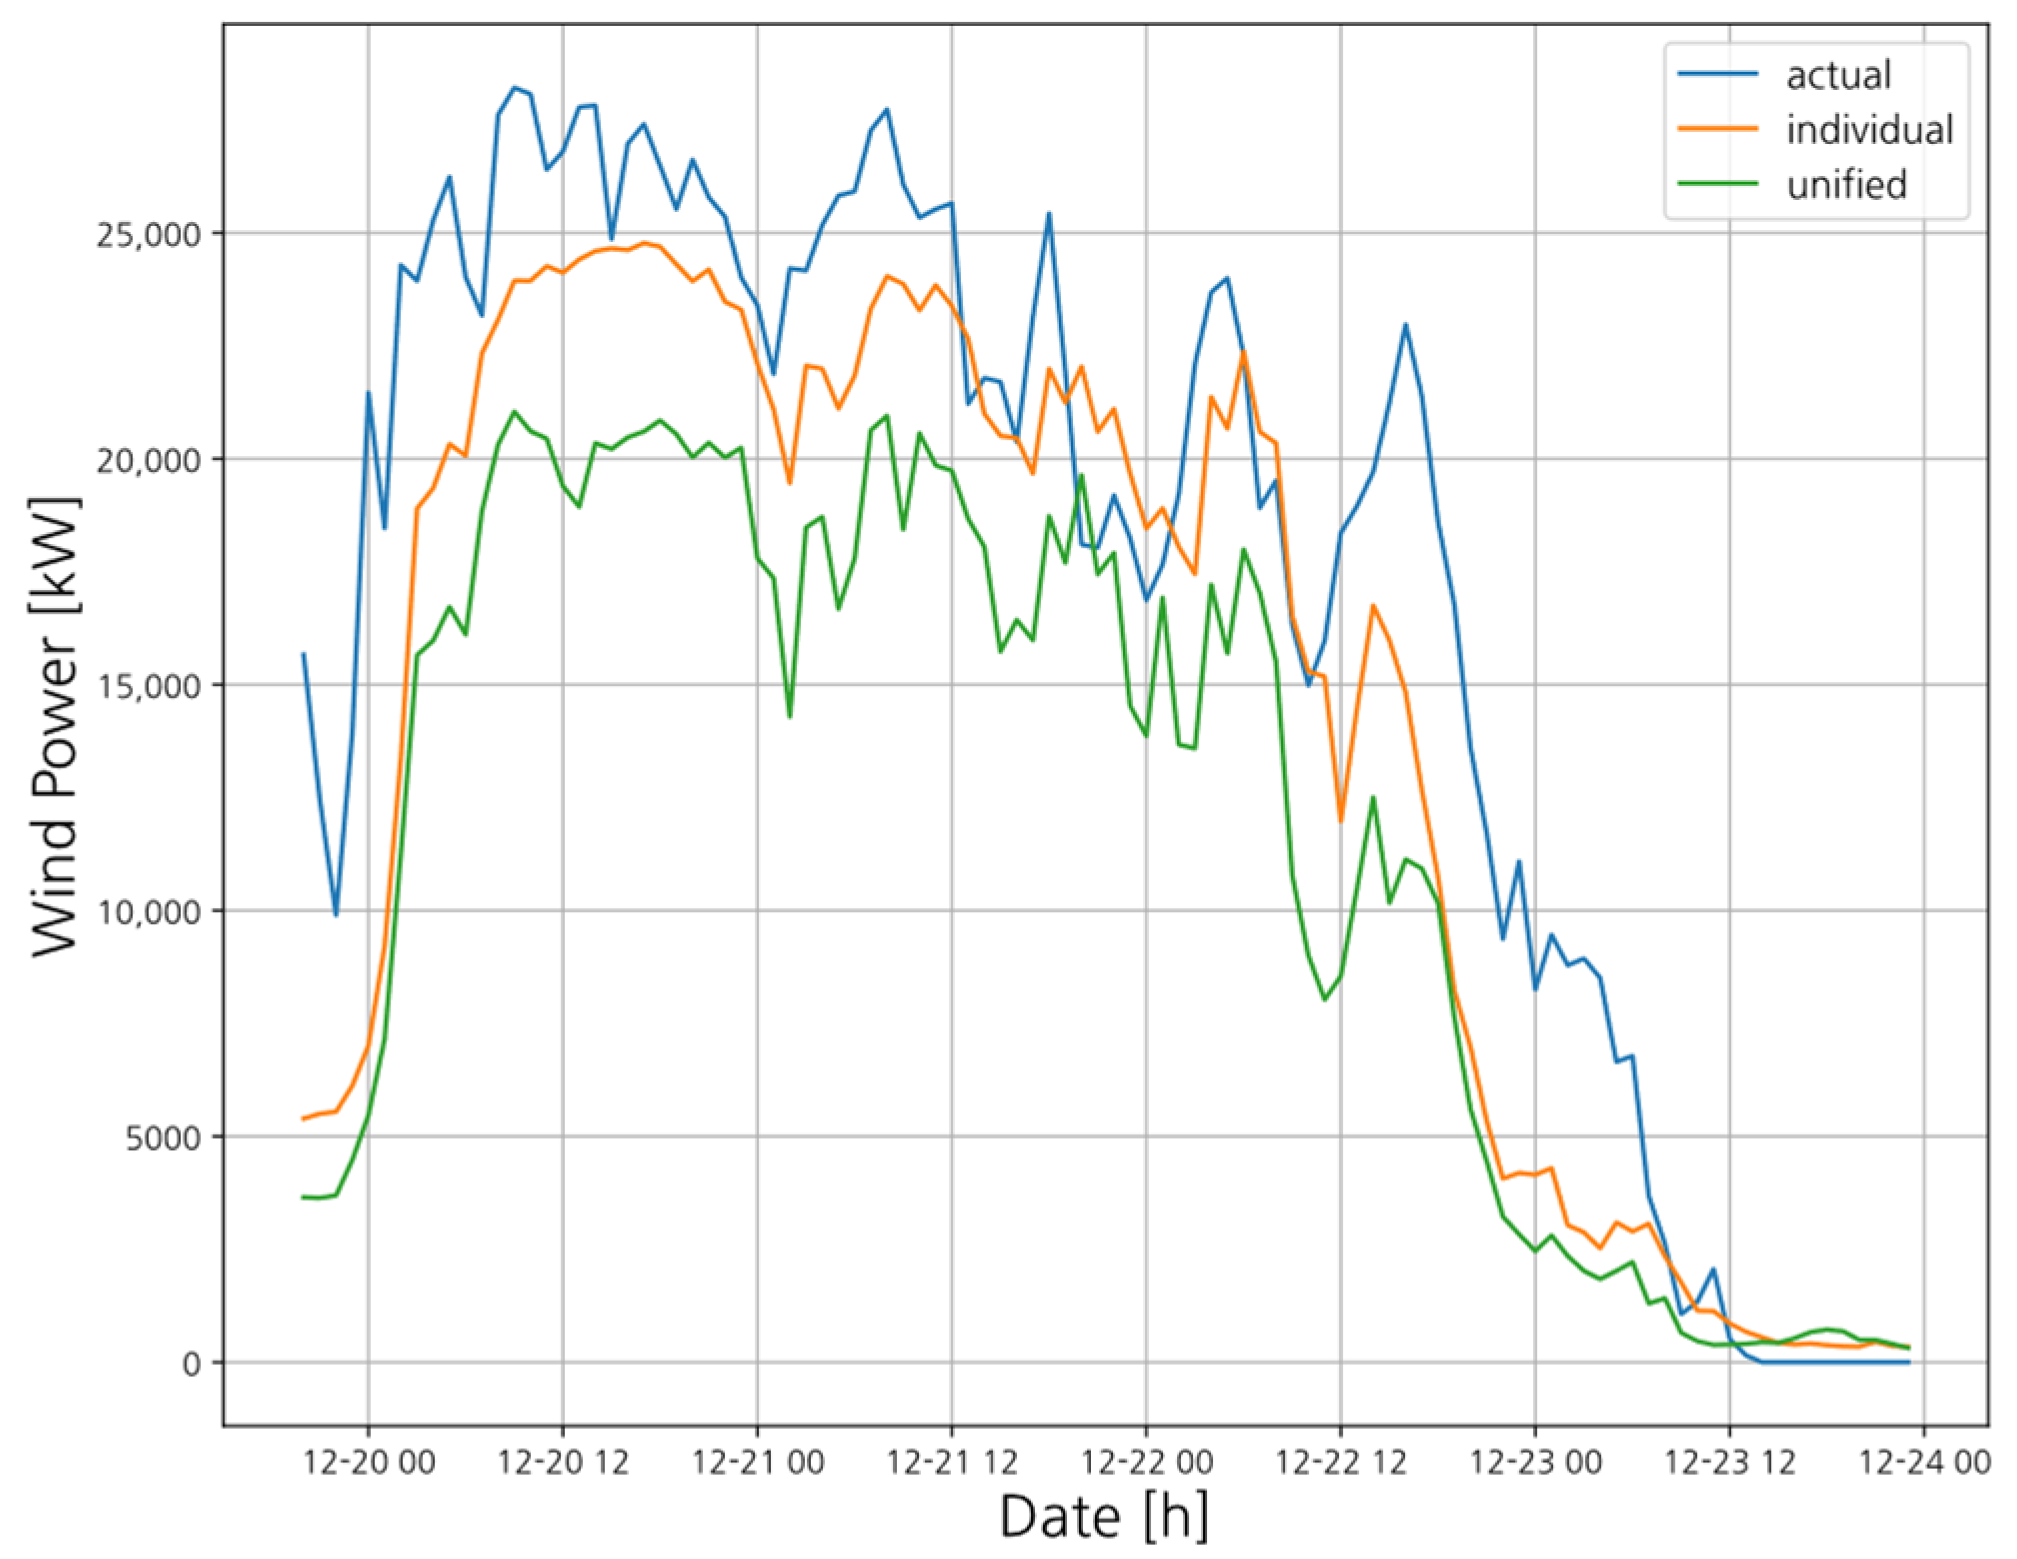
Table 3 compares the overall performance using nMAE, nRMSE, and nMAPE, confirming that individual models consistently outperformed the unified model.
Figure 8 visualizes the December test results, where individual models (orange) more closely follow actual power (blue) than the unified model (green), demonstrating higher accuracy.
3.4. Development of a Hybrid Model
A hybrid model combines physical and data-driven models to complement the limitations of each model and effectively utilize their respective strengths. Based on the advantages of these two approaches, we developed a hybrid model that improves the inference speed and enhances reliability through explainable results. This study is based on the Simulation-Assisted Machine Learning method, one of the techniques proposed in Combining Machine Learning and Simulation to a Hybrid Modeling Approach by the Fraunhofer Center for Machine Learning. Referring to this method, we trained the hybrid model using both the predictions from the data-driven model and the outputs from the physical model [
13].
3.4.1. Solar Power Hybrid Model
The solar power hybrid model is constructed by integrating the power generation predictions from both a physical model and a data-driven model. The overall structure of the solar hybrid forecasting model is illustrated in
Figure 9.
First, NWP data are used to forecast solar irradiance, which serves as input to the simulation model. The predicted irradiance is then used in the physics-based model to estimate power generation. In parallel, both the NWP data and real-time solar inverter measurements are used as input features to train the data-driven model based on the XGB algorithm. The outputs from both the physics-based and data-driven models are subsequently fed into the hybrid model to compute the final PV power forecast. Accordingly, the proposed solar power forecasting model adopts a hybrid approach that combines the physical consistency of simulation-based modeling with the learning capability of XGB. The hybrid model is formulated as follows:
Additionally, the physics-based model for solar power forecasting is calculated as follows, considering the solar irradiance, temperature, and power generation efficiency characteristics.
The XGB model learns from various meteorological and historical power generation data to predict future power output. The model is formulated as follows:
The weighting coefficient α of the hybrid model for solar power forecasting is dynamically adjusted based on the reliability of the physics-based and machine learning models. Instead of assigning a fixed weight, a weighted inverse error strategy is employed, where α is dynamically adjusted using the prediction errors of each model. To dynamically integrate the outputs, the weighting coefficient α(
) is computed using a weighted inverse error strategy, as described below. This approach enables automatic weight adjustments when the reliability of a specific model decreases due to factors such as weather changes, ensuring stable forecast values.
The parameters used in Equations (1) through (4), including the model inputs, coefficients, and prediction-related variables, are detailed in
Table 4 to facilitate a clear understanding and interpretation of the PV hybrid forecasting model formulation.
3.4.2. Wind Turbine Power Hybrid Model
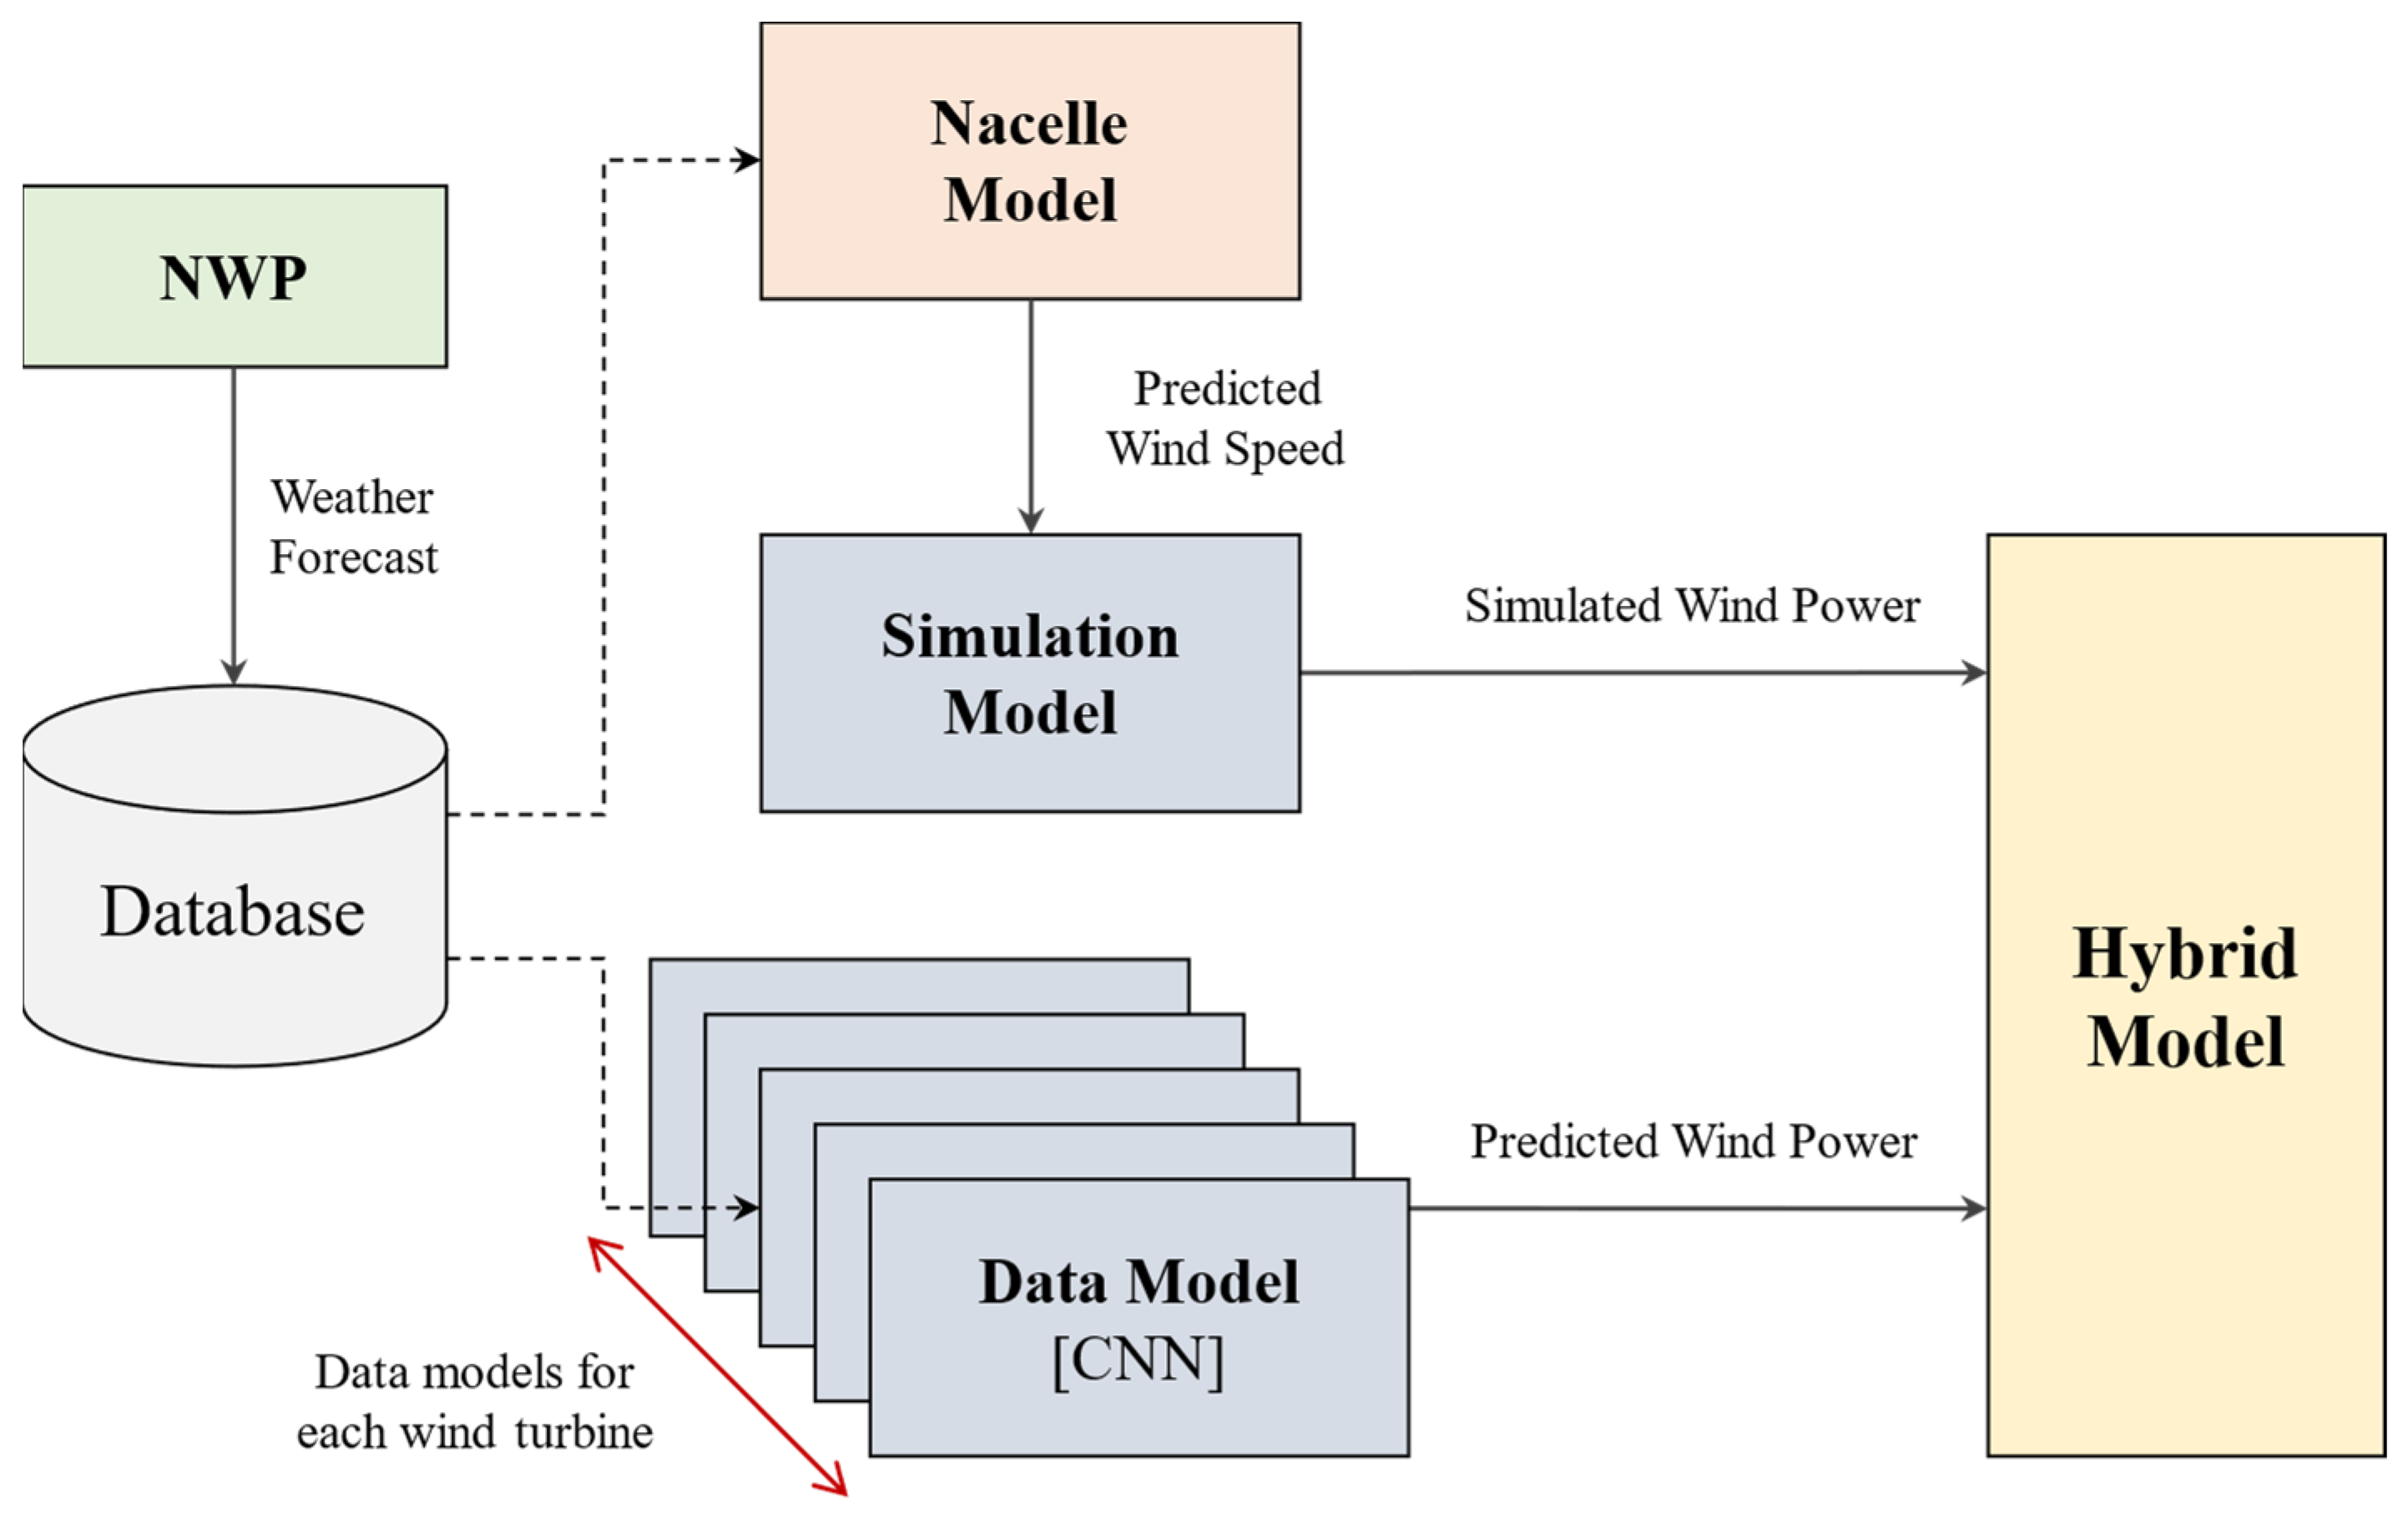
The wind power hybrid prediction model, similar to the solar power hybrid model, is constructed by integrating the power output forecasts from both a physics-based model and a data-driven model. The overall structure of the wind power hybrid prediction model is illustrated in
Figure 10. First, NWP data are utilized to forecast the nacelle wind speed. The predicted nacelle wind speed is then used as an input to the physical model to estimate power generation.
Subsequently, to generate the output of the data-driven model, both the NWP data and wind turbine data are used as input features to predict the power output. Unlike the solar power data-driven model, the wind power data-driven model aggregates the predicted results from the individual models trained for each turbine in the wind farm, reflecting the heterogeneous characteristics of each turbine.
Accordingly, the wind power forecasting model adopts a hybrid approach that integrates a physics-based model with a Convolutional Neural Network (CNN) machine learning model. This method is designed to compensate for the high variability of wind power generation and effectively capture the nonlinear characteristics of wind patterns. The hybrid model for wind turbine power generation forecasting can be formulated as follows:
Additionally, the previously developed physics-based model can be formulated as follows, and wind power generation is calculated based on turbine operating conditions as follows:
The CNN-based model learns from time-series wind speed data to predict the power output by identifying wind patterns effectively. The model is defined as follows:
The primary computational operation in CNNs is the convolution operation. The output of the
l-th convolutional layer is expressed as follows:
Finally, the weighting coefficient
α of the hybrid model for wind turbine power forecasting is also dynamically adjusted based on the reliability of the physics-based and machine learning models. Instead of assigning a fixed weight, a weighted inverse error strategy is adopted, where
α is dynamically adjusted using the prediction errors of each model.
The parameters used in Equations (5) through (9), including the turbine operation thresholds, model inputs, and prediction-related variables, are detailed in
Table 5 to facilitate a clear understanding and interpretation of the wind power hybrid forecasting model formulation.
3.5. Development of a High Available Data Server
The development of the hybrid model requires the real-time collection and processing of big data, including NWP data, solar inverter data, and wind turbine data, at both minute and hourly intervals. Since these data must not be lost—even in the event of collection errors—high availability and failover must be ensured. For this reason, a high-availability data server was implemented using a Kafka cluster and a Galera cluster using Max Scale to establish the hybrid framework. First, we deployed a Kafka cluster to enable the real-time, lossless, and distributed processing of big data. Additionally, we built a Relational Data Base Management System (RDBMS) cluster using MariaDB’s Max Scale and Galera Cluster, ensuring high availability by replicating the collected data across multiple nodes.
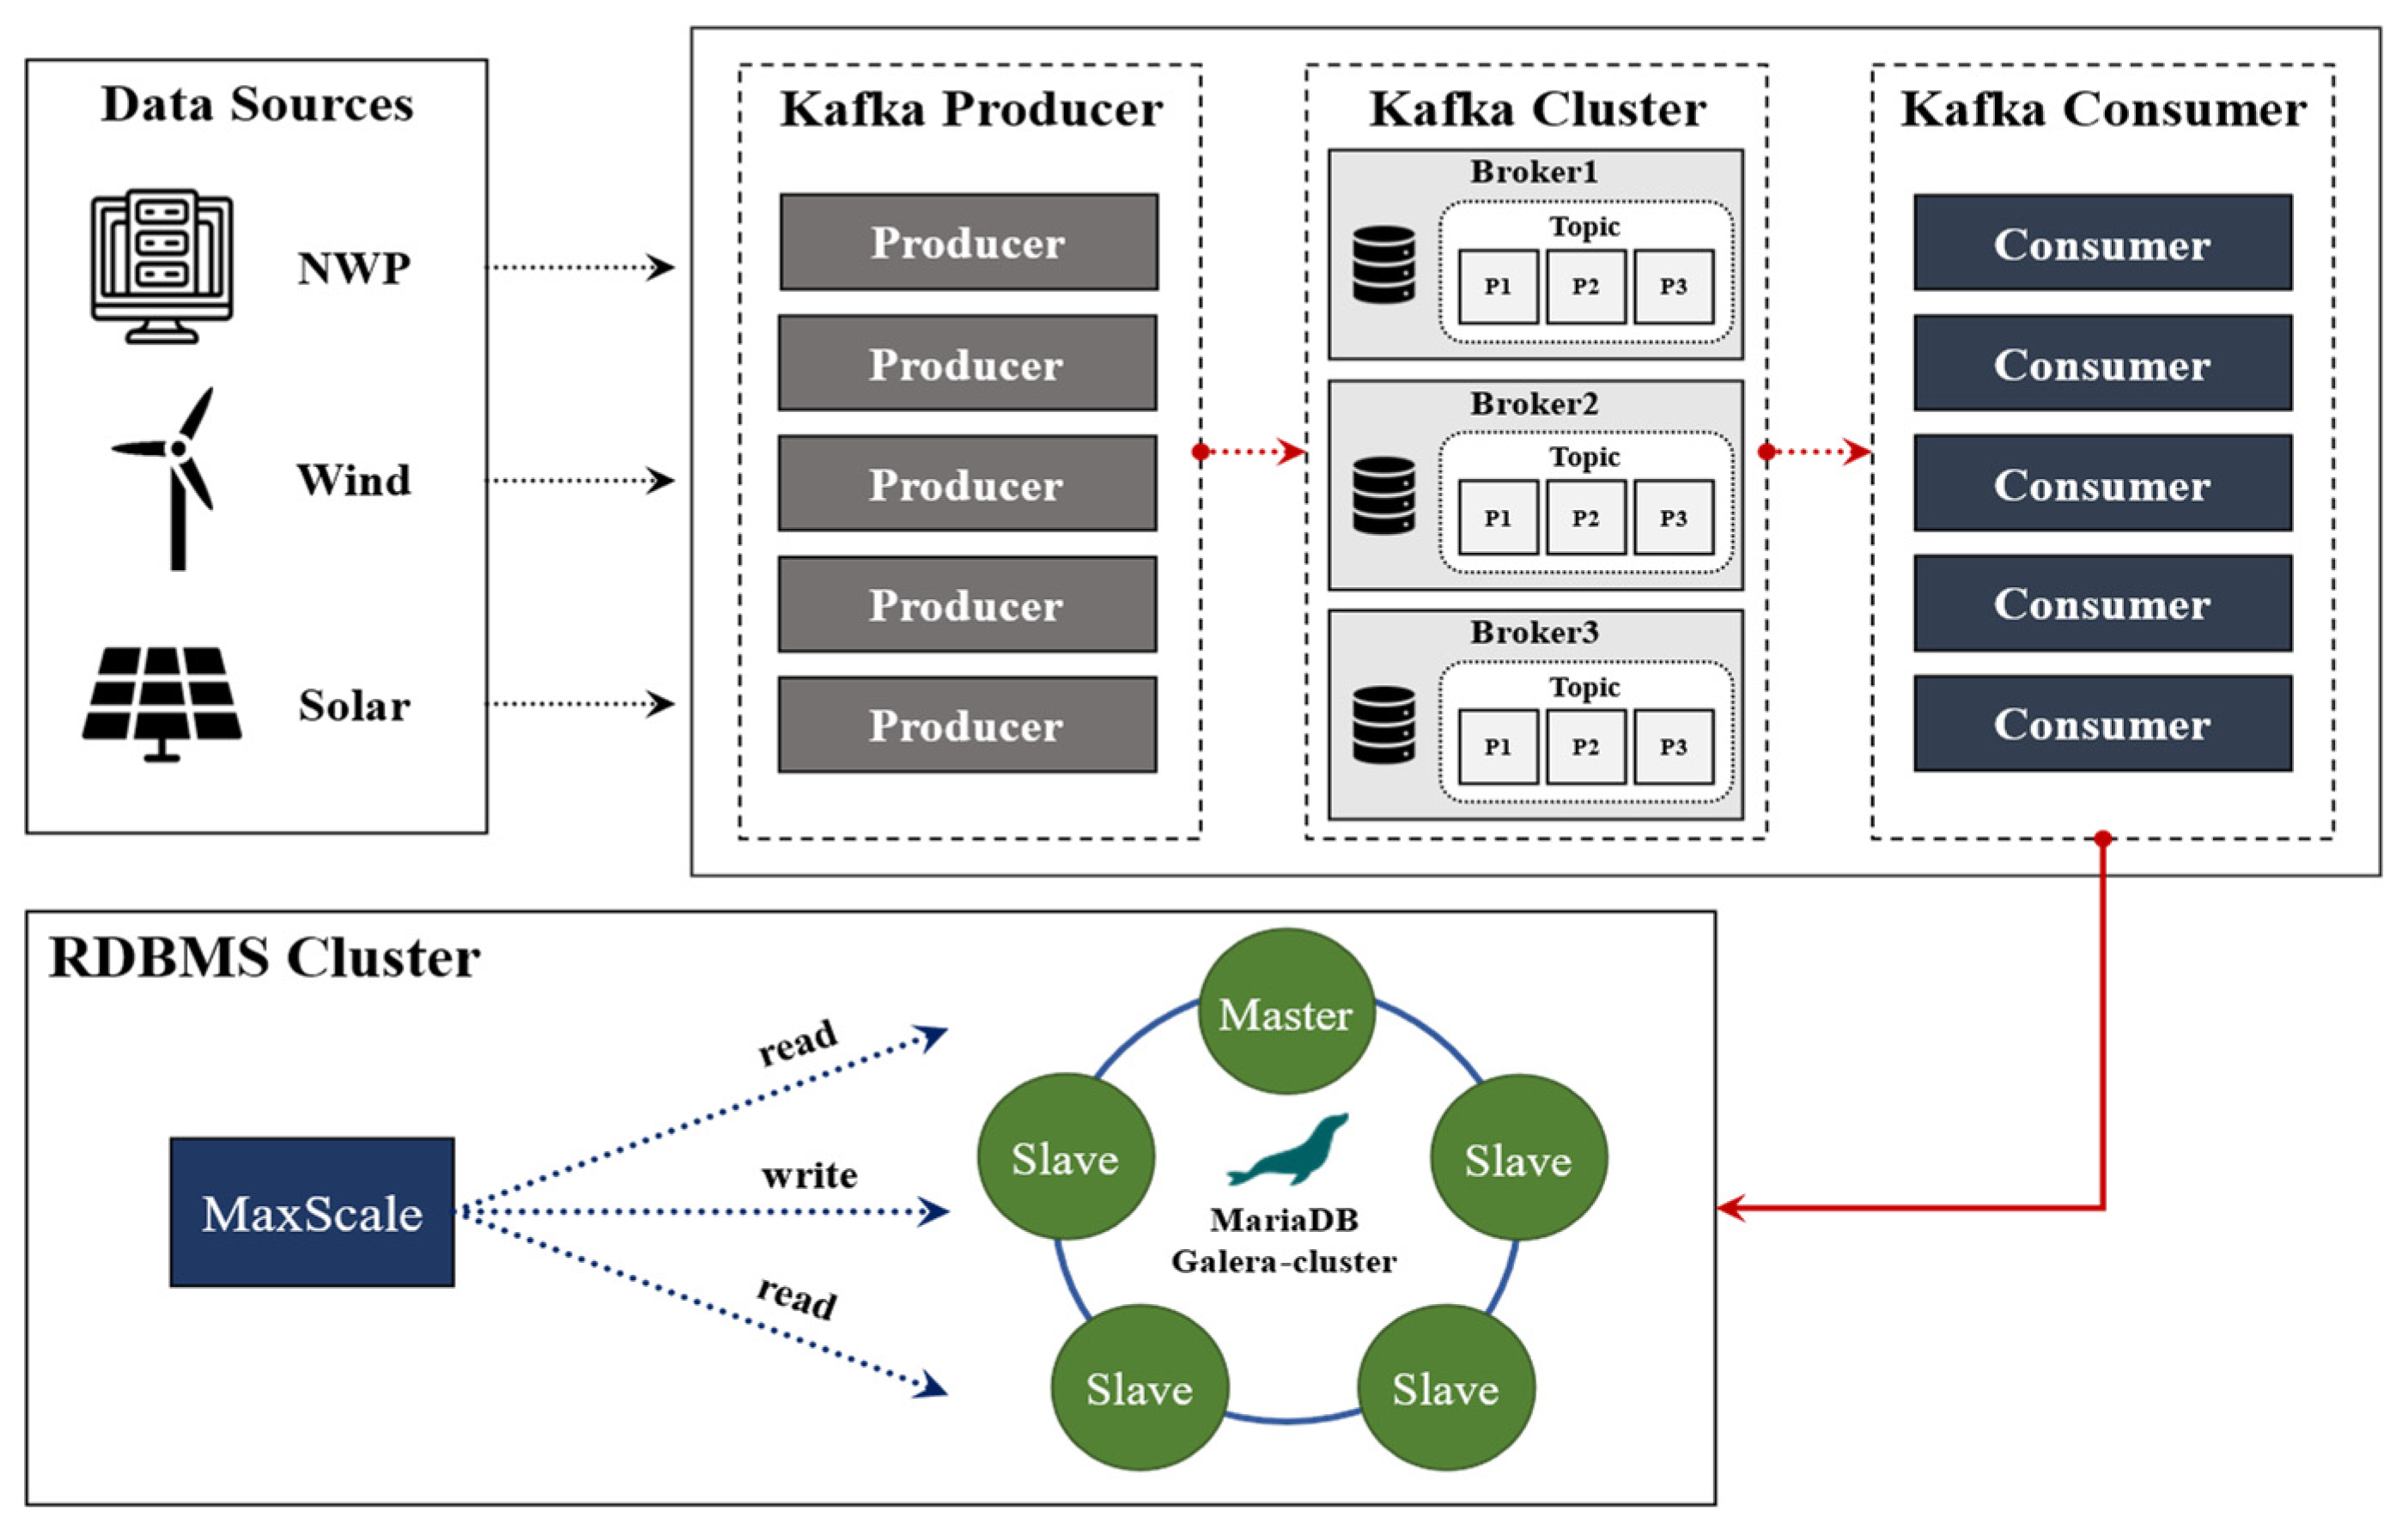
Structure
Figure 11 illustrates the architecture of the high-availability hybrid modeling framework. Data collected from various sources, including the NWP, wind turbines, and solar inverters, are ingested in real-time via Kafka producers and transmitted to the Kafka cluster. The transmitted data are replicated and sequentially stored in topics within Kafka brokers. The stored data are then consumed by Kafka consumers, which process the data and store it in an RDBMS cluster.
The Kafka-based messaging system ensures real-time, lossless, and distributed data processing, while the RDBMS cluster, built using MariaDB’s Max Scale and Galera Cluster, guarantees high availability and data integrity by synchronizing the data across multiple nodes. This framework ensures reliable data collection, efficient processing, and fault tolerance, which are crucial for hybrid modeling applications. Additionally, during the development of the hybrid model, a rigorous data preprocessing process was implemented to ensure the quality of the collected data and to enhance the reliability of predictions. Exploratory Data Analysis (EDA) was performed to identify the outliers that exceeded the expected range of the values generated by power generators and sensors. When such anomalies were detected, data refinement and correction modules were applied to improve the reliability of the model. However, since physical models generate high-fidelity data through simulations, and the demonstration site operates a moderate-scale renewable energy facility, the collected data exhibit high accuracy with minimal noise. As a result, the dataset used in this study contains negligible data gaps or noise, allowing for reliable forecasting and model validation. Nevertheless, in future applications involving new demonstration sites, high-fidelity data may not always be readily available. To address this potential issue, a data imputation module was developed to reconstruct missing or incomplete data based on the existing high-quality dataset. For this purpose, a Generative Adversarial Network (GAN)-based data imputation model was introduced. This model was designed to learn the inherent patterns of the collected data and reconstruct missing values to improve data quality. By applying the GAN-based imputation technique, the hybrid modeling framework can maintain its predictive performance and reliability, even in environments where data gaps occur. This approach enhances the framework’s robustness and adaptability, ensuring its practical applicability in various environments with fluctuating data quality.


