
A Bio-Optimization Approach for Renewable Energy Management: The Case of a University Building in a Tropical Climate


Abstract
1. Introduction
2. Literature Review
3. Materials and Methods
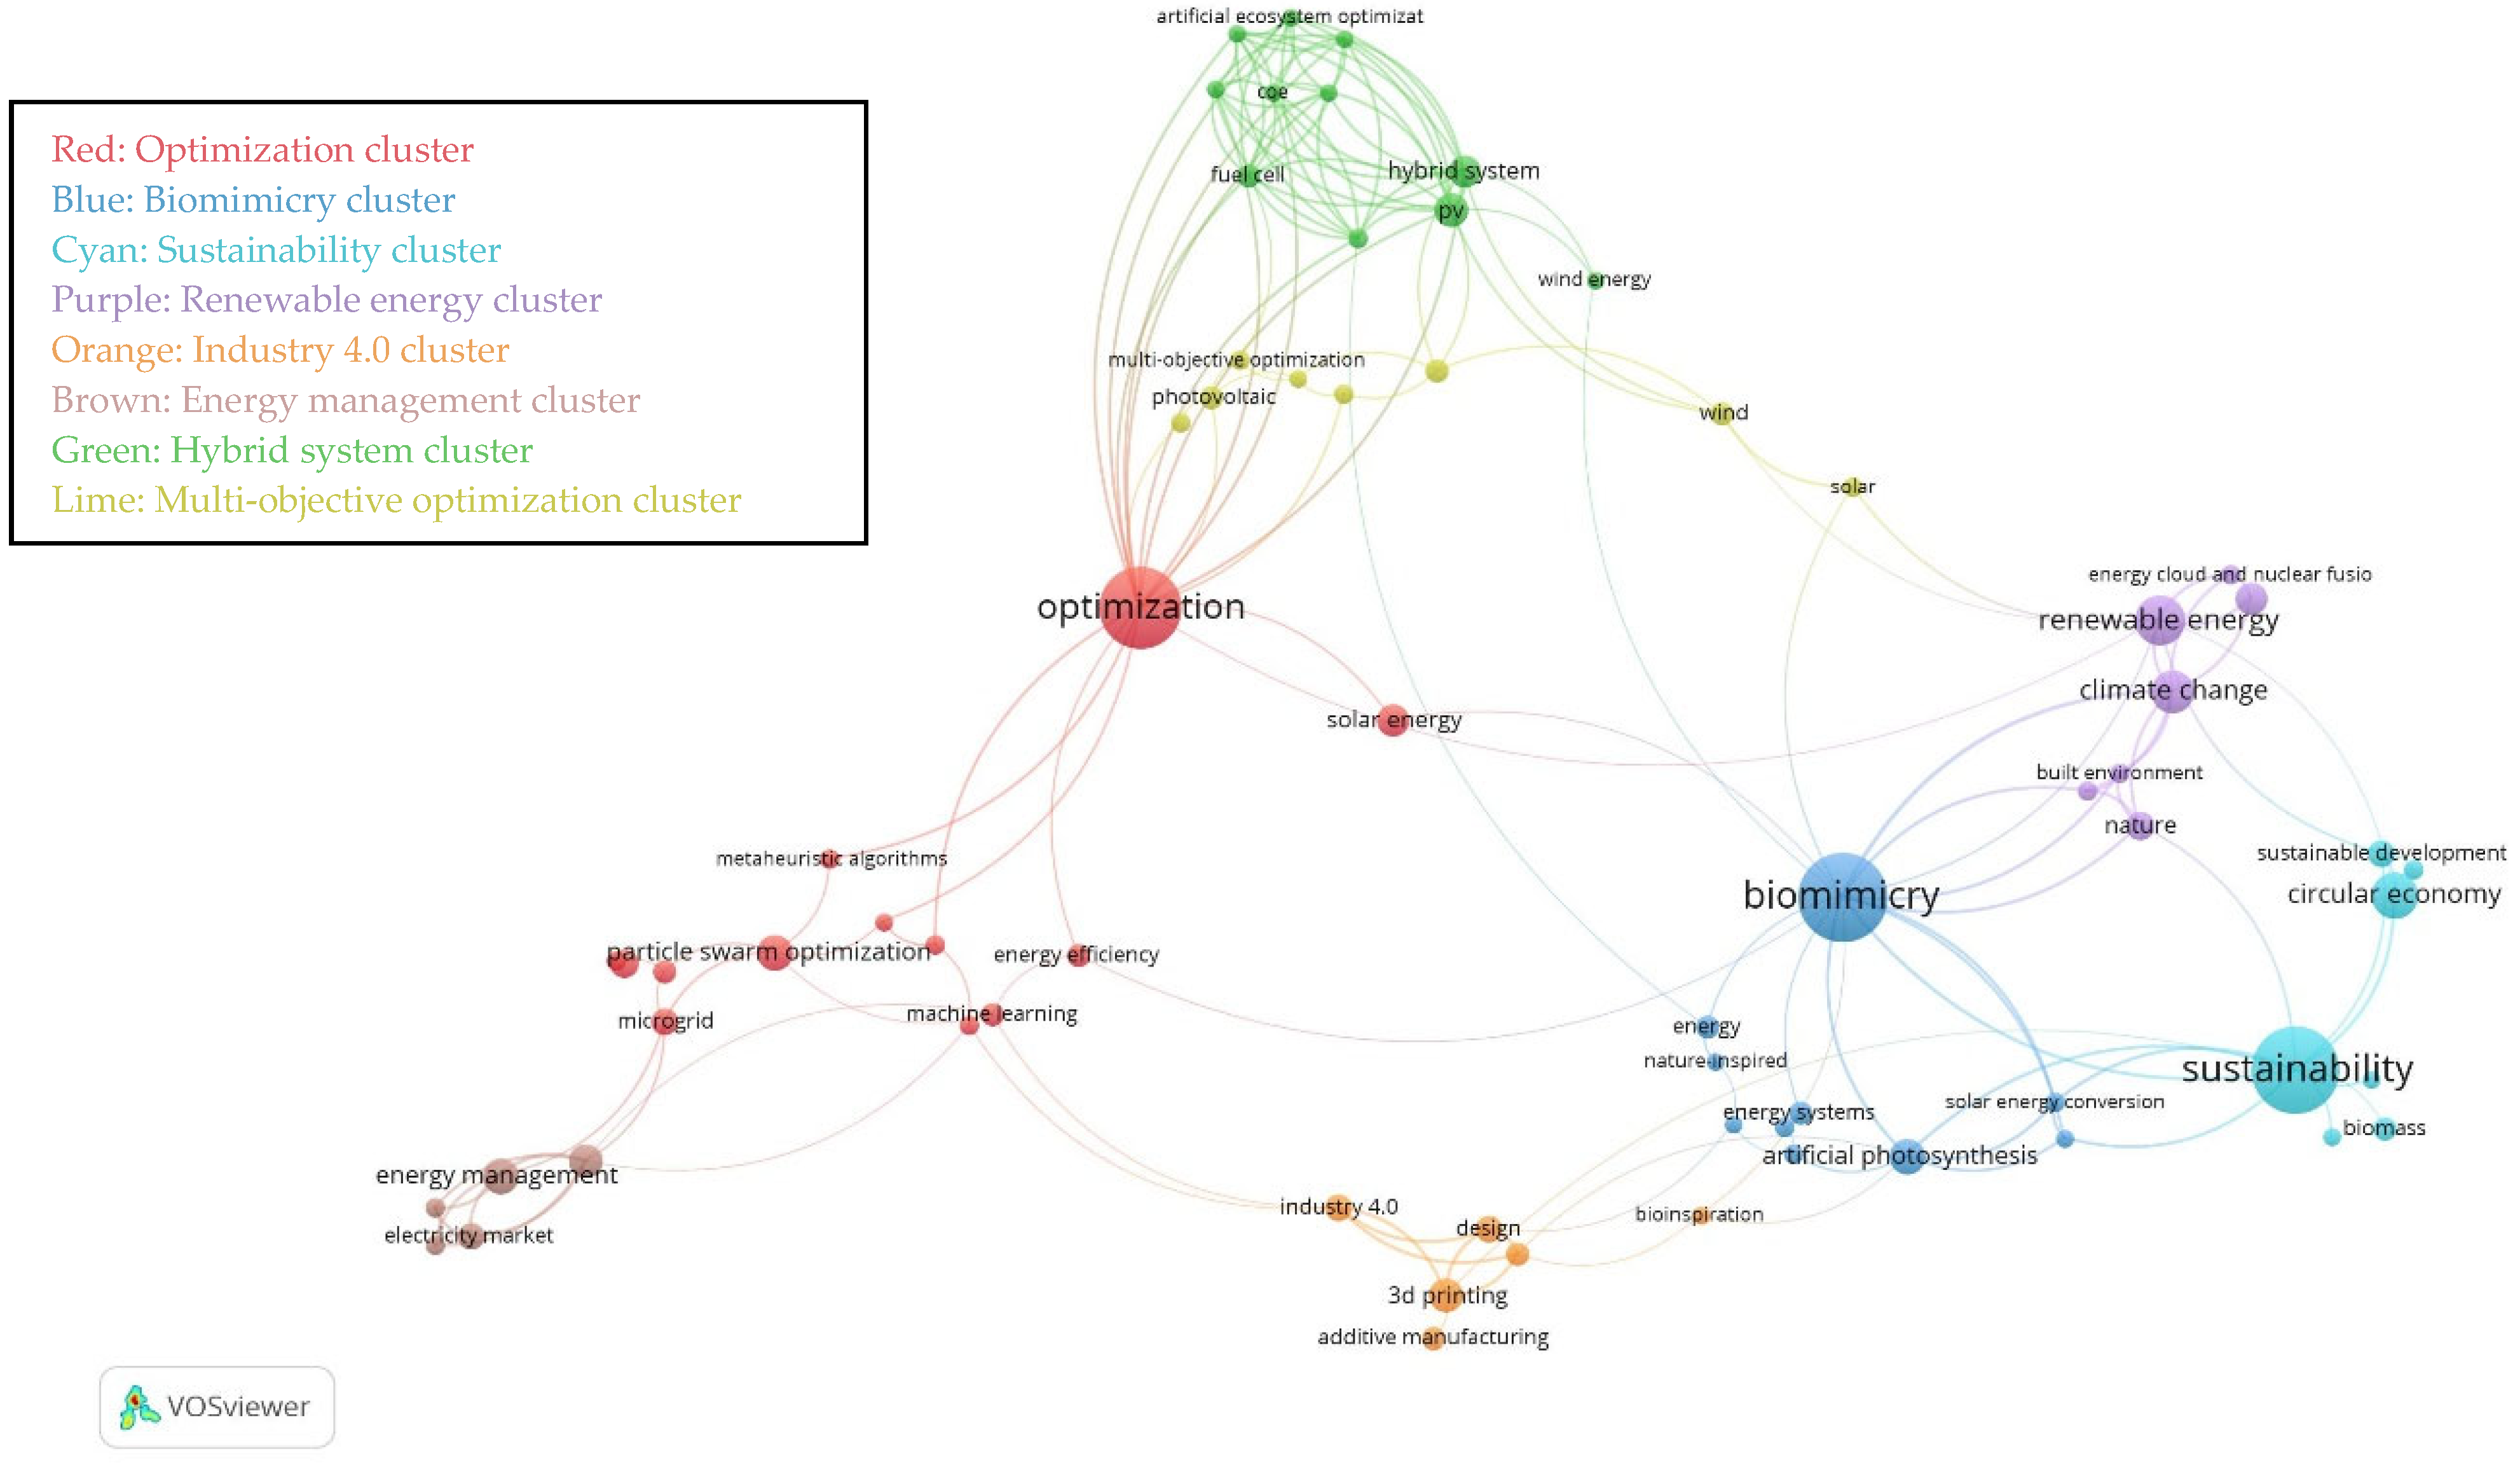
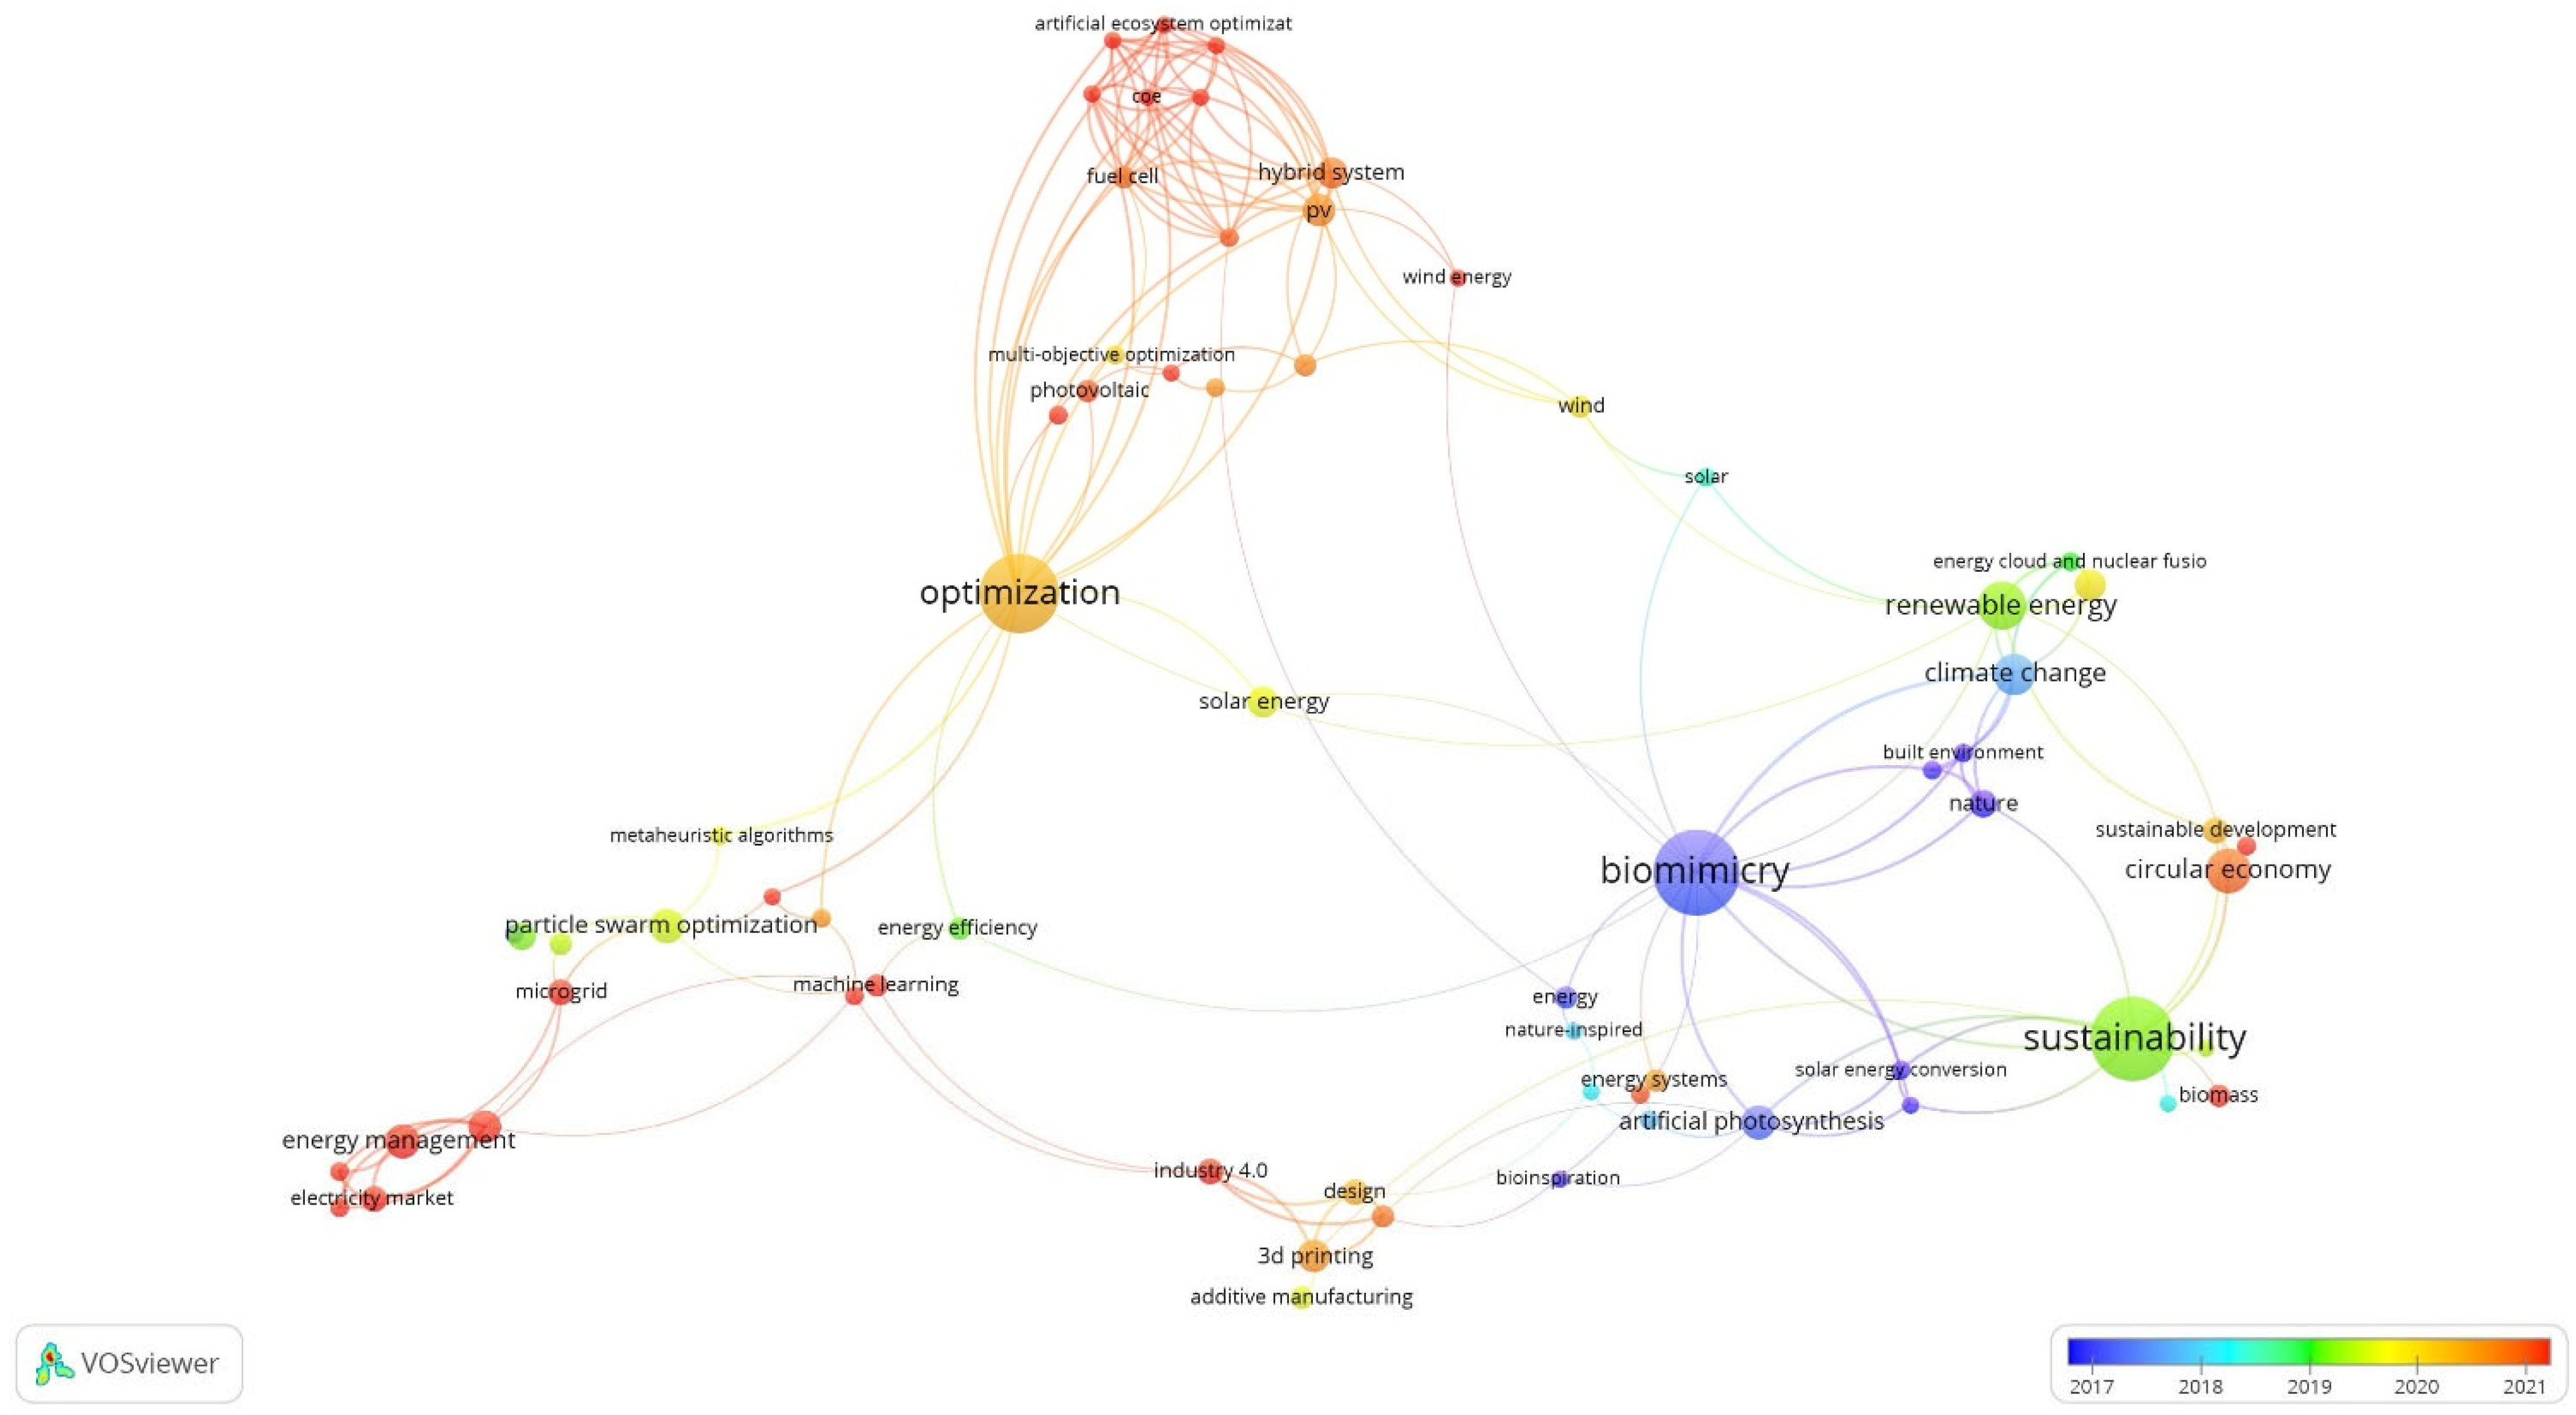
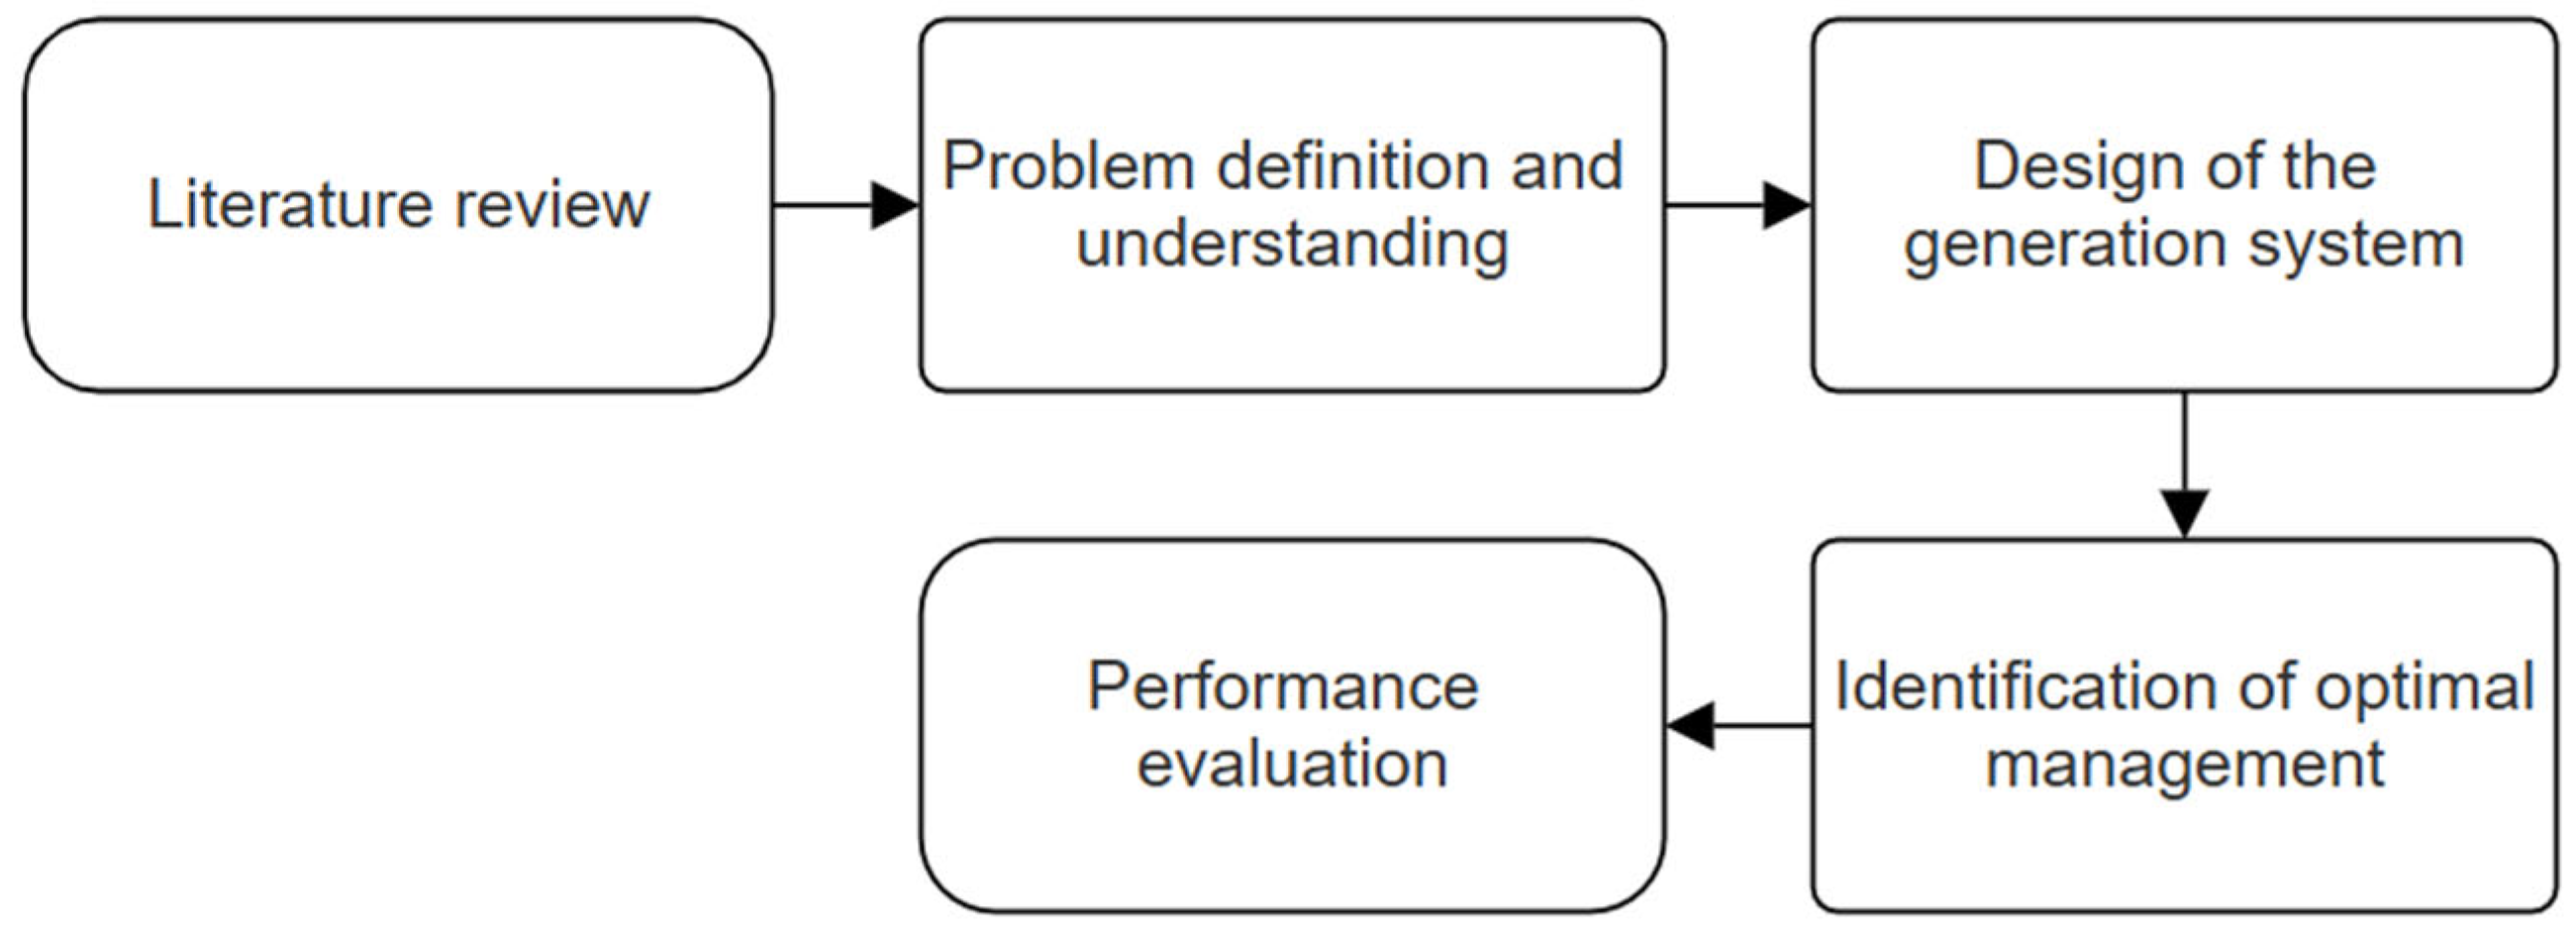
- Literature Review: We initiated our research with a thorough bibliometric review to analyze global trends, advancements, and potential knowledge gaps in the fields of renewable energy and biomimicry. This analysis helped us identify promising research directions and potential areas for innovation within the sustainable energy sector.
- Problem Definition and Understanding: Based on the literature review, we formulated clear research objectives and the methodology to achieve them. This involved defining the parameters of our case study, ensuring the research remained focused and achievable within the defined time and research budget constraints.
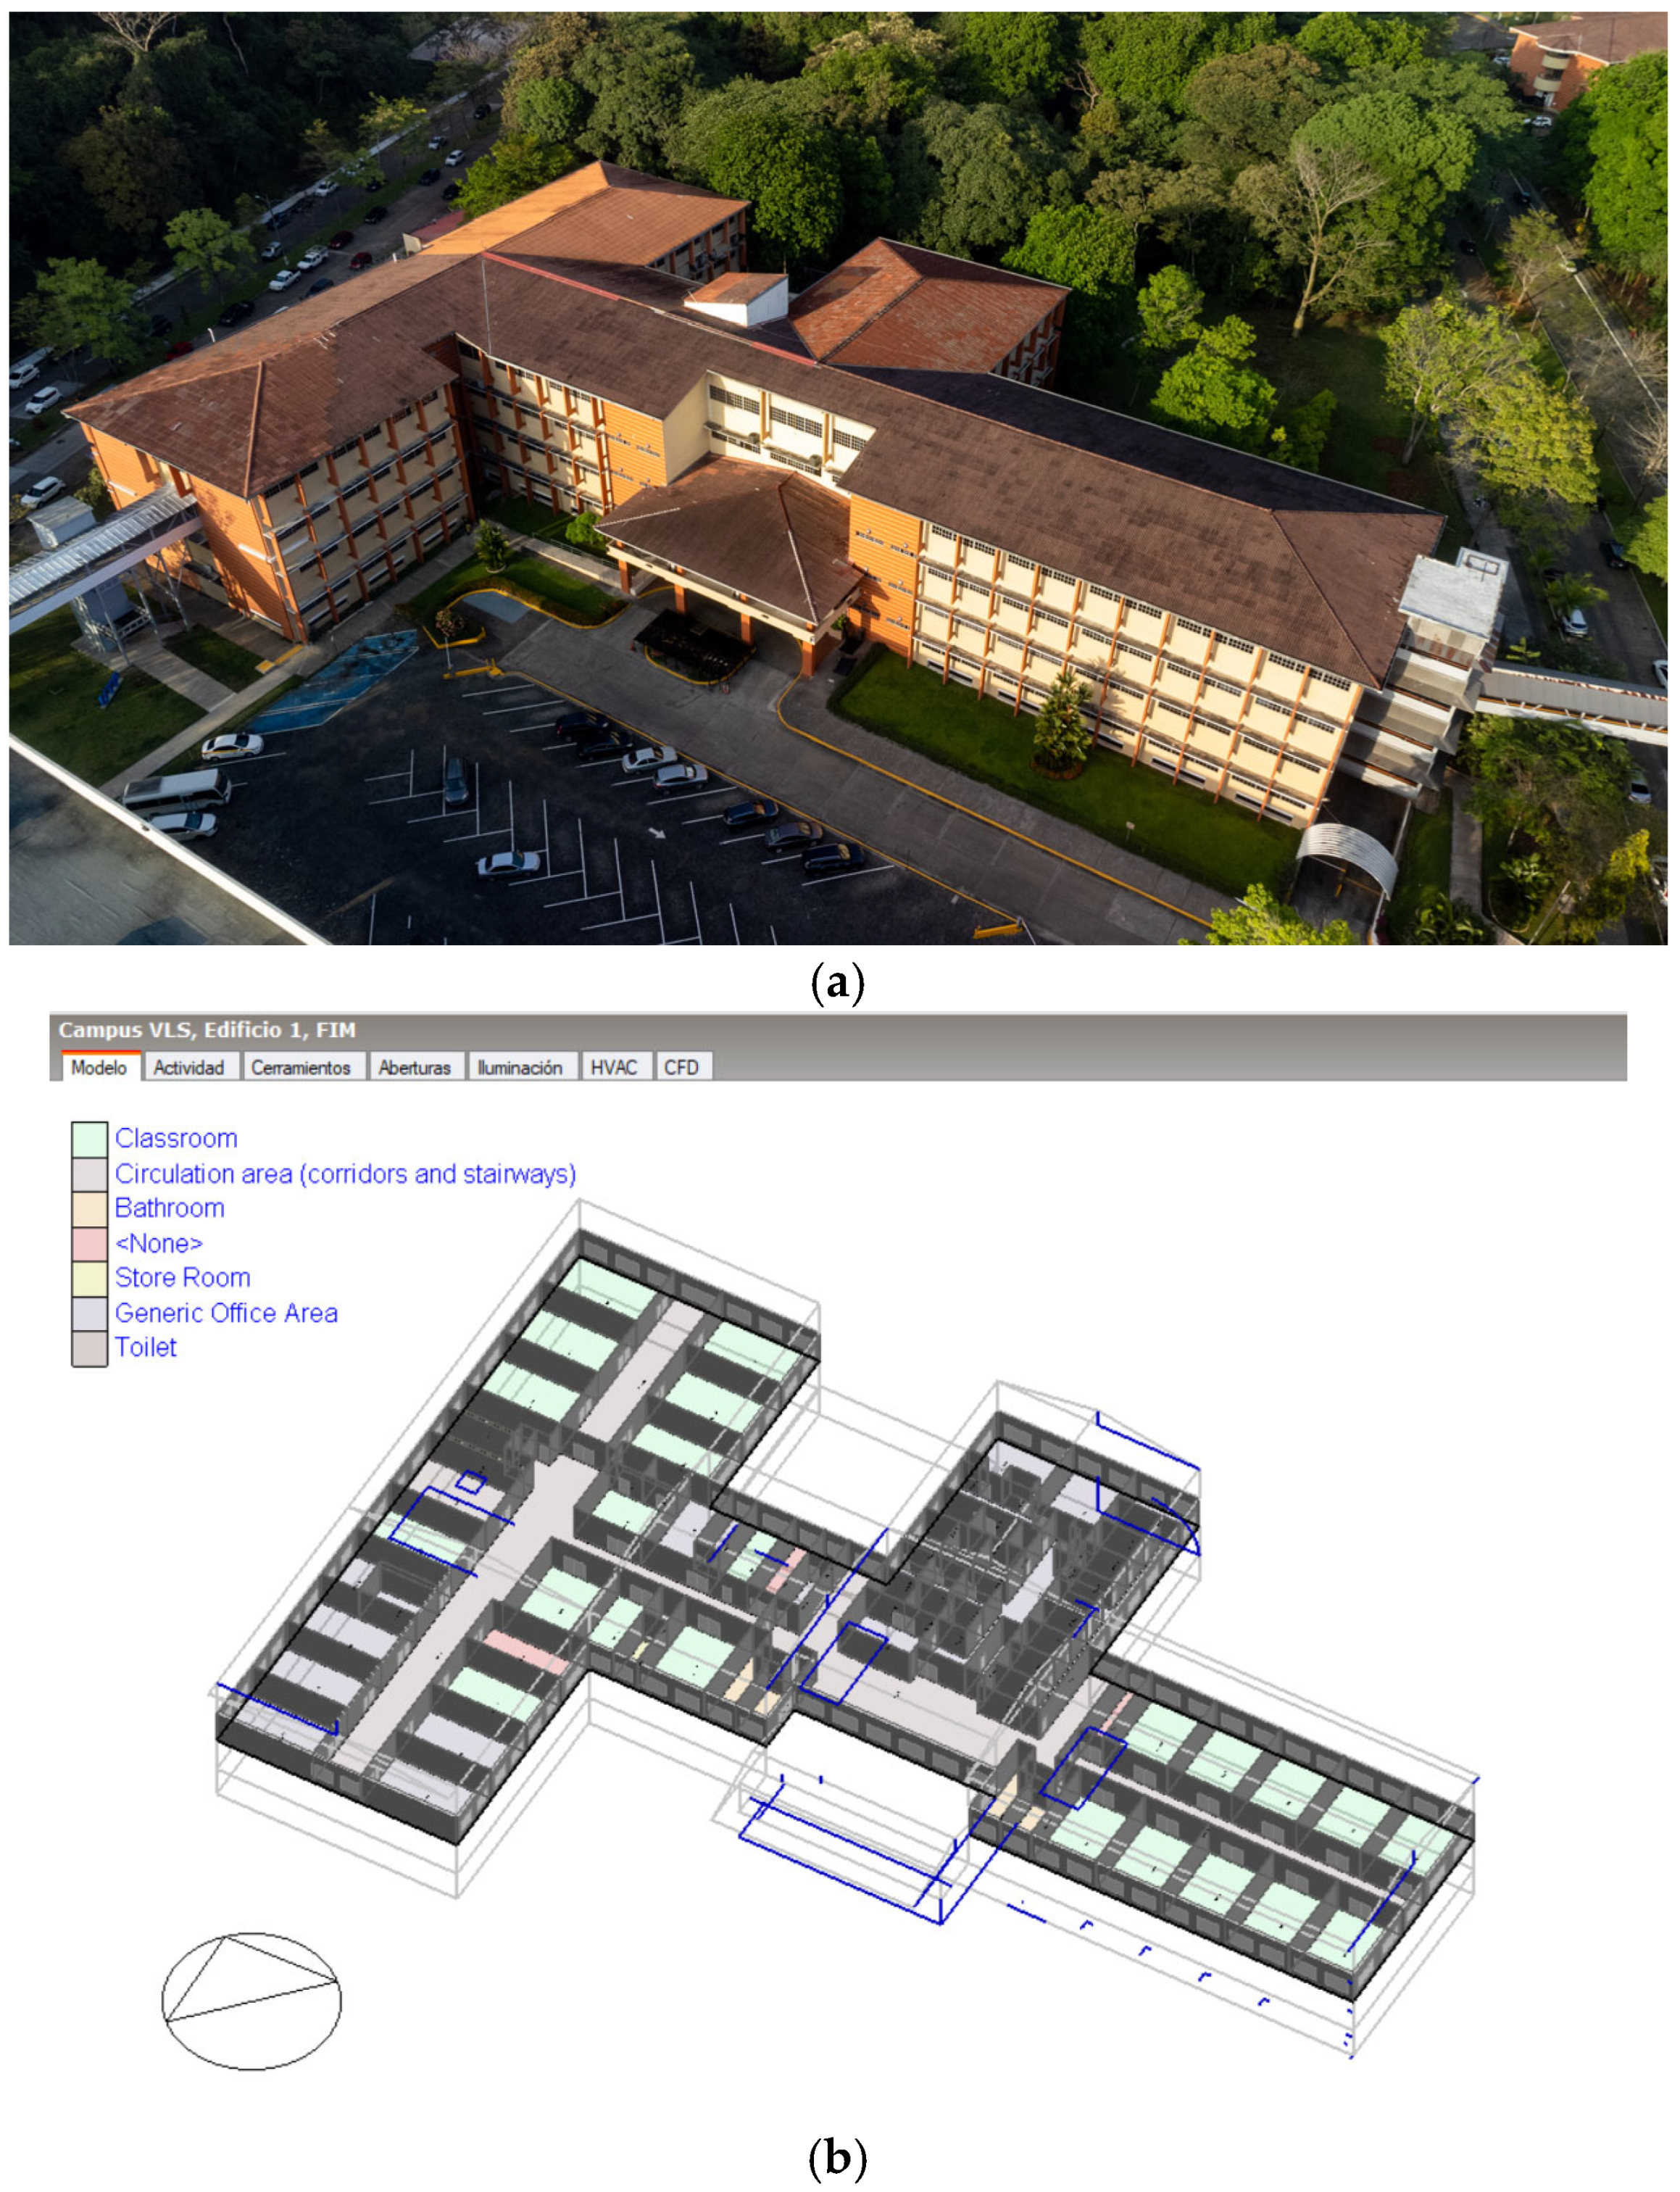
- Design of the Generation System: We designed a site-specific hybrid wind–solar distributed energy generation system with a battery bank for building #1 on the Víctor Levi Sasso Campus of the Universidad Tecnológica de Panamá (UTP). This design prioritized the building’s physical space and considered factors such as local climate conditions, energy usage patterns, and available resources to optimize the system’s configuration.
- Identification of Optimal Management: To enhance the efficiency and sustainability of our designed hybrid system, we used a biomimetic-inspired algorithm. Utilizing software tools such as MATLAB (ver. 9.10.0.1602886) and Python (ver. 3.11), we implemented optimization techniques that aimed to improve energy management and resource utilization.
- Performance Evaluation: We conducted a comparative analysis between the performance of the biomimicry-optimized system and a non-optimized baseline. This evaluation allowed us to quantify the improvements achieved in terms of energy efficiency, measured by the energy deficit in both cases.
3.1. Problem Definition and Understanding
3.2. Design of the Generation System
- Wind Generation System Sizing: The RenovaWind EOS 1 kW [30] turbine was selected for its rooftop suitability and omnidirectional operation. Using the Weibull wind frequency method, we estimated the wind generation capacity and allocated a space of 350.26 m2 for 9 turbines. Each turbine has a rated power of 1000 W.
- Solar Generation System Sizing: SunPower SPR-A450-COM [31] panels were selected for their high efficiency and suitability for the available rooftop space. After accounted for area occupied by wind turbines, 3521.86 m2 remained for solar panels. The generation capacity was calculated using the Installed Power method, considering optimal panel orientation and inclination. Each panel has a rated power pf 450 W.
- Conventional storage system (Battery Bank Sizing): Tesvolt TS25 [32] batteries were selected for their efficiency and reliability. These modular batteries can be expanded in 4.8 kW increments. However, it could be replaced with another storage system. Based on the highest daily combined energy generation, a total of 13 battery units are required to store the surplus energy generated during off-hours.
3.3. Optimization Setup
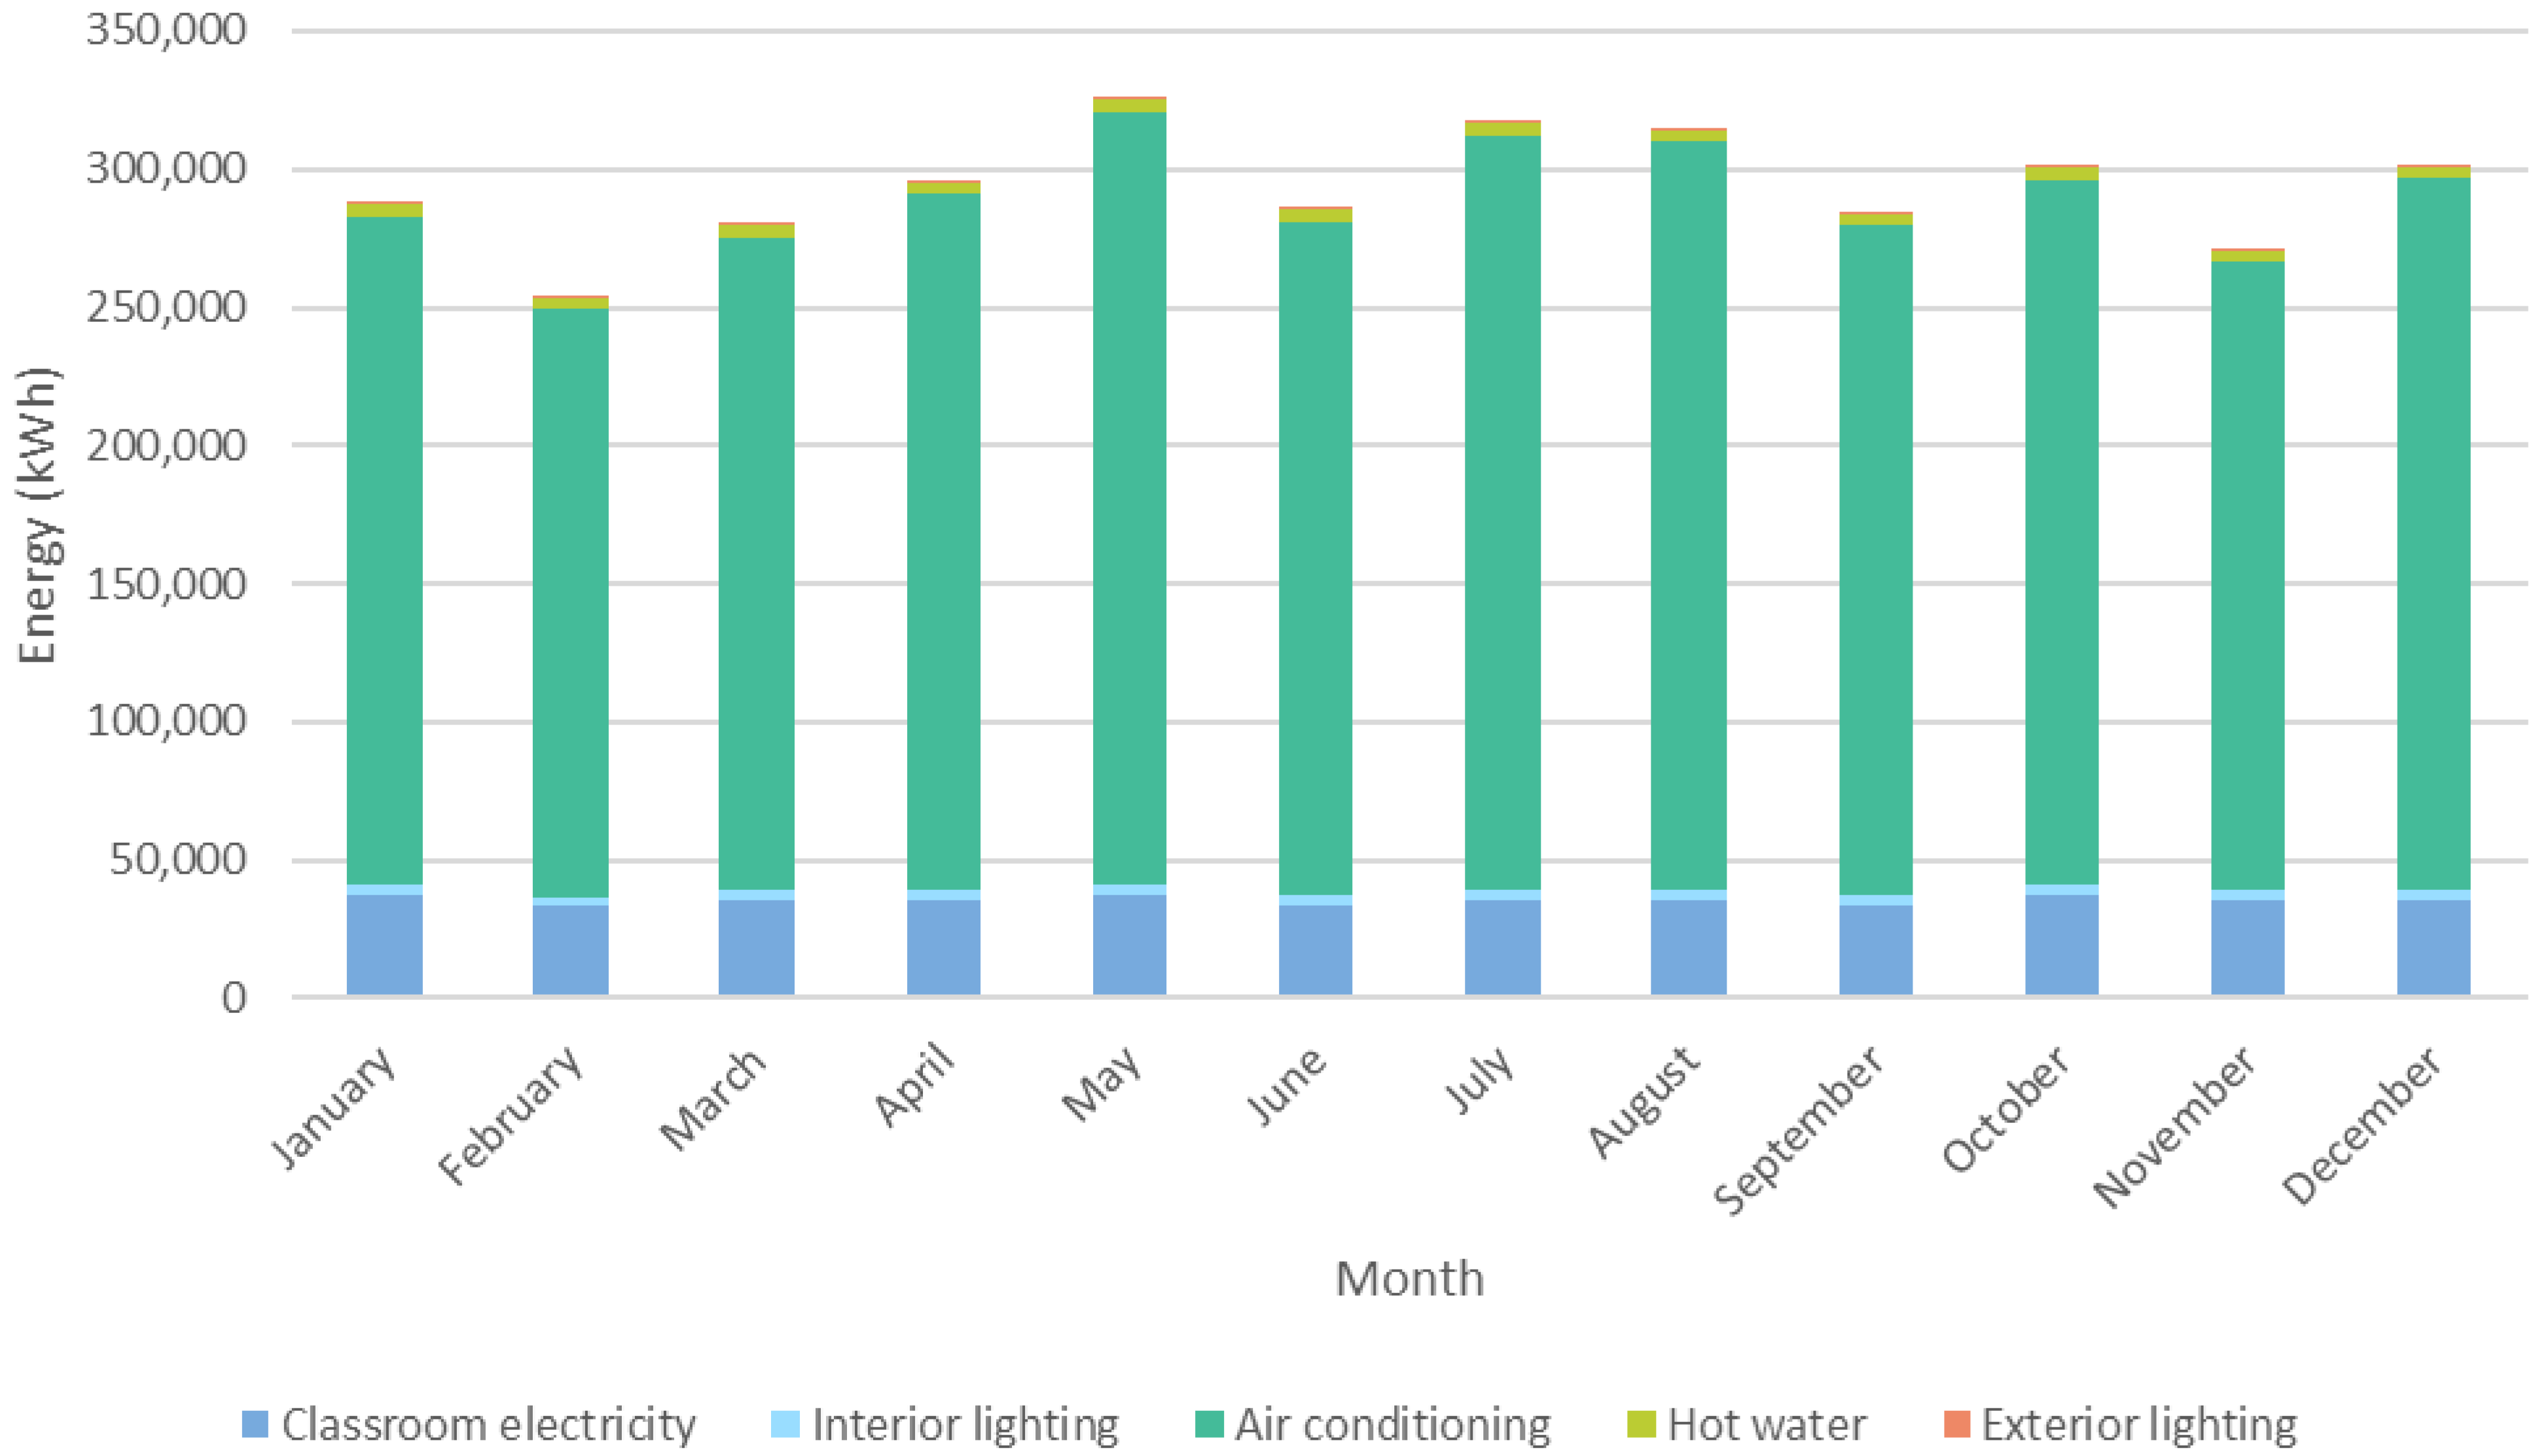
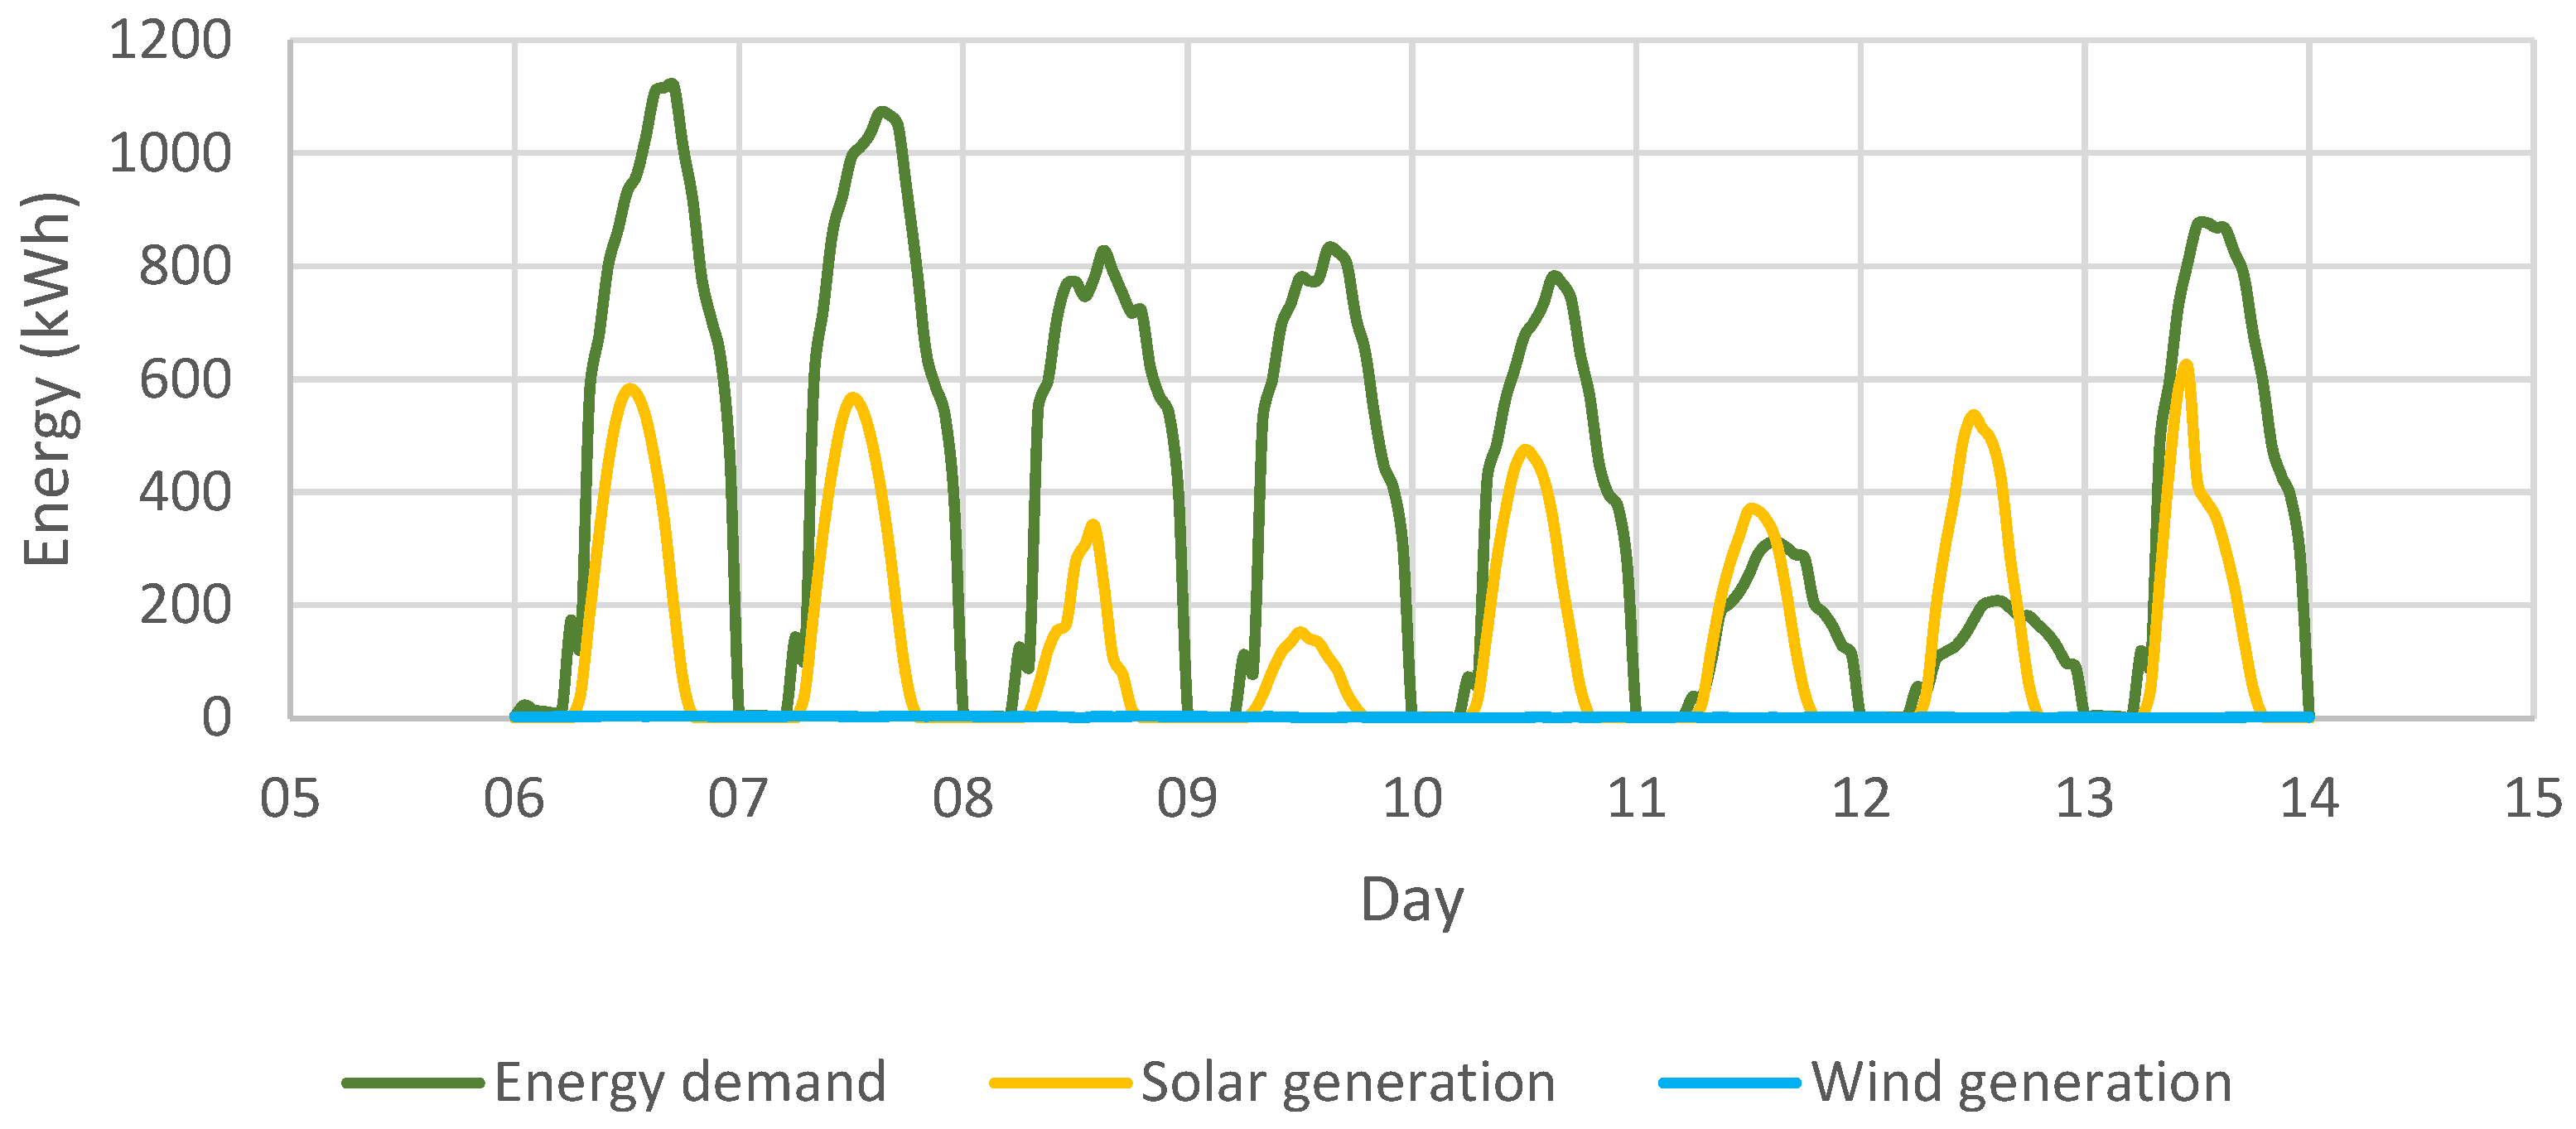
- Data collection: We gathered energy-related data from separate sources. DesignBuilder simulations provided building energy demand and solar generation data, shown in Figure 4. Since DesignBuilder is unable to simulate wind generation, a MATLAB script was written to simulate it, considering the on-site historic weather data, power curves from the turbines, and other relevant parameters.
- Descriptive statistics: We calculated descriptive statistics to summarize the dataset.
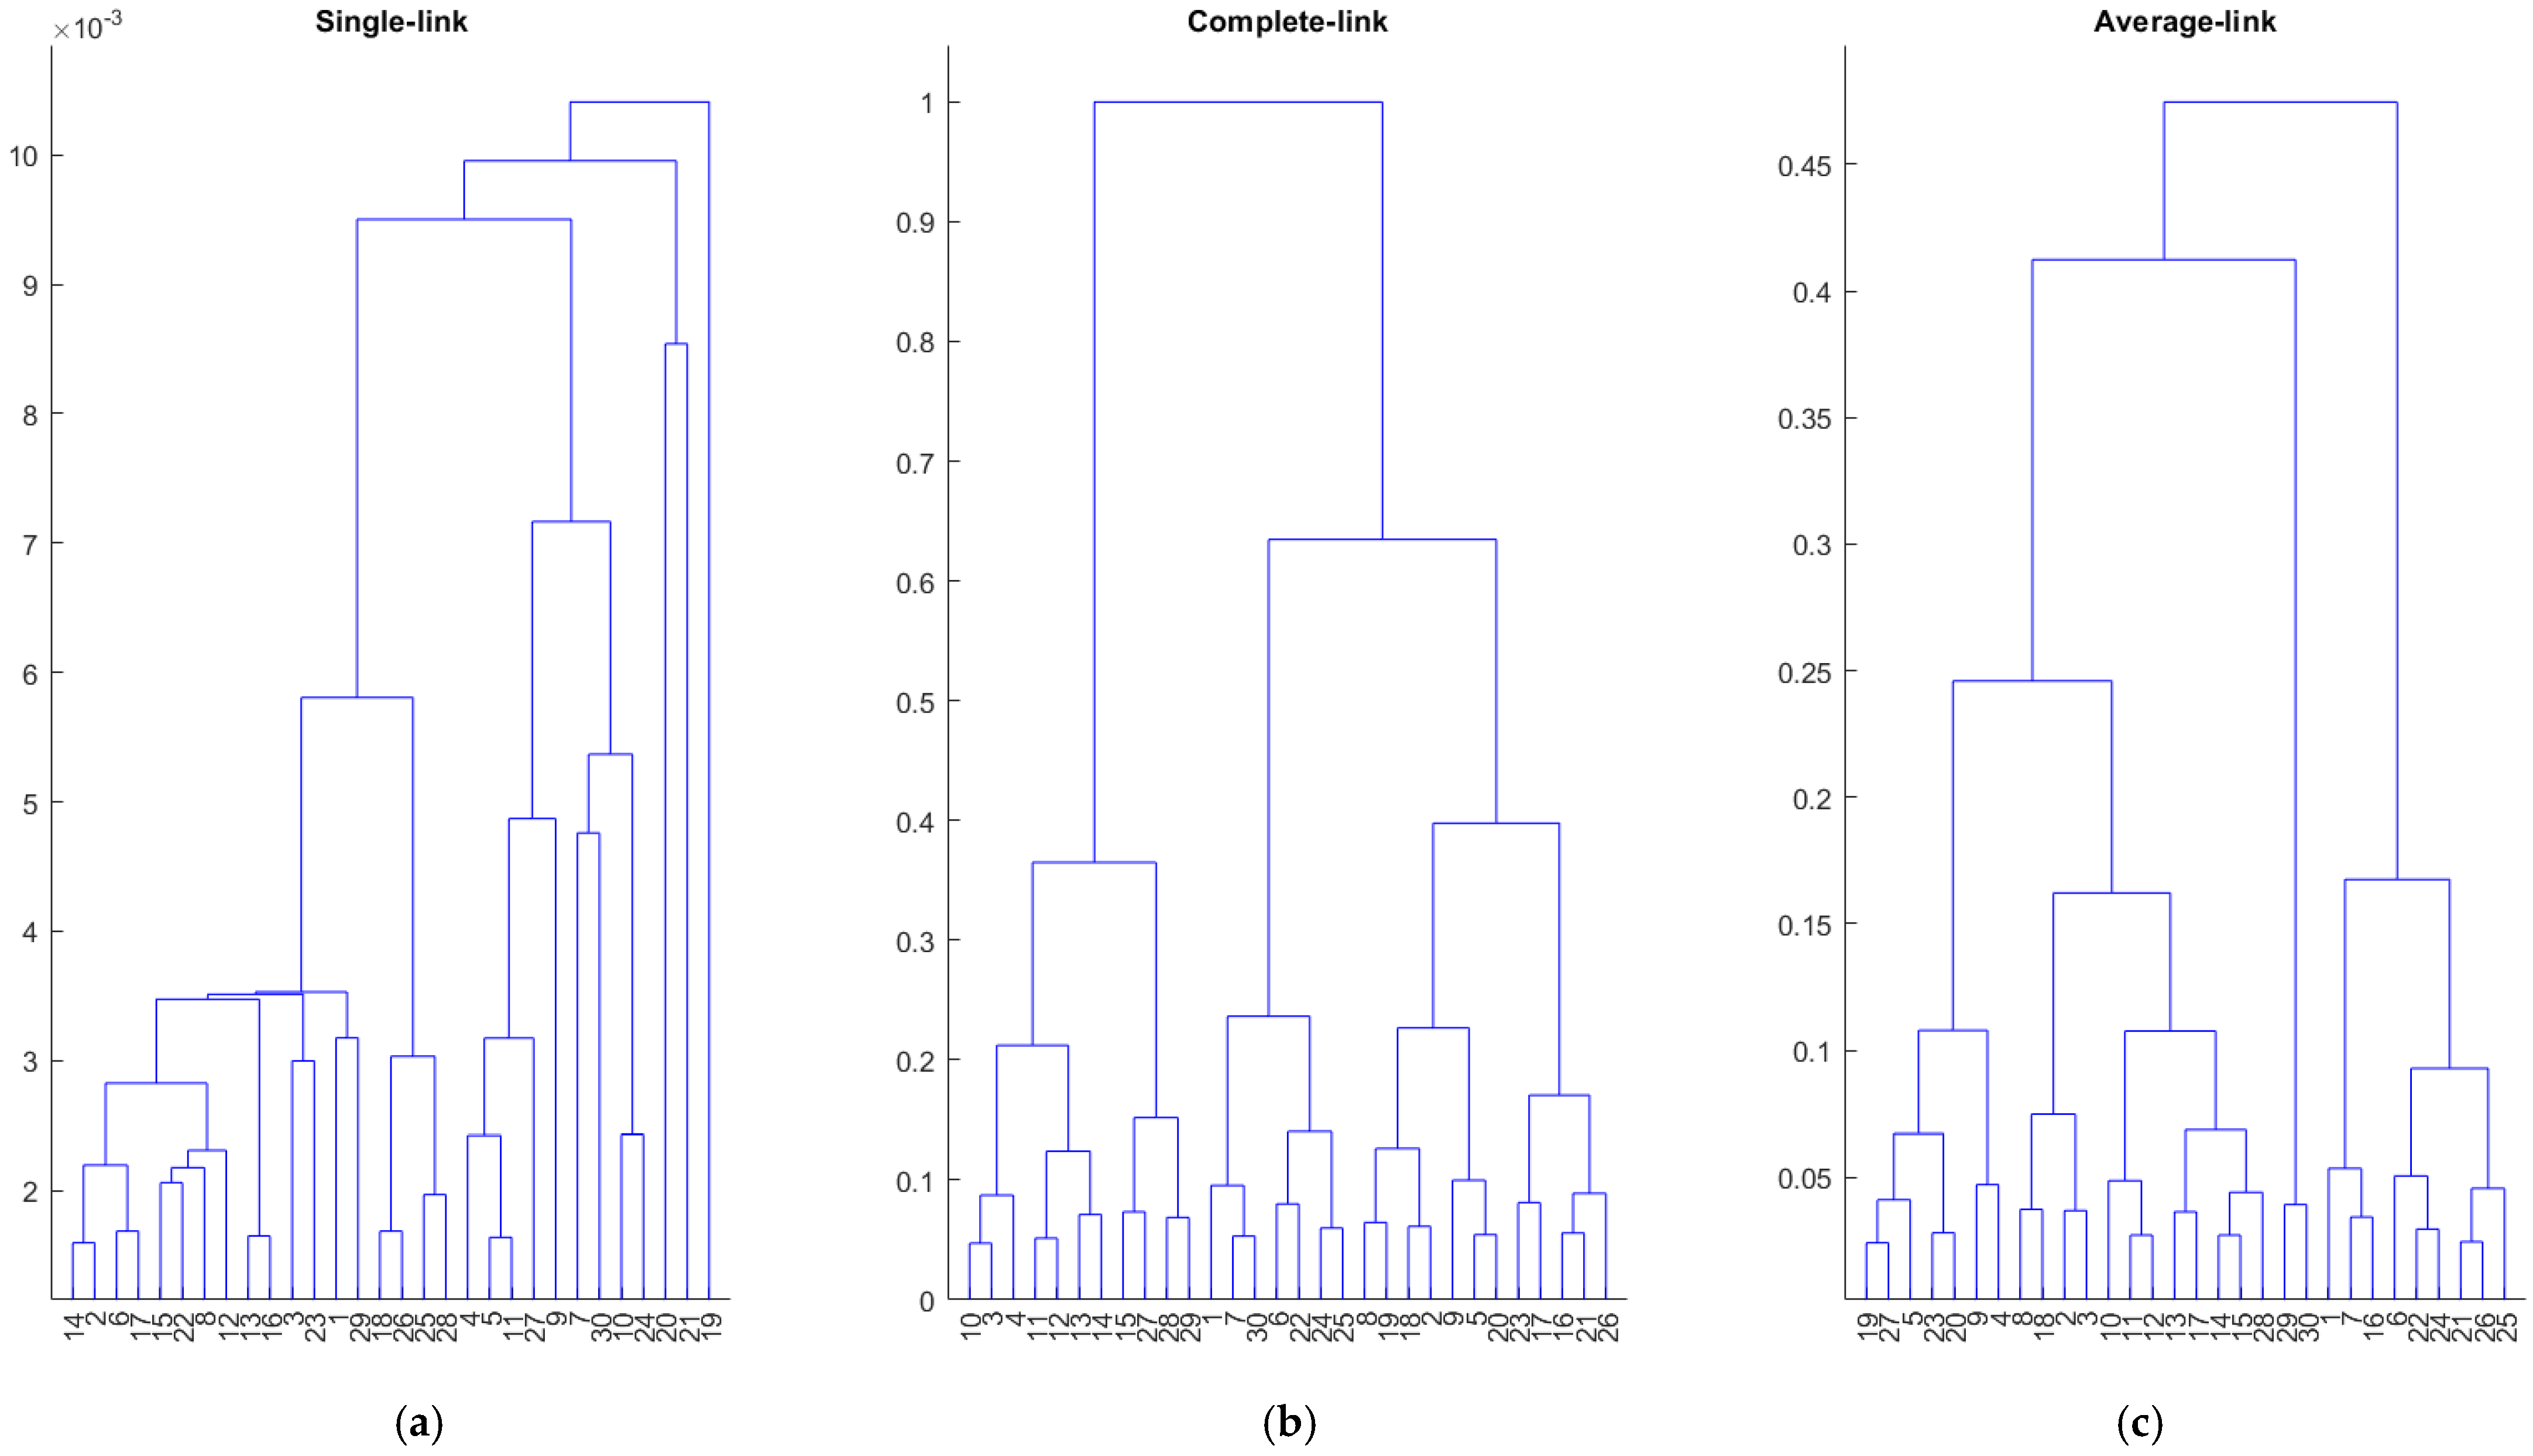
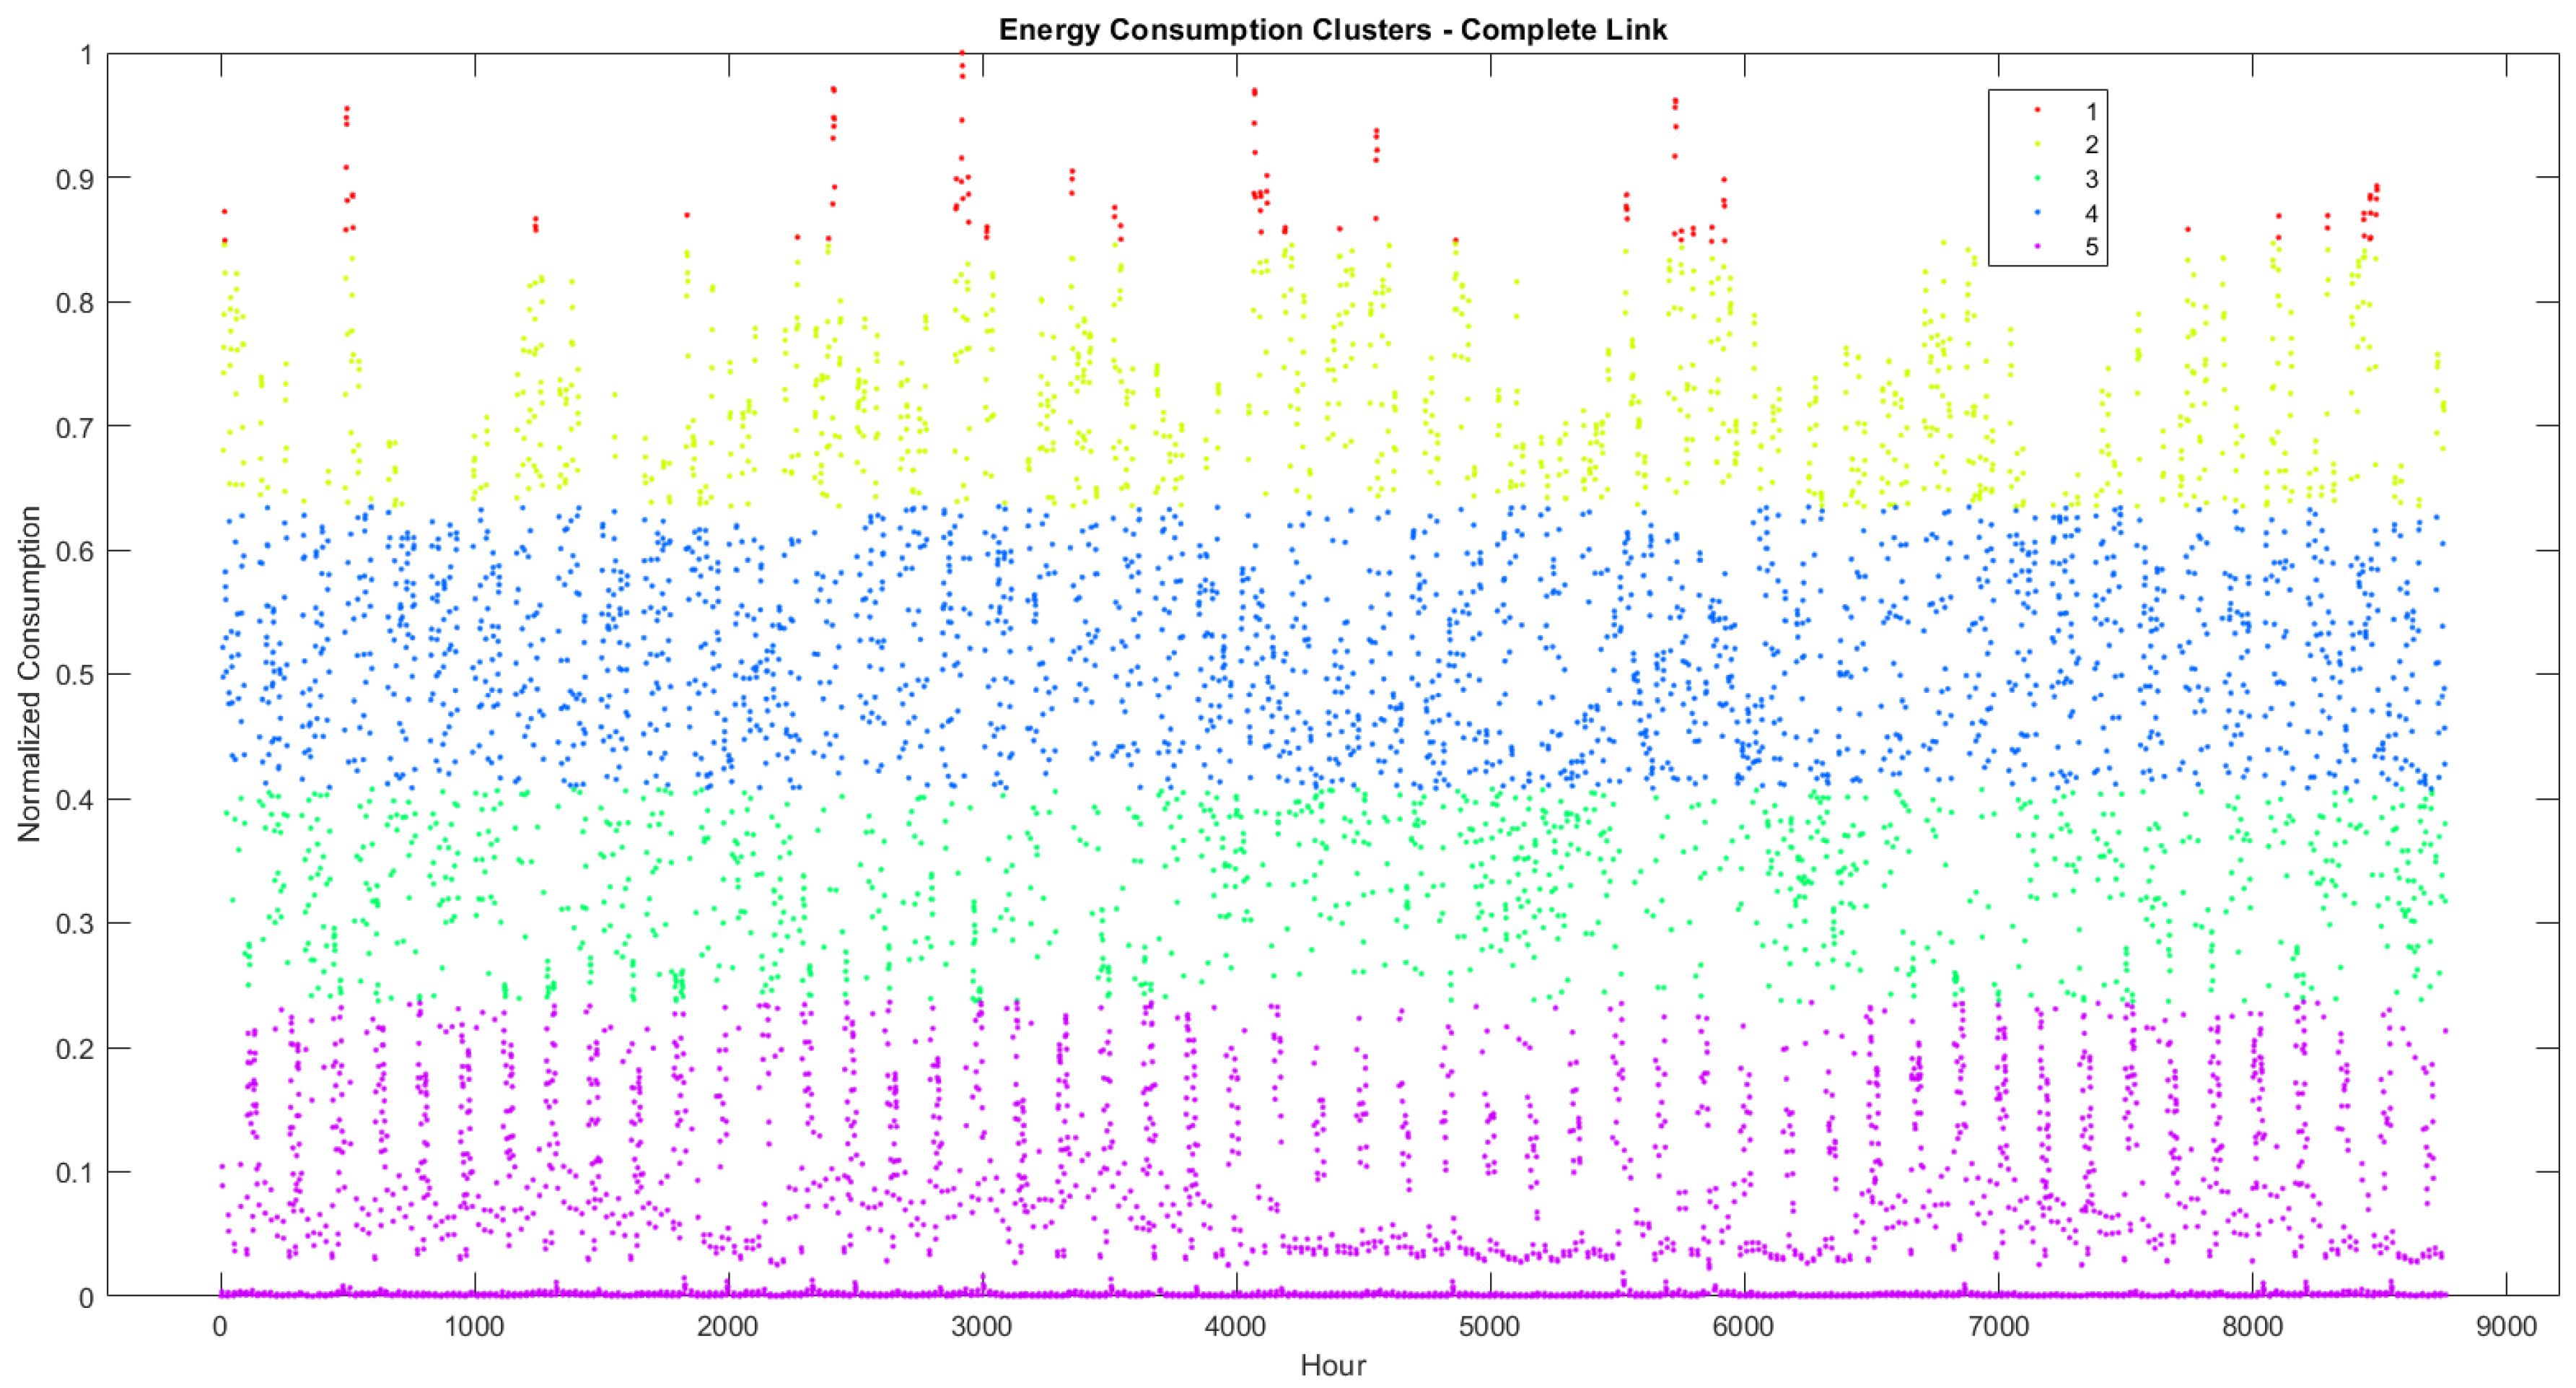
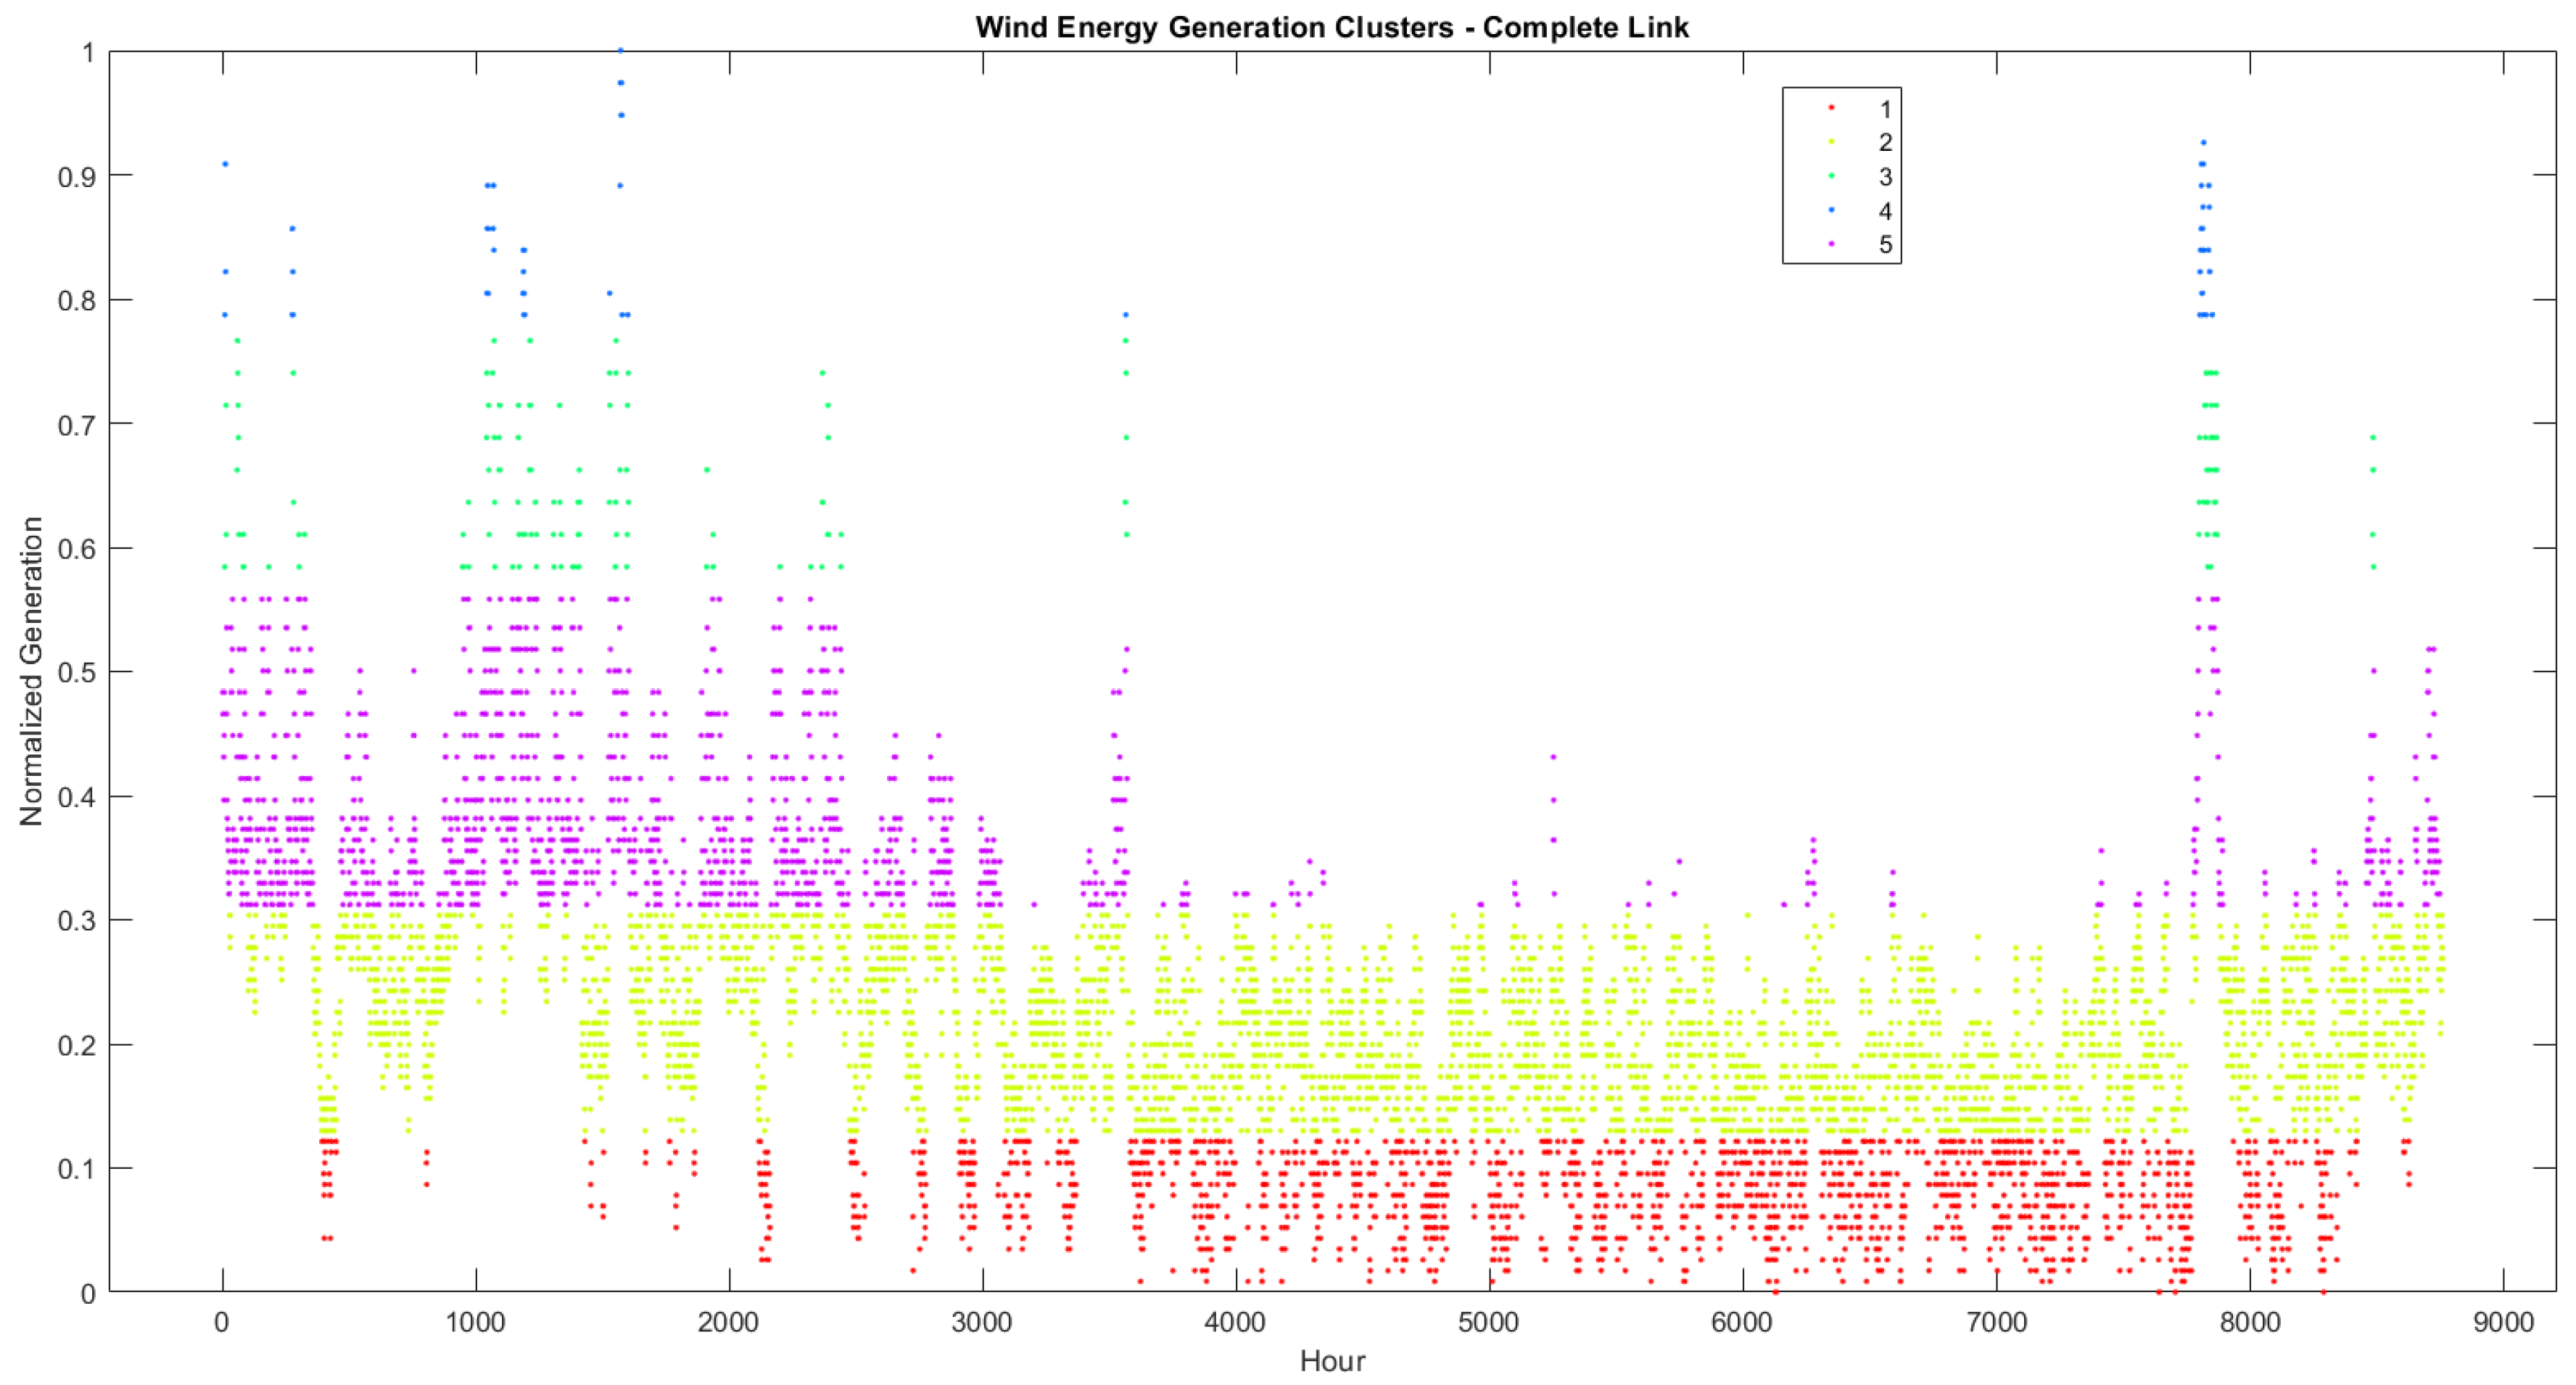
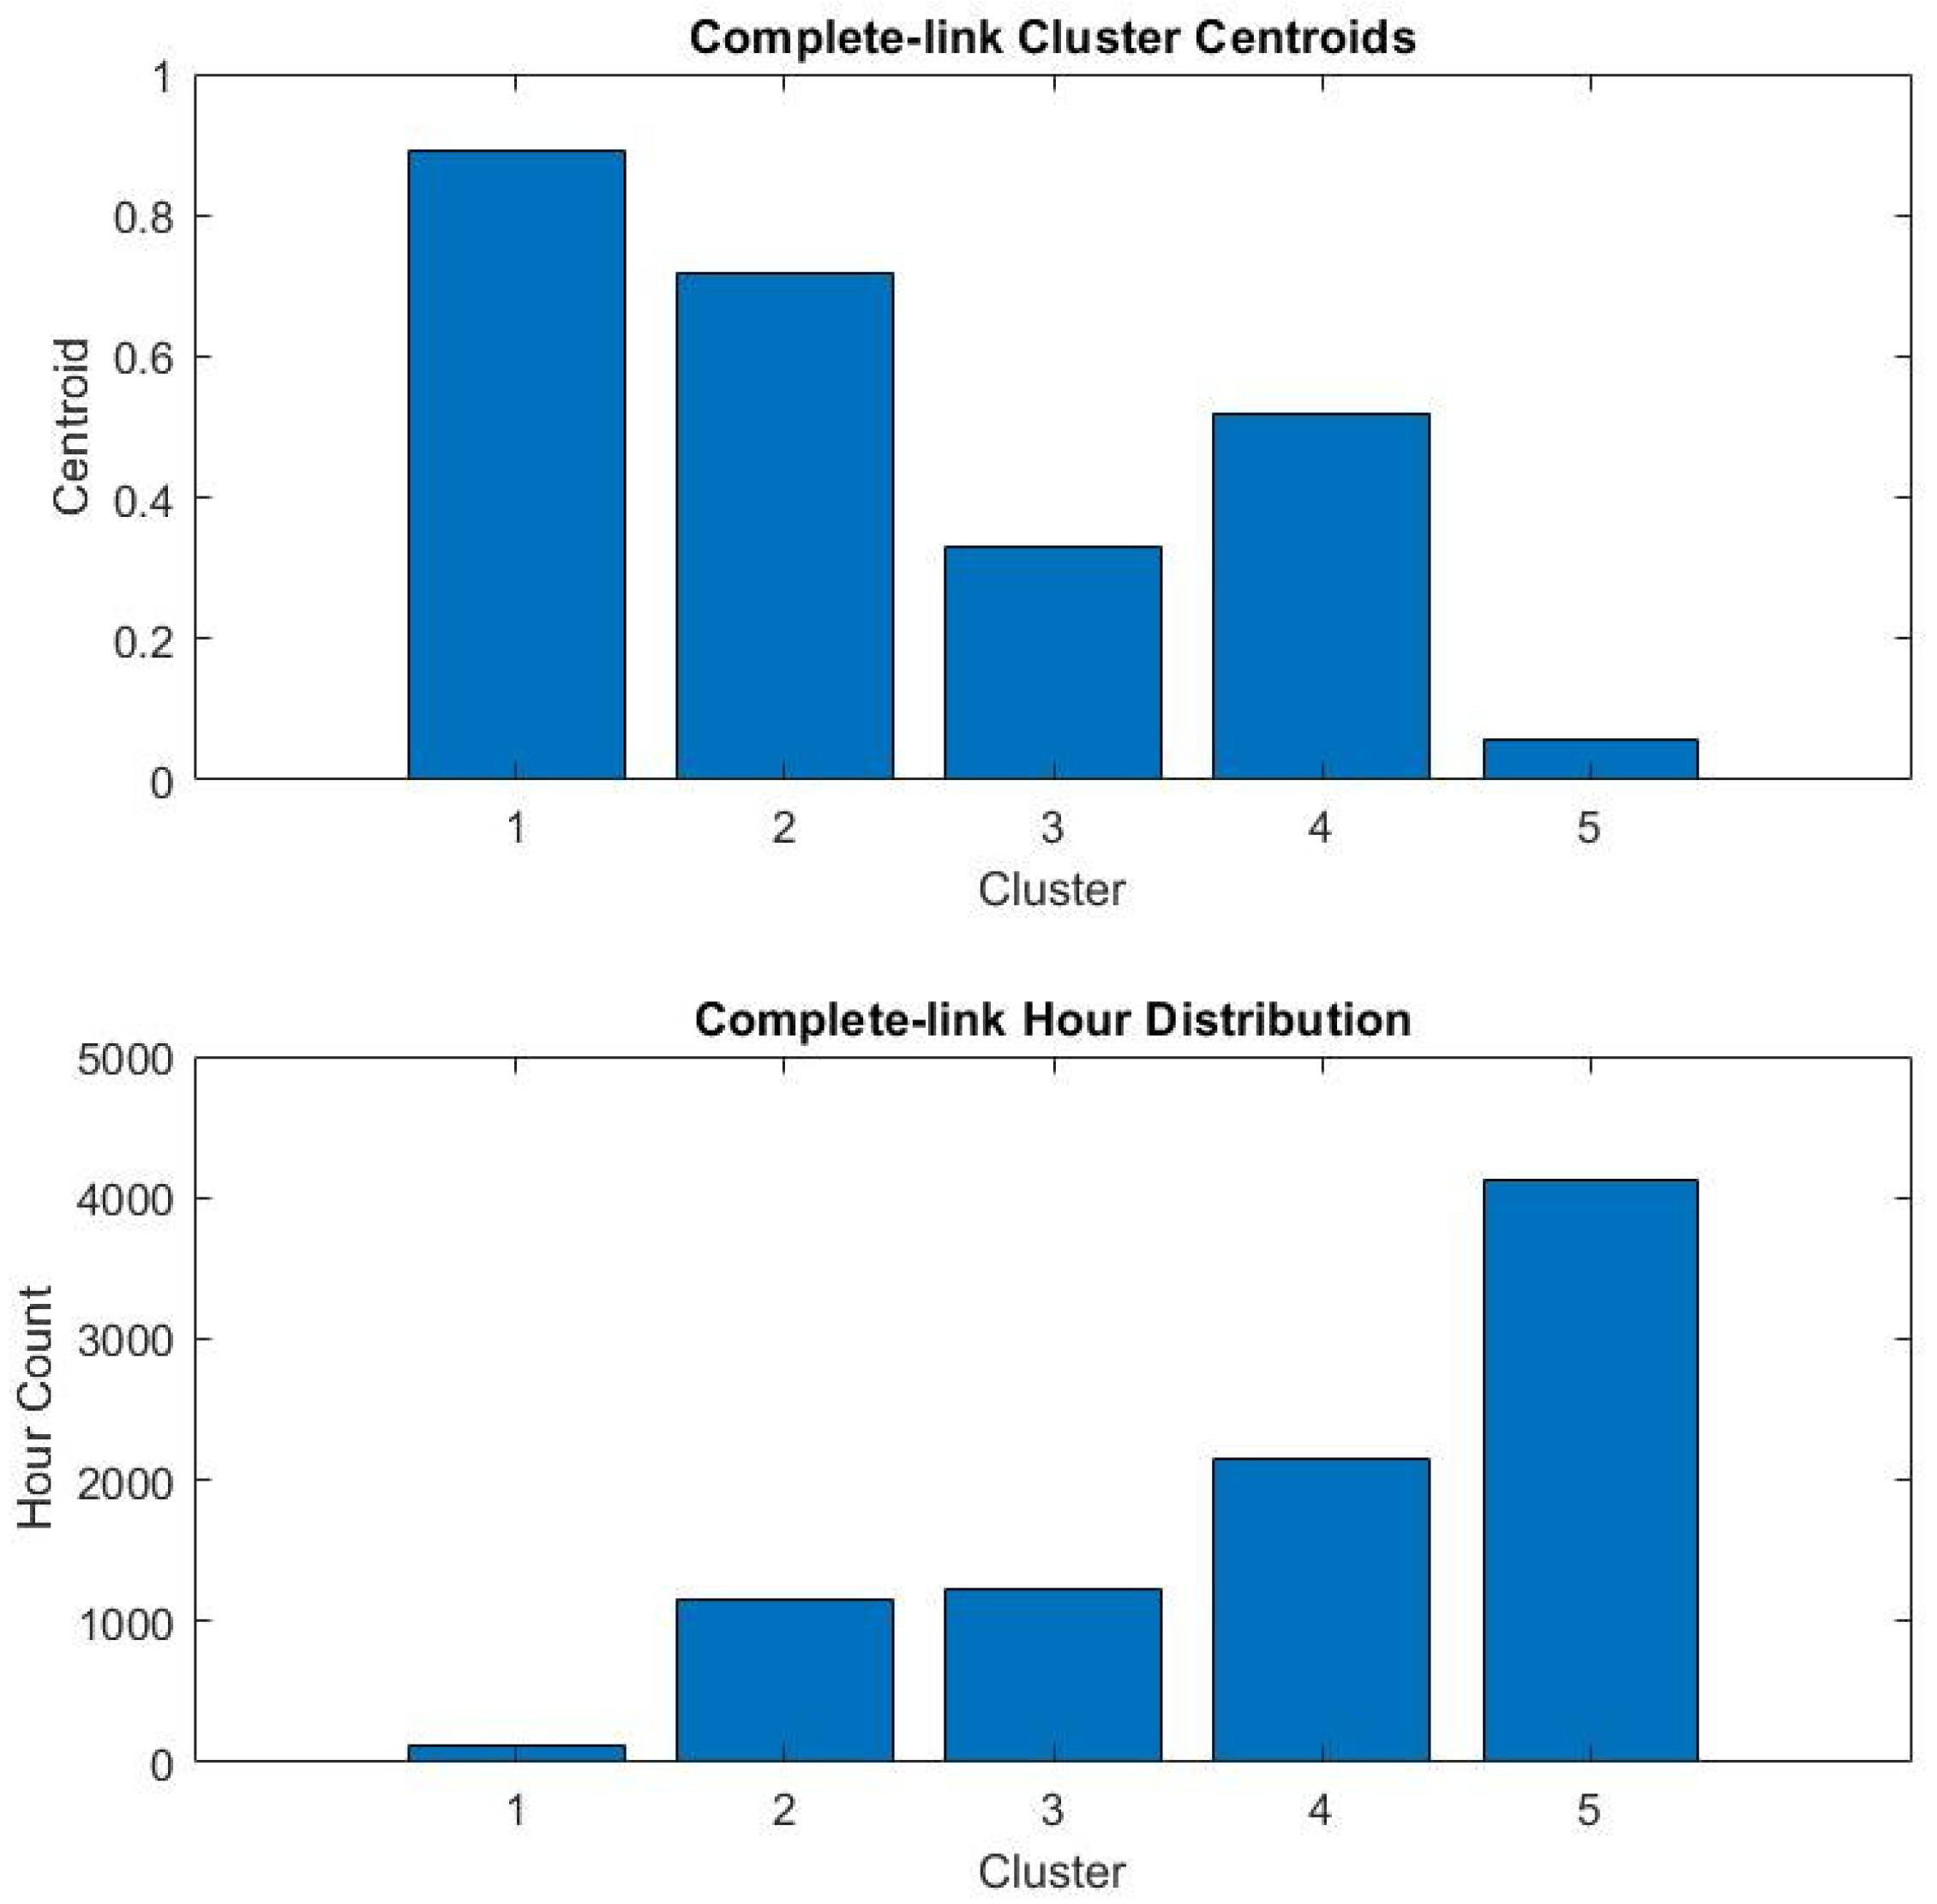
- Clustering: We used a k-means clustering algorithm to categorize data points exhibiting similar characteristics.
3.4. Performance Evaluation
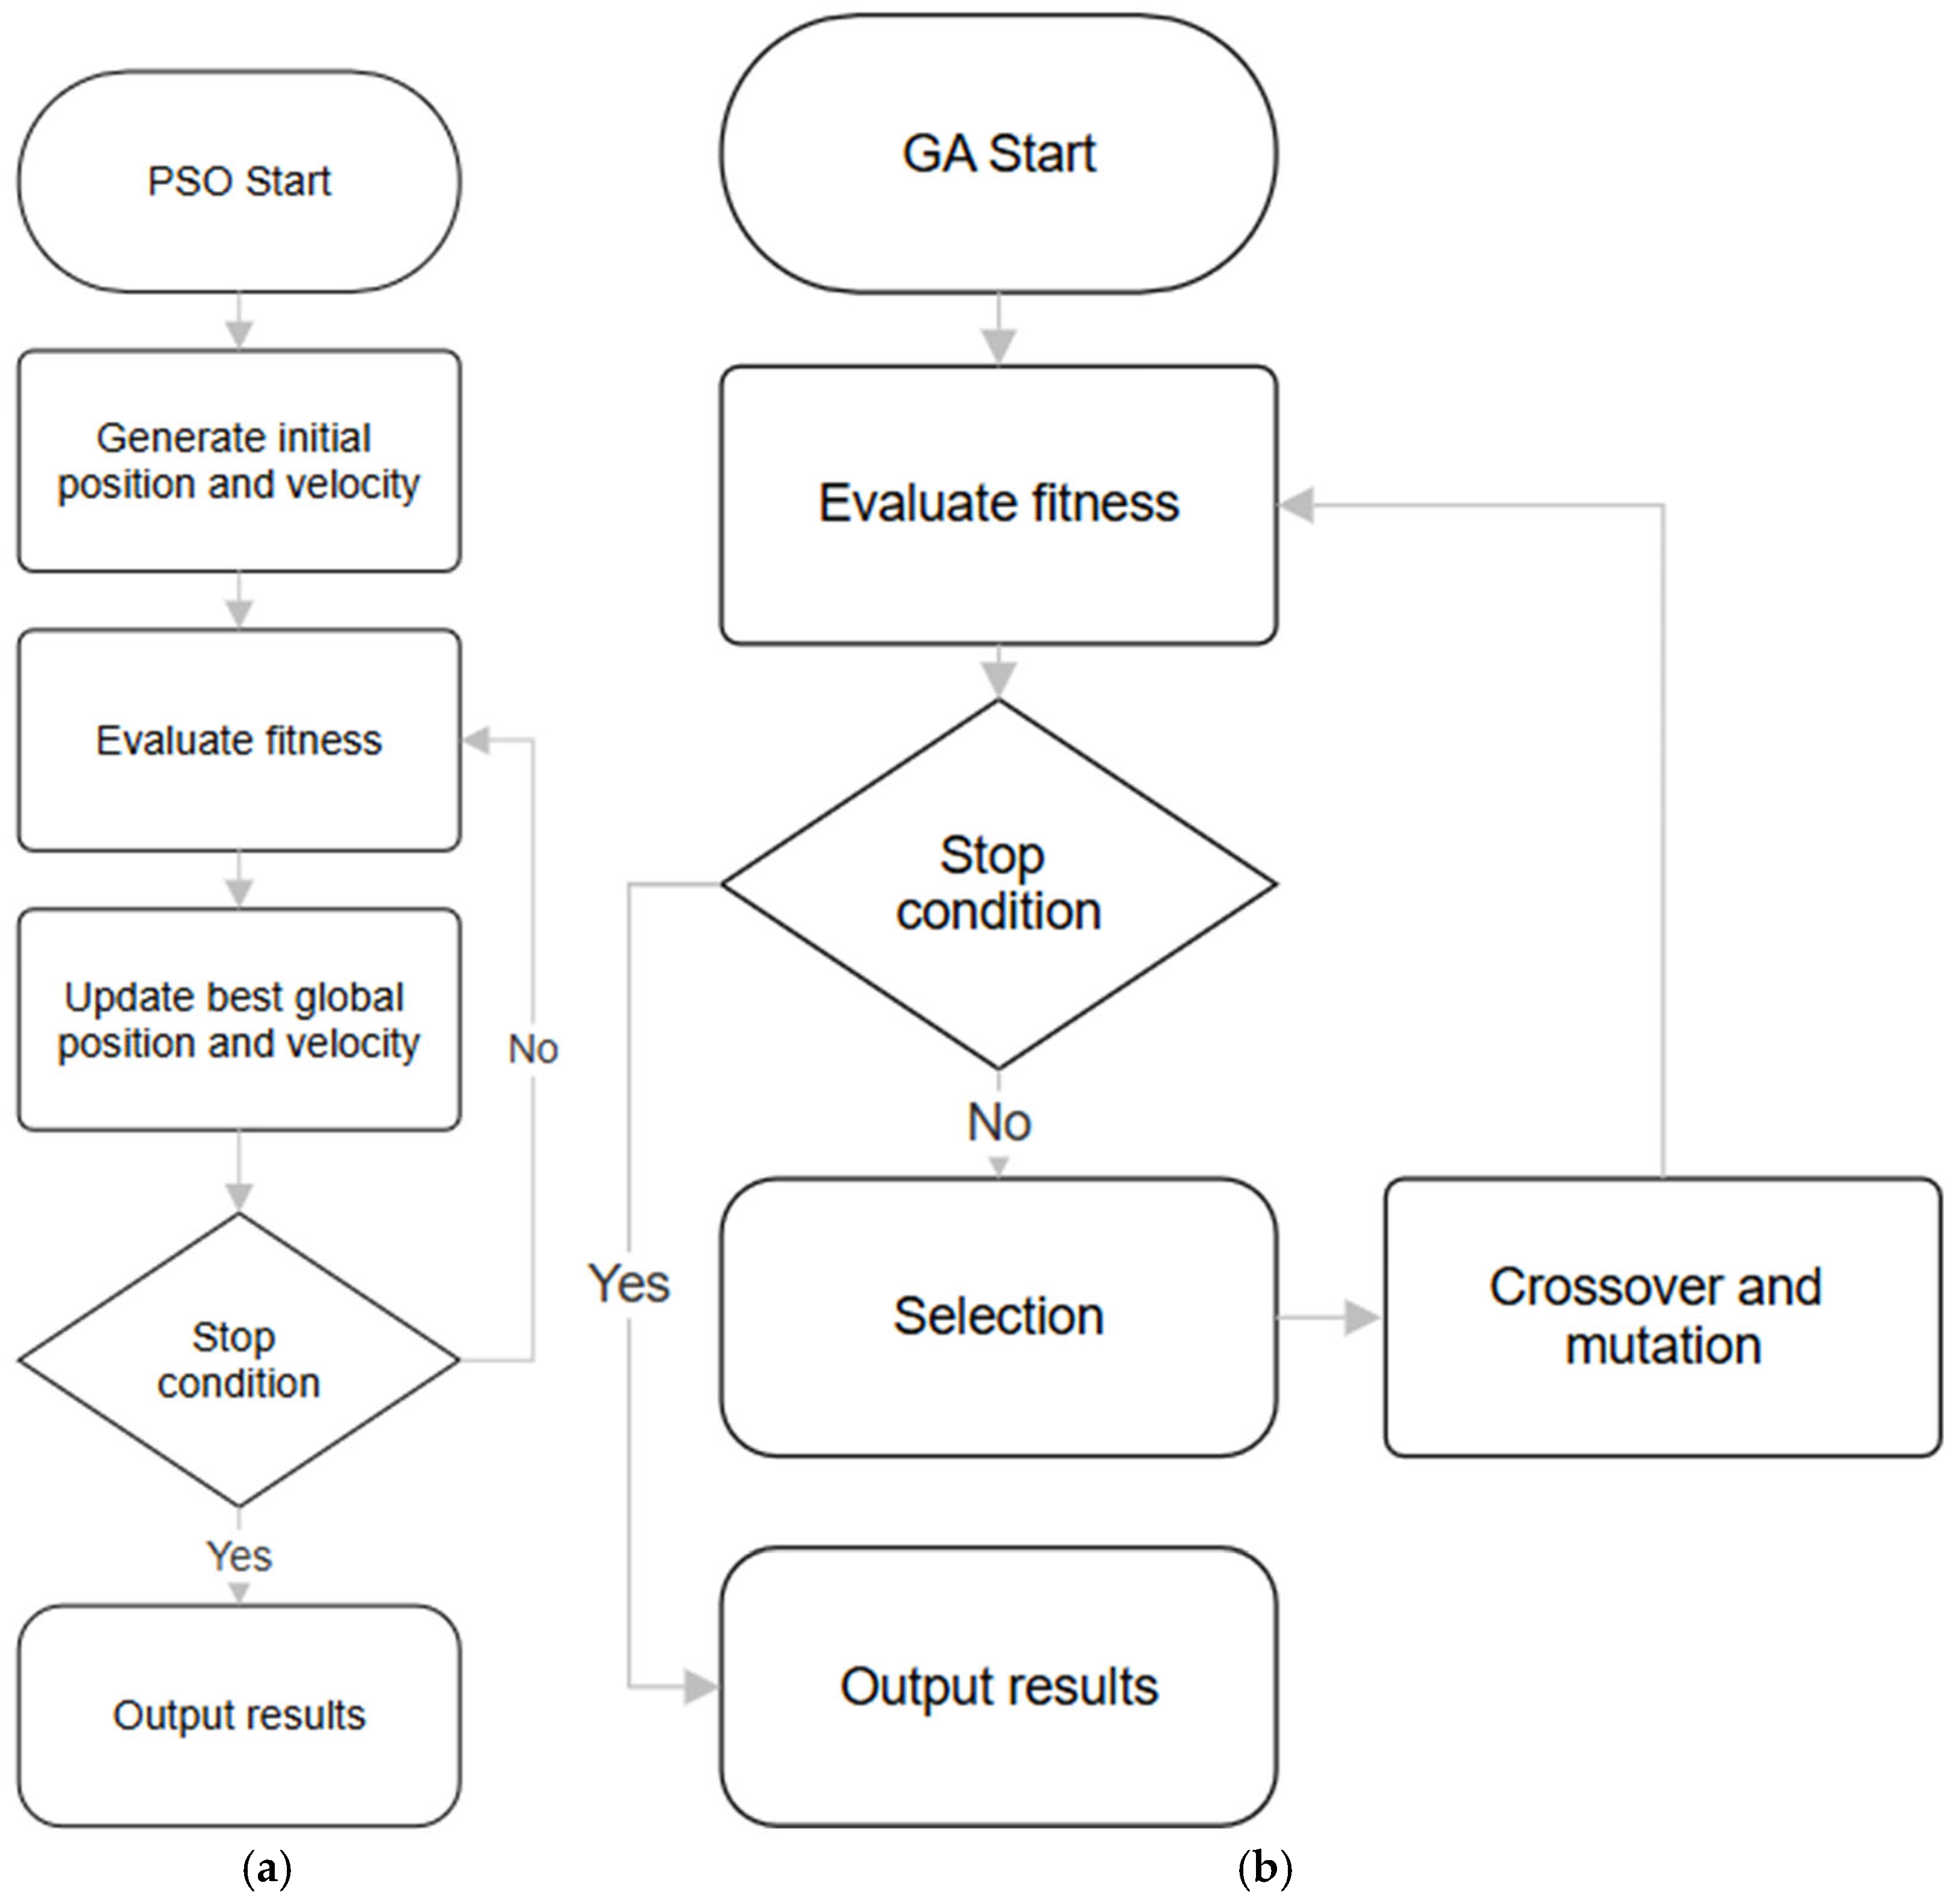
- PSO begins with randomly scattered particles within a search space. Each of these particles represents a potential solution and has parameters for both position and velocity.
- An objective function assesses each particle, determining the “fitness” of its current position.
- Each particle remembers the best position it has encountered, and the swarm collectively remembers the best position found by any particle.
- In each iteration, the particles adjust their velocities and positions according to a velocity update rule. This rule is influenced by the particle’s previous velocity, the best personal position, and the best global position.
- This process iterates until a stopping criterion is met, typically a user-defined maximum number of iterations.
4. Results Analysis
- Better Exploration: GA explores many possible solutions at once, like trying out lots of different designs. PSO focuses on improving a single solution, which can make it become stuck on a design that is not truly the best.
- Built-in Advantage: GA naturally favors solutions that perform better overall, even if we do not explicitly tell it all the rules. It is like natural selection—the “fittest” solutions survive.
- Handles Complexity Better: GA is better at dealing with all the complicated ways that solar power, wind power, batteries, and building energy use interact. PSO can struggle with these complex relationships.
5. Discussion
- Space Limitations: The system was constrained by the available space on an existing building. Because of this restriction, the manually designed generation system could only meet approximately 33% of the building’s energy demand, though this does meet certain European standards for renewable energy integration in existing buildings [49]. This emphasizes that retrofitting existing buildings with renewable energy systems often faces physical limitations. Project developers and policymakers need to set realistic expectations about the achievable level of energy self-sufficiency based on available space.
- Economic Factors: This project prioritized technical performance over economic factors. Future studies should include other parameters such as equipment cost and return on investment, reflecting real-world implementation considerations, as demonstrated in similar studies [48]. This means that optimization should not only focus on energy production but also on minimizing overall costs.
- Optimization Focus: The energy mix optimization, based solely on generation per square meter and rated power, negatively impacted the energy deficit when combined with the subsequent battery discharge optimization. However, applying the battery discharge optimization to the original non-optimized system did yield a positive result of 2% reduction in the energy deficit. This demonstrates that optimizing individual components in isolation can be counterproductive. A holistic, system-level optimization approach is crucial for achieving overall efficiency gains. Designers should carefully consider the interactions between different system components.
- Algorithm Choice: Applying the Genetic Algorithm (GA) to the battery discharge optimization achieved a 4% reduction in energy deficit, double that of PSO. There is no one-size-fits-all optimization solution. Engineers and designers should experiment with multiple algorithms and carefully evaluate their performance based on the specific project requirements and constraints.
6. Conclusions
- The superior performance of the GA suggests that incorporating GA-based optimization into the design process for distributed renewable energy systems can lead to demonstrably better energy generation and resource utilization. This translates to potentially reduced energy costs and a smaller carbon footprint for buildings adopting this approach.
- Our work highlights the crucial need to integrate practical constraints, such as space limitations, building adaptability, and economic factors (equipment and grid energy costs), directly into the optimization process. Ignoring these factors can lead to theoretically optimal but practically unfeasible solutions. Our methodology, incorporating dynamic simulations, provides a framework for addressing these real-world challenges.
- The findings are particularly relevant to the advancement of distributed energy in Panama, where the push for renewable energy adoption is growing. The successful application of GA-based optimization in our case study provides a valuable model for future projects in the region, potentially accelerating the transition to a more sustainable energy landscape.
Author Contributions
Funding
Data Availability Statement
Conflicts of Interest
Appendix A
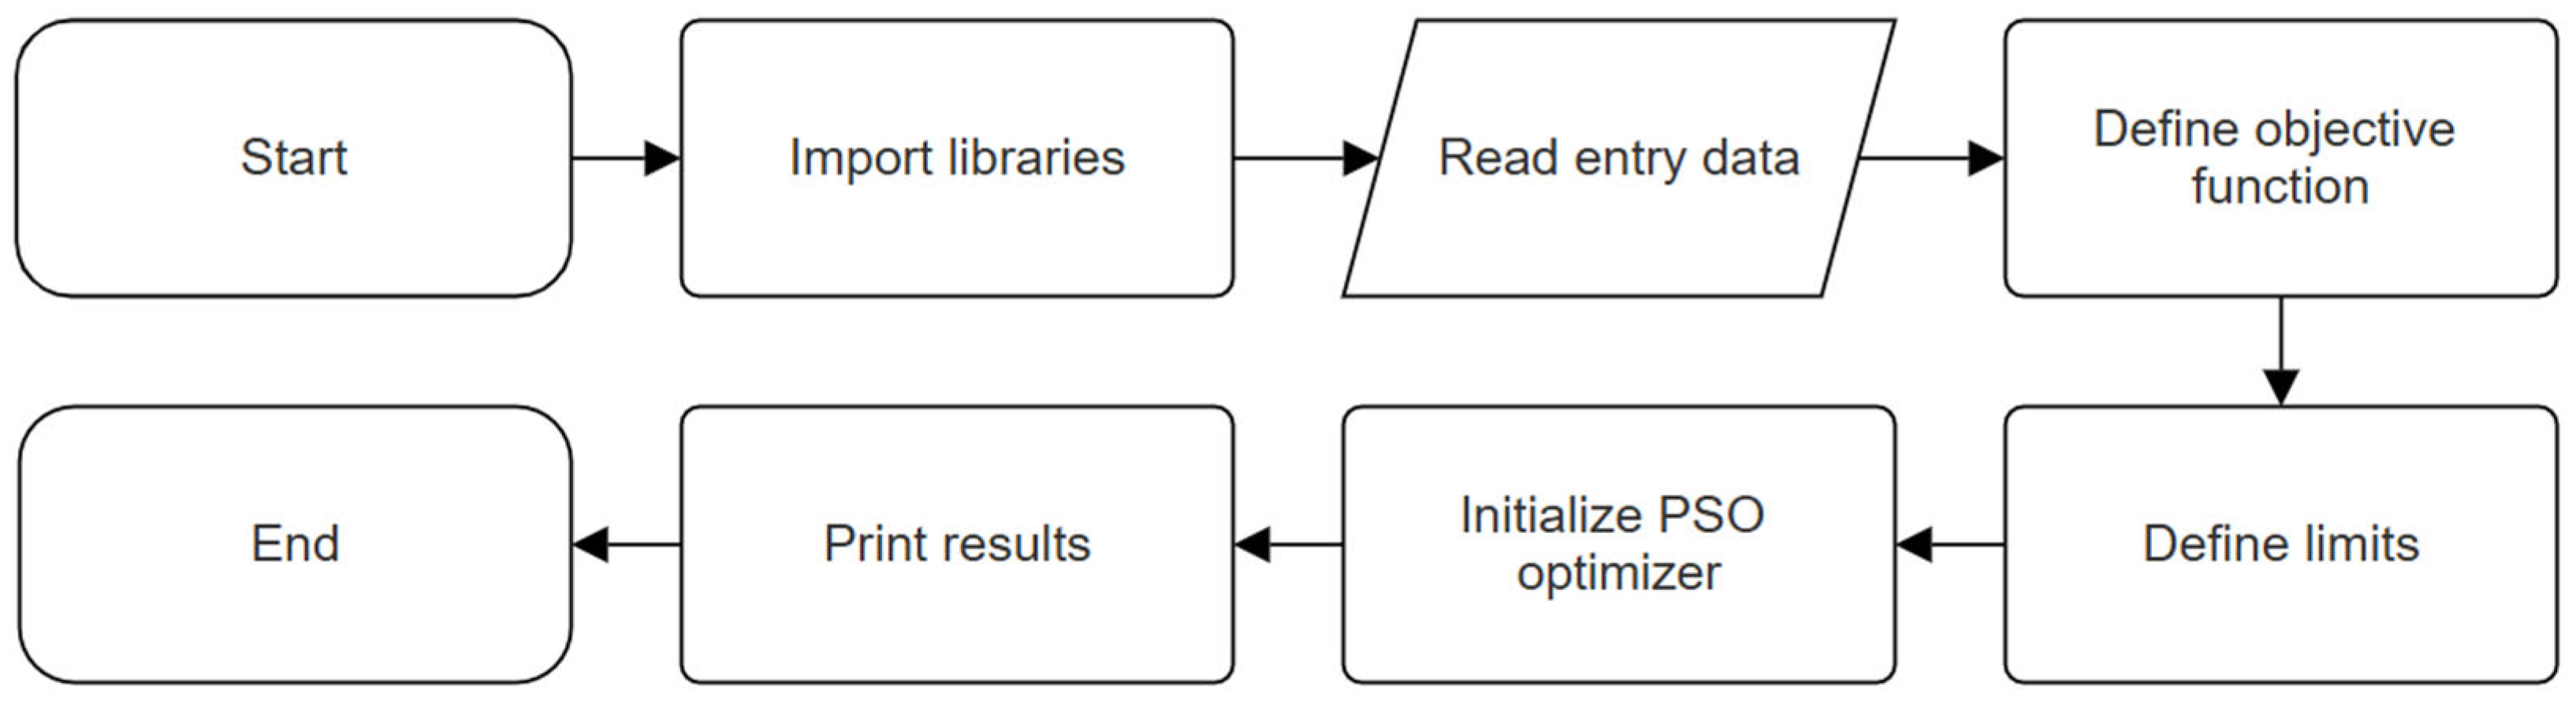
- Import necessary libraries: Imports the required libraries for data manipulation (pandas), numerical computation (numpy), and particle swarm optimization (pyswarms).
- Load input data: Reads the ‘Datos_de_entrada.csv’ file into a variable called ‘energy_data’.
- Define the objective function: This function does the following:
- Extract solar and wind area values from the input.
- Calculate energy generation for solar and wind based on input areas and data from ‘energy_data’.
- Calculate energy deficit: Find the absolute difference between energy consumption (in ‘energy_data’) and the total energy generation.
- Apply penalties: Assign a large penalty if the combined solar and wind area falls below 80% of the available land.
- Return: The average of the energy deficit and any penalty.
- 4.
- Set the available area: Define a variable ‘available_area’ and assign the value 3872.12.
- 5.
- Define search space boundaries: Defines lower bounds (lb) and upper bounds (ub), both containing [0, available_area]. These set minimum and maximum values for solar and wind areas.
- 6.
- Configure PSO options: Set parameters (c1, c2, w) for the Particle Swarm Optimization algorithm.
- 7.
- Set bounds: Creates a tuple bounds containing the lower and upper bounds of the search space.
- 8.
- Create optimizer: Initialize a GlobalBestPSO optimizer from pyswarms with settings for the number of particles, dimensions, PSO options, and search space bounds.
- 9.
- Run Optimization: Execute the optimization process using the objective function and running for 1000 iterations. Returns the best cost (minimum total deficit) and the corresponding position (optimal solar and wind areas).
- 10.
- Print results: Display the optimal cost (lowest energy deficit), and optimal solution (best solar and wind areas).
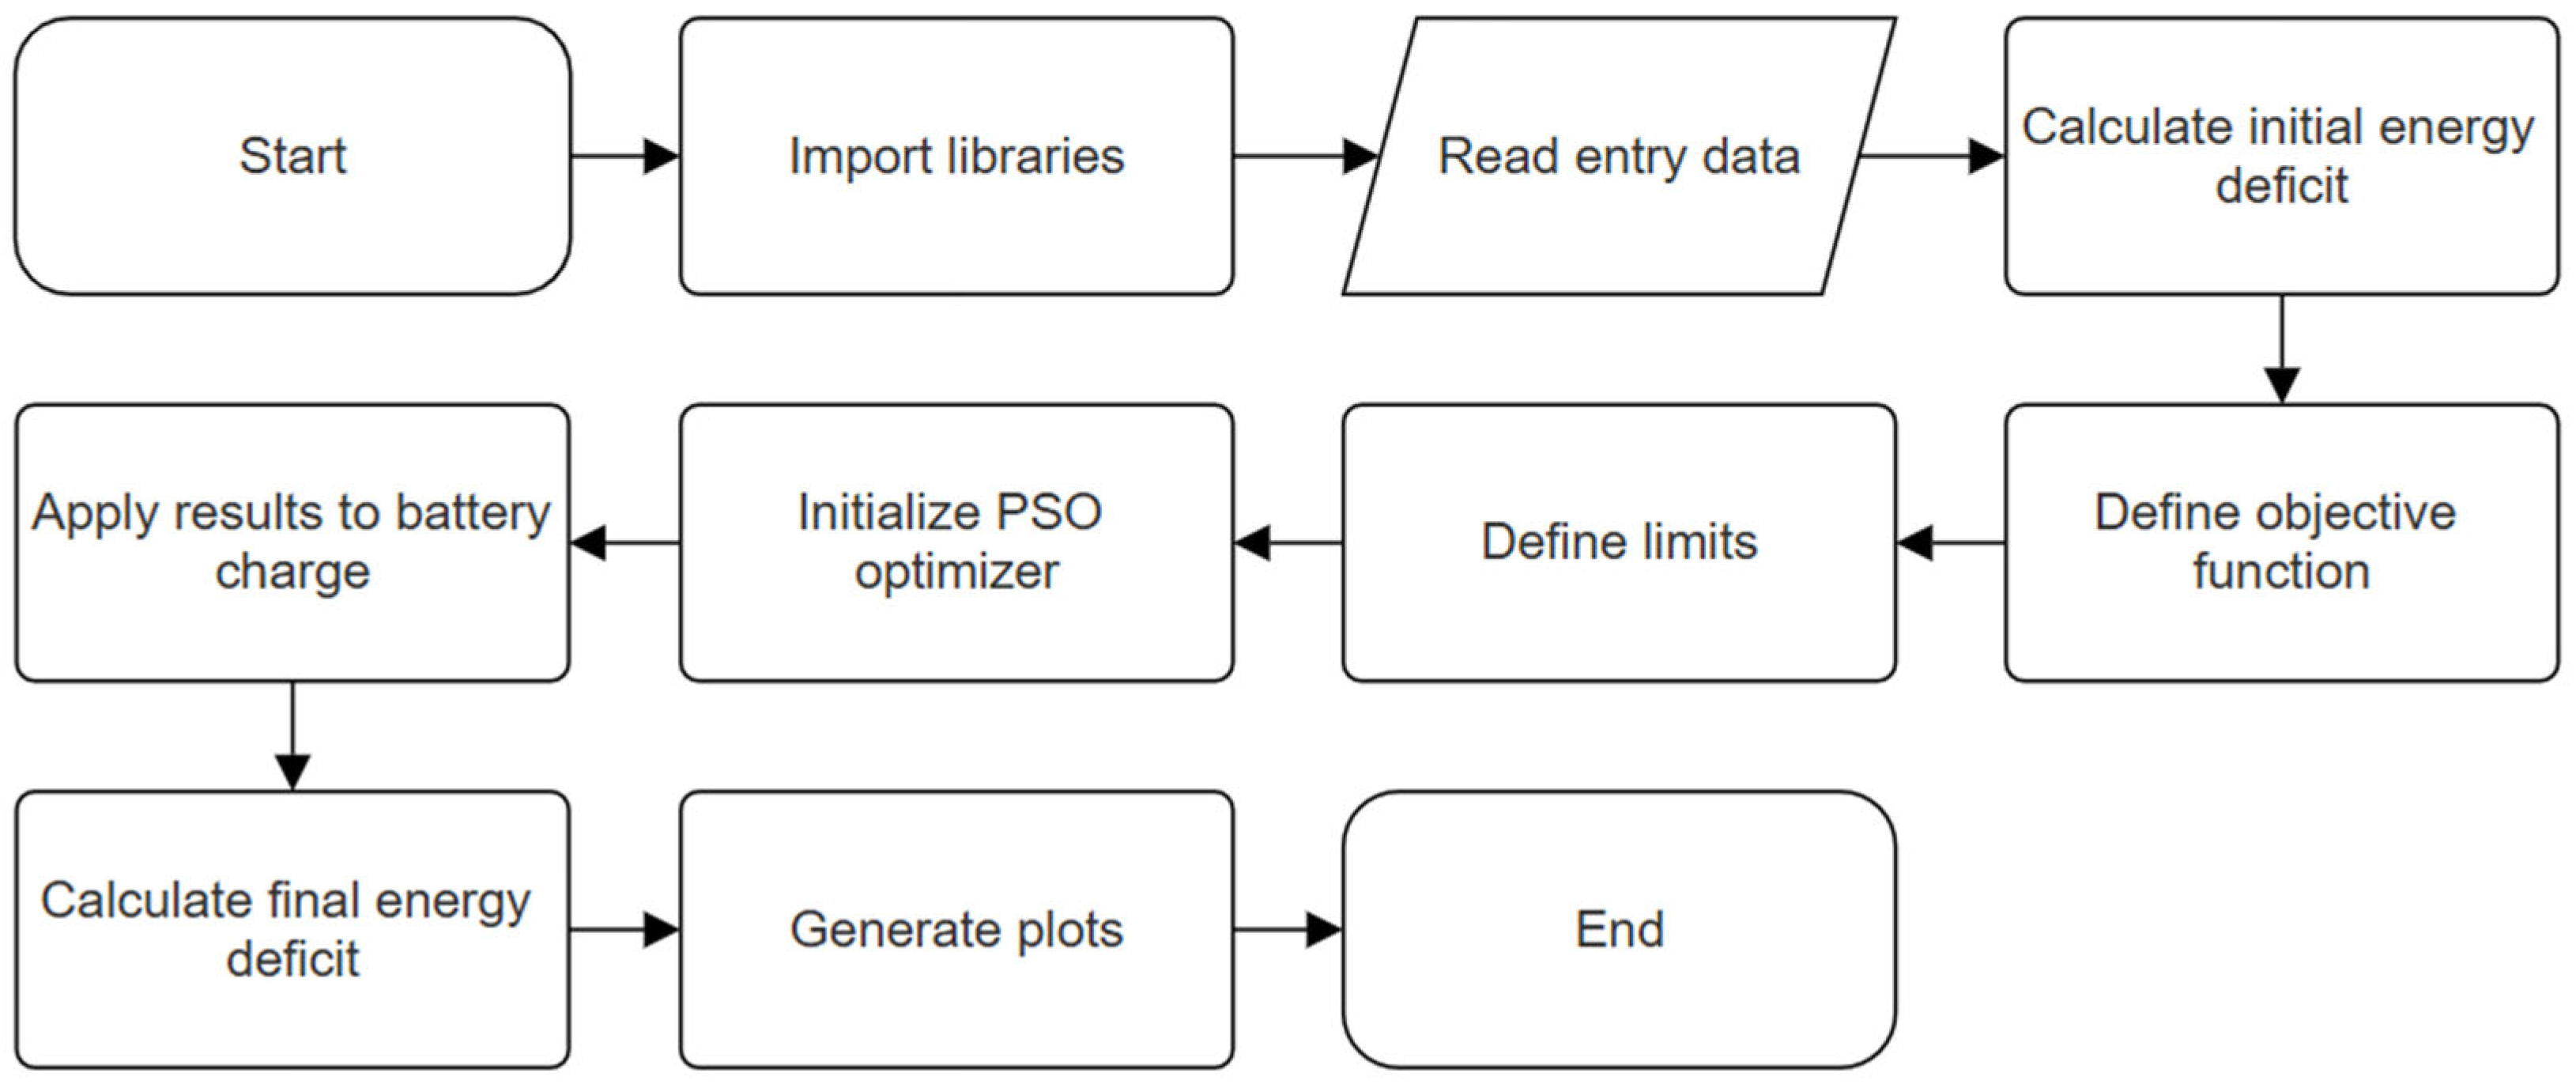
- Import Libraries
- pandas: Data manipulation and analysis.
- numpy: Mathematical operations.
- pyswarms: Implements Particle Swarm Optimization.
- matplotlib.pyplot: Plotting and visualization.
- datetime: Working with dates and times.
- Load Data
- Read ‘Datos_de_entrada.csv’ into a pandas DataFrame named energy_data.
- Data Preprocessing
- Convert the ‘date’ column to datetime format.
- Calculate the initial energy deficit (consumption—solar energy—wind energy).
- Define Objective Function (f)
- Input: An array representing battery discharge levels for each timestep.
- Calculate: The final energy deficit by subtracting battery discharge from the initial energy deficit.
- Return: The sum of the absolute values of the final energy deficit across all time intervals.
- Configure PSO
- Set up a GlobalBestPSO optimizer with 100 particles, searching an 8760-dimensional space (representing hourly battery usage in a year). Specify PSO parameters (c1, c2, w).
- Optimize Battery Usage
- optimizer.optimize(f, iters = 1000): Run the PSO algorithm to find the optimal battery discharge patterns to minimize energy deficit.
- Store the best cost (representing minimized deficit) and best position (optimal battery discharge values).
- Analyze Results
- Print the final cost (optimized energy deficit).
- Add new columns to energy_data:
- ○
- ‘battery_discharge’: Optimized battery discharge levels.
- ○
- ‘final_energy_deficit’: Updated deficit after considering battery.
- Save the enhanced DataFrame to ‘optimized_energy_data_10.csv’.
- Focus on Saturdays
- Filter energy_data to include only Saturdays.
- Calculate the total energy deficit on Saturdays.
- Print the result.
- Focus on Sundays
- Filter energy_data for Sundays.
- Calculate the sum of initial and final energy deficits for Sundays.
- Print the results.
- Focus on May
- Filter energy_data for the month of May.
- Filter further for May 6th to May 13th, and specifically for May 6th.
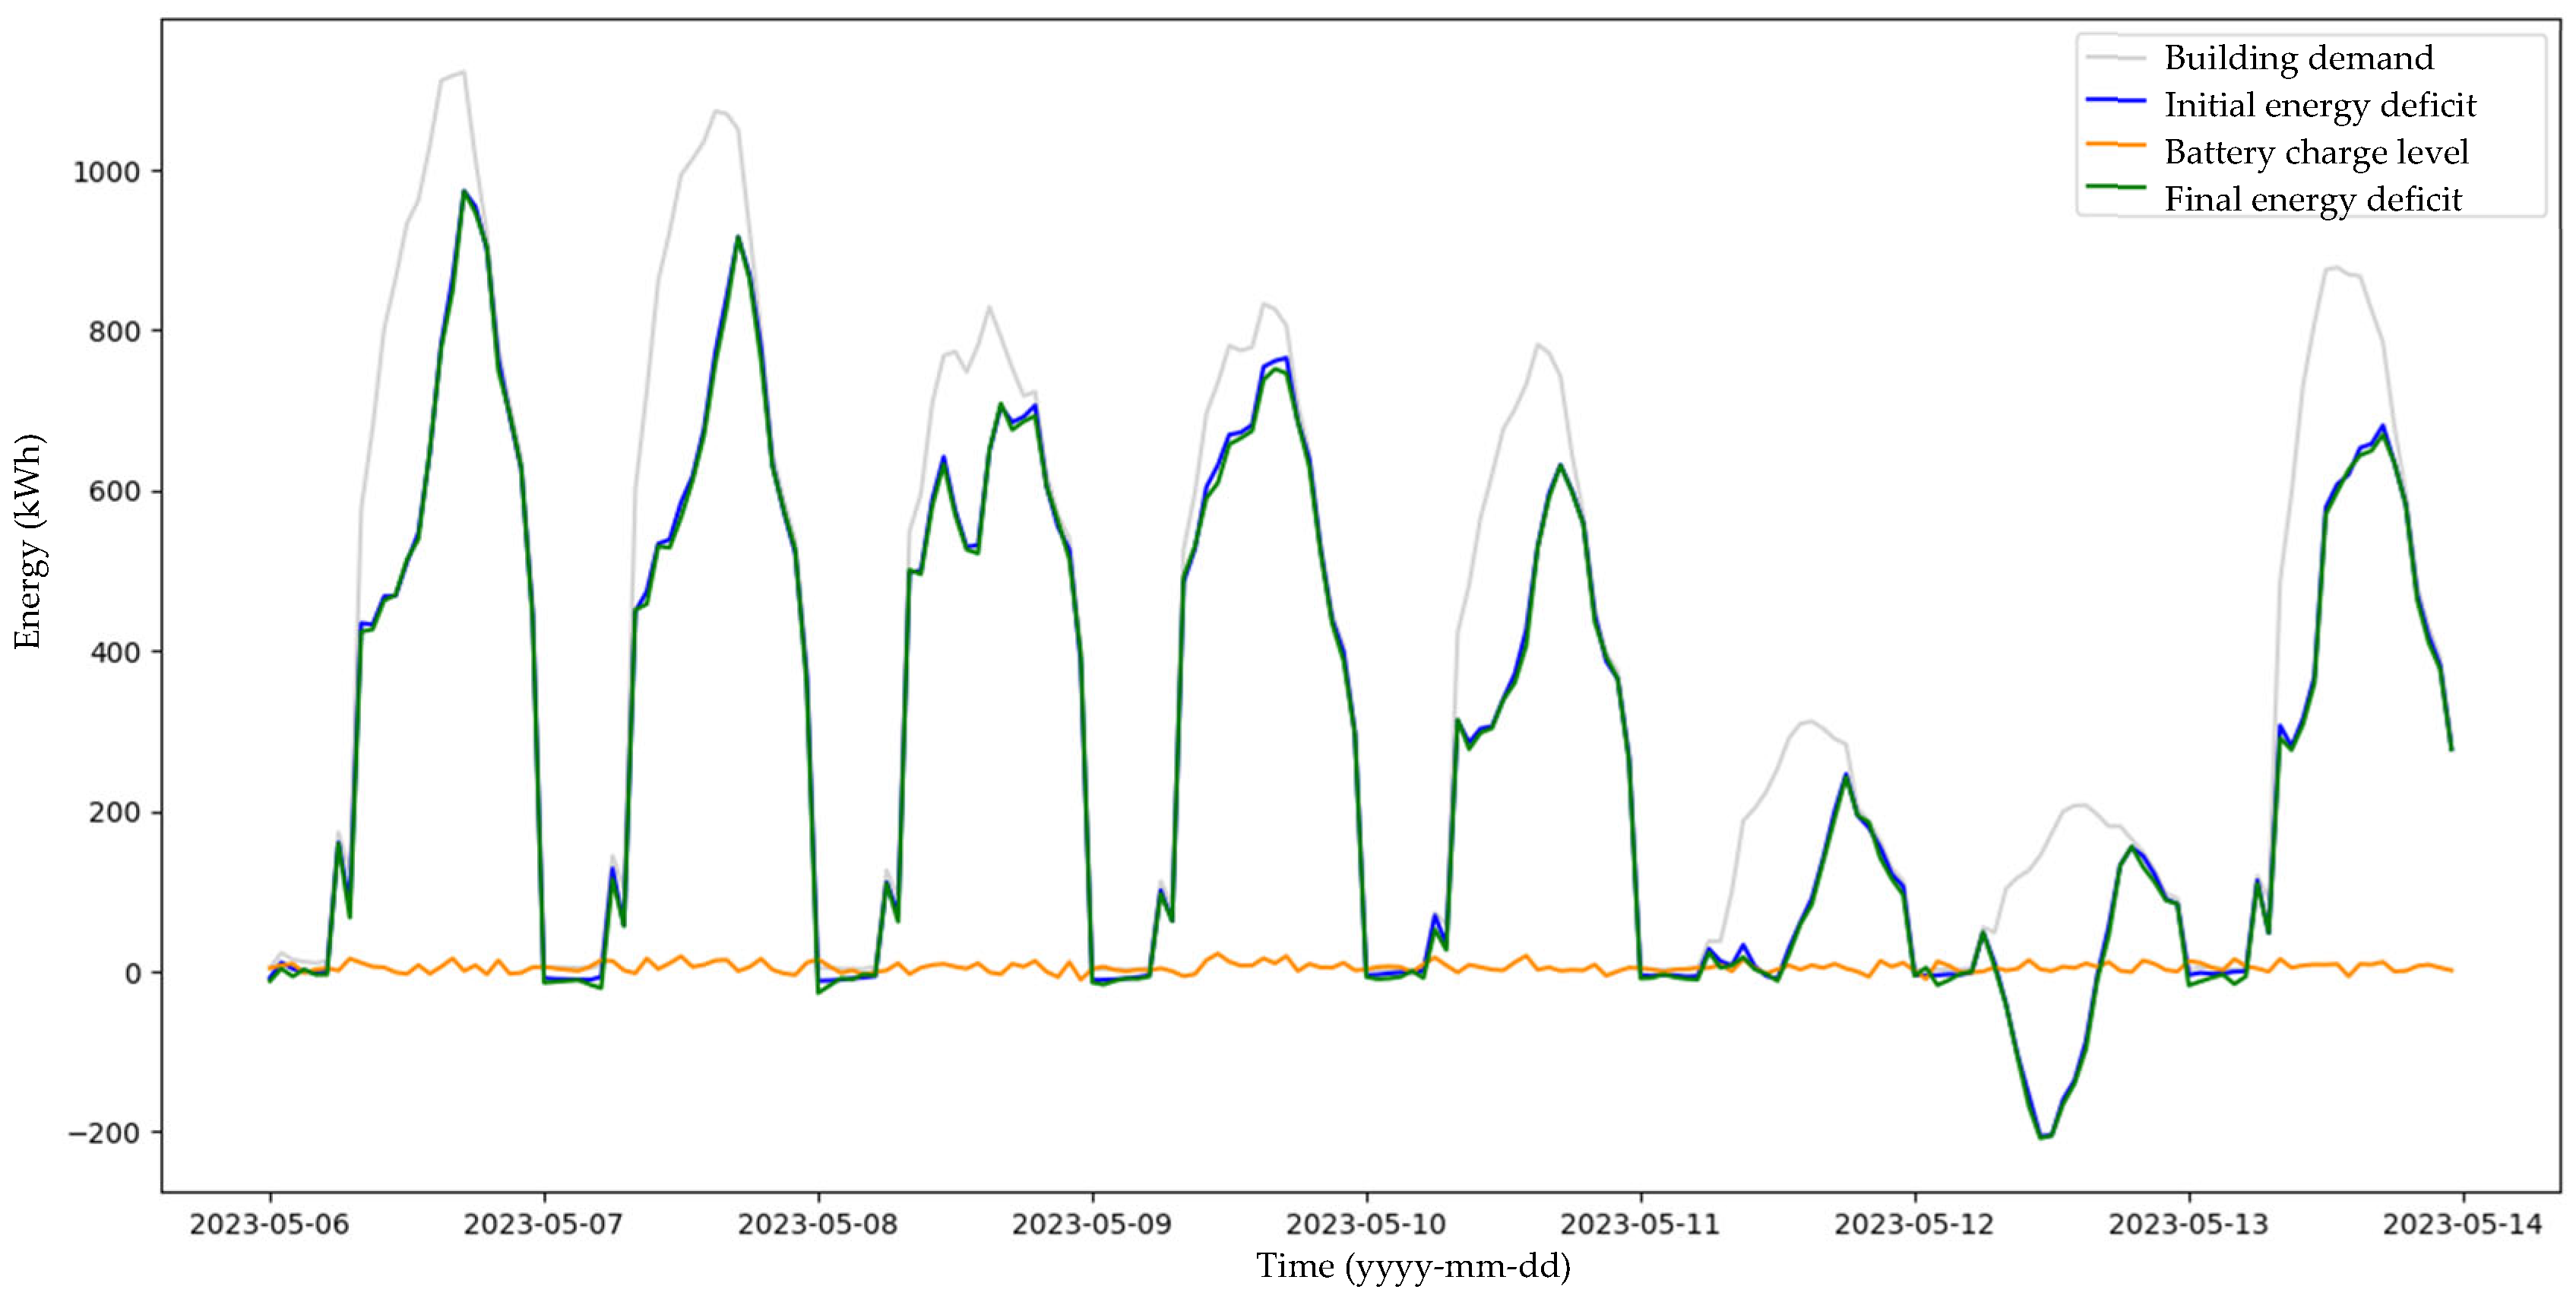
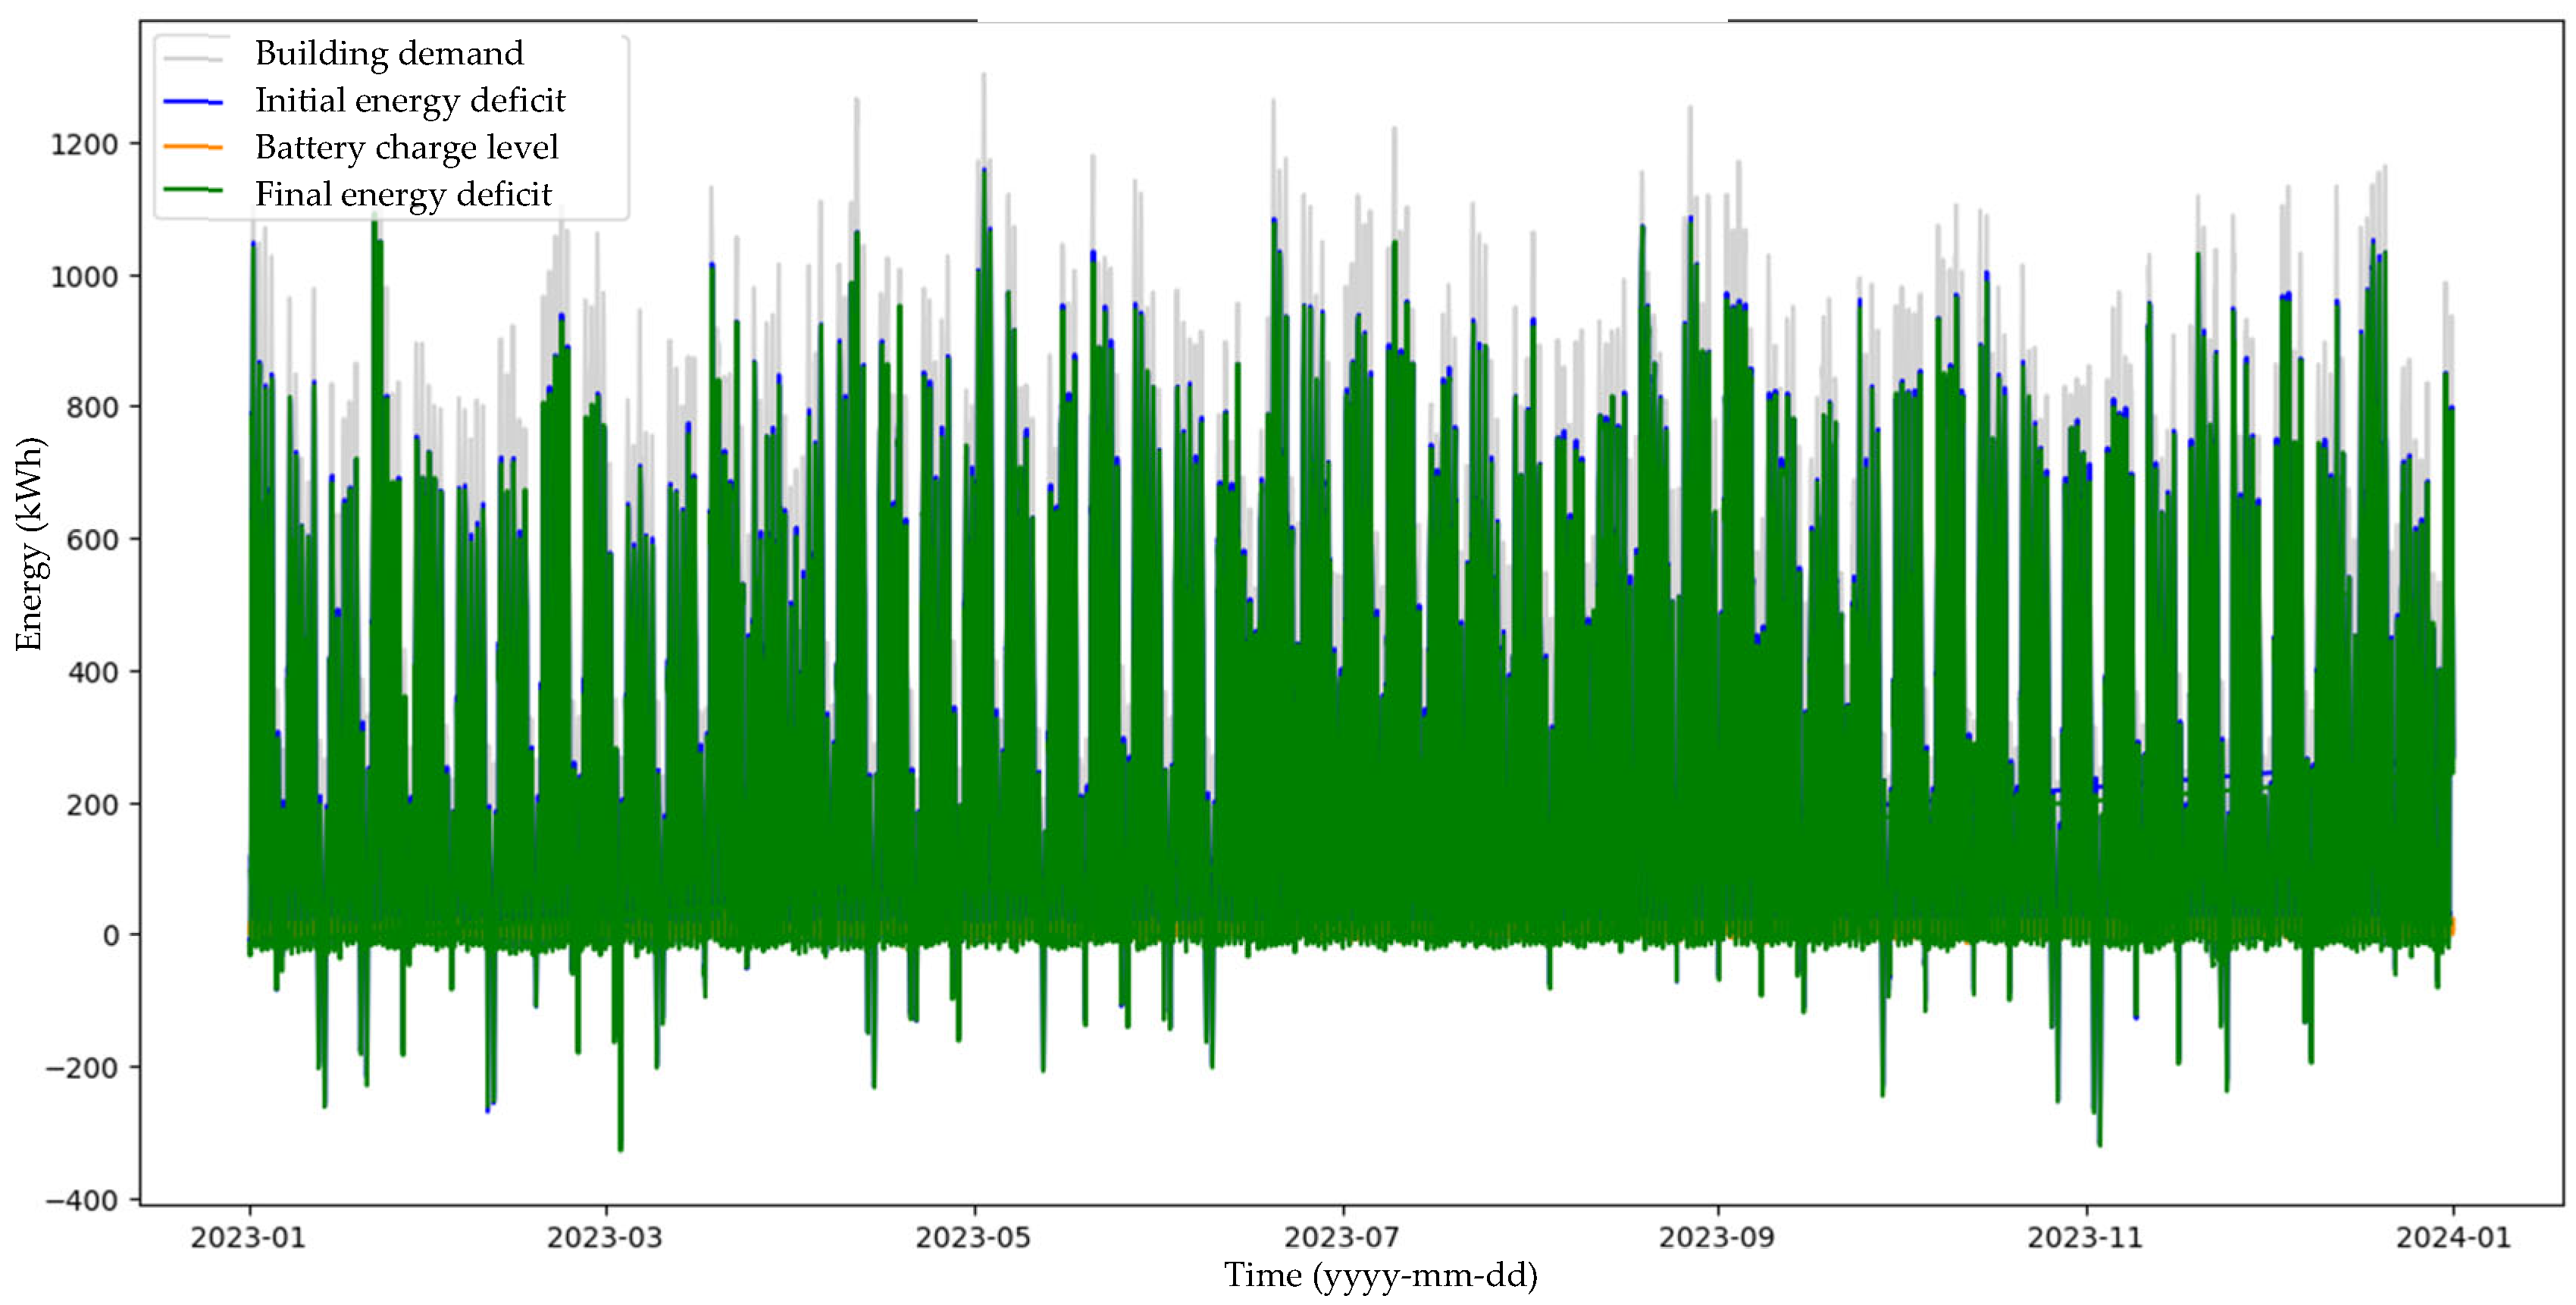
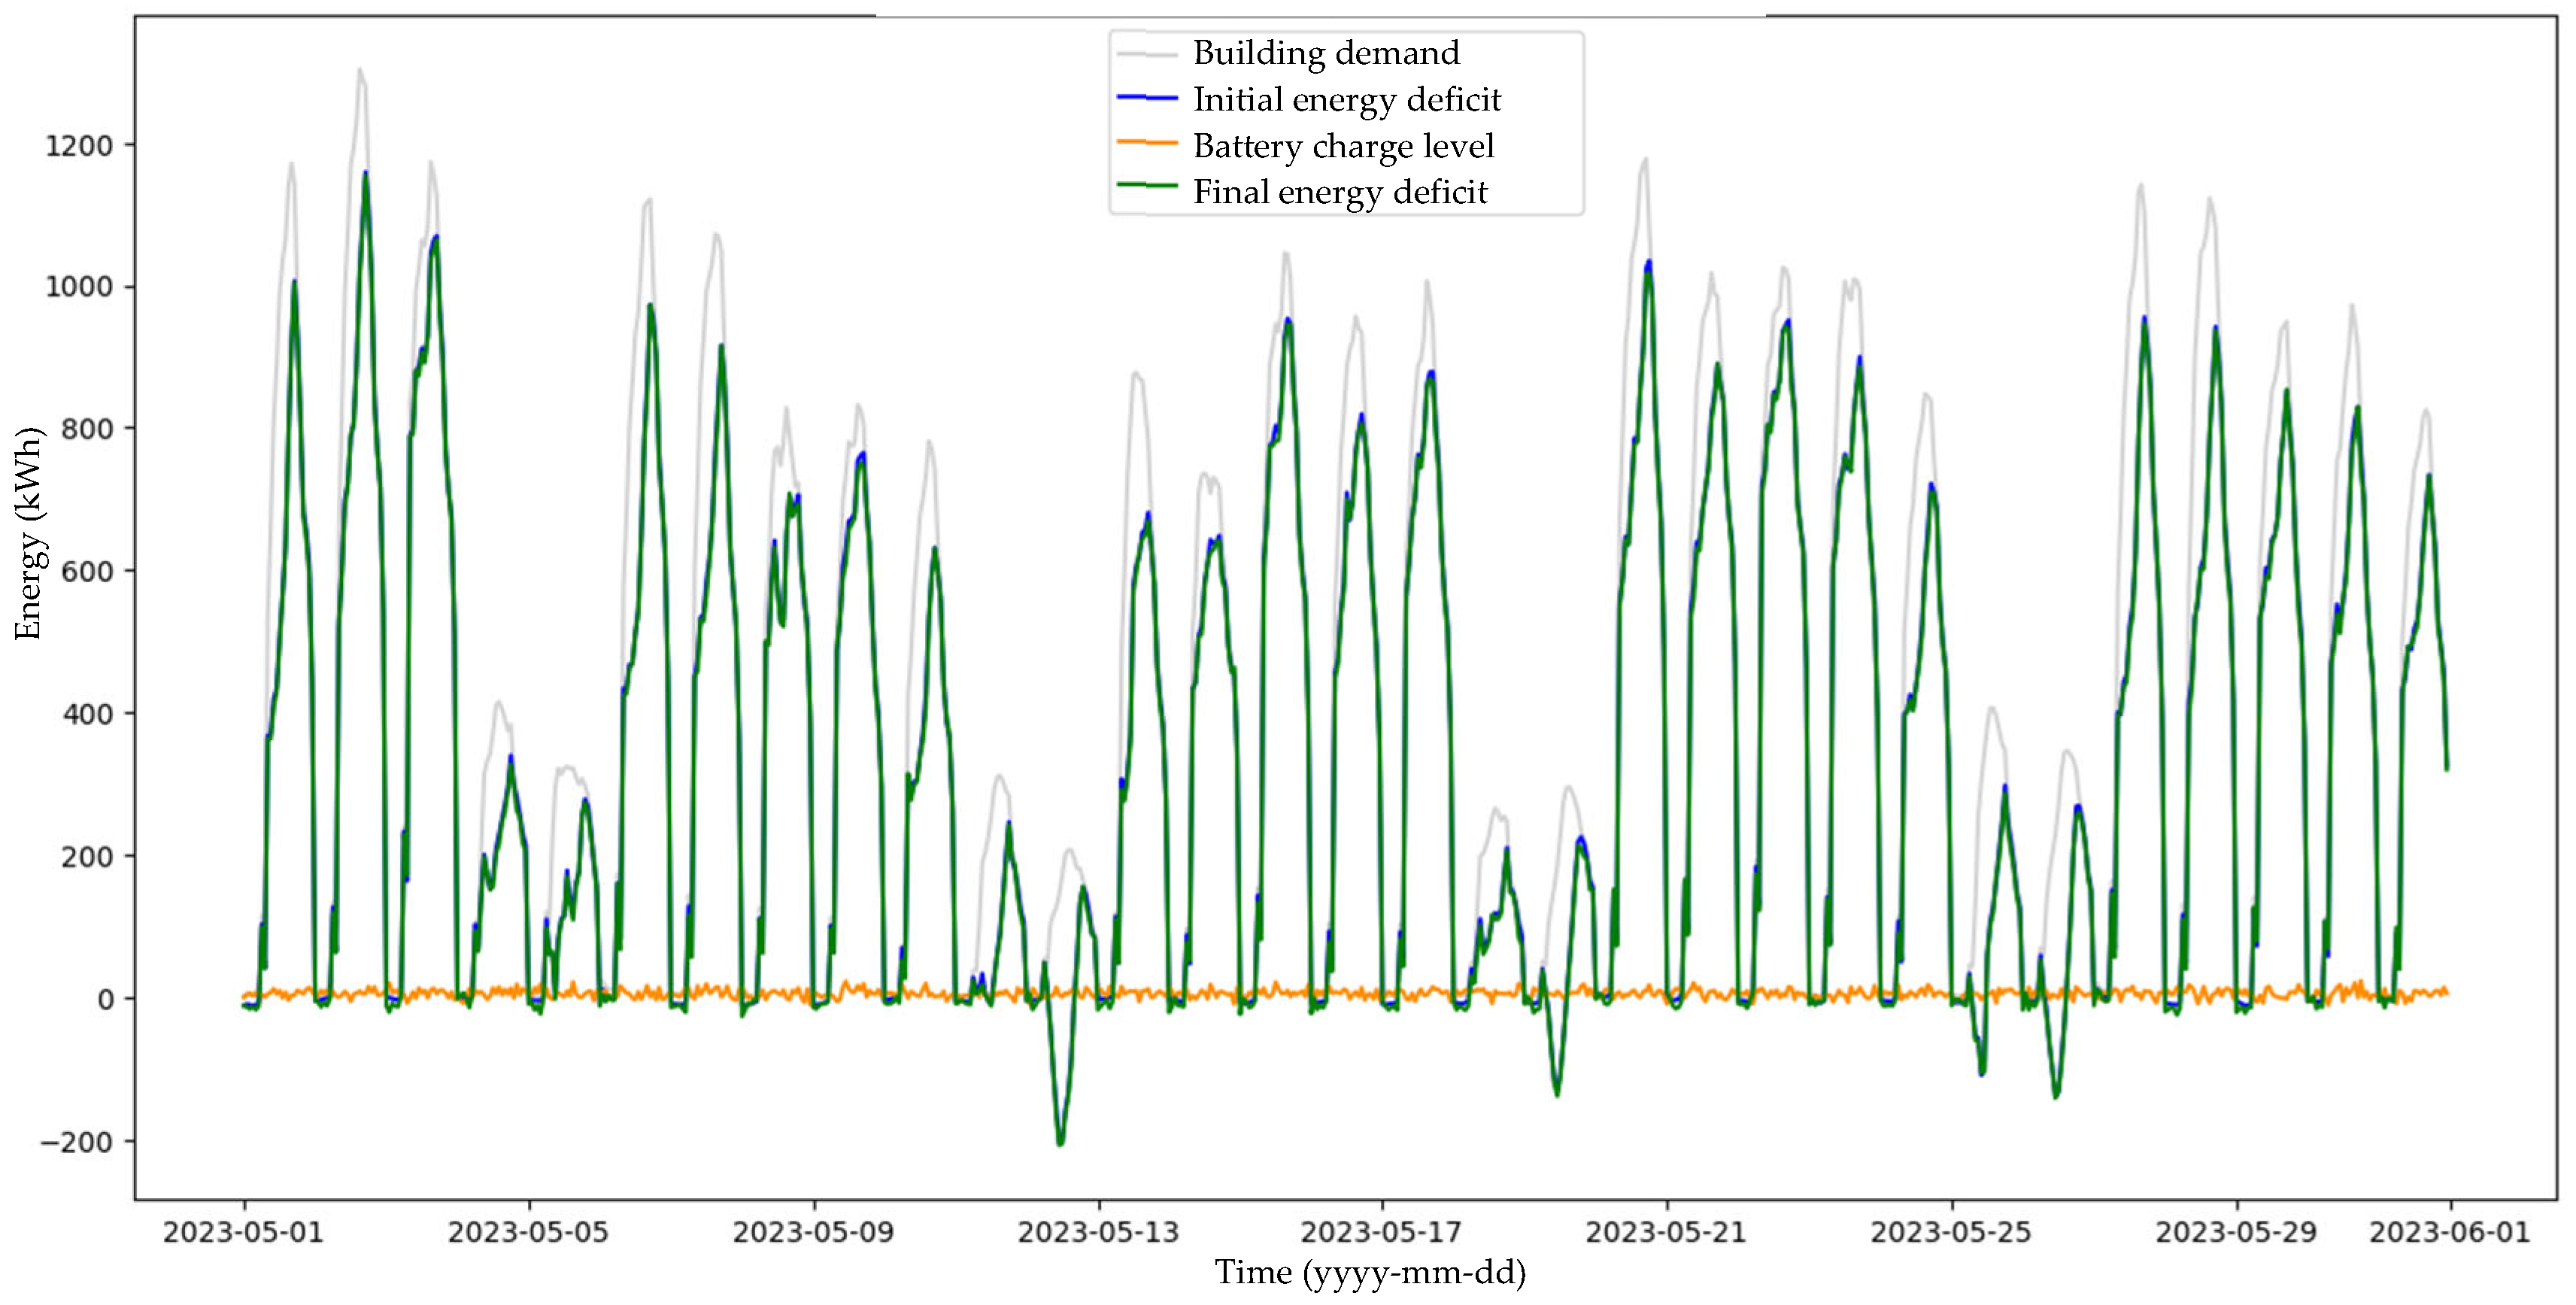
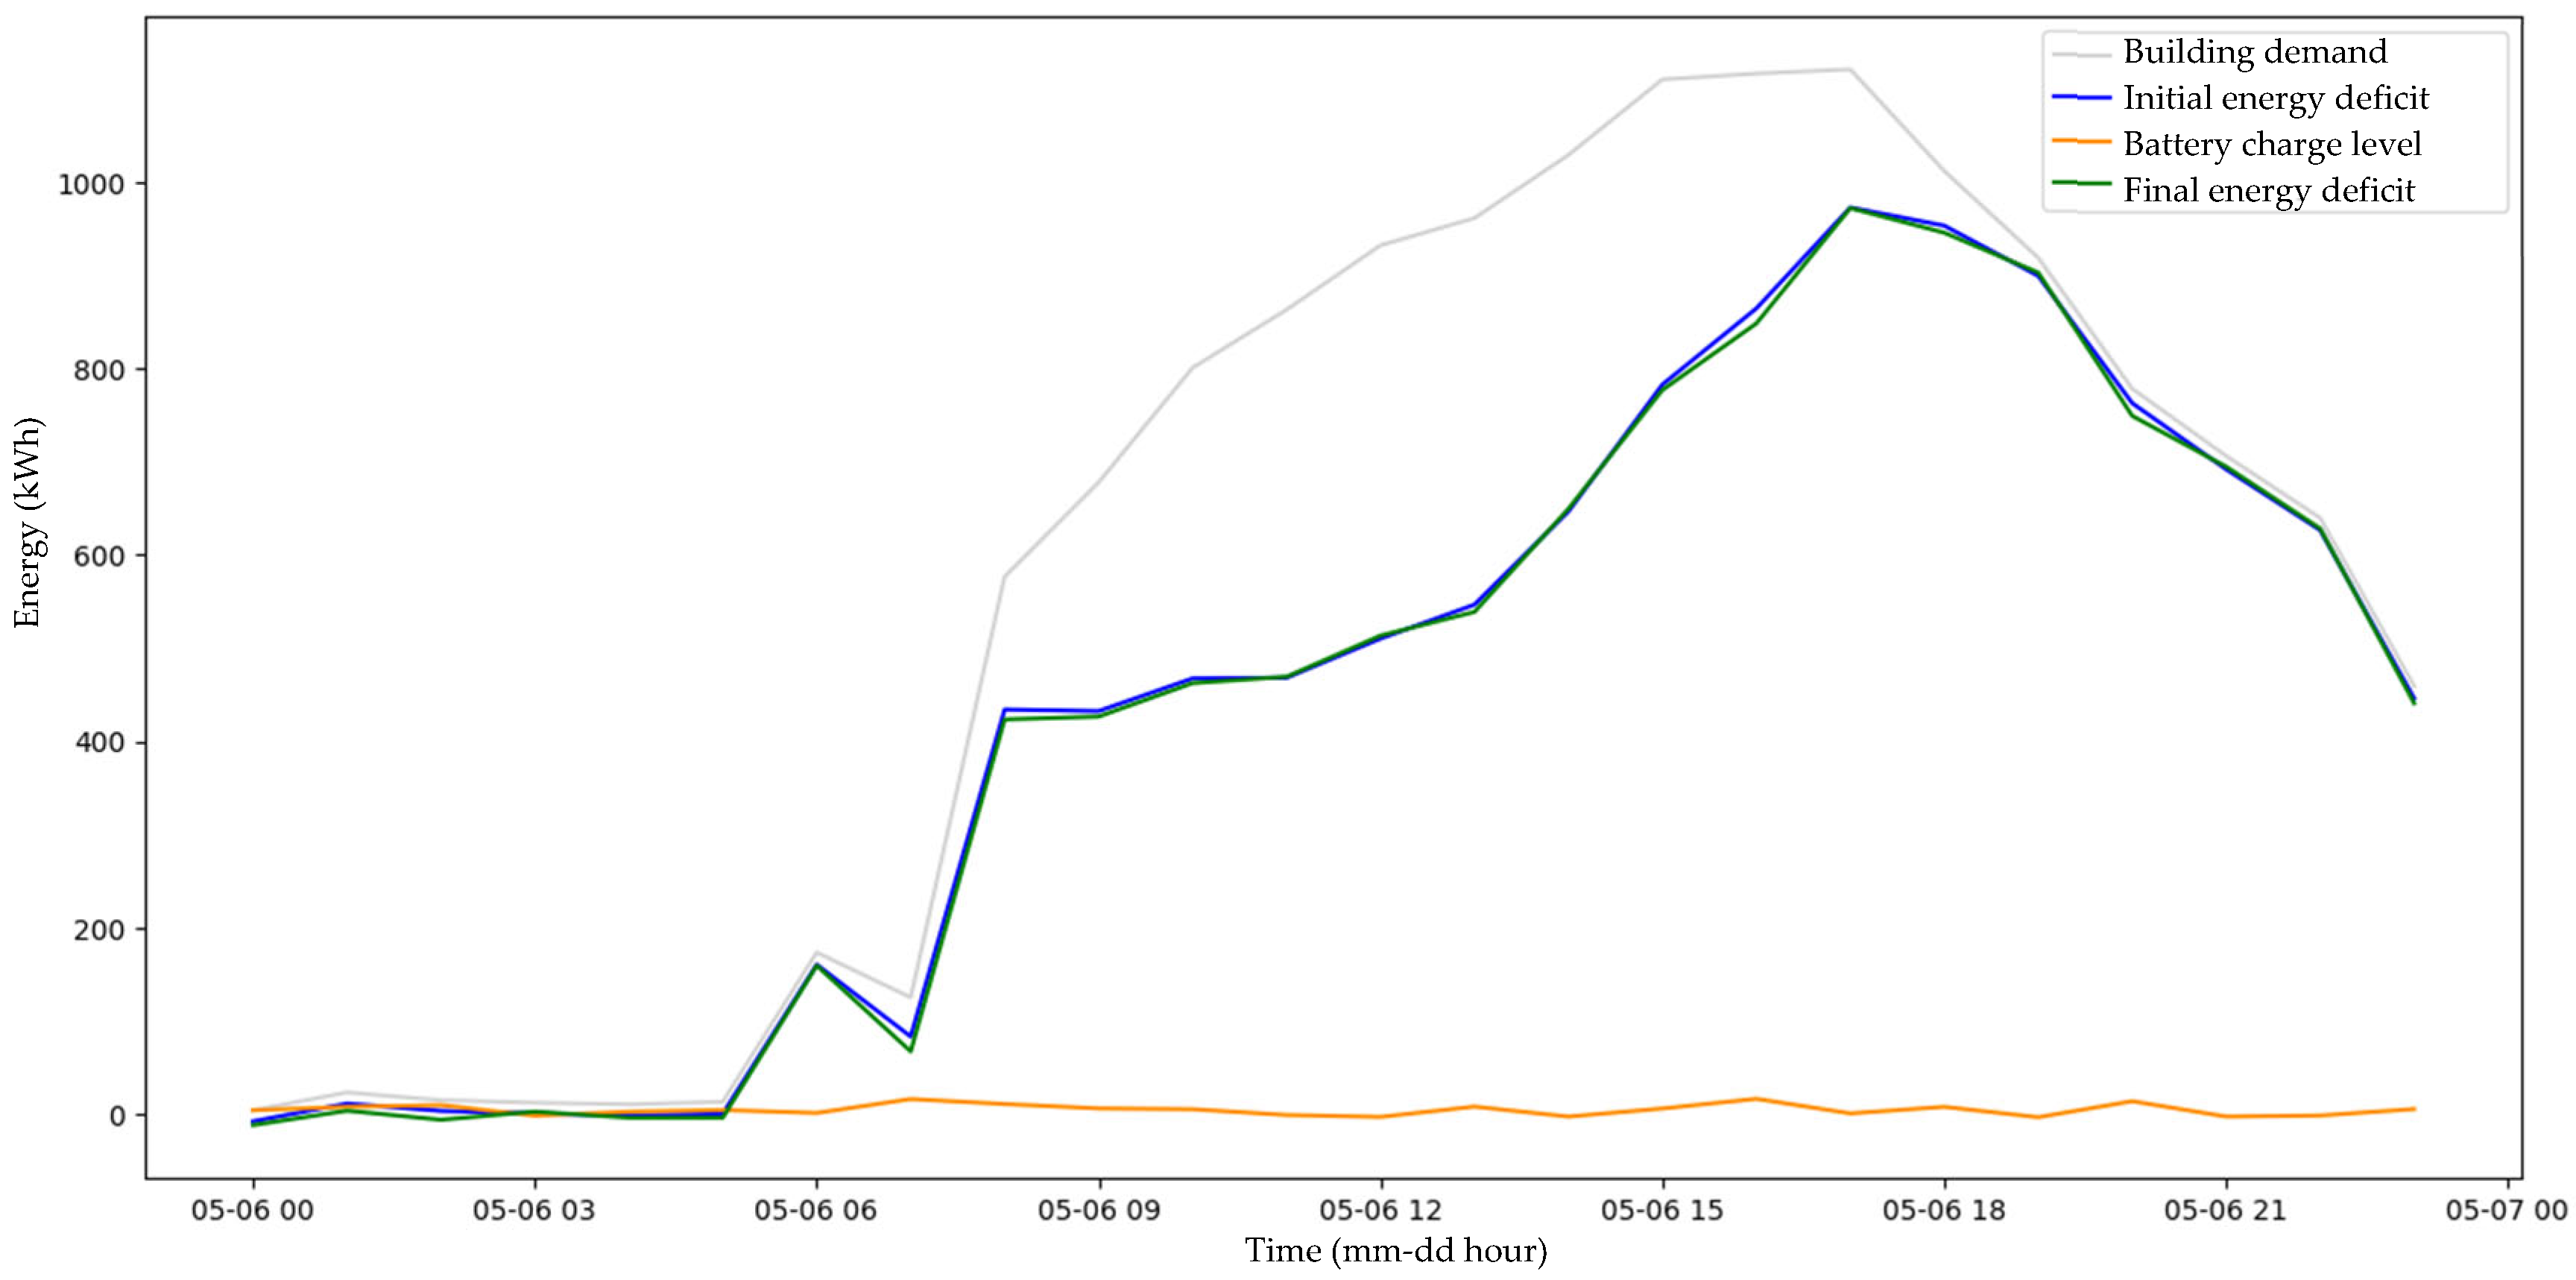
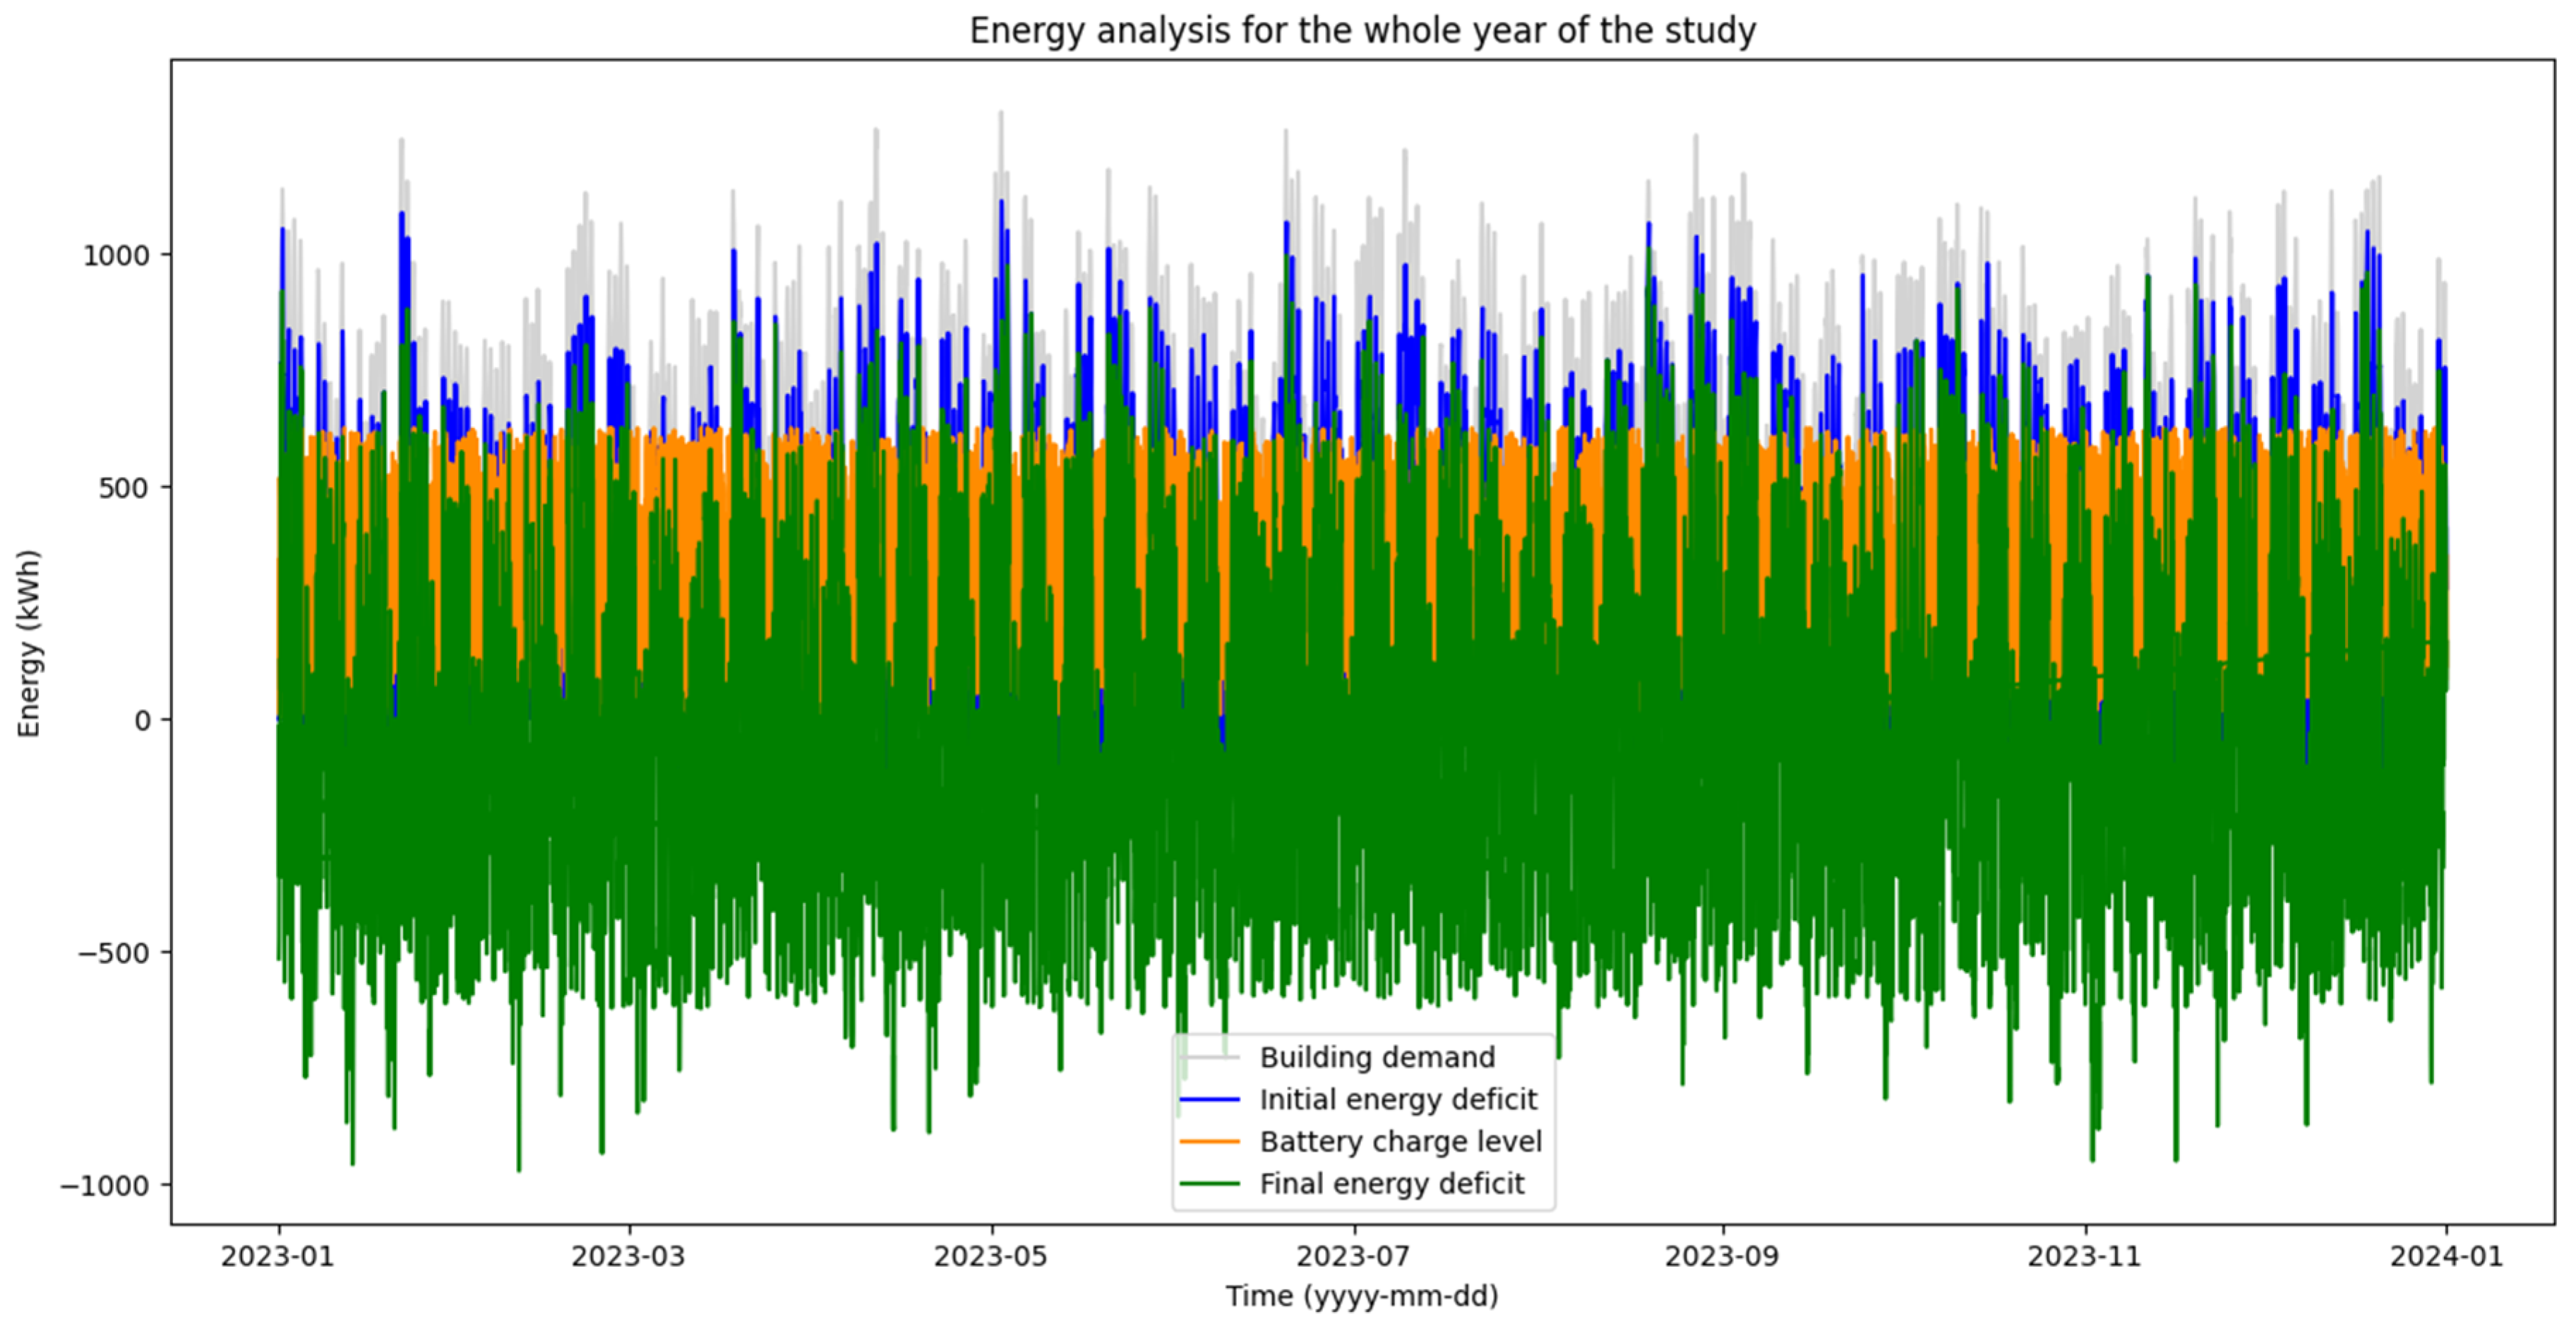
- Visualization
- Year-Round Plot: Plot energy consumption, initial deficit, battery discharge, and final deficit across all dates. Add a title and legend.
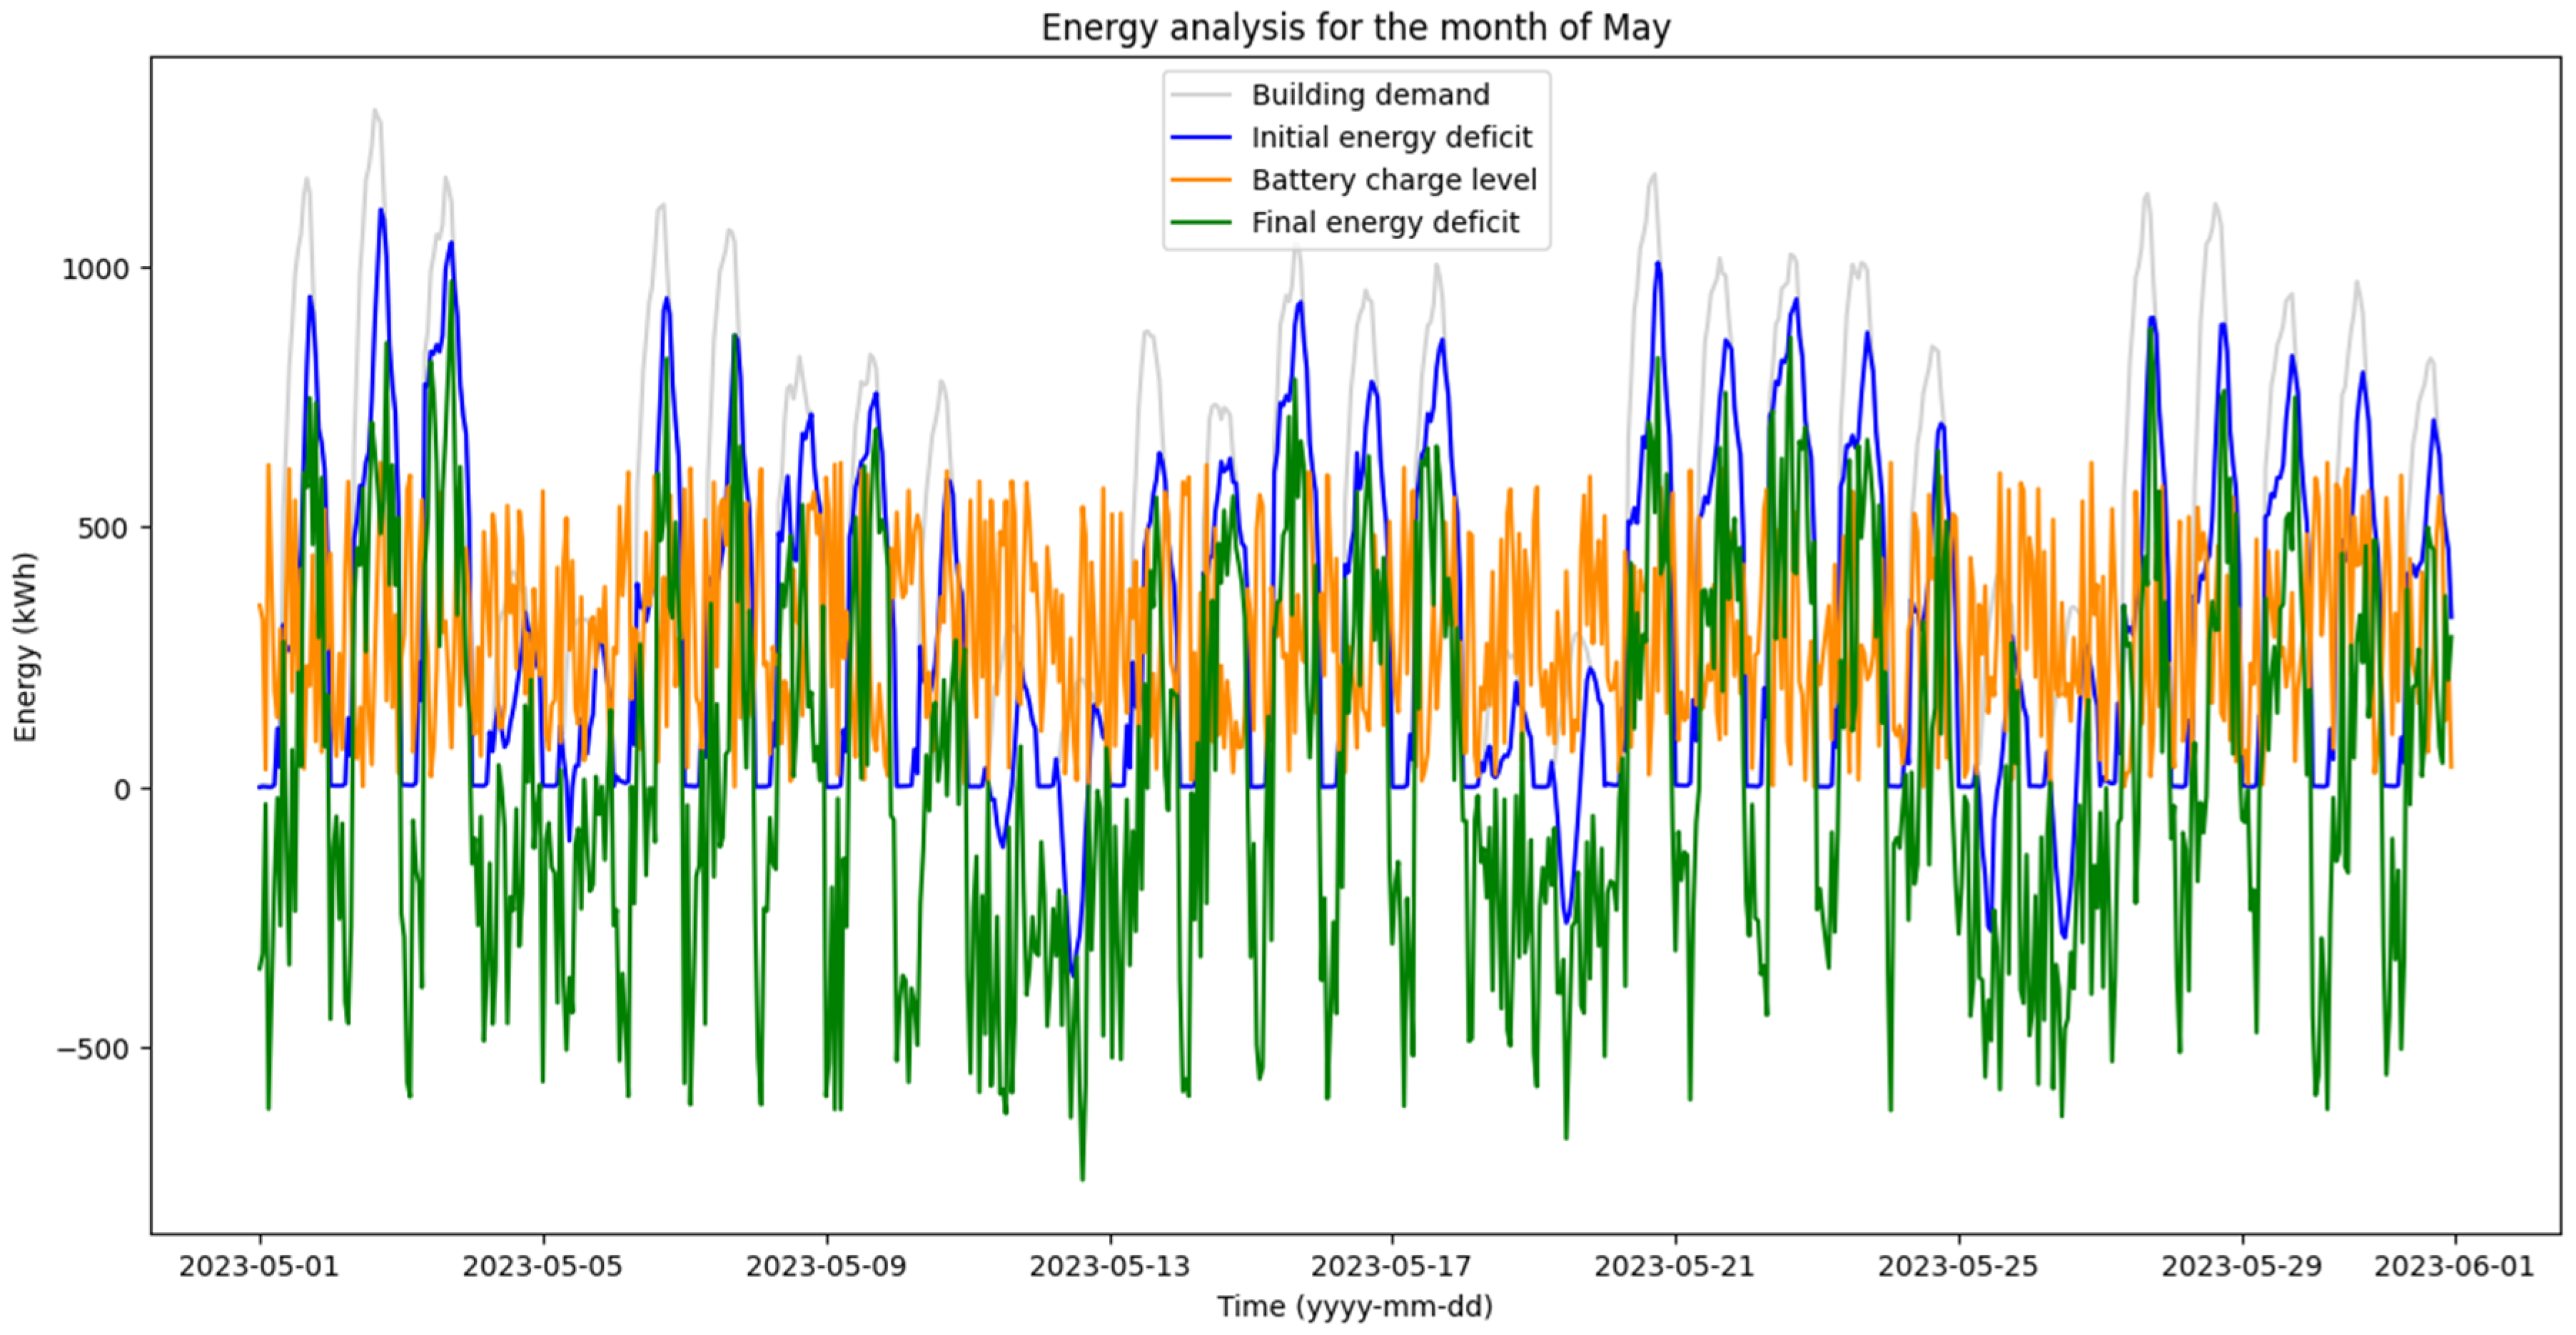
- May Plot: Repeat the plot, focusing on the month of May.
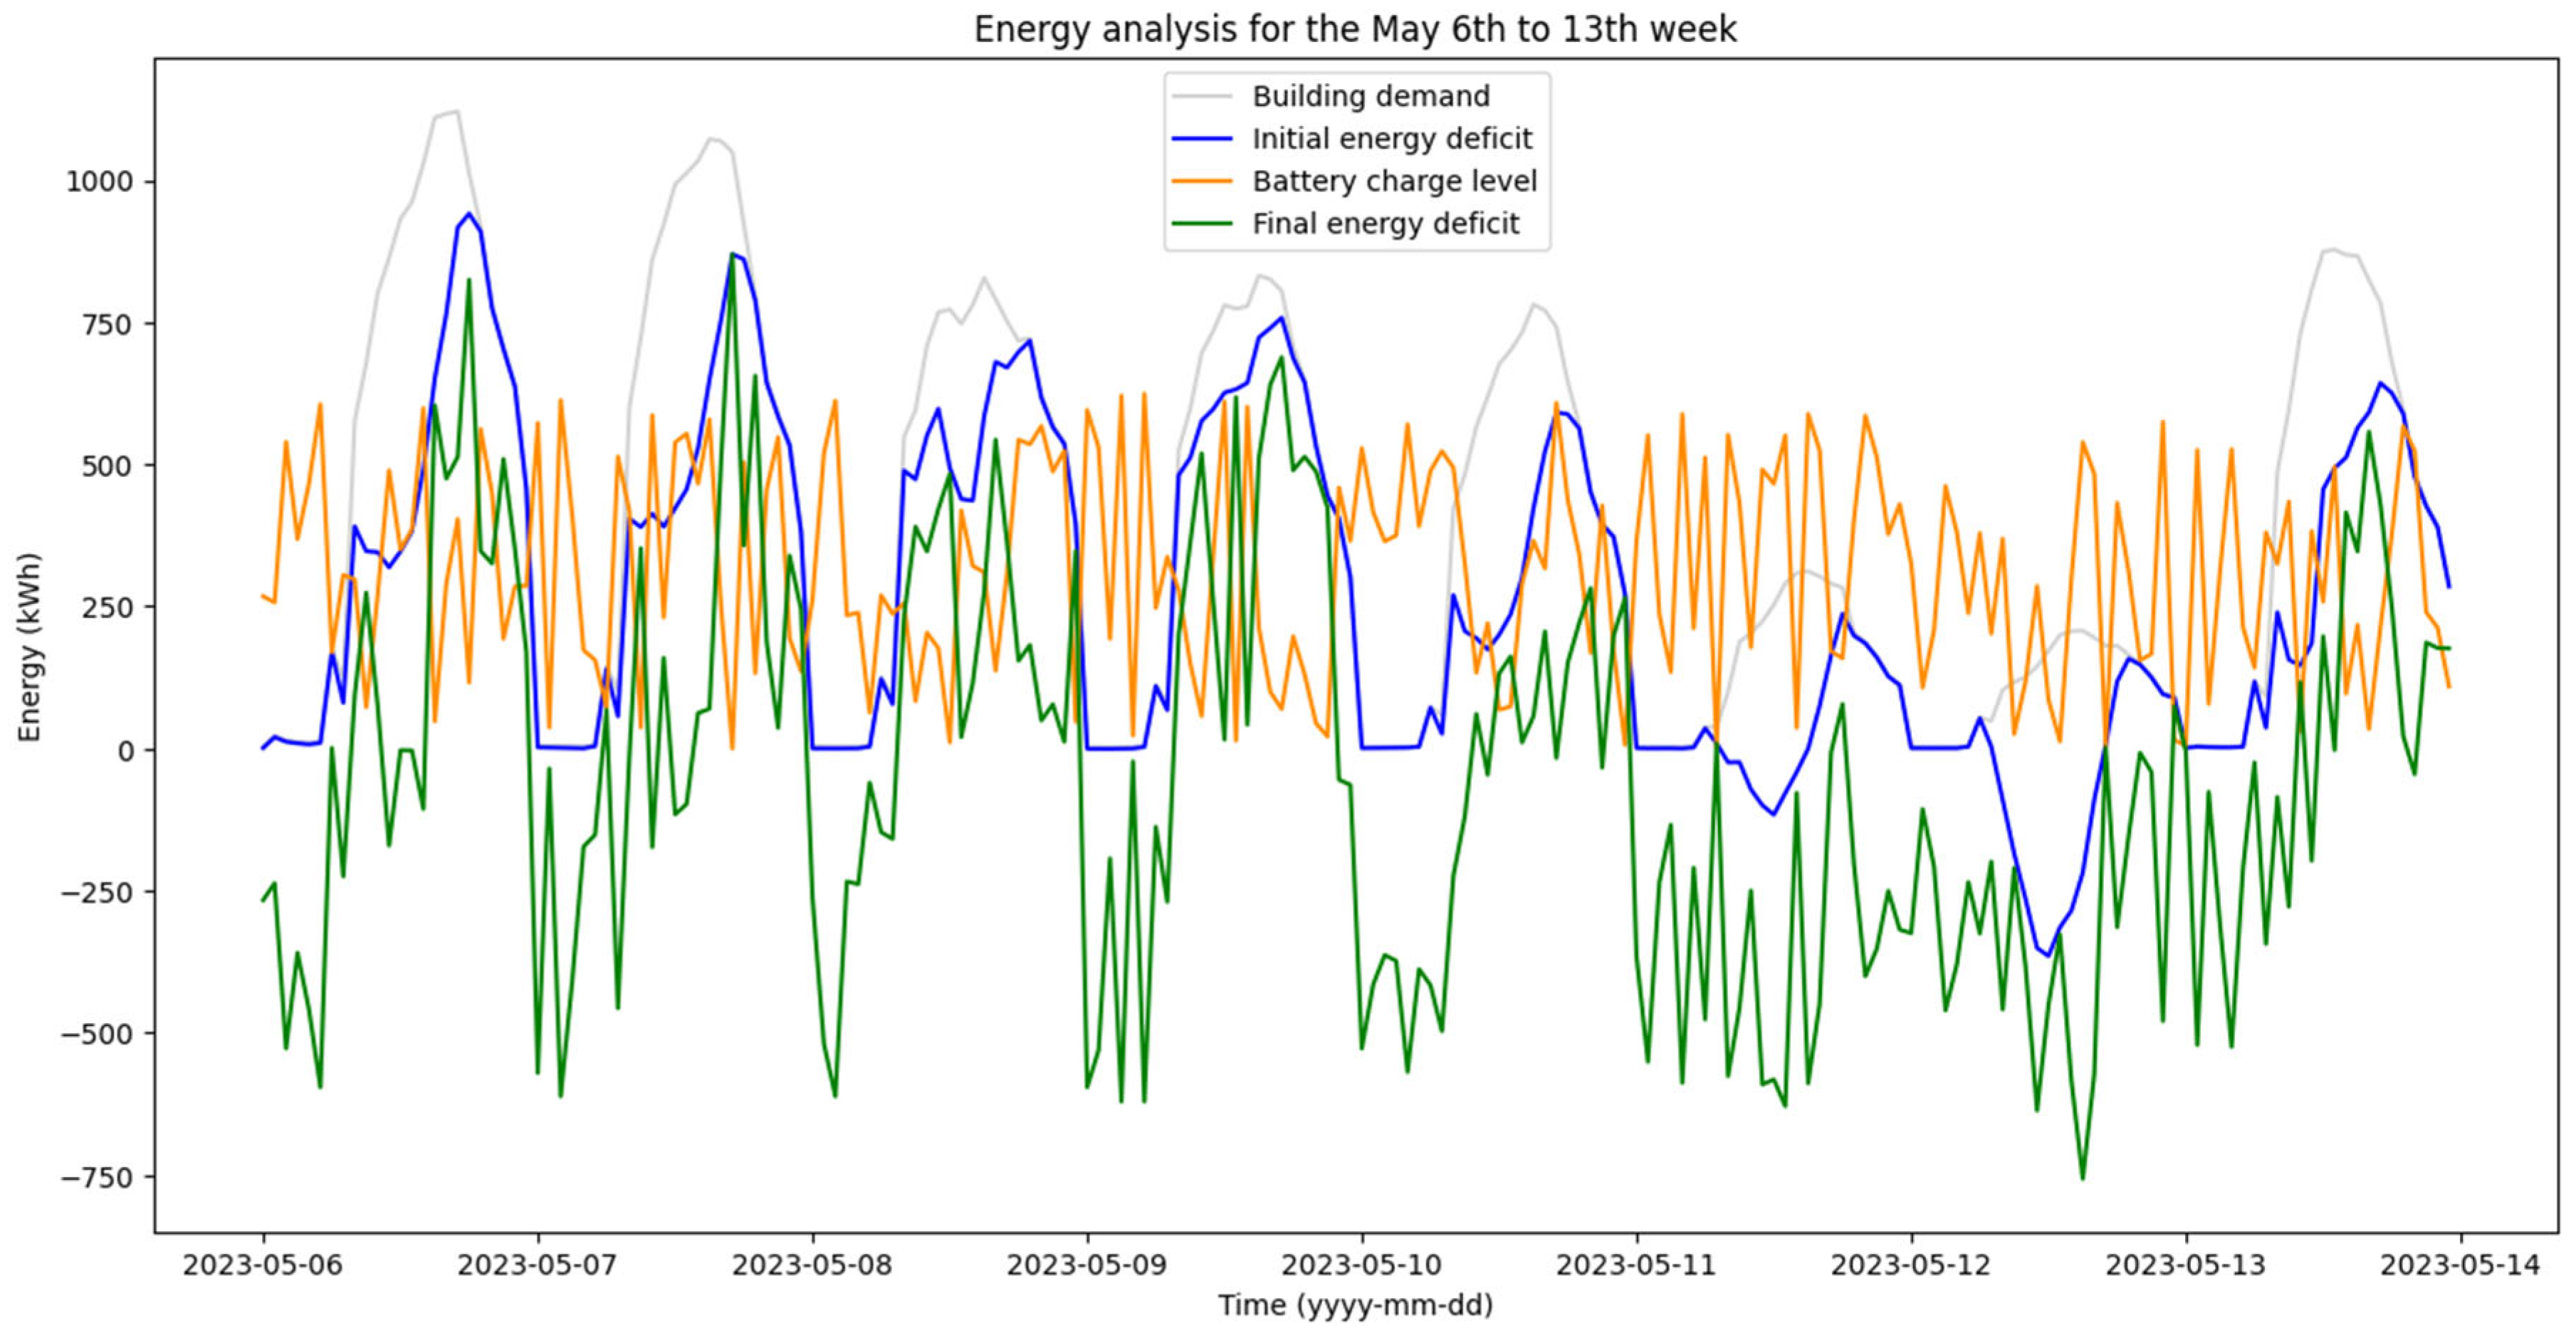
- May 6th–13th Plot: Repeat the plot, zooming in on May 6th to 13th.
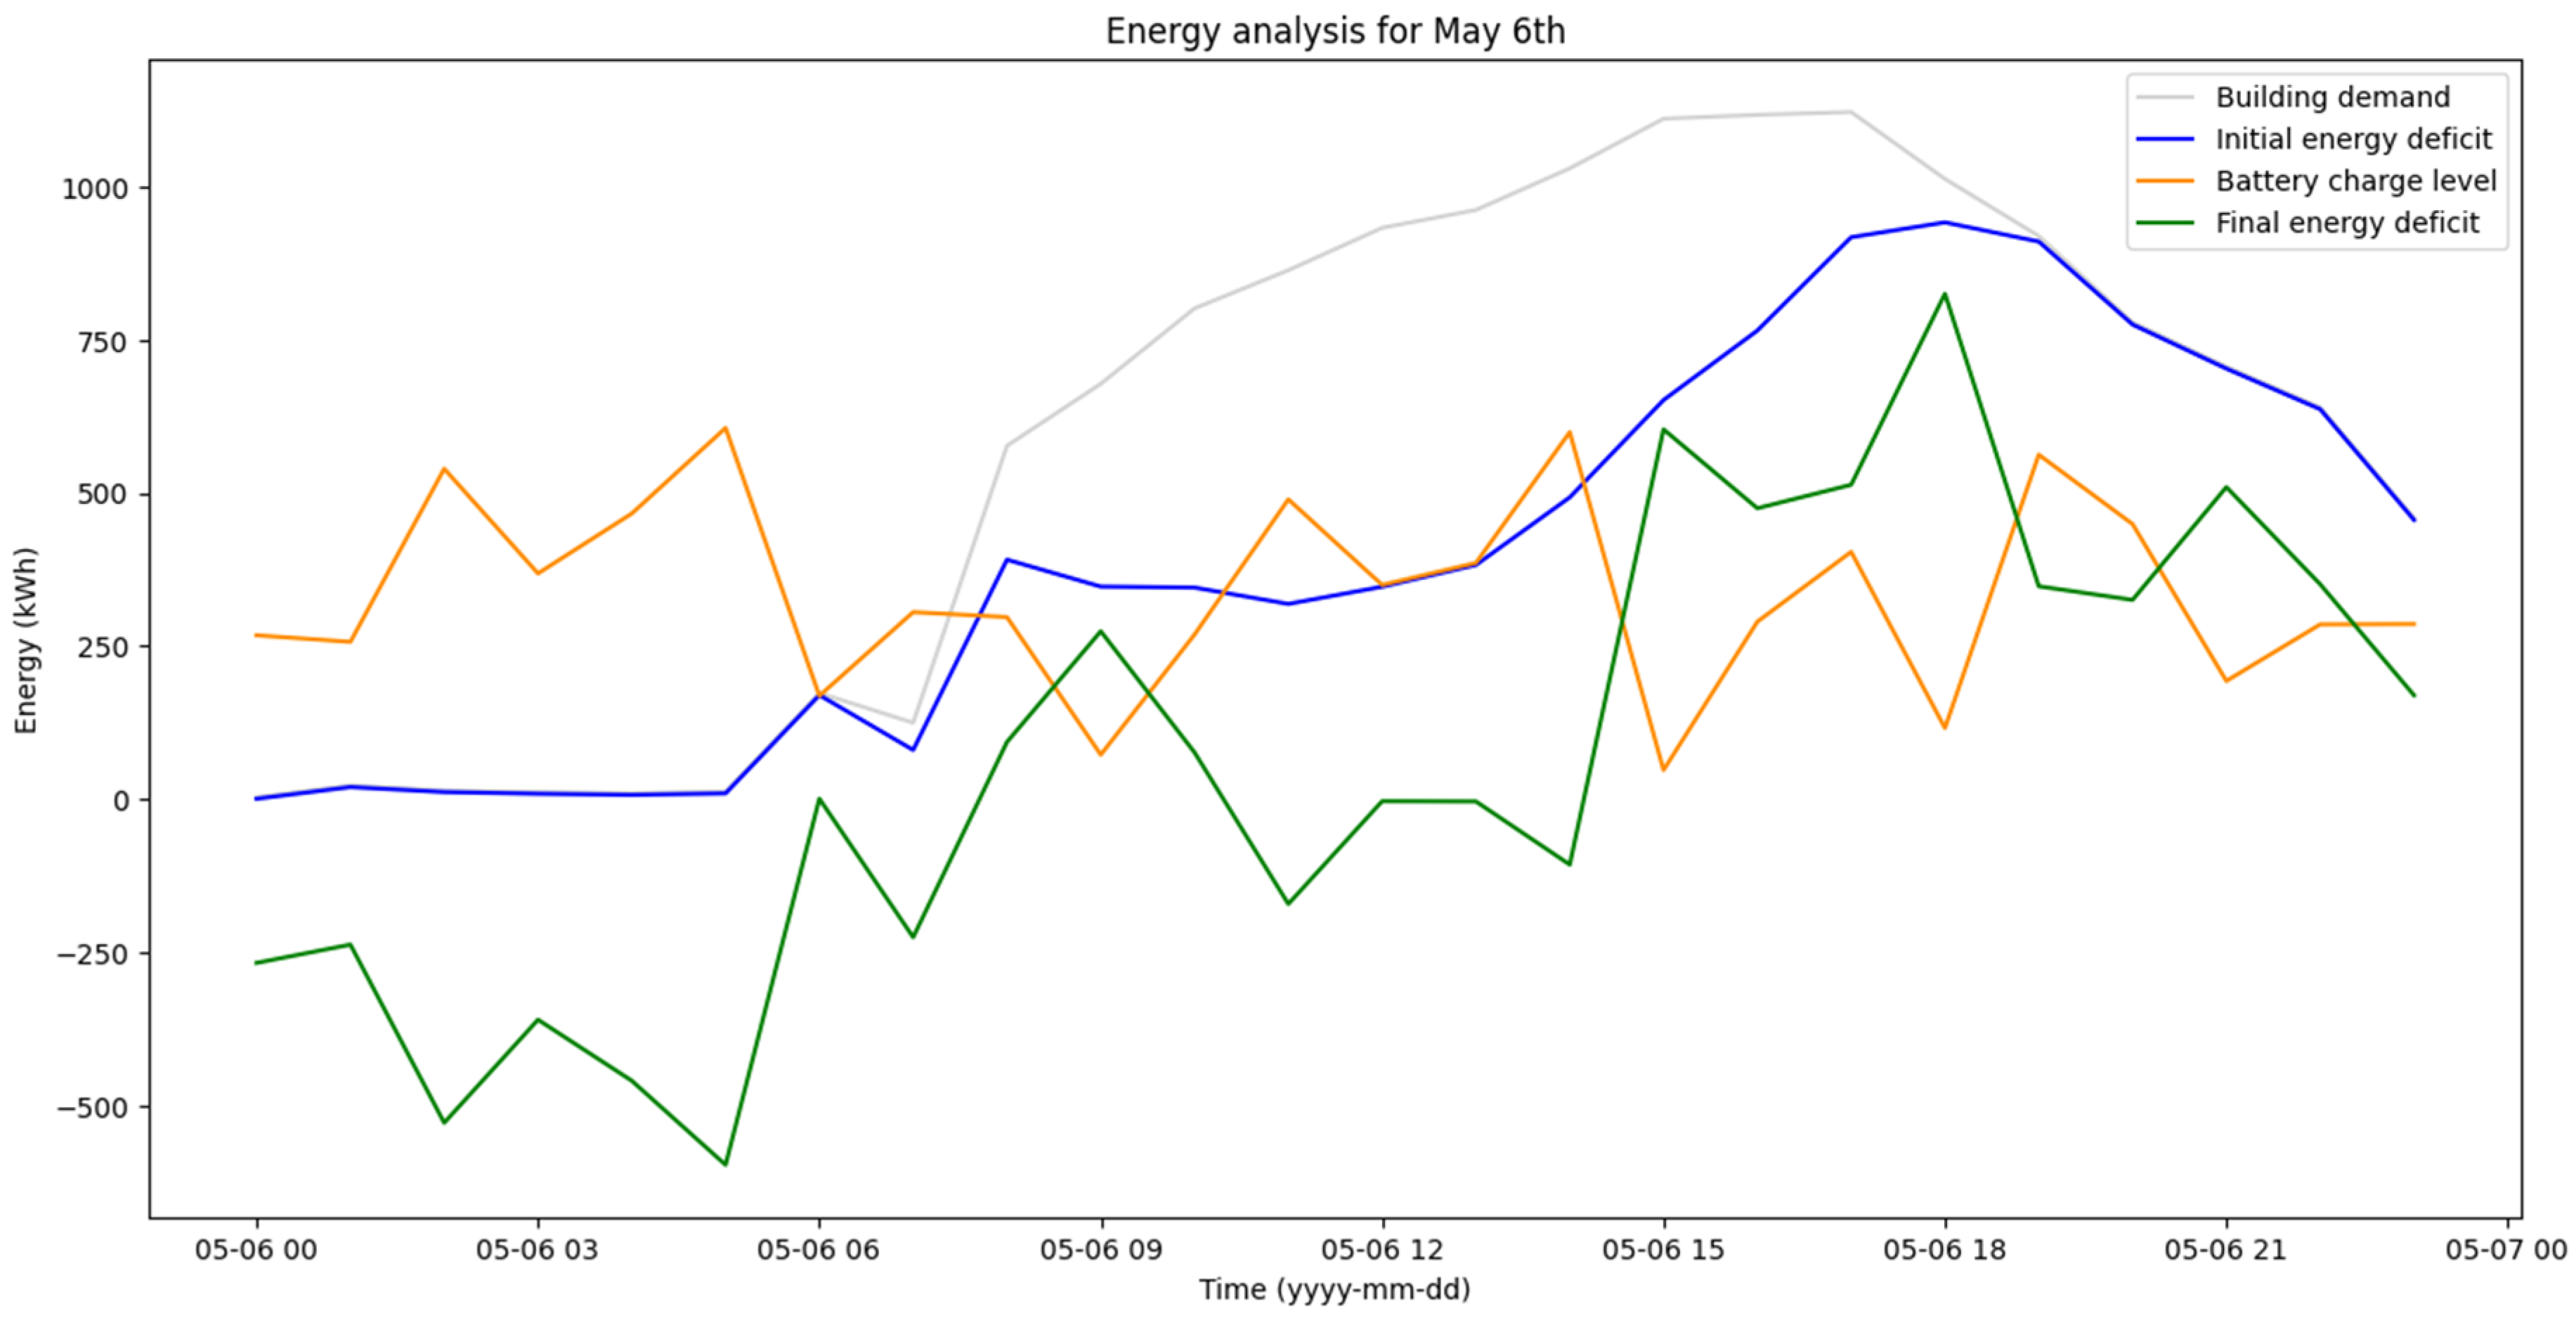
- May 6th Plot: Repeat the plot, specifically showing data for May 6th.
- Analyze Negative Values
- Filter energy_data for rows where any of the following are negative: initial energy deficit, final energy deficit, energy consumption.
- Combine the filtered data into a DataFrame negative_values_df.
- Save negative_values_df to ‘new_data_with_original_system.csv’.
References
- El-Zeiny, R.M.A. Biomimicry as a Problem Solving Methodology in Interior Architecture. Procedia Soc. Behav. Sci. 2012, 50, 502–512. [Google Scholar] [CrossRef]
- Chayaamor-Heil, N.; Hannachi-Belkadi, N. Towards a platform of investigative tools for biomimicry as a new approach for energy-efficient building design. Buildings 2017, 7, 19. [Google Scholar] [CrossRef]
- Knippers, J.; Speck, T. Design and construction principles in nature and architecture. Bioinspir. Biomimetics 2012, 7, 015002. [Google Scholar] [CrossRef]
- Ruiz-Pastor, L.; Chulvi, V.; Royo, M.; Sampaio, J.N. Bio-inspired design as a solution to generate creative and circular product concepts. Int. J. Des. Creativity Innov. 2023, 11, 42–61. [Google Scholar] [CrossRef]
- Badarnah, L.; Kadri, U. A methodology for the generation of biomimetic design concepts. Arch. Sci. Rev. 2015, 58, 120–133. [Google Scholar] [CrossRef]
- Aguilar-Planet, T.; Peralta, E. Innovation Inspired by Nature: Applications of Biomimicry in Engineering Design. Biomimetics 2024, 9, 523. [Google Scholar] [CrossRef]
- Nguyen, T.H.; Nguyen, L.V.; Jung, J.J.; Agbehadji, I.E.; Frimpong, S.O.; Millham, R.C. Bio-Inspired Approaches for Smart Energy Management: State of the Art and Challenges. Sustainability 2020, 12, 8495. [Google Scholar] [CrossRef]
- Omidvarnia, F.; Sarhadi, A. Nature-Inspired Designs in Wind Energy: A Review. Biomimetics 2024, 9, 90. [Google Scholar] [CrossRef]
- The Biomimicry Institute What is Biomimicry? Available online: https://biomimicry.org/what-is-biomimicry/ (accessed on 10 July 2022).
- Vanaga, R.; Blumberga, A. First Steps to Develop Biomimicry Ideas. Energy Procedia 2015, 72, 307–309. [Google Scholar] [CrossRef]
- Martín-Palma, R.J.; Lakhtakia, A. Progress on bioinspired, biomimetic, and bioreplication routes to harvest solar energy. Appl. Phys. Rev. 2017, 4, 021103. [Google Scholar] [CrossRef]
- Herzallh, N.S.; Cohen, Y.; Mukha, D.; Neumann, E.; Michaeli, D.; Nechushtai, R.; Yehezkeli, O. Photosynthesis Z-Scheme biomimicry: Photosystem I/BiVO4 photo-bioelectrochemical cell for donor-free bias-free electrical power generation. Biosens. Bioelectron. 2020, 168, 112517. [Google Scholar] [CrossRef]
- Stevovic, I.; Mirjanic, D.; Petrovic, N. Integration of solar energy by nature-inspired optimization in the context of circular economy. Energy 2021, 235, 121297. [Google Scholar] [CrossRef]
- Gandhi, S.; Liu, A. Living Energy. Consilience 2021, 24, 2021. [Google Scholar] [CrossRef]
- Wright, G. Bio-Inspired Wind Turbine Blade Profile Design. 14 December 2017. Available online: http://hdl.handle.net/10829/8227 (accessed on 5 March 2024).
- Mirniazmandan, S.; Rahimianzarif, E. Biomimicry, An Approach Toward Sustainability of High-Rise Buildings. Iran. J. Sci. Technol. Trans. A Sci. 2018, 42, 1837–1846. [Google Scholar] [CrossRef]
- Shrestha, S. Design and Optimization of Hybrid Foundation for Tall Wind Turbines and Development of New Foundation Through Bio-mimicry. All Dissertations, May 2019. Available online: https://tigerprints.clemson.edu/all_dissertations/2385t (accessed on 5 March 2024).
- Wayne, B.M.; Mintorogo, D.S.; Arifin, L.S. Biomimicry Kinetic Facade as Renewable Energy. Adv. Civ. Eng. Sustain. Archit. 2019, 2, 1–10. [Google Scholar] [CrossRef]
- Prathik, V.; Narayanan, U.K.; Kumar, P. Design Analysis of Vertical Axis Wind Turbine Blade Using Biomimicry. J. Mod. Mech. Eng. Technol. 2021, 8, 1–11. [Google Scholar] [CrossRef]
- Computational and Experimental Investigation of Lotus-Inspired Horizontal-Axis Wind Turbine Blade. 2021. Available online: https://www.researchgate.net/publication/350820035_Computational_and_Experimental_Investigation_of_Lotus-inspired_Horizontal-Axis_Wind_Turbine_Blade (accessed on 10 April 2025).
- Grippa, M. CFD Analyses and Performance Comparison of Micro-Hydropowder Plants. 2016. Available online: https://upcommons.upc.edu/handle/2117/101039 (accessed on 5 March 2024).
- Volkov, A.V.; Ryzhenkov, A.V.; Druzhinin, A.A.; Vikhlyantsev, A.A.; Orakhelashvili, B.M.; Baikov, V.N.; Šoukal, J.; Sedlař, M.; Komárek, M.; Pochylý, F.; et al. Application of New Approaches to the Hydropower Combined Complex Creation for Autonomous Energy Supply. E3S Web Conf. 2021, 320, 04002. [Google Scholar] [CrossRef]
- Zhang, H.; Aggidis, G.A. Nature rules hidden in the biomimetic wave energy converters. Renew. Sustain. Energy Rev. 2018, 97, 28–37. [Google Scholar] [CrossRef]
- Willis, M.; Adamo, G.; Hanna, J.; Auger, J. Towards Sustainable Island Futures: Design for Ocean Wave Energy. J. Futures Stud. 2021, 25, 31–44. [Google Scholar]
- Zhang, H.; Sheng, W.; Zha, Z.; Aggidis, G. A Preliminary Study on Identifying Biomimetic Entities for Generating Novel Wave Energy Converters. Energies 2022, 15, 2485. [Google Scholar] [CrossRef]
- Qiao, W.; Moayedi, H.; Foong, L.K. Nature-inspired hybrid techniques of IWO, DA, ES, GA, and ICA, validated through a k-fold validation process predicting monthly natural gas consumption. Energy Build. 2020, 217, 110023. [Google Scholar] [CrossRef]
- Ozbayram, E.G.; Kleinsteuber, S.; Nikolausz, M. Biotechnological utilization of animal gut microbiota for valorization of lignocellulosic biomass. Appl. Microbiol. Biotechnol. 2019, 104, 2. [Google Scholar] [CrossRef]
- Lackner, M.; Drew, D.; Bychkova, V.; Mustakhimov, I. Value-Added Products from Natural Gas Using Fermentation Processes: Fermentation of Natural Gas as Valorization Route, Part 1. In Natural Gas—New Perspectives and Future Developments; IntechOpen: London, UK, 2022. [Google Scholar] [CrossRef]
- Ma, X.; Mu, Y.; Zhang, Y.; Zang, C.; Li, S.; Jiang, X.; Cui, M. Multi-objective microgrid optimal dispatching based on improved bird swarm algorithm. Glob. Energy Interconnect. 2022, 5, 154–167. [Google Scholar] [CrossRef]
- RenovaWind 1 kW Vertical Wind Turbine. Available online: https://renovawind.com/en/solutions/business-solutions (accessed on 2 October 2024).
- SunPower SPR-A450-COM (450 W). Available online: http://www.solardesigntool.com/components/module-panel-solar/Sunpower/6573/SPR-A450-COM/specification-data-sheet.html (accessed on 2 October 2024).
- Tesvolt TS25. Available online: https://www.tesvolt.com/en/products/a-series/ts-48-v.html (accessed on 2 October 2024).
- Mora, D.; Fajilla, G.; Austin, M.C.; De Simone, M. Occupancy patterns obtained by heuristic approaches: Cluster analysis and logical flowcharts. A case study in a university office. Energy Build. 2019, 186, 147–168. [Google Scholar] [CrossRef]
- Zhang, Y.; Lv, Y. Research on electrical load distribution using an improved bacterial foraging algorithm. Front. Energy Res. 2023, 11, 1103038. [Google Scholar] [CrossRef]
- Menos-aikateriniadis, C.; Lamprinos, I.; Georgilakis, P.S. Particle Swarm Optimization in Residential Demand-Side Management: A Review on Scheduling and Control Algorithms for Demand Response Provision. Energies 2022, 15, 2211. [Google Scholar] [CrossRef]
- Wang, Y.; Wei, C. Design optimization of office building envelope based on quantum genetic algorithm for energy conservation. J. Build. Eng. 2021, 35, 102048. [Google Scholar] [CrossRef]
- Krishna, P.V.; Babu, M.R. CCIS 269—Energy and Path Aware Ant Colony Optimization Based Routing Algorithm for Wireless Sensor Networks. In Global Trends in Computing and Communication Systems; Springer: Berlin/Heidelberg, Germany, 2012. [Google Scholar]
- Özdemir, D.; Dörterler, S. An adaptive search equation-based artificial bee colony algorithm for transportation energy demand forecasting. Turk. J. Electr. Eng. Comput. Sci. 2022, 30, 1251–1268. [Google Scholar] [CrossRef]
- Yang, Q.; Dong, N.; Zhang, J. An enhanced adaptive bat algorithm for microgrid energy scheduling. Energy 2021, 232, 121014. [Google Scholar] [CrossRef]
- Idrees, A.K.; Couturier, R. Energy-saving distributed monitoring-based firefly algorithm in wireless sensors networks. J. Supercomput. 2022, 78, 2072–2097. [Google Scholar] [CrossRef]
- Yuvaraj, T.; Ravi, K. Multi-objective simultaneous DG and DSTATCOM allocation in radial distribution networks using cuckoo searching algorithm. Alex. Eng. J. 2018, 57, 2729–2742. [Google Scholar] [CrossRef]
- Li, Y.; Liang, X.; Song, W.; Li, T.; Wang, D.; Liu, Y. Optimization and thermal performance of U-type evacuated tube solar collector filled with phase change material. Energy Rep. 2022, 8, 6126–6138. [Google Scholar] [CrossRef]
- Liu, S.; Wang, L.; Jiang, H.; Liu, Y.; You, H. Wind Farm Energy Storage System Based on Cat Swarm Optimization–Backpropagation Neural Network Wind Power Prediction. Front. Energy Res. 2022, 10, 850295. [Google Scholar] [CrossRef]
- Wang, D.; Tan, D.; Liu, L. Particle swarm optimization algorithm: An overview. Soft Comput. 2018, 22, 387–408. [Google Scholar] [CrossRef]
- Miranda, L.J.V. PySwarms: A research toolkit for Particle Swarm Optimization in Python. J. Open Source Softw. 2018, 3, 433. [Google Scholar] [CrossRef]
- Gad, A.G. Particle Swarm Optimization Algorithm and Its Applications: A Systematic Review. Arch. Comput. Methods Eng. 2022, 29, 2531–2561. [Google Scholar] [CrossRef]
- Isa, F.M.; Ariffin, W.N.M.; Jusoh, M.S.; Putri, E.P. A Review of Genetic Algorithm: Operations and Applications. J. Adv. Res. Appl. Sci. Eng. Technol. 2024, 40, 1–34. [Google Scholar] [CrossRef]
- Saleh, Y.A.S.; Austin, M.C.; Carpino, C.; Turhan, C. Determining Payback Period and Comparing Two Small-Scale Vertical Axis Wind Turbines Installed at the Top of Residential Buildings. Int. J. Arch. Eng. Technol. 2024, 11, 1–16. [Google Scholar] [CrossRef]
- Artículo 194 del Tratado de Funcionamiento de la Unión Europea. Available online: www.europarl.europa.eu/factsheets/es (accessed on 4 October 2023).
- Azad, A.S.; Rahaman, M.S.A.; Watada, J.; Vasant, P.; Vintaned, J.A.G. Optimization of the hydropower energy generation using Meta-Heuristic approaches: A review. Energy Rep. 2020, 6, 2230–2248. [Google Scholar] [CrossRef]
- Kohne, T.; Ranzau, H.; Panten, N.; Weigold, M. Comparative study of algorithms for optimized control of industrial energy supply systems. Energy Informatics 2020, 3, 12. [Google Scholar] [CrossRef]

| Year | Energy Source | Biological Analogy | Source | Type of Research Project |
|---|---|---|---|---|
| 2015 | Solar | Sea stars | [10] | Preliminary |
| 2017 | Solar | Insect eyes | [11] | Simulation |
| 2020 | Solar | Photosynthesis | [12] | Experimental |
| 2021 | Solar | Genetic Algorithm | [13] | Simulation |
| 2021 | Solar | Bacteria | [14] | Experimental |
| 2017 | Wind | Feathers | [15] | Experimental |
| 2018 | Wind | Mix | [16] | Review |
| 2019 | Wind | Palm roots | [17] | Simulation |
| 2019 | Wind | Feathers | [18] | Simulation |
| 2021 | Wind | Mix | [19] | Simulation |
| 2021 | Wind | Lotus | [20] | Experimental |
| 2016 | Hydroelectric | Snail shells | [21] | Simulation |
| 2021 | Hydroelectric | Humpback whales | [22] | Simulation |
| 2018 | Tidal | Mix | [23] | Review |
| 2021 | Tidal | Arrowhead crab | [24] | Simulation |
| 2022 | Tidal | Dumbo octopus | [25] | Experimental |
| 2020 | Natural gas | Mix | [26] | Simulation |
| 2020 | Biomass | Bacteria | [27] | Theoretical |
| 2022 | Natural gas | Bacteria | [28] | Experimental |
| 2022 | Optimization | Bird flocks | [29] | Simulation |
| Month/Day | Tmax 1 (°C) (Time) | Tmin 2 (°C) (Time) | GHImax 3 W/m2 (Time) | DNImax 4 W/m2 (Time) | DIFmax 5 W/m2 (Time) | RHmax 6 (%) (Time) | RHmin 7 (%) (Time) | Wind Speed (m/s) | Average Wind Direction (°) |
|---|---|---|---|---|---|---|---|---|---|
| January 3 | 35 (15:00) | 23.9 (6:00) | 649 (11:00) | 498 (11:00) | 379 (1:00) | 94 (5:00) | 44 (15:00) | 0.43 | 126 |
| February 20 | 34.6 (15:00) | 22.2 (6:00) | 943 (13:00) | 690 (13:00) | 299 (13:00) | 93 (6:00) | 40 (15:00) | 2.77 | 85.77 |
| March 17 | 35.6 (15:00) | 24.9 (6:00) | 956 (13:00) | 653 (13:00) | 388 (12:00) | 73 (6:00) | 36 (16:00) | 2.3 | 49 |
| April 11 | 35.3 (15:00) | 24.8 (6:00) | 918 (12:00) | 602 (12:00) | 357 (14:00) | 82 (24:00) | 44 (16:00) | 1.75 | 87 |
| May 20 | 34.8 (15:00) | 24.5 (6:00) | 716 (15:00) | 584 (15:00) | 385 (12:00) | 90 (6:00) | 53 (16:00) | 0.87 | 83.3 |
| June 23 | 32.8 (15:00) | 23.4 (6:00) | 779 (14:00) | 464 (14:00) | 335 (14:00) | 94 (6:00) | 58 (15:00) | 0.45 | 108.25 |
| July 21 | 35.5 (16:00) | 24.3 (6:00) | 846 (14:00) | 568 (14:00) | 352 (12:00) | 97 (4:00) | 49 (16:00) | 0.3 | 89.3 |
| August 19 | 34.7 (15:00) | 24.1 (6:00) | 848 (12:00) | 588 (12:00) | 402 (13:00) | 95 (5:00) | 52 (15:00) | 3.9 | 188 |
| September 1 | 32.5 (15:00) | 23 (6:00) | 893 (12:00) | 686 (11:00) | 406 (14:00) | 98 (24:00) | 60 (15:00) | 2.1 | 83 |
| October 20 | 32.5 (15:00) | 23 (6:00) | 786 (11:00) | 687 (10:00) | 368 (14:00) | 96 (6:00) | 62 (14:00) | 2.33 | 90.67 |
| November 11 | 32.9 (15:00) | 23.7 (6:00) | 275 (16:00) | 126 (16:00) | 215 (16:00) | 94 (5:00) | 61 (13:00) | 2.55 | 80 |
| December 16 | 34.3 (15:00) | 24.6 (6:00) | 664 (14:00) | 423 (14:00) | 394 (13:00) | 94 (7:00) | 50 (16:00) | 4.2 | 34.5 |
| Component | Material | Heat Transfer Coefficient (Wm−2K−1) |
|---|---|---|
| Walls (interior and exterior) | 0.100 m thick concrete blocks, with a 0.015 m thick double filling. | 1.94 |
| Flooring | 0.040 m × 0.040 m tiles. | 2.98 |
| Roof | 0.038 m thick expanded polyurethane, over a metal structure. | 0.39 |
| Ceiling | Suspended. 0.0508 m × 0.0508 m mineral fiber in aluminum frames. 2.700 m over floor level. | 1.94 |
| Doors | Pine wood, 2.00 m × 1.00 m. | 1.11 |
| Windows | Sliding. 0.006 m thick simple glass with a gray tone. | 5.70 |
| Equipment | Estimated Consumption | Operating Hours |
|---|---|---|
| Interior lighting (fluorescent bulbs) | 32 W | Monday–Friday 07:00–22:30 |
| Consumption density for equipment | 17.6 W/m2 | Saturday 08:00–18:00 |
| Exterior lighting | 100 W | Monday–Sunday 18:00–07:00 |
| Air conditioning system (water-cooled chiller with fan coils) | 30 kWh/m2 | Monday–Friday 07:00–22:30 |
| Part | Number of Clusters |
|---|---|
| Energy consumption | 5 |
| Solar generation | 5 |
| Wind generation | 5 |
| Algorithm | Description | Source |
|---|---|---|
| Bacterial Foraging Algorithm (BFA) | Based on the behavior of bacteria in search of nutrients, BFA is an optimization algorithm that emulates the chemotactic movement of bacteria in their search for food. | [34] |
| Particle Swarm Optimization (PSO) | Inspired by the behavior of bird flocks and fish schools, PSO optimizes a function by having a population (a swarm) of candidate solutions (particles) and moving these particles around the search space according to simple mathematical rules. | [35] |
| Genetic Algorithm (GA) | This algorithm is based on the principles of natural selection and genetics, such as inheritance, mutation, selection, and crossover, to find the best solution to a problem. | [36] |
| Ant Colony Optimization (ACO) | Inspired by the behavior of ants in search of food, ACO is a probabilistic algorithm that is used to find the optimal path in a graph. | [37] |
| Bee Algorithm (BA) | This algorithm is inspired by the behavior of bees in search of food, particularly the way in which worker bees share information about the location and quality of food sources. | [38] |
| Bat Algorithm (BA) | Based on the behavior of bats and their use of echolocation, this algorithm is used for global optimization. | [39] |
| Firefly Algorithm (FA) | Inspired by the behavior of fireflies and their use of light signals to attract other individuals. | [40] |
| Cuckoo Search Algorithm (CSA) | This algorithm is inspired by the brood parasitism strategy of the cuckoo, which lays its eggs in the nests of other bird species. | [41] |
| Artificial Immune System (AIS) | Inspired by the immune system, this algorithm is used in anomaly detection, pattern recognition, and optimization. | [42] |
| Cat Swarm Optimization (CSO) | Based on the behavior of cats, and in particular on their behavior of searching and pursuing. | [43] |
| Number of Solar Panels | Number of Wind Turbines | |
|---|---|---|
| Manual design | 1743 | 9 |
| Optimized design | 1207 | 36 |
| Iteration | Decrease in Energy Deficit (%) |
|---|---|
| 1 | −9.8 |
| 2 | −9.9 |
| 3 | −9.9 |
| 4 | −9.8 |
| 5 | −9.8 |
| 6 | −9.8 |
| 7 | −9.8 |
| 8 | −9.8 |
| 9 | −9.7 |
| 10 | −9.8 |
| Average | −9.8 |
Disclaimer/Publisher’s Note: The statements, opinions and data contained in all publications are solely those of the individual author(s) and contributor(s) and not of MDPI and/or the editor(s). MDPI and/or the editor(s) disclaim responsibility for any injury to people or property resulting from any ideas, methods, instructions or products referred to in the content. |
© 2025 by the authors. Licensee MDPI, Basel, Switzerland. This article is an open access article distributed under the terms and conditions of the Creative Commons Attribution (CC BY) license (https://creativecommons.org/licenses/by/4.0/).
Share and Cite
Aguilar Pinzón, O.; Aguilar Gallardo, O.; Chen Austin, M. A Bio-Optimization Approach for Renewable Energy Management: The Case of a University Building in a Tropical Climate. Energies 2025, 18, 2100. https://doi.org/10.3390/en18082100
Aguilar Pinzón O, Aguilar Gallardo O, Chen Austin M. A Bio-Optimization Approach for Renewable Energy Management: The Case of a University Building in a Tropical Climate. Energies. 2025; 18(8):2100. https://doi.org/10.3390/en18082100
Chicago/Turabian StyleAguilar Pinzón, Orlando, Orlando Aguilar Gallardo, and Miguel Chen Austin. 2025. "A Bio-Optimization Approach for Renewable Energy Management: The Case of a University Building in a Tropical Climate" Energies 18, no. 8: 2100. https://doi.org/10.3390/en18082100
APA StyleAguilar Pinzón, O., Aguilar Gallardo, O., & Chen Austin, M. (2025). A Bio-Optimization Approach for Renewable Energy Management: The Case of a University Building in a Tropical Climate. Energies, 18(8), 2100. https://doi.org/10.3390/en18082100