
Assessment of Charge Dilution Strategies to Reduce Fuel Consumption in Natural Gas-Fuelled Heavy-Duty Spark Ignition Engines


Abstract
1. Introduction
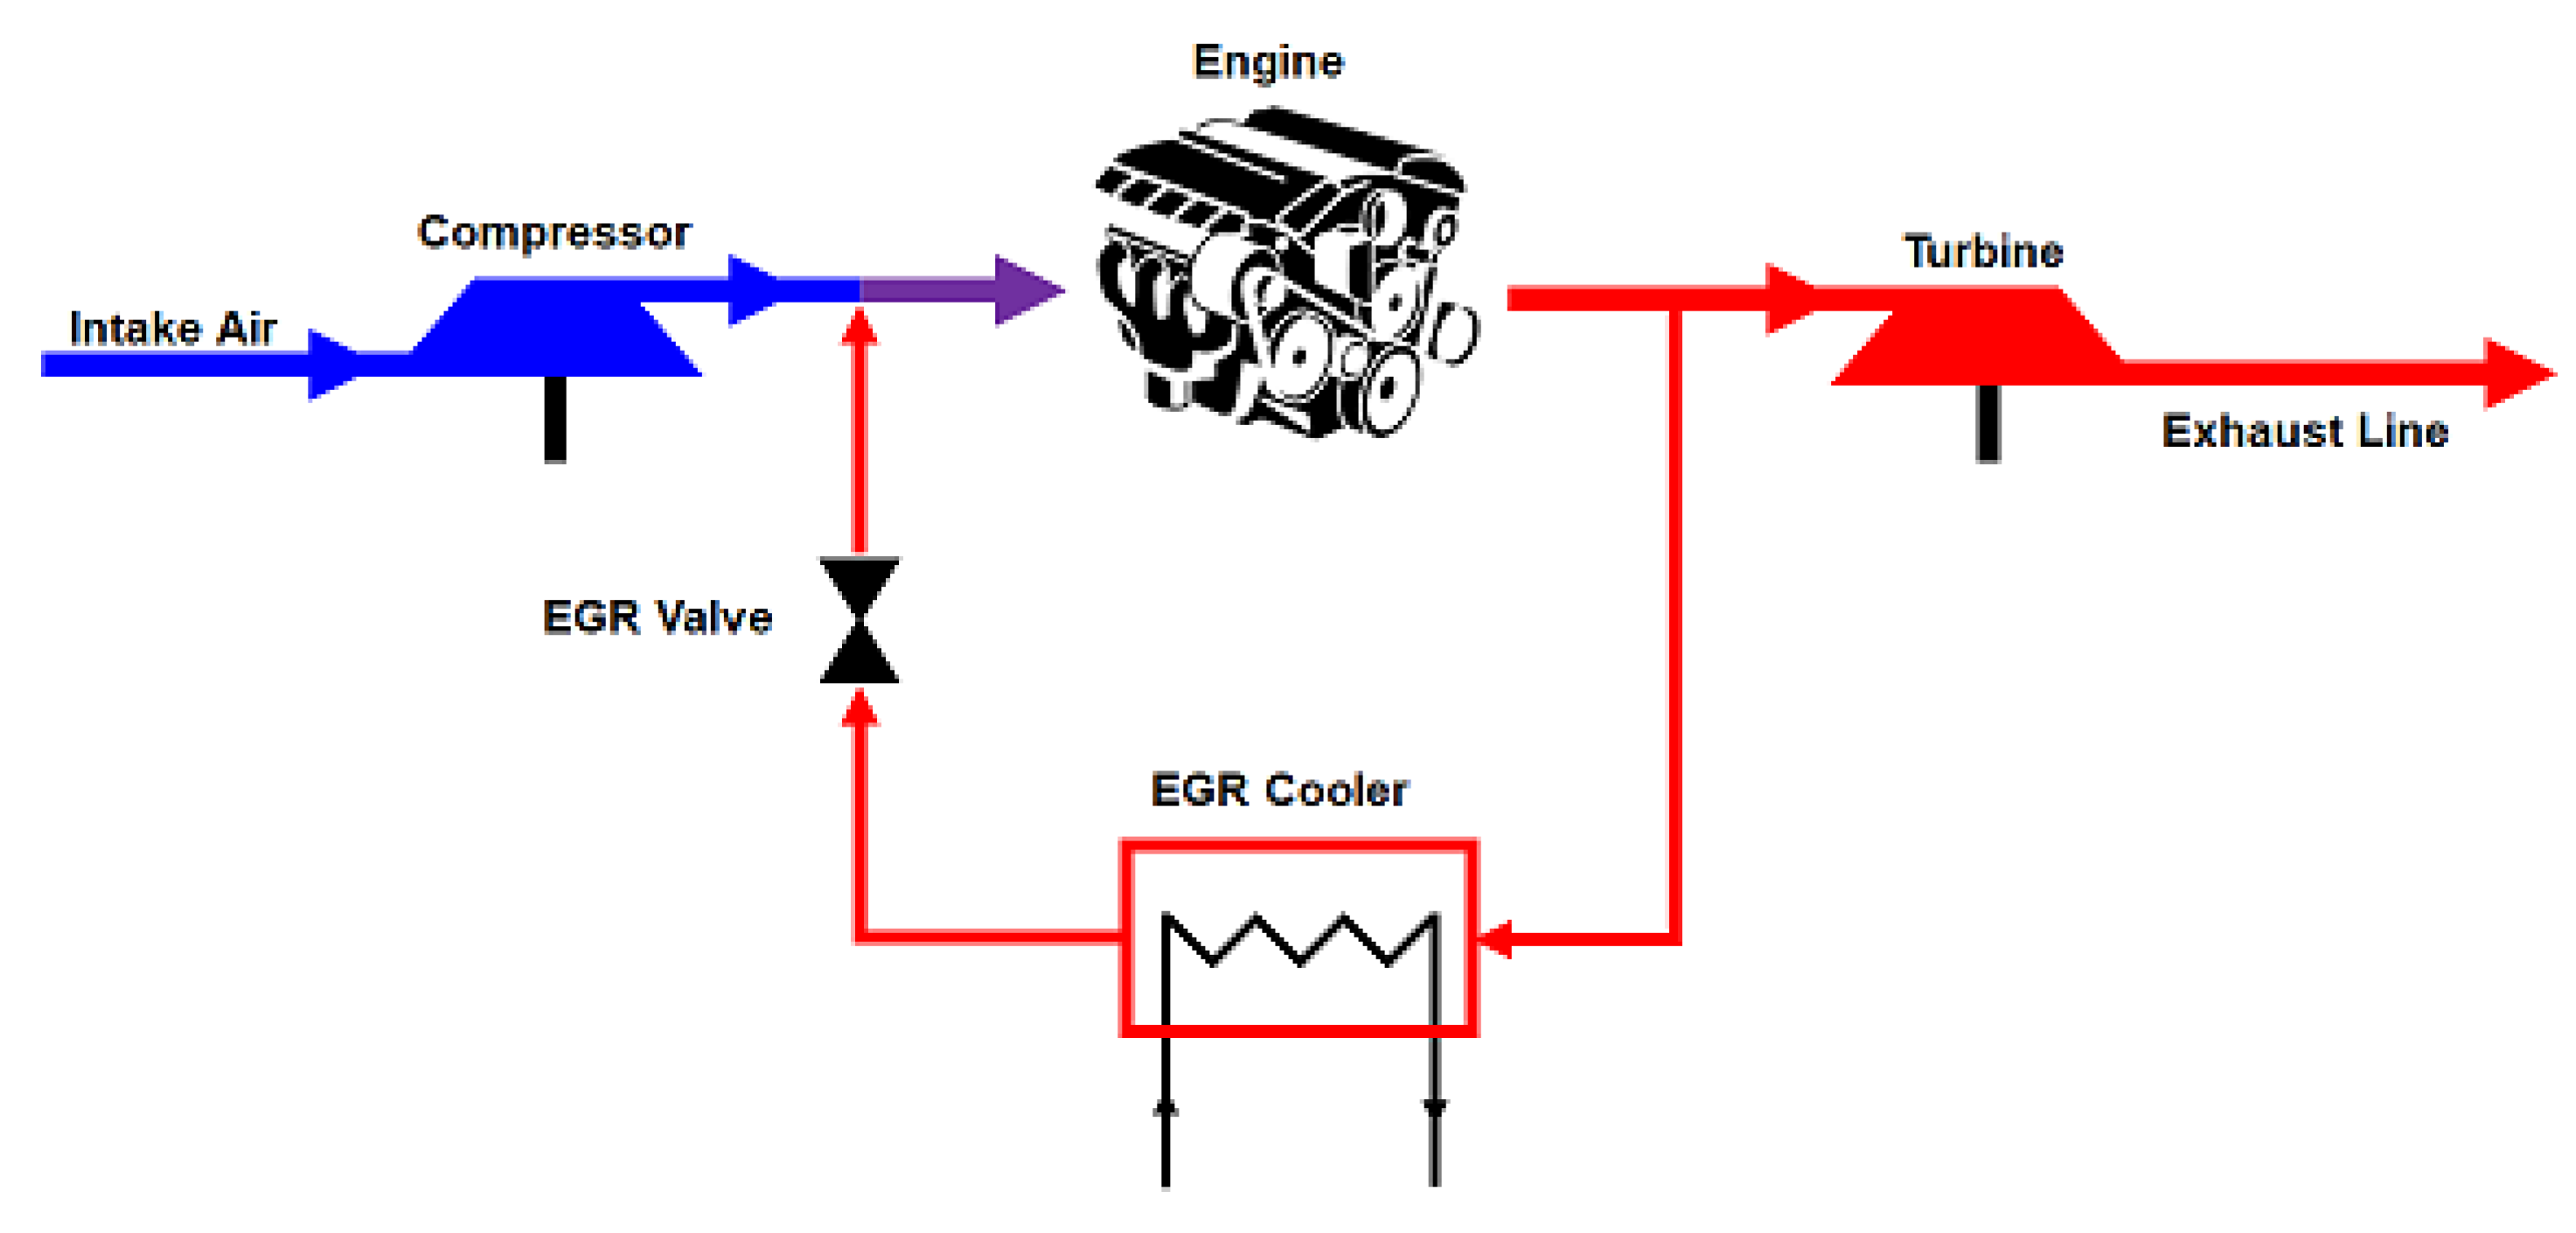
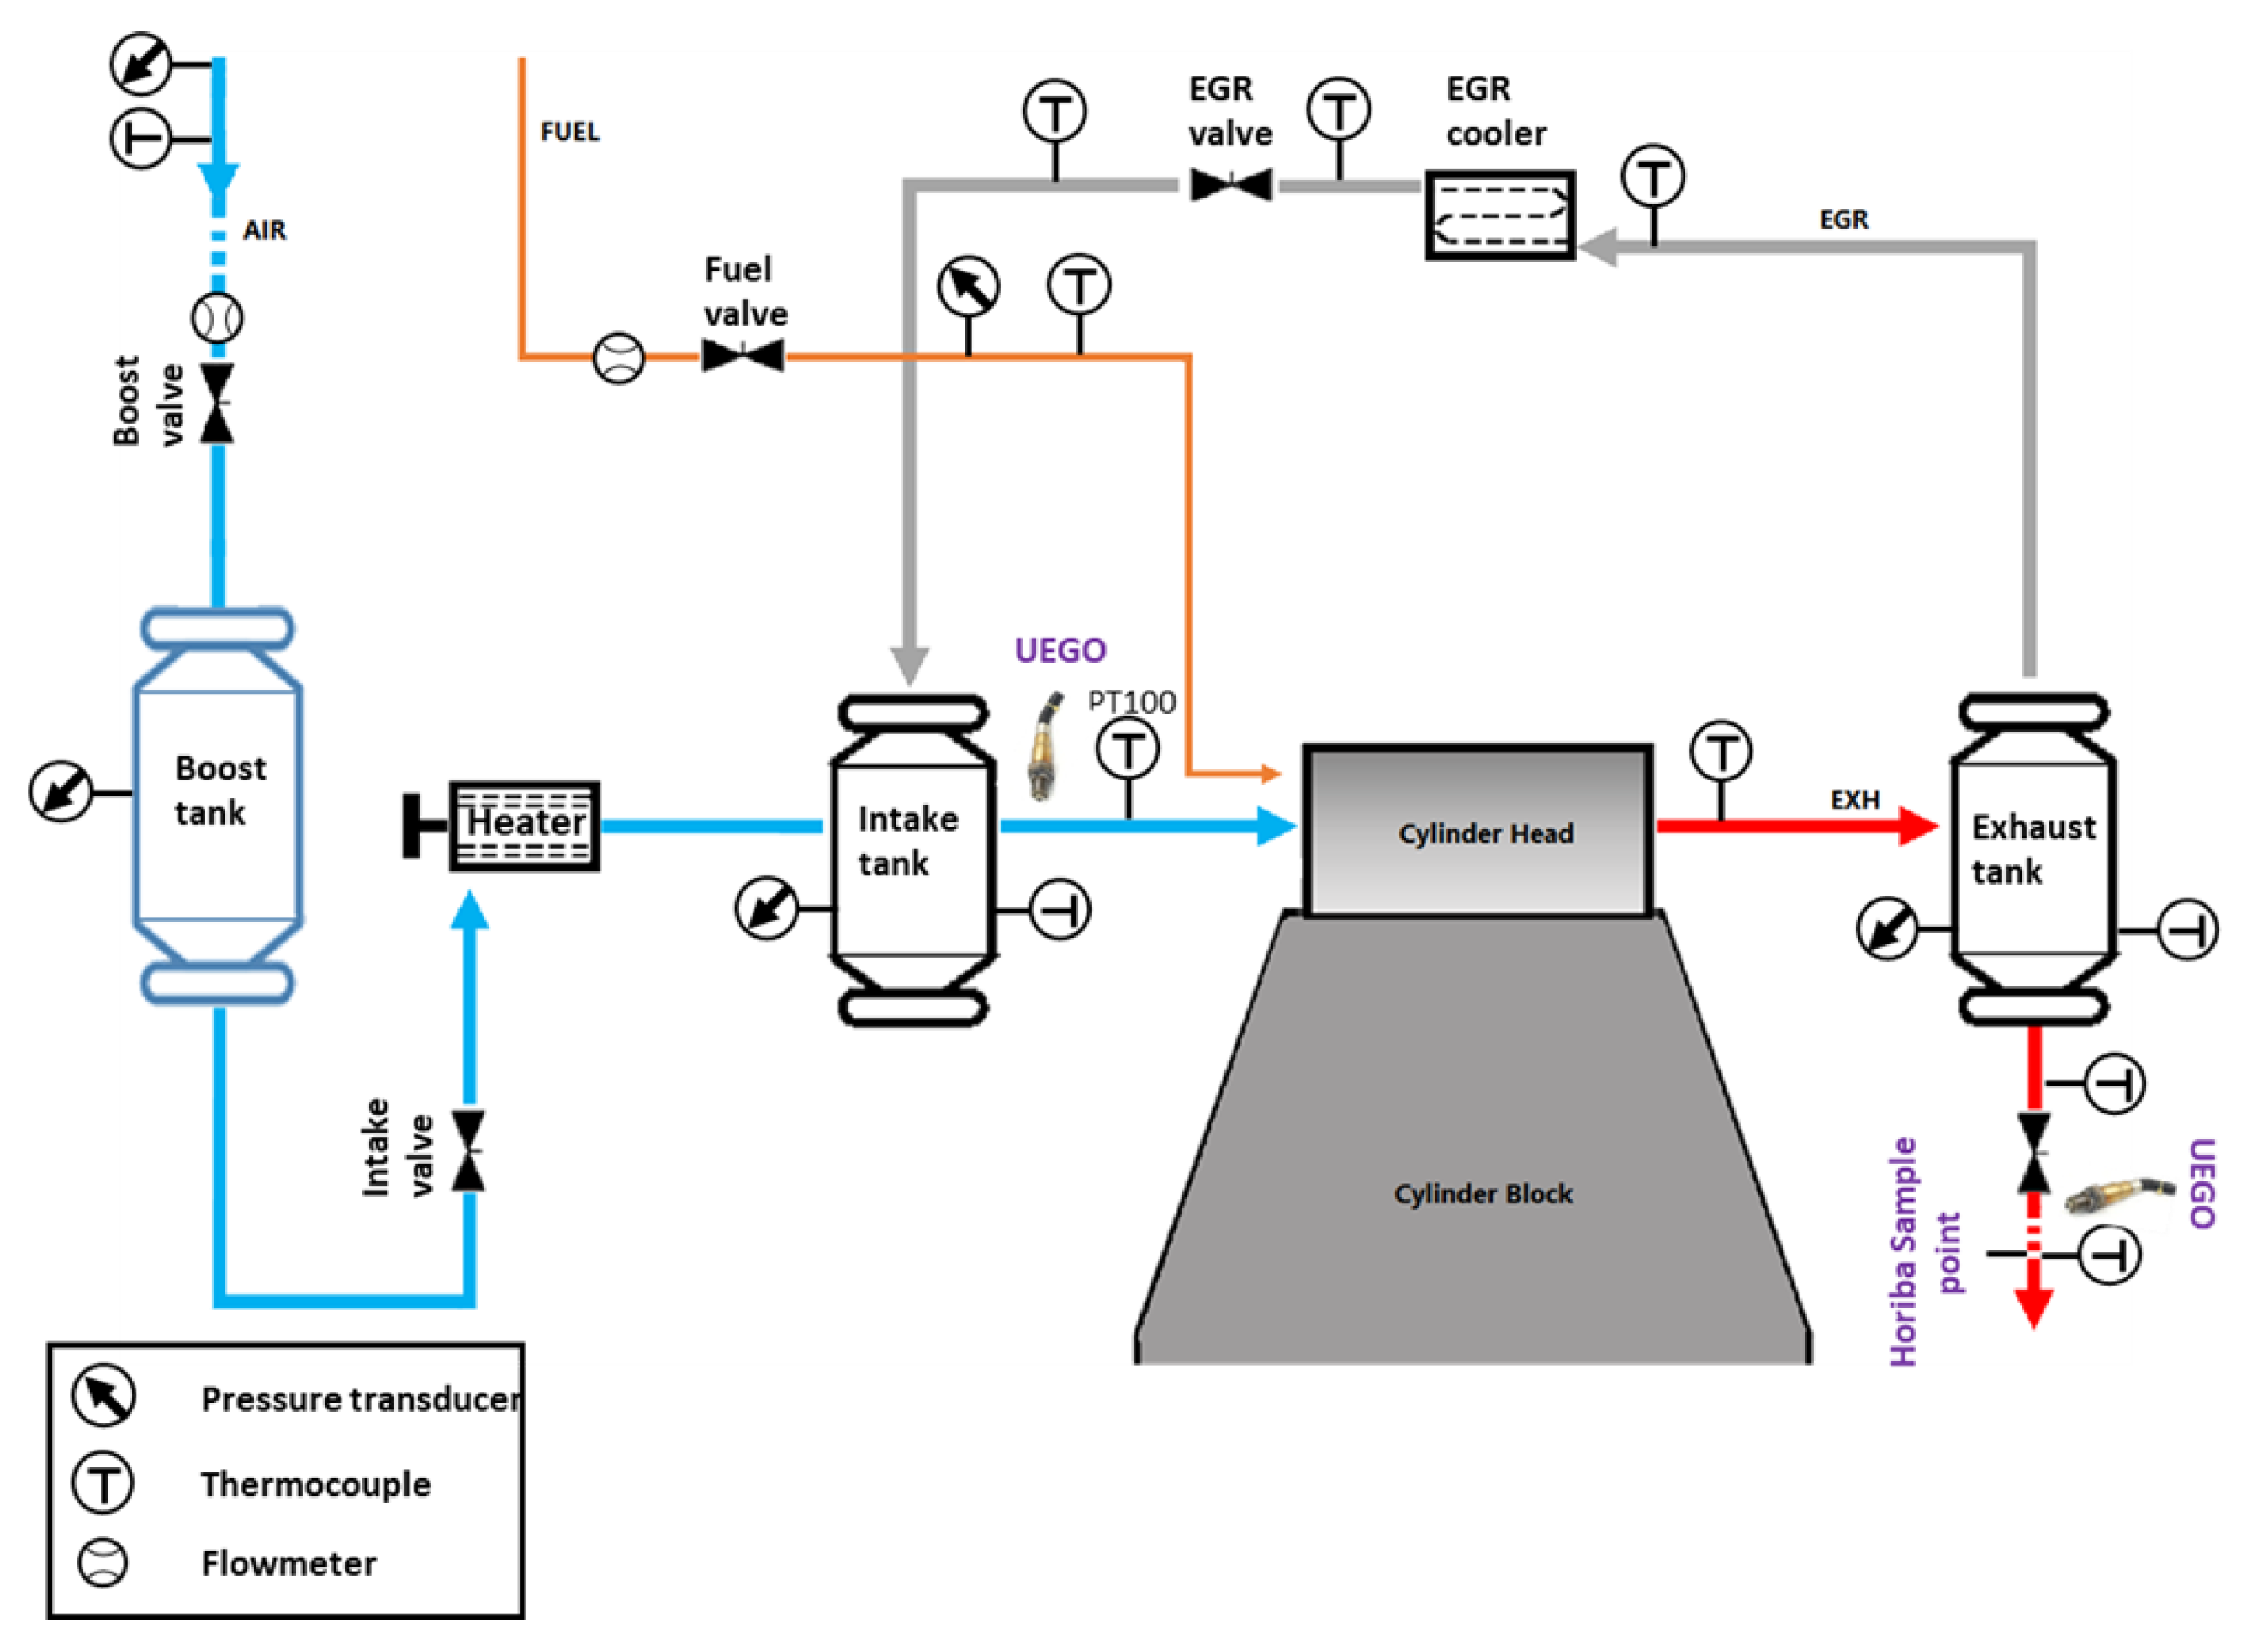
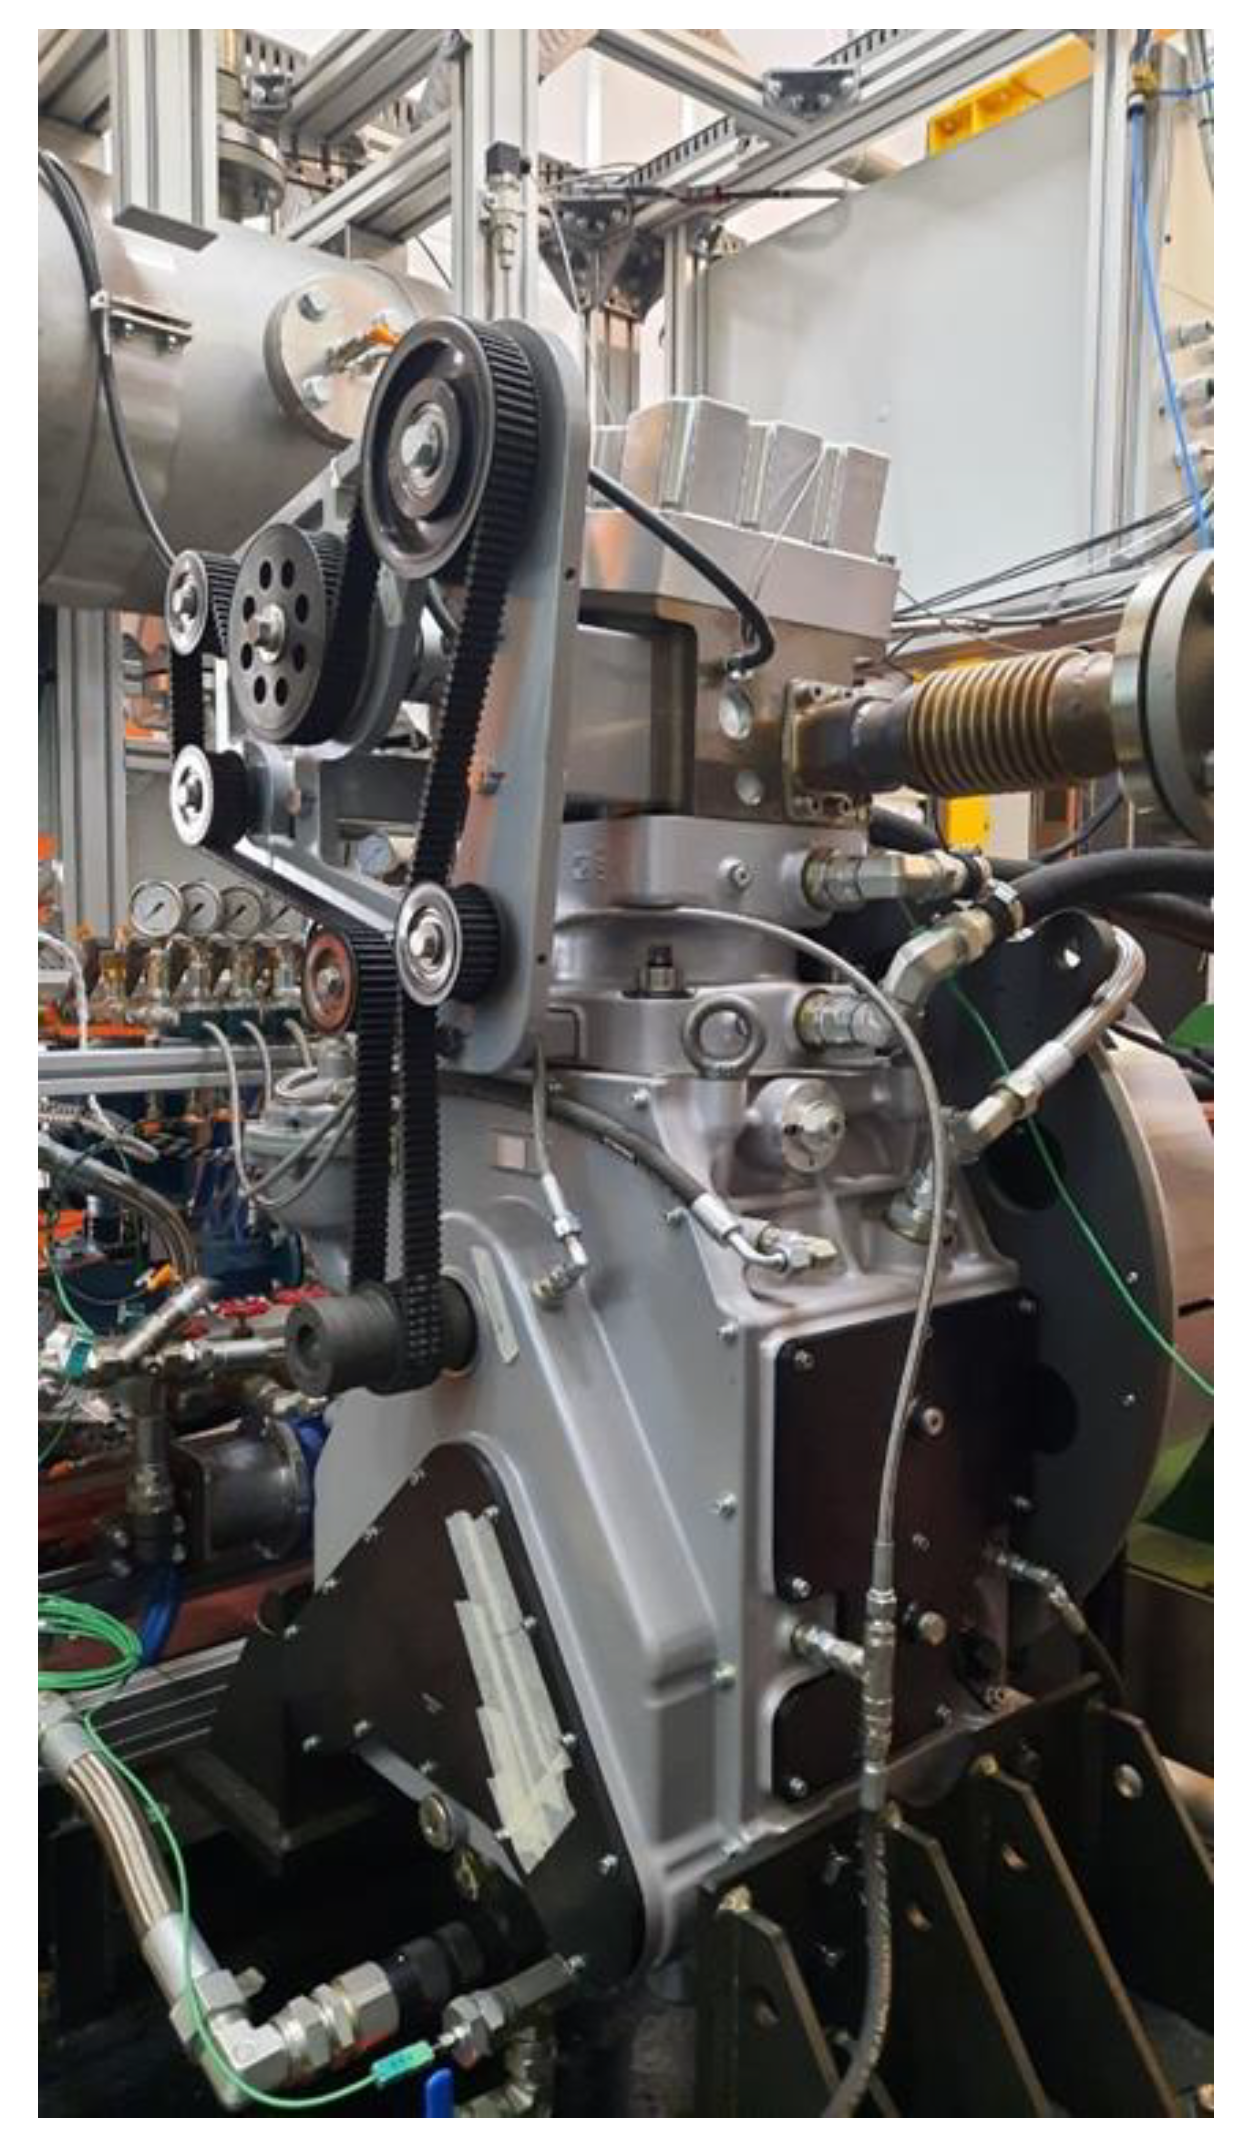
2. Methodology
3. Results and Discussion
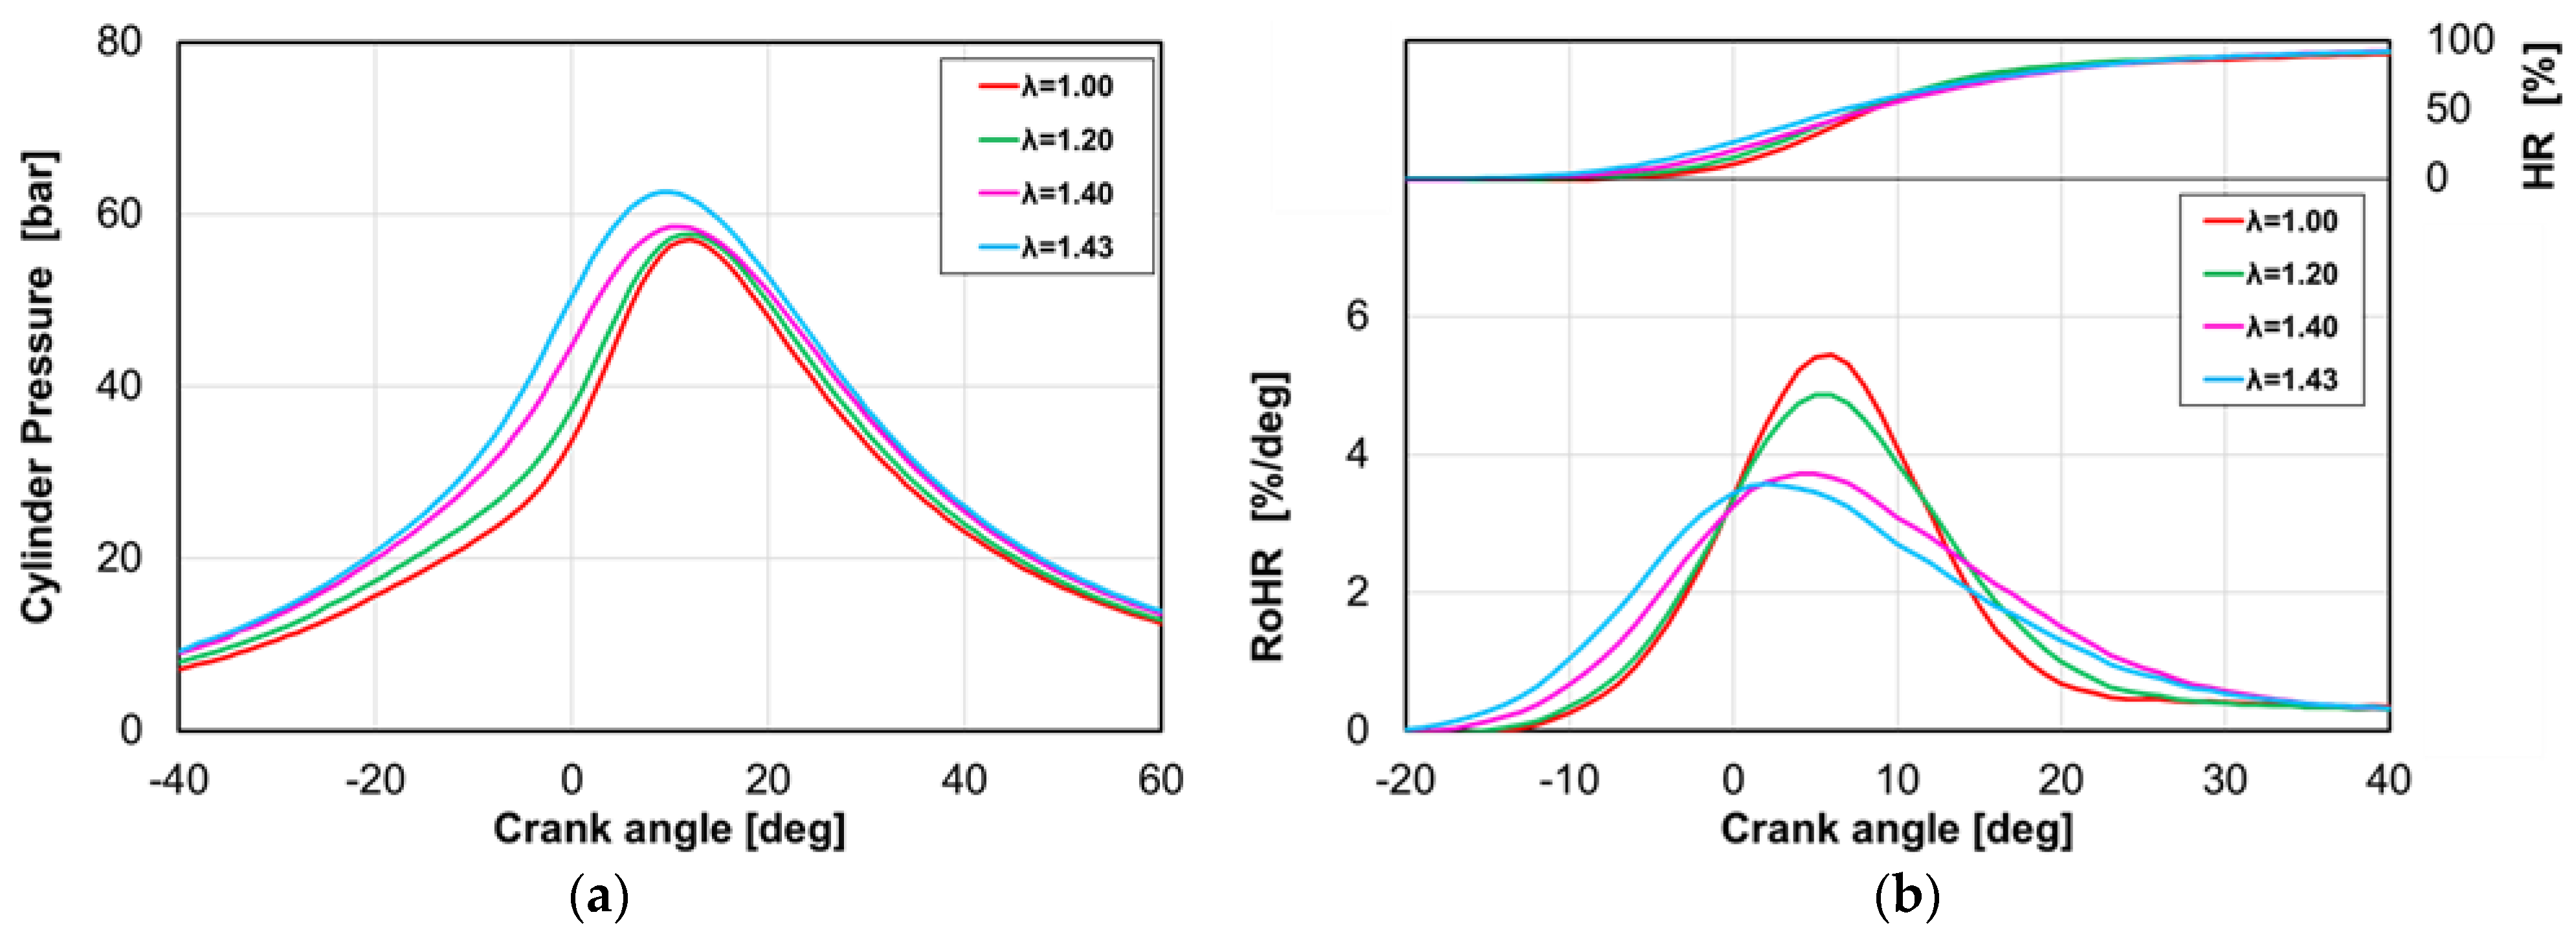
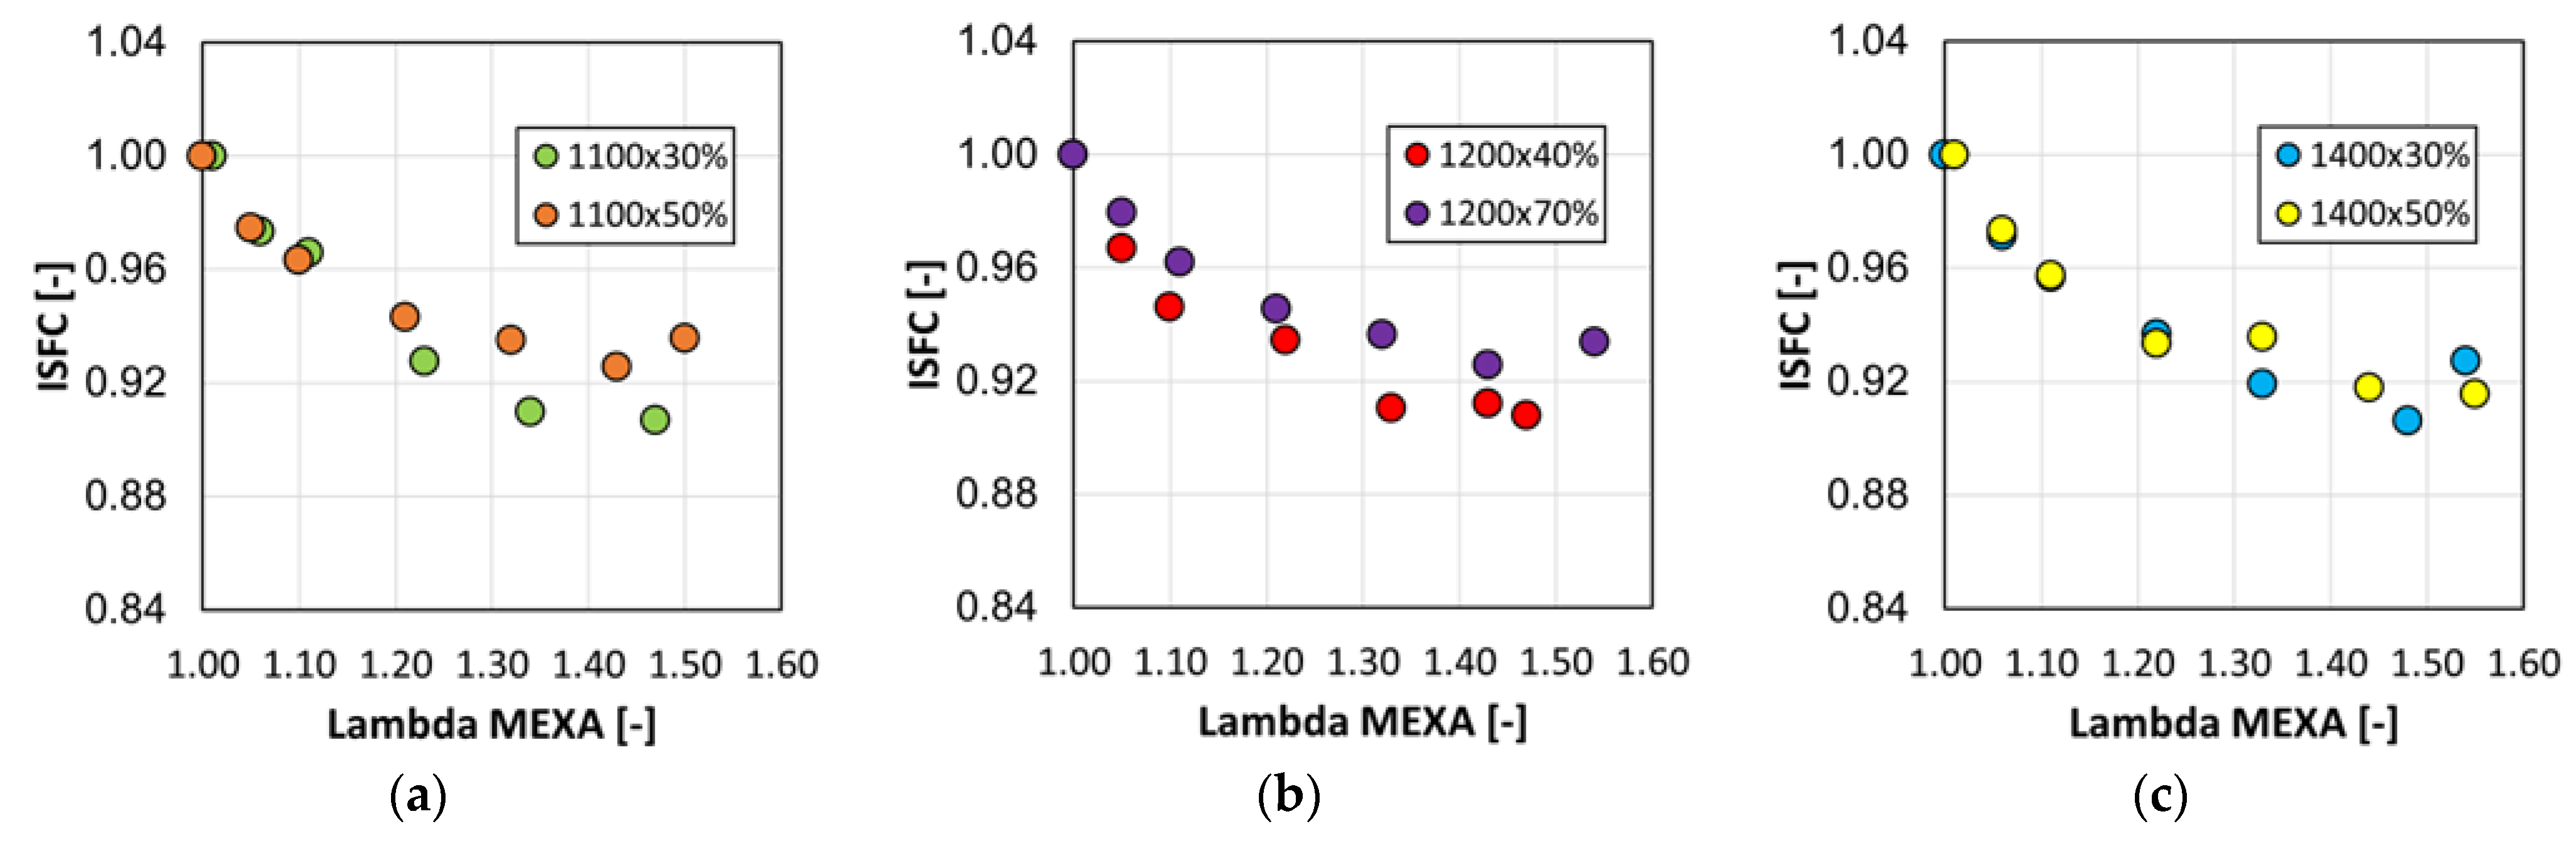
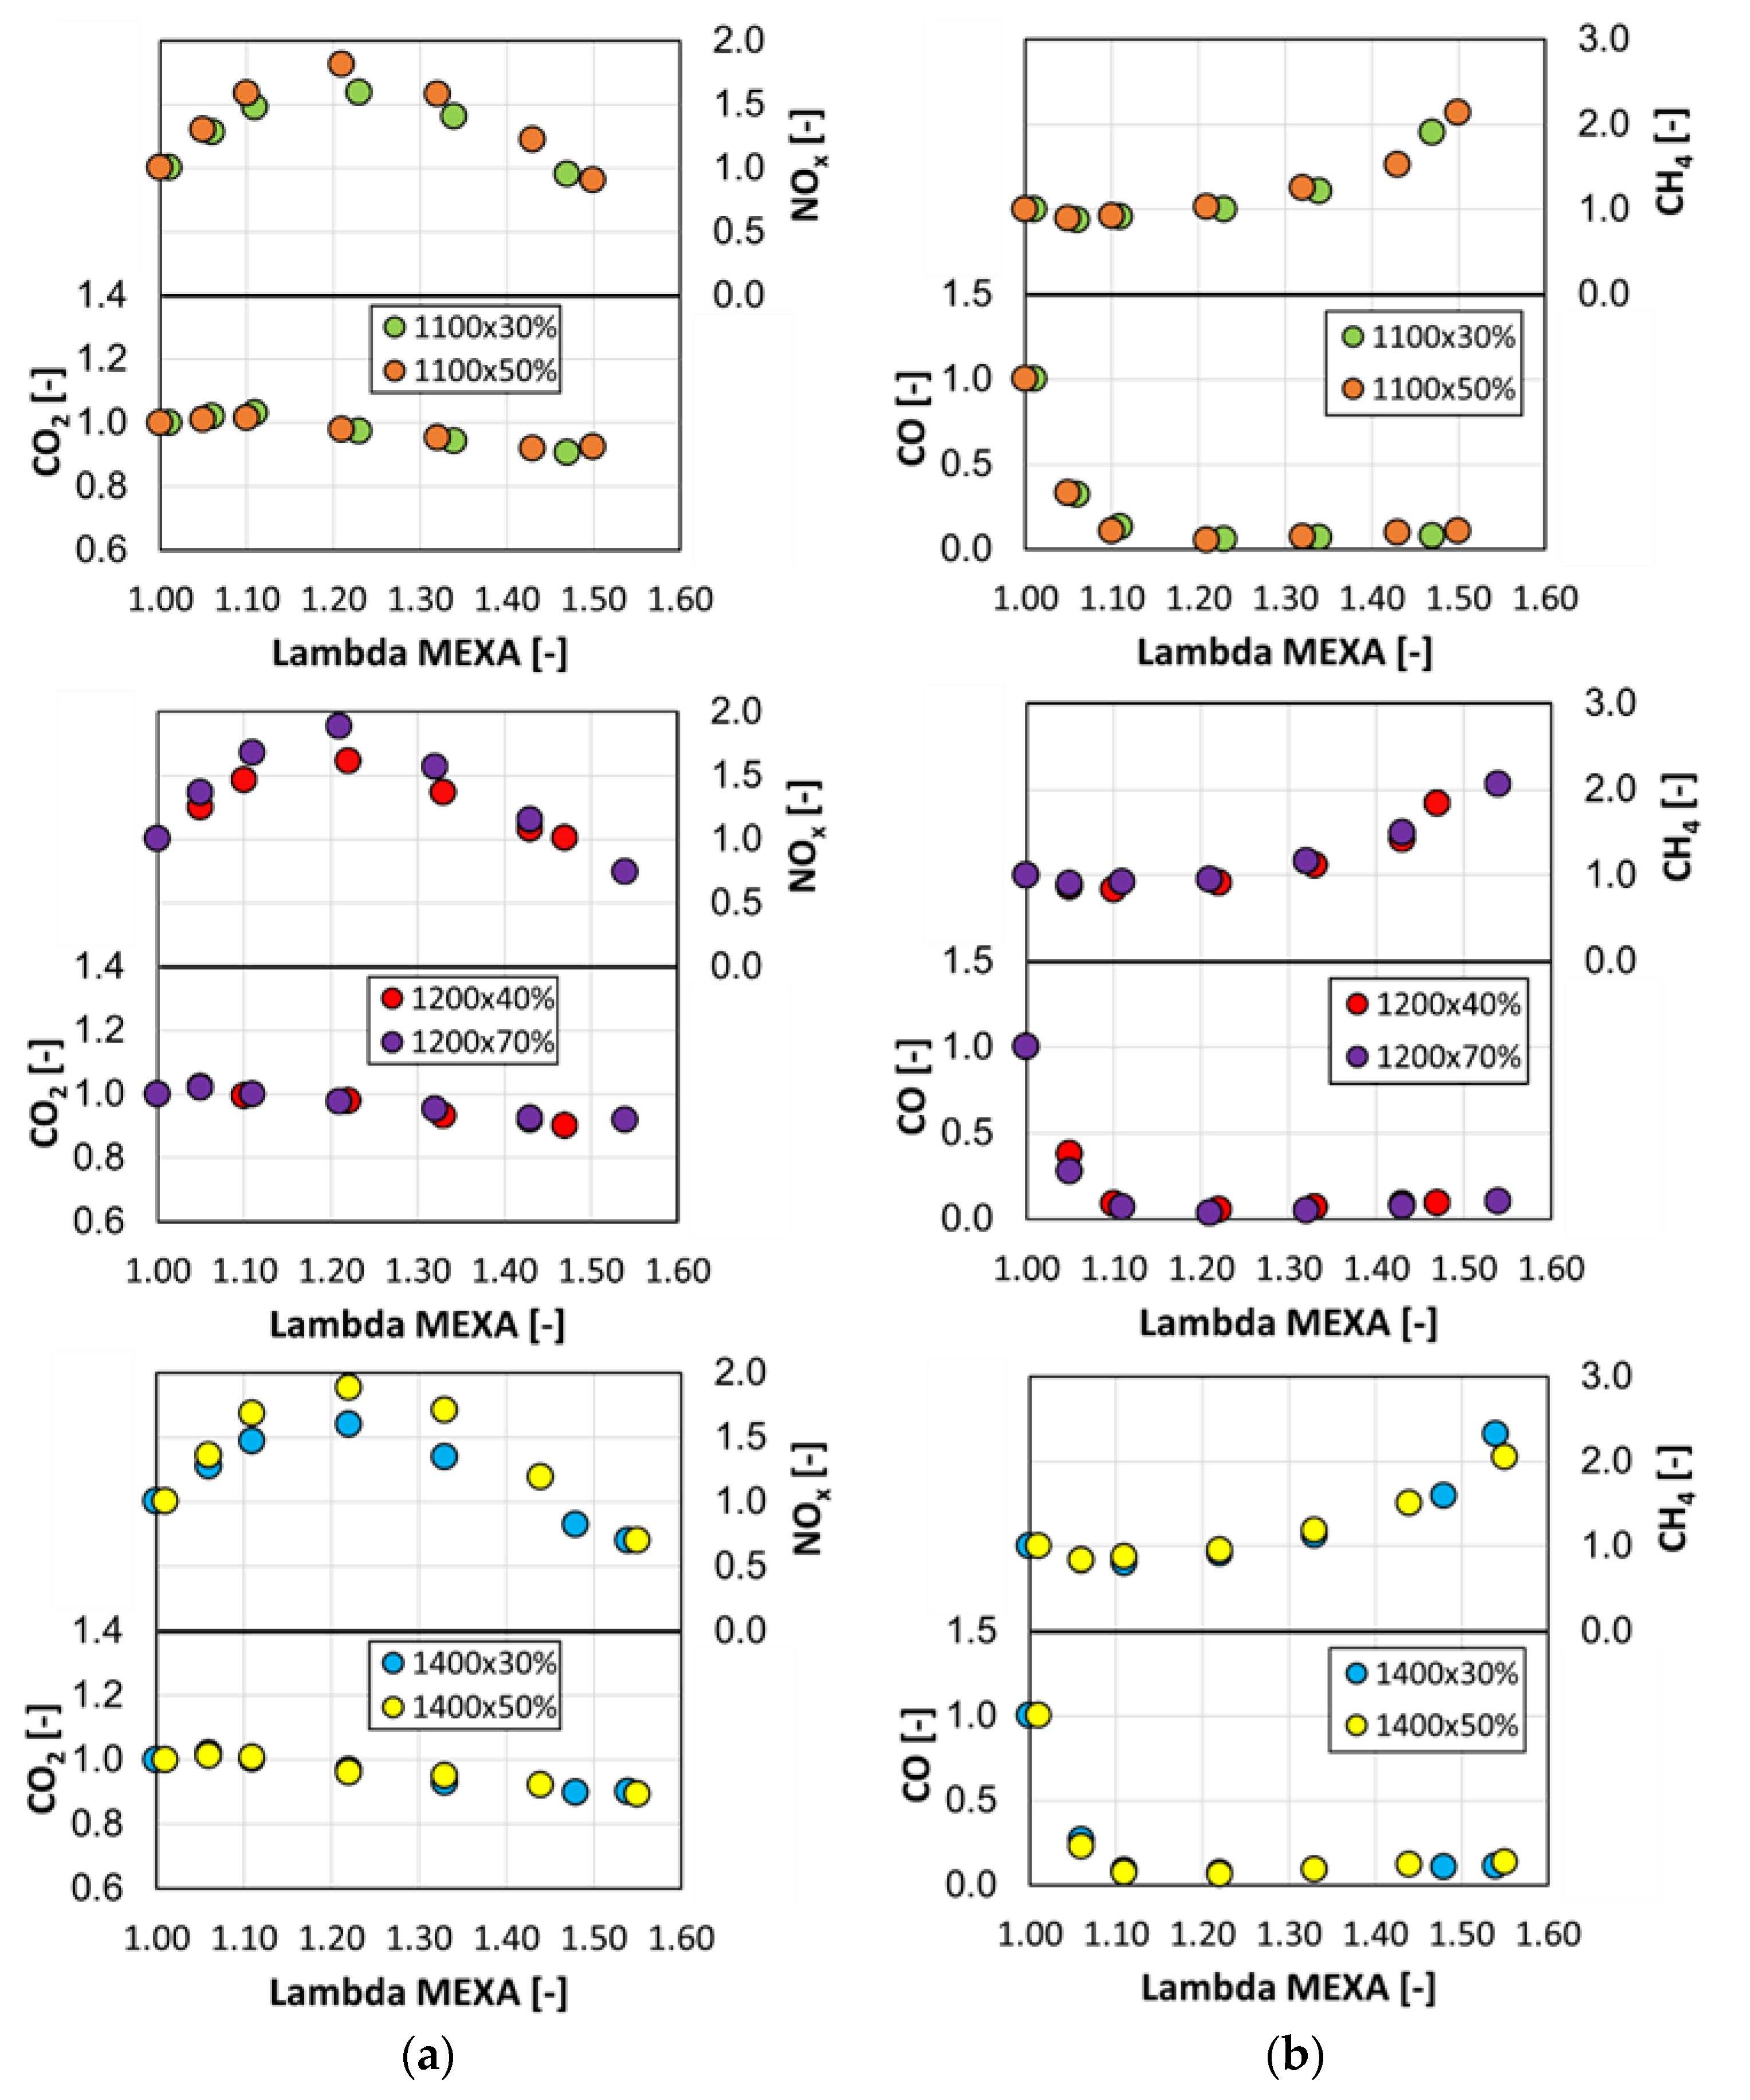
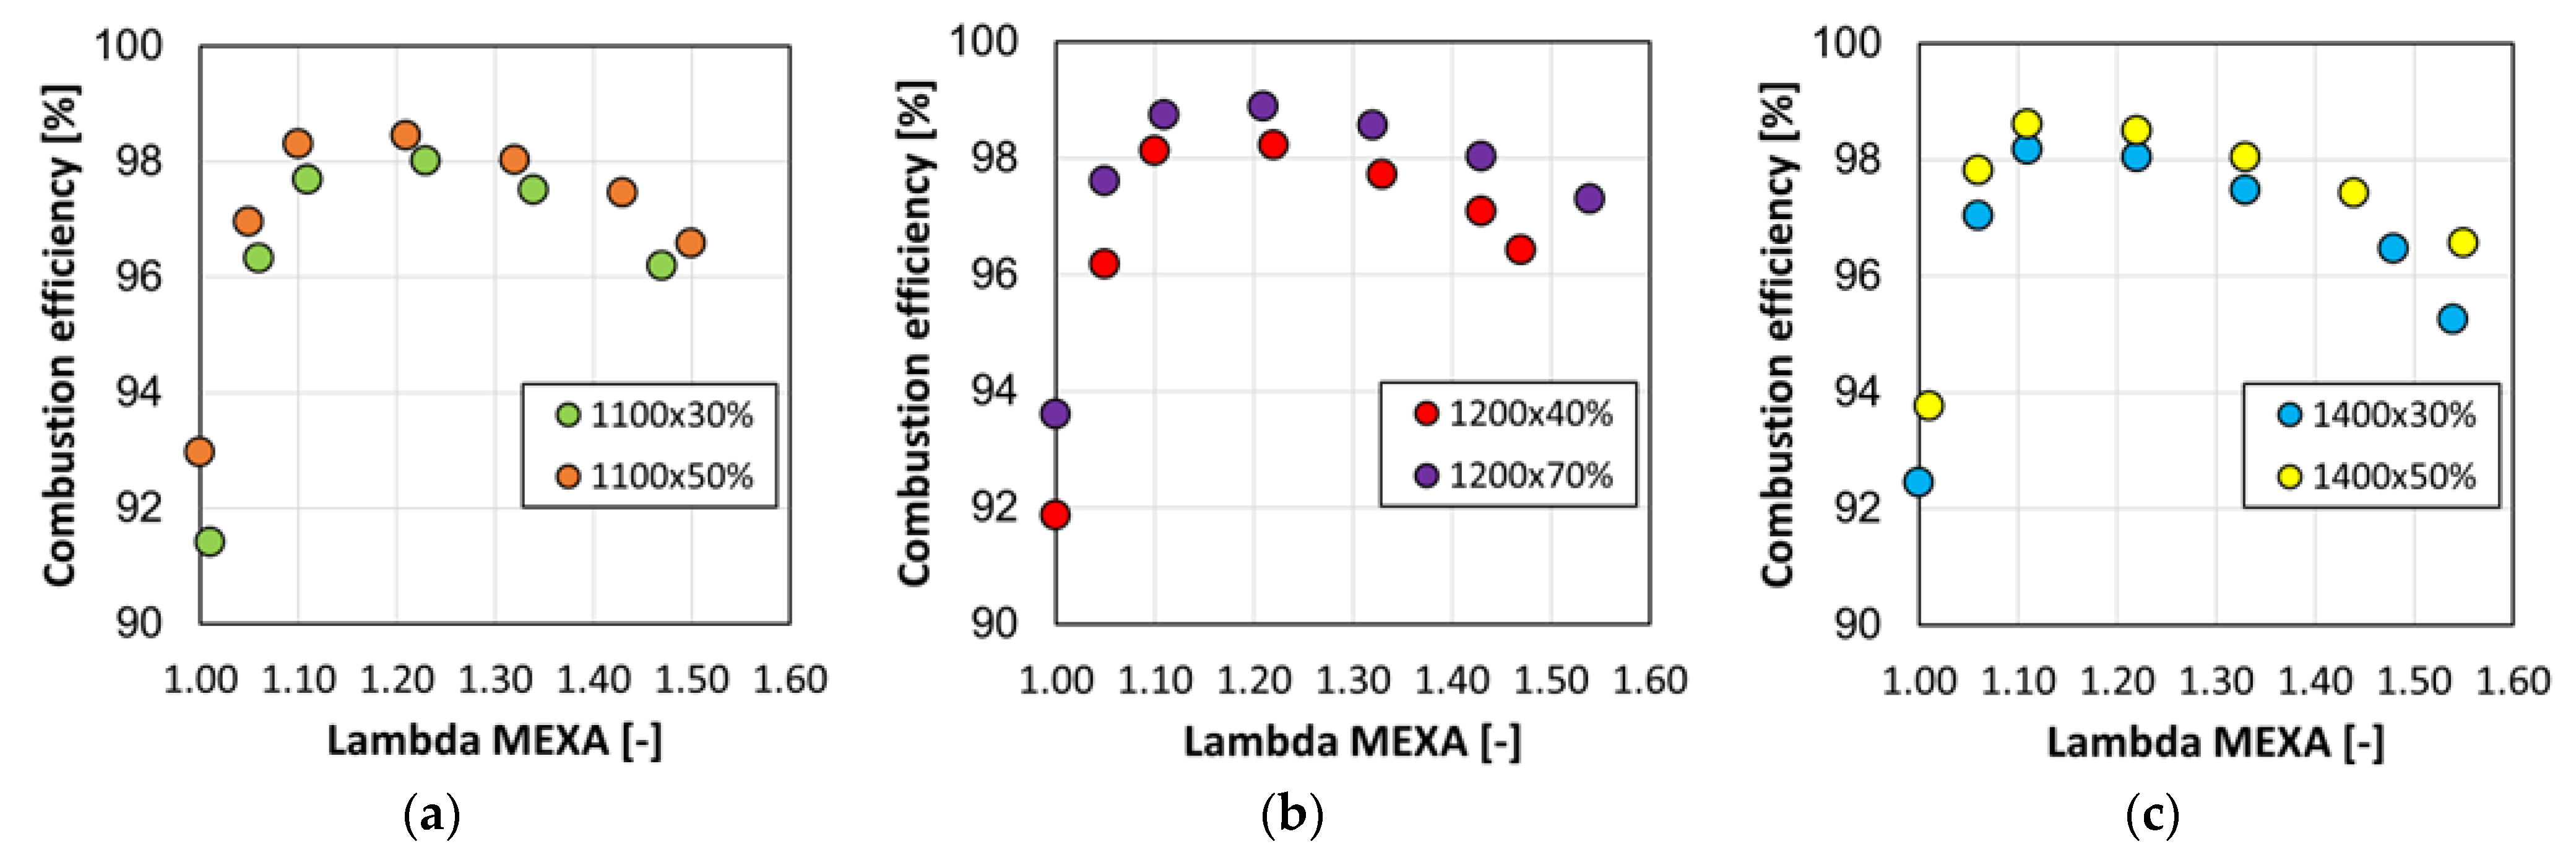
3.1. Lean Combustion Campaign Results
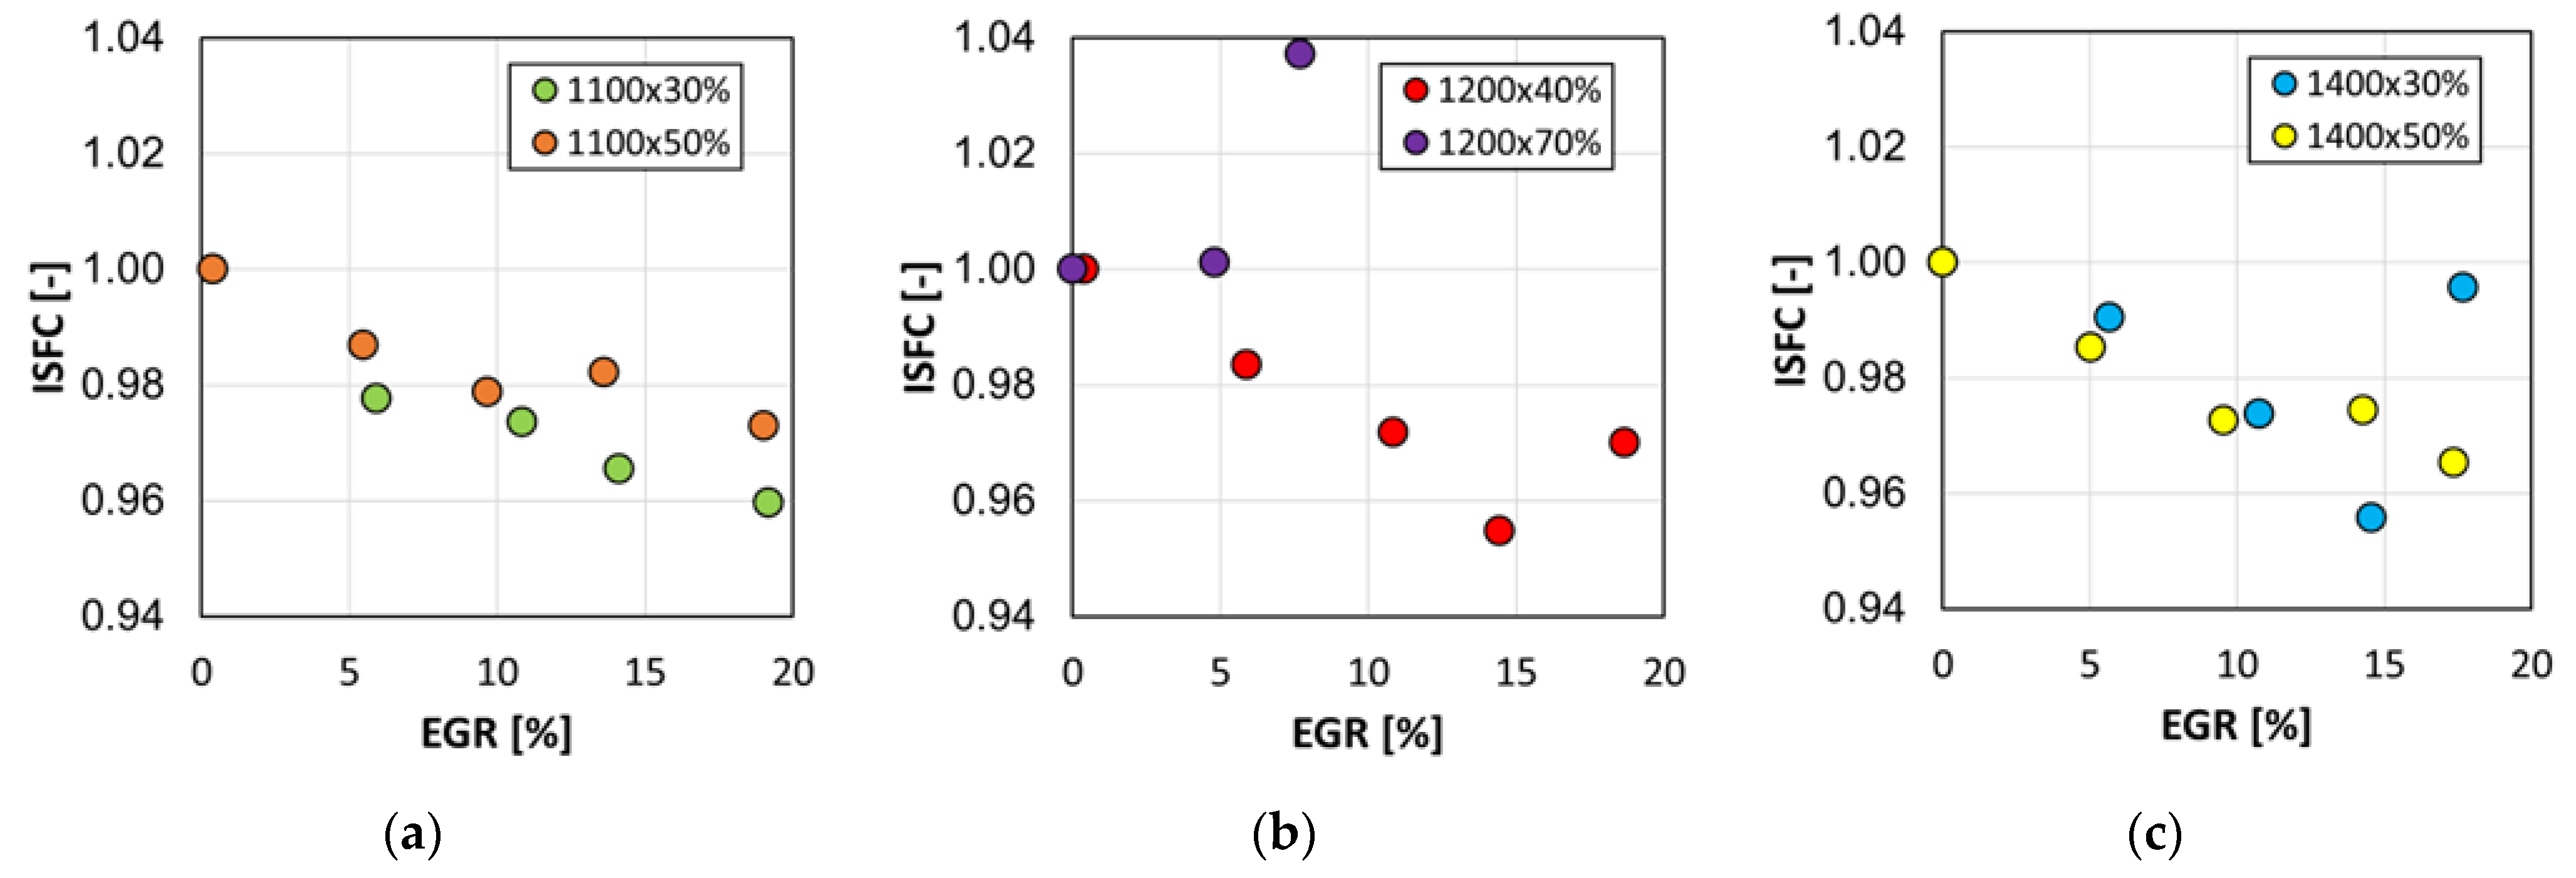
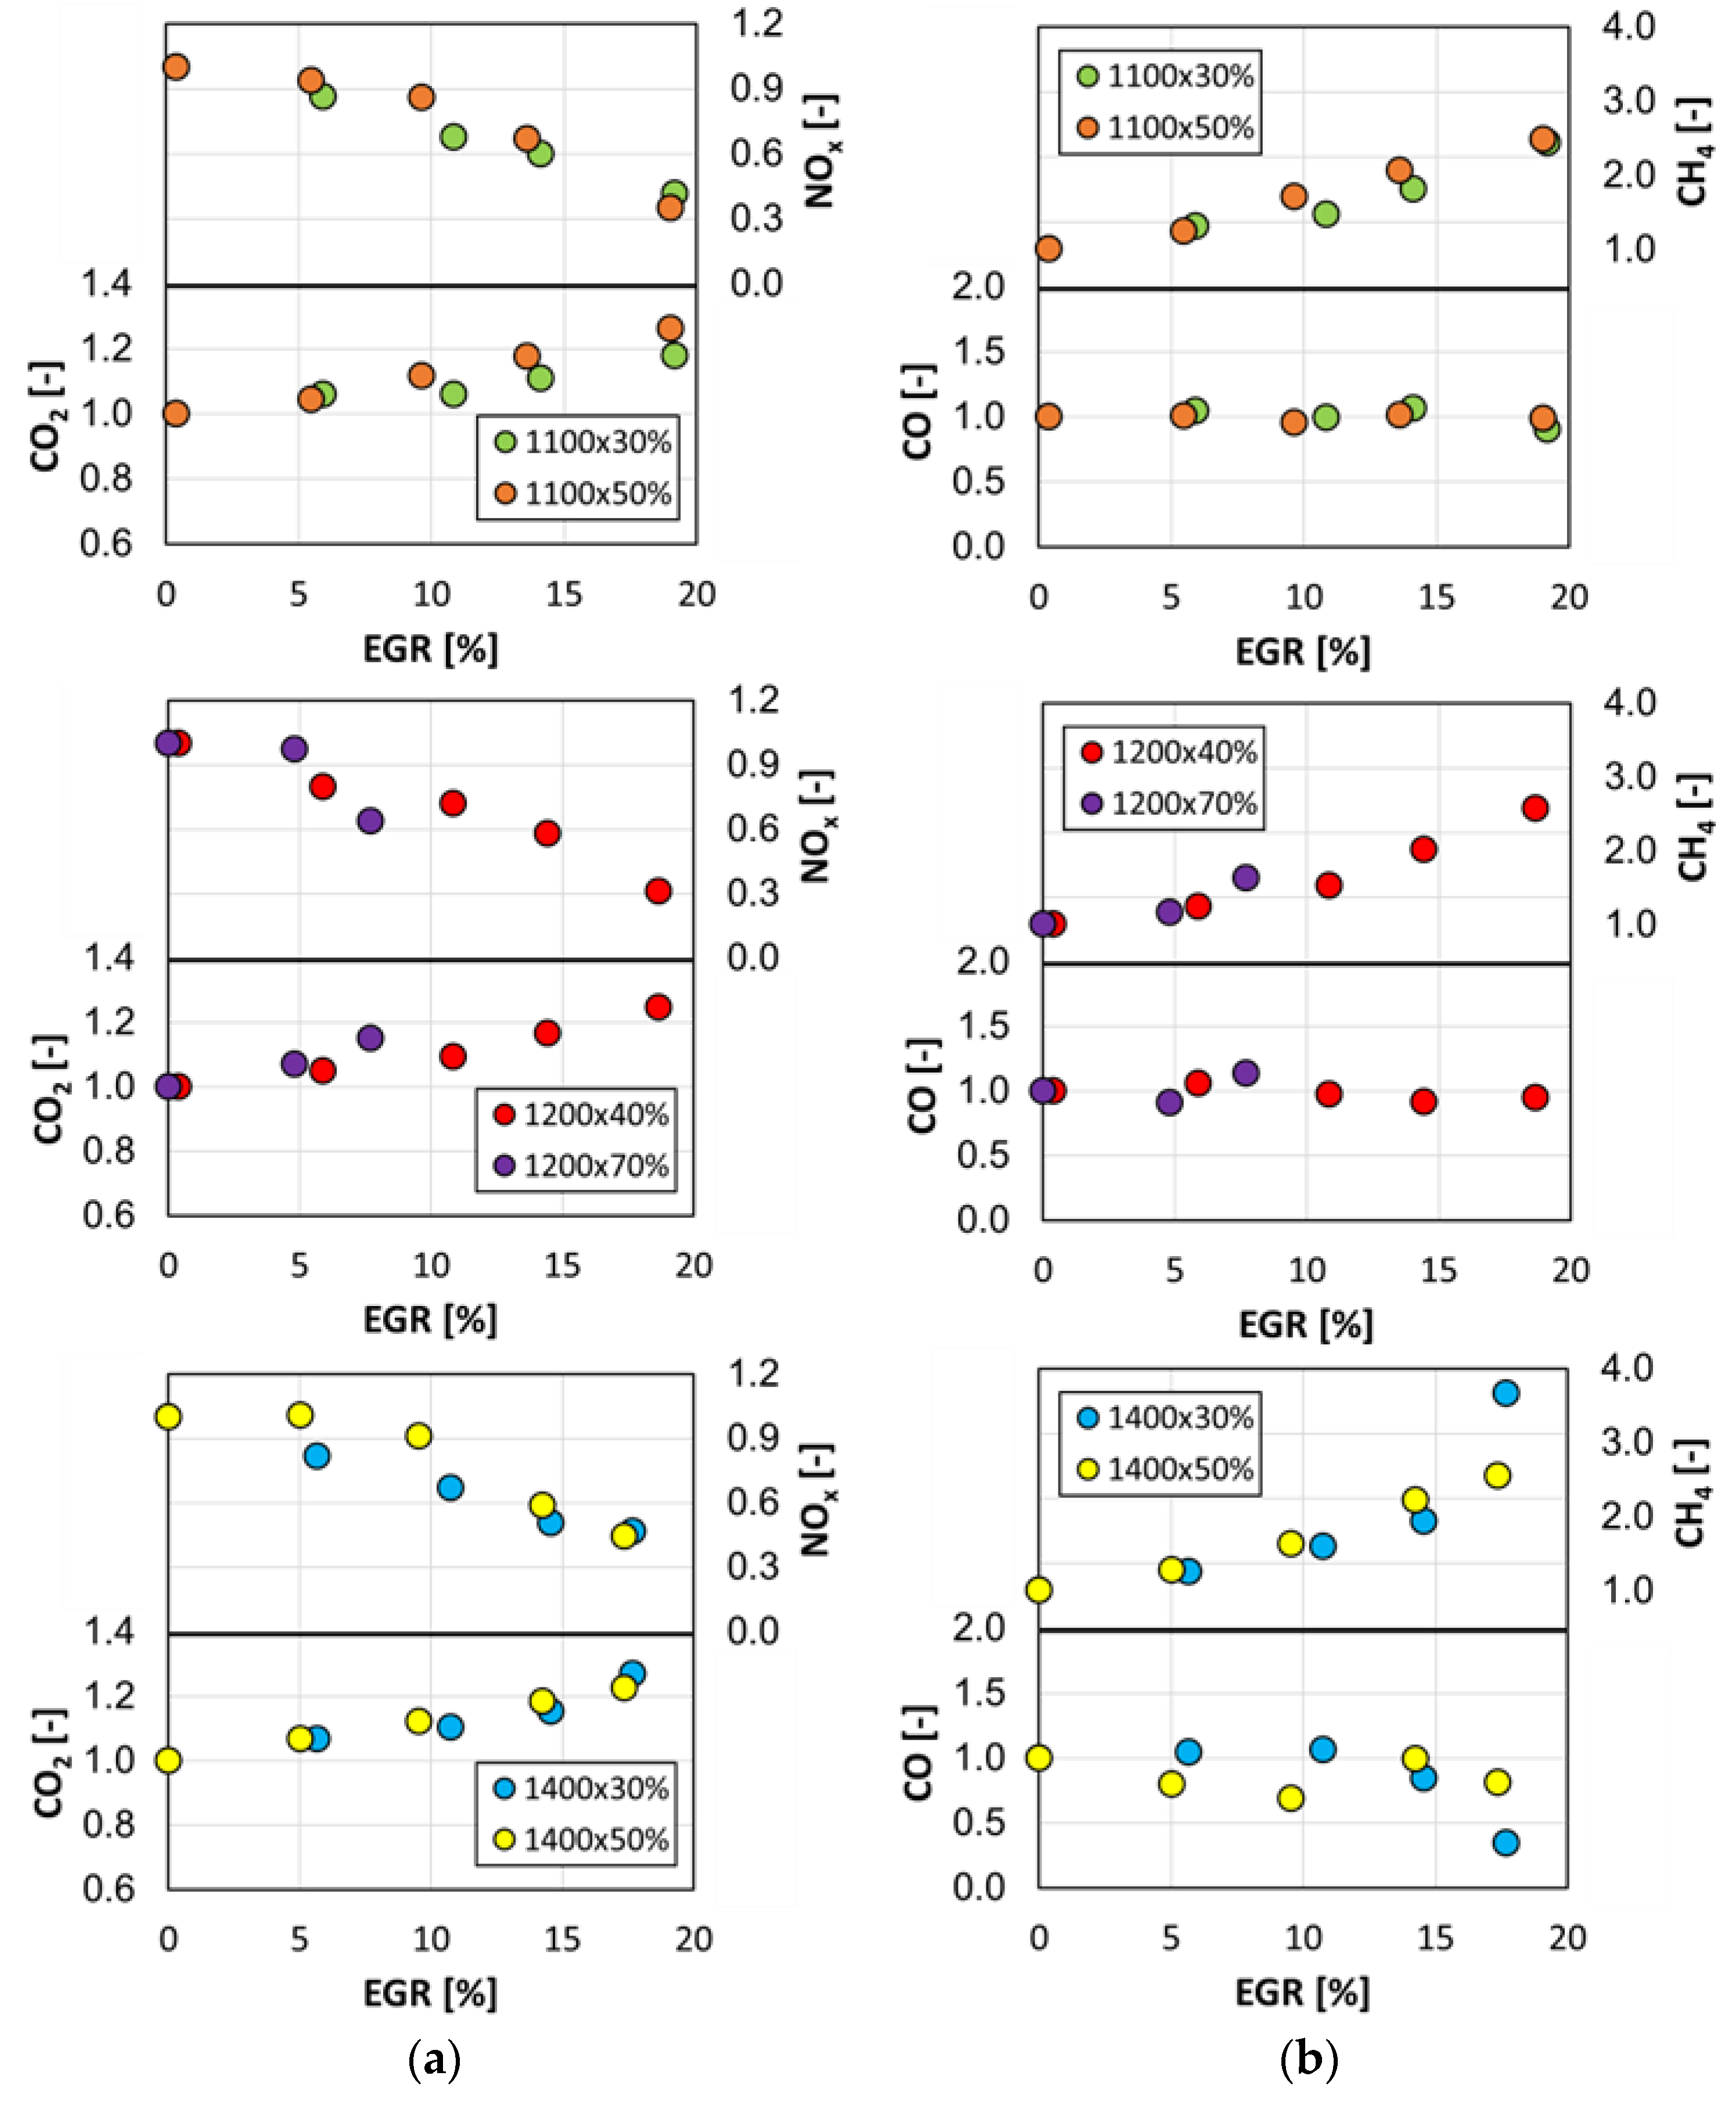
3.2. EGR Combustion Campaign Results
4. Conclusions
Author Contributions
Funding
Data Availability Statement
Acknowledgments
Conflicts of Interest
Abbreviations
| ATS | After-Treatment System |
| CBM | Compressed Bio-Methane |
| CH4 | Methane |
| CO | Carbon Monoxide |
| CO2 | Carbon Dioxide |
| COVIMEP | Coefficient Of Variation of Indicated Mean Effective Pressure |
| EGR | Exhaust Gas Recirculation |
| EU | European Union |
| GHG | GreenHouse Gas |
| GWP | Global Warming Potential |
| H/C | Hydrogen-to-Carbon |
| HD | Heavy-Duty |
| HP | High-Pressure |
| HR | Heat Release |
| IMEP | Indicated Mean Effective Pressure |
| ISFC | Indicated Specific Fuel Consumption |
| LBM | Liquefied Bio-Methane |
| LNG | Liquified Natural Gas |
| MBF | Mass Burned Fraction |
| MBF50 | Combustion Barycentre |
| MON | Motor Octane Number |
| NG | Natural Gas |
| NOx | Nitrogen Oxides |
| O2 | Oxygen |
| PFI | Port Fuel Injection |
| PFP | Peak Firing Pressure |
| RoHR | Rate of Heat Release |
| RPM | Rounds Per Minute |
| SCE | Single-Cylinder Engine |
| SI | Spark Ignition |
| THC | Total Hydrocarbon |
| TWC | Three-Way Catalyst |
| UEGO | Universal Exhaust Gas Oxygen |
| WtW | Wheel to Wheel |
| λ | Air-to-fuel ratio |
| γ | Heat Capacity Ratio |
References
- Beyer, A.; Di Domenico, D.; Beatrice, C.; Casal Kulzer, A. High-pressure direct injection as enabling technology for high-power density hydrogen SI engines: Experimental analysis of the influence of jet-guided combustion regimes on efficiency and abnormal combustion. Energy Convers. Manag. 2025, 326, 119497. [Google Scholar] [CrossRef]
- Zuo, Q.; Yang, D.; Shen, Z.; Chen, W.; Lu, C.; Chen, L.; Lei, S. Effect of premixed ratio on combustion and emission characteristics in a spark ignition engine with hydrogen-ammonia direct injection. Fuel 2025, 393, 135051. [Google Scholar] [CrossRef]
- Prussi, M.; Yugo, M.; De Prada, L.; Padella, M.; Edwards, R. JEC Well-To-Wheels Report v5; EUR 30284 EN; Publications Office of the European Union: Luxembourg, 2020; ISBN 978-92-76-20109-0. [Google Scholar] [CrossRef]
- Gupta, S.K.; Mittal, M. Effect of Compression Ratio on the Performance and Emission Characteristics, and Cycle-to-Cycle Combustion variations of a Spark-Ignition Engine Fueled with Bio-methane Surrogate. Appl. Therm. Eng. 2019, 148, 1440–1453. [Google Scholar] [CrossRef]
- O’Shea, R.; Wall, D.M.; Kilgallon, I.; Browne, J.D.; Murphy, J.D. Assessing the total theoretical, and financially viable, resource of biomethane for injection to a natural gas network in a region. Appl. Energy 2017, 188, 237–256. [Google Scholar] [CrossRef]
- Napolitano, P.; Di Domenico, D.; Di Maio, D.; Guido, C.; Golini, S. Ultra-Fine Particle Emissions Characterization and Reduction Technologies in a NG Heavy Duty Engine. Atmosphere 2022, 13, 1919. [Google Scholar] [CrossRef]
- Karavalakis, G.; Hajbabaei, M.; Jiang, Y.; Yang, J.; Johnson, K.C.; Cocker, D.R.; Durbin, T.D. Regulated, greenhouse gas, and particulate emissions from lean-burn and stoichiometric natural gas heavy-duty vehicles on different fuel compositions. Fuel 2016, 175, 146–156. [Google Scholar] [CrossRef]
- Duan, X.; Li, Y.; Liu, J.; Guo, G.; Fu, J.; Zhang, Q.; Zhang, S.; Liu, W. Experimental study the effects of various compression ratios and spark timing on performance and emission of a lean-burn heavy-duty spark ignition engine fueled with methane gas and hydrogen blends. Energy 2019, 169, 558–571. [Google Scholar] [CrossRef]
- Thiruvengadam, A.; Besch, M.; Padmanaban, V.; Pradhan, S.; Demirgok, B. Natural gas vehicles in heavy-duty transportation-A review. Energy Policy 2018, 122, 253–259. [Google Scholar] [CrossRef]
- Henke, I.; Cartenì, A.; Beatrice, C.; Di Domenico, D.; Marzano, V.; Patella, S.M.; Picone, M.; Tocchi, D.; Cascetta, E. Fit for 2030? Possible scenarios of road transport demand, energy consumption and greenhouse gas emissions for Italy. Transp. Policy 2024, 159, 67–82. [Google Scholar] [CrossRef]
- Kiga, S.; Moteki, K.; Kojima, S. Features of the World’s First Multi-Link Variable Compression Ratio System and its Actuator in the New Nissan VC-Turbo Engine. In Proceedings of the 26th Aachen Colloquium Automobile and Engine Technology 2017, Aachen, Germany, 9–11 October 2017. [Google Scholar]
- Hoppe, F.; Thewes, M.; Baumgarten, H.; Dohmen, J. Water injection for gasoline engines: Potentials, challenges, and solutions. Int. J. Engine Res. 2016, 17, 86–96. [Google Scholar] [CrossRef]
- Stobart, R.K.; Wijewardane, A.; Allen, C. The Potential for Thermo-Electric Devices in Passenger Vehicle Applications. In SAE 2010 World Congress & Exhibition; 2010-01-0833; SAE International: Warrendale, PA, USA, 2010. [Google Scholar] [CrossRef]
- Randolph, E.; Fieseler, K.; Conway, G.; Alger, T. The Effects of EGR Composition on Combustion Performance and Efficiency. SAE Int. J. Adv. Curr. Pract. Mobil. 2021, 3, 250–261. [Google Scholar] [CrossRef]
- Yin, X.; Li, W.; Zhang, W.; Lv, X.; Yang, B.; Wang, Y.; Zeng, K. Experimental analysis of the EGR rate and temperature impact on combustion and emissions characteristics in a heavy-duty NG engine. Fuel 2022, 310, 122394. [Google Scholar] [CrossRef]
- Zhang, Q.; Li, M.; Li, G.; Shao, S.; Li, P. Transient emission characteristics of a heavy-duty natural gas engine at stoichiometric operation with EGR and TWC. Energy 2017, 132, 225–237. [Google Scholar] [CrossRef]
- Zhang, Q.; Xu, Z.; Li, M.; Shao, S. Combustion and emissions of a Euro VI heavy-duty natural gas engine using EGR and TWC. J. Nat. Gas Sci. Eng. 2016, 28, 660–671. [Google Scholar] [CrossRef]
- Li, Y.; Wang, P.; Wang, S.; Liu, J.; Xie, Y.; Li, W. Quantitative investigation of the effects of CR, EGR and spark timing strategies on performance, combustion and NOx emissions characteristics of a heavy-duty natural gas engine fueled with 99% methane content. Fuel 2019, 255, 115803. [Google Scholar] [CrossRef]
- Durret, R. Opportunities and Challenges of Lean Combustion in Automotive IC Engines; GM Global R&D: Detroit, MI, USA, 2020; Available online: https://it.scribd.com/document/404591558/symp13-Durrett (accessed on 23 March 2025).
- Heywood, J.B. Internal Combustion Engine Fundamentals; McGraw-Hill: New York, NY, USA, 1988. [Google Scholar]
- Liu, J.; Ulishney, C.J.; Dumitrescu, C.E. Experimental investigation of a heavy-duty natural gas engine performance operated at stoichiometric and lean operations. Energy Convers. Manag. 2021, 243, 114401. [Google Scholar] [CrossRef]
- Cho, H.M.; He, B.-Q. Combustion and Emission Characteristics of a Natural Gas Engine under Different Operating Condition. Environ. Eng. Res. 2009, 14, 95–101. [Google Scholar] [CrossRef]
- Einewall, P.; Tunestål, P.; Johansson, B. Lean Burn Natural Gas Operation vs. Stoichiometric Operation with EGR and a Three Way Catalyst; SAE Technical Paper 2005-01-0250; SAE International: Warrendale, PA, USA, 2005. [Google Scholar] [CrossRef]
- Hutter, R.; De Libero, L.; Elbert, P.; Onder, C.H. Catalytic methane oxidation in the exhaust gas aftertreatment of a lean-burn natural gas engine. Chem. Eng. J. 2018, 349, 156–167. [Google Scholar] [CrossRef]
- Lott, P.; Casapu, M.; Grunwaldt, J.-D.; Deutschmann, O. A review on exhaust gas after-treatment of lean-burn natural gas engines—From fundamentals to application. Appl. Catal. B Environ. 2024, 340, 123241. [Google Scholar] [CrossRef]
- Leyko, J.; Słobiński, K.; Jaworski, J.; Mitukiewicz, G.; Bou Nader, W.; Batory, D. Study on SI Engine Operation Stability at Lean Condition—The Effect of a Small Amount of Hydrogen Addition. Energies 2023, 16, 6659. [Google Scholar] [CrossRef]
- Muncrief, R.; Sharpe, B. Overview of the Heavy-Duty Vehicle Market and CO2 Emissions in the European Union; The International Council on Clean Transportation: Washington, DC, USA, 2015; Available online: https://theicct.org/wp-content/uploads/2021/06/ICCT_EU-HDV_mkt-analysis_201512.pdf (accessed on 23 March 2025).


| Engine Type | Single Cylinder |
|---|---|
| Displacement | 2147 cm3 |
| Bore | 135 mm |
| Stroke | 150 mm |
| Valves per cylinder | 4 |
| Compression ratio | 11.9 |
| Combustion chamber type | Bowl-in piston and flat head |
| Ignition | Inductive discharge + spark plug |
| Injection | Port Fuel at 8 bar |
| Emission Species | Range | Linearity/Accuracy |
|---|---|---|
| CO | 0–10% | <1% |
| CO2 | 0–20% | 1% |
| O2 | 0–25% | 0.5% |
| NOx | 0–5000 ppm | <1% |
| THC | 0–10,000 ppm | 0.5% |
| RPM | Load [%] | Testing Methodology |
|---|---|---|
| 1100 | 30 |
Threshold to identify dilution limit:
|
| 1100 | 50 | |
| 1200 | 40 | |
| 1200 | 70 | |
| 1400 | 30 | |
| 1400 | 50 |
Disclaimer/Publisher’s Note: The statements, opinions and data contained in all publications are solely those of the individual author(s) and contributor(s) and not of MDPI and/or the editor(s). MDPI and/or the editor(s) disclaim responsibility for any injury to people or property resulting from any ideas, methods, instructions or products referred to in the content. |
© 2025 by the authors. Licensee MDPI, Basel, Switzerland. This article is an open access article distributed under the terms and conditions of the Creative Commons Attribution (CC BY) license (https://creativecommons.org/licenses/by/4.0/).
Share and Cite
Di Domenico, D.; Napolitano, P.; Di Maio, D.; Beatrice, C. Assessment of Charge Dilution Strategies to Reduce Fuel Consumption in Natural Gas-Fuelled Heavy-Duty Spark Ignition Engines. Energies 2025, 18, 2072. https://doi.org/10.3390/en18082072
Di Domenico D, Napolitano P, Di Maio D, Beatrice C. Assessment of Charge Dilution Strategies to Reduce Fuel Consumption in Natural Gas-Fuelled Heavy-Duty Spark Ignition Engines. Energies. 2025; 18(8):2072. https://doi.org/10.3390/en18082072
Chicago/Turabian StyleDi Domenico, Davide, Pierpaolo Napolitano, Dario Di Maio, and Carlo Beatrice. 2025. "Assessment of Charge Dilution Strategies to Reduce Fuel Consumption in Natural Gas-Fuelled Heavy-Duty Spark Ignition Engines" Energies 18, no. 8: 2072. https://doi.org/10.3390/en18082072
APA StyleDi Domenico, D., Napolitano, P., Di Maio, D., & Beatrice, C. (2025). Assessment of Charge Dilution Strategies to Reduce Fuel Consumption in Natural Gas-Fuelled Heavy-Duty Spark Ignition Engines. Energies, 18(8), 2072. https://doi.org/10.3390/en18082072