Abstract
This study develops and validates a three-dimensional CFD model for a 12 L large-bore active-type pre-chamber spark-ignition (PCSI) engine fueled by natural gas. The model incorporates an advanced Extended Coherent Flamelet Model (ECFM-3Z) with a tuned stretch factor to capture complex turbulence–flame interactions, flame propagation, and pollutant formation under ultra-lean conditions. By systematically varying pre-chamber geometries—specifically the orifice diameter, cone angle, diverging tapered nozzle, and volume—the simulations assess their effects on combustion dynamics, heat release rates, turbulent jet penetration, and emissions (NOx and CO). Model predictions of in-cylinder and pre-chamber pressure profiles, combustion phasing, and emission trends are validated against experimental data. The results demonstrate that optimizing pre-chamber and orifice configurations enhances turbulent mixing, accelerates flame development, and reduces local high-temperature zones, thereby suppressing NOx and CO formation. Although some discrepancies in NOx predictions persist due to limitations in current turbulence–chemistry models, the findings offer valuable insights for the design of high-efficiency, low-emission PCSI engines.
1. Introduction
The global focus on clean and efficient combustion has positioned pre-chamber spark-ignition (PCSI) engines as a key technology for high thermal efficiency and low emissions, especially with compressed natural gas (CNG) [1,2,3,4,5,6]. PCSI engines enhance combustion stability, fuel–air mixing, and temperature uniformity, reducing NOx emissions compared to conventional spark-ignition systems [7,8,9]. However, optimizing turbulence, chemical kinetics, and combustion interactions remains challenging, necessitating advanced numerical simulations [9,10,11].
PCSI engines face combustion stability and emission control challenges, particularly in large-bore applications, where conventional ignition struggles with complete combustion [1,2,3,4,10]. Computational Fluid Dynamics (CFD) provides detailed combustion insights, reducing reliance on experimental methods. Kirkpatrick et al. [1] demonstrated CFD’s capability in modeling fuel injection, combustion, and flame propagation, while pre-chamber technology mitigates CNG’s lower flame speeds and turbulence issues in Miller cycle engines [2,10].
CFD modeling for gas-fueled pre-chamber engines has evolved from 2D to advanced 3D simulations, improving predictive accuracy. Studies [11,12,13] have validated CFD models’ reliability in combustion analysis, and Winter et al. [4] highlighted CFD’s role in mixing optimization and combustion enhancement. These advancements enable precise ignition delay predictions, air–fuel mixture optimization, and pollutant formation assessment in gas-fueled engines. Recent advancements in CFD modeling have shifted toward highly sophisticated three-dimensional approaches incorporating detailed chemical reaction mechanisms and advanced turbulence–flame interaction related models. A detailed account of the CFD model and an extensive review of the various modeling techniques reported in the literature are provided in references [10,14]. Methods such as Large Eddy Simulation (LES) and Direct Numerical Simulation (DNS) provide deeper insights into critical phenomena, including jet ignition dynamics, flame quenching, stratified mixture formation, and pollutant generation [14,15,16,17]. Additionally, studies on methane-fueled turbulent jet ignition systems emphasize the significance of adaptive mesh refinement (AMR) techniques in accurately resolving pre-chamber orifice flow structures and combustion processes [2,3,5,12,14]. As a result, detailed CFD analyses enabled the aforementioned studies to clarify the interaction between combustion and turbulence in PCSI engines, thereby enhancing our understanding of the system’s characteristics and inherent limitations. Until now, CFD analysis techniques have been utilized in the design of PCSI engines to optimize pre-chamber volume, orifice diameter, injected fuel mass, and spark timing for lean combustion [5,6,13,14,15,18,19,20,21,22,23]. These studies have also aimed to elucidate the trade-offs between pre-chamber volume and nozzle area in terms of scavenging efficiency, combustion efficiency, and emissions. This involves the complex interactions influencing turbulence generation, fuel–air mixing, flame propagation, and pollutant formation. Recently, several noteworthy studies related to CFD have emerged, including the following. Bigalli et al. [5] conducted comprehensive numerical investigations of various passive pre-chamber geometries using detailed chemistry solvers, demonstrating that optimizing pre-chamber design significantly improves combustion efficiency and reduces emissions. Advanced modeling techniques have also facilitated the detailed analysis of spark timing effects. For instance, Xue et al. [6] showed how variations in spark timing influence turbulent jet characteristics and the overall engine performance in lean-burn natural gas engines. These developments have enhanced simulations of hydrogen and CNG fuels, though challenges such as high computational costs and model validation persist. Xu et al. [15] also focused on the effects of spark timing and the pre-chamber global equivalence ratio on turbulent jet ignition behavior, using a detailed CFD model with a reduced methane mechanism and an LES turbulence model.
Despite these advancements, significant challenges remain in developing comprehensive, experimentally validated CFD models tailored for large-bore CNG PCSI engines, because the ignition mechanism in the main chamber induced by the turbulent hot jets arising from the nozzles is profoundly different from conventional turbulent premixed flame development [14,15,17]. One of the most significant characteristics of PCSI engines is their multi-mode combustion behavior. Previous studies [10,14,24,25,26] have well documented that, in PCSI engines, turbulent lean premixed flames exhibit an expanded reaction zone as the Reynolds number increases and the Karlovitz number exceeds unity (Ka > 1), with certain regions showing particularly extensive reaction zones. In PCSI engines, the primary combustion regimes are the flamelet and Thin Reaction Zone (TRZ) regimes, both of which correspond to turbulent flames characterized by moderate to high Karlovitz numbers. However, nearly all studies to date that have examined the combustion characteristics of PCSI engines using CFD techniques have relied on combustion models based on the assumptions of the flamelet regime—where the quasi-steady laminar flame structure, typically observed in the corrugated flamelet regime, is disrupted. As a result, these models struggle to accurately capture the combustion behavior in medium- and high-Karlovitz-number regimes. Therefore, in the absence of a numerical model capable of accurately representing the physics of turbulent jet ignition combustion, several recent studies have attempted an alternative approach. These efforts involve the ad hoc tuning of model constants associated with large- and small-scale turbulence enhancements, as well as the flame stretch factor, by comparing them with experimental data. Through this approach, existing flamelet-based combustion models have been adapted and improved for application in the combustion analysis of PCSI engines [10,14,26,27]. However, these approaches may not sufficiently align numerical simulations with experimental data in both the pre-chamber and main combustion chamber [10,14,26]. To address the limitations of RANS-based turbulence and flamelet-based combustion models in capturing turbulence–flame interactions, studies have focused on refining the model coefficients governing combustion speed and burn rate.
Notwithstanding these developments in CFD methodologies, a key limitation of numerical models is their accuracy in predicting emissions in PCSI engines. This is critical, as PCSI technology in large-bore natural gas engines aims to extend the lean-burn limit while reducing NOx emissions. Extensive CFD-based investigations have analyzed the effects of pre-chamber design parameters—such as the number of orifices, diameter, inclination angle, and volume—on NOx formation [19,20,28]. Additionally, CFD models have provided insights into pre-chamber combustion physics and chemistry, which are difficult to capture experimentally [12,29]. However, the experimental validation of NOx predictions in pre- and main chamber chemical kinetics remains insufficient, highlighting the need for further empirical studies. Existing CFD frameworks often oversimplify the effects of residual gas interactions and omit secondary NOx formation pathways, such as prompt NO and the NNH mechanism. Moreover, these models typically require extensive geometry-specific calibration, limiting their generalizability. Variability in NOx prediction accuracy frequently arises from simplified representations of phenomena such as turbulence–flame interactions, residual gas effects, transient combustion dynamics, and ultra-lean operational conditions.
Recent advancements in numerical modeling have sought to address these challenges by integrating Computational Fluid Dynamics (CFD) with machine learning (ML) techniques [30,31]. Posch et al. [30] introduced an ML-based approach for pre-chamber design optimization, condensing 3D CFD simulations into simplified models for predicting pressure differentials and NOx levels. While achieving <10% deviation, this method relied on trend analysis rather than absolute performance predictions due to condensed simulation data limitations. To address these challenges, the further refinement of high-fidelity CFD–ML hybrid models is essential to enhance their scalability and accuracy. Future research should focus on improving transient condition predictions, enabling models to capture real-world variations in load and speed. This advancement is crucial for optimizing PCSI engine performance while reducing computational costs and ensuring robust emission predictions.
Recently, 0D/1D modeling approaches have been used to efficiently simulate pre-chamber spark-ignition (PCSI) engines, capturing global combustion, emissions, and heat transfer characteristics at a fraction of the computational cost of 3D CFD simulations [3,32]. These models enable fast parametric studies, but lack detailed turbulence–chemistry interactions and rely on empirical correlations, limiting their generalizability. To improve their accuracy, a hybrid strategy is emerging, where 1D models are calibrated using CFD-derived turbulence and combustion parameters [3]. Additionally, 0D/1D models facilitate rapid optimization, while 3D CFD refines key configurations [32].
Even with these notable improvements, several limitations persist in existing models, including insufficient experimental validation for large-bore engines and limited studies on multi-fuel applications. Until now, CFD studies on PCSI engines utilizing natural gas as a fuel have been limited to engines with displacements ranging from 0.5 L to 6 L [18,19,21,22,32,33]. Only recently has a CFD-based numerical study been conducted to examine the effects of nozzle diameter, hole number, and hole orientation on the combustion and scavenging characteristics of a 12 L passive-type PCSI large-bore CNG engine [20]. As widely recognized, the implementation of the pre-chamber spark-ignition (PCSI) combustion method in large-displacement engines poses considerable challenges due to increased combustion chamber volume, prolonged flame propagation distances, and greater heat transfer losses, all of which impact combustion efficiency and stability. Ensuring a uniform fuel distribution and stable ignition timing becomes more difficult, leading to combustion instability and efficiency losses. Additionally, reduced charge motion and inadequate jet penetration hinder complete combustion, while higher in-cylinder pressures increase knock tendencies. Scaling PCSI technology requires optimized pre-chamber design, injector placement, and ignition control. Addressing these challenges necessitates advanced CFD simulations and refined combustion strategies to enhance performance and efficiency in large-displacement engines.
As described earlier, several limitations persist in existing CFD models for PCSI engines, particularly in active-type large-bore PCSI applications, including insufficient experimental validation and limited studies on emissions and chemical kinetics. Therefore, this study aims to address these limitations by developing and validating a detailed three-dimensional CFD model specifically for 12 L large-bore active-type pre-chamber spark-ignition engines fueled by natural gas, a topic that has not been extensively studied. Particular emphasis is placed on practical applications and experimental validation to enhance model reliability. The work also integrates insights from various studies, including those from previous research [10,14,17,25,26,27], to enhance the understanding of ignition mechanisms and improve overall engine performance while reducing emissions. In this study, experimental data and a 0D/1D system-level simulation program were utilized to establish accurate initial and boundary conditions. To ensure precise combustion modeling, a well-tuned version of the ECFM-3Z model, refined through the experimental calibration of the stretch factor in a flamelet-based combustion model, was employed. Using this approach, the effects of pre-chamber orifice geometry and cone angle variations on the chemical processes and combustion characteristics within both the pre-chamber and main chamber of the target engine were analyzed. Additionally, the impact of these design variations on pollutant formation, specifically CO and NOx emissions, was examined in detail.
2. Experimental Set Up and Test Engine
2.1. Test Cell and Engine Specification
The pre-chamber combustion system investigated in this study was implemented in a turbocharged eight-cylinder port fuel injection (PFI) spark-ignition (SI) engine, incorporating turbulent jet ignition (TJI) technology from the Korea STX Engine Company (Changwon, Republic of Korea). Figure 1 provides a schematic representation of the engine configuration. To ensure homogeneous air–fuel mixing, the PFI system was positioned 353 mm upstream of the cylinder head within the intake manifold. The cylinder head featured four valves per cylinder with double overhead camshafts (DOHCs) to enhance cylinder filling and scavenging efficiency. A Miller cycle strategy with early intake valve closing was applied to reduce NOx emissions and improve thermal efficiency. The engine was coupled to a 3600 kW hydraulic dynamometer, controlled via a Horiba SPARCE dynamometer system (Horiba Ltd., Kyoto, Japan), under steady-state operating conditions. In PCSI engines, accurate in-cylinder pressure and temperature measurements are critical for analyzing combustion efficiency, turbulence–chemistry interactions, and cycle-to-cycle variations. To achieve precise measurements, high-resolution pressure sensors, fast-response temperature sensors, and advanced digital signal processing techniques are essential.
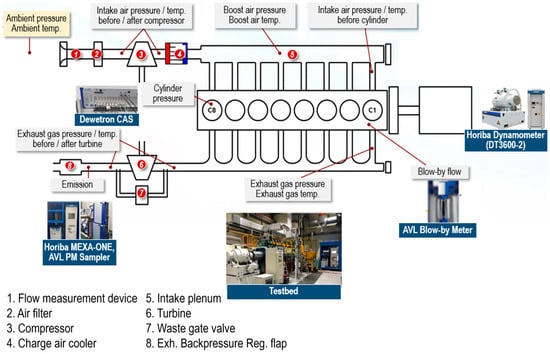
Figure 1.
Schematic diagram of the engine test setup.
In-cylinder pressure measurements and combustion analysis were conducted using a Dewetron combustion analyzer (DEWE-800-CA2, Dewetron GmbH, Graz, Austria) integrated with an AVL GU22C high-temperature pressure transducer (AVL List GmbH, Graz, Austria)—a 6.2 mm plug-type sensor designed for thermodynamic accuracy, meeting reference-class standards when combined with the PH04 flame arrestor (AVL List GmbH, Graz, Austria)—mounted directly in the engine head and connected via a charge amplifier (sensitivity: 34pC/bar, offset: −8 V, and filter: 100 kHz) to a PC-based acquisition system, featuring thermally optimized piezoelectric elements to prevent signal interference from mechanical contact with the mounting bore. A programmable encoder installed on the crankshaft accurately measured and provided real-time angular position data on the engine shaft to both the digital ignition controller and data acquisition system. This acquisition system concurrently recorded sensor signals, including cylinder pressure (via a charge amplifier), exhaust gas temperature, air–fuel ratio, and coolant temperature. These synchronized measurements were subsequently transferred to a computer for detailed engineering analysis and further digital signal processing. High-speed pressure signal data inherently contain noise; therefore, in this study, a Butterworth filter was implemented as the primary filtering method, with a cutoff frequency set at 5 kHz. Under steady-state operation, a National Instruments LabVIEW control system governing the engine actuators and sensors enabled the combustion analyzer to record 300 cycles of pressure data at a 0.1 CAD sampling rate, capturing detailed pressure traces and other averaged cycle measurements at a lower resolution. Fuel and coolant temperatures were maintained constant through testbed cooling facilities, while fuel mass flow was recorded using an orifice-type flowmeter (Emerson Electric Co., St. Louis, MO, USA).
Exhaust gas emissions, including NO, total hydrocarbons (THCs), and CO, O2, and CO2, were analyzed using a HORIBA MEXA-ONE exhaust gas analyzer (Horiba Ltd., Kyoto, Japan) at the exhaust port outlet. Additionally, particulate matter (PM) emissions were quantified using an AVL PM Sampler smoke meter (AVL List GmbH, Graz, Austria).
The target engine was an eight-cylinder, pre-mixed spark-ignition engine fueled with natural gas. Experimental tests were conducted under steady-state conditions across load variations ranging from 10 to 100%, with the results serving as benchmark data for CFD simulation validation. Detailed engine specifications and operating conditions are presented in Table 1 and Table 2.

Table 1.
Engine specifications.
Table 2.
Operating conditions.
2.2. Pre-Chamber and Engine Geometry
Figure 2 shows 3D CAD surfaces of the engine geometry, including the pre-chamber. As shown in Figure 2, the larger of the chambers (main chamber) is a conventional SI combustion chamber, while the smaller one, having a fixed volume (pre-chamber), is where combustion is initiated by the spark plug. The pre-chamber volume is 1745 mm3 (0.107 in3), accounting for approximately 1.76% of the engine’s clearance volume, with 1.85% of the total injected fuel being delivered to the pre-chamber through the auxiliary pre-chamber injection orifice. The illustration within the boxed area at the top of Figure 2 represents the two cross-sections utilized for analysis in this study. The figure depicts the physical phenomena occurring within the PCSI engine in two different cross-sections.
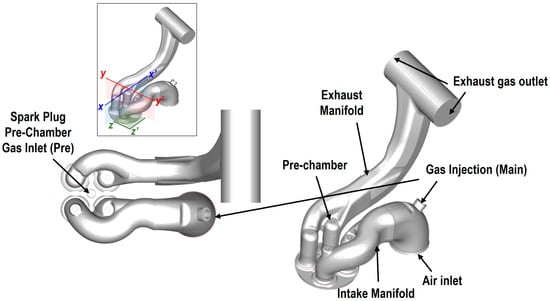
Figure 2.
CAD surface data of the pre-chamber and combustion chamber design, including the intake and exhaust ports’ geometry.
Previous studies have reported that the optimal pre-chamber volume ratio ranges from 2.4% [23] to 3.5% [18], considering the trade-off between ignition energy and NOx emissions. The numerical and experimental test ranges investigated in these studies span from 2.0% to 3.5% [3,19,23,26].
In comparison, the pre-chamber volume of the target engine in this study is relatively small. This design choice is based on the premise that reducing the pre-chamber volume in PCSI engines enhances ignition stability and combustion speed, thereby improving lean-burn operation and thermal efficiency.
3. Numerical Model
Numerical simulations are performed using the commercial CFD code, Fire™ by AVL Version 2021 R2 [34], a computational fluid dynamics software for computing compressible, three-dimensional, chemically reacting flows in complex geometries with moving boundaries. Fire™ employs a fully conservative finite volume method (FVM) to solve the governing conservation equations for mass, momentum, and enthalpy, along with additional transport equations for turbulence-related quantities and chemical species conservation. The computational framework utilizes a general unstructured grid, where all dependent variables—including momentum, pressure, density, turbulence kinetic energy, dissipation rate, and scalar properties—are evaluated at the cell centers to ensure numerical stability and accuracy in complex flow simulations [14,34]. Using this software, the full engine processes can be simulated by a movable mesh model during the engine cycle process.
3.1. Computational Mesh
Figure 3 shows the computational domain created from the real engine geometry, including the intake/exhaust ports and the pre-chamber. As can be seen, the pre-chamber is aligned with respect to the cylinder axis. In this study, the meshing process is conducted using the Hybrid Meshing Tool of AVL FIRE™ (AVL List GmbH, Graz, Austria) with dynamic mesh regeneration. This approach enables the accurate modeling of volume changes associated with piston and valve motion, ensuring a high-fidelity simulation of combustion physics. The methodology employs a combination of structured and unstructured meshes, providing enhanced flexibility in handling complex geometries. To maximize flexibility in the mesh structure and topology, the solver supports computational cells with an arbitrary number of faces, enabling the use of polyhedral control volumes. The framework accommodates such configurations through adaptive connectivity strategies and gradient interpolation techniques, ensuring an accurate evaluation of cell face values. Consequently, it supports polyhedral, tetrahedral, and hexahedral elements, enhancing the computational efficiency of the simulation.
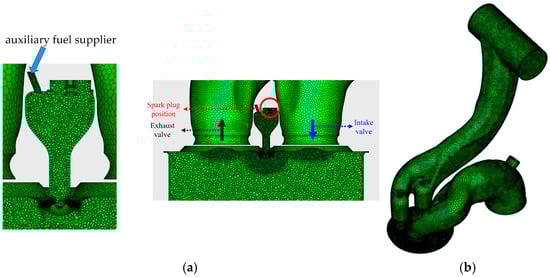
Figure 3.
Computational mesh details for pre-chamber and main engine simulations. (a) Sectional zoomed view of pre-chamber computational grids and (b) whole computational grids @TDC.
Polyhedral meshing is mainly used for the whole computational domain, with a base cell size of 1 mm and a maximum cell size of 4 mm. This is based on experience from previous studies [14,19,33,35] utilizing the RANS approach for PCSI engine modeling.
The pre-chamber mesh resolution is set to 0.7 mm, while the channels connecting the pre-chamber to the engine cylinders are refined further, with a typical cell size of 0.2 mm [35,36]. This localized mesh refinement in the pre-chamber region is implemented to accurately resolve early flame kernel formation and propagation, ensuring the precise capture of combustion dynamics within the pre-chamber. Finally, the cell size is fixed to 1.3 mm for cells located close to the walls. Moreover, the Piston Displacement Function (PDF) is used to improve the grid resolution. The total grid count ranges from 0.987 to 1.556 million, with time steps controlled via CFL (Courant–Friedrichs–Lewy) conditions. The mesh type of the grid system consists of tetrahedron elements (0.64%), hexahedron elements (0.6%), pyramid elements (3.25%), and polyhedron elements (95.51%). At the time of ignition, +13.41 deg CA additional spherical refinement is applied in the spark plug area. A relatively fine mesh in the pre-chamber needs to be generated to resolve the flow field properly, and transfer channels (orifice) between the PC and main chamber have to be refined with at least eight cells in between. The refinement of connecting channels is extruded into the main chamber (cone or cylinder refinement) in the direction of flame jets. Finally, the mesh is refined to 0.5 mm at the spark gap location where all geometric details are captured, with a few cells between electrodes to better capture the initial flame kernel and the early combustion evolution.
3.2. Description of Test Geometries
This study investigates the effects of the pre-chamber diameter, volume, and cone angle on scavenging performance, chemical composition variations, and emissions using the previously described CFD model. The pre-chamber cone angle is set to 130° and 140°, as illustrated in Figure 4. Specifically, the analysis examines two pre-chamber diameters, two kinds of volume configurations, and two cone angles, as detailed in Figure 5 (Cases 1–3). For each pre-chamber configuration, the nozzle area ratio, denoted as β, is mathematically defined as the ratio of the total nozzle exit area to the pre-chamber volume, as expressed in Equation (1). This parameter, representing the relative flow area of the orifices and the penetration of the flame jet, is systematically varied to evaluate its impact on combustion characteristics [3,19]. In fluid dynamics, non-dimensional parameters such as β allow for generalization and scalability, enabling comparisons across different engine geometries and operating conditions.
where B is the cylinder bore, At is the total flow area of all pre-chamber orifices, and Vpcc is the pre-chamber volume.
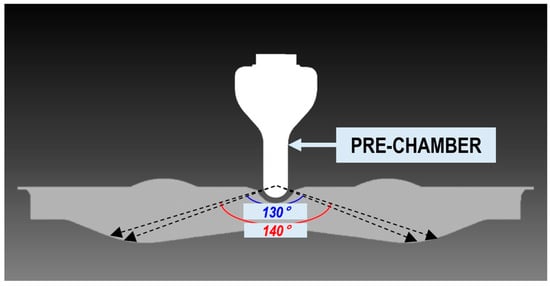
Figure 4.
Cross-sectional illustration of the combustion chamber and pre-chamber installation with different cone angles.
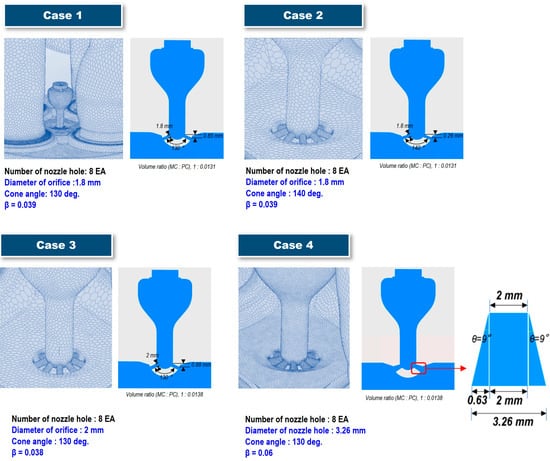
Figure 5.
Schematic diagram of test cases with computational mesh of the fluid region in the pre-chamber.
Numerous previous studies [3,18,19,23,26] have aimed to optimize pre-chamber geometry by determining the optimal β parameter value, as β primarily governs the flow characteristics of flame jets propagating from the pre-chamber into the main chamber. In this study, the β parameter value ranges from 0.03 to 0.034—well below the 0.2~0.4 range found in previous work—indicating a relatively smaller orifice diameter compared to the pre-chamber volume. While previous studies have reported that β = 0.3 optimizes combustion stability and emissions, our engine is designed with a smaller pre-chamber to improve cold-start performance and reduce in-cylinder flow interference. Therefore, we apply the optimal orifice diameter range of 1.8–2.0 mm [3,18,19,23] on a reduced-volume pre-chamber.
The total number of nozzles in the pre-chamber is set to eight, ensuring a well-distributed spatial arrangement of the igniting jets ejected from the pre-chamber. A noteworthy aspect of this study is the comparison of combustion characteristics in a PCSI engine equipped with diverging-tapered-hole pre-chamber nozzles, aiming to analyze the underlying mechanisms and evaluate their potential advantages for PCSI engine applications (Figure 5, Case 4).
Unlike conventional orifices, the diverging-tapered-hole nozzle minimizes flow separation at the nozzle exit, facilitating more uniform air–fuel mixing. As a result, it generates stronger turbulent jets, which enhance main-chamber ignition and improve combustion stability, particularly under ultra-lean operating conditions.
A critical parameter that has not been extensively analyzed in previous studies is the pre-chamber cone angle, as schematically illustrated in Figure 4. Most prior research has employed a cone angle of 130° [23] or 140° [36]. However, in Miller cycle engines—such as the one examined in this study—where early intake valve closing (EIVC) extends the compression stroke, variations in the cone angle may have a significant impact on scavenging performance. Additionally, the volume ratio of the pre-chamber to the main chamber is 1.31% for Cases 1 and 2 and 1.38% for Cases 3 and 4.
Furthermore, as the turbulent jet flows through the pre-chamber orifice, it interacts with flow resistance, potentially influencing the composition and concentration of active intermediate radicals within both the cold jet and the initial jet flame. Given these potential effects, this study systematically investigates the influence of cone angle variations on the combustion and emissions characteristics of PCSI engines, as shown in Figure 4.
Figure 5 illustrates the four geometric configurations analyzed in this study, detailing the key dimensional parameters alongside the three-dimensional computational mesh representation.
3.3. Governing Equations
The complete set of governing equations expressed in tensor notation specifically incorporating a URANS (Unsteady Reynolds Averaged Navier–Stokes) turbulence model within a Reynolds-Averaged Navier–Stokes (RANS) framework for performing a 3D CFD analysis of a PCSI engine can be expressed as follows:
where ρ is density, uj is the velocity component in the j-direction, xj is the spatial coordinate, p is the pressure, μ is the dynamic viscosity, is the Reynolds stress tensor modeled through turbulent viscosity, μt, k is the turbulent kinetic energy, h is the enthalpy, λ is the thermal conductivity, Cp is the specific heat at a constant pressure, Prt is the turbulent Prandtl number, is the work due to pressure change, , and Sh is the source term from combustion reactions. Equation (4) represents the viscous stress tensor, whereas Equation (5) denotes the Reynolds stress tensor.
In the combustion model used in this study, transport equations are solved for the Favre-averaged mass densities of multiple chemical species, including fuel, O2, N2, NO, CO2, CO, H2, H2O, O, H, N, OH, and soot within the computational cell, which itself is divided into three distinct mixing zones. Hence, the term “burned gases” refers not only to fully reacted products within the mixed burned-gas zone (zone Mb), but also includes partially reacted or unreacted components found in the unmixed fuel zone (Fb) and the air zone (Ab). Typically, these chemical reactions are represented in the conventional reaction format, as follows:
where Sc and Sct are the laminar and turbulent Schmidt numbers, respectively. is the average combustion source term. is the average mass fraction of species x, which is determined as follows:
V represents the volume of the computational cell, is the mean density, and is the mass of the computational cell.
Fuel is categorized into the following two fractions: the fuel contained in fresh gases, denoted as , and the fuel present within the burned gases, denoted as . This distinction is essential for accurately modeling combustion, as the fresh-gas fuel fraction () undergoes consumption predominantly through auto-ignition or flame propagation, whereas the burned-gas fuel fraction () is primarily consumed by diffusion flames. These fuel transport processes are conventionally expressed in the simplified reaction form, as follows:
When local fuel/air (F/A) equivalence ratios exceed stoichiometric conditions, the available oxygen in the fresh gases becomes insufficient for complete fuel oxidation. As a result, a portion of the fuel in the fresh-gas mixed zone (Mu), which is consumed through either auto-ignition or flame propagation, remains partially unoxidized. This unoxidized fraction subsequently moves into the burned-gas zone (Mb), where it undergoes further oxidation processes (post-oxidation). Similarly, fuel residing in the unmixed fresh-gas region (Fu) does not experience immediate oxidation during the primary combustion events (auto-ignition or flame propagation). Consequently, this unoxidized fuel is directly transferred from the unburned-gas region into the burned-gas region. The term captures this fuel mass transfer, appearing with opposite signs in the transport equations for unburned- and burned-fuel fractions. Specifically, the reaction rate denotes the oxidation rate of unburned fuel occurring via auto-ignition or flame propagation, while the reaction rate corresponds to the oxidation rate of the burned-fuel fraction through diffusion flame processes.
3.4. Turbulence Model
In this study, the k-ζ-f turbulence model [35] was selected to calculate the turbulent viscosity (μt) appearing in Equation (5) owing to its high accuracy and convergence stability. This model is an optimized variant of the near-wall turbulence closure originally proposed by Durbin [37,38]. This is another version of the low-Re turbulence model. In addition to the turbulent kinetic energy and its dissipation rate in the standard k-ε turbulence model, the wall-normal velocity fluctuation v2 and its source term f are introduced as variables to incorporate near-wall turbulence anisotropy, as well as non-local pressure–strain effects. The need for damping functions can be avoided by the careful introduction of this kind of relaxation [39,40]. This model enhances the numerical stability of the original v2-f model by solving a transport equation for the velocity scale ratio ζ = v2/k as opposed to the velocity scale v2. Thus, to consider the non-isotropic turbulence which occurs in the in-cylinder flow, it is expected that the k-ζ-f model has a much better prediction capability compared to the k-ε model. It has also been reported that the k-ζ-f model shows a better predictive ability in many engineering problems than the conventional k-ε turbulence model [28]. All the walls of the computational domain were set as isothermal from experimental data. Hybrid wall treatment [34] was employed to describe the behavior of the fluid in wall boundary layers. The decision to employ a hybrid wall treatment was driven by computational efficiency and the specific requirements of the simulation. While the hybrid wall treatment in FIRE code [34] allows for coarser near-wall meshing, its application to the k-ζ-f turbulence model may lead to a slight reduction in accuracy when resolving detailed near-wall turbulence effects. However, by using a relatively larger mesh size in the main chamber—except for the near-wall regions inside the pre-chamber—and applying a wall function approach, the computational cost was significantly reduced while effectively leveraging the high accuracy of the k-ζ-f model.
3.5. Combustion Model
Turbulent jet ignition (TJI) in lean-burn engines presents significant challenges for combustion modeling. While pre-chamber combustion resembles that of a conventional SI engine, ignition in the main chamber—driven by turbulent hot jets—differs fundamentally from traditional premixed flame propagation. To address this complexity, the Extended Coherent Flamelet Model (ECFM-3Z) was selected for its capability to model both premixed and diffusion combustion.
ECFM-3Z tracks flame propagation through a transport equation for flame surface density (Σ), incorporating convection, diffusion, turbulent stretch, thermal expansion, and mean flow effects. As this transport equation has been extensively detailed in previous studies [14,41], it is omitted here for brevity.
The equation consists of two source terms. One is a source term which represents flame surface density generation, primarily influenced by turbulent net flame stretch, which depends on turbulence intensity, velocity gradients, and length scales, with corrections for curvature and thermal expansion under the assumption of isotropic flame distribution. The other is a sinking term which accounts for local flame extinction due to unfavorable conditions such as excessive strain, heat loss, or insufficient reactants.
These terms are mathematically expressed in Equation (11).
In this equation, ρfu,fr is the partial fuel density of the fresh gas, ρfu is the density of the fresh gas, and SL is the laminar flame speed.
Here,
Kt is a critical property, since it influences the source term for the flame surface and, therefore, the mean turbulent reaction rate. From Equation (11), it can be observed that flame stretch is expressed as the large-scale characteristic strain, ε/k, modified by a correction function, Ct, which accounts for turbulence scale size, viscous effects, and transient behavior [42]. The parameter Ct is a function of turbulence parameters and laminar flame characteristics [34].
The coefficients of α, the stretch factor, and β in Equation (11) are arbitrary tuning constants used in ECFM-3Z.
The ECFM-3Z model divides combustion into three zones—fuel, air, and air–fuel mixture—with mixing governed by a characteristic time scale derived from the k-ζ-f turbulence model. Burnt gas properties are determined using the reaction progress variable, while an auto-ignition model estimates ignition delay based on reaction time scales. Although ECFM-3Z lacks detailed chemistry, it effectively models turbulent premixed flame propagation, making it well-suited for SI engine combustion simulations [43].
The model requires laminar flame speeds, which depend on local pressure, fresh gas temperature, and the unburned fuel–air equivalence ratio. Empirical correlations, such as Metghalchi and Keck [44], often underpredict laminar flame speeds under real engine operating conditions [43]. To enhance accuracy, this study utilizes pre-tabulated values from AVL FIRE, generated using detailed reaction mechanisms. Laminar flame thickness is computed from the temperature profile normal to the flame front and the chemical time, which is derived from the characteristic time of laminar flame propagation using the Zeldovich Number, dependent on the activation temperature of fuel oxidation. While ECFM-3Z does not incorporate detailed chemistry, it solves transport equations for the mean concentrations of key chemical species, including O2, N2, CO2, CO, H2, H2O, O, H, N, OH, and NO, where “mean concentrations” refer to the global averages across all three mixing zones within a computational cell. The detailed governing equations related to this were presented earlier in Equations (7)–(10).
A spherical model is employed for pre-chamber ignition, coupled with ECFM-3Z. The spherical flame kernel forms at the spark plug gap, based on the spark position, ignition timing, flame kernel radius, and spark duration. Ignition begins at −14 CA BTDC, with ignition energy calculated from the flame kernel radius and thermodynamic properties. The flame surface density remains constant in all ignition cells within the kernel radius for the spark duration and must be self-sustaining to propagate combustion post-ignition. For further details on the combustion simulation methodology, refer to [34].
3.6. Turbulence–Chemistry Interaction
The interaction between turbulence and combustion chemistry is critical in PCSI applications, as turbulent reactive flow leads to mutual influences between combustion dynamics and flow characteristics. Compared to conventional SI engines, PCSI systems exhibit highly inhomogeneous turbulent flow fields, characterized by steep spatial gradients at jet boundaries and rapid temporal evolution. As the flame front propagates, it interacts with both large and small eddies, enhancing turbulent mixing and intensifying diffusive processes within the flame structure.
As discussed in Section 3.2, the Flame Surface Density (FSD) transport equation includes source and sink terms that account for flame stretching and quenching effects, essential for accurately modeling flame front dynamics under both laminar and turbulent conditions. The ITNFS (Intermittent Turbulence Net Flame Stretch) model [45] is used to simulate the interaction between individual vortices and flame fronts via direct numerical simulation (DNS). It assumes that each turbulence scale independently influences flame stretching, with the cumulative effect inferred from individual scale behavior in fully turbulent flow. However, in real PCSI engines, flame behavior is inherently anisotropic, making the assumption of isotropic turbulence invalid. As a result, the ITNFS model does not fully account for turbulence anisotropy, potentially introducing inaccuracies in combustion analysis results [14,45,46]. Despite these limitations, the ITNFS model is employed in this study to simulate turbulence–chemistry interactions, as no more advanced model is currently available. This selection is made to ensure computational feasibility and efficiency.
3.7. Pollutant Modeling
Pollutant modeling is conducted within the burned-gas region of the mixing zone in each computational cell. The following two sets of reactions are considered: (1) reactions occurring in hot combustion products formed from unburned gases in the mixing region and (2) reactions associated with the turbulent mixing of fuel and air from the burned-gas region into the mixed burnt gases. The burned-gas region contains combustion products, air, and fuel, facilitating diffusion reactions that contribute to carbon monoxide (CO) and soot formation.
The ECFM-3Z model enhances the accuracy of flame property calculations, CO equilibrium reactions [47,48], and NOx kinetics via the extended Zeldovich mechanism, focusing on post-flame zones with the Fenimore prompt NOx mechanism to model NOx formation in the flame front [49]. NOx formation occurs in both the flame front and post-flame gases. Hence, combining the Extended Zeldovich mechanism with the prompt NOx mechanism can significantly enhance the accuracy of NOx predictions in pre-chamber combustion engines, especially under conditions where both thermal and non-thermal NOx formation pathways are relevant. This study uses the prompt NOx mechanism in the flame front zone, where hydrocarbon radicals and N2 interact, and the extended Zeldovich mechanism in the post-flame zone, where high temperatures drive thermal NOx formation. Finally, we dynamically link these zones using temperature, the equivalence ratio, and chemical species concentrations.
CO formation and its subsequent oxidation into CO2 within the burned-gas mixing zone are modeled using a six-step reduced kinetic mechanism (CORK–CO Reduced Kinetics) [47]. This CORK model improves upon the four-step mechanism [47] by incorporating two additional reactions for C2H2 and C2H4 [48].
3.8. Initial and Boundary Conditions from Experiment and 0D/1D Simulation
3.8.1. Experimental Data for Initial and Boundary Conditions
At the inlet and outlet boundaries, the constant total pressure and temperature obtained from experimental measurements (Table 2) are applied. The species concentrations are prescribed to maintain a global air–fuel equivalence ratio (λ = 2), with air modeled as a mixture of N2 (77%) and O2 (23%). Additionally, the fuel injection profiles in both the pre-chamber and main chamber, along with the fuel temperature, are experimentally measured and applied to the simulation. Uniform pressure and temperature distributions are set as initial conditions, reflecting the average operating conditions of experimental engines. In the cylinder and pre-chamber, initialization is performed using experimentally measured pressure values and appropriate temperature conditions to ensure consistency with physical boundary conditions and thermodynamic states.
3.8.2. 0D/1D Simulation for Initial and Boundary Conditions
Some of the boundary conditions for the 3D simulations are obtained from a 0D/1D simulation model, which is developed in-house for the baseline engine. This model incorporates a one-dimensional wave action model [49,50] for the intake and exhaust pipes, a thermal networking heat transfer model [49,51] for calculating the heat transfer between engine components, and a thermodynamic model for in-cylinder combustion and gas exchange processes. In this in-house simulation code, the intake and exhaust systems, including cylinders and junctions, are represented using a one-dimensional or quasi-dimensional approach based on gas dynamics simulation techniques. The components (e.g., throttle body, turbocharger, compressor, throttle body, plenum, and muffler) connected to the engine’s intake and exhaust system are thermodynamically modeled. These simulations employ the non-isentropic formulation of the method of characteristics [50] to accurately capture flow behavior. During the compression, combustion, and expansion phases, the combustion heat release rate is governed by an energy balance equation, which is defined using experimentally measured heat release profiles.
Another component of this code is the heat transfer analysis, which is performed to calculate the temperatures of engine components, including the cylinder walls, piston, head, and exhaust valves. This analysis employs the thermal network method [51,52] to predict component temperatures based on engine operating conditions such as speed, load, and pressure. Thermal network methods are widely used to predict the temperatures of engine components, including the piston, cylinder head, and liner. These methods simplify complex heat transfer phenomena by representing them as manageable resistive and conductive networks, where heat transfer is modeled similarly to an electrical circuit. In this approach, nodes correspond to key engine components (e.g., piston crown, cylinder head, exhaust valve, and liner), with thermal resistances representing the conduction and convection pathways within the system. The temperature at each node is computed using linear equation-solving techniques, such as the Gauss elimination method. The output provides the final temperature of each component and the energy flow along different heat transfer pathways. In this program, boundary conditions are defined using experimentally measured coolant and oil temperatures for nodes exposed to these fluids.
The computational flowchart of the in-house code used in this study is presented in Figure 6. As shown in the flow chart, the simulation initializes by loading input/output files and setting engine parameters. It applies the method of characteristics for 1D pulsating flow in intake/exhaust pipes and imports experimental heat release rate data for accuracy. Operating conditions are defined, and energy balance equations integrate flow, combustion, and heat transfer data. The model computes component temperatures, performs gas exchange and heat transfer calculations, and determines cylinder volume variations. Finally, it outputs temperatures, heat flows, and flow efficiency metrics, concluding the simulation. The 0D/1D simulation is first executed for seven or eight cycles until the convergent criterion is satisfied. It is considered that the solution reaches periodicity if the difference between the volumetric efficiency of the first cylinder in the previous cycle and that of the present cycle is less than 0.01. The converged solutions are used as initial data and boundary conditions for the solid surface temperatures of the cylinder head, liner, piston, pre-chamber, and spark plug.
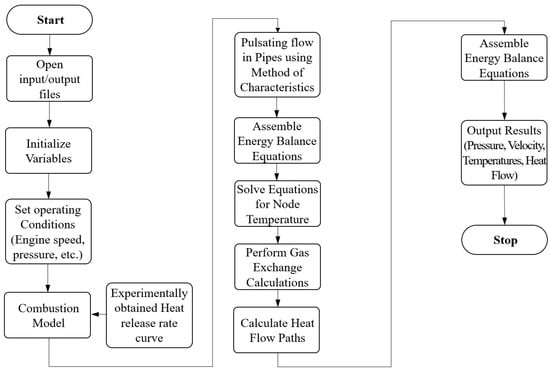
Figure 6.
Computational flowchart of the 0D/1D program used in this study.
The model is validated using available experimental data, as shown in Figure 7, where the intake and exhaust pressure trends are compared. As shown in Figure 7a, the simulation accurately captures pressure waveforms from compression and expansion wave interactions due to piston movement, even in the complex turbocharged V8 engine. Figure 7b shows a strong match between simulation and experimental exhaust pressure waveforms, successfully predicting compression waves during the power stroke. This validated 0D/1D model is used to determine the boundary conditions in hard-to-measure areas, such as the piston and liner surface temperatures.
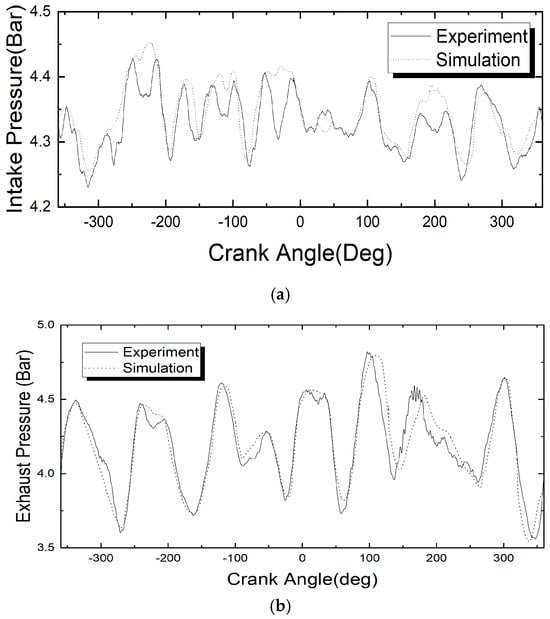
Figure 7.
Comparison of pressure measurements with 0D/1D simulation results for (a) the intake duct and (b) the exhaust duct.
3.9. Simulation Control Setting
In particular, in the present work, the Reynolds-averaged Navier–Stokes equations are solved by using the SIMPLE (Semi-Implicit Method for Pressure-Linked Equations) algorithm and a second-order upwind TVD (Total Variation Diminishing) scheme with Roe’s MINMOD limiter. A blending factor of 0.5 is selected to discretize convective terms for the momentum equation and upwind schemes for turbulence and energy equations. Crank–Nicolson time integration is employed for time discretization, and a variable time-stepping approach, governed by the CFL condition, is implemented. The maximum CFL number varies across different regions of the computational domain, ranging from 0.1 to 5, ensuring numerical stability and accuracy. The time step is dynamically adjusted to optimize resolution while maintaining computational efficiency [12,33,34]. The solution is iterated until the convergence criteria are achieved. In general, it is observed that the residuals for the momentum equations, the turbulent kinetic energy, and turbulent energy dissipation rate are below 10−4. The energy equation residual is well below 10−5, while the residual for the continuity equation is below 10−4. The simulation period should extend through the full engine cycle to accurately capture realistic combustion and exhaust processes, as the intake, compression, and exhaust phases significantly influence pre-chamber performance, which, in turn, affects combustion and emissions in lean-burn engines. However, most recent CFD studies on PCSI engines only simulate the closed cycle (from intake valve closing (IVC) to exhaust valve opening (EVO)) due to computational resource limitations and the high numerical complexity involved [29,41]. This study simulates a full 720° crank angle (CA) engine cycle, spanning from the exhaust valve opening (EVO) of the previous cycle to the EVO of the current cycle, encompassing all critical engine processes.
In internal combustion engine (ICE) development, 3D CFD simulations are commonly employed to study stationary operating points. However, previous research has demonstrated that, even for steady-state conditions, multiple consecutive cycles are required to obtain a statistically representative solution [52]. The literature suggests that at least three consecutive cycles should be simulated to minimize the uncertainties associated with initial conditions and enhance solution stability [53], though this approach significantly increases computational cost. To address this, the present study employs three consecutive engine cycles for each operating condition to ensure numerical convergence and reduce the dependency on assumed initial conditions. The Algebraic Multi-Grid (AMG) solver is utilized as the linear system solver, where matrix coefficients are strategically aggregated to construct a coarser grid representation, eliminating the need for additional discretization while maintaining computational efficiency.
Simulations are run in parallel on a distributed memory cluster of an Intel Xeon W-2265@3.5GHz computer with a processor consisting of 32 cores and 192 GB of DDR4 2933 memory per node. About 504 h is needed to run a three-cycle fired simulation for one case.
To facilitate a clear understanding of the workflow of this study, Figure 8 schematically illustrates the overall process. To determine the initial and boundary conditions, both engine dynamometer testing and 0D/1D simulations are conducted. The 0D/1D simulation program is validated and calibrated using experimental data. Additionally, the combustion model is refined by experimentally tuning the stretch factor to improve the predictive accuracy.
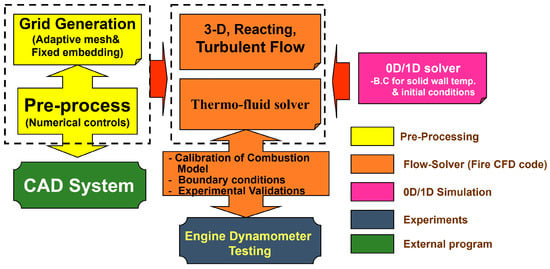
Figure 8.
Schematic diagram of overall workflow of this study.
4. Results
4.1. Calibration of Combustion Model
As previously mentioned, ECFM-3Z is a combustion model adopted in this study to simulate the complex combustion processes in internal combustion engines. A critical parameter in this model is the stretch factor, presented in Equation (2), which plays a significant role in accurately predicting flame behavior under various operating conditions.
Several previous studies have attempted to optimize this parameter to overcome the limitations of flamelet-based models [27,41]. However, no research has been reported on its application to active-type natural-gas-fueled pre-chamber combustion systems. Therefore, this study aims to tune the ECFM-3Z model by systematically varying the stretch factor across a wide range. Specifically, the stretch factor, α, is adjusted from 0.3 to 0.77, and an empirical correlation proposed in recent studies [14,54], as given in Equation (13), is applied. This correlation expresses the stretch factor in ECFM-3Z as a function of the flame-based Karlovitz number, based on the principle that the stretch factor modulates the interaction between turbulence and the flame front, influencing flame propagation speed and stability.
where, , .
The flame-based Karlovitz number included in Equation (14) is calculated using the following equation.
where δL represents the laminar flame thickness, SL is the laminar flame speed, ν denotes the kinematic viscosity, and ε is the turbulent dissipation rate.
Figure 9 presents the heat release rate as a function of crank angle degrees for various stretch factor (α) values, comparing the simulation results with those derived from the experimentally measured in-cylinder pressure data of Case 3. In Figure 9, SF represents the stretch factor, while SF_opt denotes the stretch factor calculated using Equation (13).
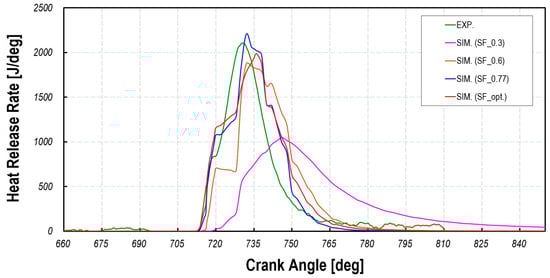
Figure 9.
Heat release rate versus crank angle degrees for different α values, in comparison with experimental apparent heat release.
Figure 9 presents the heat release rate as a function of crank angle degrees for various β values, comparing the simulation results with those derived from the experimental in-cylinder pressure measurements for Case 3. The experimental data in this figure represent the apparent heat release rate. The results indicate that, as α increases, both the heat release rate and its rate of change increase, demonstrating that higher α values correspond to an increase in combustion speed. Another noteworthy feature of the results in Figure 8 is that, despite extensive model tuning, the observed delayed combustion phasing indicates significant inaccuracies in the current turbulence–flame interaction model, which fails to accurately represent the anisotropic characteristics of turbulent flames in PCSI engines. In PCSI combustion, the formation of strong turbulent jets leads to the rapid dissipation of turbulent kinetic energy (TKE), posing a major challenge in modeling turbulence–flame interactions. Consequently, the flame does not have sufficient time to adjust to the turbulent flow field, resulting in numerical predictions that deviate from the actual combustion behavior.
Figure 10 illustrates the effect of stretch factor variations on combustion speed by dividing the combustion duration into the following three phases: 10% mass fuel burn duration (MFB10), 50% mass fuel burn duration (MFB50), and 90% mass fuel burn duration (MFB90). As observed in the figure, higher α values correspond to faster combustion rates, leading to a reduction in burn duration. Additionally, in the SF_opt case, where the flame-based Karlovitz number is considered based on PCSI engine multi-mode combustion, a high prediction accuracy is achieved for the flame development angle (MFB10) to the MFB50 region. These results indicate that tuning the stretch factor using Equation (13) provides the highest prediction accuracy, while using a single stretch factor shows that the optimal range is 0.6 < α < 0.77. This range deviates from the previously proposed optimal value (α = 0.525~0.6) suggested in earlier studies [39]. Thus, it is confirmed that the correction of the stretch factor in ECFM-3Z must be performed individually based on engine operating conditions, fuel type, and combustion strategy. Based on these results, all CFD simulations in this study are conducted using the stretch factor calculated from the correlation in Equation (13), which demonstrates the highest accuracy in combustion analysis.
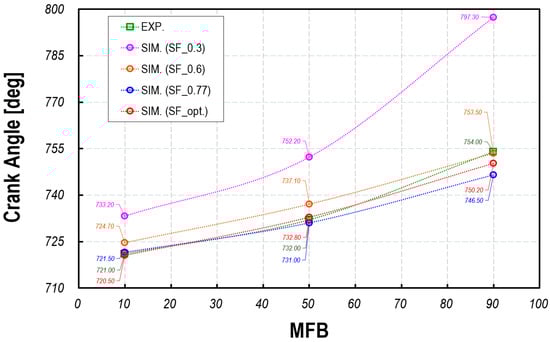
Figure 10.
Mass burned fraction versus crank angle degrees for different α values, in comparison with MBF calculated based on experiment.
4.2. Validation of CFD Simulation with Flamelet-Based Combustion Model
Before analyzing a PCSI combustion engine using CFD, validating the CFD model is a crucial initial step to ensure the accuracy and reliability of the numerical solution. For this purpose, the operating point described in Table 2 is selected. The in-cylinder pressure and emissions are compared with experimental measurements from the eight-cylinder engine, considering the pre-chamber configuration of Case 3. The validation test is conducted at an engine speed of 1000 rpm under full-load, ultra-lean conditions (λ = 2).
Figure 11 shows the comparison between prediction and measurement for the pressure trace of the in-cylinder and pre-chamber at 1000 rpm under full-load conditions. The experimental measurements encompass 300 cycles of pressure data with an associated average value, while the CFD simulation reports the average cylinder pressure computed from three cycles. It can be observed from Figure 11 that the predicted pressures are in reasonably good agreement with the experimental data. The close agreement between the in-cylinder pressure traces and the experimental data is attributed to the precise tuning of the stretch factor in the ECFM-3Z model, as previously discussed.
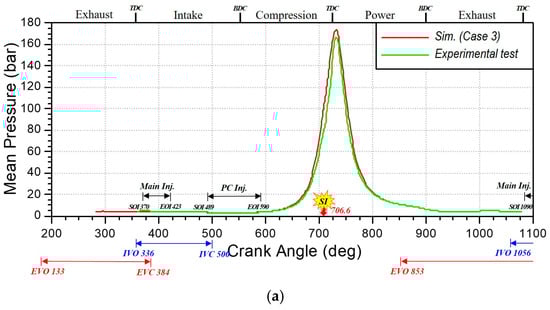
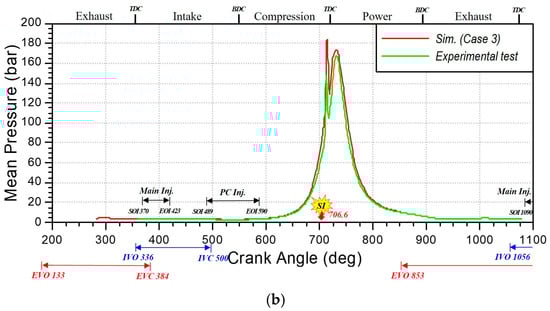
Figure 11.
Comparisons of main chamber and pre-chamber pressure between measurements and predictions. (a) Main-chamber pressure trace and (b) pre-chamber-pressure trace.
Further validations of the emissions of CO and NOx are indicated in Figure 12. The CFD simulation results for CO emissions show an overprediction of approximately 11% compared to the experimental values. However, there exist large discrepancies in the NO emissions between the simulation and experiment. It can be found from Figure 12 that the predicted NOx emissions are 24.7% larger than the measured value. This may be due to the problem that combustion sub-models may cause some numerical errors, resulting in overestimating the pressure and temperature in the pre-chamber. This is because, in lean combustion conditions, using the Zeldovich mechanism for NOx prediction may lead to overestimation. This is primarily due to the inherent limitations of the mechanism and the characteristics of lean combustion. The Zeldovich mechanism describes the formation of thermal NO, which predominantly occurs at high temperatures (>1800 K); however, in lean combustion, the combustion temperature decreases, limiting high-temperature regions, and consequently, actual NOx production may be lower than the predictions made by the Zeldovich mechanism, which is highly sensitive to temperature and reaction rate constants, potentially leading to an overestimation of NOx formation at elevated temperatures. Additionally, the overestimation of NOx emissions can be attributed to the increased oxygen concentration. While a relatively high oxygen concentration is present, the low temperature and short residence time significantly suppress NOx formation. However, CFD models may not fully account for the effects of these ultra-lean conditions, potentially leading to an overestimation of NOx emissions. That is, in pre-chamber combustion, rapid flame propagation and high turbulence may reduce the residence time for thermal NOx formation, resulting in deviations from predicted values. The inability of the ECFM-3Z combustion model to accurately predict the turbulence and mixing effects within the PCSI engine is another contributing factor to this overestimation. In pre-chamber engines, rapid mixing and flame jet dynamics can induce local temperature variations that are not fully captured by over-simplified models.
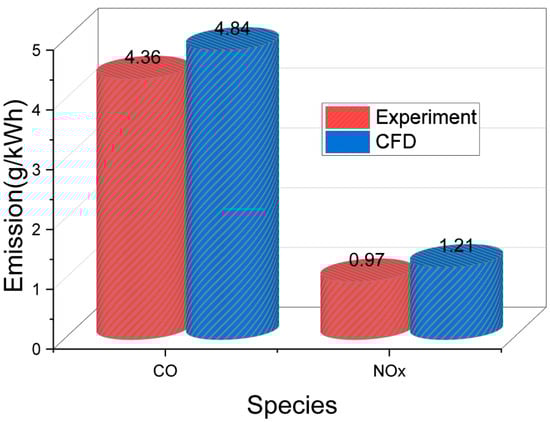
Figure 12.
Experimental validation of CO and NOx emissions derived from CFD analysis.
To improve the predictive accuracy of NOx emissions in PCSI engines using the extended Zeldovich mechanism, it is essential to incorporate the N2O Pathway, a key NOx formation route under lean-burn conditions. Additionally, the temperature dependency of the mechanism should be modified to account for the sharp decline in thermal NOx reaction rates, and low-temperature NOx formation pathways, such as NO production from hydrocarbon radicals, must be introduced. Beyond refining the chemical mechanism, PCSI-engine-specific effects should be integrated into NOx modeling by dynamically coupling local equivalence ratios and stratification, as computed from the ECFM-3Z model, with the extended Zeldovich mechanism.
Finally, accurately capturing the effects of turbulence on flame structure and reaction zones necessitates the development of numerical models that couple the Zeldovich mechanism with turbulence modeling, enabling a better resolution of lean combustion conditions. Advancing such computational frameworks is critical for improving NOx emission predictions in PCSI engines.
For CO emissions, the ECFM-3Z model may overestimate CO levels under certain conditions due to its treatment of post-flame oxidation and turbulence–chemistry interactions. In active PCSI engines, a significant portion of CO undergoes oxidation after the main flame has passed, driven by the presence of residual radicals (OH, O, and H) and bulk turbulence effects. Since ECFM-3Z assumes an equilibrium-driven post-flame oxidation model, it may underpredict CO oxidation rates, resulting in higher predicted CO emissions compared to experimental values. Another factor contributing to the overestimation of CO emissions is the inadequate representation of turbulent mixing between the pre-chamber and main chamber, which affects the accuracy of CO formation and oxidation predictions. High-momentum turbulent jets enhance CO oxidation through jet-induced mixing and flame propagation acceleration; however, ECFM-3Z may not fully capture turbulence–chemistry interactions in these regions, leading to an overprediction of CO concentrations in simulations.
4.3. Exploring Thermo-Fluid Interaction Between the Pre-Chamber and Main Chamber
Figure 13 displays the pressure curves for the pre-chamber (PC) and main chamber (MC) across various configurations, including a reference case without a pre-chamber (NPC). The throat diameter greatly affects the PC peak pressure—a smaller throat retains the reacting mixture longer, leading to a higher pressure. In cases with a pre-chamber, the PC curve shows dual peaks—the first from the rapid combustion of a near-stoichiometric mixture in the PC, and the second from the MC pressure rise propagating into the PC. The zoomed section in the upper right of Figure 13 (Case 1) illustrates the interplay between the expanding flame pushing reactants out of the PC and the MC gases flowing in due to compression. When the PC pressure exceeds the MC pressure, flow reversal 1 (FR1) occurs; a later equilibrium marks flow reversal 2 (FR2). Figure 8 clearly illustrates that variations in the orifice cone angle have a pronounced effect on the pre-chamber pressure. In this study, Case 2—where the cone angle was increased by 10°—produced the highest peak pressure in the pre-chamber. This outcome is likely attributable to the significant flow resistance encountered by the combusted turbulent jets as they pass through the orifices.
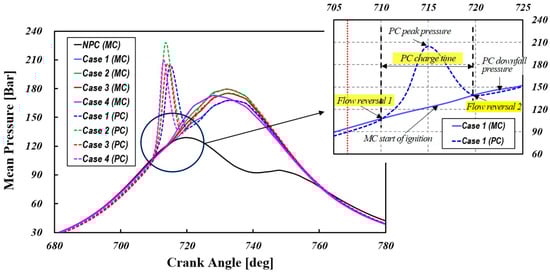
Figure 13.
Pressure traces for various geometric variations in the pre and main chamber.
Table 3 summarizes these events and the residence time—defined as the interval between FR1 and FR2 [29]. Cases 1 and 2 have longer residence times due to higher flow restrictions, allowing for prolonged radical dispersion but increasing the risk of chemical transformation. Shorter residence times indicate lower pre-chamber combustion and a higher mass flow, resulting in jets richer in active species. Larger orifice diameters enable faster energy transfer to the MC, with a lower degree of pre-chamber combustion releasing more fuel energy in the MC for enhanced ignition. Case 4, which employed a diverging-tapered-hole nozzle, exhibited the shortest residence time. This is because, unlike conventional straight-hole nozzles, a diverging-tapered-hole nozzle minimizes flow separation at the nozzle exit, thereby increasing the gas jet velocity and enhancing the mixing with the air–fuel mixture in the main chamber. Previous studies [16,19,55] have emphasized that excessive flow restriction may lead to the recombination of active species before they effectively mix with the MC charge. As shown in Table 3, while the onset of FR1 due to combustion is nearly identical across configurations, the termination time of the discharge of high-pressure combustion products through the orifice (FR2) is strongly governed by the orifice’s geometric configuration.
Table 3.
Summary of flow reversal time and mixture residence time for various cases.
Figure 14 shows the pressure differential between the PC and MC for different configurations. The results indicate that the nozzle diameter and cone angle strongly influence the PC pressure. This differential acts as the driving force for jet flame injection into the MC. Case 2 exhibits the highest peak pressure differential, while Cases 1, 3, and 4 show reductions of 25%, 22%, and 15% compared to Case 2. The elevated differential in Case 2 is likely due to the higher combustion pressure in the PC. Figure 14 shows that, while the onset of pressure rise in the PC is similar across different orifice geometries, the slope of the pressure rise curve varies significantly, resulting in distinct phase shifts among the cases. This variation is due to differences in the scavenging flow during compression, which affect the distribution of the mixture concentration, flow velocity field, and turbulence intensity level near the spark plug. These factors influence flame propagation and speed. The peak PC pressure depends on the flow resistance encountered by the turbulent jet as it passes through the orifice. In this study, Case 2 exhibits the highest peak pressure and steepest gradient of initial rise, likely due to an optimal mixture concentration and turbulence at the ignition stage, promoting rapid flame development.
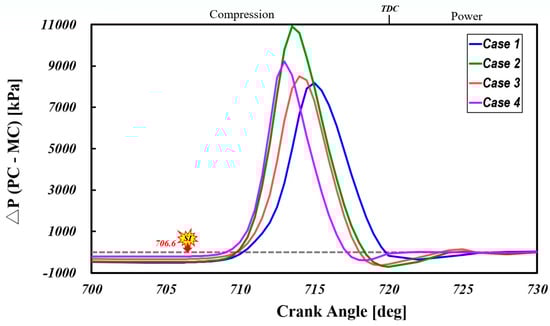
Figure 14.
Temporal variations in pressure difference between pre- and main chamber.
Figure 15 presents the velocity contours and flow streamlines in the pre-chamber for different cases at 706.4 °CA, just before ignition. A key characteristic of the flow behavior during the compression stroke is the strong mixing of jets from each nozzle in the lower region of the pre-chamber. These mixed flows then ascend and, except for Case 2, are deflected to the left of the central axis before reaching the upper surface. This upward flow induces the formation of recirculating vortices on both the left and right sides, influencing the flow dynamics around the spark plug gap. As the upward-moving flow impacts the pre-chamber roof, it decelerates and subsequently passes through the spark plug gap. The most critical aspect of the pre-chamber flow field is the interaction and balance between the two recirculating vortices, which are primarily dictated by the nozzle jet flow rate and injection angle.
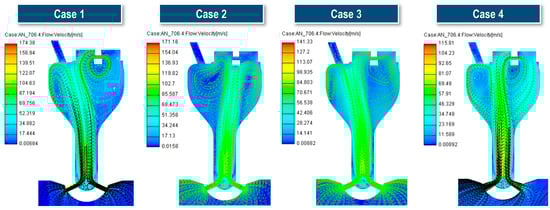
Figure 15.
Flow distributions inside pre-chamber just before ignition for various cases (x-x’ section).
In Case 4, which is equipped with a diverging tapered nozzle, the nozzle functions as a converging-tapered-hole nozzle during the compression stroke. Consequently, the constriction in the channel induces a pressure drop, accelerating the flow and increasing the outlet velocity. This, in turn, enhances jet momentum and penetration, generating a strong, more directed upward flow toward the spark plug. As a result, a more symmetrical recirculation zone is established on both sides of the pre-chamber.
A key observation in this figure is that, in Case 2, where the orifice cone angle is increased, the flow streams from the eight orifices merge in the lower region of the pre-chamber and, unlike in other cases, shift rightward before ascending directly toward the spark plug. This leads to the formation of a strong and wide recirculation zone on the left side. Unlike other cases, where the right-side recirculation flow interacts with and passes through the spark plug gap, Case 2 exhibits a stagnated flow distribution. Ultimately, this result confirms that modifying the orifice cone angle has a more significant influence on the pre-chamber flow distribution at the time of ignition compared to simply altering the orifice geometry.
Figure 16a presents the turbulent kinetic energy (TKE) at the spark plug gap position just before ignition. Among the analyzed cases, Case 3 exhibits the highest TKE level, while Case 1 shows a 38.4% lower TKE than Case 3, Case 2 is 48.0% lower, and Case 4 is 60.2% lower. As shown in Figure 12, the flow expelled from each nozzle mixes in the lower region of the pre-chamber. As this flow moves upstream, the turbulent kinetic energy dissipates and weakens.
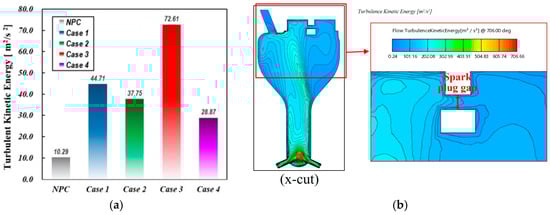
Figure 16.
Comparison of averaged turbulent kinetic energy of the spark plug gap position before ignition: (a) averaged turbulent kinetic energy of the spark plug gap position and (b) sectional view of turbulent kinetic energy contour in pre-chamber for Case 3.
Figure 16b illustrates the distribution of turbulent kinetic energy in the x-x’ cross-section for Case 3, which exhibits the highest turbulence kinetic energy (TKE) level at the spark plug gap. In a PCSI engine, the turbulence intensity at the spark plug gap significantly impacts ignition stability, flame propagation, and combustion efficiency by influencing flame kernel formation, cycle-to-cycle variations, and emissions. Hence, maintaining a high TKE at the spark plug gap through pre-chamber geometry optimization is crucial, as it enhances flame kernel development by increasing the initial flame stretch rate and reducing ignition delay [14,18,19]. The formation of two recirculation zones on the left and right sides of the pre-chamber, where TKE levels are significantly low, can be observed. A strong upwash flow with a high turbulent kinetic energy develops between these two recirculation regions, but weakens further as it moves toward the upper end of the pre-chamber. Eventually, this flow passes through the spark plug gap.
These findings indicate that, to ensure an optimal distribution of turbulent energy at the spark plug gap for stable combustion, it is necessary to optimize the nozzle diameter and length, as well as the volume and shape of the pre-chamber.
Figure 17a presents the average jet penetration velocity, determined by measuring the distance traveled by the jet from the start of ejection until it either reaches the combustion chamber wall or ceases further movement. Among the analyzed cases, Case 3 exhibits the highest penetration velocity, attributed to its greater absolute mass flow and, consequently, stronger pre-chamber ejection momentum. Regarding nozzle diameter effects, it is well-established that jets from smaller nozzle diameters penetrate the combustion chamber more rapidly due to their higher velocity and momentum. However, Case 3, despite having a larger orifice diameter, maintains a thicker jet core, which enhances momentum retention over a longer distance. Additionally, a thicker jet plume improves entropy transfer to the main chamber, facilitating deeper penetration before jet dissipation occurs.
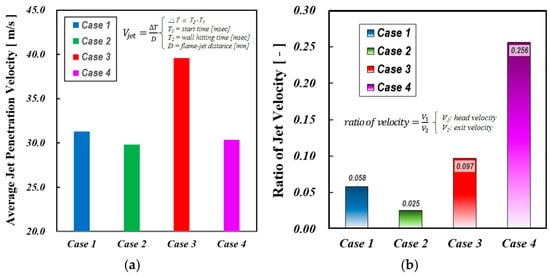
Figure 17.
The effect of various geometric variation on jet velocity: (a) average jet penetration velocity and (b) ratio of jet velocity(@FR2).
Figure 17b compares the instantaneous jet exit velocity at the nozzle with the instantaneous jet head velocity at FR2. The jet exit velocity is derived from simulations by averaging the velocity magnitudes along the jet axis within the nozzle length. The figure indicates that, at FR2, the jet head velocity decreases by approximately 2 to 26% relative to the jet exit velocity, reflecting the degree of deceleration. Among the examined cases, Case 4 demonstrates the highest jet speed ratio, signifying that the turbulent jet momentum is effectively sustained throughout the later stages of flame development. This is because the diverging-tapered-hole nozzle reduces pressure drop and boundary layer separation, thereby minimizing turbulence across the nozzle and producing stronger turbulent jets. This confirms that variations in jet head velocity are significantly influenced by pre-chamber nozzle geometry, as anticipated.
Figure 18 presents a zoomed sectional view of the equivalence ratio distribution in the pre-chamber (PC) and main chamber (MC) just before ignition (706.4° CA) for various cases. During the compression stroke, as the piston moves upward and the pressure in the MC exceeds that of the PC, the lean mixture from the MC begins to penetrate into the PC. Upon entering through the orifices or nozzles, the lean mixture undergoes intense mixing in the lower region of the PC, forming a distinct upward-moving gas column. The velocity and trajectory of this gas column are strongly influenced by the orifice geometry.
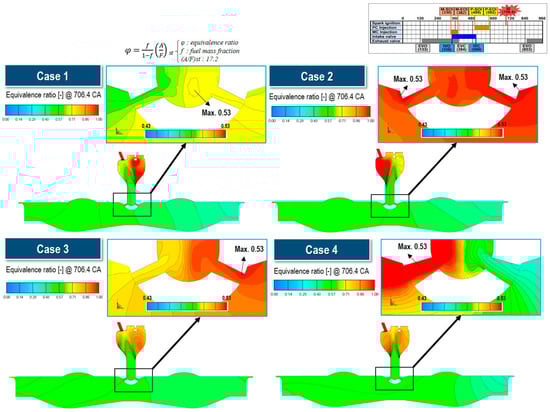
Figure 18.
Equivalence distribution in pre- and main chamber just before ignition for various cases (x-x’ section).
As illustrated in Figure 18, this lean mixture column remains only partially mixed with the rich mixture in the PC until ignition occurs, which is a significant observation. Additionally, a non-uniform equivalence ratio distribution is evident around the spark plug region. These findings indicate that geometric parameters such as the nozzle diameter and cone angle strongly affect both the trajectory and velocity of the lean mixture column from the MC, ultimately influencing the local fuel–air ratio at the spark plug gap.
These results suggest that modifications to the orifice geometry not only alter the fluid dynamic behavior of the turbulent jet, but also influence the formation of pollutant emissions, such as CO and NOx. Furthermore, Figure 18 illustrates that the concentration of the mixture entering through each orifice varies among cases, and the resultant gas column’s momentum and direction significantly affect the equivalence ratio distribution near the spark plug gap.
In a PCSI engine, the residence time of gases in the pre-chamber significantly influences the mass of residual gases and the chemical composition of species such as CO, NO, and OH radicals and CO2. Figure 19 presents (a) the amount of residual gas remaining in the pre-chamber (PC) from the previous cycle and (b) the chemical composition of the residual gas in percentage. As shown in Table 3, the amount of residual gas is not directly proportional to the residence time of the mixture in the PC. Case 1 exhibits the highest amount of residual gas, which is 10.8 times higher than that of Case 2. This is primarily due to the increased flow resistance caused by the reduction in orifice diameter. However, despite having the same orifice diameter as Case 1, Case 2 sees a significantly improved flow resistance by increasing the orifice cone angle. The residual gas amount in Case 3 is 9.8% of that in Case 1, while Case 4 has 10.5% of the residual gas compared to Case 1.
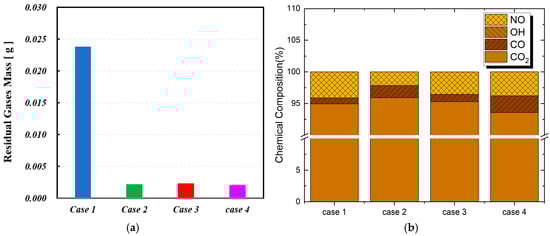
Figure 19.
Mass (a) and chemical composition (b) of residual gas for different orifice geometries.
Meanwhile, Figure 19b illustrates the variation in the chemical composition of residual gases due to changes in orifice geometry. For NO, Case 1 exhibits the highest concentration, which can be attributed to the longer residence time, as prolonged exposure to high temperatures enhances NO formation reactions.
In the case of CO, Case 4 shows the highest concentration. As indicated in Table 3, Case 4 has the shortest residence time, leading to an increase in incomplete combustion products like CO within the pre-chamber. Additionally, the OH radical concentration is in the order of 10−⁶, making it barely visible in the graph. Among the residual gases, Case 4 exhibits the highest OH radical concentration at 9.475 × 10−⁶ (%). As an intermediate species in the combustion process, the OH radical concentration exhibits complex behavior depending on residence time and temperature. Therefore, in Case 4, which has the shortest residence time, the elevated OH radical concentration is likely attributed to its formation during the combustion reaction.
4.4. Effect of Geometric Variations in Pre-Chamber on Combustion Characteristics of Main Chamber
Figure 20 presents the cumulative heat release rate for various pre-chamber geometries, while Table 4 compares the combustion durations across different cases. The inclusion of a non-pre-chamber (NPC) case highlights PCSI’s impact on flame propagation and combustion timing. The results indicate that PCSI accelerates combustion initiation, with pre-chamber geometry significantly influencing early-stage combustion.
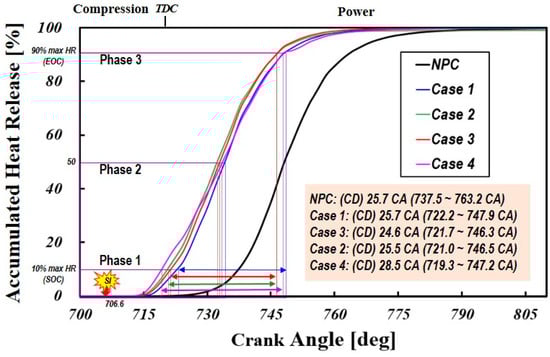
Figure 20.
Profiles of accumulated heat release rate for various orifice geometries.
Table 4.
Details of combustion durations for various cases (unit:CA).
The CA0-10 duration (Phase 1), or flame development angle (FDA), represents a crank angle interval where 10% of the total fuel mass is burned. The NPC exhibits the longest flame development duration (30.9 CA), nearly twice that of the PCSI cases, indicating slower ignition, while Case 4 (12.7 CA) achieves the shortest Phase 1 duration, demonstrating the most efficient ignition, with Cases 1, 2, and 3 showing similar reductions (14.4~15.6 CA) compared to the NPC.
During CA10-50 (Phase 2), the pre-chamber jet influence weakens as combustion transitions toward a premixed flame regime, yet still affects overall flame propagation. The NPC exhibits the fastest Phase 2 combustion (10.9 CA), while Case 4 has the longest duration (14.3 CA), indicating slower mid-stage combustion due to weaker jet penetration or a leaner main chamber mixture, whereas Cases 1, 2, and 3 show slightly shorter durations, suggesting an improved combustion stability. The slower combustion rate in Phase 2 for Case 4 is primarily due to the weaker jet penetration, lower turbulence intensity, and leaner main chamber mixture, all resulting from the diverging-tapered-hole nozzle design. These factors collectively delay flame propagation and extend the mid-stage combustion duration.
NPC exhibits the longest Phase 3 duration (26.3 CA), indicating slow flame propagation due to possible flame quenching or incomplete oxidation. Among the PCSI cases, Case 2 has the longest late-stage combustion (14.0 CA), while Cases 1 (13.4 CA) and 3 (13.3 CA) exhibit slightly faster combustion.
Case 3 exhibits the shortest total combustion duration (24.6 CA), indicating a well-balanced combustion process, while Case 4 has the longest (27.9 CA), suggesting a slower burn rate due to a lower jet velocity and energy dissipation, which results in reduced turbulence and slower combustion progression. The NPC (25.7 CA) shows a comparable CD to the PCSI cases, but demonstrates unstable combustion due to its prolonged Phase 1 and Phase 3 durations. Overall, smaller orifice diameters enhance jet velocity, shortening early-phase combustion and improving pre-chamber charge ignition.
Figure 21 presents the heat release rate (HRR) curves for four different orifice geometries throughout the combustion period, along with bottom-view flame surface density iso-contours at key combustion stages. Additionally, the figure includes pressure curves for both the PC and MC, as well as the pressure differential between the two chambers during the combustion process.
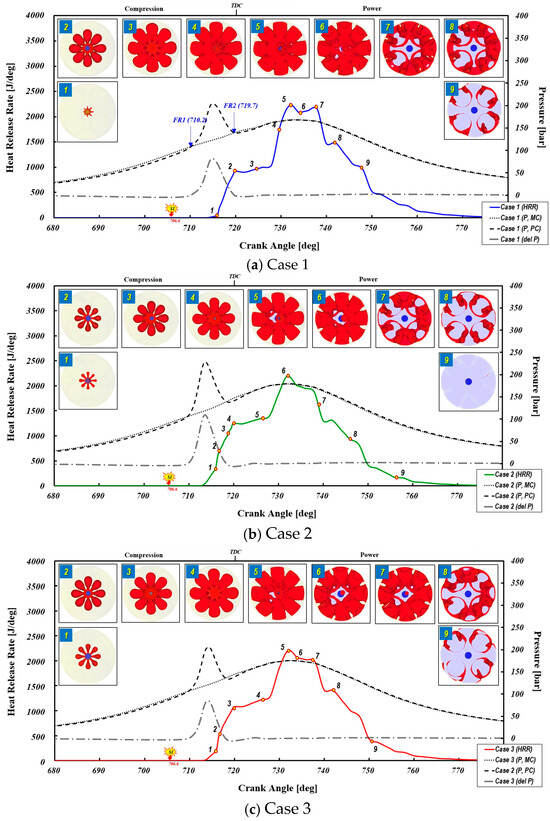
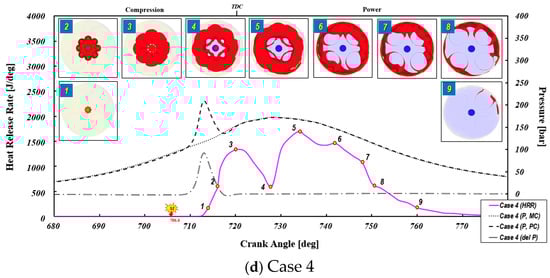
Figure 21.
Sequential plots of heat release rate along with main-chamber pressure, pre-chamber pressure, pressure difference, and flame surface density contour from the bottom view (a) Case 1; (b) Case 2; (c) Case 3; and (d) Case 4.
The HRR profiles in Figure 21a–d exhibit similar trends in terms of combustion initiation, duration, and completion, while also demonstrating a characteristic two-stage heat release process. The first peak occurs when PC jets merge and spread across the MC. Before merging, the PC jets reach their maximum flame surface area, contributing to the initial peak in the AHRR.
The second peak in the AHRR is hypothesized to result from end-gas auto-ignition, which accelerates the consumption of the remaining unburned mixture. After the first peak, the PC jets merge into a hollow cone-shaped flame structure, leaving unburned air–fuel pockets between the hollow cone and the piston. Subsequently, compression due to ongoing heat release and upward piston motion triggers end-gas auto-ignition. Thus, the second peak in the AHRR corresponds to this rapid auto-ignition event. These results are in exact agreement with experimental findings from the previous literature on natural gas PCSI engines [56].
The first HRR peak is jet-momentum-driven, suggesting a mixing-controlled premixed combustion phase. However, the scaling inconsistency of the second HRR peak and the absence of a significant driving pressure differential (ΔP~0) behind the pre-chamber jets suggest a transition from a mixing-controlled to a kinetically controlled combustion regime. This transition coincides with the deceleration of pre-chamber jets due to a diminishing driving pressure and charge entrainment, leading to a flame front evolution process, wherein combustion is no longer solely mixing-driven. Unlike diesel combustion, where the rate-limiting factor is fuel–air mixing, pre-chamber combustion is governed by the interaction between hot burned gases and unburned fuel–air mixtures, rendering the process largely independent of laminar flame speed. The second-stage heat release is more intense and prolonged, primarily driven by bulk in-cylinder flow and turbulence, though as the main chamber mixture becomes leaner, combustion is increasingly influenced by chemical kinetics. In the later stages of heat release, combustion progression becomes less dependent on nozzle geometry, though nozzle-induced flow structures continue to play a role in determining flame propagation characteristics.
Previous studies have indicated that main-chamber ignition is inherently asymmetric, as combustion emerges from pre-chamber jets at different timings [43,56]. However, the sequential flame surface density contour plots in Figure 21 reveal that the flame propagation from each orifice remains largely uniform, likely due to the limited influence of large-scale turbulence in the main chamber. In contrast, during the early flame development stage, flame propagation exhibits non-uniform characteristics, as illustrated in Figure 21a, where a long flame jet is observed near the spark plug in the initial moments of combustion onset.
As shown in Table 4, the flame development angles are 15.6 CA, 14.4 CA, 15.1 CA, and 12.7 CA in Cases 1, 2, 3, and 4, respectively. Additionally, pre-chamber jet merging occurs most rapidly in Case 4, attributable to the diverging tapered nozzle design, which accelerates jet dispersion and flame front interaction. Initial flame formation occurs between FR1 and FR2, where the flame divides into eight discrete jets upon exiting the pre-chamber nozzle holes and propagates individually. In Cases 1, 2, and 3, these eight jet flames merge gradually after FR2 (before TDC), whereas in Case 4, jet merging occurs significantly earlier due to the diverging-tapered-orifice design. In Case 4, the initial flame development phase is accelerated, leading to higher combustion rates before TDC (720° CA); however, after TDC, the heat release rate undergoes a sharp decline, causing a relatively delayed combustion progression.
Figure 21b illustrates that a higher pre-chamber heat release and pressure buildup enhance jet penetration and kinetic energy dissipation, leading to the formation of turbulent mixing eddies in the main chamber. The impact of the pre-chamber cone angle on jet dispersion is also evident, as a larger cone angle facilitates stronger jet interaction with the main-chamber charge, further enhancing the mixing efficiency. Notably, Case 3, as shown in Figure 21c, which features an intermediate cross-sectional orifice area, exhibits the most accelerated heat release in the early combustion stages, indicating an optimal balance between the jet velocity and energy content. The orifice dimensions in Case 3 are sufficiently large to prevent jet flame quenching, ensuring stable combustion propagation.
A critical observation in Figure 21d is that the maximum jet driving force develops more rapidly in Case 4 than in other cases. This phenomenon arises due to the optimized spatial distribution of turbulent jets and a shorter penetration depth, resulting in a larger flame jet angle, which promotes broader and shorter flame structures, increasing the probability of plume interaction. Additionally, the diverging tapered nozzle increases the flow separation distance between the jet core and the nozzle wall, enhancing air entrainment into the nozzle and improving mixture formation within the main chamber. As a result, the radial velocity at the nozzle exits increases, contributing to improved mixture stratification. As combustion progresses, the pre-chamber jet momentum decreases, transitioning from turbulent jet-driven propagation to a mushroom cloud formation mechanism. This transition results in faster jet head velocity decay, which slows the merged flame jet progression. Another distinct feature of Case 4 is the pronounced dip between the first and second heat release peaks, suggesting that pre-chamber jet combustion exhibits a weaker energy-carrying effect and a delayed ignition trigger compared to other orifice geometries due to the fact that the expanding cross-section of the nozzle reduces jet penetration, leading to weaker turbulence and less effective charge mixing, delaying flame propagation. This disadvantageous combustion characteristic further exacerbates the delayed second-stage heat release, leading to an extended total combustion duration relative to other nozzle configurations.
4.5. Analysis of Chemical Composition and Emission Characteristics
Figure 22a–d present the major chemical species formed in the pre-chamber across various cases, providing insight into the timing and characteristics of flow reversal from the main chamber to the pre-chamber. The plots illustrate the mass fraction relative to the instantaneous total mass, where each time step accounts for the dynamically updated total mass. These traces illustrate the temporal evolution of fuel and the intermediate species critical to the ignition and combustion processes. Vertical dashed red lines indicate flow reversal events. The box in the upper right corner of each graph provides a magnified view of the residence time interval between the two backflow events. As previously established, the throat diameter is a critical parameter influencing the pre-chamber peak pressure. A smaller orifice diameter increases residence time, allowing for a greater pressure buildup, whereas a larger orifice diameter facilitates earlier pressure relief, modifying combustion phasing. Combustion in the pre-chamber initiates as spark energy dissociates fuel and oxygen molecules, forming OH radicals. As shown in Figure 22a–d, immediately after the start of sparking, CH4 rapidly depletes, causing OH radical formation. As combustion progresses, the CO and OH concentrations peak at the first heat release peak (Figure 18), promoting CO oxidation into CO2, which also reaches its maximum simultaneously. Since OH indicates reaction zones and heat release, it is a key parameter for analyzing flame structure and local fuel oxidation. The OH radical peak emerges within the residence zone, indicating the completion of pre-chamber charge combustion. If complete oxidation is not achieved, a significant portion of unburned hydrocarbons may be expelled during the exhaust stroke, adversely affecting combustion efficiency [19,29].
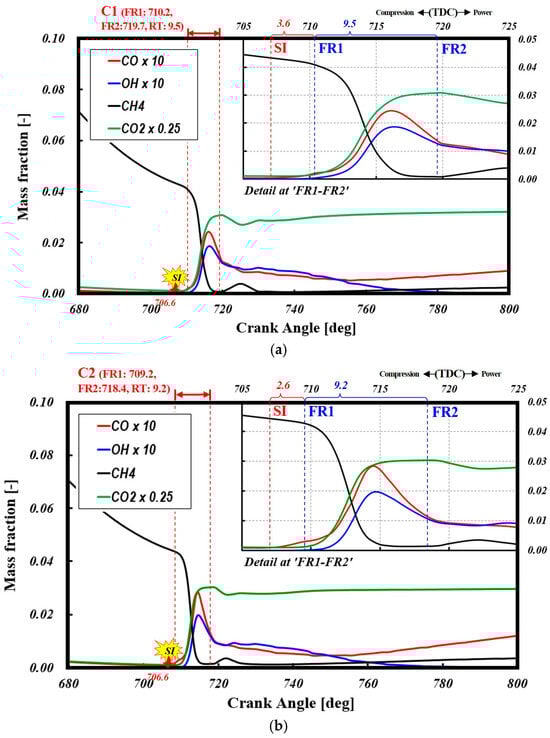
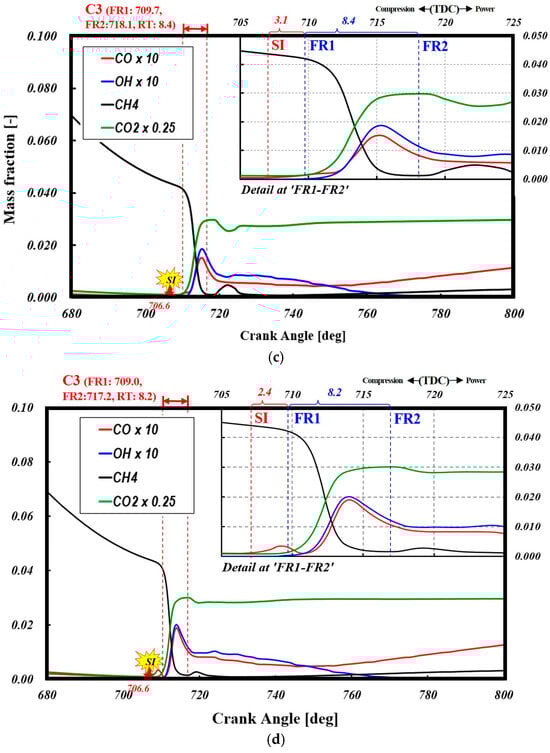
Figure 22.
Temporal variations of the main chemical species mass fraction formed in the pre-chamber for various cases. (a) Case 1; (b) Case 2; (c) Case 3; and (d) Case 4.
Following the second flow reversal (FR2), fresh charge and partially reacted species flow back into the pre-chamber, triggering localized combustion (post-flame reactions). This is confirmed by the second CH4 peak after FR2, indicating that high pre-chamber temperatures facilitate secondary ignition and radical formation, leading to additional combustion events. Near FR2, CO oxidation halts before decreasing, attributed to a declining OH radical concentration and temperature drop [12].
The temporal evolution and peak concentration profiles of OH radicals inside the pre-chamber exhibit no significant differences across the four orifice geometries. However, the maximum concentration and temporal evolution of CO show noticeable variations. This can be attributed to the fact that OH radicals are highly reactive intermediate species that rapidly reach a quasi-steady-state concentration during combustion. Additionally, since OH is continuously regenerated in reaction zones, its steady-state concentration remains relatively stable, independent of minor variations in orifice geometry.
In contrast, CO, as a combustion product, is strongly influenced by post-flame oxidation, residence time, and turbulence-driven mixing. Differences in orifice geometry affect flow dynamics, mixing intensity, and temperature distribution, leading to variations in CO oxidation rates.
In this study, Cases 1 and 2, which feature smaller orifices, increase flow restriction, prolong CO residence time, and result in higher CO accumulation. Conversely, Case 3, which has a higher scavenging efficiency and greater turbulent mixing intensity, exhibits relatively lower CO emissions. However, OH radicals, being short-lived and equilibrium-driven, are less affected by these geometric variations, leading to minimal or no change in their concentration.
Figure 23 presents the flame development during the combustion period (712~732 CA) for the four different orifice geometries in the y-y’ cross-section, using iso-contours of flame surface density. A distinct feature observed is the occurrence of post-flame combustion after FR2, attributed to fuel and combustion product backflow from the main chamber into the pre-chamber. In Case 1, post-flame combustion initiates the earliest (728 CA) compared to other cases due to having the highest flow resistance from the main chamber to the pre-chamber, which delays the influx of fuel and combustion products. Specifically, a longer residence time interval delays the flow reversal (FR) event, resulting in later post-flame reactions. As shown in Table 3, Case 1, with the longest residence time, exhibits strong post-flame reactions downstream of the pre-chamber at 728 CA, whereas Case 4, with the shortest residence time, shows earlier post-flame reactions at 720 CA. Case 2 exhibits the fastest and most intense flame development, attributed to the highest PC–MC pressure difference, as observed in Figure 14. In Case 4, the diverging tapered orifice produces the widest initial turbulent jet angle, leading to better spatial flame distribution during early flame development.
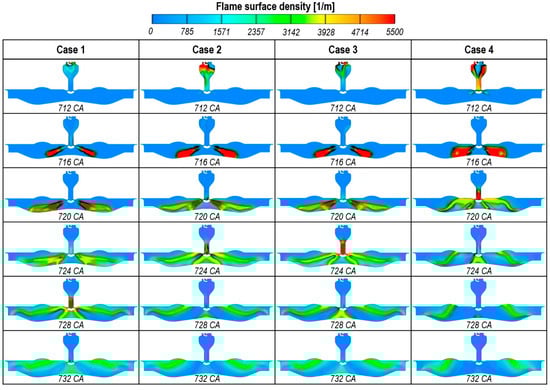
Figure 23.
Temporal sequential plot of distribution of flame surface density in pre- and main chamber.
These findings indicate that a lower resistance to reverse flow facilitates earlier post-flame combustion. Furthermore, post-flame ignition consistently occurs after FR2 due to fuel and combustion product entrainment into the pre-chamber.
Figure 24 illustrates the CH4 consumption rate during the residence time, along with the amounts of CO and NO produced during the gas residence time. As previously reported, a longer PC residence time tends to yield more complete combustion products than a shorter one, which directly influences the composition of the jets. The CH4 consumption rate increases proportionally with the residence time, and the amount of CO produced shows a similar proportional relationship. However, in Case 3, improved turbulent mixing and a high turbulent kinetic energy near the spark plug gap—favorable for stable flame propagation, as shown in Figure 16a—result in a shorter residence time interval compared to Case 2, yet the flames burn more completely. However, NO production does not exhibit the same proportionality with residence time, because NOx emissions depend not only on residence time, but also on factors such as the concentration distribution of the air–fuel mixture inside the pre-chamber, the presence of localized hot spots and rich pockets, and enhanced mixing that ensures complete combustion, thereby reducing UHC and CO while simultaneously suppressing NOx formation. Consequently, NOx generation in the pre-chamber is influenced by residence time as well as by factors such as a higher turbulent kinetic energy, which accelerates chemical reactions by increasing mixing rates, and uniform mixing in the main chamber, which minimizes rich zones that contribute to NOx formation. As demonstrated in Figure 16a and Figure 17, Case 3 exhibits the lowest NOx emissions by enhancing mixing through a higher turbulent kinetic energy while avoiding the formation of excessive local rich pockets within the pre-chamber.
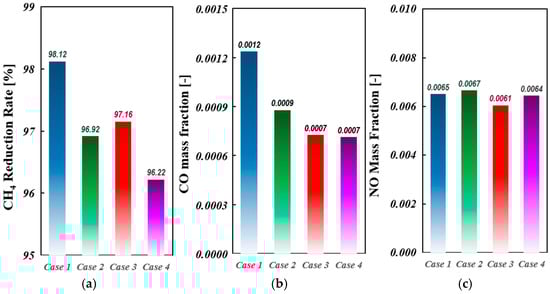
Figure 24.
Variations in chemical compositions in pre-chamber during residence time. (a) Consumption rate CH4 (%); (b) production of CO during residence time; and (c) production of NO during residence time.
Figure 25 shows how NO forms and evolves over the combustion cycle within the PC and MC of a PCSI engine fueled by natural gas, comparing four different orifice (nozzle) geometries. Around the spark timing (near 706 °CA), the flame initiates in the pre-chamber. As the flame expands, the local temperature and pressure increase, promoting the formation of thermal NO. Any geometry that intensifies local heat release or creates high-temperature regions will tend to increase NO formation early in the combustion process. A noteworthy feature of Figure 25a is that that, as the PCSI system approaches the FR2 timing, NO emissions gradually decrease. This occurs because a strong jet flow rapidly transfers combustion products into the main chamber and the mixture is very lean, so the peak NO level can be limited. Subsequently, when the main-chamber pressure exceeds that of the pre-chamber, backflow occurs, allowing unburned fuel, active radicals, and combustion products to re-enter the pre-chamber. This backflow can initiate secondary ignition and radical formation, leading to additional combustion events and a sharp increase in NO emissions. After NO concentrations reach a peak, they then stabilize or “freeze” as combustion temperatures drop and mixing disperses the hot regions.
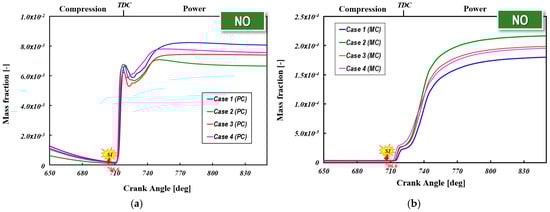
Figure 25.
Temporal evolution of NO emission for four different orifice geometries. (a) Pre-chamber and (b) main chamber.
NO typically forms most rapidly at high temperatures and near-stoichiometric conditions. If the design prolongs high-temperature residence time in the pre-chamber (due to slower venting or less mixing), NO formation can continue to rise (Case 1). The differences in the final NO levels among the four cases reflect how effectively each orifice design manages local temperature, residence time, and mixing intensity. Figure 25b presents the temporal evolution profile of NO in the main chamber for Case 2. In this case, the highest NO emissions are observed, which are attributed to the rapid temperature rise caused by strong auto-ignition and subsequent rapid combustion following the second peak of the heat release rate, as shown in Figure 21b. In contrast, Case 1 exhibits the lowest NO emissions; as indicated in Figure 21a, turbulent jets with a higher entropy discharged into the main chamber promote mixing and heat release over a broader area, thereby suppressing localized rapid temperature increases and maintaining a lower NO level. Cases 3 and 4 demonstrate that an increased effective flow area leads to a more uniform combustion distribution and suppresses prolonged high-temperature zones, resulting in lower NO peaks. These findings underscore that improved mixing through turbulent jets—by preventing localized rich zones and distributing heat more evenly—is critical for reducing NO emissions. Hence, in PCSI engines, the pre-chamber is not merely an ignition source for the main chamber charge, but is designed to generate large-scale mixing eddies or plumes that facilitate the consumption of the main-chamber charge, and when optimized, it serves as an effective means to suppress emissions such as NO and CO.
Figure 26 displays bottom views of the in-cylinder mixture temperature distribution at 745 °CA for three cross-sectional areas indicated within the black box and four different orifice geometries. Notably, localized hot spot zones exceeding 1800 K and quenching zones—resulting from turbulent jets impinging on the cylinder wall and piston surfaces—are clearly observed. These hot spot zones are generated by the interaction between the jets and the main chamber in-cylinder flow, and they may temporarily elevate temperatures, locally enhancing thermal NOx formation. The optimization of the orifice and pre-chamber volumes is required to mitigate localized NOx formation by distributing heat more evenly. In this study, the presence of eight orifices results in eight locally distributed quenching zones on the piston surface and the cylinder wall. The area and shape of each quenching zone differ because the momentum and flow rates of the hot jet plumes discharged from each of the eight orifices are not uniform, and these turbulent jets interact with the in-cylinder flow before reaching the quenching zones. The existence of these quenching zones, where combustion temperatures are relatively low, can lead to incomplete flame reactions, resulting in increased unburned hydrocarbon (UHC) and CO emissions. In contrast, in the case of Case 4, a quenching zone is not observed. This is attributed to the characteristics of the diverging tapered orifice, as shown in Figure 21d, where the flow velocity decreases slightly due to the expanding cross-sectional area, thereby reducing the penetration depth of the turbulent jet. Consequently, the combustion rate in the latter stages is significantly slower compared to other cases, which, due to the delayed reaction time, may increase the potential for NO formation. Ultimately, the CFD analysis in this study demonstrates that, by coupling the simulation of the PCSI engine’s emission characteristics with that of its in-cylinder thermal-fluid dynamics, the orifice and pre-chamber geometries can be optimized early in the design process, facilitating the development of high-efficiency, low-emission PCSI engines. However, to obtain more accurate results, there is a critical need to develop numerical models specifically tailored to lean conditions that account for turbulence–chemistry interactions and NOx emission mechanisms.
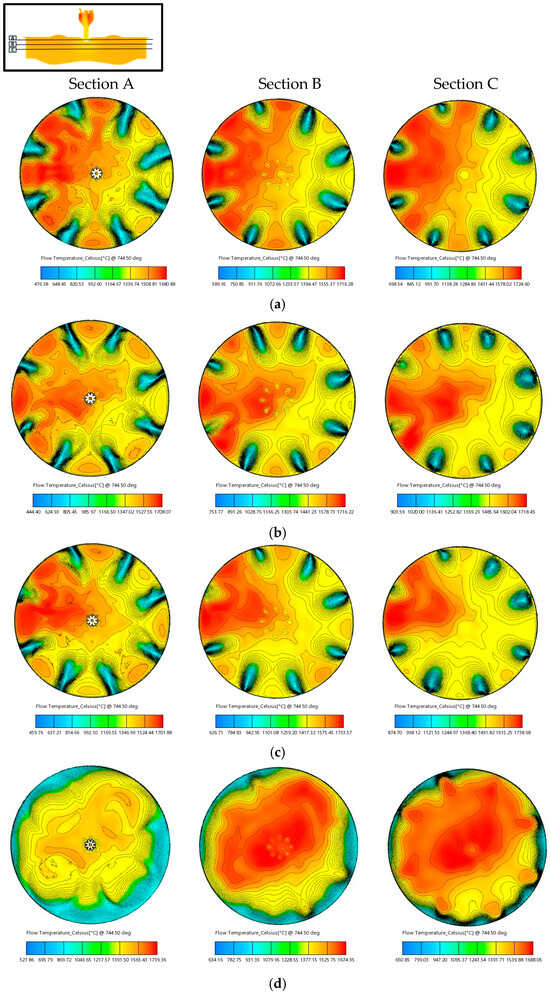
Figure 26.
Multi-sectional plots of temperature distribution of in-cylinder mixture for four different orifice geometries: (a) Case 1, (b) Case 2, (c) Case 3, and (d) Case 4 at 745 deg.
5. Conclusions
This study integrates computational analysis with experimental validation to optimize the active pre-chamber geometry in a turbocharged eight-cylinder PFI SI engine under real operating conditions. Key design parameters—pre-chamber volume, orifice diameter, cone angle, and nozzle geometry (diverging tapered nozzle)—are analyzed to enhance combustion efficiency and reduce emissions in large-bore marine PCSI engines.
Experimental validation confirms that optimized pre-chamber and orifice configurations mitigate localized high-temperature zones, reducing NO emissions. The findings highlight that enhanced turbulent mixing and dynamic control are essential for achieving lean-burn combustion with minimal pollutant formation. While the further refinement of turbulence–chemistry interaction models is required for improved NOx and CO predictions under ultra-lean conditions, this study provides a robust framework for advancing PCSI engine design toward a higher efficiency and lower environmental impact. The findings of this study can be summarized as follows:
- Bigalli et al. [5] demonstrated that optimizing the pre-chamber volume and nozzle diameter significantly enhances combustion efficiency, while Xu et al. [15] reported that flame stretch rate and turbulent dissipation strongly influence combustion phasing; the present study confirms that reducing the orifice diameter increases residence time, improving flame stability, and that increasing the turbulent kinetic energy (TKE) by 38% near the spark gap enhances ignition stability, further supporting efficient pre-chamber combustion dynamics.
- Recent work by Posch et al. [30] highlighted the limitations of the extended Zeldovich mechanism in ultra-lean PCSI conditions. In this study, NOx emissions were overestimated by ~24%, reinforcing the need to integrate low-temperature NO formation pathways (e.g., N2O mechanism) into future models.
- The flame development angle (CA 0–10%) is reduced by 57% when incorporating a pre-chamber ignition system compared to a conventional SI combustion system (30.9 CA → 12.7~15.6 CA across different pre-chamber geometries).
- The amount of residual gas varies significantly across the cases, with Case 1 retaining 10.8 times more residual gas than Case 2. This difference arises from the fact that, even with the same orifice diameter, variations in the orifice cone angle lead to substantial changes in scavenging efficiency during the compression stroke.
- The jet exit velocity is obtained by averaging the velocity magnitudes along the jet axis within the nozzle. At FR2, the jet head velocity decreases by 2 to 26% relative to the exit velocity, indicating deceleration effects. Among all cases, Case 4 exhibits the highest jet speed ratio, demonstrating effective momentum retention during late-stage flame development.
- CH4 oxidation rate and CO formation scale with residence time. In Case 3, enhanced turbulent mixing and a high turbulent kinetic energy (TKE) near the spark gap—which promote stable flame propagation—lead to a shorter residence time than Case 2, yet result in more complete combustion.
- The NOx emissions in Case 3 were 24.7% higher than experimental values, likely due to the overestimation of thermal NOx formation in the CFD model.
- This study optimizes the ECFM-3Z model by systematically varying the stretch factor (α) from 0.3 to 0.77, applying an empirical correlation that expresses α as a function of the flame-based Karlovitz number. The results indicate that increasing α enhances both the heat release rate and its rate of change, signifying faster combustion. However, despite extensive tuning, the findings reveal delayed combustion phasing, underscoring inaccuracies in the turbulence–flame interaction model, which fails to capture the anisotropic nature of turbulent flames in PCSI engines.
Author Contributions
S.-J.J.; methodology, S.-J.J.; software, S.-J.J. and S.-J.M.; validation, S.-J.J. and S.S.; formal analysis, S.-J.J.; investigation, S.-J.J.; resources, S.-J.J. and S.S.; data curation, S.-J.J., S.-J.M. and S.S.; writing—original draft preparation, S.-J.J.; writing—review and editing, S.-J.J.; visualization, S.-J.J. and S.-J.M.; supervision, S.-J.J.; project administration, S.-J.J.; funding acquisition, S.-J.J. All authors have read and agreed to the published version of the manuscript.
Funding
This work was supported by the Material and Parts Technology Development Project of the Korea Institute for Advancement of Technology, funded by the Korean government (Grant No. 20004900).
Data Availability Statement
The original contributions presented in the study are included in the article, further inquiries can be directed to the corresponding author.
Conflicts of Interest
Author Seokpan Seo was employed by the company STX Engine Co., Ltd. The remaining authors declare that the research was conducted in the absence of any commercial or financial relationships that could be construed as a potential conflict of interest.
References
- Kirkpatrick, A.; Kim, G.H.; Olsen, D. CFD Modeling of the Performance of a Prechamber for Use in a Large Bore Natural Gas Engine. In Proceedings of the ASME International Combustion Engine Division Spring Technical Conference, Chicago, IL, USA, 11 November 2008; pp. 397–403. [Google Scholar] [CrossRef]
- Payri, R.; Novella, R.; Barbery, I.; Bori-Fabra, O. Numerical and experimental evaluation of the passive pre-chamber concept for future CNG SI engines. Appl. Therm. Eng. 2023, 230, 120754. [Google Scholar] [CrossRef]
- Riccardi, M.; De Bellis, V.; Sforza, L.; Tunestål, P.; Bozza, F.; Beatrice, C.; Lucchini, T. Experimental and Numerical Analysis of an Active Pre-Chamber Engine Fuelled with Natural Gas; AE Technical Paper 2023-01-0185; SAE International: Warrendale, PA, USA, 2023. [Google Scholar] [CrossRef]
- Winter, H.; Schnessl, E.; Pirker, G.; Zelenka, J.; Wimmer, A. Application of CFD Simulation to Optimize Combustion in Prechamber Gas Engines with Port Injection. In Proceedings of the ECCM-ECFD, 7th European Conference on Computational Fluid Dynamics, Glasgow, UK, 11–15 June 2018. [Google Scholar]
- Bigalli, S.; Catalani, I.; Balduzzi, F.; Matteazzi, N.; Agostinelli, L.; De Luca, M.; Ferrara, G. Numerical investigation on the performance of a 4-stroke engine with different passive pre-chamber geometries using a detailed chemistry solver. Energies 2022, 15, 4968. [Google Scholar] [CrossRef]
- Xue, Y.; Wang, P.; Zhao, Q.; Ji, S.; Yong, C.; Yin, W. Effect of Spark Timing on the Pre-Chamber Jet Ignition in a Lean-Burn Natural Gas Engine. Int. J. Engine Res. 2023, 24, 3556–3573. [Google Scholar] [CrossRef]
- Li, F.; Zhao, Z.; Wang, B.; Wang, Z. Experimental study of pre-chamber jet ignition in a rapid compression machine and single-cylinder natural gas engine. Int. J. Engine Res. 2019, 22, 1342–1356. [Google Scholar] [CrossRef]
- Wang, T.; Zhang, L.; Li, L.; Wu, J.; Wang, H. Numerical comparative study on the in-cylinder mixing performance of port fuel injection and direct injection gas-fueled engine. Energies 2022, 15, 5223. [Google Scholar] [CrossRef]
- Novella, R.; Gómez-Soriano, J.; Martinez-Hernandiz, P.J.; Libert, C.; Rampanarivo, F. Improving the performance of the passive pre-chamber ignition concept for spark-ignition engines fueled with natural gas. Fuel 2021, 290, 119971. [Google Scholar] [CrossRef]
- Kim, J.; Scarcelli, R.; Som, S.; Shah, A.; Biruduganti, M.S.; Longman, D.E. Numerical Investigation of a Fueled Pre-Chamber Spark-Ignition Natural Gas Engine. Int. J. Engine Res. 2021, 23, 1475–1494. [Google Scholar] [CrossRef]
- Shapiro, E.; Ahmed, I.; Tiney, N. Advanced ignition modelling for pre-chamber combustion in lean burn gas engines. In Proceedings of the Ignition Systems for Gasoline Engines: Internationale Tagung Zündsysteme für Ottomotoren, Berlin, Germany, 6–7 December 2018; p. 104. [Google Scholar]
- Distaso, E.; Amirante, R.; Cassone, E.; De Palma, P.; Sementa, P.; Tamburrano, P.; Vaglieco, B. Analysis of the Combustion Process in a Lean-Burning Turbulent Jet Ignition Engine Fueled with Methane. Energy Convers. Manag. 2020, 223, 113247–113257. [Google Scholar] [CrossRef]
- Shah, A.; Tunestål, P.; Johansson, B. CFD Simulations of Pre-Chamber Jets’ Mixing Characteristics in a Heavy Duty Natural Gas Engine; SAE Technical Paper 2015-01-1890; SAE International: Warrendale, PA, USA, 2015. [Google Scholar] [CrossRef]
- Jeong, S.-J. CFD Simulation of Pre-Chamber Spark-Ignition Engines—A Perspective Review. Energies 2024, 17, 4696–4985. [Google Scholar] [CrossRef]
- Xu, L.; Li, G.; Yao, M.; Zheng, Z.; Wang, H. Numerical Investigation on the Jet Characteristics and Combustion Process of an Active Prechamber Combustion System Fueled with Natural Gas. Energies 2022, 15, 5356–5372. [Google Scholar] [CrossRef]
- Bolla, M.; Shapiro, E.; Tiney, N.; Kyrtatos, P.; Kotzagianni, M.; Boulouchos, K. Numerical Simulations of Pre-Chamber Combustion in an Optically Accessible RCEM; SAE Technical Paper 2019-01-0224; SAE International: Warrendale, PA, USA, 2019. [Google Scholar] [CrossRef]
- Mastorakos, E.; Allison, P.; Giusti, A.; De Oliveira, P.; Benekos, S.; Wright, Y.; Frouzakis, C.; Boulouchos, K. Fundamental aspects of jet ignition for natural gas engines. SAE Int. J. Engines 2017, 10, 2429–2438. [Google Scholar] [CrossRef]
- Baumgartner, L.S.; Wohlgemuth, S.; Zirngibl, S.; Wachtmeister, G. Investigation of a Methane Scavenged Prechamber for Increased Efficiency of a Lean-Burn Natural Gas Engine for Automotive Applications; SAE Technical Paper 2015-01-0866; SAE International: Warrendale, PA, USA, 2015. [Google Scholar]
- Wang, M.; Leng, X.; He, Z.; Wei, S.; Chen, L.; Jin, Y. A Numerical Study on the Effects of the Orifice Geometry Between Pre- and Main Chamber for a Natural Gas Engine; SAE Technical Paper 2017-01-2195; SAE International: Warrendale, PA, USA, 2017. [Google Scholar] [CrossRef]
- Lu, C.; Song, E.; Xu, C.; Ni, Z.; Yang, X.; Dong, Q. Analysis of Performance of Passive Pre-Chamber on a Lean-Burn Natural Gas Engine under Low Load. J. Mar. Sci. Eng. 2023, 11, 596. [Google Scholar] [CrossRef]
- Krajnović, J.; Sjerić, M.; Tomić, R.; Kozarac, D. A Novel Concept of Active Pre-Chamber Engine with a Single Injector—The Passive Main Chamber Approach. Appl. Therm. Eng. 2024, 250, 123509. [Google Scholar] [CrossRef]
- Lopez, J.J.; Novella, R.; Gomez-Soriano, J.; Martinez-Hernandiz, P.J.; Rampanarivo, F.; Libert, C.; Dabiri, M. Advantages of the Unscavenged Pre-Chamber Ignition System in Turbocharged Natural Gas Engines for Automotive Applications. Energy 2021, 218, 119466. [Google Scholar] [CrossRef]
- Shah, A.; Tunestal, P.; Johansson, B. Effect of Pre-Chamber Volume and Nozzle Diameter on Pre-Chamber Ignition in Heavy Duty Natural Gas Engines; SAE Technical Paper 2015-01-0867; SAE International: Warrendale, PA, USA, 2015. [Google Scholar]
- Biswas, S.; Tanvir, S.; Wang, H.; Qiao, L. On Ignition Mechanisms of Premixed CH4/Air and H2/Air Using a Hot Turbulent Jet Generated by Pre-Chamber Combustion. Appl. Therm. Eng. 2016, 106, 925–937. [Google Scholar] [CrossRef]
- Kyrtatos, P.; Bolla, M.; Benekos, S.; Bardis, K.; Xu, G.; Kotzagianni, M.; Wright, Y.M.; Giannakopoulos, G.; Frouzakis, C.E.; Boulouchos, K. Advanced Methods for Gas-Prechamber Combustion Research and Model Development. In Proceedings of the 16th Conference, the Working Process of the Internal Combustion Engine, Graz, Austria, 28–29 September 2017; pp. 167–183. [Google Scholar]
- Kim, J.; Scarcelli, R.; Som, S.; Shah, A.; Biruduganti, M.S.; Longman, D.E. Assessment of turbulent combustion models for simulating prechamber ignition in a natural gas engine. J. Eng. Gas Turbines Power 2021, 143, 091004. [Google Scholar] [CrossRef]
- Kim, J.; Scarcelli, R.; Som, S.; Shah, A.; Biruduganti, M.S.; Longman, D.E. Evaluation of Combustion Models for CFD Simulation of Pre-Chamber Ignition in a Natural Gas Engine. In Proceedings of the 11th U.S. National Combustion Meeting, Pasadena, CA, USA, 24–27 March 2019. [Google Scholar]
- Li, W.; Ma, J.; Zhu, T.; Wei, H.; Pan, J. Nozzle Design of Plug-and-Play Passive Pre-Chamber Ignition Systems for Natural Gas Engines. Appl. Sci. 2023, 13, 9468. [Google Scholar] [CrossRef]
- Silva, M.; Sanal, S.; Hlaing, P.; Cenker, E.; Johansson, B.; Im, H.G. Effects of Geometry on Passive Pre-Chamber Combustion Characteristics; SAE Technical Paper 2020-01-0821; SAE International: Warrendale, PA, USA, 2020. [Google Scholar]
- Posch, S.; Winter, H.; Zelenka, J.; Pirker, G.; Wimmer, A. Development of a Tool for the Preliminary Design of Large Engine Prechambers Using Machine Learning Approaches. Appl. Therm. Eng. 2021, 191, 116774. [Google Scholar] [CrossRef]
- Rao, A.; Liu, Y.; Ma, F. Numerical Simulation of Nitric Oxide (NO) Emission for HCNG-Fueled SI Engine Using Zeldovich, Prompt (HCN), and Nitrous Oxide (N2O) Mechanisms Along with Error Reduction Novel Sub-Models and Their Classification Through Machine Learning Algorithms. Fuel 2023, 333, 126320. [Google Scholar] [CrossRef]
- Bozza, F.; Teodosio, L.; Krajnović, J.; Sjerić, M.; De Bellis, V.; Malfi, E. Extensive validation of a combustion and pollutant emission model of a pre-chamber engine including different pre-chamber geometries. Fuel 2024, 373, 132282. [Google Scholar] [CrossRef]
- Sanal, S.; Echeverri Marquez, M.; Silva, M.; Cenker, E.; Im, H.G. A Numerical Study on the Effect of a Pre-Chamber Initiated Turbulent Jet on Main Chamber Combustion; SAE Technical Paper 2022-01-0469; SAE International: Warrendale, PA, USA, 2022. [Google Scholar] [CrossRef]
- AVL. AVL FIRE, Software Documentation, version 2021 R2; AVL: Graz, Austria, 2021. [Google Scholar]
- Huang, S.; Li, T.; Chen, R.; Yi, P.; Li, S.; Wang, X.; Wang, N. Computational analysis of the scavenging characteristic and optimization of passive pre-chamber. Appl. Therm. Eng. 2024, 243, 122676. [Google Scholar] [CrossRef]
- Syrovatka, Z.; Vitek, O.; Vavra, J.; Takats, M. Scavenged Pre-Chamber Volume Effect on Gas Engine Performance and Emis-Sions; SAE Technical Paper 2019-01-0258; SAE International: Warrendale, PA, USA, 2019. [Google Scholar] [CrossRef]
- Hanjalić, K.; Popovac, M.; Hadžiabdić, M. A robust near-wall elliptic-relaxation eddy-viscosity turbulence model for CFD. Int. J. Heat Fluid Flow 2004, 25, 1047–1051. [Google Scholar]
- Durbin, P.A. Near-wall turbulence closure modeling without “damping functions”. Theor. Comput. Fluid Dyn. 1991, 3, 1–13. [Google Scholar] [CrossRef]
- Nzebuka, G.G.; Waheed, M.A. Thermal evolution in the direct chill casting of an Al-4 pct Cu alloy using the low-Reynolds number turbulence model. Int. J. Therm. Sci. 2020, 147, 106152. [Google Scholar]
- Wu, X.; Durbin, P.A. Numerical simulation of heat transfer in a transitional boundary layer with passing wakes. J. Heat Transf. 1999, 122, 248–257. [Google Scholar]
- Fonseca, L.; Braga, R.; Morais, L.F.; Huebner, R.; Valle, R.M. Tuning the Parameters of the ECFM-3Z Combustion Model for CFD 3D Simulation of a Two-Valve Engine Fueled with Ethanol; SAE Technical Paper 2016-36-0383; SAE International: Warrendale, PA, USA, 2016. [Google Scholar]
- Meneveau, C.; Sreenivasan, K.R. The Multifractal Nature of Turbulent Energy Dissipation. J. Fluid Mech. 1991, 224, 429–484. [Google Scholar]
- Benajesa, J.; Novellaa, R.; Gomez-Sorianoa, J.; Barberya, I.; Libertb, C.; Rampanarivob, F.; Dabirib, M. Computational assessment towards understanding the energy conversion and combustion process of lean mixtures in passive pre-chamber ignited engines. Appl. Therm. Eng. 2020, 178, 115501. [Google Scholar]
- Metghalchi, M.; Keck, J.C. Burning velocities of mixtures of air with methanol, isooctane, and indolene at high pressure and temperature. Combust. Flame 1982, 48, 191–210. [Google Scholar]
- Meneveau, C.; Poinsot, T. Stretching and quenching of flamelets in Premixed turbulent combustion. Combust. Flame 1991, 86, 311–332. [Google Scholar]
- Veynante, D.; Vervisch, L. Turbulent Combustion Modeling. Prog. Energy Combust. Sci. 2002, 28, 193–266. [Google Scholar] [CrossRef]
- Hautman, D.J.; Dryer, F.L.; Schug, K.P.; Glassman, I. A Multiple-step overall kinetic mechanism for the oxidation of hydrocarbons. Combust. Sci. Technol. 1981, 25, 219–235. [Google Scholar]
- Jay, S.; Béard, P.; Pires da Cruz, A. Modeling Coupled Processes of CO and Soot Formation and Oxidation for Conventional and HCCI Diesel Combustion; SAE Technical Paper 2007-01-0162; SAE International: Warrendale, PA, USA, 2007. [Google Scholar] [CrossRef]
- Heywood, J.B. Internal Combustion Engines Fundamentals, 2nd ed.; Mc Graw Hill Publication: New York, NY, USA, 2018; pp. 154–196. [Google Scholar]
- Benson, R.S.; Horlock, J.H.; Winterbone, D.E. The Thermodynamics and Gas Dynamics of Internal-Combustion Engines; Clarendon Press: Oxford, UK, 1982; Volume I, II. [Google Scholar]
- Van Gerpen, J. Documentation of the Benson Diesel Engine Simulation Program; Technical Report 88-C-025; U.S. Army Aviation and Technology Activity-AVSCOM: Cleveland, OH, USA, 1988. [Google Scholar]
- Chiodi, M. An Innovative 3D-CFD-approach towards virtual development of internal combustion engines. Ph.D. Thesis, Universität Stuttgart, Vieweg+Teubner Research Verlag, Stuttgart, Germany, 2010. [Google Scholar]
- Tromellini, R.; Kumar, M.; Moeeni, S.; Chiodi, M.; Bargende, M.; Kuboyama, T.; Moriyoshi, Y. 3D-CFD Full Engine Simulation Application for Post-Oxidation Description; SAE Technical Paper 2021-24-0016; SAE International: Warrendale, PA, USA, 2021. [Google Scholar] [CrossRef]
- Wanker, R. Simulation Methods Covering Recent Technologies for GDI Engines. In Proceedings of the AVL International Simulation Conference, Graz, Austria, 22–24 October 2019. [Google Scholar]
- Onofrio, G.; Napolitano, P.; Tunestal, P.; Beatrice, C. Combustion sensitivity to the hole size in an active prechamber ultra-lean heavy-duty natural gas engine. Energy 2021, 235, 121298. [Google Scholar]
- Rajasegar, R.; Niki, Y.; Garcia-Oliver, J.M.; Li, Z.; Musculus, M.P.B. Fundamental insights on ignition and combustion of natural gas in an active fueled prechamber spark-ignition system. Combust. Flame 2021, 232, 111561. [Google Scholar]
Disclaimer/Publisher’s Note: The statements, opinions and data contained in all publications are solely those of the individual author(s) and contributor(s) and not of MDPI and/or the editor(s). MDPI and/or the editor(s) disclaim responsibility for any injury to people or property resulting from any ideas, methods, instructions or products referred to in the content. |
© 2025 by the authors. Licensee MDPI, Basel, Switzerland. This article is an open access article distributed under the terms and conditions of the Creative Commons Attribution (CC BY) license (https://creativecommons.org/licenses/by/4.0/).