
A Numerical Study on Leakage Flow in the Shroud Cavity of a Centrifugal Impeller


Abstract
1. Introduction
2. Numerical Methods and Computational Models
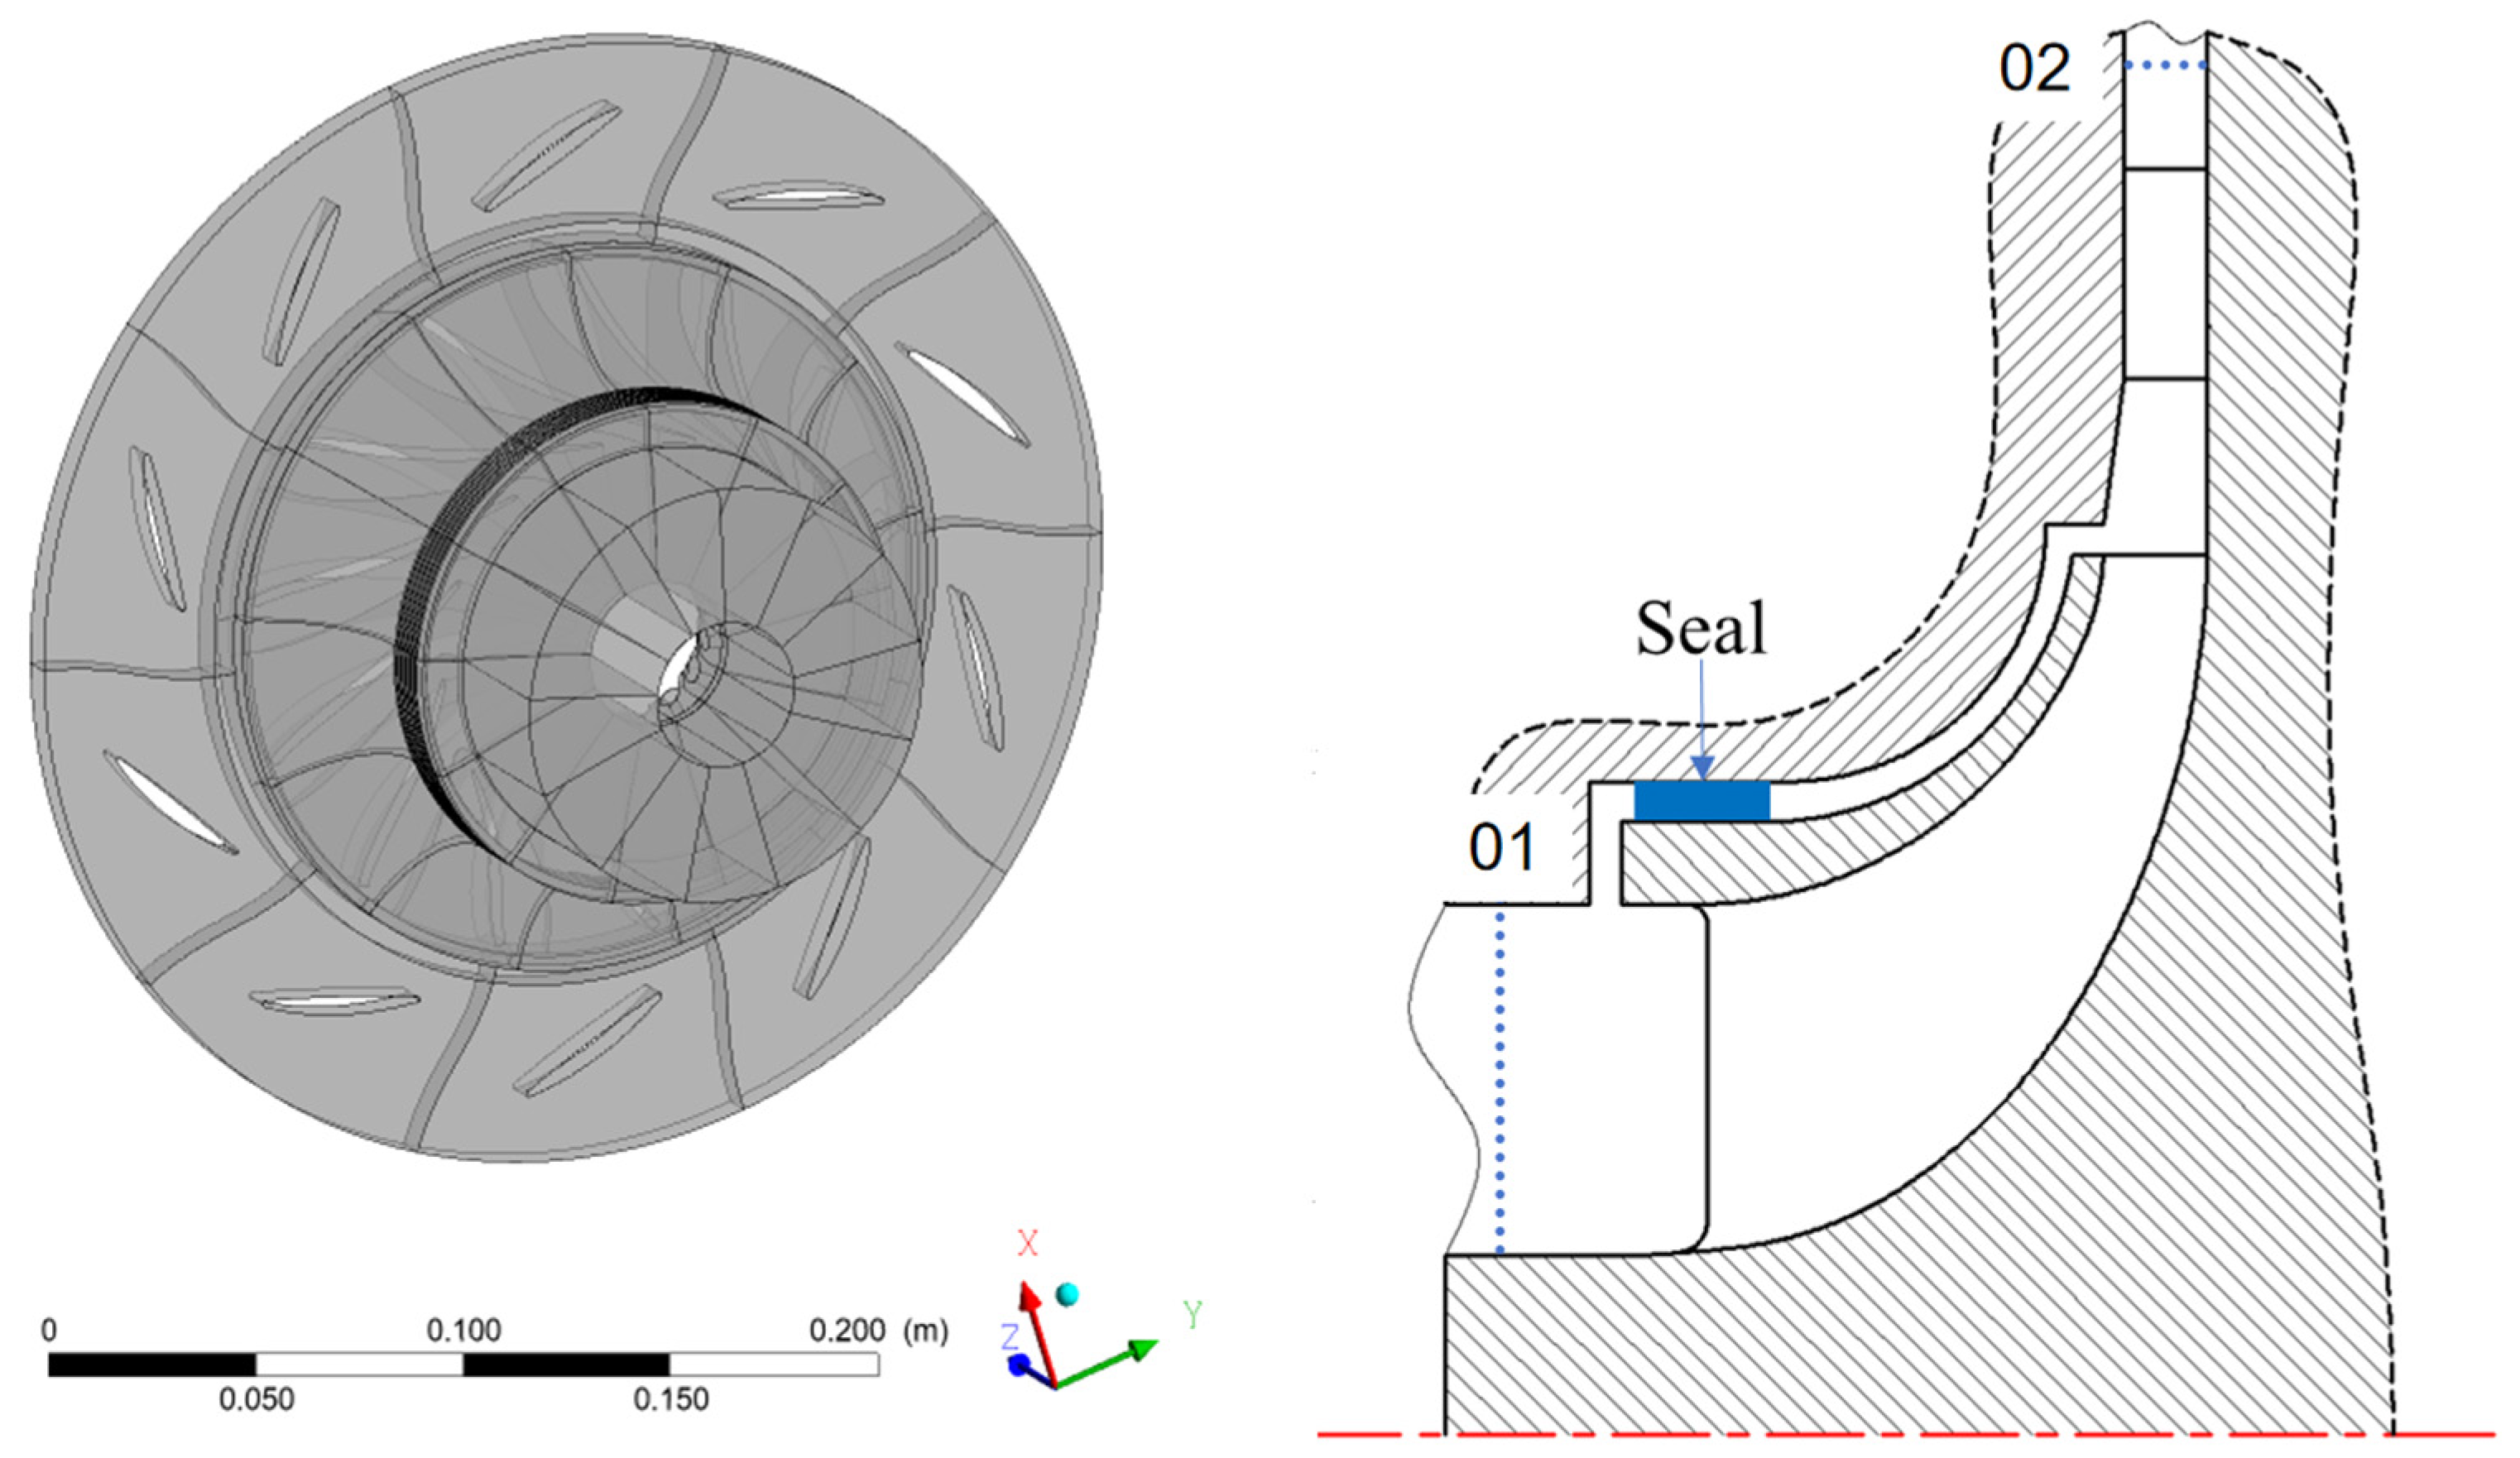
2.1. Research Object
2.2. Method and Verification
2.2.1. Numerical Method
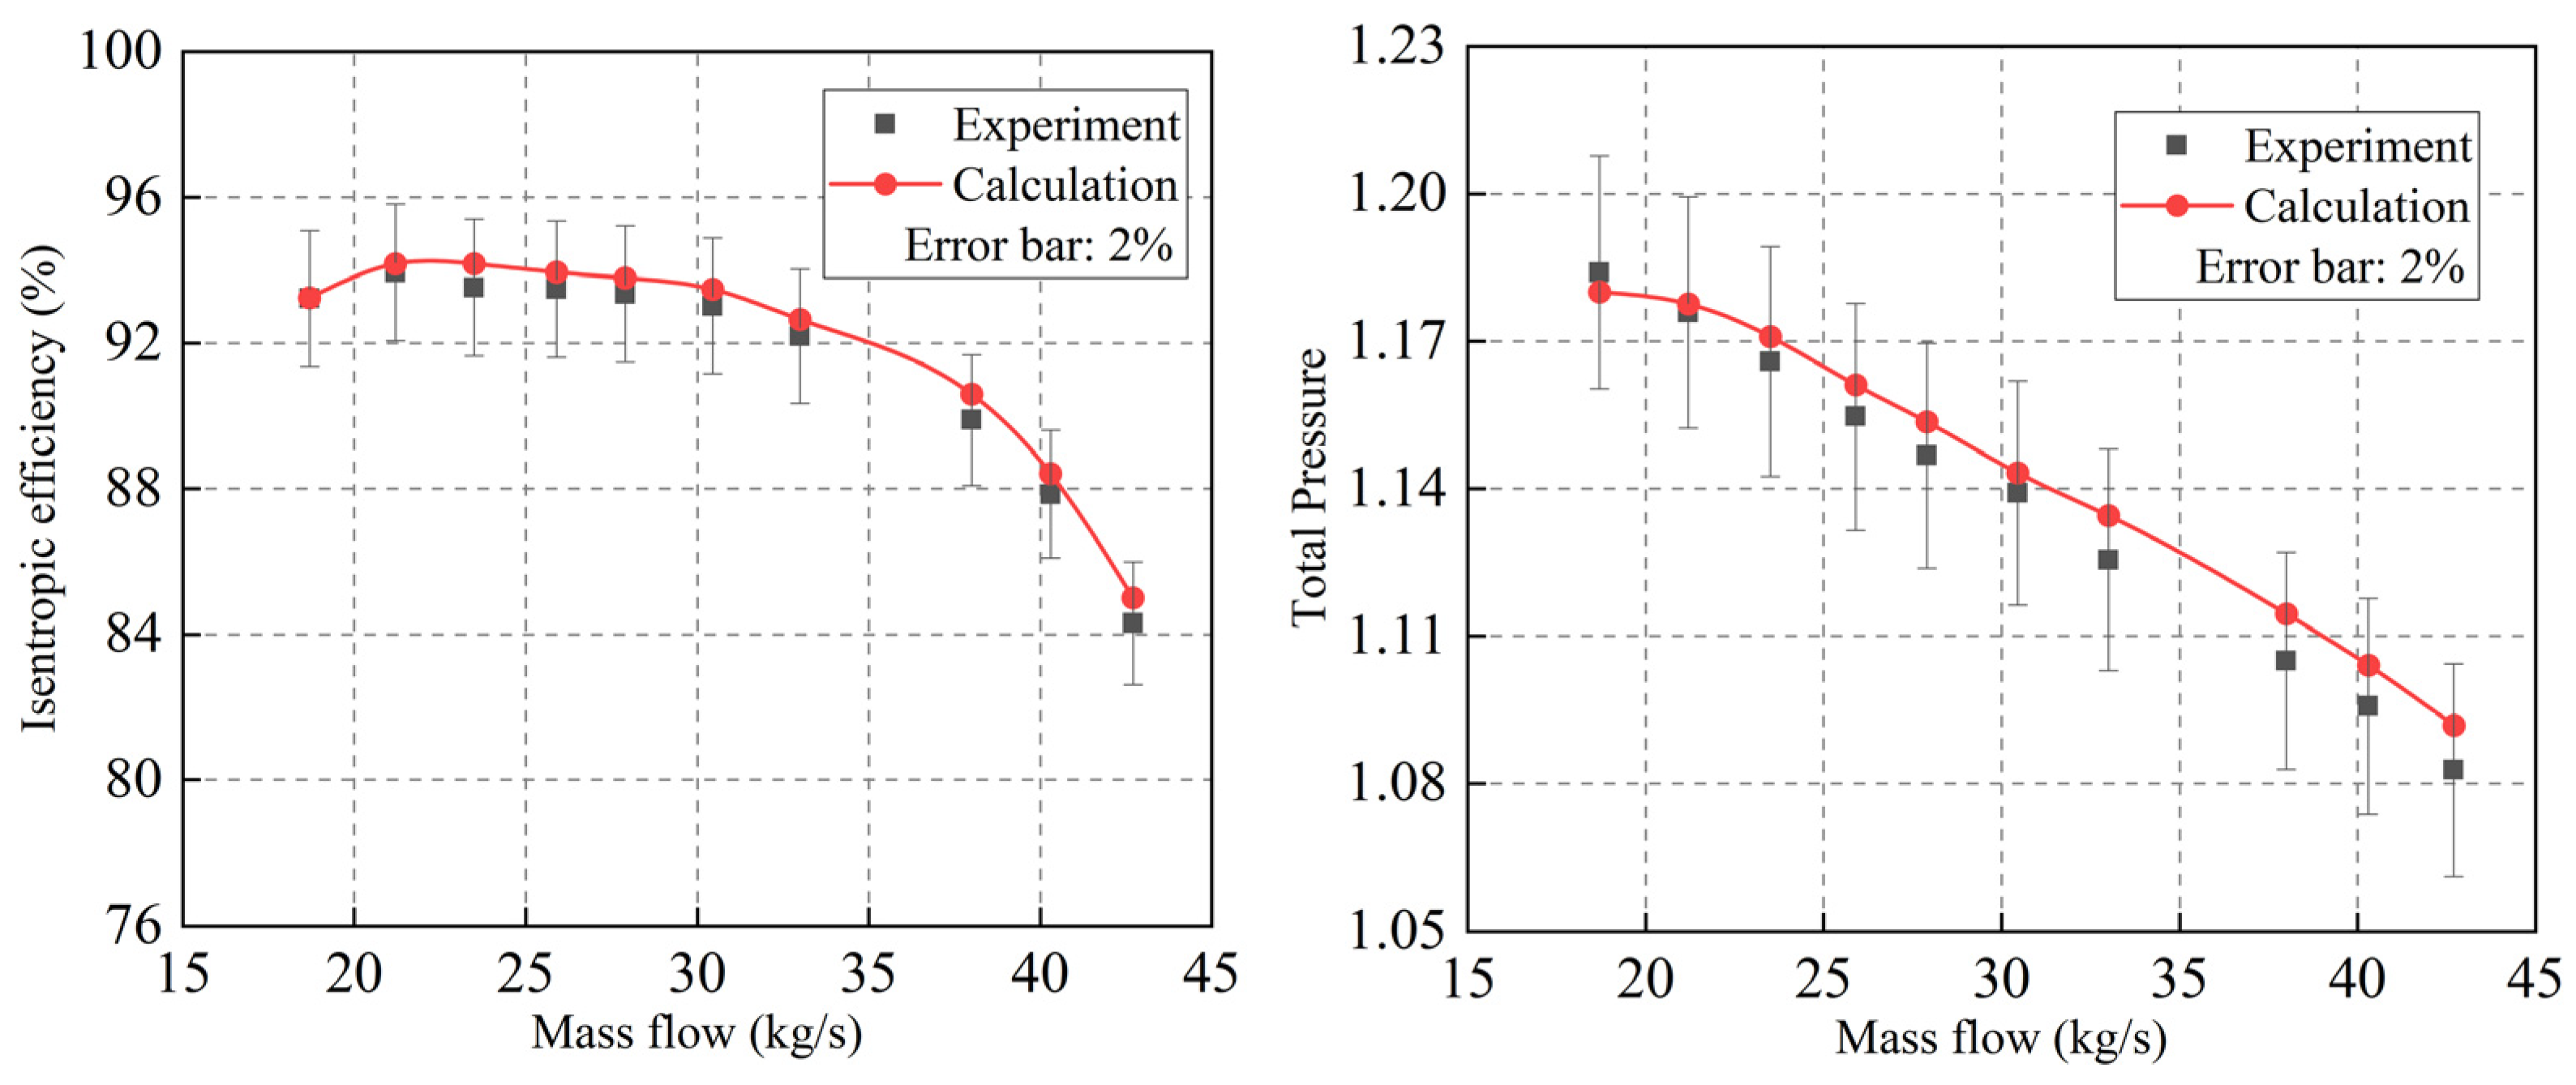
2.2.2. Numerical Method Verification
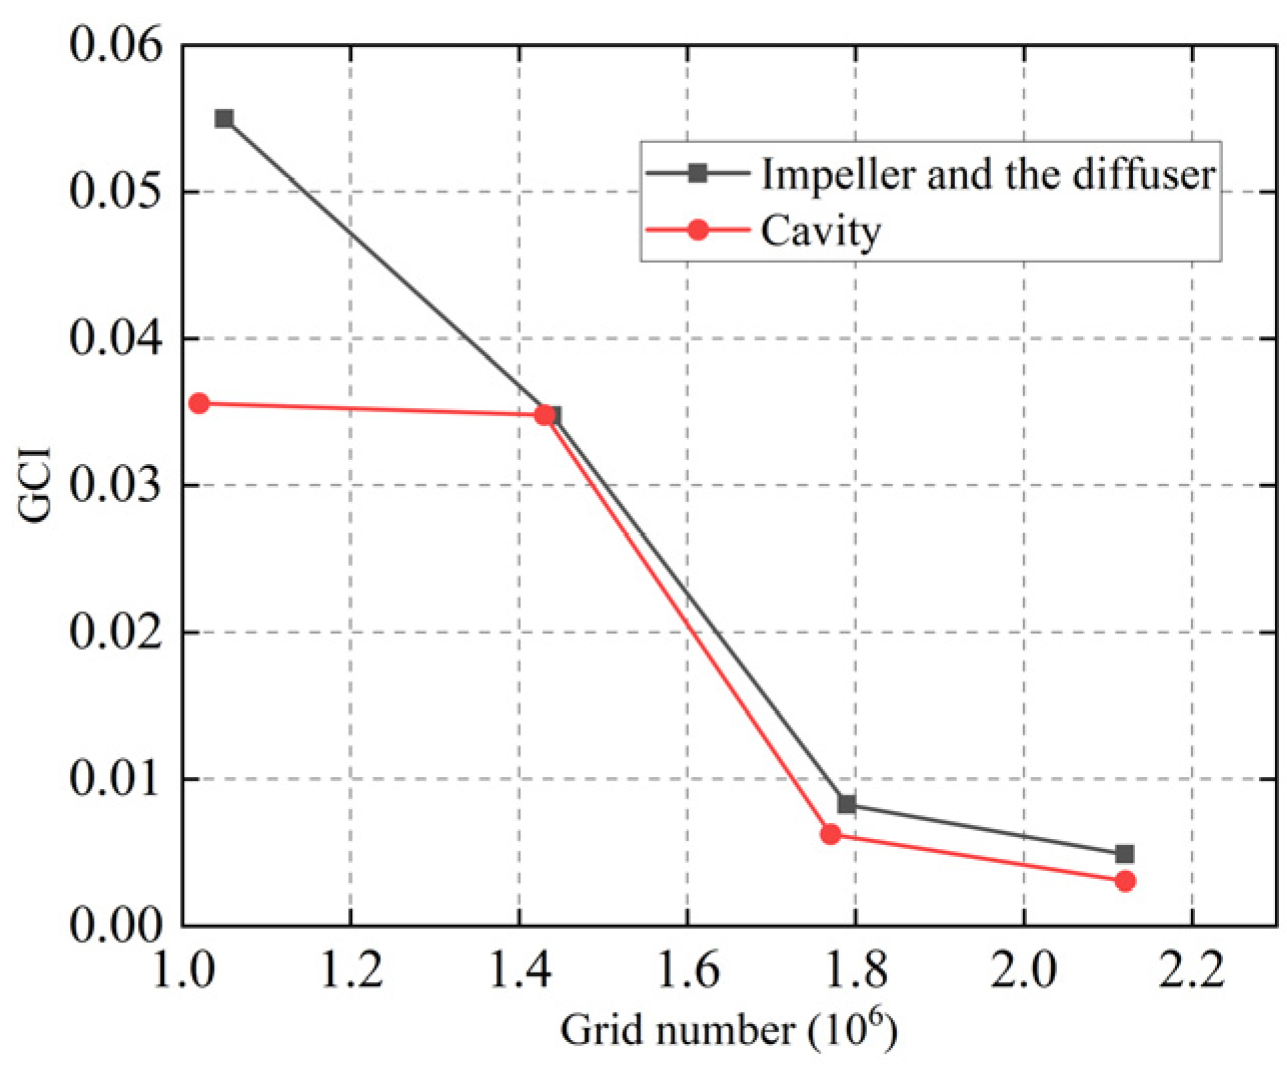
2.2.3. Mesh Independence Verification
2.3. Equations
3. Research and Analysis
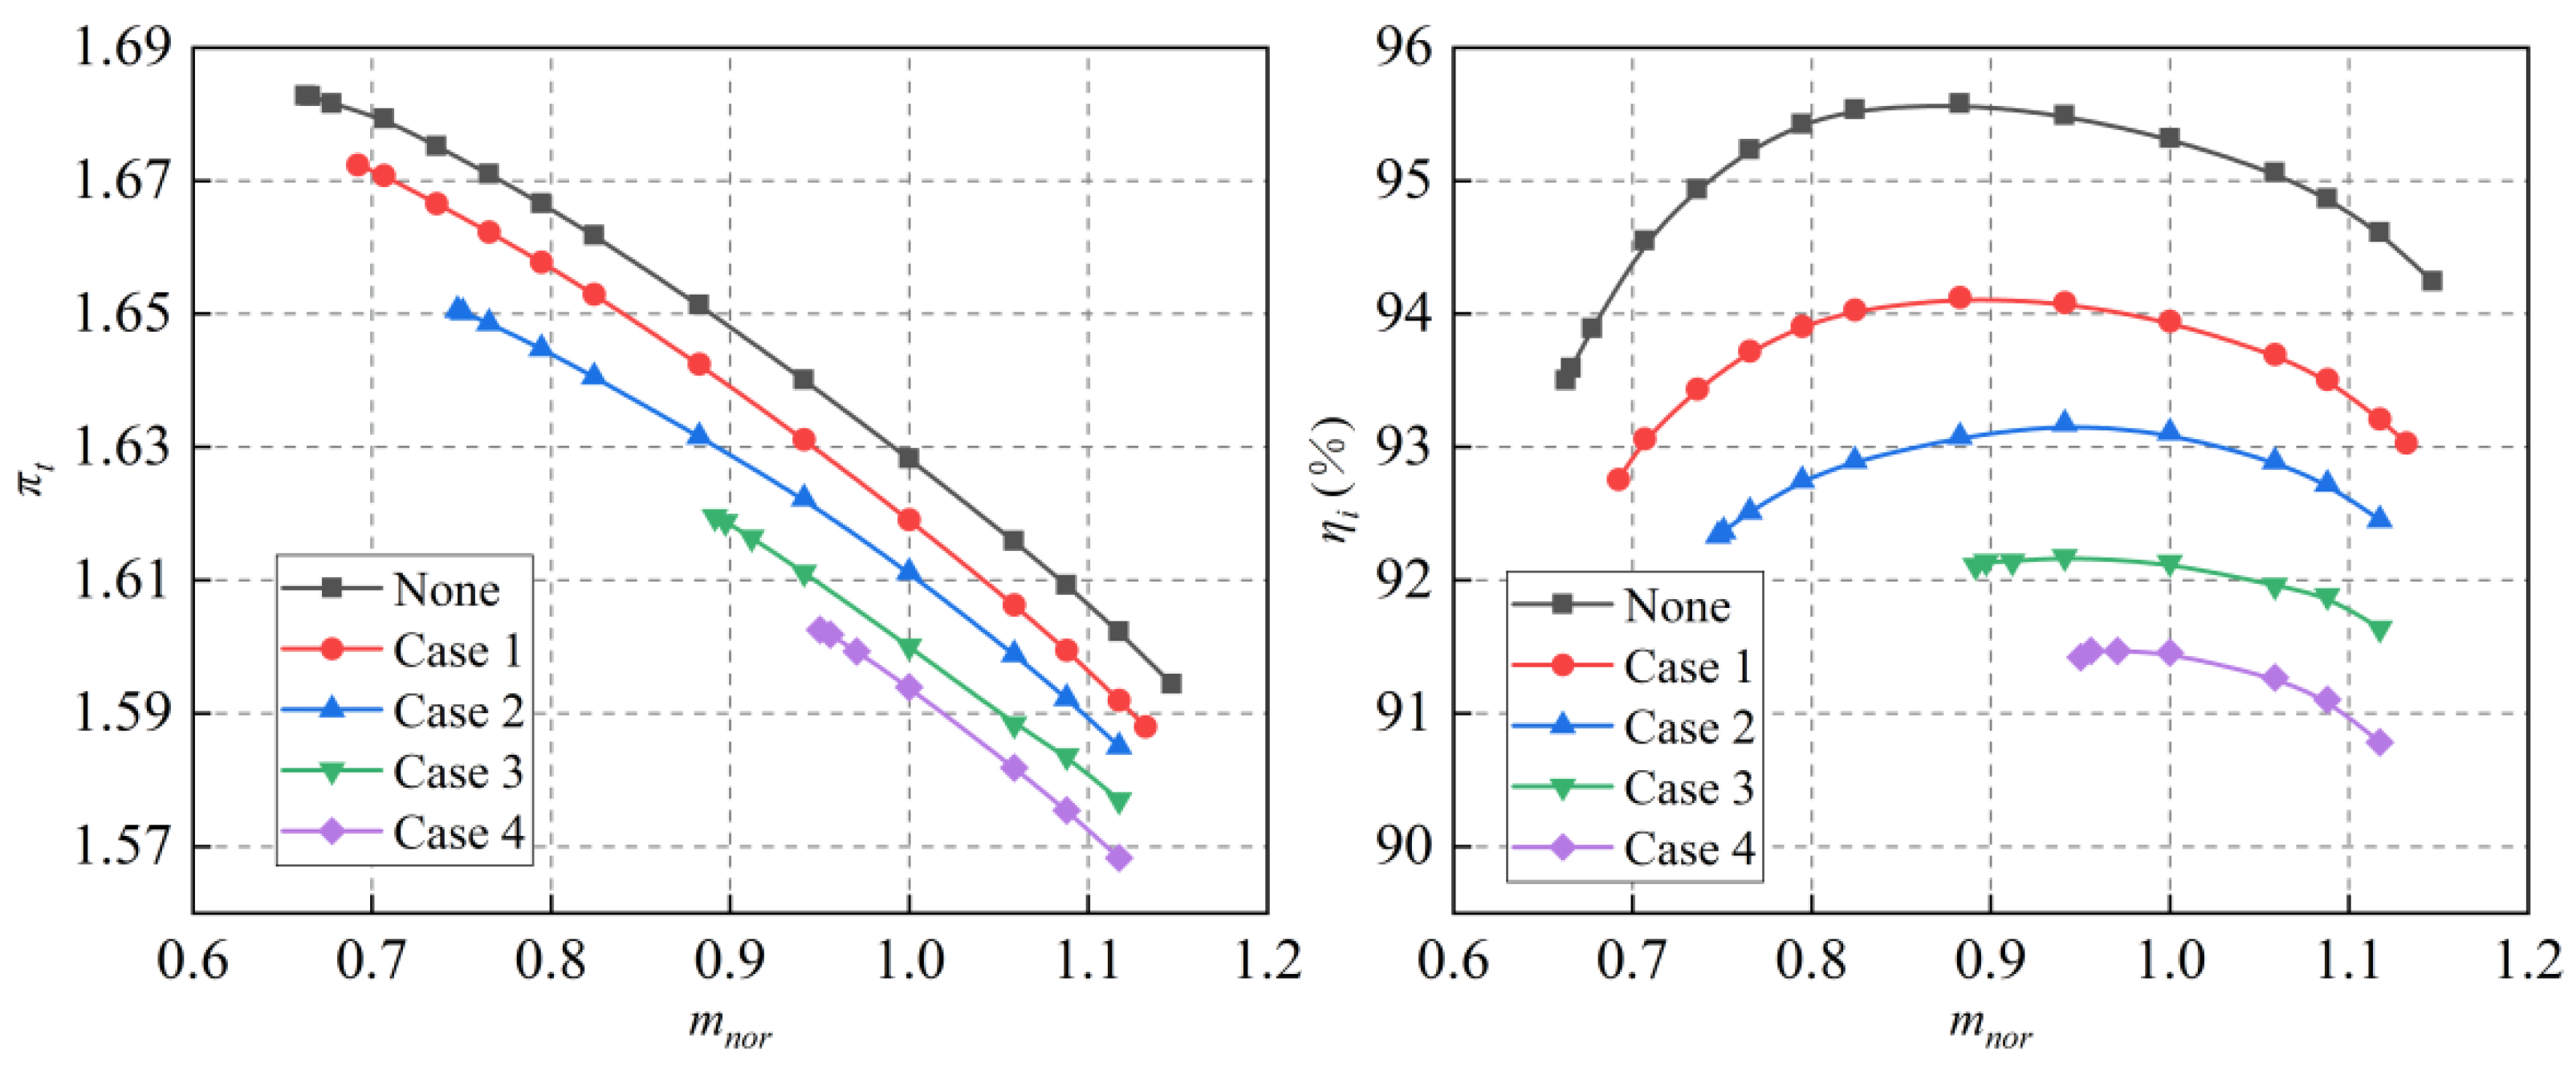
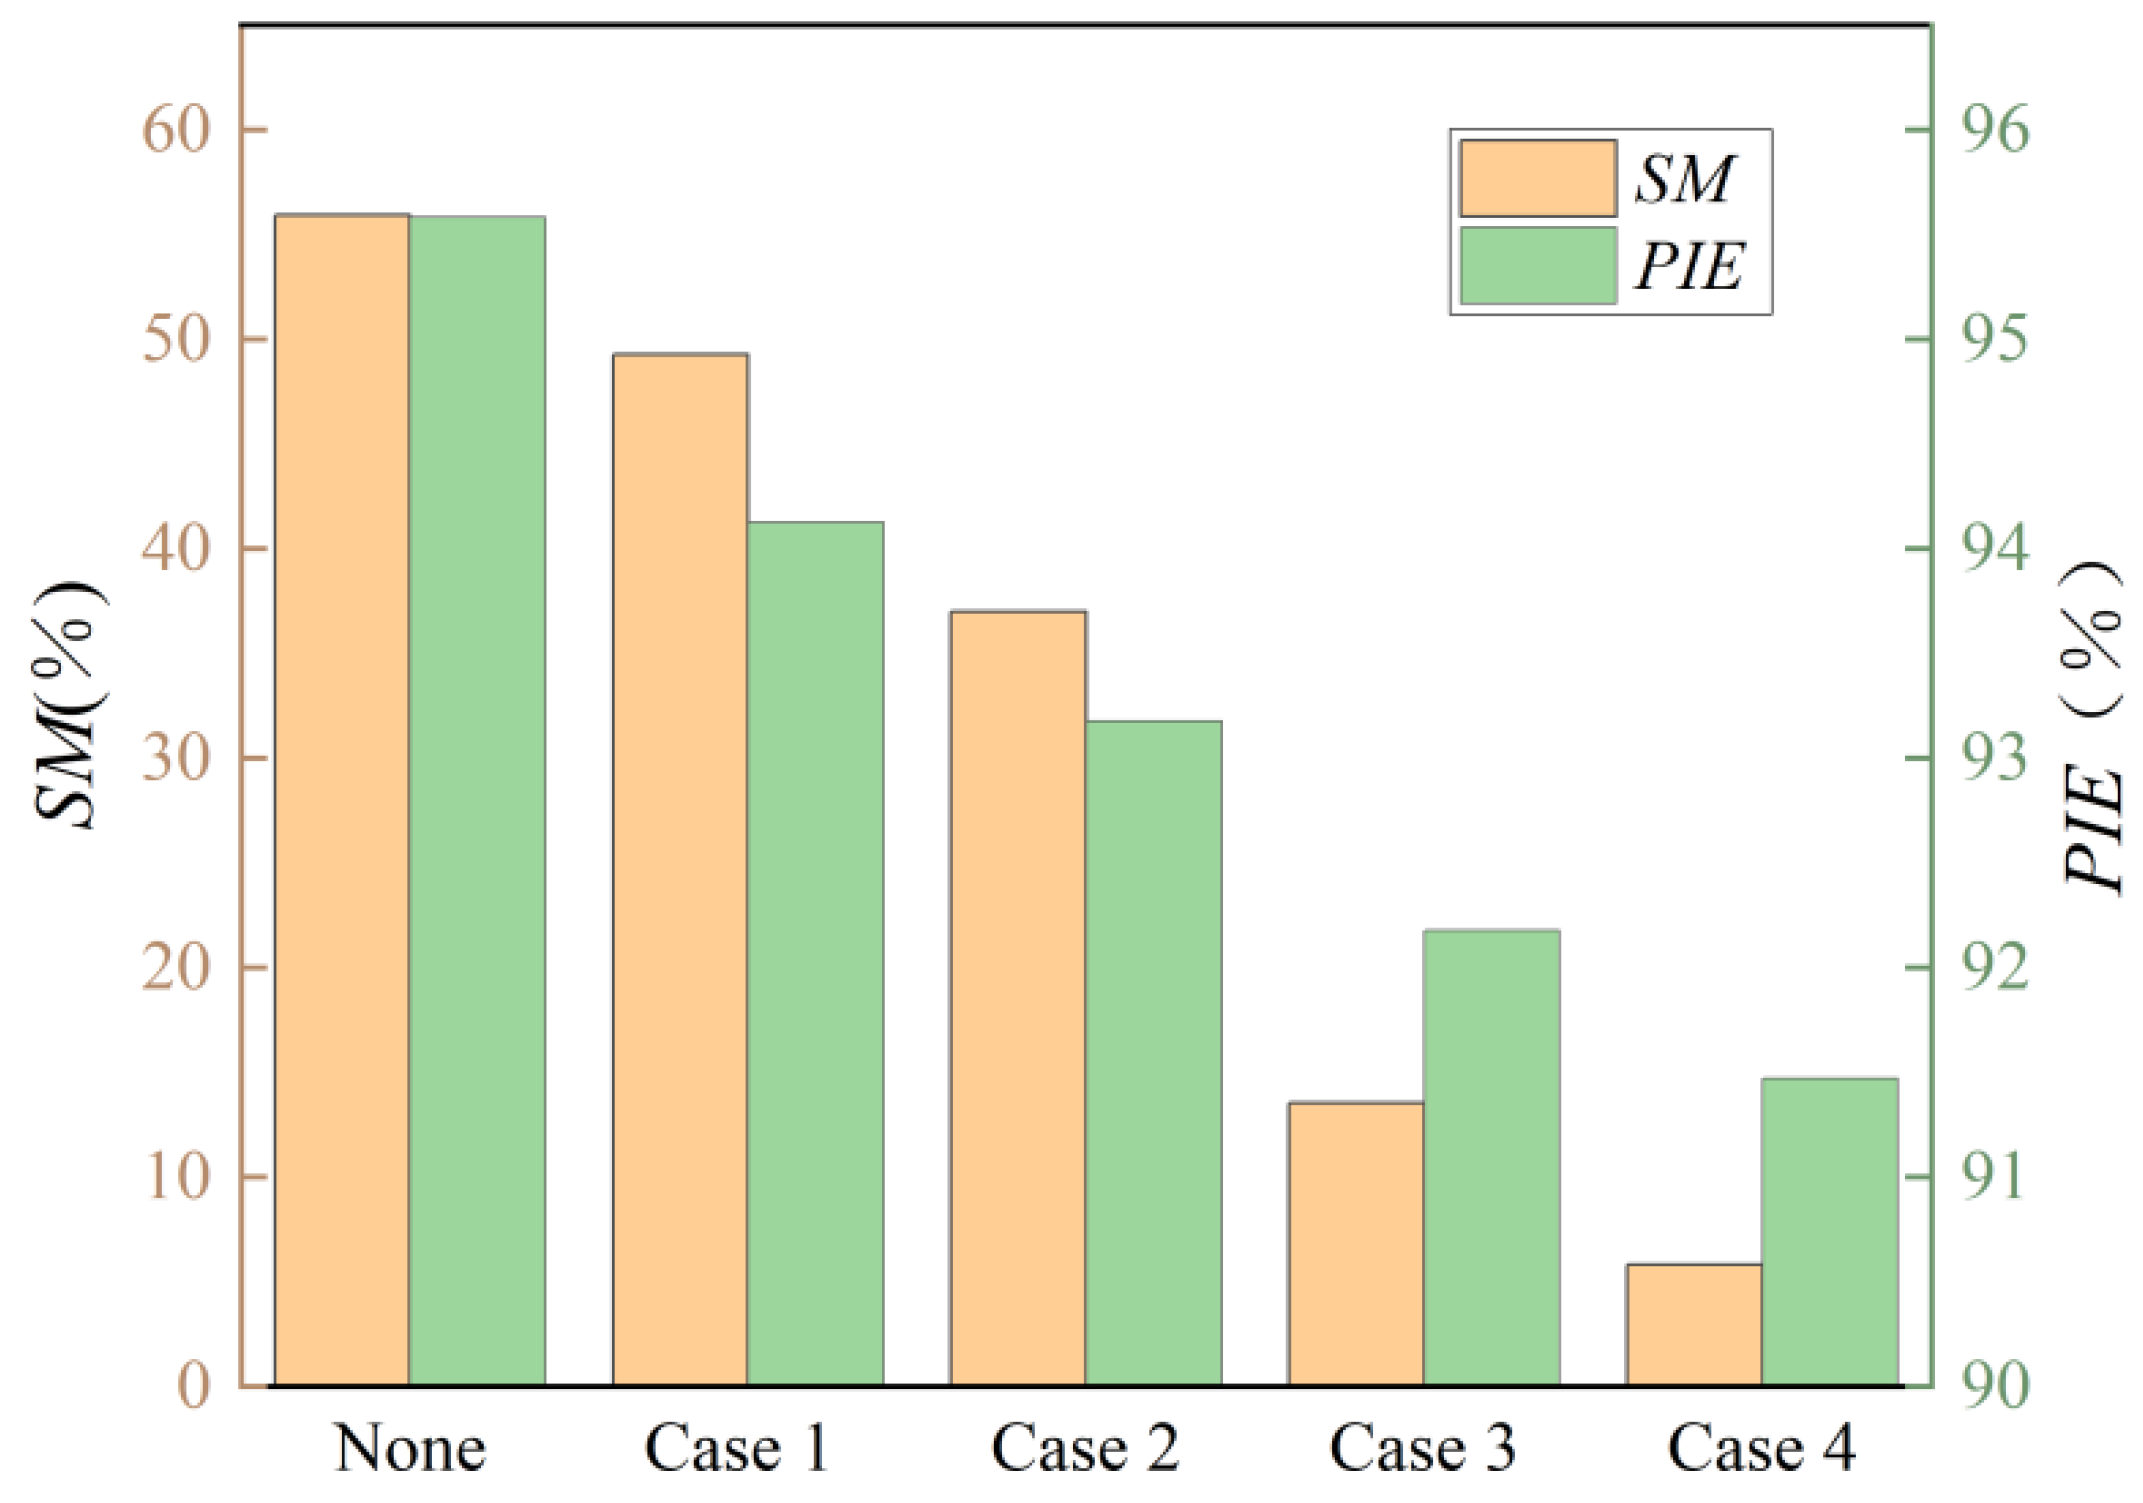
3.1. Overall Performance
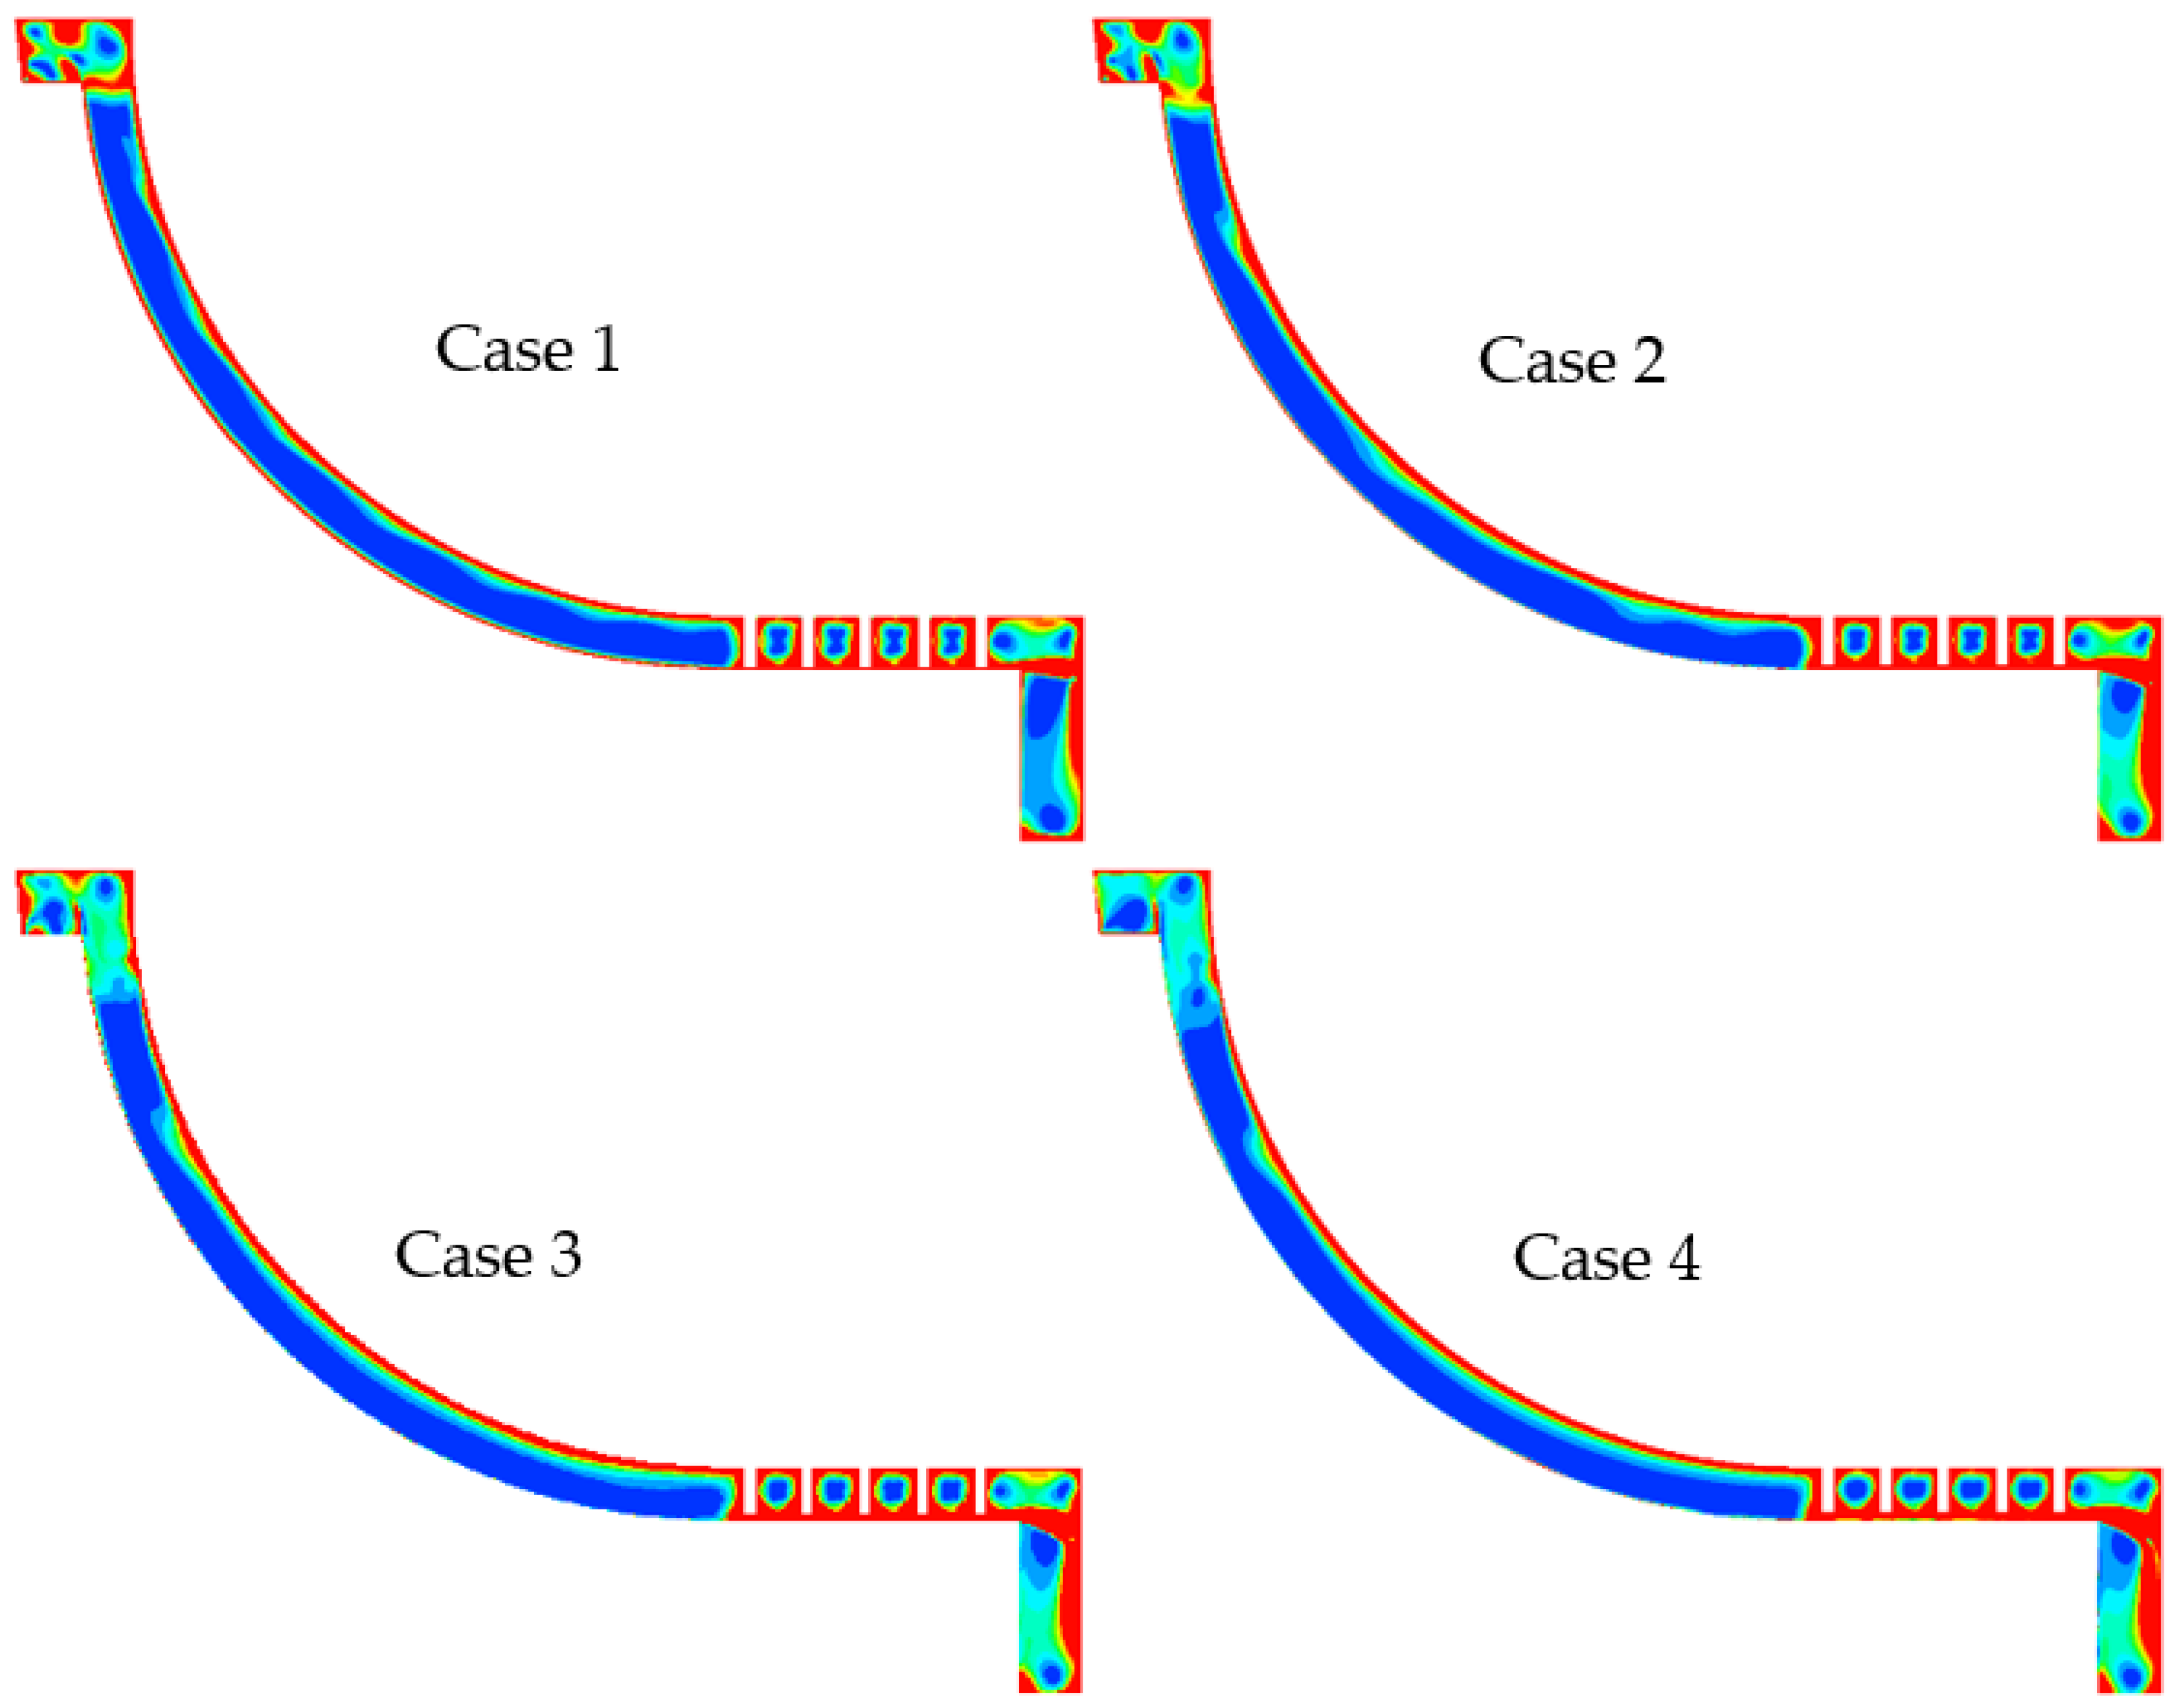
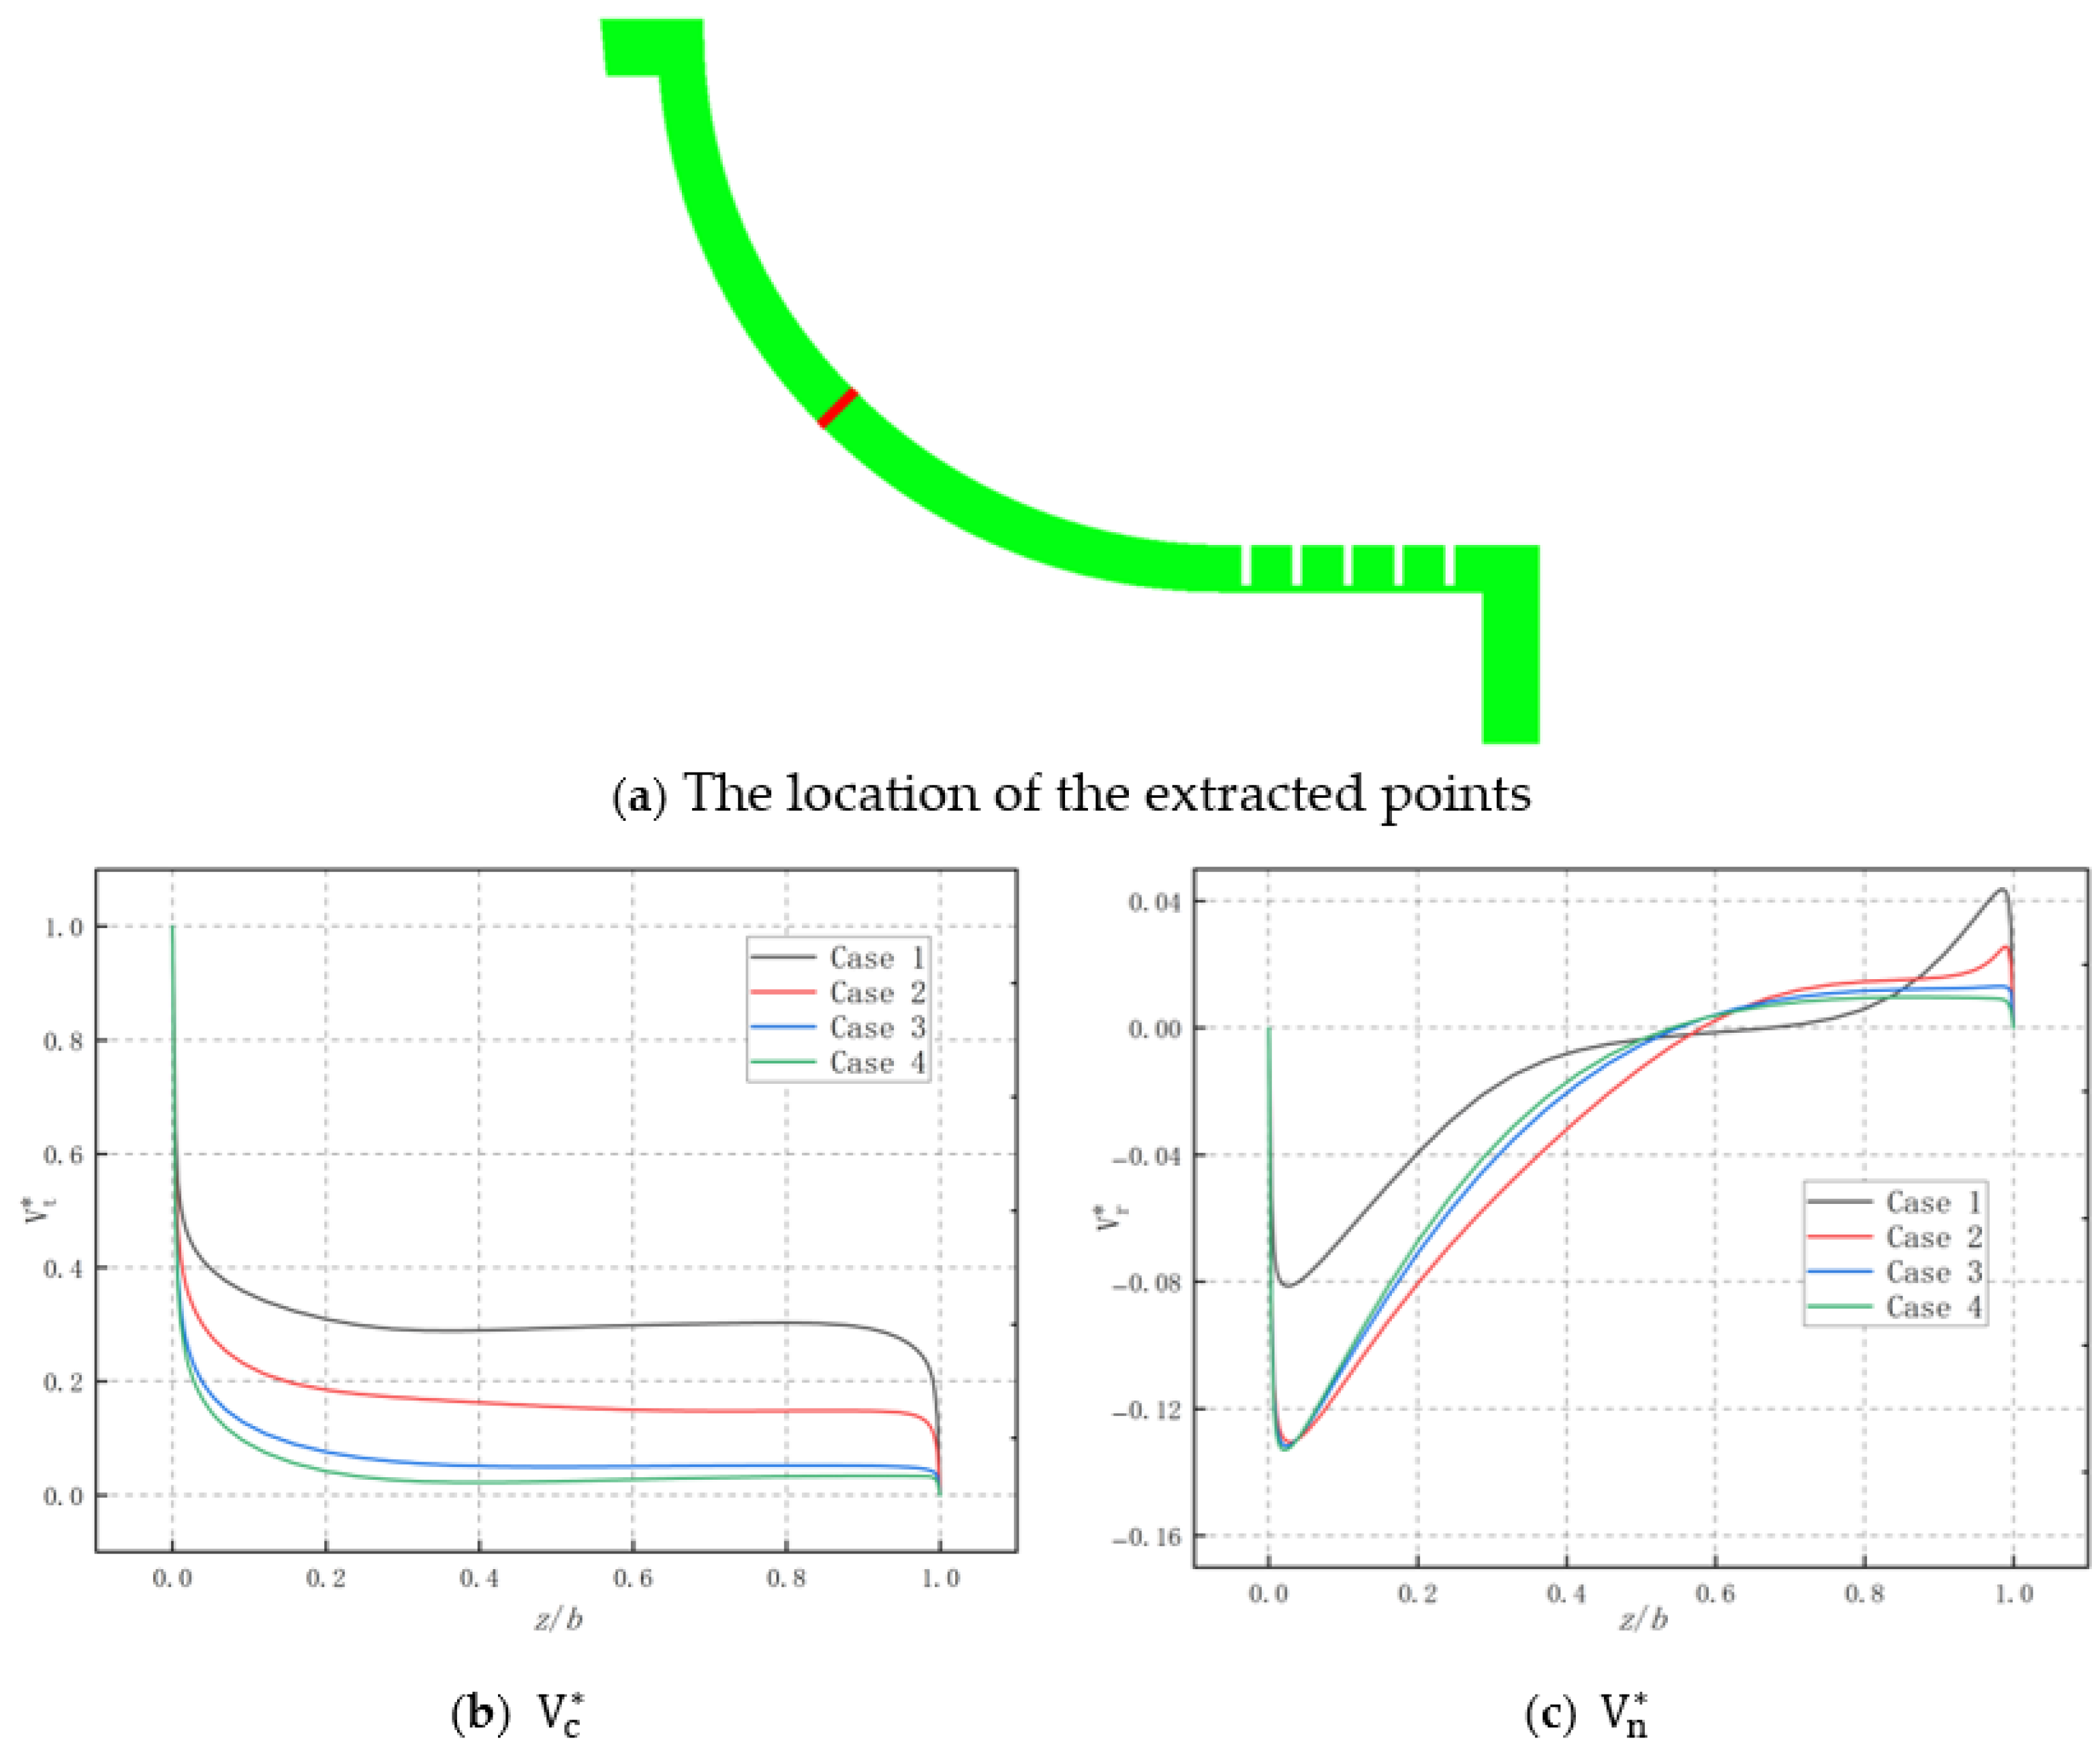
3.2. Flow Analysis Within the Shroud Cavity
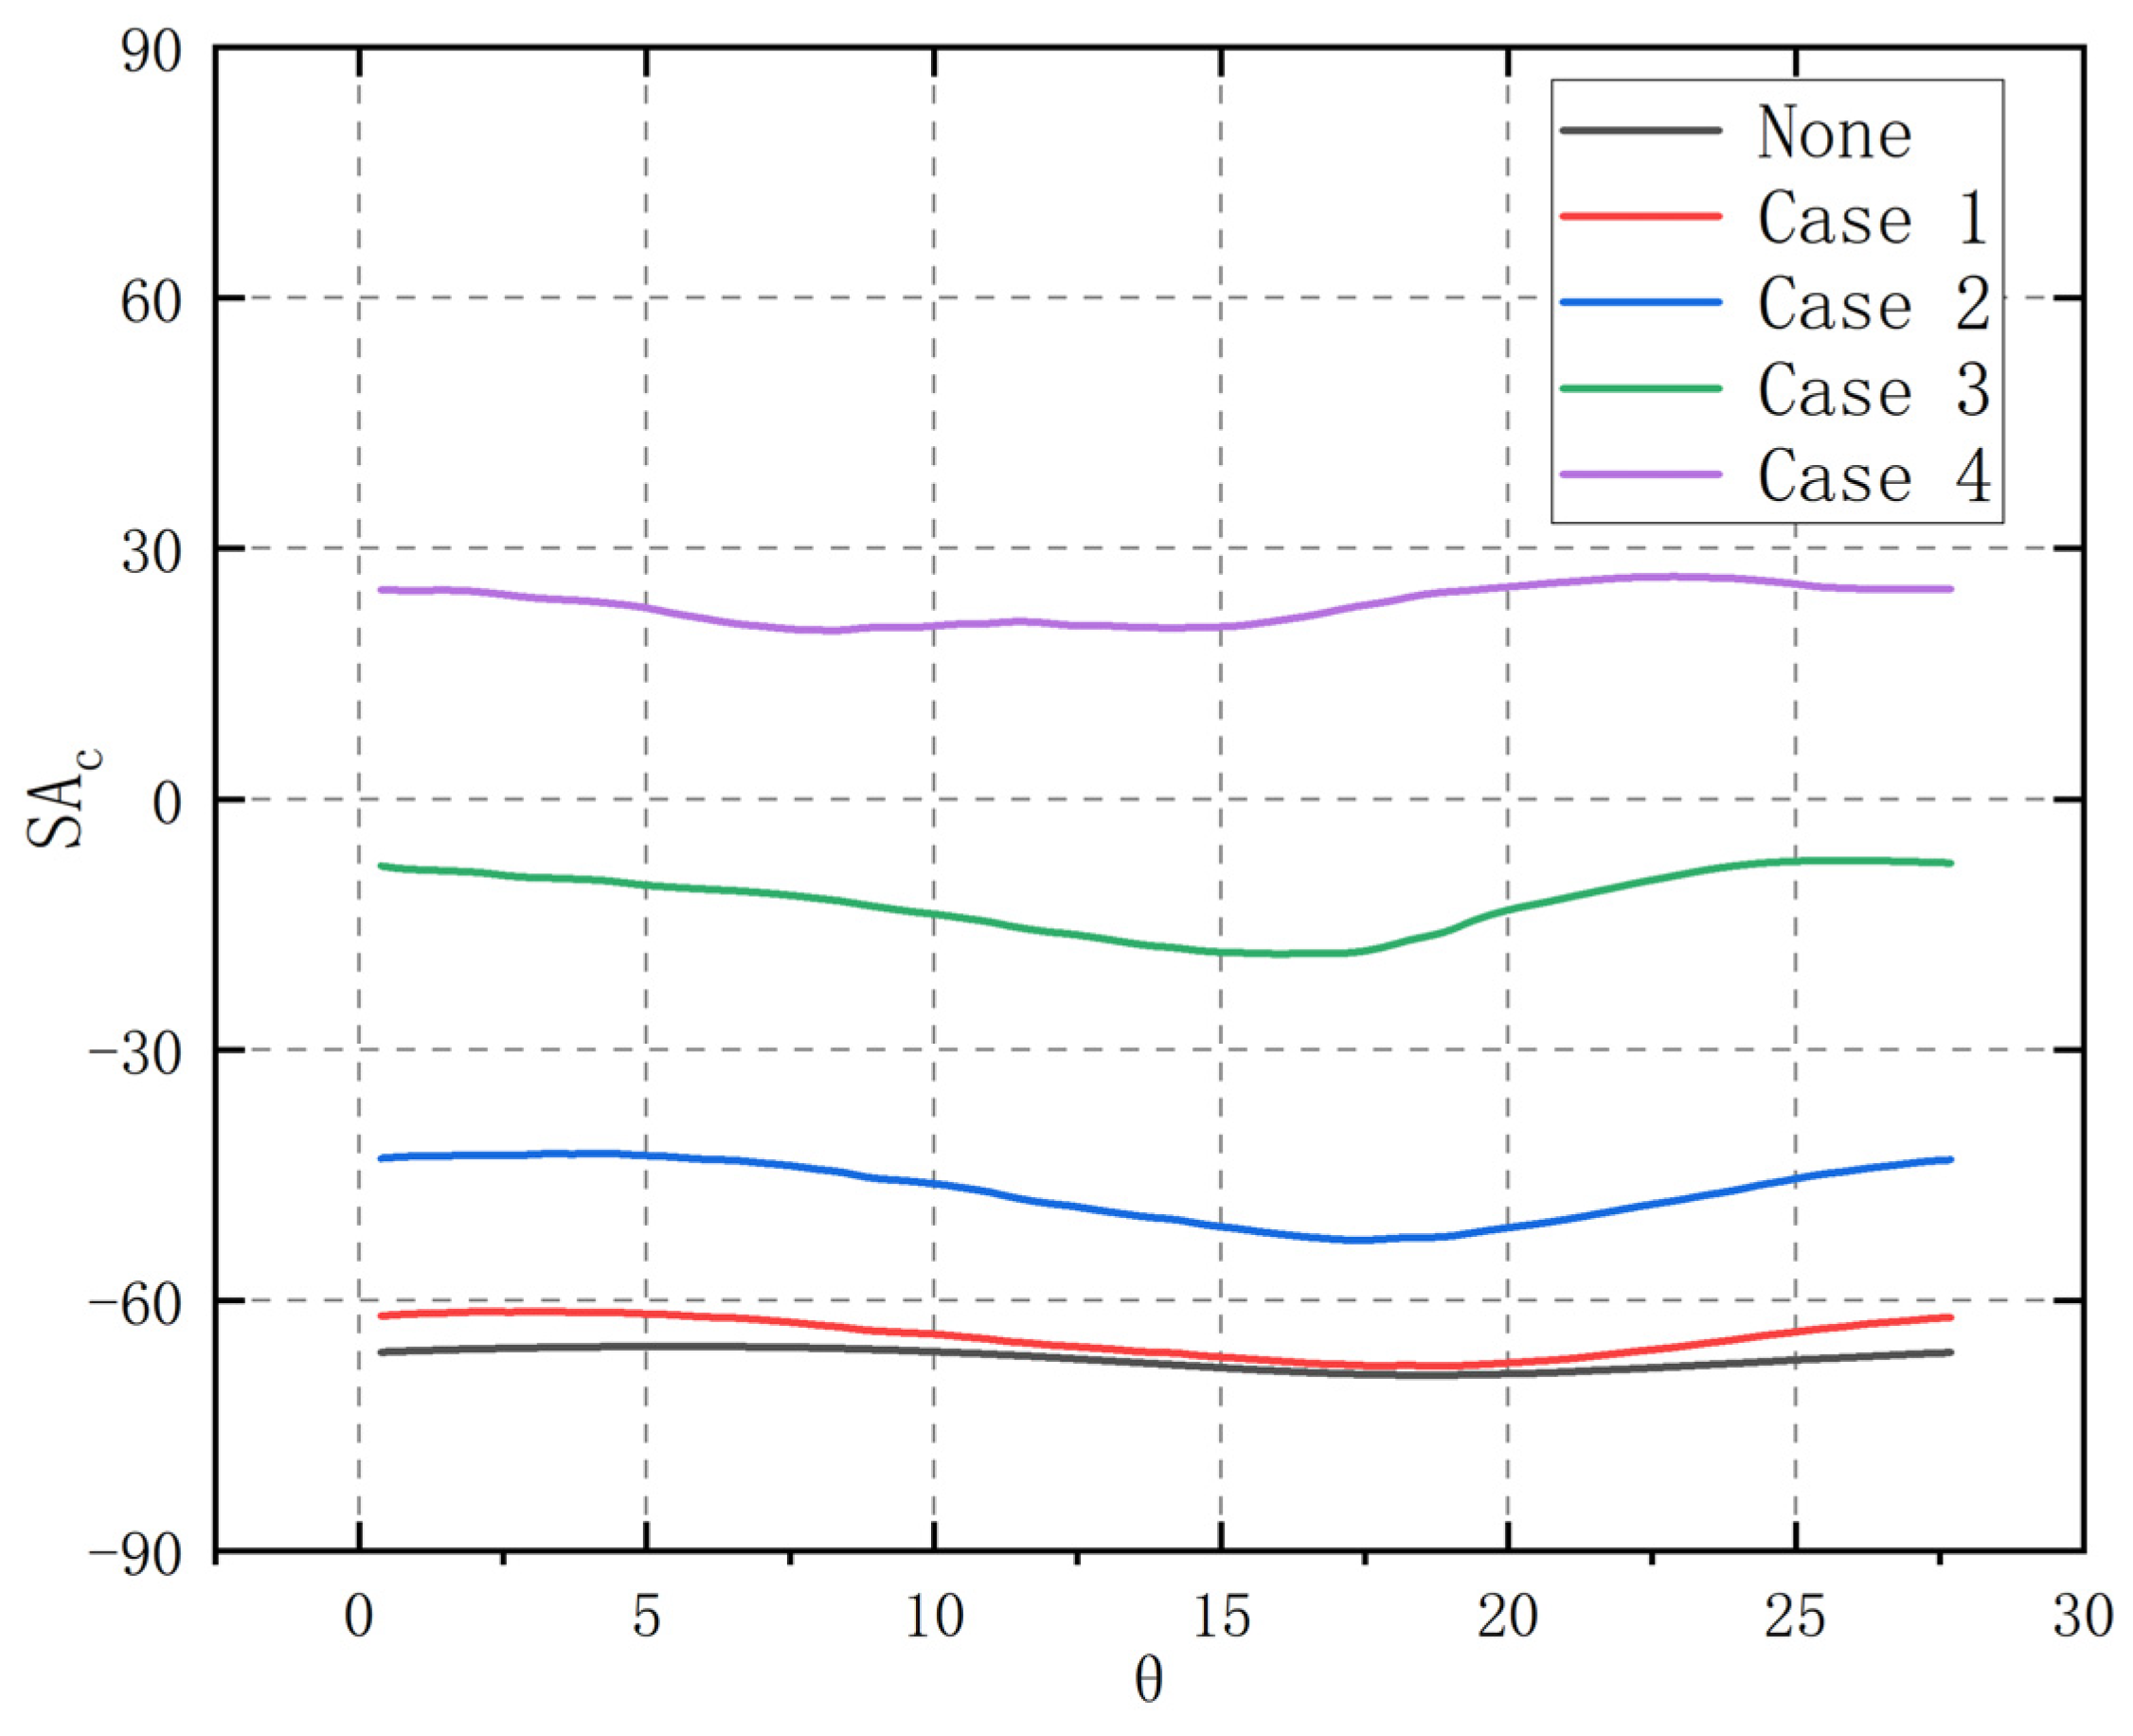
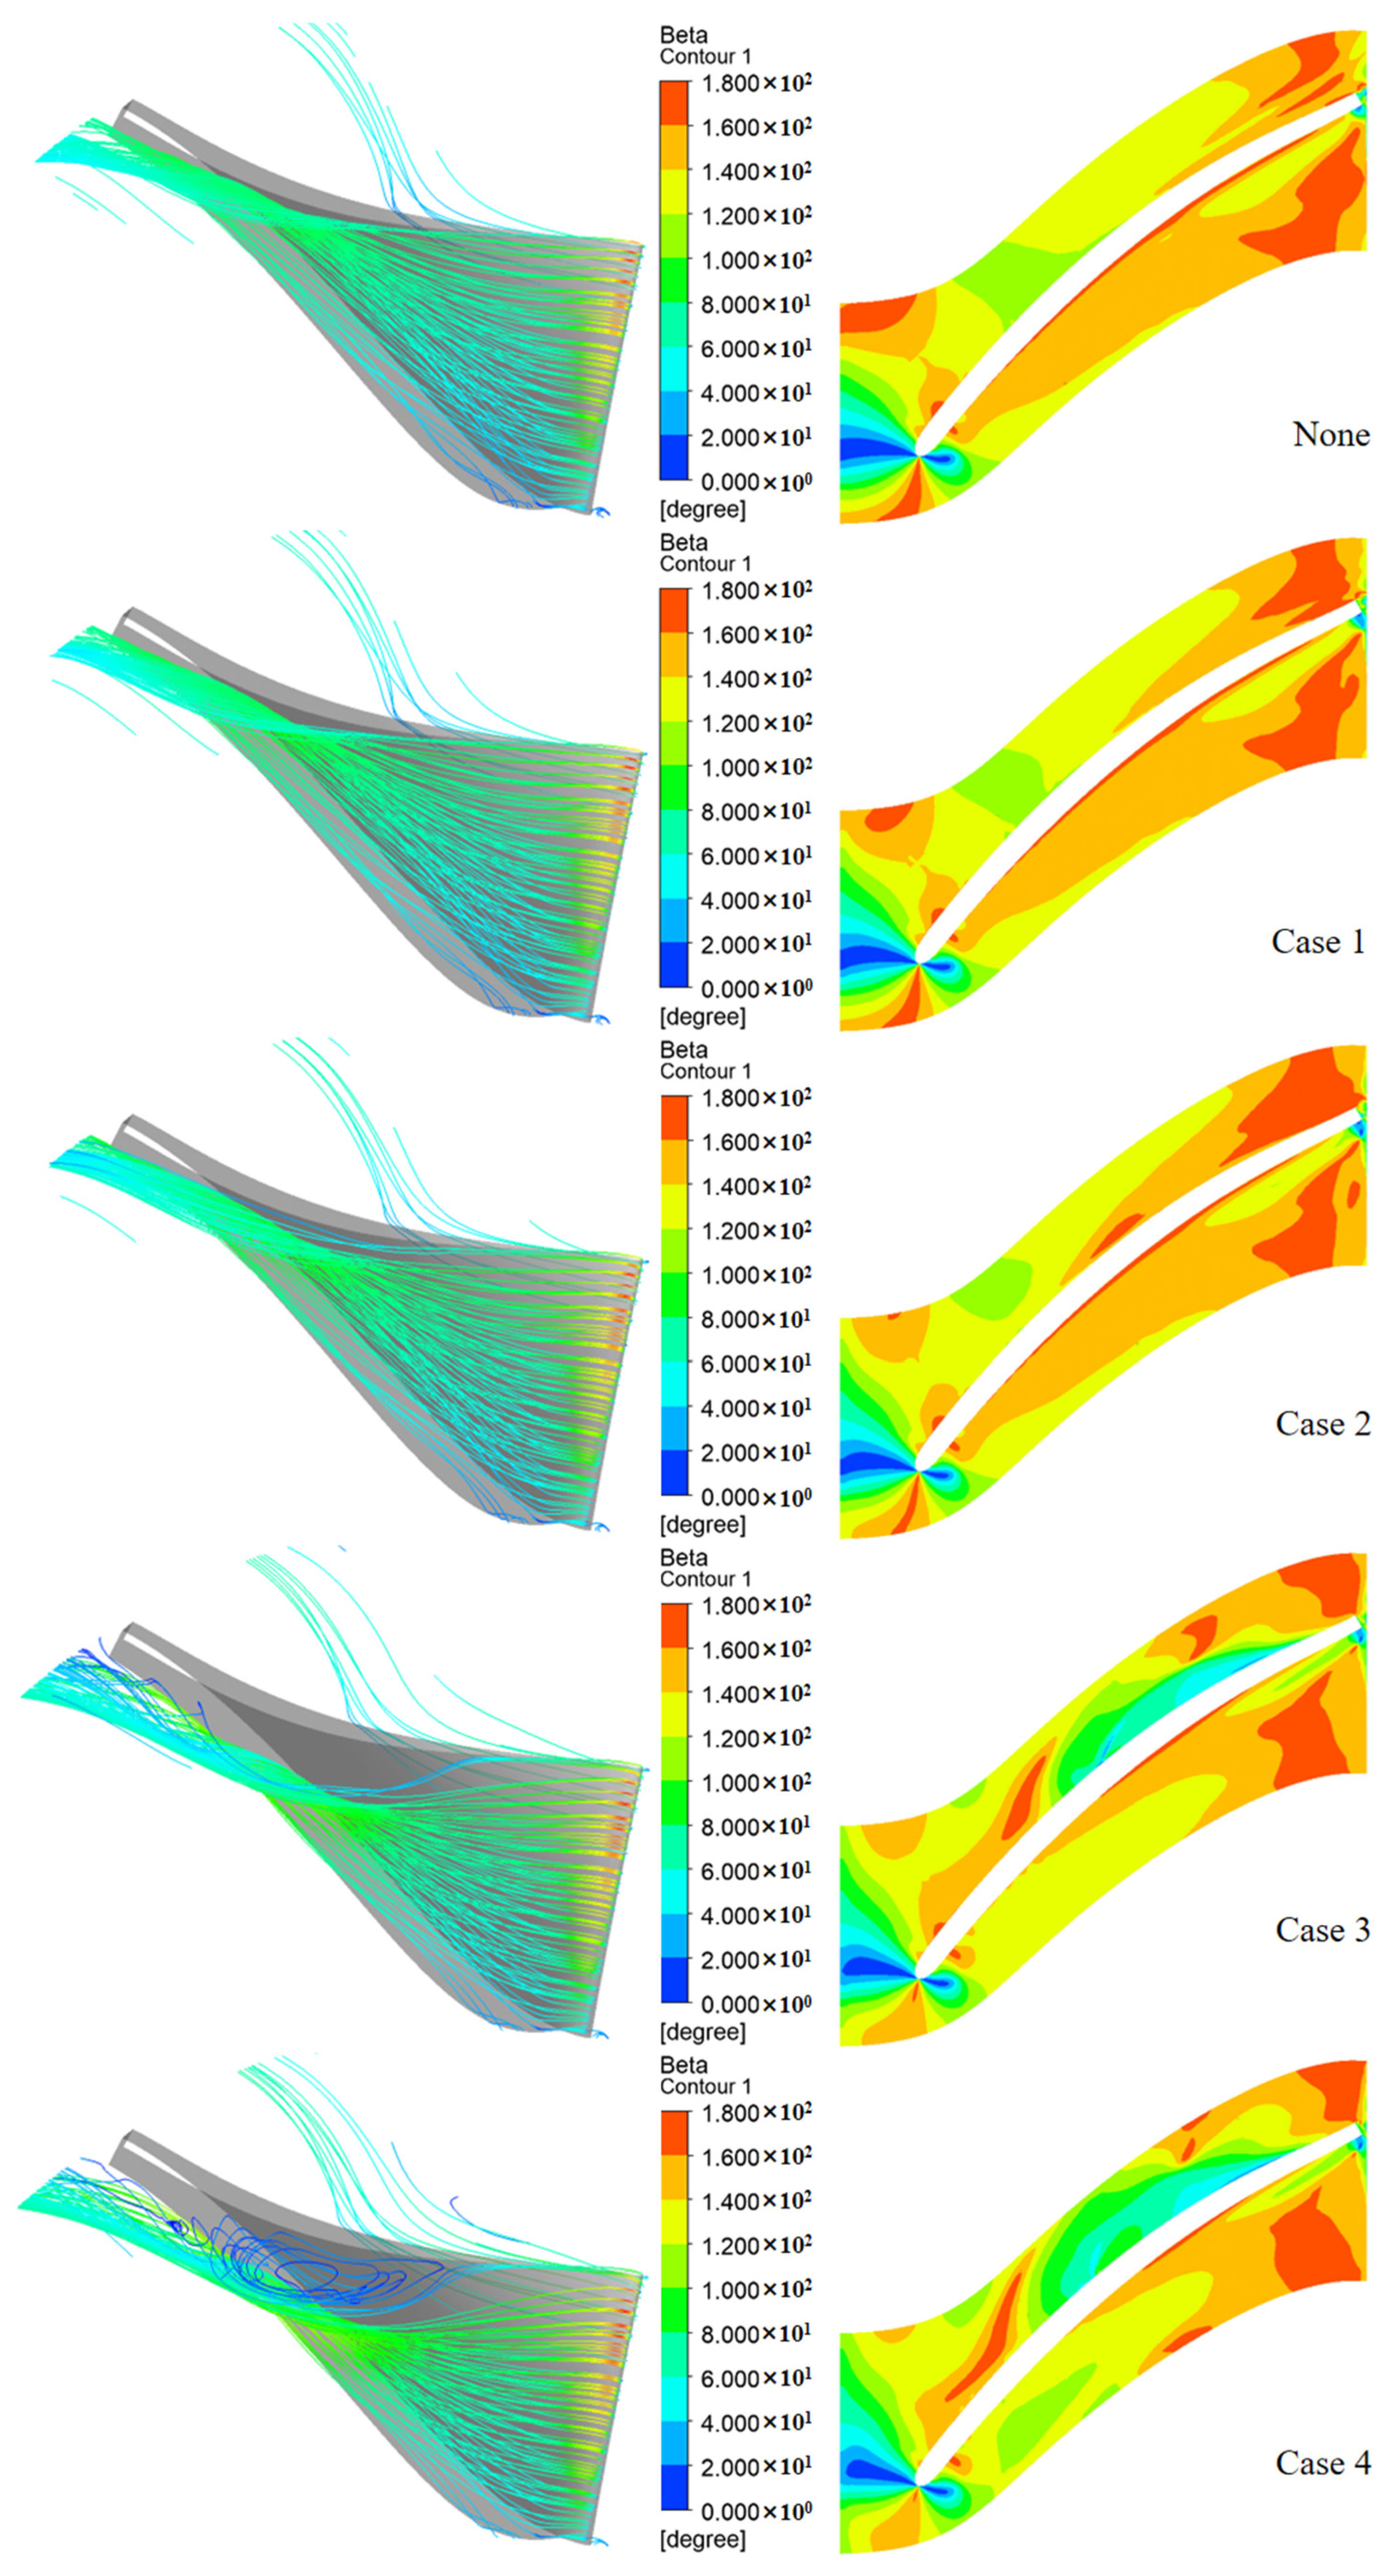
3.3. Influence on Impeller
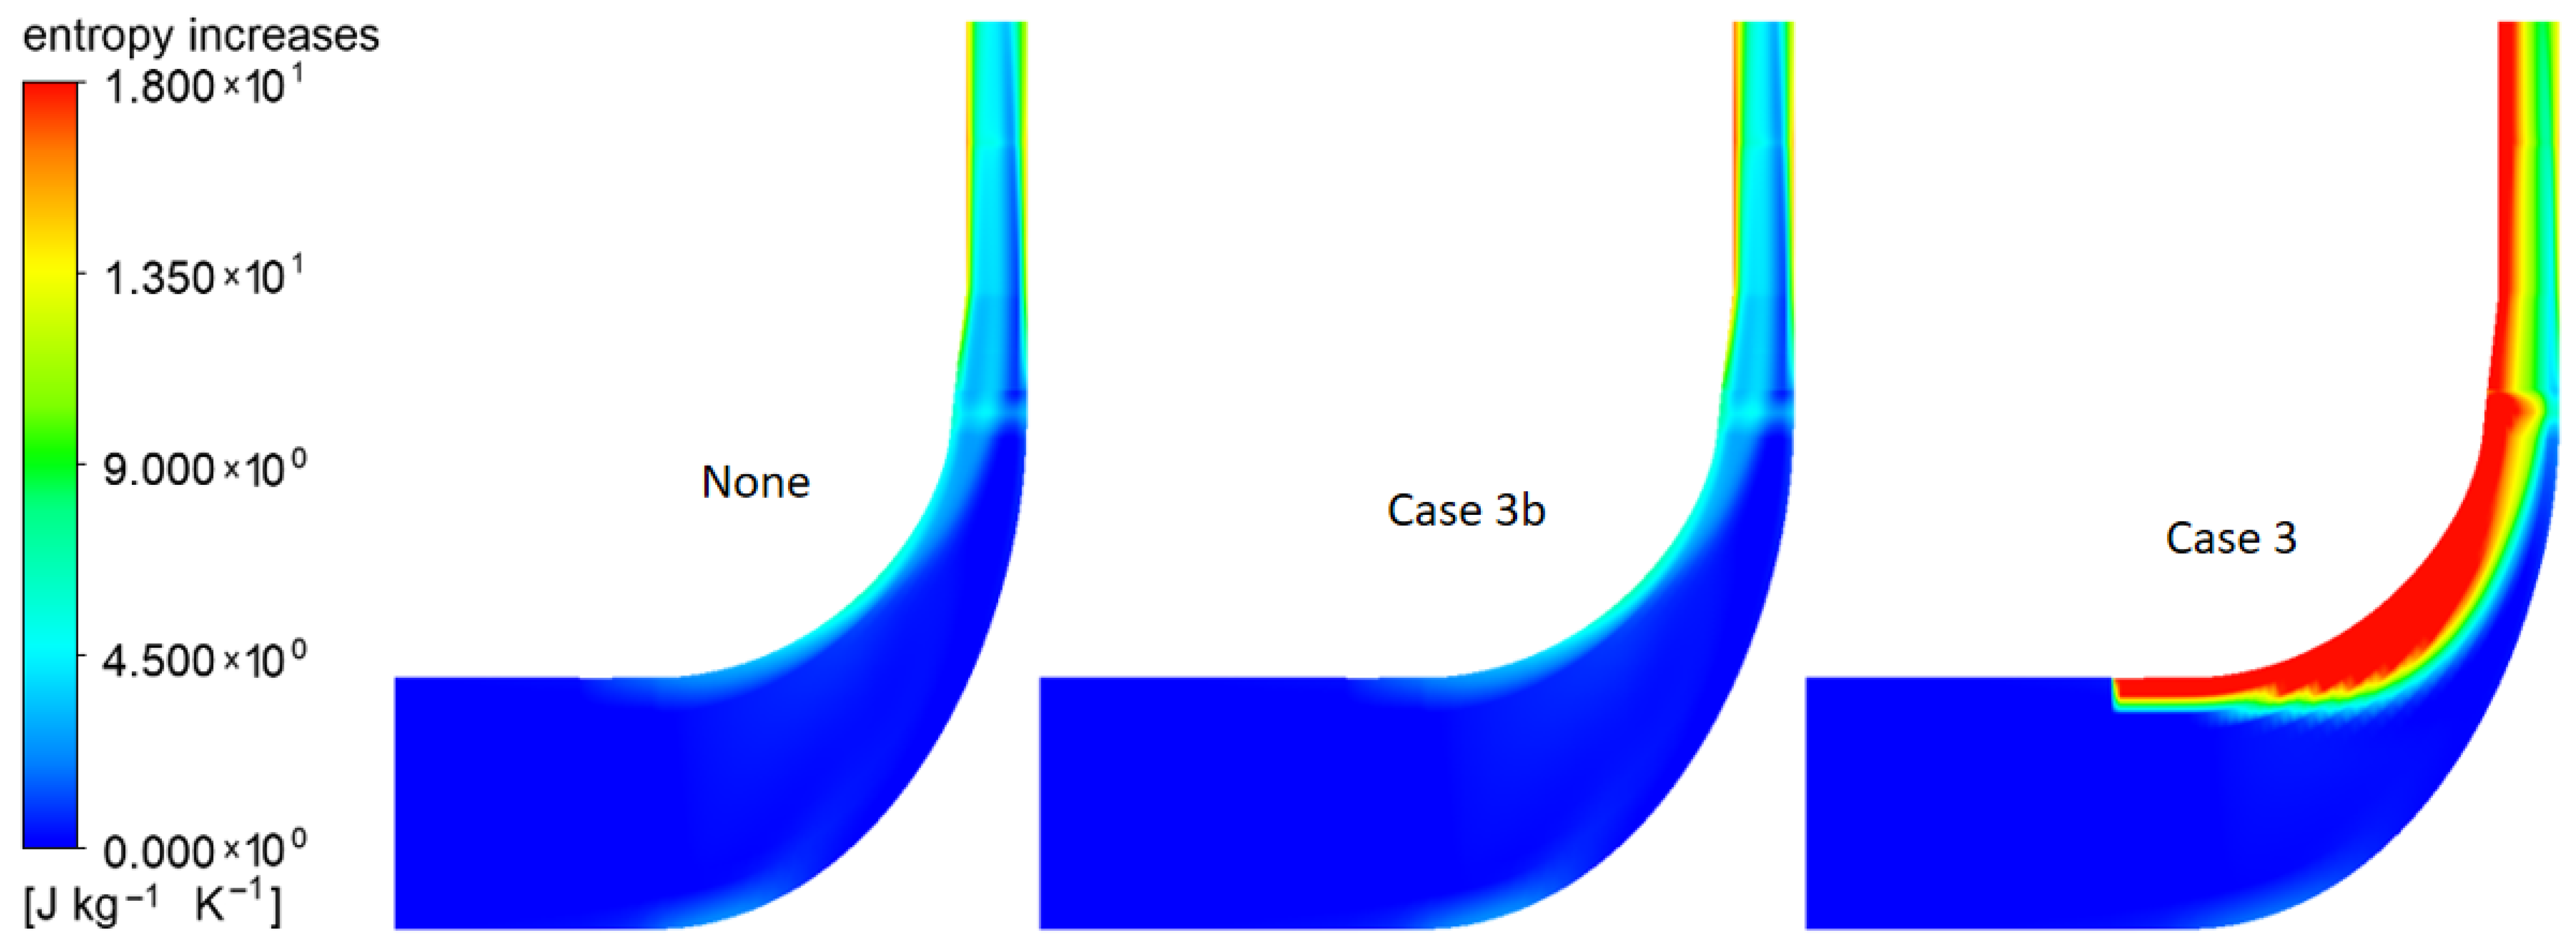
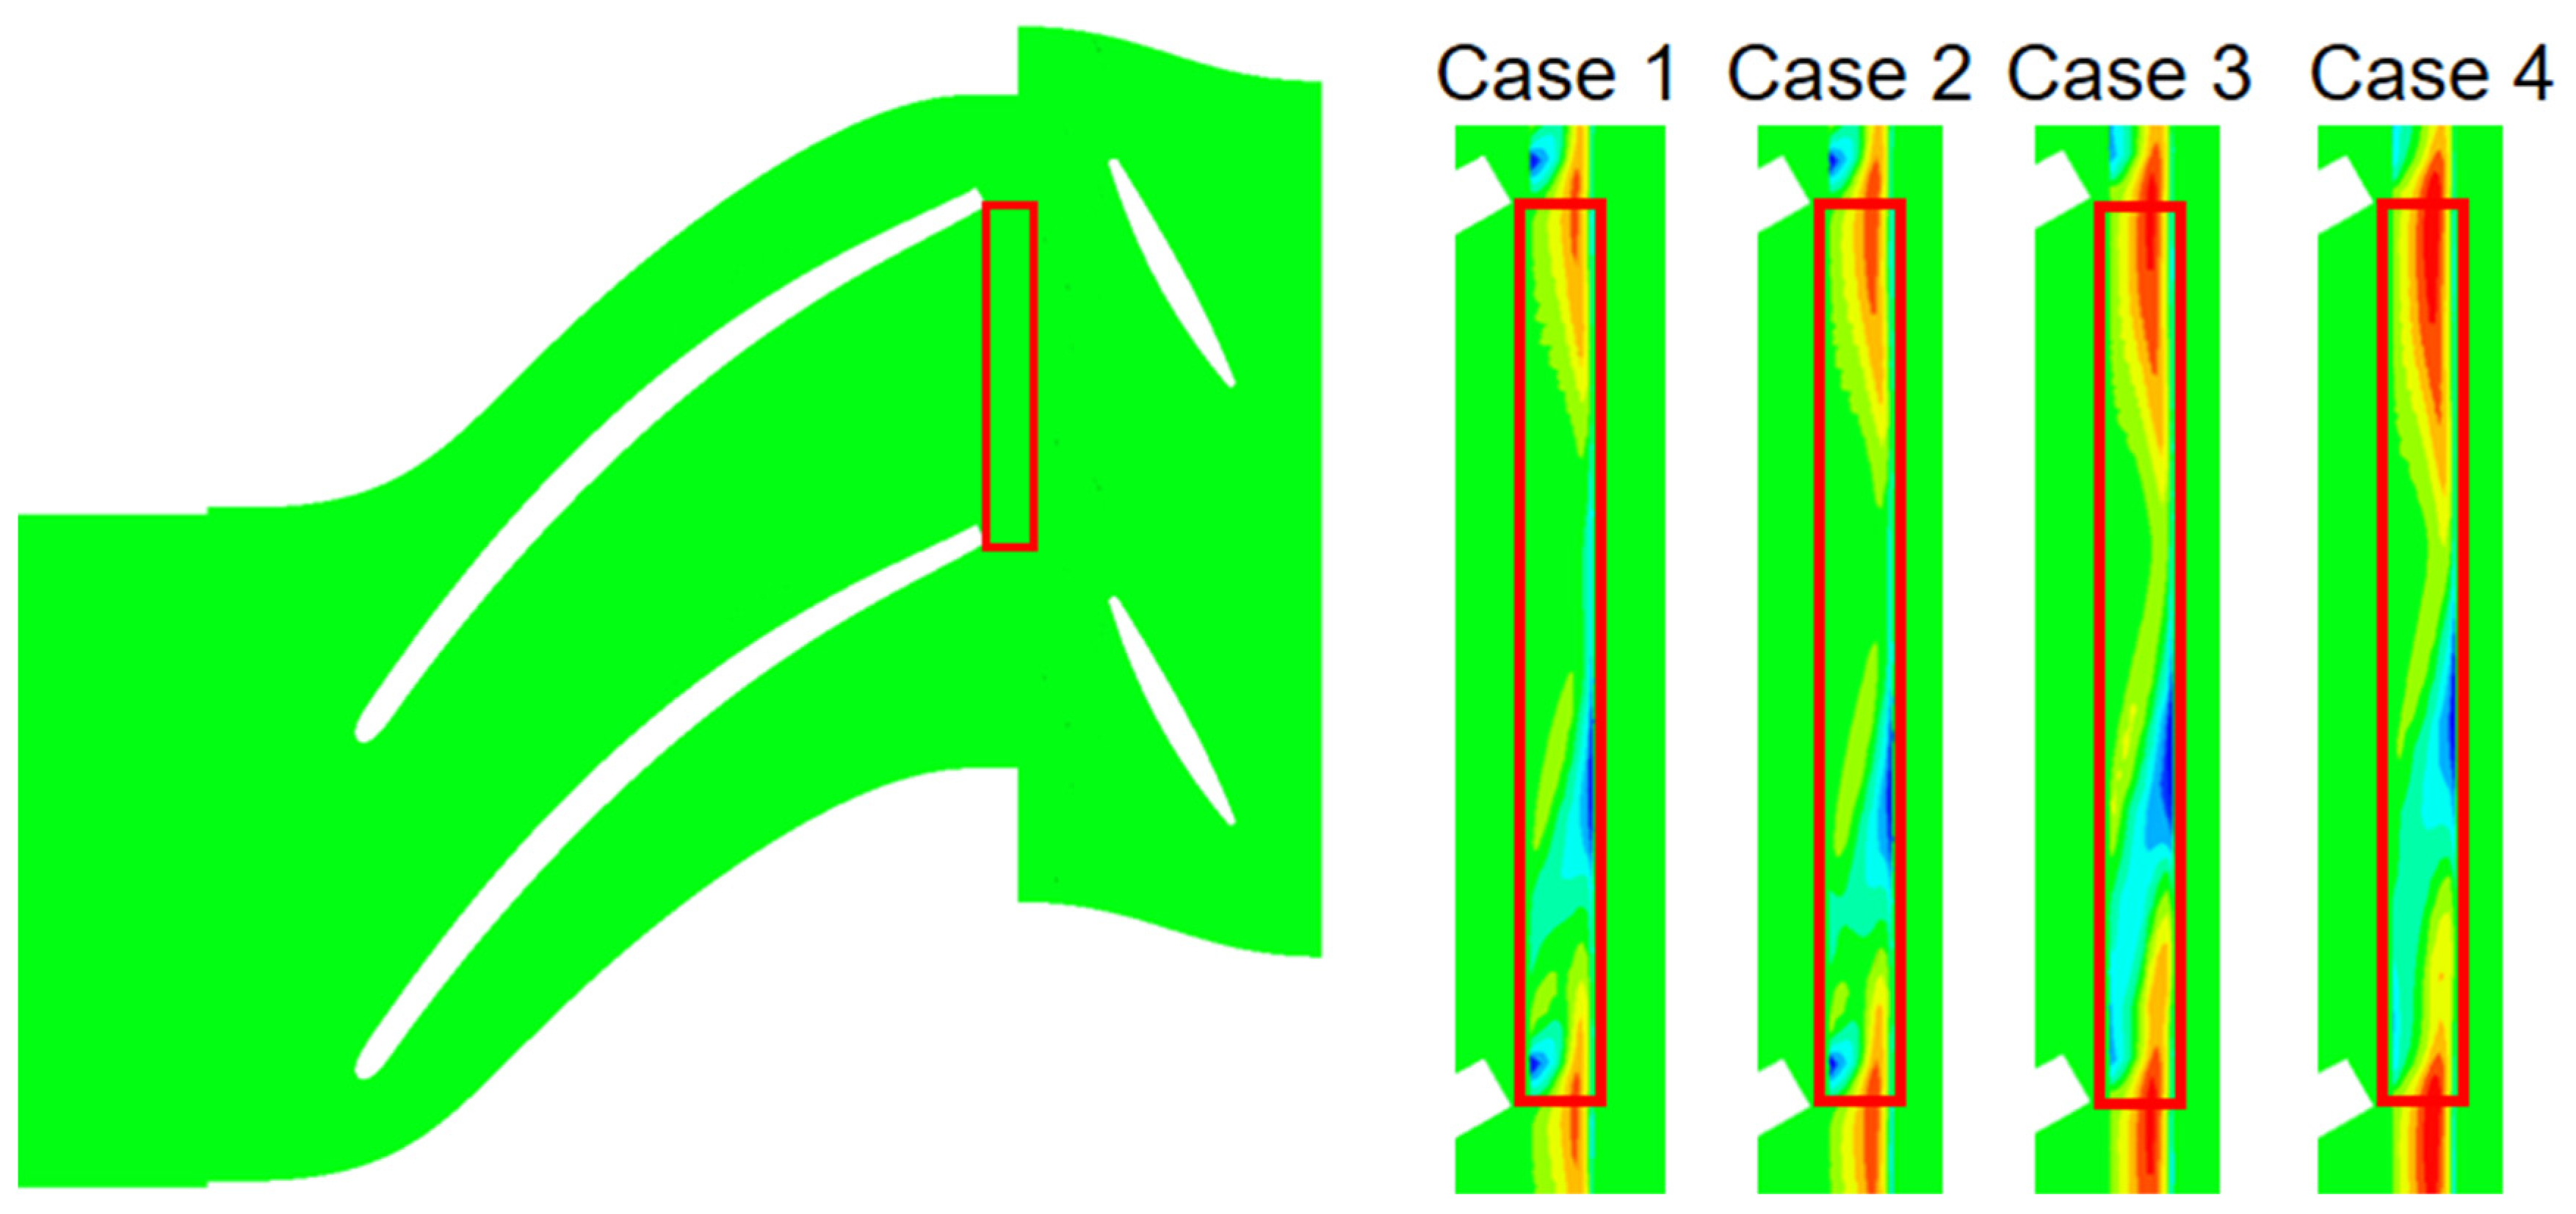
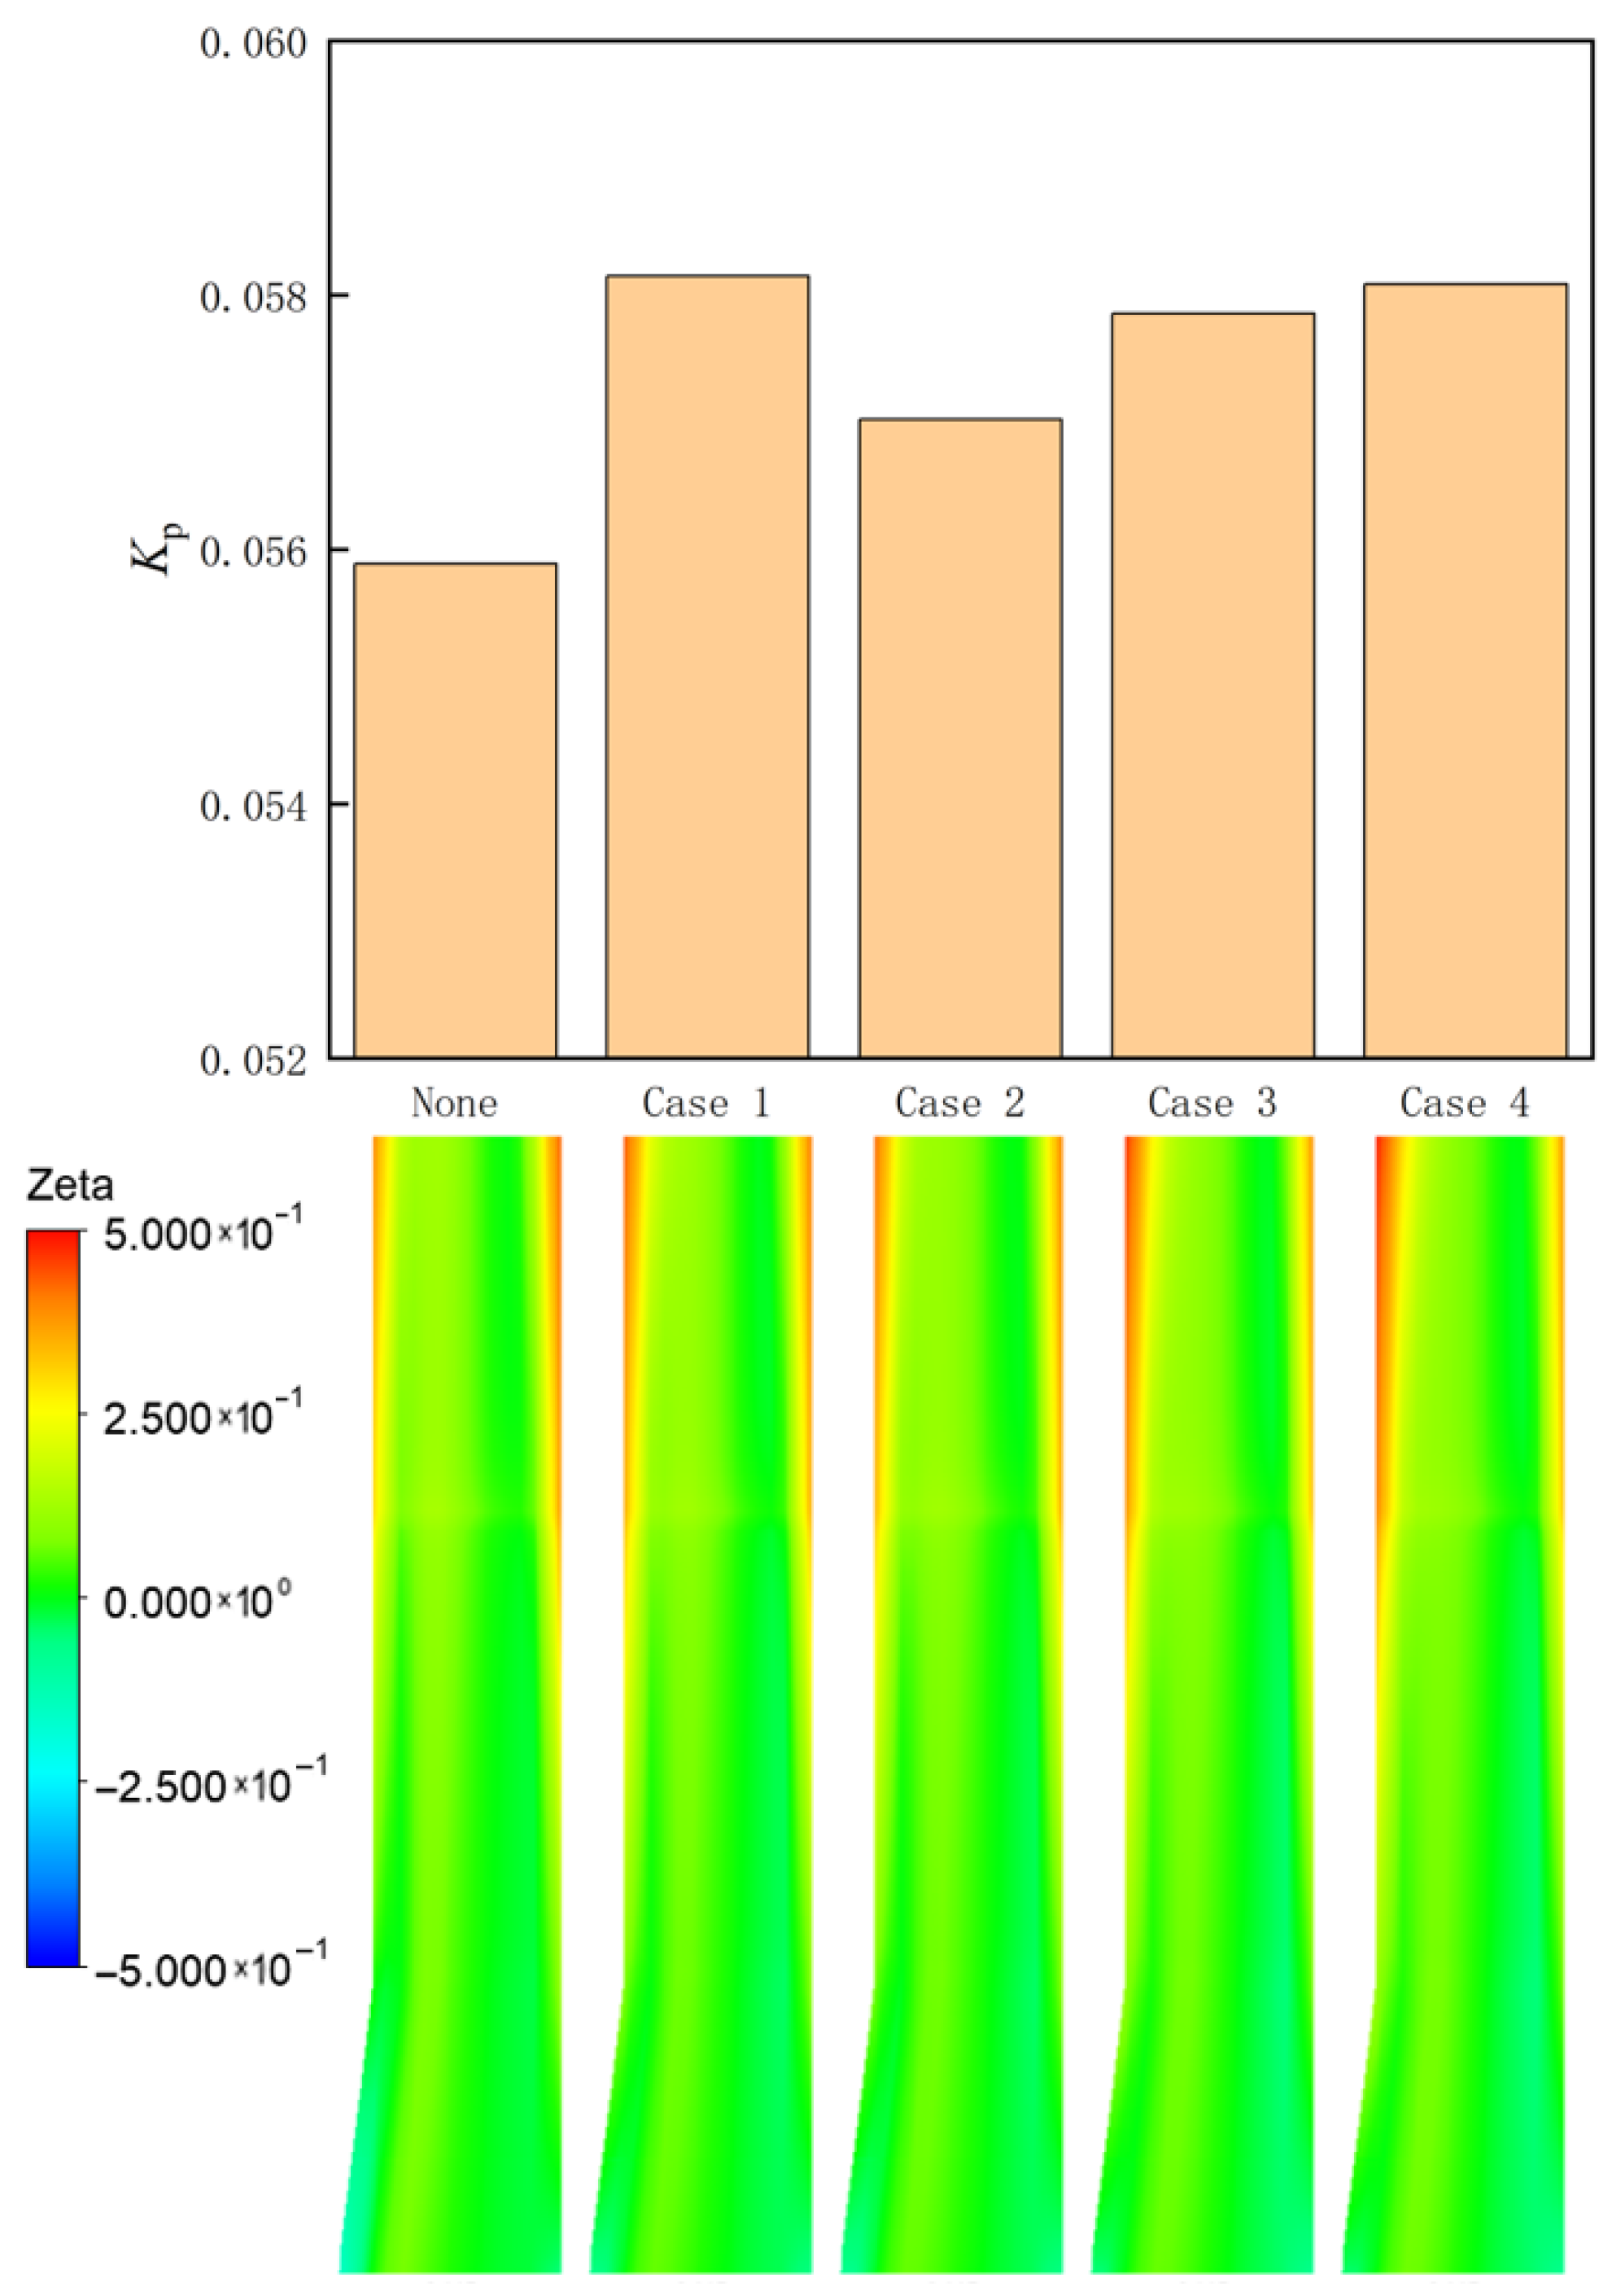
3.4. Influence on Diffuser
4. Conclusions
- The shroud cavity and leakage flow within the shrouded impeller centrifugal compressor significantly impair its overall performance, including the reduction in isentropic efficiency, pressure ratio, and stable operating range. This detrimental impact is observed to escalate with increasing leakage amounts due to wear, further exacerbating the compressor’s performance decline.
- When leakage flow is injected into the main flow passage at the impeller inlet from the shroud cavity, the circumferential mixing exhibits a uniform distribution. In contrast, when injected into the shroud cavity, the leakage flow of the main flow fluid from the impeller outlet exhibits a nonuniform characteristic. Particularly, fluid near the pressure side of the blades, upon injection into the shroud cavity, forms complex circulatory structures and ultimately flows back into the main flow passage near the suction surface at the impeller outlet.
- The leakage flow from the shroud cavity increases the swirling angle of the gas near the shroud surface at the impeller inlet. The heightened leakage flow rate directly results in a more significant increase in the swirling angle, consequently intensifying the impact loss inflicted by the airflow on the blades and detrimentally impacting the compressor’s stable operation.
- The primary cause of the performance degradation in shrouded impeller centrifugal compressors is the mixing loss that occurs between the leakage flow and the main flow. Under low flow conditions, this mixing loss becomes especially pronounced, resulting in the generation of separation vortices in the vicinity of the shroud surface, thereby further impairing the compressor’s performance.
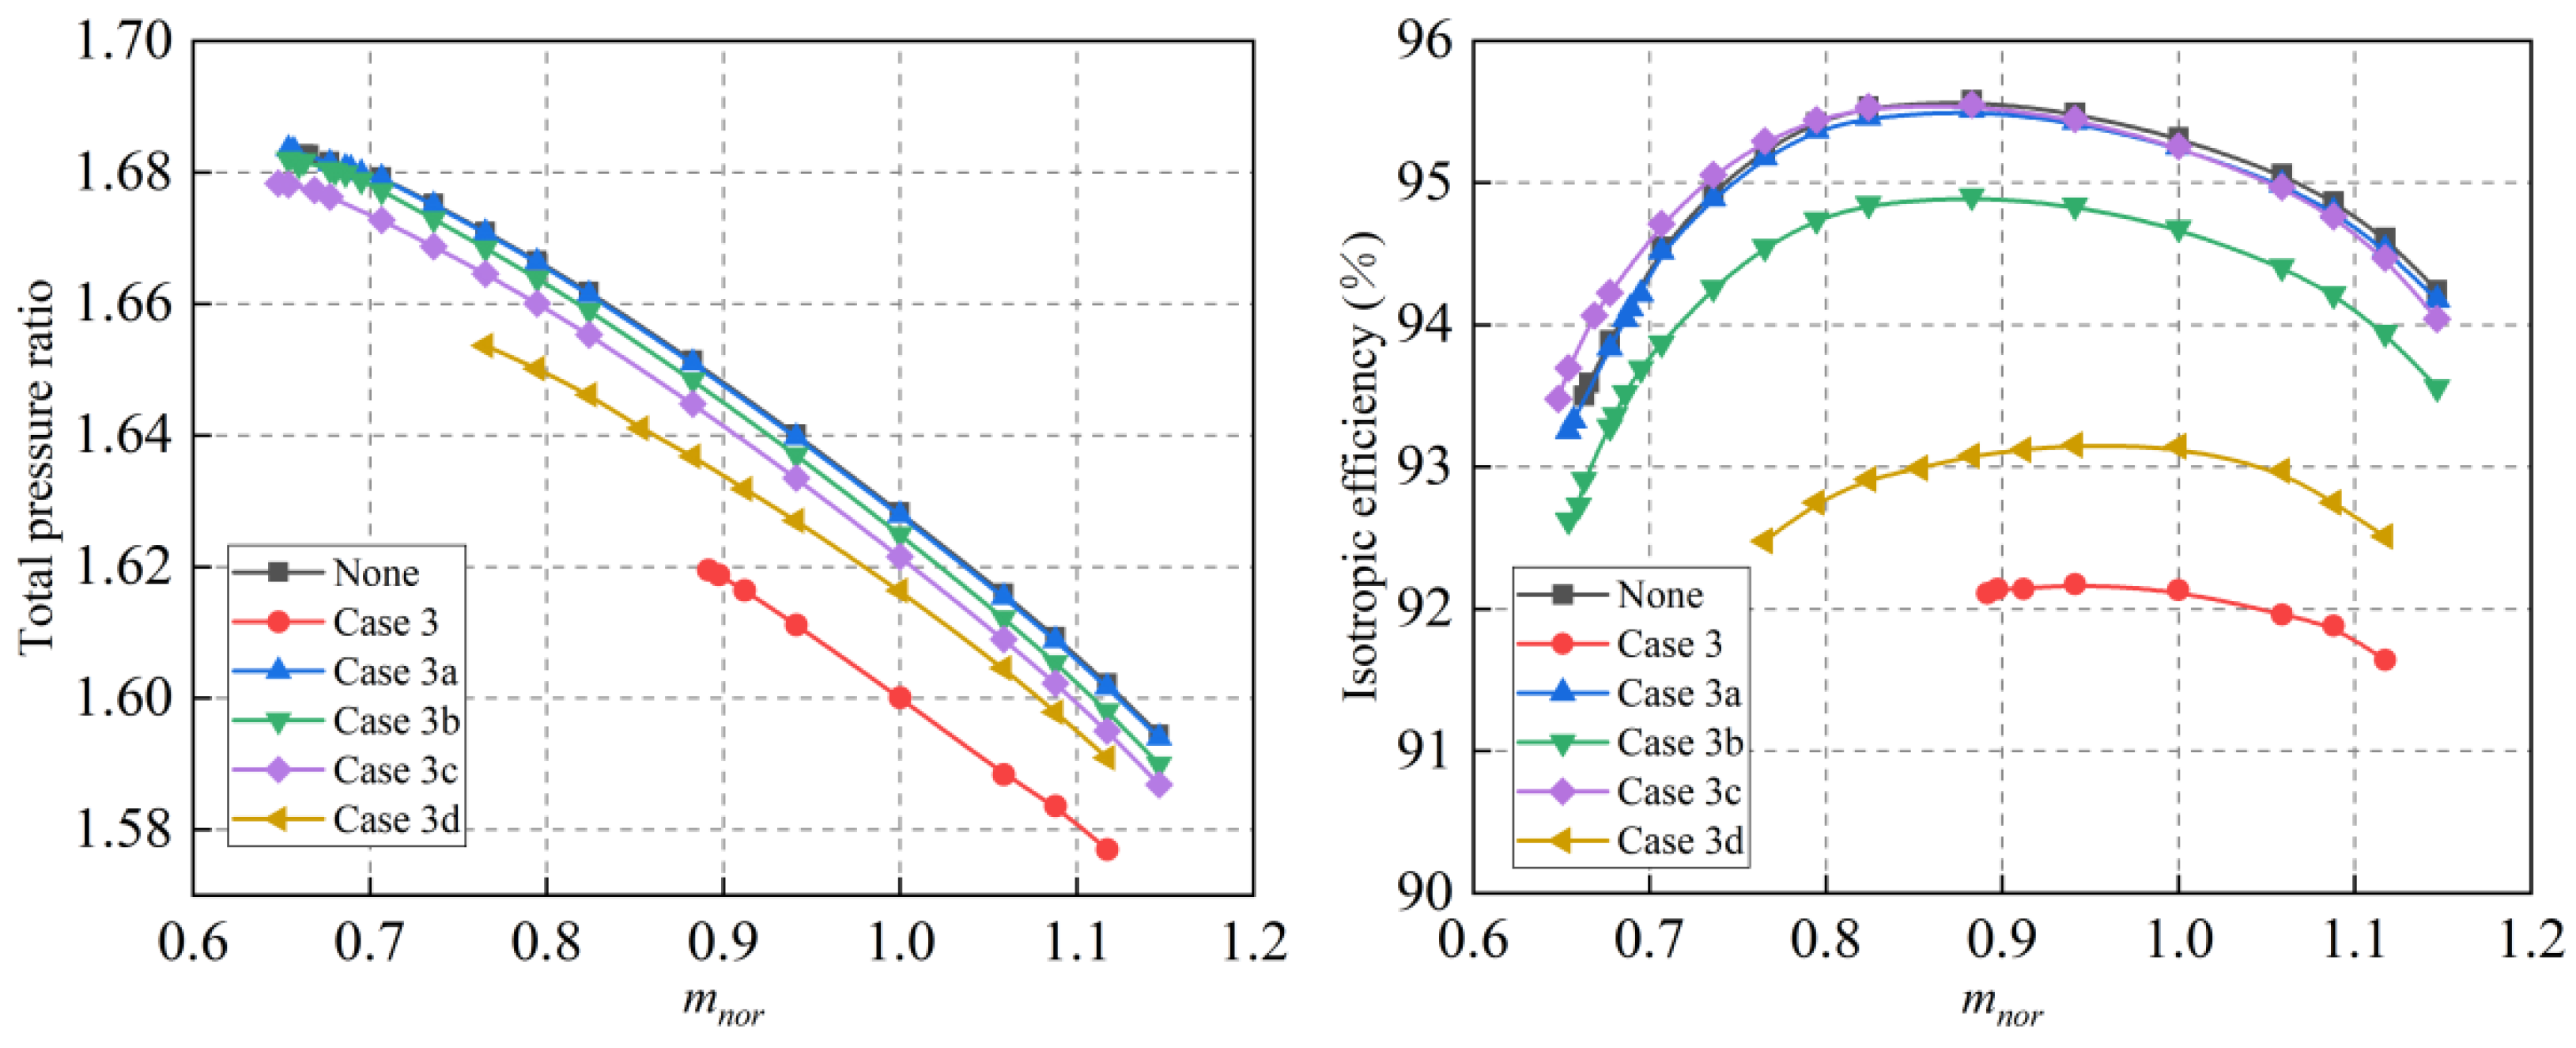
- The flow conditions at the inlet and outlet of the shroud cavity exert a significant influence on the energy loss within the diffuser. Under small flow rate conditions, the flow conditions at the shroud cavity’s inlet are the primary determinant. Conversely, under large flow rate conditions, the flow at the shroud cavity’s outlet becomes the primary factor. Furthermore, studies have revealed the existence of an optimal value of leakage rate that minimizes energy loss within the diffuser.
Author Contributions
Funding
Data Availability Statement
Conflicts of Interest
Nomenclature
| Symbols | Subscripts | ||
| Eu | Euler number; | 01 | Impeller inlet; |
| h | Enthalpy/kJ·kg−1; | 02 | Diffuser outlet; |
| m | Mass flow rate/kg·s−1; | a | Axial; |
| P | Static pressure/Pa; | c | Circumferential; |
| PIE | Peak isentropic efficiency; | isen | Isentropic; |
| Pt | Total pressure/Pa; | n | Normal; |
| r | Radius/m; | nor | Dimensionless; |
| Re | Reynolds number; | t | Total. |
| SA | Swirling angle; | ||
| SM | Stall margin; | ||
| V | Velocity/m·s−1. | ||
| Greek symbols | Acronyms | ||
| ζ | Energy loss coefficient; | PIE | Peak Isentropic Efficiency; |
| µ | Dynamic viscosity; | CAES | Compressed Air Energy Storage; |
| πt | Total pressure ratio; | SM | Surge Margin. |
| ρ | Density of the fluid; | ||
| ϕ | Dissipation function/m2/s−3; | ||
| ω | Angular velocity | ||
References
- Halkos, G.; Gkampoura, E.-C. Assessing Fossil Fuels and Renewables’ Impact on Energy Poverty Conditions in Europe. Energies 2023, 16, 560. [Google Scholar] [CrossRef]
- Berna-Escriche, C.; Álvarez-Piñeiro, L.; Blanco, D. Forecasts Plus Assessments of Renewable Generation Performance, the Effect of Earth’s Geographic Location on Solar and Wind Generation. Appl. Sci. 2025, 15, 1450. [Google Scholar] [CrossRef]
- Ekoue, M.K.; Woerman, M.; Clastres, C. Intermittency and uncertainty in wind and solar energy: Impacts on the French electricity market. Energy Econ. 2025, 142, 108176. [Google Scholar] [CrossRef]
- He, Z.; Luo, M.; Tu, Z. Survey of the Isothermal Compressed Air Energy Storage Technologies. J. Eng. Therm. Energy Power 2018, 33, 1–6. [Google Scholar]
- Houssainy, S.; Janbozorgi, M.; Kavehpour, P. Thermodynamic performance and cost optimization of a novel hybrid thermal-compressed air energy storage system design. J. Energy Storage 2018, 18, 206–217. [Google Scholar] [CrossRef]
- Shamshirgaran, S.R.; Ameri, M.; Khalaji, M.; Ahmadi, M.H. Design and optimization of a compressed air energy storage (CAES) power plant by implementing genetic algorithm. Mech. Ind. 2015, 17, 109. [Google Scholar] [CrossRef]
- Hameer, S.; van Niekerk, J.L. A review of large-scale electrical energy storage. Int. J. Energy Res. 2015, 39, 1179–1195. [Google Scholar] [CrossRef]
- Zhang, Q.; Yang, X.; Xu, Y.; Cao, L.; Yan, Z. Influence of Different Impeller Structure on the Performance of Engine Cooling Water Pump. Fluid Mach. 2018, 46, 27. [Google Scholar]
- Dong, S.; Sun, Z.; Tan, C.; Tao, H. Numerical Investigation on Flow Field of Impeller Front-Side Cavity for Shrouded Impeller. J. Propuls. Technol. 2017, 38, 1241. [Google Scholar]
- Babin, C.; Dumas, M.; Ottavy, X.; Fontaneto, F. Numerical Characterization of an High Pressure Compressor Stage Equipped With a Closed Shrouded Stator Cavity. J. Turbomach.-Trans. Asme 2025, 147, 1–27. [Google Scholar] [CrossRef]
- Meng, C.; Zuo, Z.; Sun, J.; Liang, Q.; Guo, W.; Chen, H. Numerical study on the influence of shroud cavity in the high-pressure centrifugal compressor for compressed air energy storage system. IOP Conf. Ser. Earth Environ. Sci. 2021, 804, 032018. [Google Scholar] [CrossRef]
- Prasad, B.; Sethu Manavalan, V.; Nanjunda Rao, N. Computational and Experimental Investigations of Straight-Through Labyrinth Seals. In Proceedings of the ASME 1997 International Gas Turbine and Aeroengine Congress and Exhibition, Orlando, FL, USA, 2–5 June 1997. [Google Scholar]
- Basol, A.M.; Abhari, R.S. Performance Improvements of Centrifugal Compressors Through Shroud Cavity Leakage Management. In Proceedings of the ASME Turbo Expo 2013: Turbine Technical Conference and Exposition, San Antonio, TX, USA, 3–7 June 2013. [Google Scholar]
- Wang, Z.; Xu, L.; Xi, G. Numerical Investigation on the Labyrinth Seal Design for a Low Flow Coefficient Centrifugal Compressor. In Proceedings of the ASME Turbo Expo 2010: Power for Land, Sea, and Air, Glasgow, UK, 14–18 June 2010. [Google Scholar]
- Mischo, B.; Ribi, B.; Seebass-Linggi, C.; Mauri, S. Influence of Labyrinth Seal Leakage on Centrifugal Compressor Performance. In Proceedings of the ASME Turbo Expo 2009: Power for Land, Sea, and Air, Orlando, FL, USA, 8–12 June 2009; pp. 1283–1293. [Google Scholar]
- Christodoulou, L.; Li, Z.; Ambrose, S.; Jefferson-Loveday, R.; Jackson, R.; Lock, G.D.; Sangan, C.M.; Scobie, J. Control of Shroud Leakage Loss and Windage Torque in a Low-Pressure Turbine Stage. J. Turbomach.-Trans. Asme 2024, 147, 1–21. [Google Scholar]
- Huang, T.; Kong, X.; Lu, H.; Fan, P.; Dong, Z. Study on the influence of labyrinth seal structure on the performance of shrouded stator cascades with inter-stage cavities. Phys. Fluids 2024, 36, 095156. [Google Scholar] [CrossRef]
- Dai, X.; Wang, Z.; He, K.; Yan, X. Effect of Tooth Wear on Leakage Flow Characteristics in a Labyrinth Seal. J. Eng. Thermophys. 2023, 44, 368–373. [Google Scholar]
- Liu, H.; Chen, H.; Yang, X.; Chen, F. Study of loss mechanism in low speed compressor cascade using dissipation function. J. Aerosp. Power 2011, 26, 289–296. [Google Scholar]
- Lüdtke, K.H. Process Centrifugal Compressors; Springer: Berlin, Germany, 2004. [Google Scholar]
- Childs, D.W. Force and moment rotordynamic coefficients for pump-impeller shroud surfaces. 1987. Available online: https://ntrs.nasa.gov/citations/19870012793 (accessed on 17 February 2025).
- Karimi, M.; Akdogan, G.; Dellimore, K.; Bradshaw, S. Quantification of numerical uncertainty in computational fluid dynamics modelling of hydrocyclones. Comput. Chem. Eng. 2012, 43, 45–54. [Google Scholar] [CrossRef]
- Manna, P.; Dharavath, M.; Sinha, P.; Chakraborty, D. Optimization of a flight-worthy scramjet combustor through CFD. Aerosp. Sci. Technol. 2013, 27, 138–146. [Google Scholar] [CrossRef]
- Menter, F.R. Two-equation eddy-viscosity turbulence models for engineering applications. AIAA J. 1994, 32, 1598–1605. [Google Scholar] [CrossRef]
- Khabibova, N.Z. Dissipative function in engineering calculations. In Fundamental Principles and Practical Applications; Australian Publishers: Melbourne, VIC, Australia, 2022. [Google Scholar]
- Liu, W.; Liu, P.; Dong, Z.M.; Yang, K.; Liu, Z.C. A study on the multi-field synergy principle of convective heat and mass transfer enhancement. Int. J. Heat. Mass. Transf. 2019, 134, 722–734. [Google Scholar] [CrossRef]
- Shao, Z.; Li, W.; Wang, X.; Zhang, X.; Chen, H. Analysis of Shroud Cavity Leakage in a Radial Turbine for Optimal Operation in Compressed Air Energy Storage System. J. Eng. Gas. Turbines Power-Trans. ASME 2020, 142, 071005. [Google Scholar] [CrossRef]


| Name | Characteristics | Leakage Rate |
|---|---|---|
| None | No Cavity | 0 |
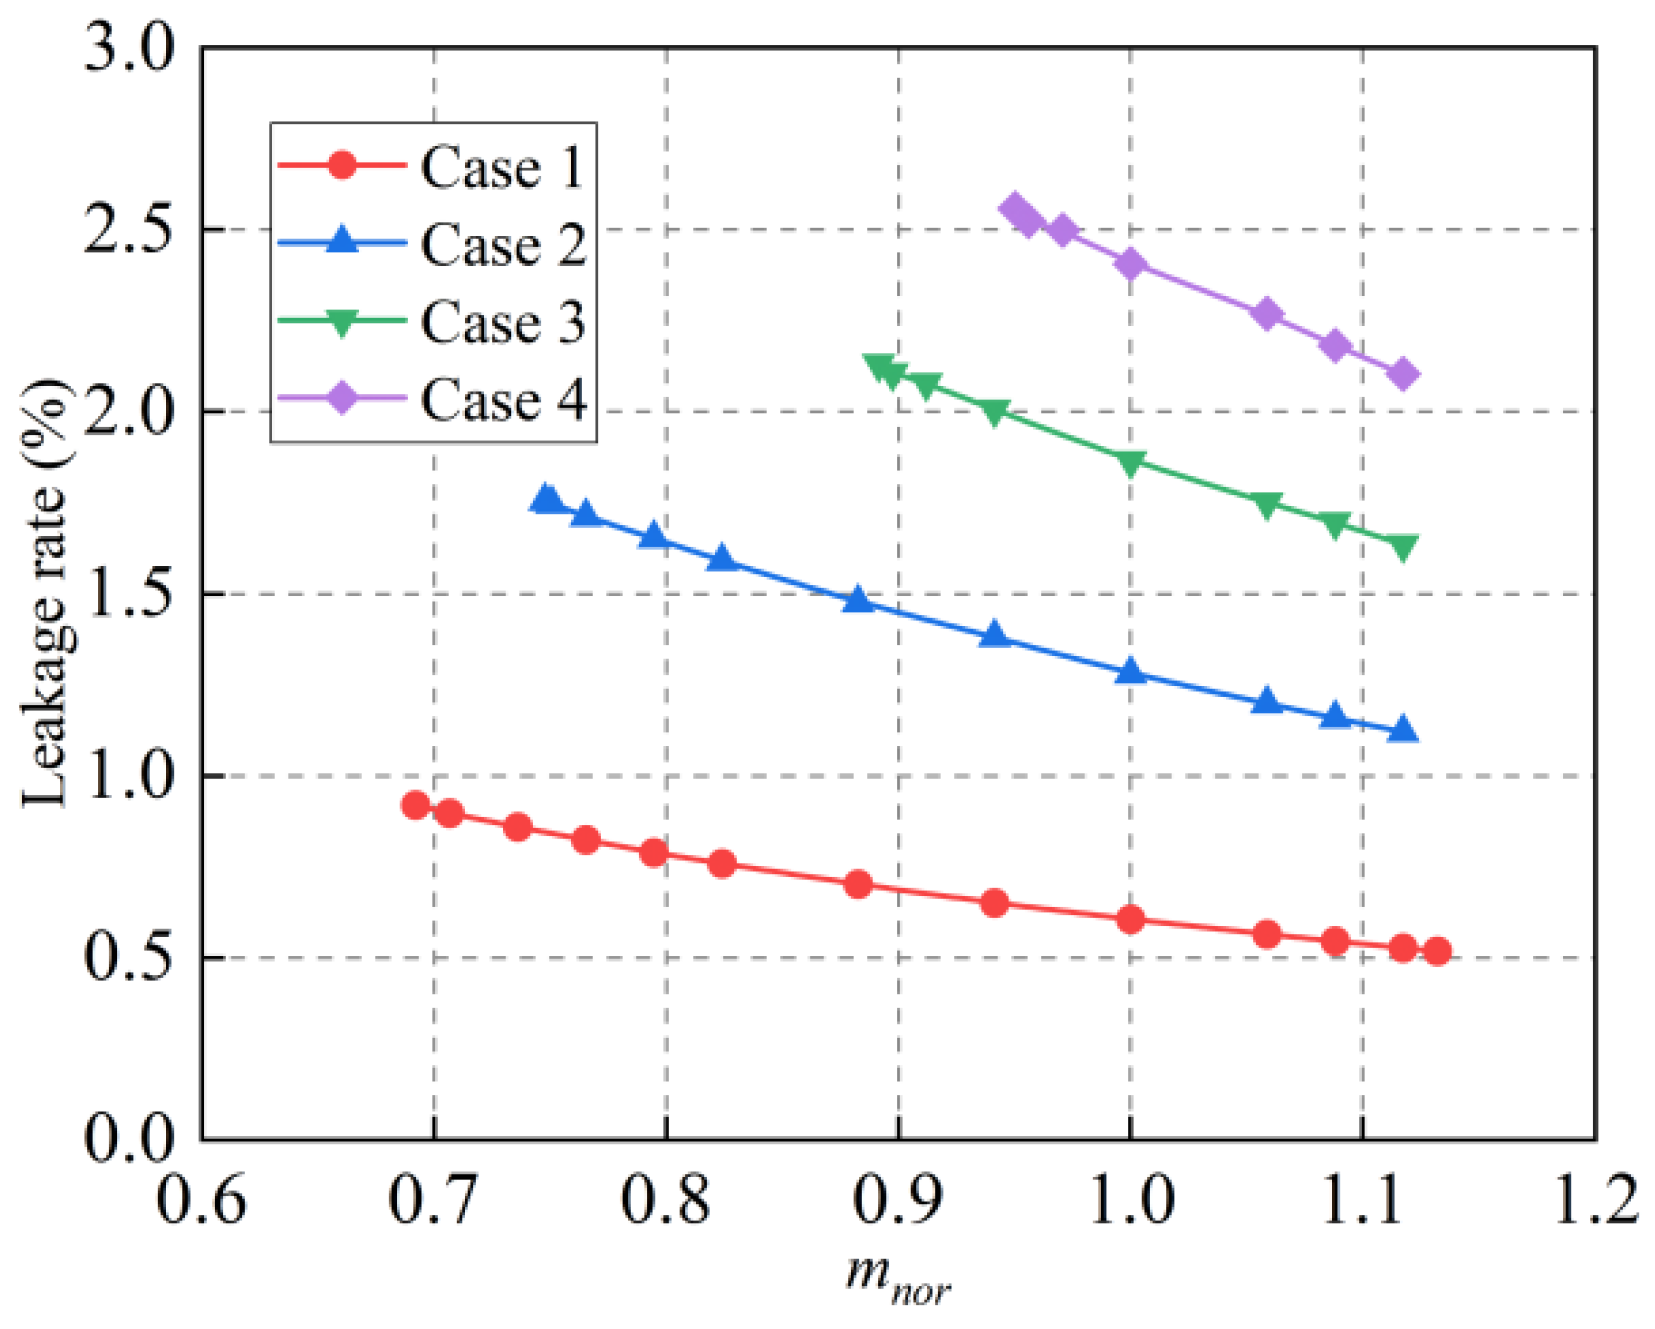
| Case 1 | Cavity and Seal Teeth 1 (5 Teeth 0.1 mm) | 0.60% |
| Case 2 | Cavity and Seal Teeth 2 (5 Teeth 0.2 mm) | 1.28% |
| Case 3 | Cavity and Seal Teeth 3 (5 Teeth 0.3 mm) | 1.86% |
| Case 4 | Cavity and Seal Teeth 4 (5 Teeth 0.4 mm) | 2.41% |
| Name | Cavity Inlet | Cavity Outlet |
|---|---|---|
| Case 3a | Closed | Connected to the impeller inlet |
| Case 3b | Connected to the impeller outlet | Closed |
| Case 3c | Connected to the impeller outlet | Pressure outlet |
| Case 3d | Pressure flow inlet | Connected to the impeller inlet |
Disclaimer/Publisher’s Note: The statements, opinions and data contained in all publications are solely those of the individual author(s) and contributor(s) and not of MDPI and/or the editor(s). MDPI and/or the editor(s) disclaim responsibility for any injury to people or property resulting from any ideas, methods, instructions or products referred to in the content. |
© 2025 by the authors. Licensee MDPI, Basel, Switzerland. This article is an open access article distributed under the terms and conditions of the Creative Commons Attribution (CC BY) license (https://creativecommons.org/licenses/by/4.0/).
Share and Cite
Chen, J.; Zuo, Z.; Chen, J.; Sun, J.; Chen, H. A Numerical Study on Leakage Flow in the Shroud Cavity of a Centrifugal Impeller. Energies 2025, 18, 2042. https://doi.org/10.3390/en18082042
Chen J, Zuo Z, Chen J, Sun J, Chen H. A Numerical Study on Leakage Flow in the Shroud Cavity of a Centrifugal Impeller. Energies. 2025; 18(8):2042. https://doi.org/10.3390/en18082042
Chicago/Turabian StyleChen, Jiaxi, Zhitao Zuo, Jixiang Chen, Jianting Sun, and Haisheng Chen. 2025. "A Numerical Study on Leakage Flow in the Shroud Cavity of a Centrifugal Impeller" Energies 18, no. 8: 2042. https://doi.org/10.3390/en18082042
APA StyleChen, J., Zuo, Z., Chen, J., Sun, J., & Chen, H. (2025). A Numerical Study on Leakage Flow in the Shroud Cavity of a Centrifugal Impeller. Energies, 18(8), 2042. https://doi.org/10.3390/en18082042