

Experimental Studies on the Thermal Hydraulics of a Fuel Column for a Gas-Cooled Micro Reactor (GMR)

 ,
,
Abstract
1. Introduction
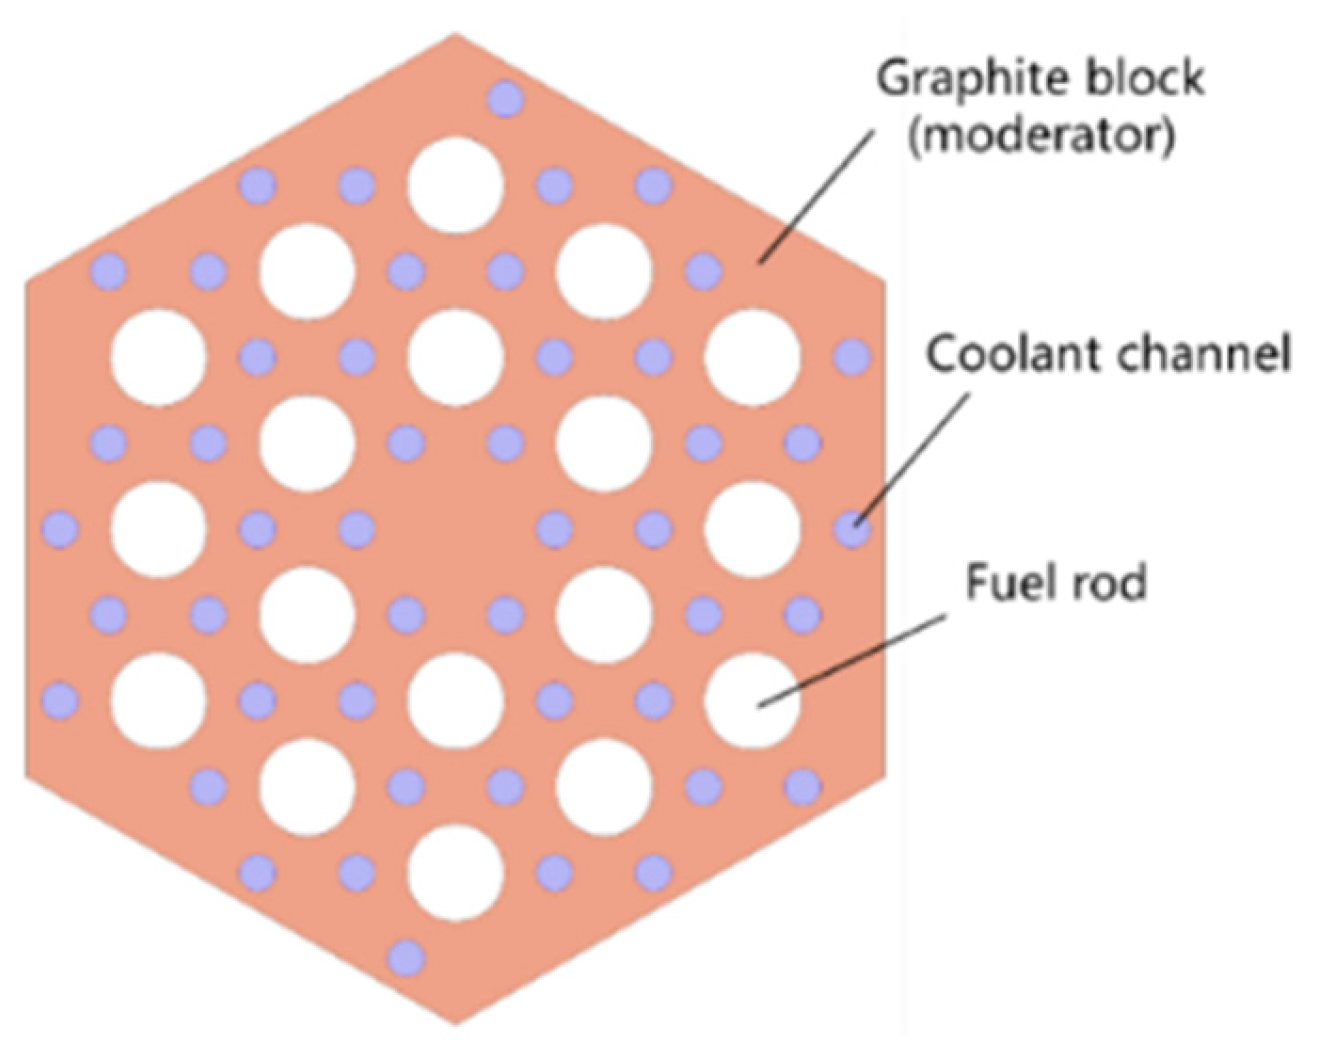
2. Overview of the GMR Core
3. Experimental Apparatus
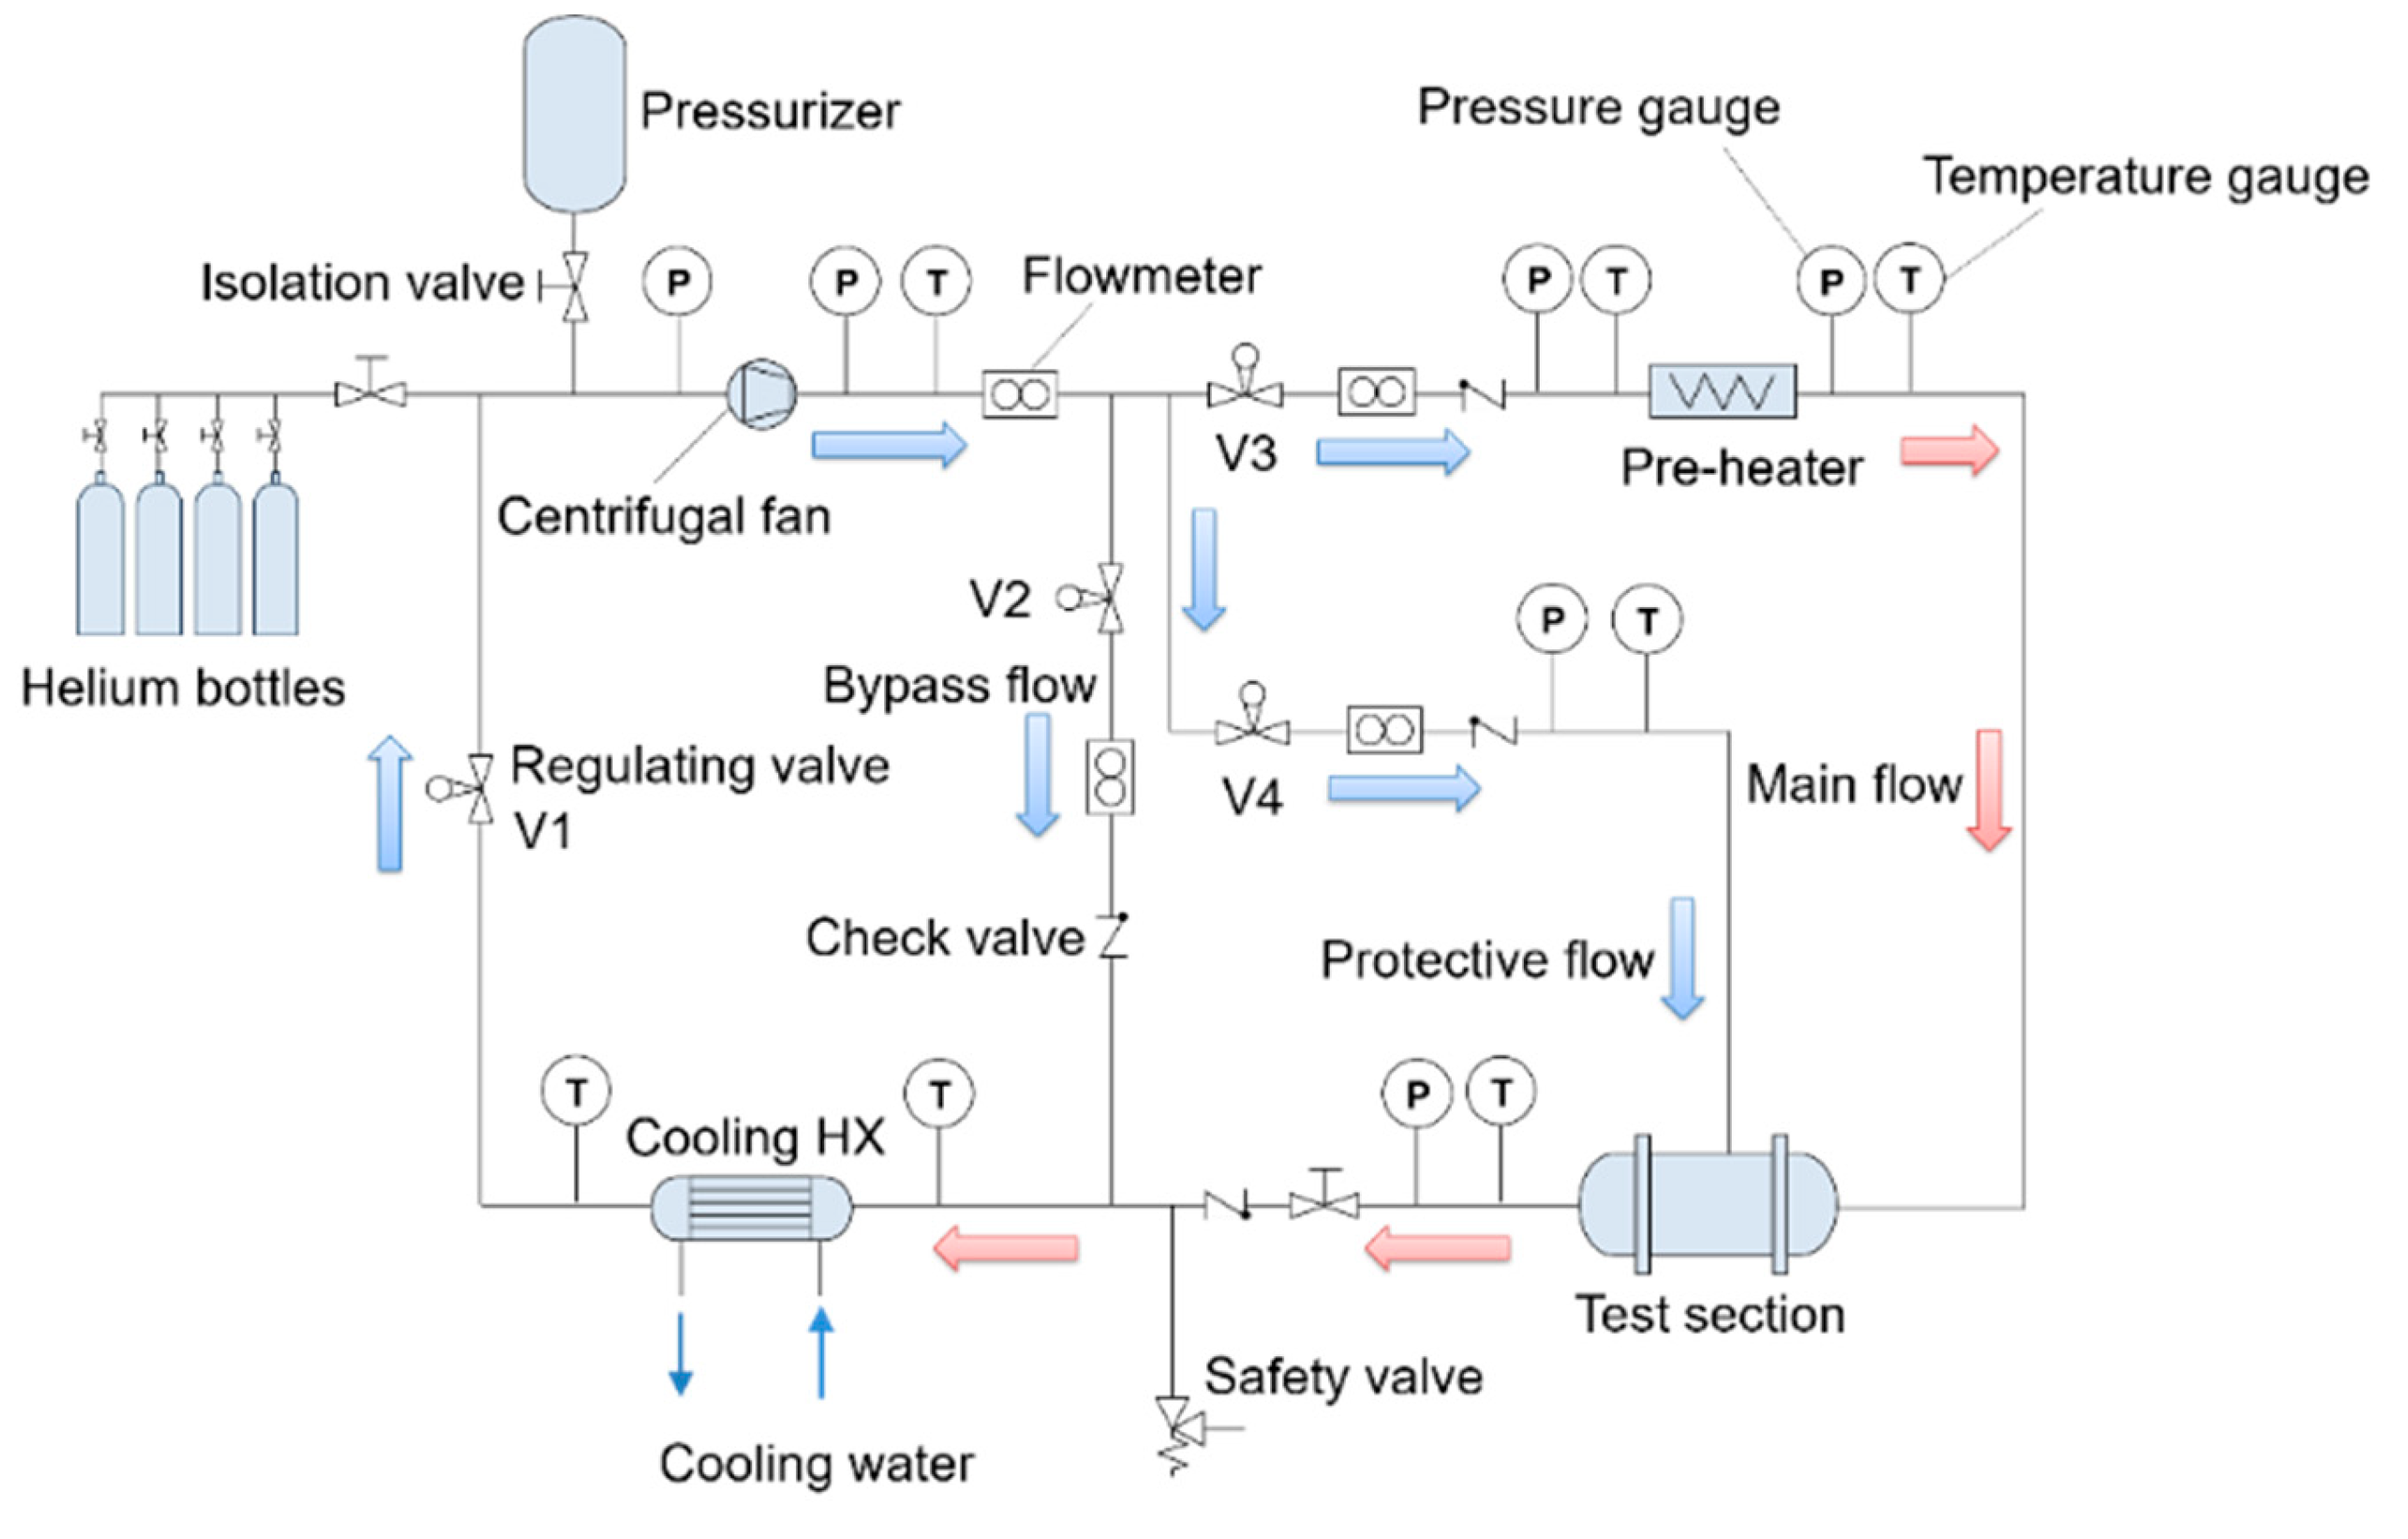
3.1. Primary Loop
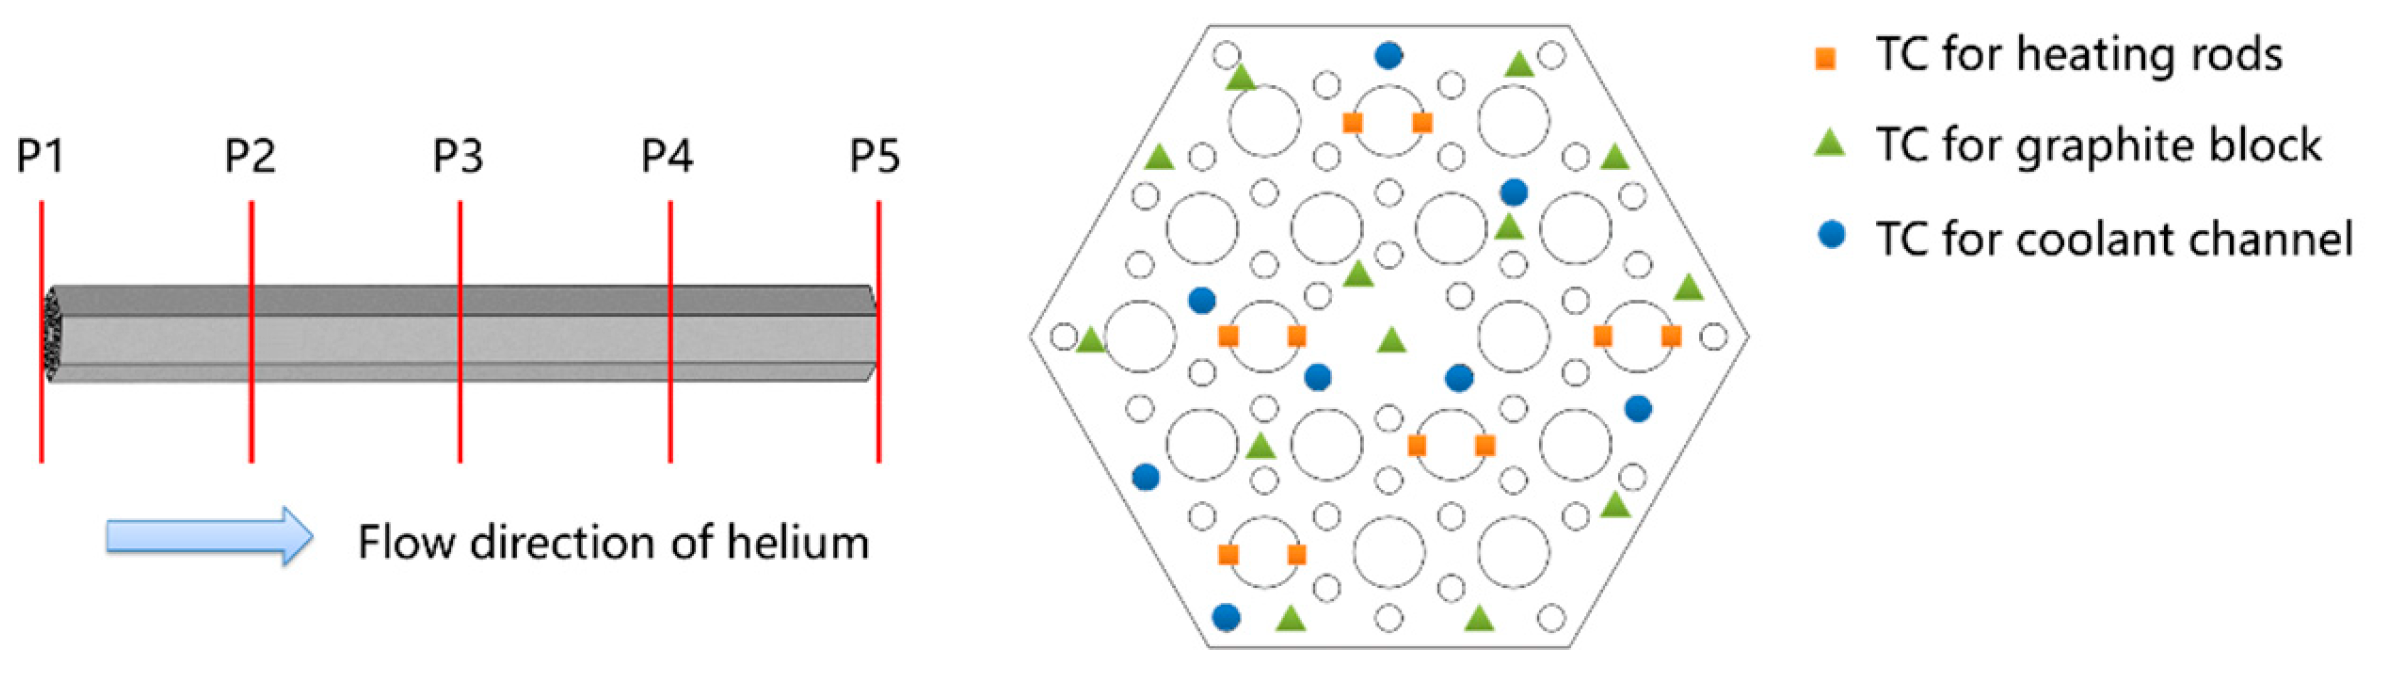
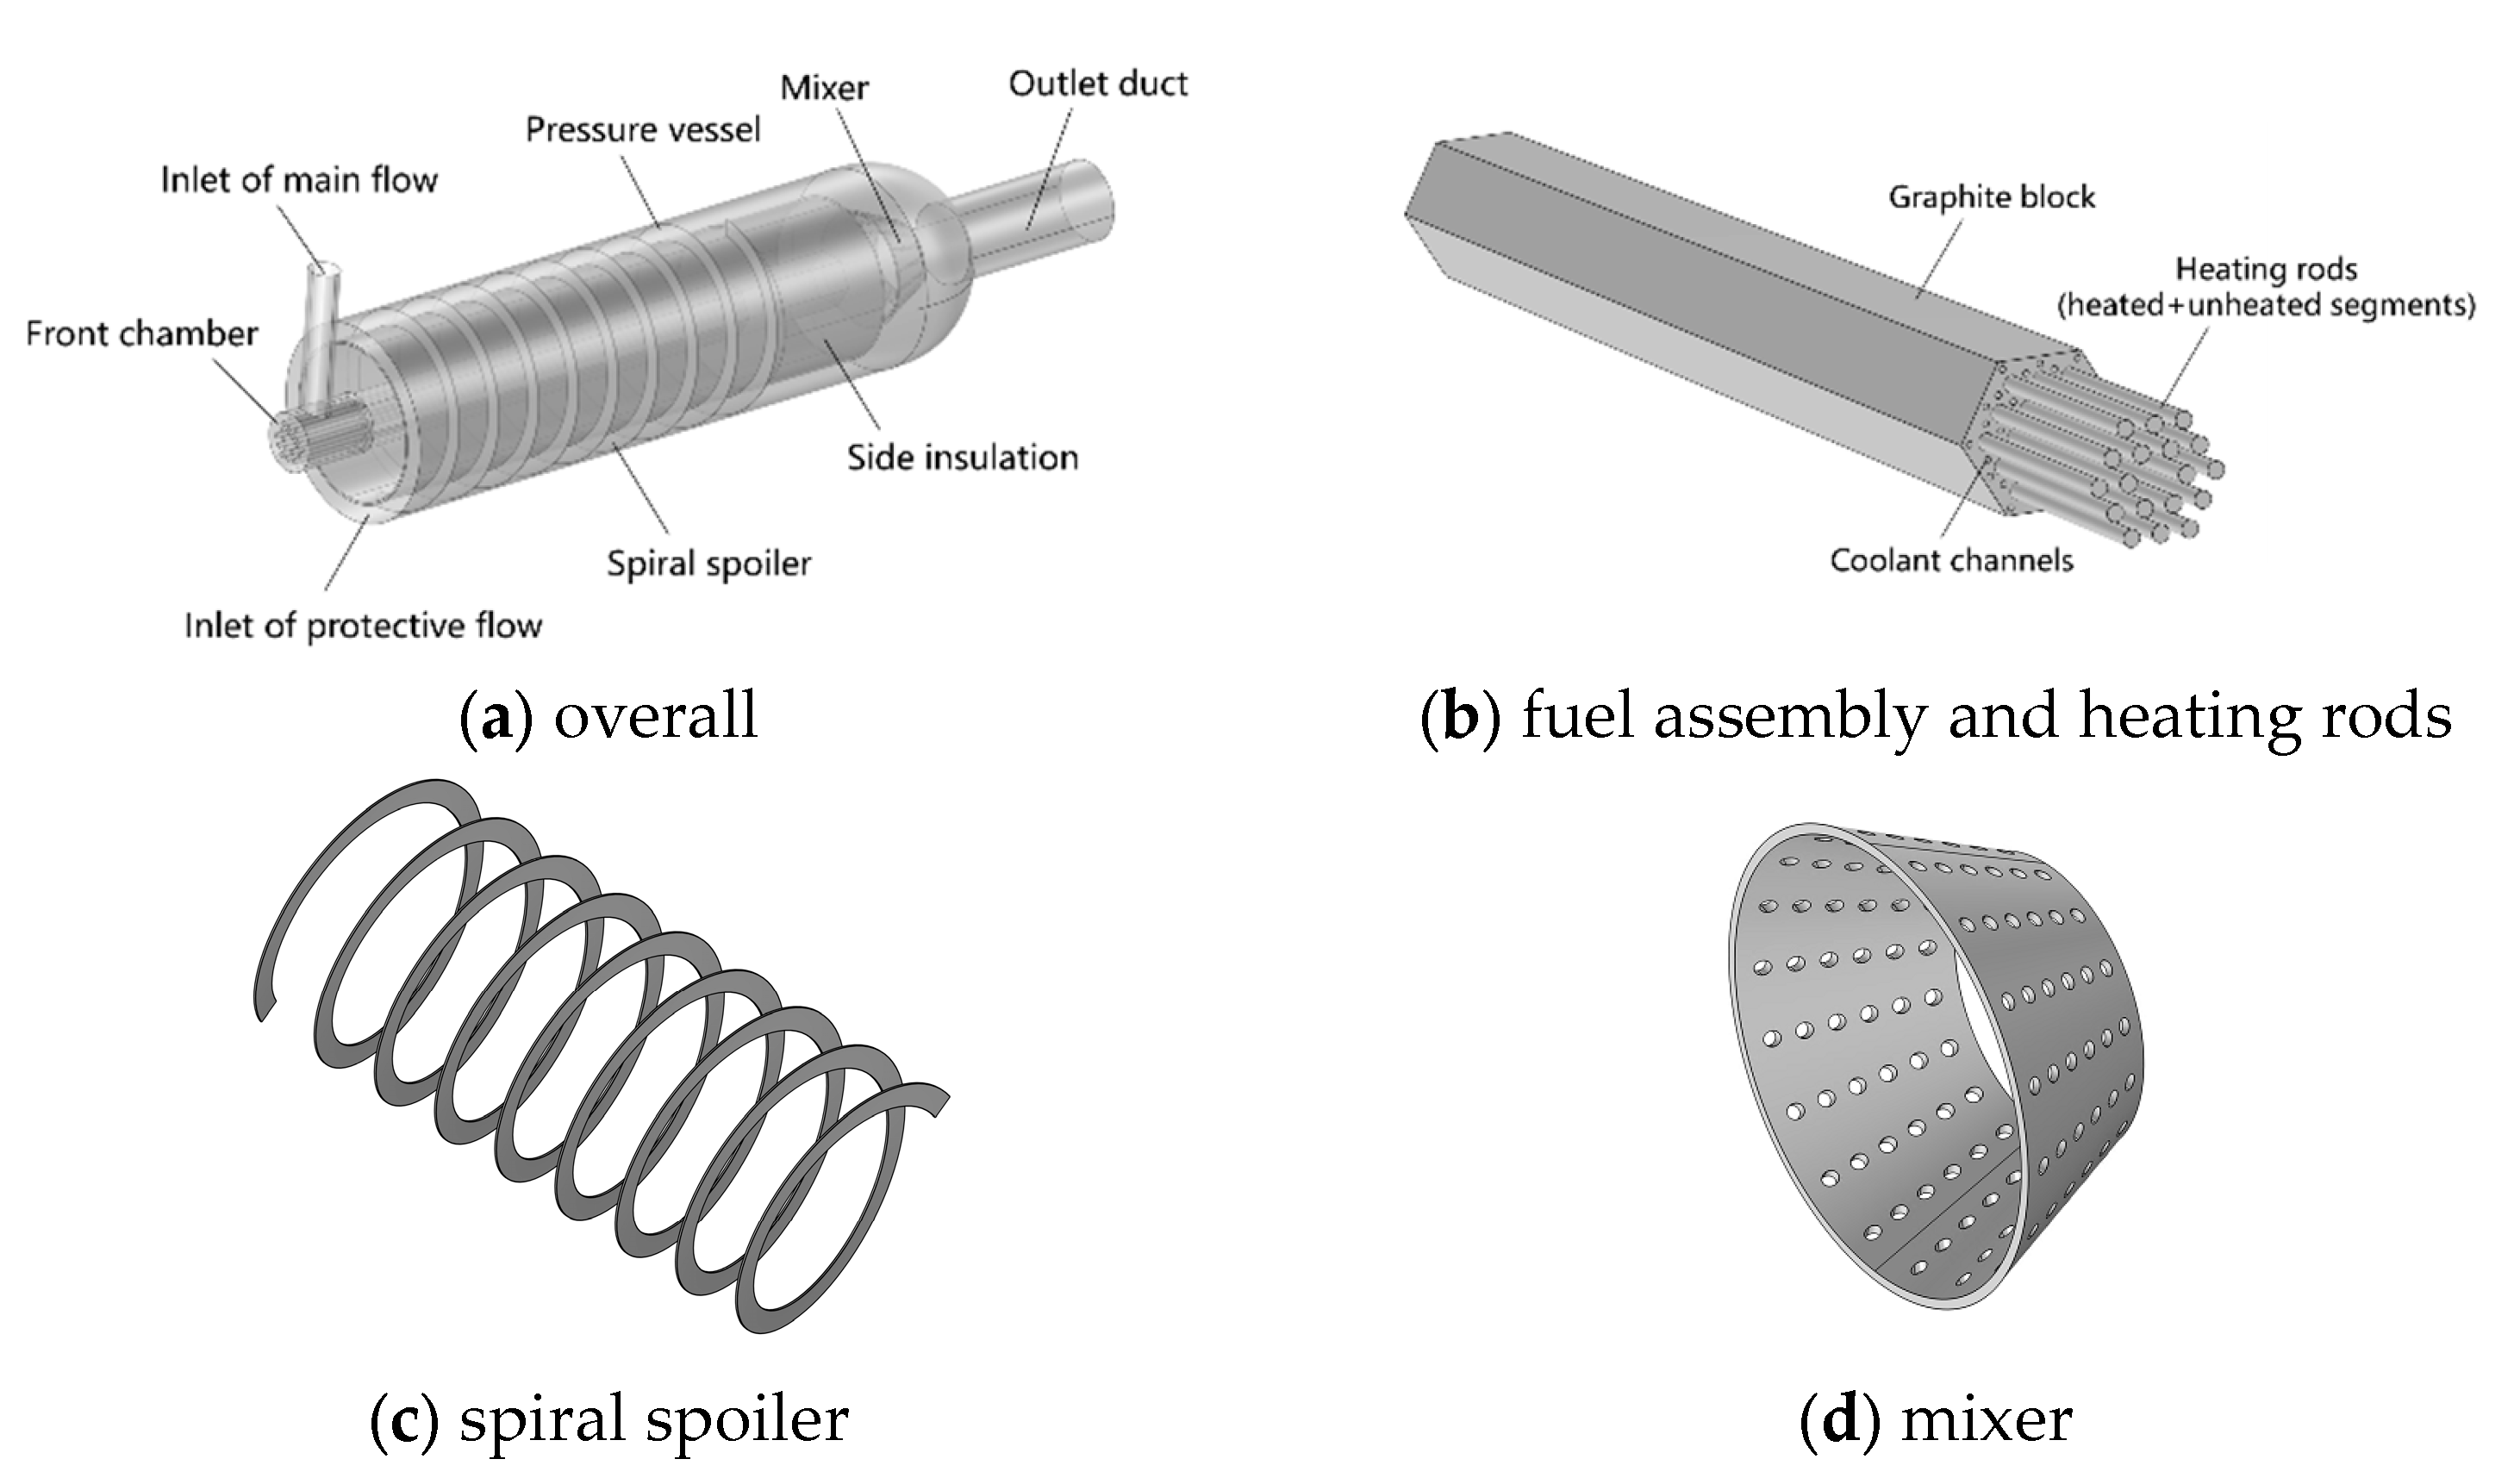
3.2. Test Section
3.3. Test Procedure and Conditions
4. Pre-Test Simulation
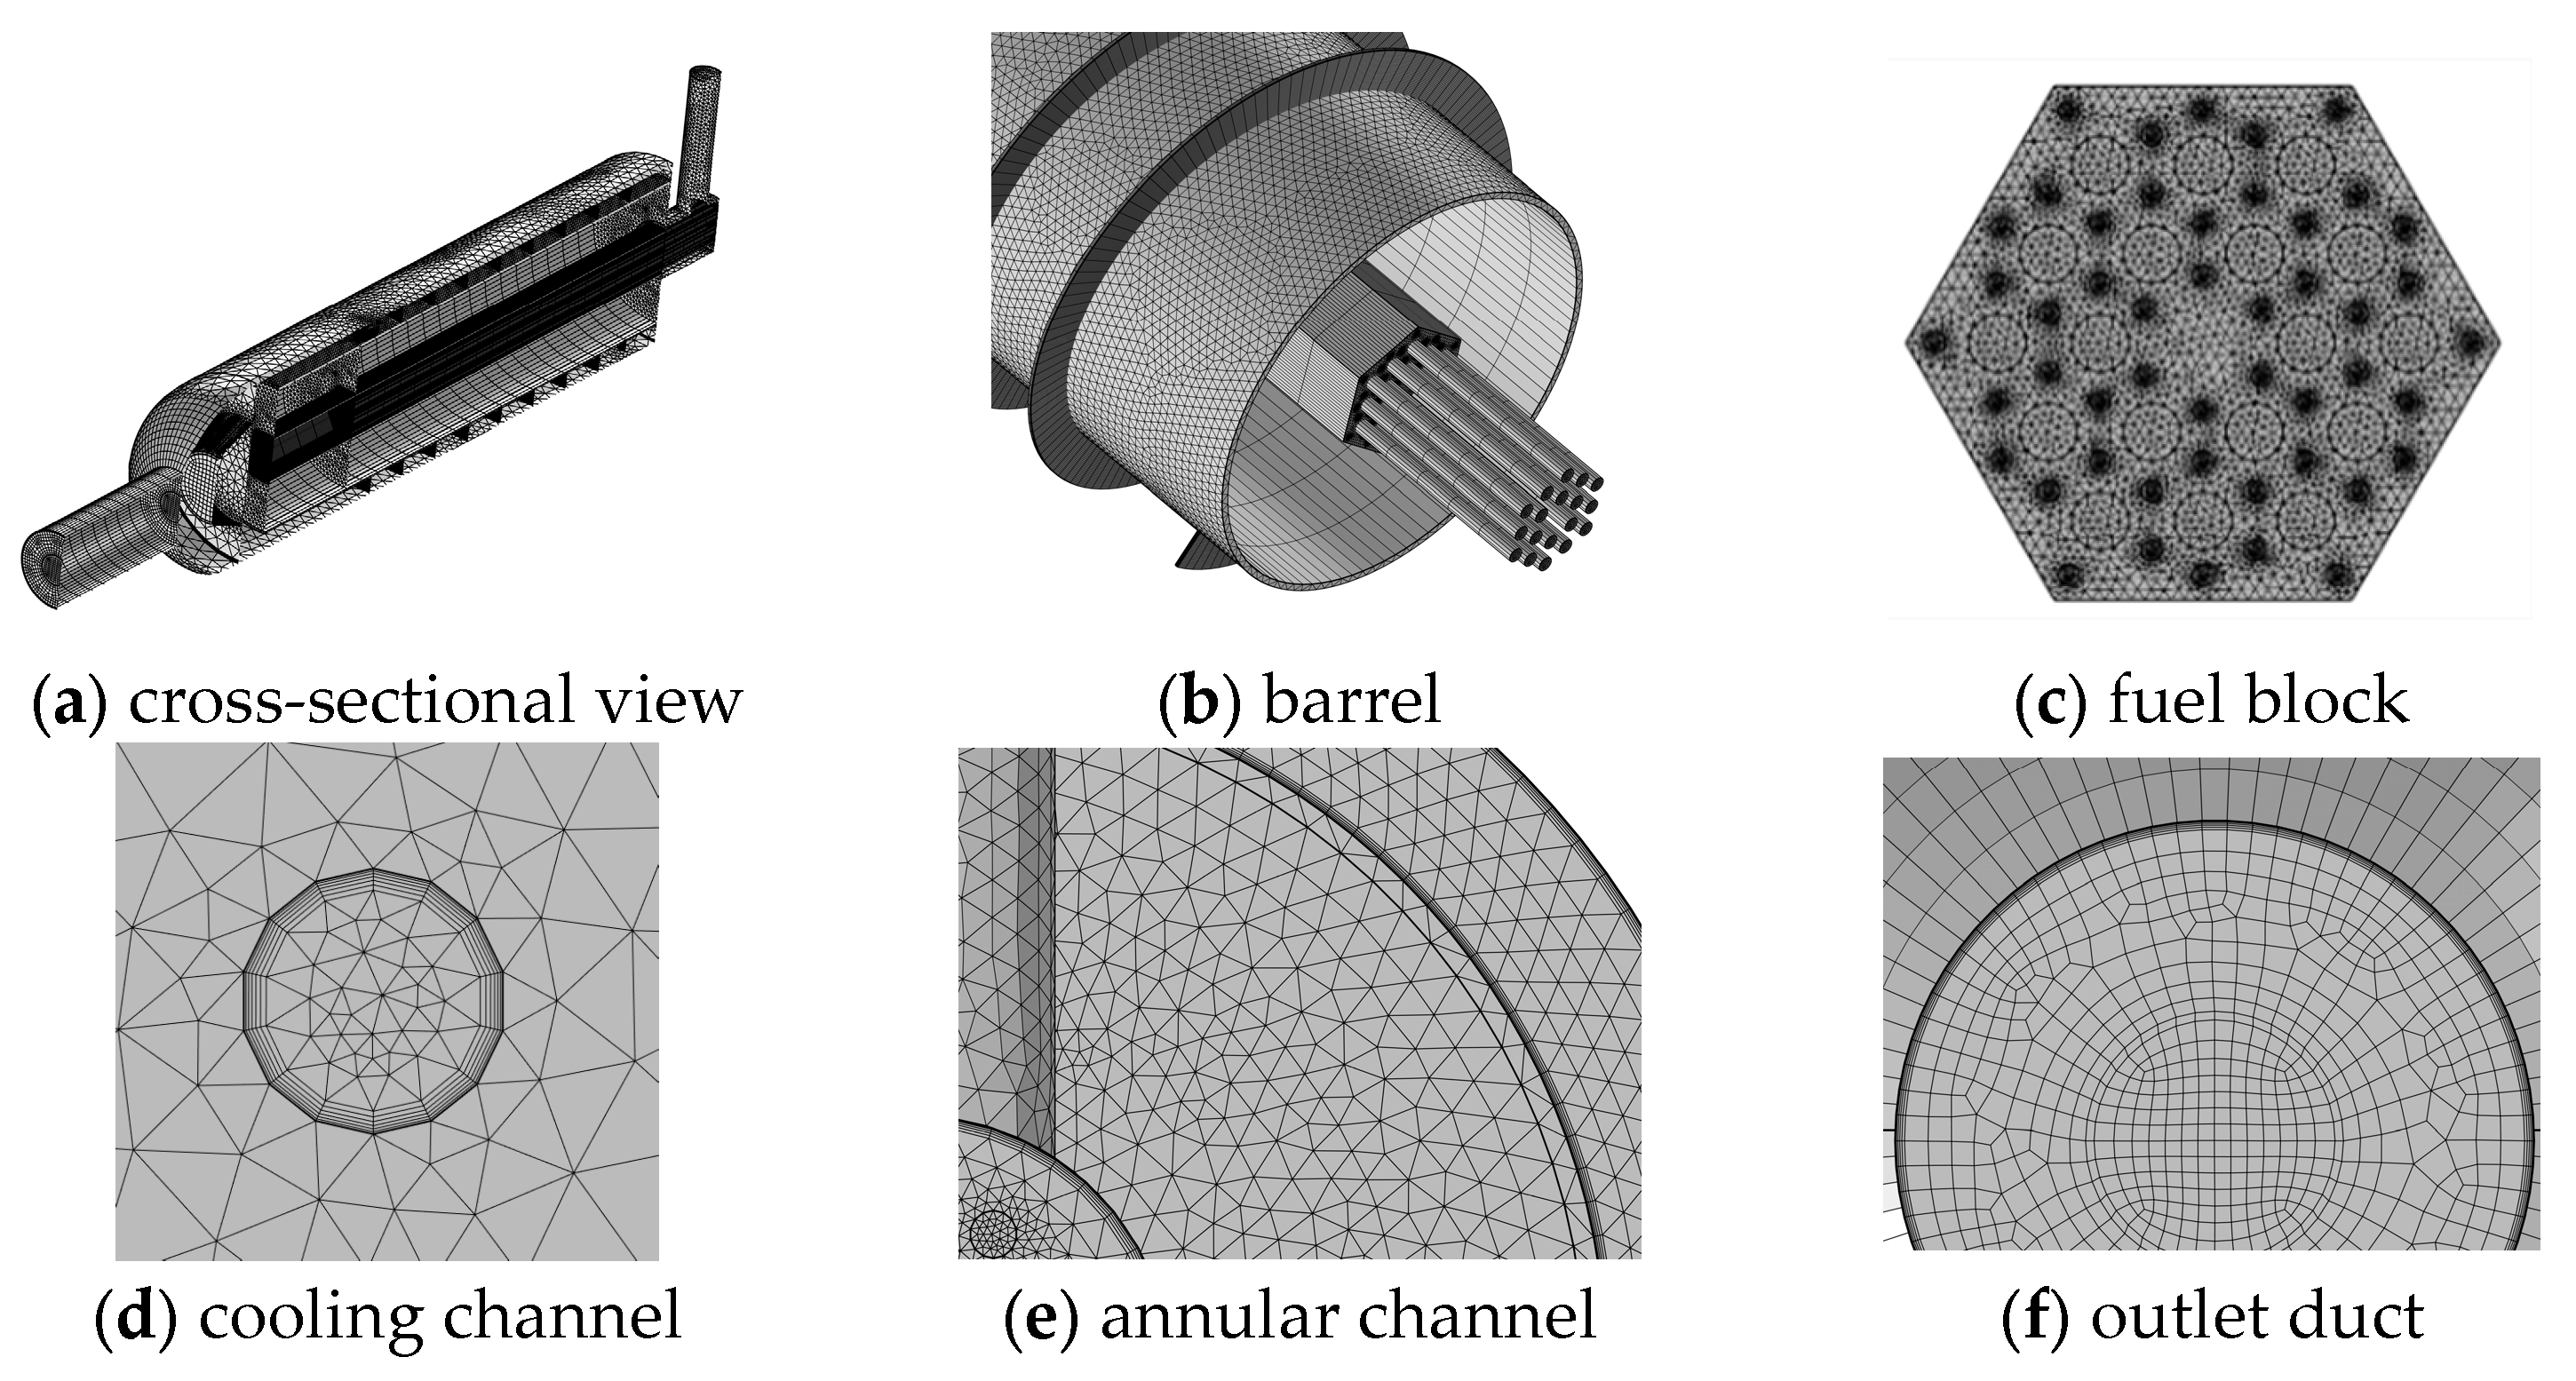
4.1. Numerical Model
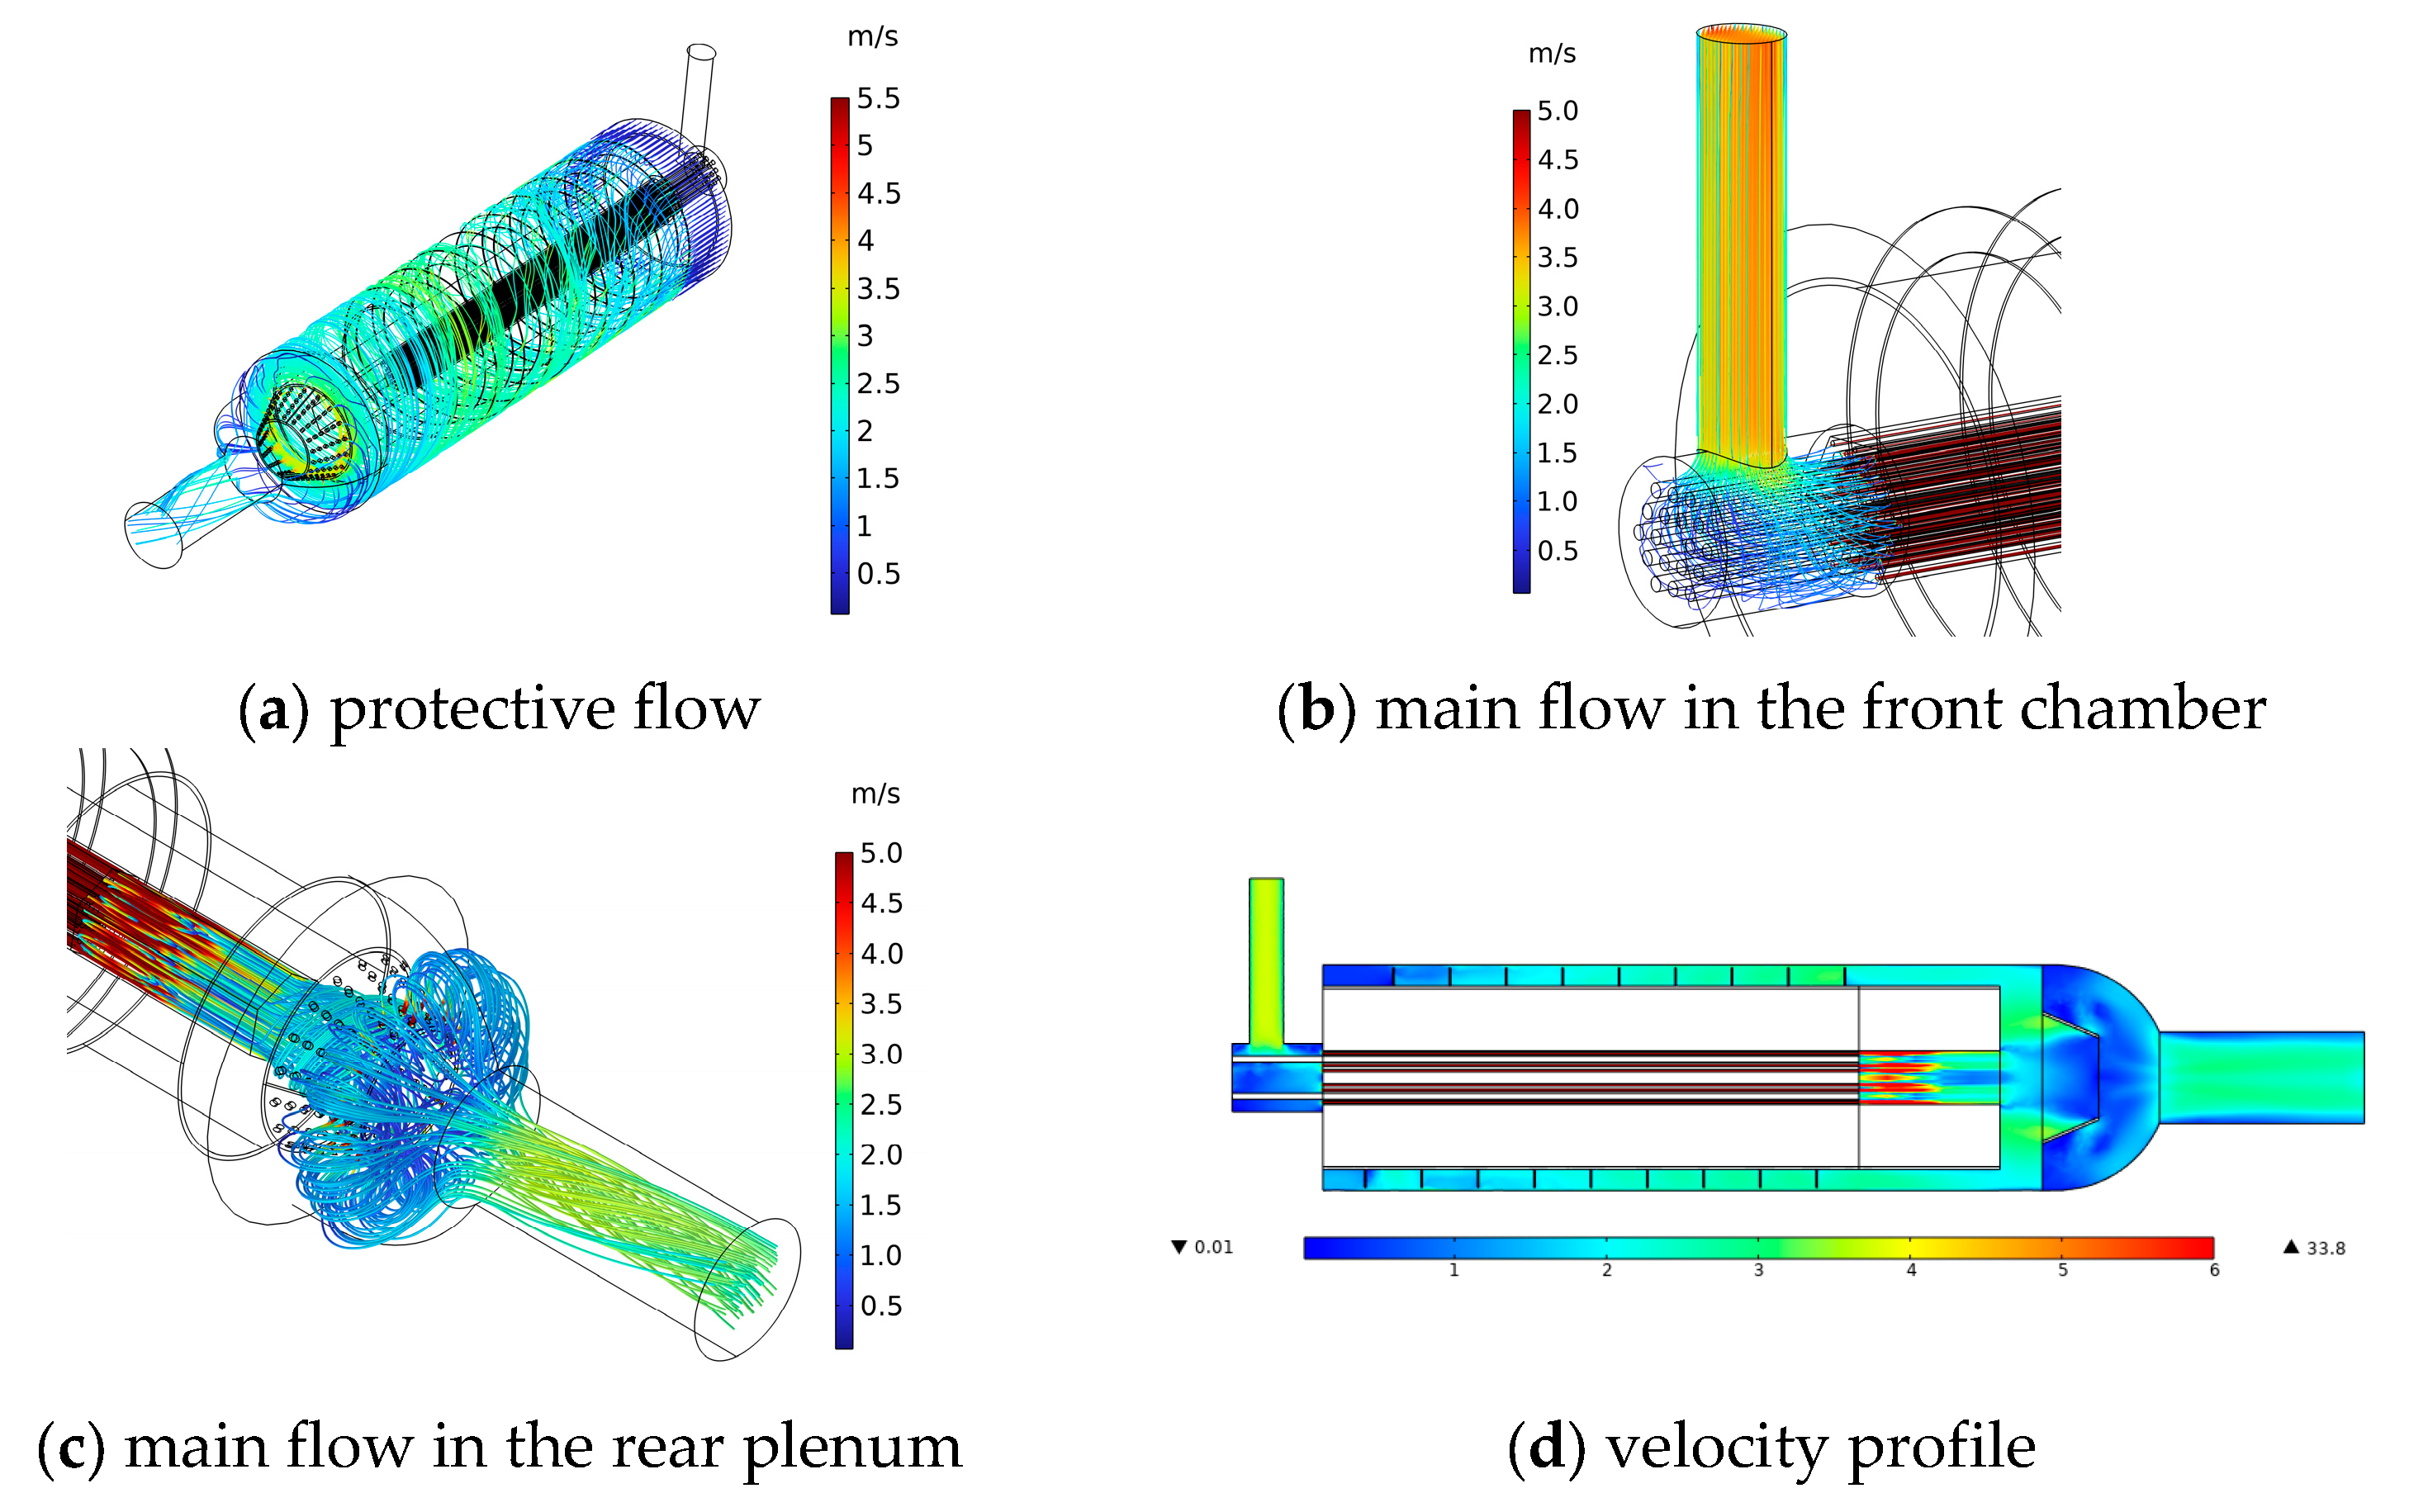
4.2. Simulation Results
5. Preliminary Test
6. Concluding Remarks
Author Contributions
Funding
Data Availability Statement
Conflicts of Interest
References
- A Technology Roadmap for Generation IV Nuclear Energy Systems; Report No. GIF-002-00; US DOE Nuclear Energy Research Advisory Committee: Washington, DC, USA; Generation IV International Forum: Washington, DC, USA, 2002.
- Slabber, J. Technical Description of the PBMR Demonstration Power Plant, Revision 4; PBMR-016956; PBMR(Pty) Ltd.: Centurion, South Africa, 2006. [Google Scholar]
- IAEA. Evaluation of High Temperature Gas Cooled Reactor Performance: Benchmark Analysis Related to the PBMR-400, PBMM, GT-MHR, HTR-10 and the ASTRA Critical Facility; (IAEA-TECDOC-1694); International Atomic Energy Agency: Vienna, Austria, 2013. [Google Scholar]
- NEA. Benchmark of the Modular High-Temperature Gas-Cooled Reactor (MHTGR)-350 MW Core Design; Nuclear Energy Agency: Paris, France, 2018; Volumes 1 and 2. [Google Scholar]
- Saito, S.; Tanaka, T.; Sudo, Y. Design of High Temperature Engineering Test Reactor (HTTR); JAERI-1332; Japan Atomic Energy Research Institute: Tokyo, Japan, 1994.
- Wu, Z.X.; Lin, D.C.; Zhong, D.X. The design features of the HTR-10. Nucl. Eng. Des. 2002, 218, 25–32. [Google Scholar] [CrossRef]
- Zhang, Z.; Dong, Y.; Li, F.; Zhang, Z.; Wang, H.; Huang, X.; Li, H.; Liu, B.; Wu, X.; Wang, H.; et al. The Shandong Shidao Bay 200 MWe High-Temperature Gas-Cooled Reactor Pebble-Bed Module (HTR-PM) Demonstration Power Plant: An Engineering and Technological Innovation. Engineering 2016, 2, 112–118. [Google Scholar] [CrossRef]
- Huang, Z.; Zhang, S.; Dong, J.; Wang, H.; Liu, G.; Chen, Q.; Du, S. Integral numerical simulation of reactor core and passive core cooling system for micro gas-cooled reactor based on CFD method. At. Energy Sci. Technol. 2023, 57, 1182–1192. [Google Scholar]
- Lange, M. Experimente zur Selbsttätigen Abfuhr der Nachwärme bei Hochtemperatur-Reaktoren: Planung, Vorbereitung und Ergebnisse; Berichte des Forschungszentrums Jülich-3012; Institut für Sicherheitsforschung uröd Reaktortechnik: Sankt Augustin, Germany, 1995. [Google Scholar]
- Nissen, H.F. NACOK experiment: Experimental set-up, execution of the test, experimental results. RAPHAEL, Deliverable D-ST3.3. 2008. [Google Scholar]
- Zheng, Y.H.; Stempniewicz, M.M. Investigation of NACOK air ingress experiment using different system analysis codes. Nucl. Eng. Des. 2012, 251, 423–432. [Google Scholar] [CrossRef]
- Schultz, R.R.; Bayless, P.D.; Johnson, R.W.; Taitano, W.T.; Wolf, J.R.; McCreery, G.E. Studies Related to the Oregon State University High Temperature Test Facility: Scaling, the Validation Matrix, and Similarities to the Modular High Temperature Gas-Cooled Reactor; INL/EXT-10-19803; Idaho National Laboratory: Idaho Falls, ID, USA, 2010. [Google Scholar]
- Kile, R.F.; Epiney, A.S.; Brown, N.R. RELAP5-3D validation studies based on the High Temperature Test facility. Nucl. Eng. Des. 2024, 426, 113401. [Google Scholar] [CrossRef]
- Vododokhov, N.; Trivedi, A.; Novog, D.R. ASYST4.1 validation for gas cooled SMR applications using the HTTF experiment. Nucl. Eng. Des. 2023, 414, 112643. [Google Scholar] [CrossRef]
- Miyamoto, Y.; Hino, R.; Inagaki, Y. Demonstration Tests for HTGR Fuel Elements and Core Components with Test Sections in HENDEL; JAERI-1333; Japan Atomic Energy Research Institute: Tokyo, Japan, 1995.
- Maruyama, S.; Takase, K.; Hino, R.; Izawa, N.; Hishida, M.; Shimomura, H. Experimental studies on the thermal and hydraulic performance of the fuel stack of the VHTR Part I: HENDEL single-channel tests with uniform heat flux. Nucl. Eng. Des. 1987, 102, 1–9. [Google Scholar] [CrossRef]
- Maruyama, S.; Takase, K.; Hino, R. Experimental studies on the thermal and hydraulic performance of the fuel stack of the VHTR Part II: HENDEL multi-channel test rig with twelve fuel rods. Nucl. Eng. Des. 1987, 102, 11–20. [Google Scholar] [CrossRef]
- Kunitomi, K.; Inagaki, Y.; Ioka, I.; Suzuki, K.; Nekoya, S.; Miyamoto, Y. Thermal and hydraulic tests in HENDEL T2 supporting the development of the core bottom structure of the High Temperature Engineering Test Reactor (HTTR). Nucl. Eng. Des. 1988, 108, 359–368. [Google Scholar] [CrossRef]
- COMSOL. COMSOL Multiphysics Reference Manual. COMSOL AB. 2021. Available online: https://doc.comsol.com/5.5/doc/com.comsol.help.comsol/COMSOL_ReferenceManual.pdf (accessed on 15 February 2025).
- Versteeg, H.K.; Malalasekera, W. An Introduction to Computational Fluid Dynamics: The Finite Volume Method, 2nd ed.; Pearson Education Limited: Edinburgh, UK, 2007; pp. 21–24. [Google Scholar]
- Churchill, S.W.; Chu, H.H. Correlating equations for laminar and turbulent free convection from a horizontal cylinder. Int. J. Heat Mass Transf. 1975, 18, 1049–1053. [Google Scholar] [CrossRef]


| Parameter | Value |
|---|---|
| Loop operational pressure (gauge) | 2.9 MPa |
| Core inlet temperature | 445 °C |
| Annular channel inlet temperature | 75 °C |
| Mass flow rate of helium through the core | 0.08 kg/s |
| Input power density of the heating rods | 2.4 kWth/m3 |
| Constant | Value | Description |
|---|---|---|
| 0.09 | to k and ε | |
| 1.44 | Coefficient scaling ε production | |
| 1.92 | Coefficient scaling ε destruction | |
| 1.0 | Turbulent diffusivity for k | |
| 1.3 | Turbulent diffusivity for ε |
| Boundary Location | Type | |
|---|---|---|
| Fluid Flow | Heat Transfer | |
| Inlet of the main flow | Mass flow rate | Temperature (=445 °C) |
| Inlet of the protective flow | Mass flow rate | Temperature (=75 °C) |
| Outlet at the outlet duct | Outflow | Zero temperature gradient |
| Outlet of the annular channel | Outflow | Zero temperature gradient |
| Outer wall of the pressure vessel | None | Convective (h = 5 W/(m2-K), ambient temperature = 30 °C) |
| Component | Material | Density (kg/m3) | Conductivity (W/(m-K)) | Specific Heat Capacity (J/(kg-K)) |
|---|---|---|---|---|
| Hexagonal block | Graphite | 1900 | 129 | 710 |
| Heating rod | MgO | 3400 | 58 | 960 |
| Side insulation | Aluminum silicate | 150 | 0.05 | 840 |
| Pressure vessel and internal structures | Stainless steel | 7800 | 15 | 460 |
| Parameter | Value |
|---|---|
| Loop operational pressure (gauge) | 0.8 MPa |
| Core inlet temperature | 262 °C |
| Annular channel inlet temperature | 51 °C |
| Mass flow rate of helium through the core | 0.067 kg/s |
| Input power of the heating rods | 38 kW |
Disclaimer/Publisher’s Note: The statements, opinions and data contained in all publications are solely those of the individual author(s) and contributor(s) and not of MDPI and/or the editor(s). MDPI and/or the editor(s) disclaim responsibility for any injury to people or property resulting from any ideas, methods, instructions or products referred to in the content. |
© 2025 by the authors. Licensee MDPI, Basel, Switzerland. This article is an open access article distributed under the terms and conditions of the Creative Commons Attribution (CC BY) license (https://creativecommons.org/licenses/by/4.0/).
Share and Cite
Huang, Z.; Jiao, M.; Jiao, J.; Sun, Y.; Xue, Y.; Zhang, S.; Wang, D. Experimental Studies on the Thermal Hydraulics of a Fuel Column for a Gas-Cooled Micro Reactor (GMR). Energies 2025, 18, 2039. https://doi.org/10.3390/en18082039
Huang Z, Jiao M, Jiao J, Sun Y, Xue Y, Zhang S, Wang D. Experimental Studies on the Thermal Hydraulics of a Fuel Column for a Gas-Cooled Micro Reactor (GMR). Energies. 2025; 18(8):2039. https://doi.org/10.3390/en18082039
Chicago/Turabian StyleHuang, Zheng, Miaoxin Jiao, Jian Jiao, Yanyu Sun, Yanfang Xue, Shuoting Zhang, and Dingsheng Wang. 2025. "Experimental Studies on the Thermal Hydraulics of a Fuel Column for a Gas-Cooled Micro Reactor (GMR)" Energies 18, no. 8: 2039. https://doi.org/10.3390/en18082039
APA StyleHuang, Z., Jiao, M., Jiao, J., Sun, Y., Xue, Y., Zhang, S., & Wang, D. (2025). Experimental Studies on the Thermal Hydraulics of a Fuel Column for a Gas-Cooled Micro Reactor (GMR). Energies, 18(8), 2039. https://doi.org/10.3390/en18082039