Abstract
This study focuses on a low-permeability sandstone reservoir in the Changqing Oilfield, aiming to elucidate the formation mechanism and occurrence state of residual oil during late-stage waterflooding development, thereby providing theoretical guidance for refined residual oil recovery. By integrating scanning electron microscopy (SEM), nuclear magnetic resonance (NMR), and digital core analysis, the oil–water occurrence state and dynamic characteristics during waterflooding were systematically investigated. NMR was employed to determine fluid distribution within core pores, while CT scanning was utilized to construct a 3D digital core model, enabling the identification of microscopic residual oil displacement and occurrence states at different flooding stages. The oil displacement efficiency was further analyzed based on variations in oil–water distribution and occurrence states within the core. The results demonstrate that pore and throat size and connectivity are the primary factors governing reservoir permeability. After high-pore-volume (PV) waterflooding, microscopic residual oil predominantly exists as dispersed droplets, films, and small-scale clusters or columns. Although prolonged high-PV waterflooding effectively expands the sweep volume, localized displacement efficiency declines, and reservoir heterogeneity adversely affects sweep volume maintenance. The post-flooding residual oil characteristics are collectively determined by the core’s local connectivity, wettability, and pore–throat morphology. This research systematically analyzes the occurrence patterns and evolutionary trends of residual oil in low-permeability reservoirs during long-term waterflooding, providing critical theoretical insights and technical support for enhanced oil recovery and residual oil exploitation.
1. Introduction
Waterflooding development is an important recovery enhancement technology for low-permeability reservoirs, clarifying the formation mechanism, occurrence state, and displacement conditions of residual oil [1,2,3,4,5,6,7,8]. Wang et al. [2] integrated core flooding experiments with fluorescence analysis to systematically analyze the distribution characteristics and recoverable potential of microscopic residual oil under different displacement methods. Guo et al. [4] conducted a comprehensive investigation on the residual oil distribution patterns following heterogeneous composite flooding, establishing the mobilization mechanisms in reservoirs subjected to this enhanced oil recovery technique. Sun et al. [5] developed microfluidic models for high-permeability sandstone in Bohai Bay Basin; employing microscopic parameters such as shape factor and Euler number, they quantitatively characterized five distinct residual oil types. Through CT-assisted displacement experiments coupled with seepage numerical simulation, Wang et al. [7] elucidated the pore structure characteristics of low-permeability sandstones and their impacts on fluid mobility and residual oil occurrence modes. The heterogeneity of the reservoir has a large impact on the macroscopic wave efficiency, and the degree of crude oil utilization in the area that has been waved is inseparable from the heterogeneity of the microscopic pore and throat structure, which involves the size of the pores and throats, distribution characteristics, pore and throat coordination number, and connectivity. Even a reservoir with a relatively homogeneous macroscopic performance will inevitably have a certain degree of microscopic heterogeneity. However, conventional research methods cannot characterize the effect of microscopic heterogeneity on the crude oil mobilization process. For example, the basic rock slice or glass etching model is ideal, but it cannot present the characteristics of crude oil mobilization and residual oil distribution in three-dimensional space. Conventional experiments on the heterogeneity of pore structures essentially remain at the level of qualitative comparison, unable to quantitatively describe the impact of the heterogeneity of microscopic pore-throat structures on the use of crude oil and the state of residual oil occurrence state and time–displacement characteristics.
The nuclear magnetic resonance (NMR) technique [9,10,11,12] utilizes NMR transverse relaxation time (T2) in relation to the pore throat structure to obtain the pore throat size distribution; it can acquire the size of the rock pores through the relaxation time conversion, and is able to obtain pores below 2mn. Wang et al. [10] quantitatively characterized the movable fluid distribution characteristics across pore-throat sizes in shales with varying pore structures through centrifugal experiments on movable fluids. Ning et al. [11] achieved the multi-scale characterization of microscopic pore structures by integrating scanning electron microscopy (SEM), CO2 adsorption, N2 adsorption, and high-pressure mercury intrusion (HPMI) experiments. Coupled with nuclear magnetic resonance (NMR) tests, they further analyzed pore connectivity and pore-size distribution.
The image analysis function of scanning electron microscopes using electronic signal imaging can quantitatively analyze the pore and throat types and characteristics, size, distribution, and coordination number, but it can only obtain two-dimensional images with poor spatial continuity. CT scanning digital core technology [13,14,15,16] using a CT imager can obtain planar images after three-dimensional reconstruction to create a digital core model [17,18,19,20,21,22,23,24,25,26], which can directly achieve the real three-dimensional skeleton and pore image of the core, with the advantages of non-destructive samples, intuitive images, and high accuracy. It can also directly obtain transverse slices of any position of the rock, which gives more information than the SEM method and is more intuitive and graphic than the mercury intrusion method. It can also make up for the shortcomings of the mercury intrusion experiment that cannot accurately measure small pores or dead pores, but the CT scanner method will filter out part of the large pore throats and retain most of the small pore throats due to the resolution of the instrument, so it is necessary to synthesize methods such as nuclear magnetic resonance to achieve a more accurate description of the pore-throat structure of the rock. Li et al. [13] established a pore network model through waterflooding scanning imaging experiments, calculating parameters such as pore-throat count and throat radius distribution, achieving quantitative characterization of microscopic pore-throat heterogeneity and oil phase migration patterns during displacement processes. Guo et al. [17] constructed a 3D digital core model of the reservoir based on micro-CT scanning technology, extracting connected pore structures and quantitatively characterizing microscopic pore structure features of core samples. Zhao et al. [24] developed a pore network model to investigate tight sandstone gas charging mechanisms at the microscopic scale through numerical simulation methods, analyzing gas–water occurrence characteristics during charging processes and identifying variations in gas-bearing properties under different geological conditions. Wang et al. [25] employed 3D micro-CT scanning and nanoscale electron microscopy imaging techniques to quantitatively characterize pore space distribution patterns in tight sandstone reservoirs. They established a dual-scale 3D pore structure model based on digital core analysis and determined tight sandstone seepage mechanisms using a coupled dual-scale pore flow simulation approach.
Therefore, this paper takes some cores from the Sai 160 block of the Changqing Oilfield as the research object, and identifies the oil–water occurrence state and time-shift characteristics during the waterflooding stages in the target block by combining electron microscope scanning, nuclear magnetic resonance (NMR), and digital core methods. The distribution characteristics of pores and throats are obtained by electron microscope scanning; the fluid distribution in the pores of the core is obtained by nuclear magnetic resonance (NMR); and the digital core is constructed by CT scanning to identify the microscopic residual oil distribution and occurrence state of the core at different stages of displacement. We also analyze the displacement effect according to the changes in oil and water distribution and occurrence state in the core.
2. Experimental Methods
2.1. Samples
The core samples were collected from the Sai 160 block of PetroChina Changqing Oilfield (Inner Mongolia, China). The main oil reservoir of the field belongs to a fine sandstone group, which includes medium-porosity low-permeability and extra-low-permeability reservoirs. The overall low-permeability reservoir is the main reservoir. Five representative rock samples of the experimental core were selected, as shown in Figure 1. After obtaining the experimental core, according to the core analysis method [27], the Boyle’s law method was used to determine the porosity, and the axial flow and core plunger steady state method was used to determine the permeability. The test results are shown in Table 1.
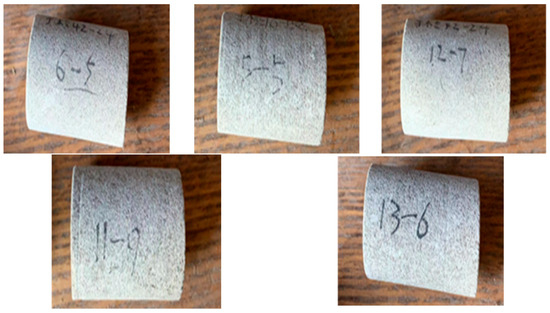
Figure 1.
Core samples.

Table 1.
Parameters of core samples.
2.2. Three-Dimensional Digital Core Construction
The CT scanning of core samples was conducted using the Xradia MicroXCT-400 high-resolution micro-CT system (Xradia Inc., Pleasanton, CA, USA), a specialized X-ray microtomography instrument widely applied in petroleum geology research for pore structure characterization. A 6 × 6 × 8 mm3 cylindrical sample was drilled in the core, and conical X-rays (2–3 μm) were used to penetrate the sample and magnify the image through different magnification objectives, and a three-dimensional stereo model was reconstructed from a large number of X-ray attenuated images (800 × 1200 × 1200 voxels) obtained from a 360-degree rotation. After obtaining the gray-level of the core, image filtering, segmentation, and geometrical topology were comprehensively applied. The pore space inside the scanned core was extracted and then the pore structure of the core was segmented by the online detection method, and the core pore network model was extracted according to the maximal-balls algorithm. On this basis, mathematical statistical methods were used to obtain the key parameters for characterizing the core micro-pore structure, Figure 2 presents the workflow diagram for constructing the pore network model.
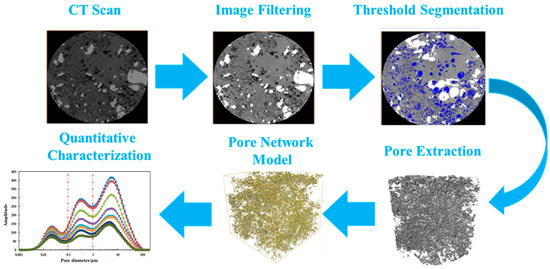
Figure 2.
Principle of digital core construction.
3. Characterization of Microscopic Pore Structure
Based on the results of saturated water core NMR tests, five cores, numbered 6-5, 5-5, 12-7, 11-9, and 13-6 in Sai 160 block, were selected for analysis by differentially comparing the NMR T2 spectral patterns of saturated water cores. The pore and throat distribution test results are shown in Figure 3, and the pore-throat connectivity analysis is shown in Figure 4. Combined with Table 2 analysis, the following conclusions can be drawn:
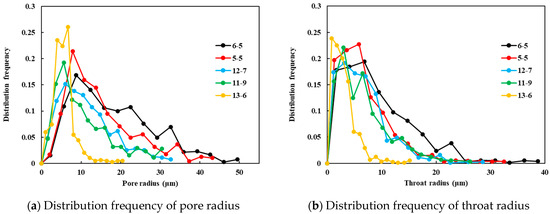
Figure 3.
Analysis results of pore and throat radius.

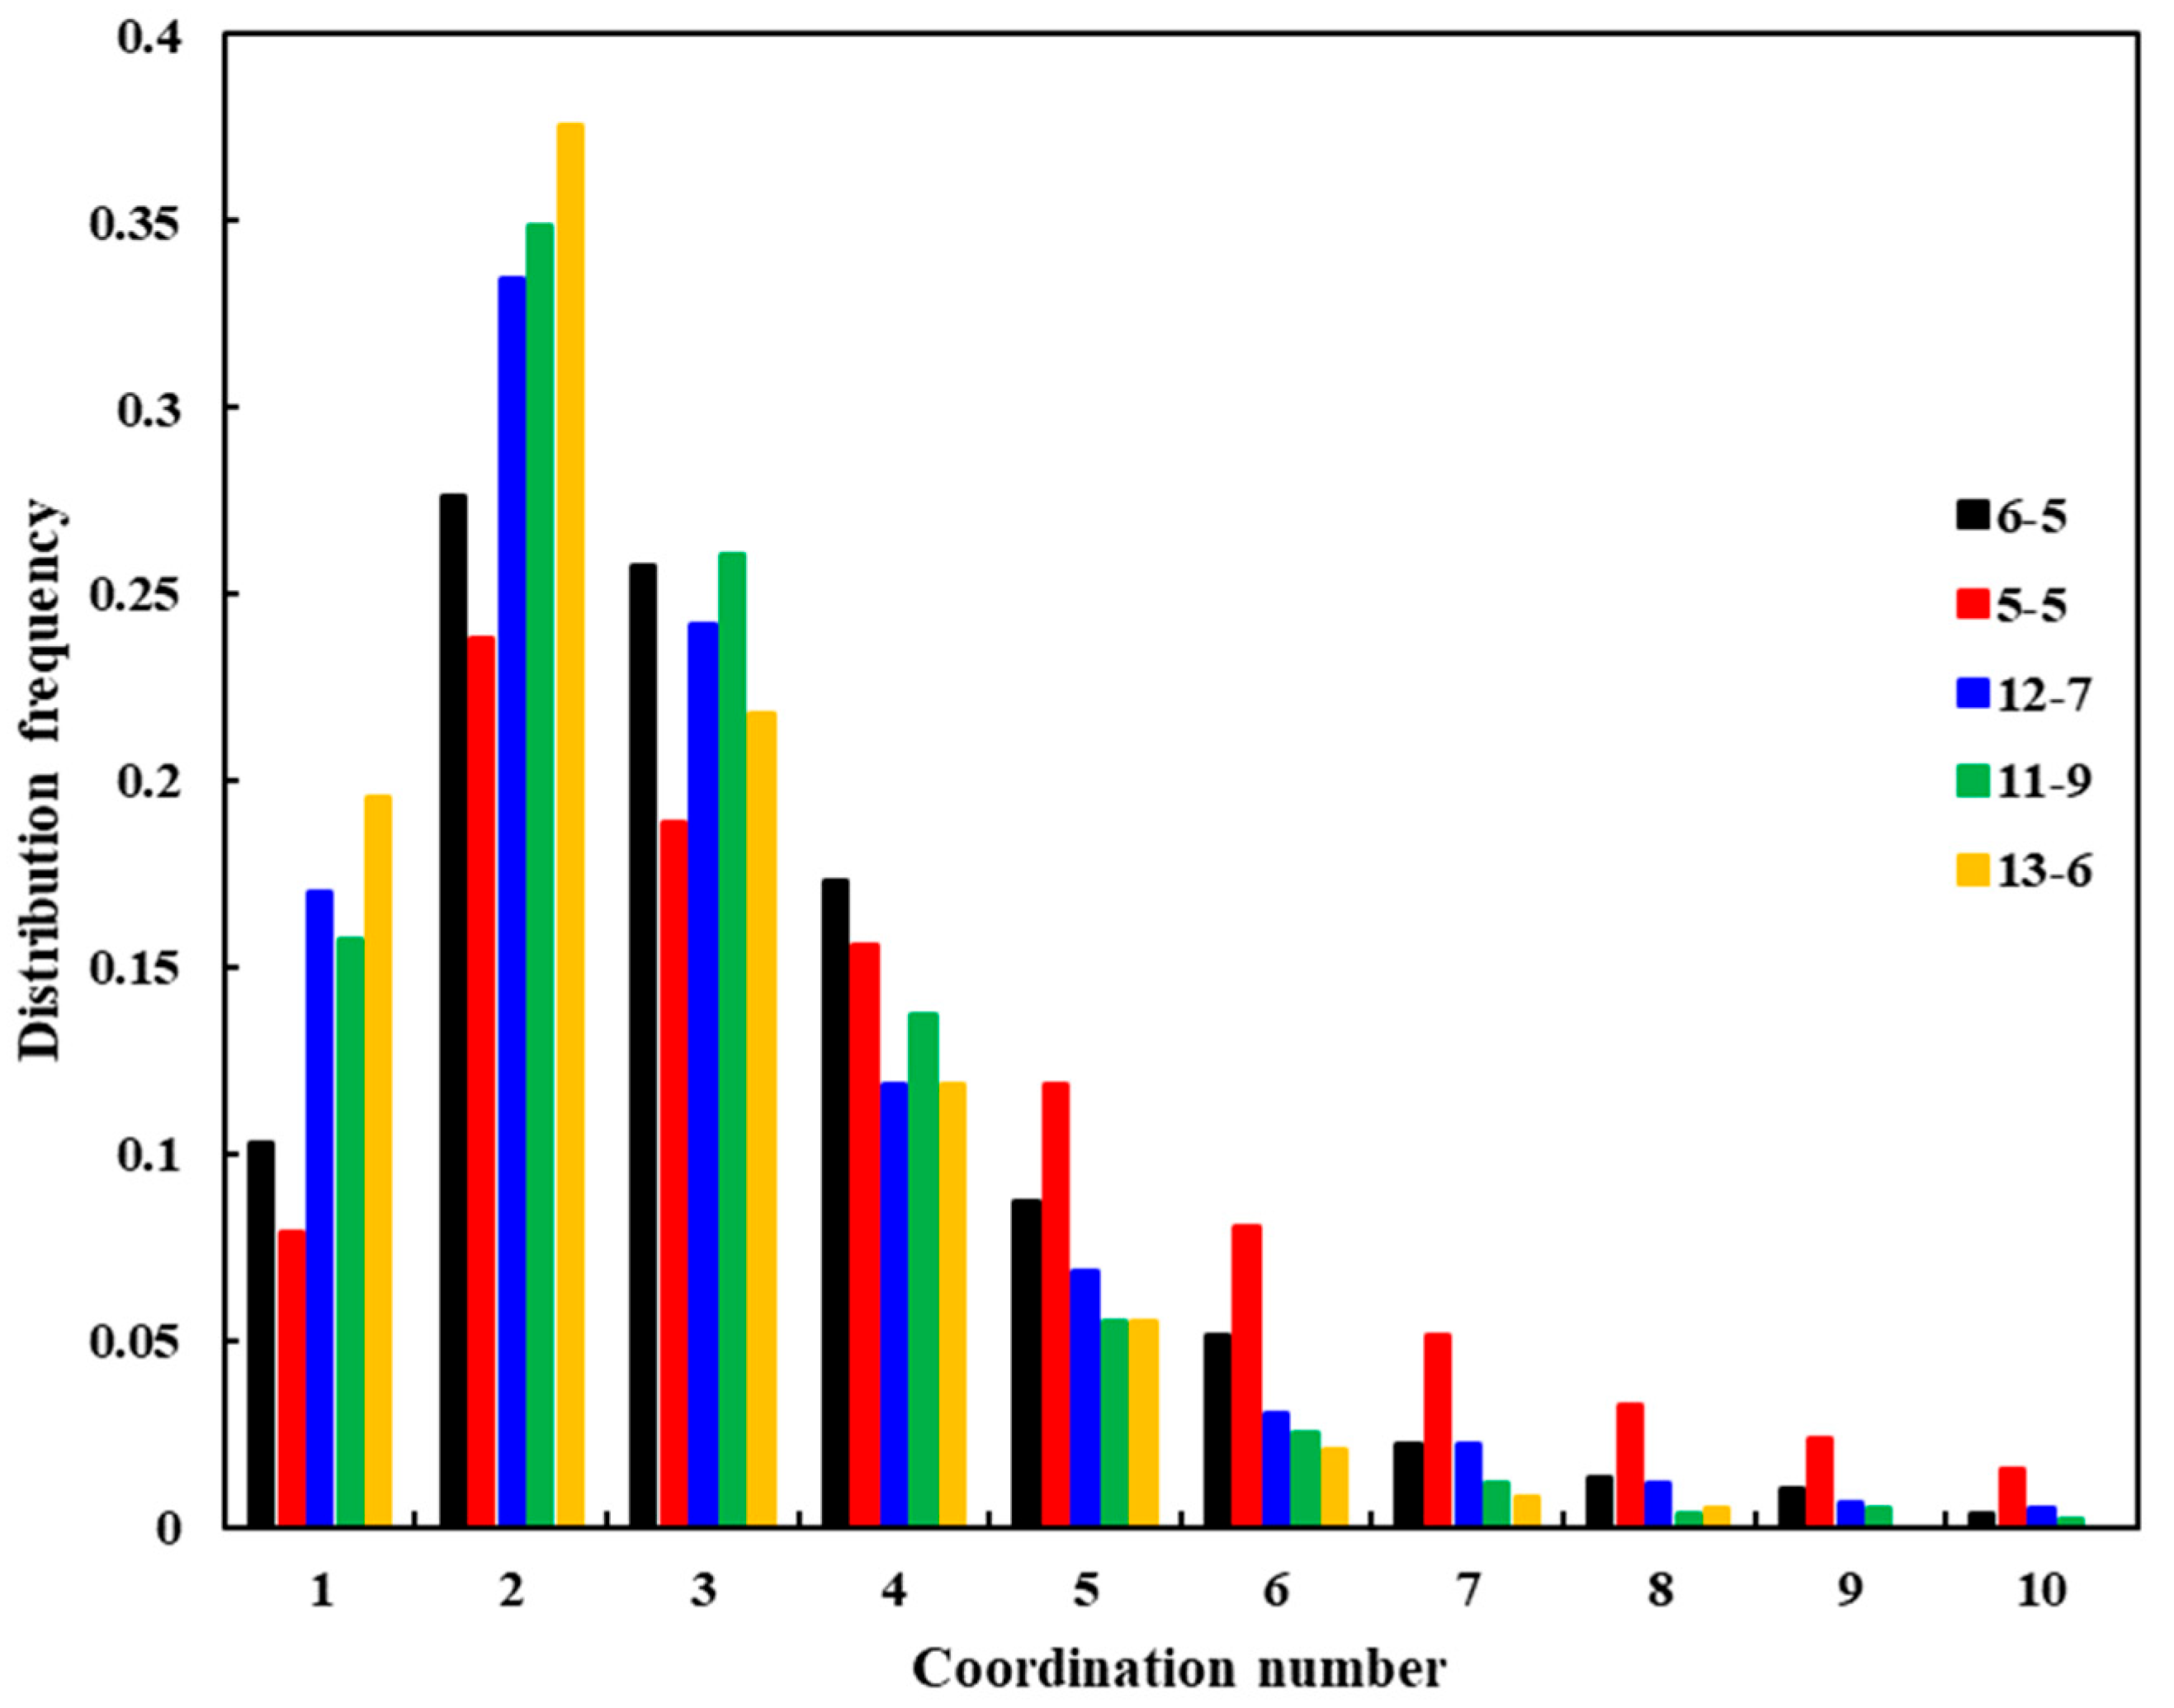
Figure 4.
Results of pore connectivity analysis.
Table 2.
Test results of core pore structure characteristics.
- (1)
- The physical properties of 6-5 and 5-5 are better: a wider range of coordination numbers, a higher radius of the mainstream pore throat, and the development of large-scale pore throats and more regular pore-throat shapes.
- (2)
- The physical properties of 12-7, 11-9, and 13-6 are poor: low coordination number, a small radius of mainstream pores, a small radius of throats, and high resistance to fluid transfer (viscous and capillary resistance).
- (3)
- By comparing and analyzing the test results of five cores, it can be seen that the larger the core pore throat radius is, the higher the core permeability is accordingly, reflecting that the size of the pore throat and connectivity are the main factors determining the permeability of the reservoir.
Pore–throat connectivity is an important part of the study of pore–throat structure, which is an important indicator of its potential permeability and recovery. Currently, the pore–throat connectivity is mainly quantitatively characterized by the coordination number, the network connectivity entropy, and the Biola schematic number. As shown in Figure 4, the connectivity of typical rock samples is characterized in this paper by the coordination number. The coordination number refers to the number of connected throats in each pore.
In this paper, the three-dimensional image information of the pore–throat structure of the core is obtained by CT scanning technology, and the optimal threshold is obtained based on the porosity of the reservoir core according to the selection of the range of the gray value, and the pore exclusion coordination number of the core is counted one by one using the Dragonfly 2022. The higher the coordination number, the better the pore connectivity, the more oil flow channels, and the better the reservoir properties. By analyzing the distribution of the coordination number, the topological properties of the rock can be effectively analyzed.
The probability distribution of the coordination number of the five core samples used in the experiment is shown in Figure 4. In general, the curve pattern is similar: the curve rises rapidly, reaches the highest peak, and then falls rapidly, and the peaks are all concentrated around 2–3; with the decrease in permeability and porosity, the pore structure tends to be complex, but the trend in the coordination number does not change significantly.
4. Microsimulation of Waterflooding
4.1. Experimental Program
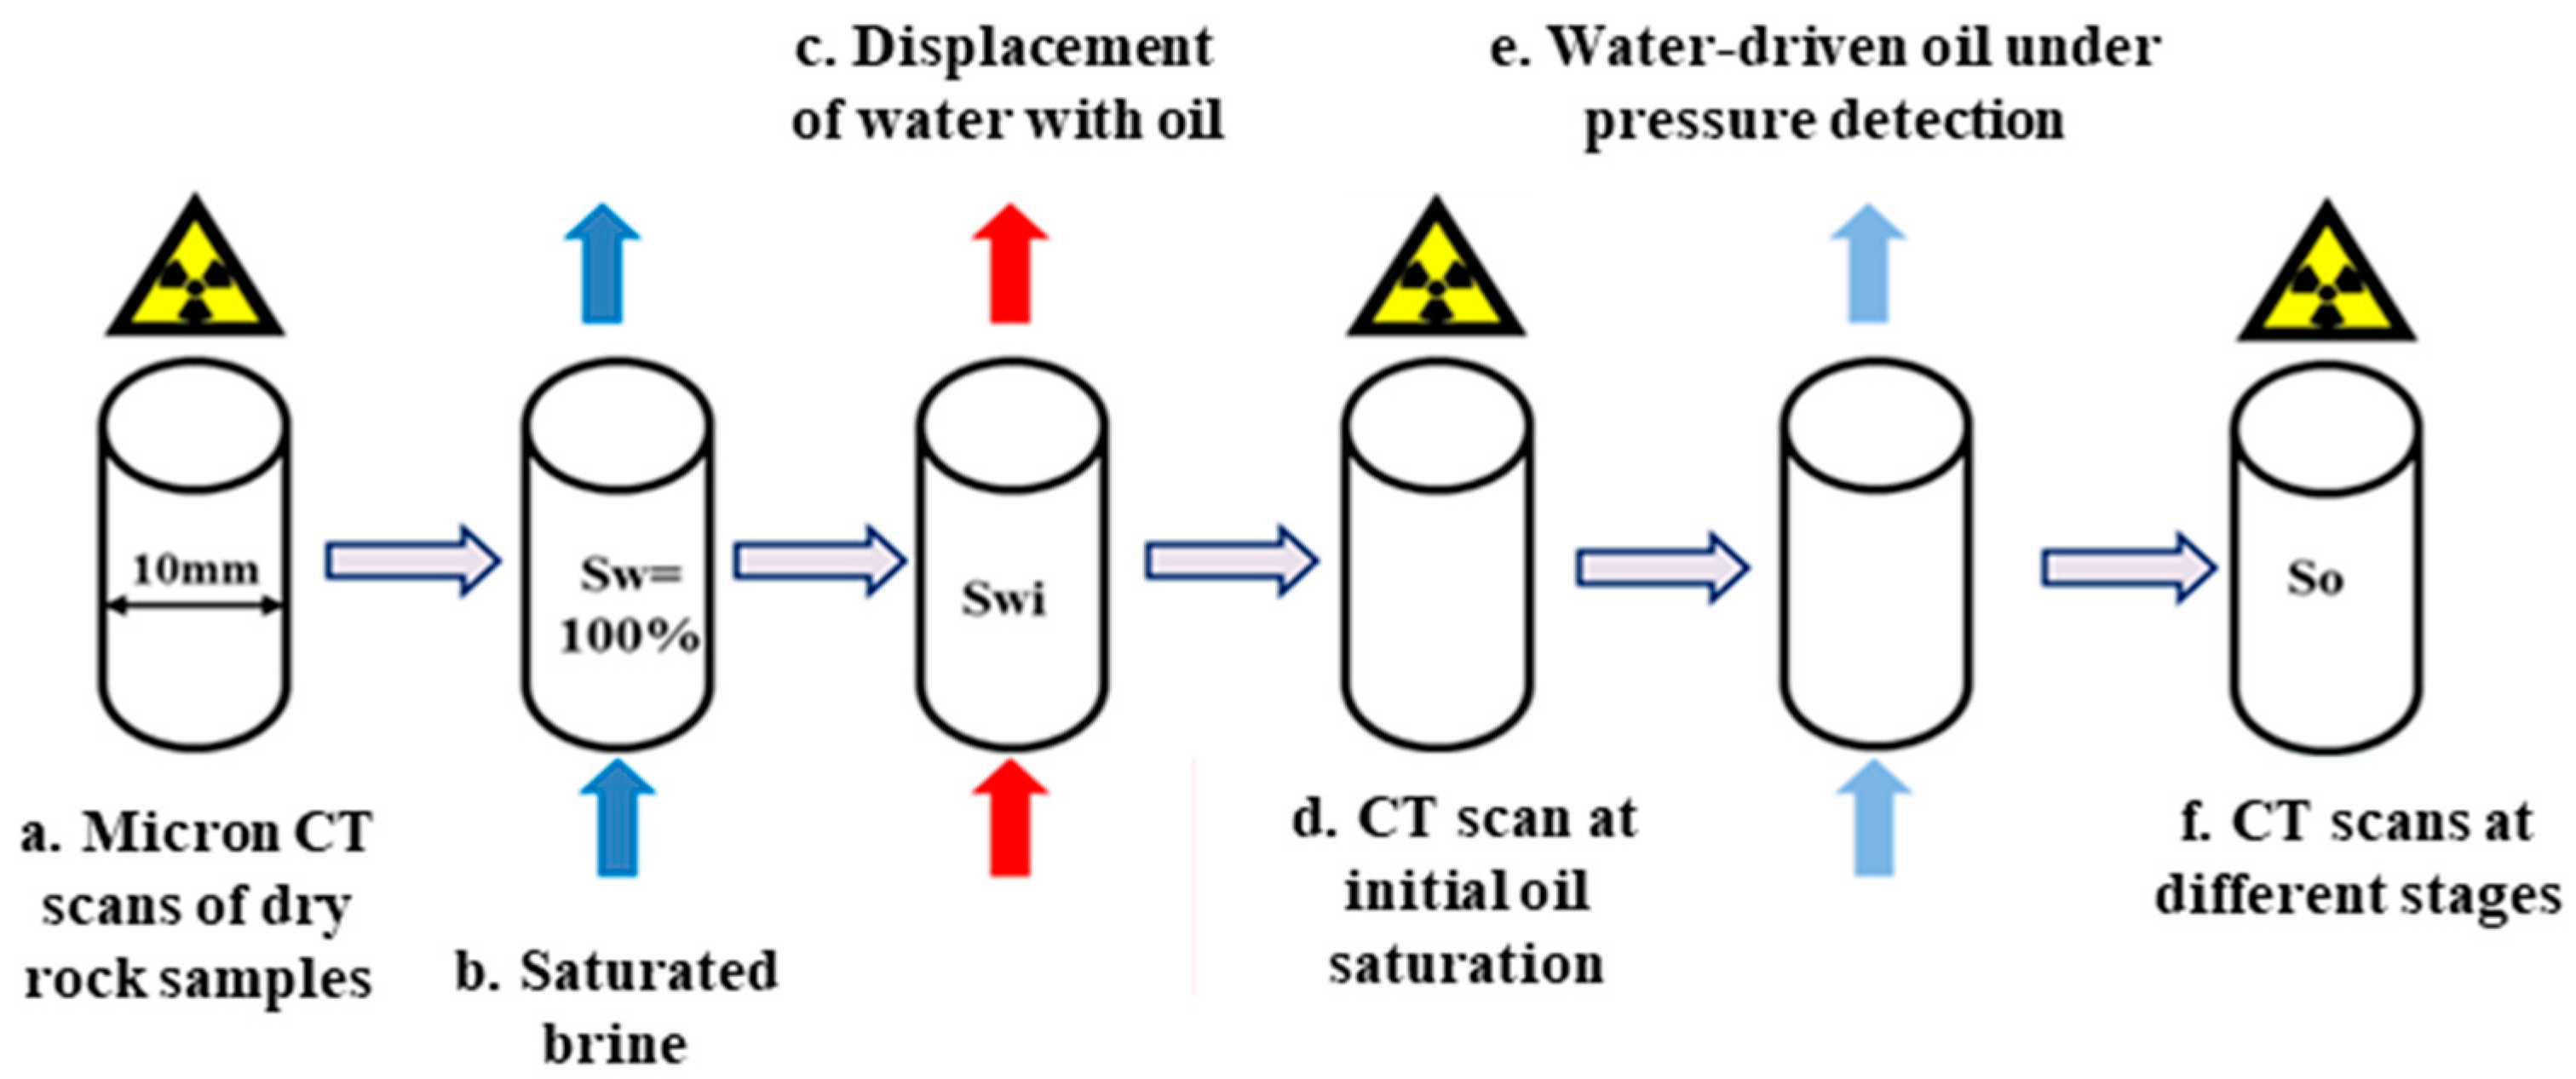
Based on the combination of microscopic multiphase flow substitution and micrometer CT scanning, experiments were carried out to observe the internal pore structure of the core without changing the external morphology and internal structure of the core; the saturated oil was used to study the characteristics of pore crude oil filling at different scales, and saturated cores were substituting with water/gas, respectively, under the condition of large PV, and at the same time, micrometer CT scanning was carried out to obtain the displacement law and the characteristics of the micro distribution in different reservoir spaces, and the residual oil occurrence state was quantitatively characterized. The specific experimental process is shown in Figure 5.
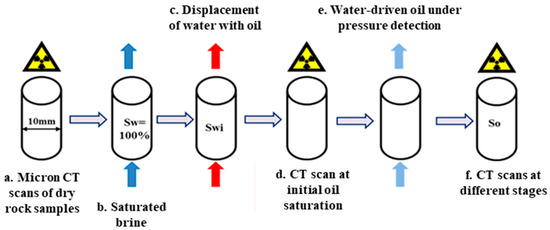
Figure 5.
Schematic diagram of micro displacement and CT scanning sequence.
During core saturation, given that the samples were extracted from low-porosity and low-permeability reservoirs, conventional waterflooding followed by the oil-flooding saturation method could no longer meet the experimental requirements. To systematically observe the occurrence states of residual oil at different waterflooding stages, this study employed the vacuum-pressure saturation method for the crude oil saturation of core samples, with oil saturation calculated using the gravimetric method.
The experimental pressure was 10 MPa, the temperature was room temperature, the resolution of CT scanning was 2–3 μm, and the diameter of the sample was 5-8 mm. Five cores, namely, 6-5, 5-5, 12-7, 11-9, and 13-6, were selected for the experiments, and the viscosity of the crude oil was 2.25 cp, the viscosity of the drive water was 1 cp, and the injection rate was 0.02 mL/min. The specific parameters are shown in Table 3.
Table 3.
Experimental parameters.
The design of the experimental program for water-driven oil + CT scanning of 5 sets of cores was as follows:
- Oil washing and drying of the cores and CT scanning of dry millimeter core subsamples;
- Low-speed injection of 100 PV brine to saturate the core with water;
- Oil displacement and CT scanning (irreducible water process and original oil distribution);
- Waterflooding and CT scanning at 1 PV, 5 PV, and 30 PV (dynamic waterflooding process and oil–water distribution).
4.2. Characteristics of Microscopic Residual Oil
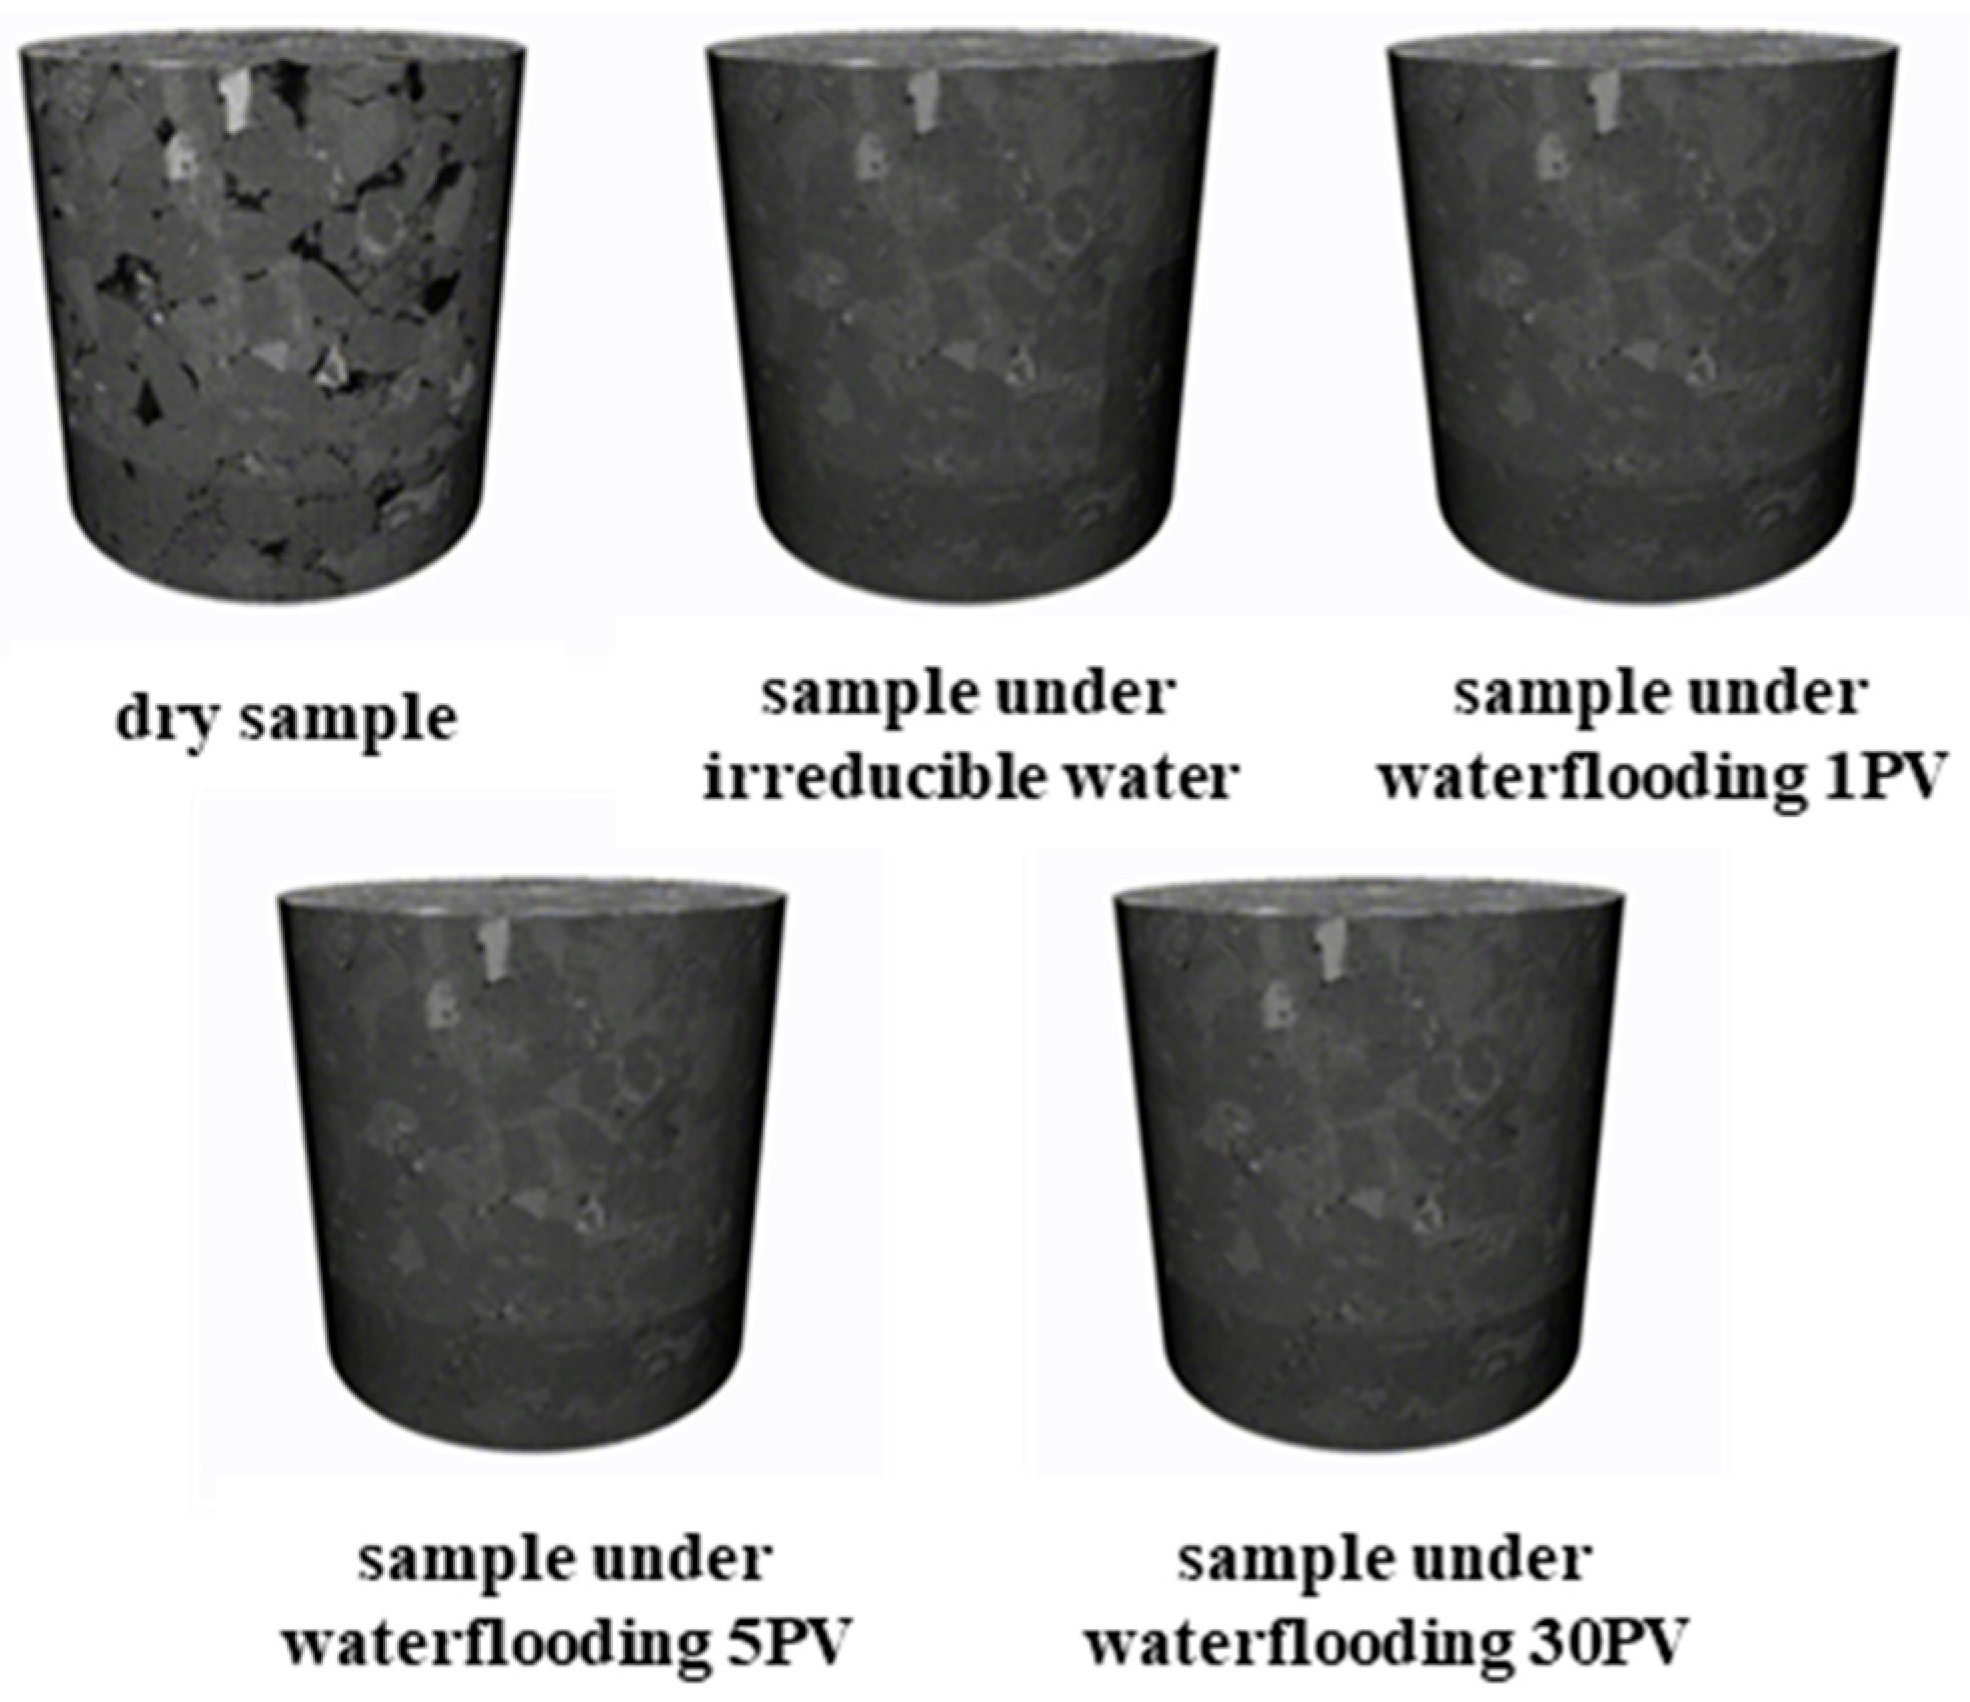
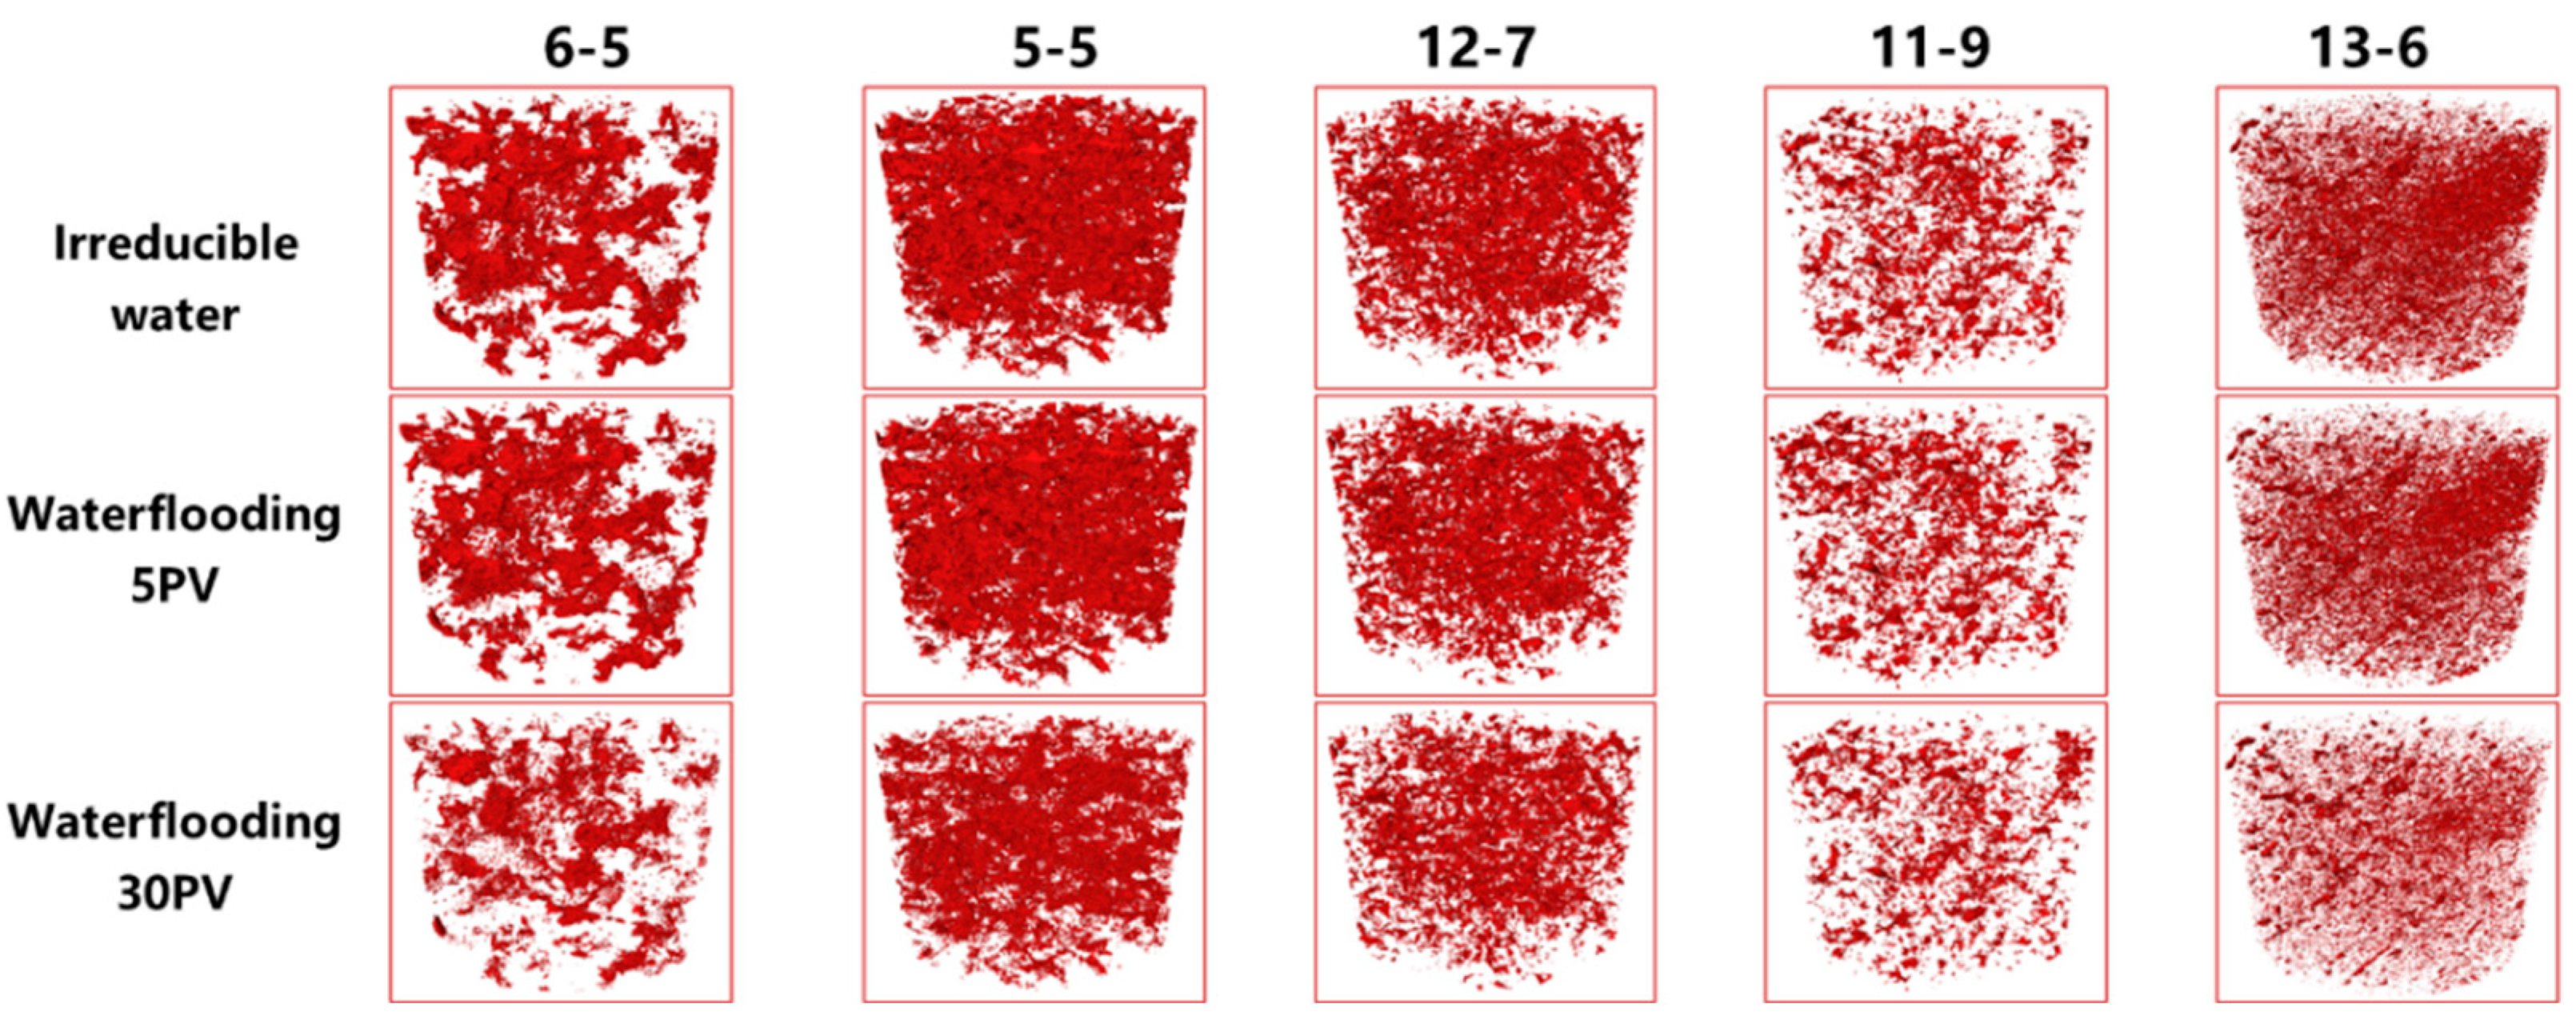
As shown in Figure 6, based on the constructed digital cores at different injection PV numbers, the matrix space and oil–water two-phase fugitive state within the pore space after the end of the drive were qualitatively characterized using the three-value segmentation method. The microscopic pore structure directly affected the fluid flow within the pore space, which in turn affected the distribution of microscopic residual oil. The processing results are shown in Figure 7 and Figure 8.
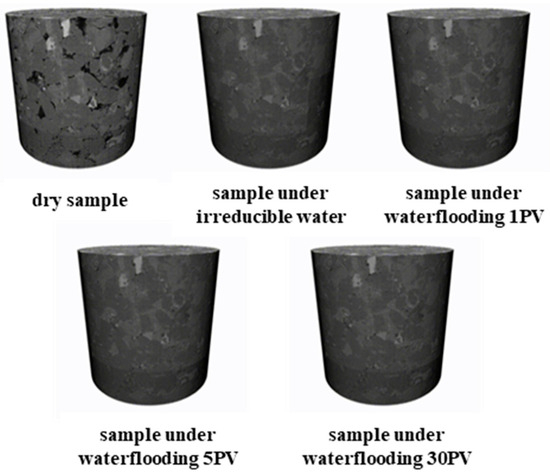
Figure 6.
Scanning results with different injection PV numbers.
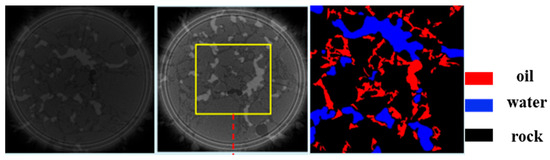
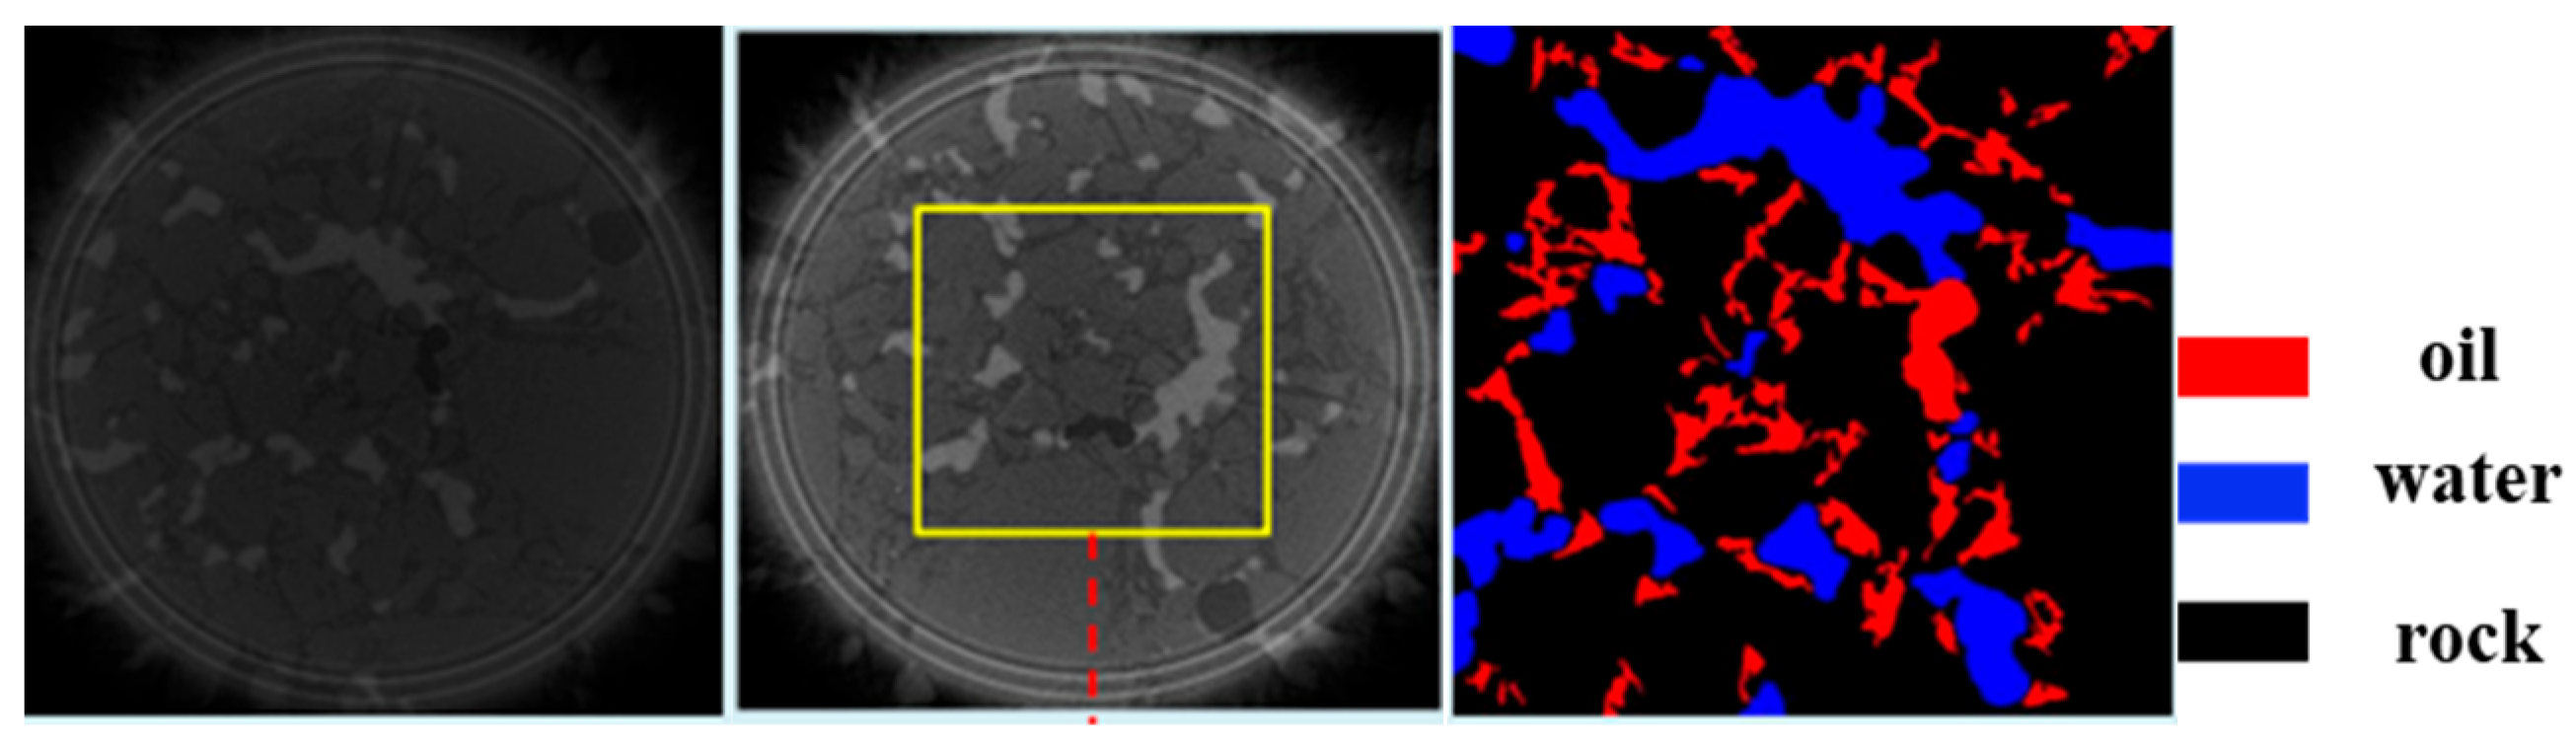
Figure 7.
Three-value segmentation—oil–water distribution.
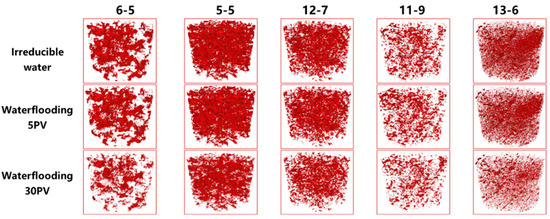
Figure 8.
Distribution of residual oil after waterflooding in different rock cores.
Figure 7 shows the color image with oil and water identification, segmentation, and labeling, where gray stands for the rock skeleton, and red and blue stand for the oil and water, respectively, and the location of oil and water and the contact relationship with the rock skeleton can be observed intuitively from this image. Through three-dimensional reconstruction software images with different Z-axis depth, color segmentation image superposition is used to reconstruct the three-dimensional model, and then the microscopic residual oil distribution information can be obtained.
The different stages of the water-driven micro-plunger core three-dimensional digital model are shown in Figure 8. With the continuous water drive, the oil phase is gradually dispersed from continuous distribution to decentralized distribution. In the early stage of the water drive, the oil saturation of the core decreased rapidly, and the degree of oil phase dispersion and distribution became more and more complicated with the continuous water drive, but the recovery rate showed a gradual decrease in the rate of increase; i.e., the effect of the water drive gradually weakened. By comparing the oil saturation and recovery of different core samples at different water drive stages, it can be seen that the physical characteristics and pore structure of the rock have an important influence on the efficiency of the water drive in the core.
Meanwhile, the residual oil morphology was quantitatively characterized based on the shape factor (describing the degree of pore–throat morphology on fluid flow), Euler number (describing the topological characteristics of the oil clusters), and the degree of overlap (describing the contact relationship of the remaining oil in the pores and throats). It was quantitatively classified into continuous phase and discontinuous phase, and the discontinuous phase was further classified into membrane, droplet, column, and porous; the classification results are shown in Table 4.
Table 4.
Remaining oil occurrence types.
Figure 9 illustrates the occurrence states of microscopic remaining oil at different displacement stages. As shown in the figure, during the early waterflooding stage, continuous-phase oil clusters and porous flow dominate the fluid distribution patterns, while discontinuous-phase remaining oil exhibits relatively low content. With the progression of waterflooding, continuous-phase remaining oil gradually transitions into discontinuous-phase forms. The proportions of columnar flow, film flow, and porous flow demonstrate significant increases.
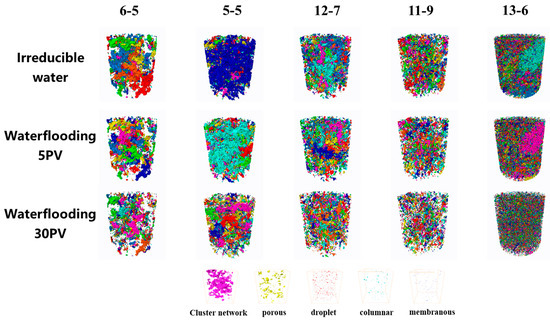
Figure 9.
Distribution characteristics of residual oil of different types at different waterflooding stages.
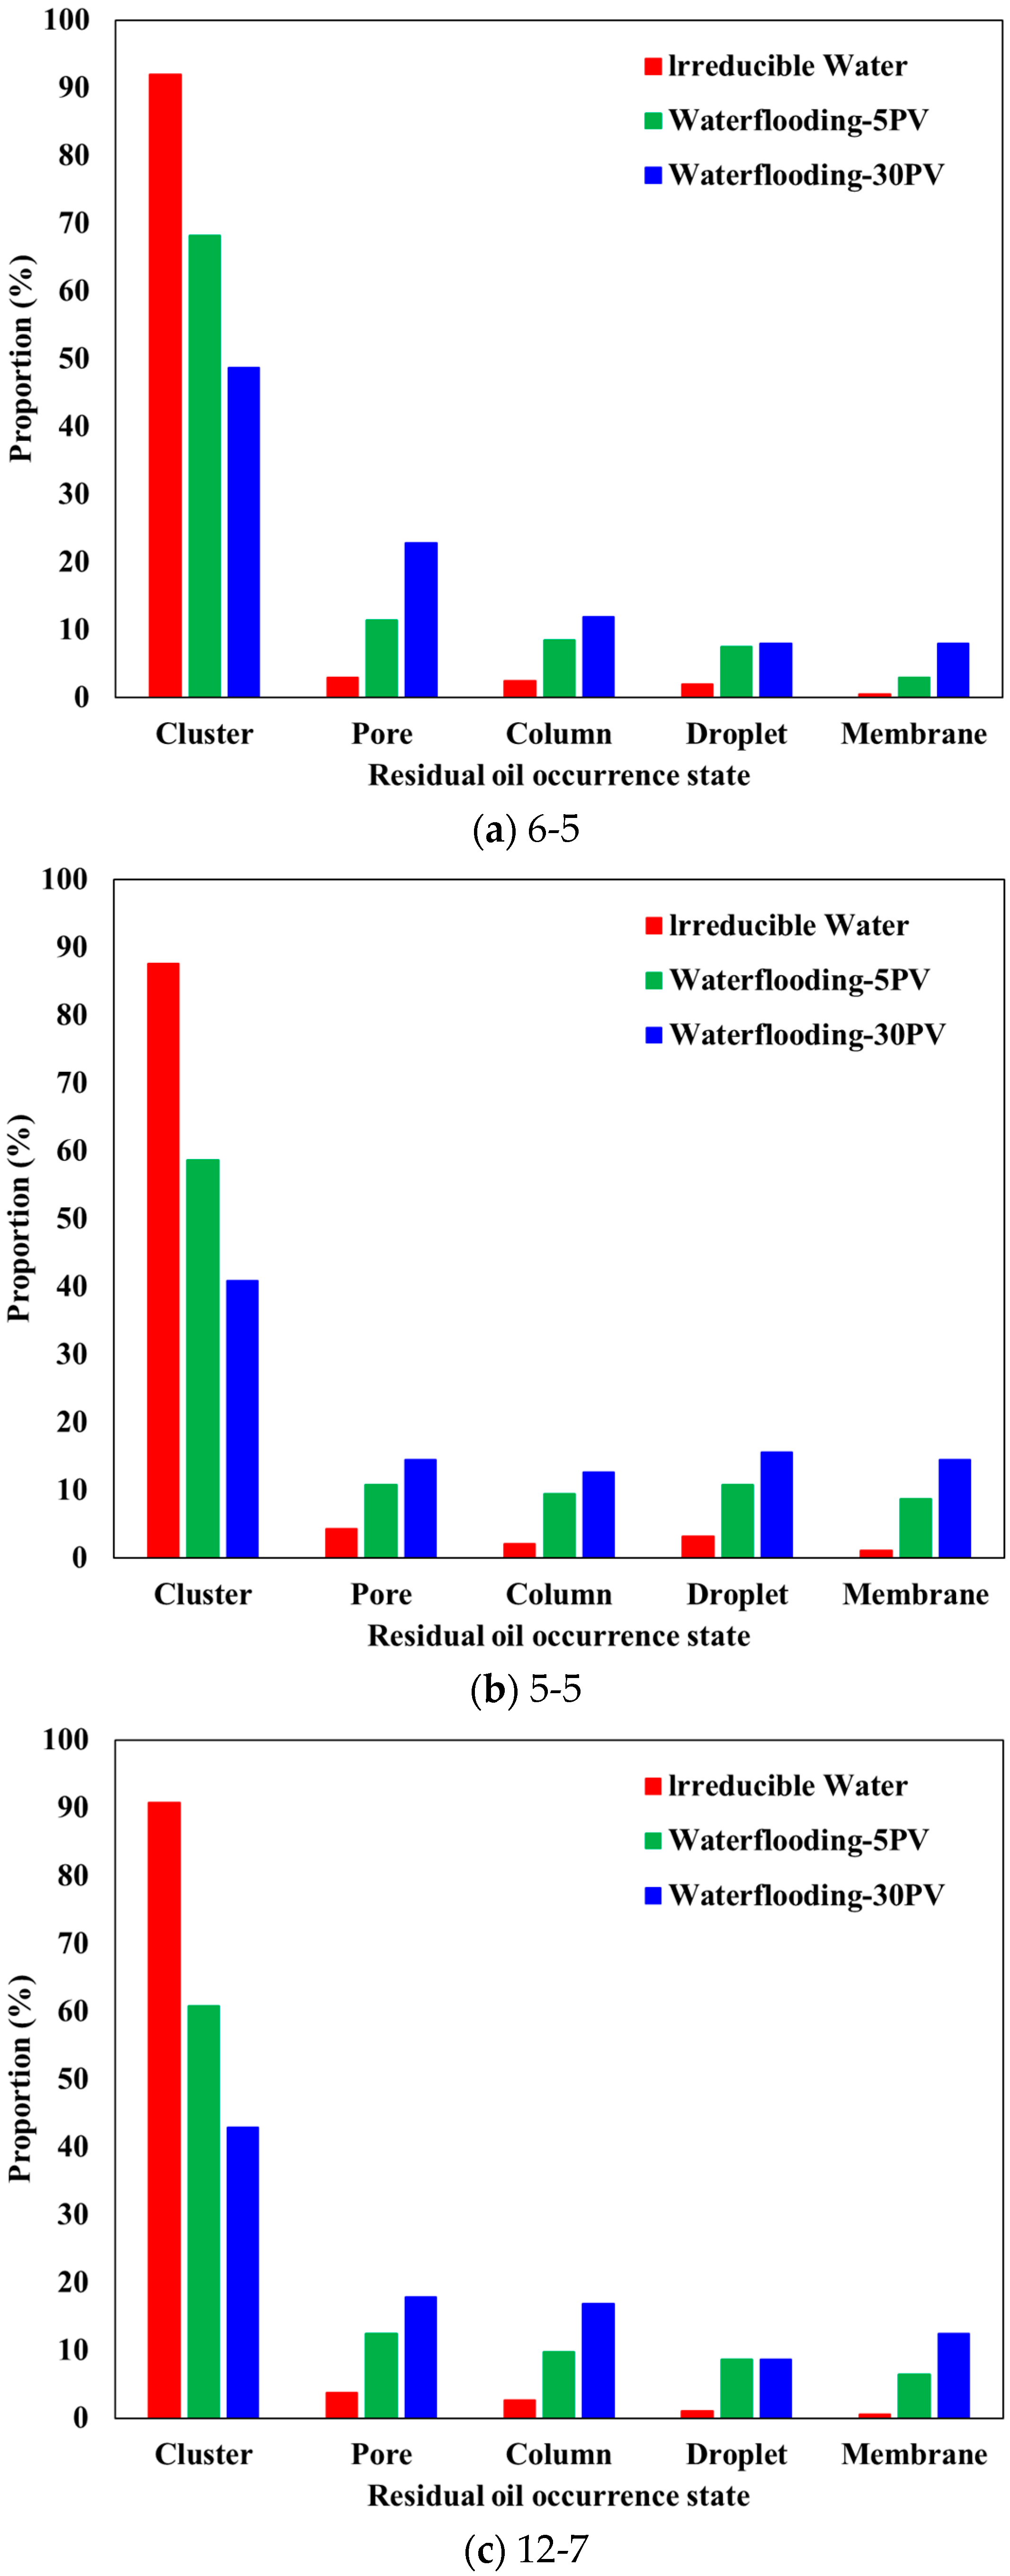
As can be obtained from Figure 3, Figure 10 and Figure 11, and Table 2, according to the results of different types of core displacement, the distribution ratio of different types of microscopic residual oils after waterflooding was quantitatively analyzed, the replacement efficiency in different types of reservoirs was obtained, and the main controlling factors were analyzed.
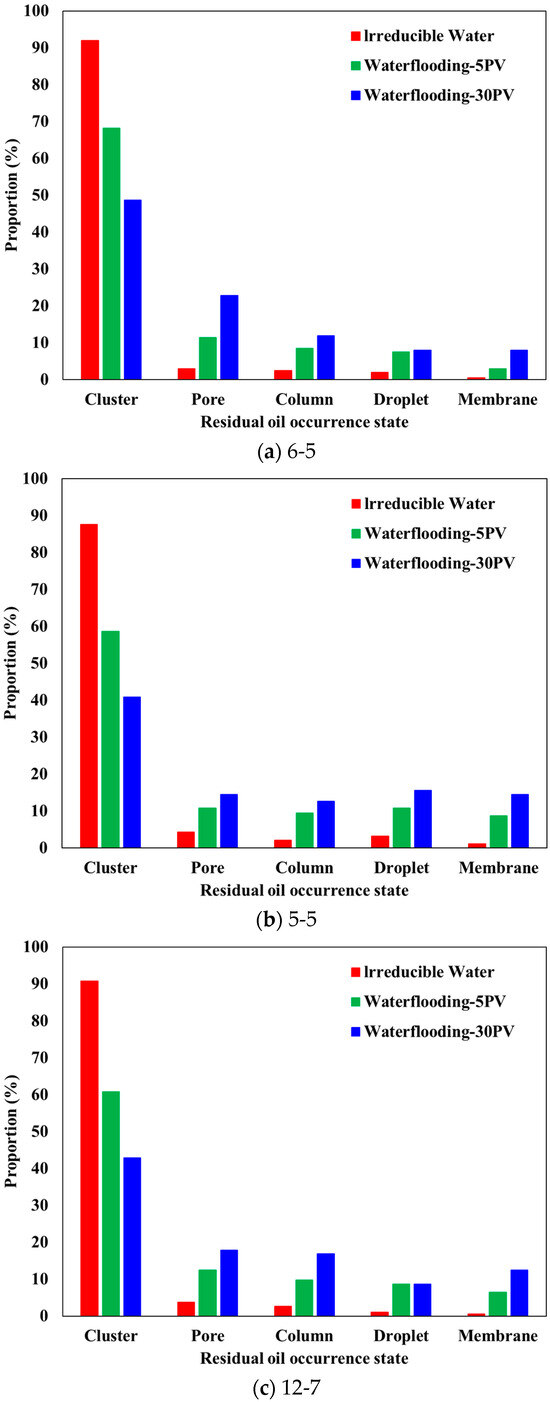
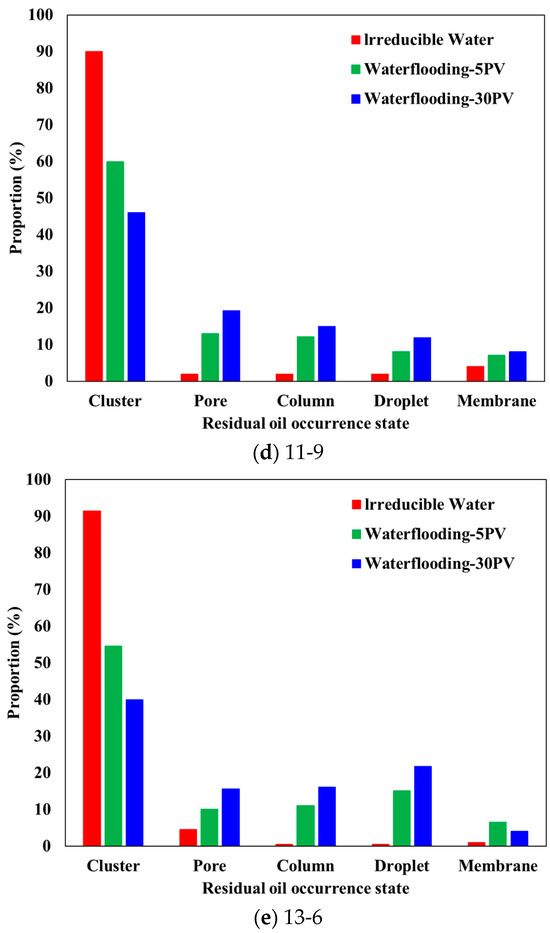
Figure 10.
Proportion of different types of residual oil at different stages of displacement.
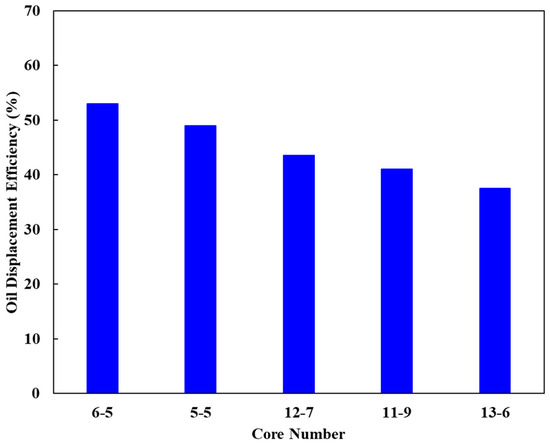
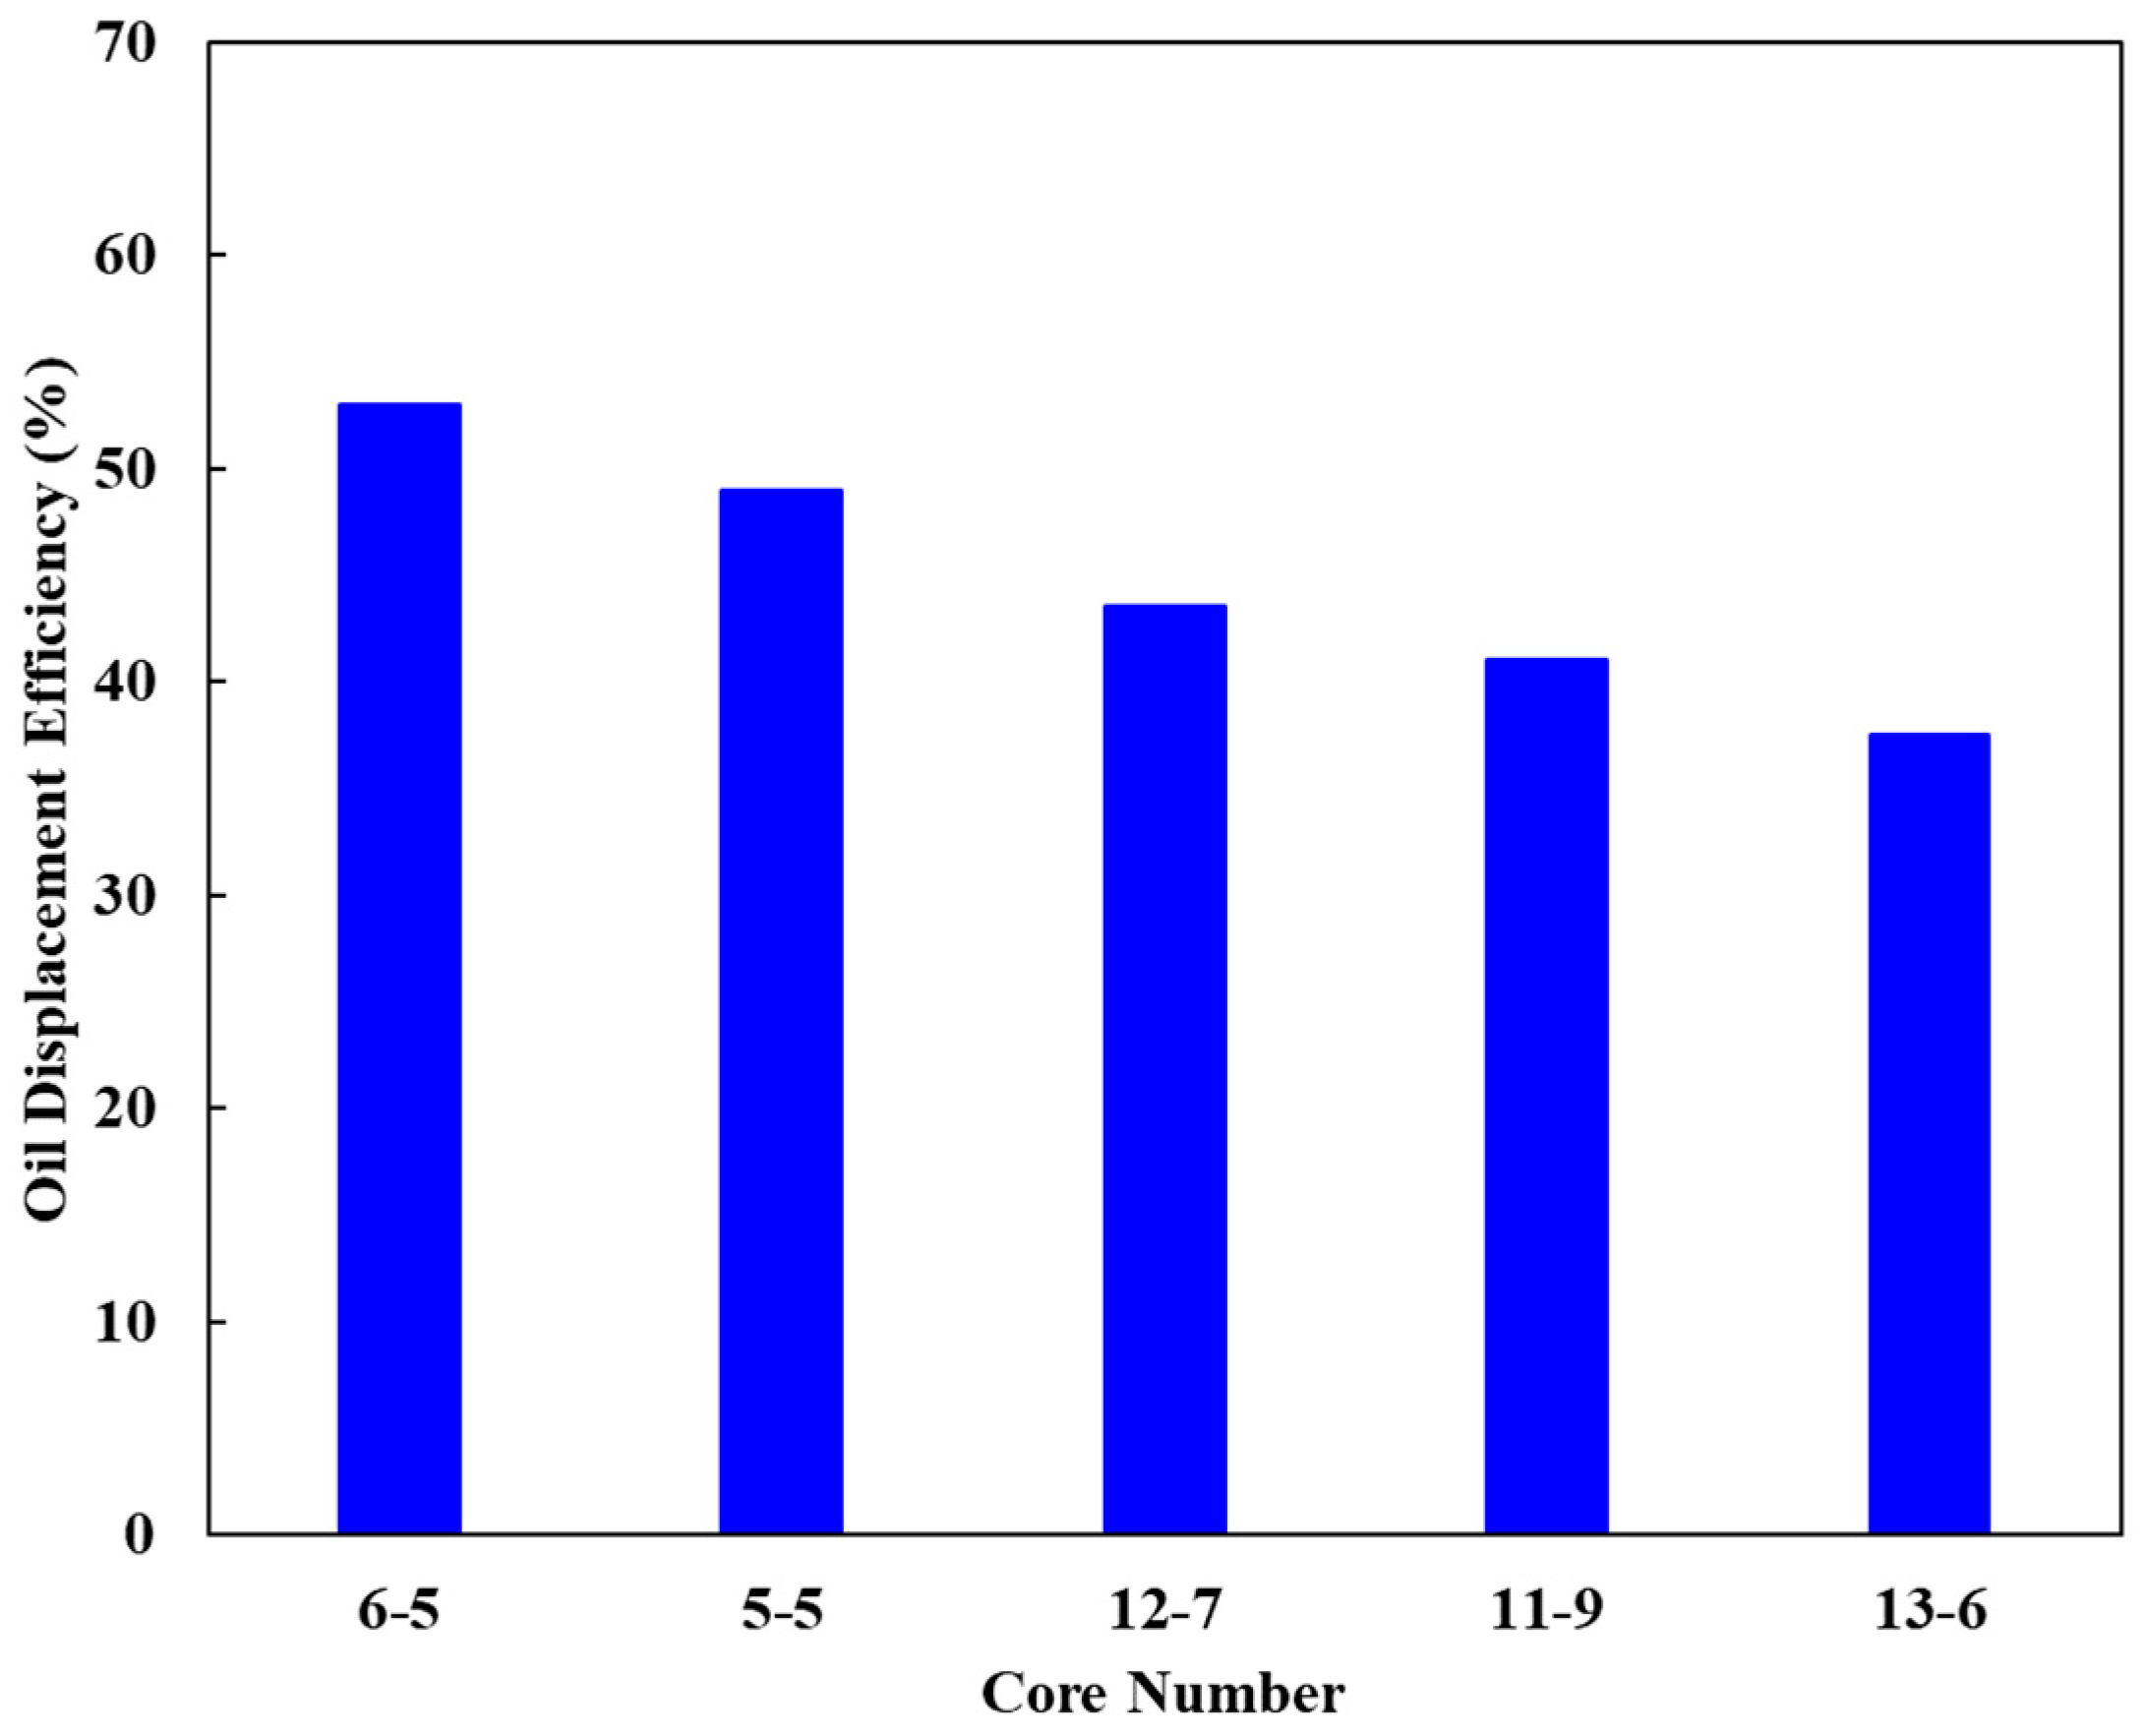
Figure 11.
Oil displacement efficiency of different rock samples.
- (1)
- After the large PV waterflooding, the oil displacement efficiency of different cores was as follows: 6-5 > 5-5 > 12-7 > 11-9 > 13-6; under the same level of pore–throat scale, the effect of large PV waterflooding was single-peak type > multiple-peak type: 6-5 > 5-5/12-7 > 11-9; under the same level of degree of non-homogeneity, the effect of large PV waterflooding was large pore throats > small pore throats: 6-5 > 5-5/11-9 > 13-6. There was more multi-peaked clustered/porous residual oil than single-peaked, and the proportion of continuous-state clustered residual oil gradually decreased and the total proportion of discontinuous-state residual oil gradually increased as the drive proceeded; the non-homogeneity was not conducive to the maintenance of the wave volume.
- (2)
- The remaining oil transformed from a continuous phase (clusters) to a discontinuous phase (porous, drops, columns, ad membranes) under the washout of the large PV drive medium. Before 5 PV, the proportion of clustered residual oil increased, a certain thickness of oil film existed between the oil phases as a flow channel, and the oil phase continuity was good. That is, the decrease in oil phase continuity was the main factor leading to the decrease in oil phase permeability.
- (3)
- The evolution law of the proportion of residual oil type can indicate that the large PV waterflooding could effectively expand the wave volume, but the local oil drive efficiency decreased. Columnar, droplet, and membrane shapes depended on core local connectivity, local wettability, and local pore-throat shapes, respectively; the percentage of residual oil after hydrodynamics indicated that the worse the physical properties, the lower the local efficiency of hydrodynamics (discontinuous oil phases were the most abundant).
- (4)
- During long-term waterflooding, the clustered flow remained the most widely distributed type. As the cumulative displacement intensity continued to increase, the clustered residual oil in large pore throats was displaced and became more enriched in smaller pores, i.e., distributed in pores with smaller coordination numbers. The coordination number and pore–throat ratio had little influence on this process. For the four types of discontinuous residual oil, as the cumulative displacement intensity increased, more clustered oil transitioned into the discontinuous type. The pore radius and coordination number associated with these discontinuous types also increased, and they predominantly existed in the main high-permeability waterflooding paths.
- (5)
- During the initial oil saturation stage, the oil phase primarily existed as continuous clusters (accounting for approximately 90% saturation), which represented the main recoverable potential where conventional waterflooding remained effective. In the early waterflooding stage, the oil phase transitions from continuous to discontinuous distribution, forming isolated clusters through stripping and fingering effects in un-swept or weakly swept zones, where enhanced injection intensity is recommended along with potential viscosity modifiers or structured polymers to improve displacement efficiency. During mid-stage waterflooding, discontinuous oil (including isolated clusters and columns) gradually increases, making surfactant injection viable to reduce interfacial tension and mobilize residual oil, while viscoelastic polymer solutions can enhance microscopic displacement through improved viscosity and elasticity. In late-stage waterflooding, advanced EOR methods should be implemented: polymer microspheres for throat plugging and viscosity enhancement, combined with wettability alteration techniques such as clay-surface organic dissolution, multi-ion exchange, and low-salinity water injection, to improve hydrophilic capacity and overall recovery efficiency.
5. Conclusions
- (1)
- The combination of digital core technology and two-phase microscopic seepage simulation can reproduce the microscopic replacement process under the real pore structure of reservoir core, which is of great significance for clarifying the mechanism of residual oil formation in waterflooding reservoirs as well as the effective utilization of residual oil.
- (2)
- Large PV waterflooding can effectively expand the wave volume, but the local oil drive efficiency decreases, the non-homogeneity is not conducive to maintaining the wave volume, and the local connectivity, local wettability, and local pore-throat shape of the core determine the characteristics of the residual oil storage after the drive.
- (3)
- The remaining oil in the reservoir core of the study area mainly consists of membrane residual oil, droplet residual oil, columnar residual oil, and porous residual oil. Before displacement, the microscopic residual oil is mainly in the form of continuous clusters, porous and dispersed large blocks, and columns; after displacement, the microscopic residual oil is mainly in the form of dispersed drops, membranes, smaller blocks, and columns. The occurrence state of continuous clustered residual oil is most significantly influenced by pore radius, whereas the distribution of the four discrete types of residual oil exhibits broader ranges of pore radius, throat-to-pore ratio, and coordination number, with their flow dynamics being less affected by heterogeneity.
- (4)
- During the medium–low water cut stage, the oil primarily exists as continuous clusters within pore spaces. At this stage, conventional waterflooding methods remain predominant. With the increasing presence of discontinuous residual oil (e.g., porous-type and columnar-type), the viscosity enhancement of the displacing phase or the addition of novel structured polymers/surfactants should be considered. In the late-stage waterflooding phase, recoverable residual oil mainly occurs as cluster-type, film-type, and minor isolated-cluster-types, where nano-scale polymer microsphere flooding may be employed as an effective EOR method.
Author Contributions
Investigation, J.W. and Y.Z.; project administration, Y.S. and T.X.; writing—original draft, B.L. and Y.S.; writing—review and editing, C.G., J.J. and Y.Z. All authors have read and agreed to the published version of the manuscript.
Funding
This research was funded by the National Science and Technology Major Project of China, grant number 2017ZX05009004-005, and the National Natural Science Foundation of China, grant numbers 52074322 and U1762210.
Data Availability Statement
The raw data supporting the conclusions of this article will be made available by the authors on request.
Conflicts of Interest
Authors Yangnan Shangguan, Chunning Gao, Junhong Jia, Yongqiang Zhang and Jinghua Wang were employed by Changqing Oilfield Company, PetroChina. The remaining authors declare that the research was conducted in the absence of any commercial or financial relationships that could be construed as a potential conflict of interest.
Abbreviations
| Parameter | Meaning |
| NMR | Nuclear magnetic resonance spectroscopy |
| CT | Computed tomography |
| PV | Pore volume multiplier |
| T2 | T2 spectrum, transverse relaxation time |
| SEM | Scanning electron microscopy |
References
- Zhou, L. Quantitative characterization technology and application of dominant injection-production direction in low-permeability sandstone reservoirs. Spec. Oil Gas Reserv. 2021, 28, 98–104. [Google Scholar] [CrossRef]
- Wang, L.; Xia, H.; Han, P.; Cao, R.; Sun, X.; Zhang, S. Microscopic characteristics of remaining oil distribution and quantitative characterization of its producibility. Lithol. Reserv. 2021, 33, 147–154. [Google Scholar] [CrossRef]
- Zhang, T. Residual Oil Micro-Distribution and Flow Characterization Based on CT Imaging Technology. Master’s Thesis, Southwest Petroleum University, Chengdu, China, 2017. [Google Scholar]
- Guo, C. Distribution characteristics of remaining oil after heterogeneous combination flooding based on sealed cored well: A case study in Zhongyi area Ng3, Gudao Oilfield. Pet. Geol. Recovery Effic. 2022, 29, 111–117. [Google Scholar] [CrossRef]
- Sun, P.; Cai, H.; Chen, X.; Yang, Z.; Yao, J. Oil-Water Occurrence Law in Typical High-Permeability Sandstone Reservoirs in the Bohai Sea Based on Microfluidic Modeling. Spec. Oil Gas Reserv. 2023, 30, 120–127. [Google Scholar] [CrossRef]
- Liu, Y.; Xia, H.; Zhang, S.; Wu, J.; Jiang, L.; Yang, K.; Li, K. Quantitative characterization of micro residual oil after polymer flooding based on digital pore model. J. China Univ. Pet. (Ed. Nat. Sci.) 2023, 47, 111–120. [Google Scholar] [CrossRef]
- Wang, Y.; Ge, L.; Lu, Y.; Song, H.; Zhang, Y. Study on fluid mobility and occurrence characteristics of remaining oil in low-permeability sandstone reservoirs based on nuclear magnetic resonance displacement experiments. Pet. Geol. Recovery Effic. 2023, 30, 22–31. [Google Scholar] [CrossRef]
- Yang, T.; Zhong, H.; Xia, H.; Zhao, X. Mechanism of residual oil mobilization after water flooding based on microscopic flow characteristics. Reserv. Eval. Dev. 2020, 10, 46–52. [Google Scholar] [CrossRef]
- Gao, H.; Sun, W.; Tian, Y.; Ren, G.; Lu, Y. Application of NMR technique in evaluation of micro-pore structure in extra-low permeability sandstone. Prog. Geophys. 2011, 26, 294–299. [Google Scholar] [CrossRef]
- Wang, J.; Cui, P.; Liu, S.; Shi, B.; Dang, H. Distribution Characteristics of Movable Fluid in Shale Oil Reservoirs with Different Pore Structures. J. Xi’an Shiyou Univ. (Nat. Sci. Ed.) 2023, 38, 59–68. [Google Scholar] [CrossRef]
- Ning, B.; Ren, D.; Wang, H.; Zhang, H.; Guo, J.; Fu, N.; Li, J.; Li, T.; Li, Q. Multi-scale combination characterization of micropore structure of tight sandstone gas reservoirs. Fault-Block Oil Gas Field 2024, 31, 34–41. [Google Scholar] [CrossRef]
- Wang, C.; Wang, F.; Liu, Z.; Jiao, L.; Zhao, J.; Yang, K. Pore structure characterization of tight oil reservoirs with fractal theory. In Proceedings of the International Field Exploration and Development Conference (IFEDC), Beijing, China, 11–12 August 2016. [Google Scholar]
- Li, J.; Liu, Y.; Gao, Y.; Cheng, B.; Meng, F.; XU, H. Effects of microscopic pore structure heterogeneity on the distribution and morphology of remaining oil. Pet. Explor. Dev. 2018, 45, 1043–1052. [Google Scholar] [CrossRef]
- Hou, J.; Qiu, M.; Lu, N.; Qv, Y.; Li, F.; Meng, X.; Shi, X. Characterization of residual oil micro distribution at pore scale using computerized tomography. Acta Pet. Sin. 2014, 35, 319–325. [Google Scholar]
- Liu, G.; Wang, L.; Sun, Z.; Wang, J.; Jiang, F. Research progress of pore-throat structure in tight sandstone formation. Pet. Sci. Bull. 2022, 7, 406–419. [Google Scholar] [CrossRef]
- Lin, C.; Wu, Y.; Ren, L.; Wang, Y.; Yan, W.; Sun, X.; Zhang, X.; Zhang, Y. Review of digital core modeling methods. Prog. Geophys. 2018, 33, 679–689. [Google Scholar] [CrossRef]
- Guo, Y.; Zhang, L.; Zhu, G.; Yao, J.; Sun, H.; Song, W.; YANG, Y.; Zhao, J. A pore-scale investigation of residual oil distributions and enhanced oil recovery methods. Energies 2019, 12, 3732. [Google Scholar] [CrossRef]
- Wei, B. Application of Digital Core Technology to Simulate High Temperature and High-Pressure Gas-Water Seepage. Master’s Thesis, Southwest Petroleum University, Chengdu, China, 2017. [Google Scholar]
- Gao, Y.; Jiang, H.; Wang, S.; Li, J.; Liu, C.; Chang, Y.; Wang, Y. Simulation analysis of microscopic water-oil displacement based on Level set method. China Offshore Oil Gas 2016, 28, 59–65. [Google Scholar] [CrossRef]
- Liao, Q. Digital Core Reconstruction and Seepage Simulation of Dense Sandstone. Master’s Thesis, China University of Geosciences (Beijing), Beijing, China, 2020. [Google Scholar]
- Zhu, Z. Remaining oil distribution patterns of metamorphic buried-hill fractured reservoir based on digital core technology. Spec. Oil Gas Reserv. 2019, 26, 148–152.157. [Google Scholar] [CrossRef]
- Guo, J.; Wang, D.; Wang, P.; Xiong, R.; Wang, H.; Wang, S. Pore Structure of Low-permeability Reservoir and Distribution Characteristics of Remaining Oil after Water Flooding Based on Digital Core. Spec. Oil Gas Reserv. 2023, 30, 101–108. [Google Scholar] [CrossRef]
- Nie, X.; Hu, J.; Wan, Y.; Zhang, C.; Zhang, Z. Reconstruction of 3D digital core model of carbonate rock based on Markov chain -Monte Carlo method. J. Yangtze Univ. (Nat. Sci. Ed.) 2021, 18, 28–35. [Google Scholar] [CrossRef]
- Zhao, W.; Wu, K.; Jiang, L.; He, M.; Li, X.; Jia, C. Charging and microscopic gas-water occurrence characteristics of tight sandstone gas based on pore network model. Nat. Gas Ind. 2022, 42, 69–79. [Google Scholar] [CrossRef]
- Wang, X.; Xun, J.; Peng, X.; Zhang, C.; Yuan, W.; Wang, Y. Flow mechanism and pore structures of tight sandstone based on digital core analysis. Pet. Geol. Recovery Effic. 2022, 29, 22–30. [Google Scholar] [CrossRef]
- Gao, S.; Yang, M.; Ye, L.; Liu, H.; Zhu, W. Simulation experiment of water invasion performance in low-permeability bottom water gas reservoir and its influence on recovery factor. Nat. Gas Ind. 2022, 42, 61–70. [Google Scholar] [CrossRef]
- SY/T 5336-2006; Core Analysis Methods. Petroleum Industry Press: Beijing, China, 2007.


Disclaimer/Publisher’s Note: The statements, opinions and data contained in all publications are solely those of the individual author(s) and contributor(s) and not of MDPI and/or the editor(s). MDPI and/or the editor(s) disclaim responsibility for any injury to people or property resulting from any ideas, methods, instructions or products referred to in the content. |
© 2025 by the authors. Licensee MDPI, Basel, Switzerland. This article is an open access article distributed under the terms and conditions of the Creative Commons Attribution (CC BY) license (https://creativecommons.org/licenses/by/4.0/).