1. Introduction
Under the dual pressures of escalating global climate change and the unsustainability of non-renewable energy sources, clean energy technologies represented by solar, hydro, and wind energy have become the core direction for transforming energy structures [
1]. According to predictions by the International Energy Agency (IEA), the cumulative installed capacity of PV systems is expected to exceed 4.7 TW by 2027, making it the most significant power generation form in terms of installed capacity globally. This marks PV technology as a key enabler for achieving energy system reform and ecological environmental restoration goals [
2,
3]. Compared to traditional energy sources, PV systems demonstrate significant technical advantages: they operate without mechanical wear, produce no emissions, and possess the potential for continuous optimization in energy conversion efficiency, especially in distributed microgrid applications, where they show outstanding adaptability [
4,
5,
6]. A PV system operates at its maximum power point (MPP) to deliver the highest output power. However, a PV system’s MPP and output characteristics are influenced by various factors such as solar irradiance, environmental temperature, humidity, shading, and dirt [
7]. Therefore, to maximize the conversion of sunlight to electricity under any climate conditions, a converter with a robust MPPT algorithm and strong adaptability is required [
8].
Existing maximum power point tracking technologies can be categorized into three main research directions: the first focuses on improvement strategies for classical algorithms, the second employs global optimization methods based on artificial intelligence, and the third explores control modes that integrate multiple algorithms. The first category, represented by the hill-climbing (HC) method [
9], perturb and observe (P&O) [
10], and incremental conductance [
11], has become relatively mature and is capable of achieving high tracking efficiency under uniform irradiance conditions.
In reference [
12], an improved INC method was proposed to address the system oscillations and misjudgment issues inherent in the traditional P&O method. This approach is used to calculate the difference between the current conductance and its rate of change, using an integrator for adjustment, thereby achieving the stable tracking of the MPP. Mishra Jyotismita proposed an adaptive incremental conductance MPPT algorithm, which adjusts the disturbance frequency and step size adaptively based on changes in PV voltage [
13]. Chellakhi and You Weifeng’s team developed an adaptive variable step-size INC algorithm. This algorithm automatically adjusts the perturbation step size based on the actual working conditions of the PV array, enabling the dynamic and precise locking of the MPP with steady-state accuracy, significantly outperforming the traditional P&O method [
14,
15]. Furthermore, Mostafa Ahmed proposed a predictive fixed switching frequency MPPT algorithm, introducing a dual adaptive step-size strategy [
16]. This approach reduces steady-state power loss, lowers computational load, and minimizes switching frequency losses, thereby enhancing the overall efficiency of the PV inverter. Mujahed Al-Dhaifallah developed an MPPT technique based on fractional-order control (FOC) for optimizing the parameters of the INC method (FOINC) [
17]. This method combines fractional-order control and INC, offering higher tracking efficiency and robustness. It can quickly adjust to the MPP under extreme climate conditions and improve tracking accuracy, significantly enhancing overall performance compared to traditional methods.
The aforementioned studies focus on improvements to classical methods for MPPT control, with the proposed techniques yielding good results, particularly in terms of high accuracy in tracking the MPP. However, when temperature and irradiance conditions change due to external factors such as clouds, tree shade, or birds, the PV characteristic curve shows multiple “pseudo” peaks and a single global maximum. Under these circumstances, traditional methods are no longer suitable for dynamic systems. Numerous researchers have conducted extensive investigations to address this issue effectively. Sanaz Jalali Zand et al. improved the self-predicting INC method, enhancing the tracking accuracy under irradiance fluctuations with a dynamic condition detection mechanism [
18]. Awais et al. proposed a neural fuzzy feedback linearization control scheme, which adaptively adjusts algorithm parameters to improve the PV system’s response speed under dynamic irradiance conditions [
19]. Hina Gohar Ali et al. developed a nonlinear sliding mode controller and demonstrated its advantages in fast dynamic response and disturbance rejection using Lyapunov stability theory [
20]. Cesar Ulises Solís-Cervantes et al. combined ESC with a dual-axis solar tracking system to achieve efficient MPPT under the dual disturbances of irradiance and temperature [
21]. Kaya et al. proposed an ANFIS-ABC-based neuro-fuzzy controller, significantly improving the GMPP search capability under partial shading conditions [
22].
Although enhanced conventional methods can handle environmental variations to some extent, they still struggle to accurately and rapidly track the GMPP under complex environmental conditions and tend to fall into local optima. Consequently, recent advancements in MPPT technology have incorporated various bio-inspired algorithms such as Cuckoo Search (CS) [
23], modified Particle Swarm Optimization (PSO) [
24], and an improved Bat Algorithm (BA) [
25]. These algorithms enhance global search capability through swarm intelligence mechanisms, effectively locating the GMPP under partial shading conditions while achieving a faster response speed than traditional methods. However, they still exhibit significant limitations:
- (1)
The convergence process depends on random initialization, leading to significant variations in the results across multiple runs, which can induce power oscillations in PV systems.
- (2)
High parameter sensitivity requires fine-tuned population size adjustments, iteration count, and other parameters to balance optimization quality and computational efficiency [
26].
- (3)
There is high algorithmic complexity, with computational resource consumption far exceeding that of traditional methods, limiting their applicability in low-cost hardware [
27].
In contrast, the Gray Wolf Optimization (GWO) algorithm utilizes a hierarchical hunting mechanism to simplify parameter tuning, requiring only population size adjustment to adapt to different environmental conditions. This reduces the complexity of parameter tuning and effectively suppresses severe oscillations during the startup phase [
28]. An analysis of existing studies reveals that the algorithm still exhibits inherent deficiencies, such as redundant search paths and insufficient convergence robustness. When abrupt environmental changes occur, GWO is prone to local optima, adversely affecting MPPT performance.
To address these issues, this study proposes an enhanced MPPT algorithm integrating an improved GWO with the INC method to enhance the adaptability and stability of PV systems under complex environmental conditions. The main improvements of the proposed algorithm are as follows:
- (1)
Improved GWO search mechanism: In the GWO phase, a dynamic candidate point focusing mechanism and a perturbed position update strategy are introduced to enhance search efficiency, improve adaptability to sudden environmental changes, and reduce search path redundancy.
- (2)
Optimized INC tracking strategy: In the INC phase, a five-level dynamic step-size adjustment, direction consistency verification, and momentum suppression strategy are implemented to overcome the limitations of fixed step sizes, improve MPPT accuracy, and reduce steady-state fluctuations.
- (3)
Enhanced environmental adaptability: The environmental mutation detection mechanism is optimized by incorporating boundary protection measures to improve detection accuracy and anti-interference capability. Additionally, physical constraints are introduced in the duty cycle adjustment process to suppress overshoot and oscillations, effectively improving system stability.
By integrating the global search capability of the improved GWO with the dynamic step-size optimization strategy of INC, the proposed algorithm significantly enhances MPPT efficiency and anti-interference capability in complex environments. However, compared to conventional algorithms, more computational resources are required to accommodate the operation of photovoltaic power generation systems in complex scenarios.
The structure of this paper is as follows:
Section 2 introduces the operational principles and output characteristics of PV cells, along with the application of INC and GWO algorithms in MPPT control.
Section 3 presents the improved GWO-INC hybrid algorithm and elaborates on its optimization strategies across operational stages.
Section 4 analyzes the performance of the proposed algorithm through simulations and compares its effectiveness with other optimization methods under varying operating conditions.
2. PV System Modeling and MPPT Algorithm Analysis
2.1. Operational Mechanisms and Output Characteristics of PV Cells
PV cells are predominantly semiconductor devices fabricated from silicon materials. Their operation relies on the photovoltaic effects of semiconductor PN junctions to achieve photoelectric conversion, as illustrated in
Figure 1.
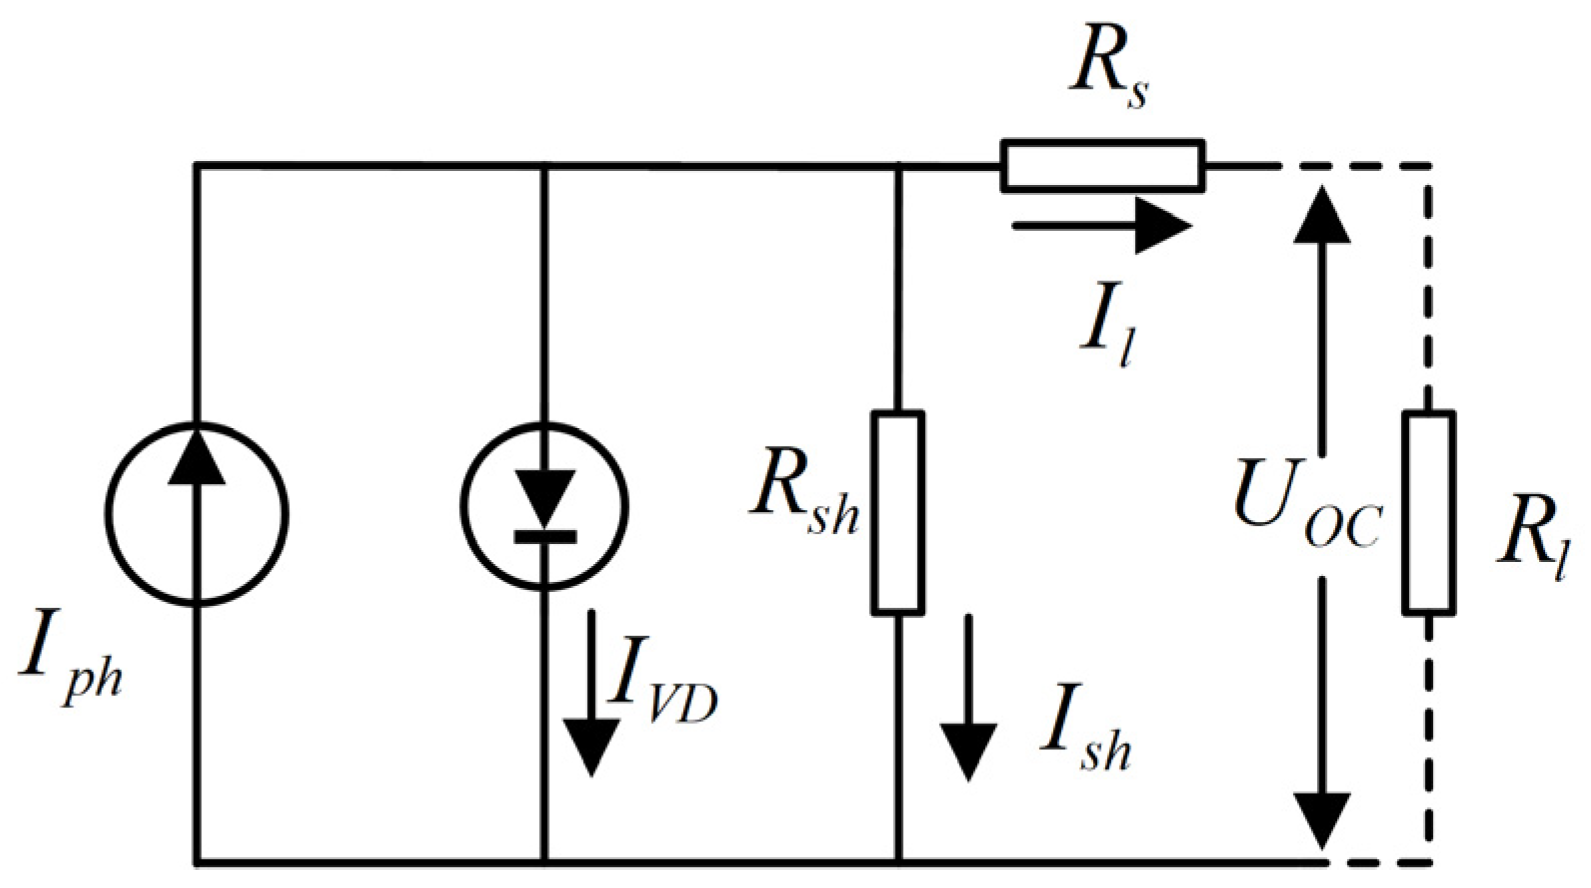
Based on their operational principles, PV cells can be modeled as stable output current sources in equivalent circuit analysis. An equivalent circuit is illustrated in
Figure 2.
The series resistance
and shunt resistance
represent the intrinsic resistive losses of the PV cell. Under ideal conditions,
is assumed to be negligible compared to
and is often omitted in calculations. The relationship between variables in the equivalent circuit is expressed as follows:
In this equation, represents the photogenerated current, which is proportional to the area of the PV cell and the irradiance of the incident light. is the dark current, the reverse current flowing through the PN junction under an external voltage when there is no illumination. is the load current. is the open-circuit voltage. is the ideal diode factor, typically in the range of . is the ambient temperature, is the Boltzmann constant, is the charge of an electron, and is the saturation current under no illumination.
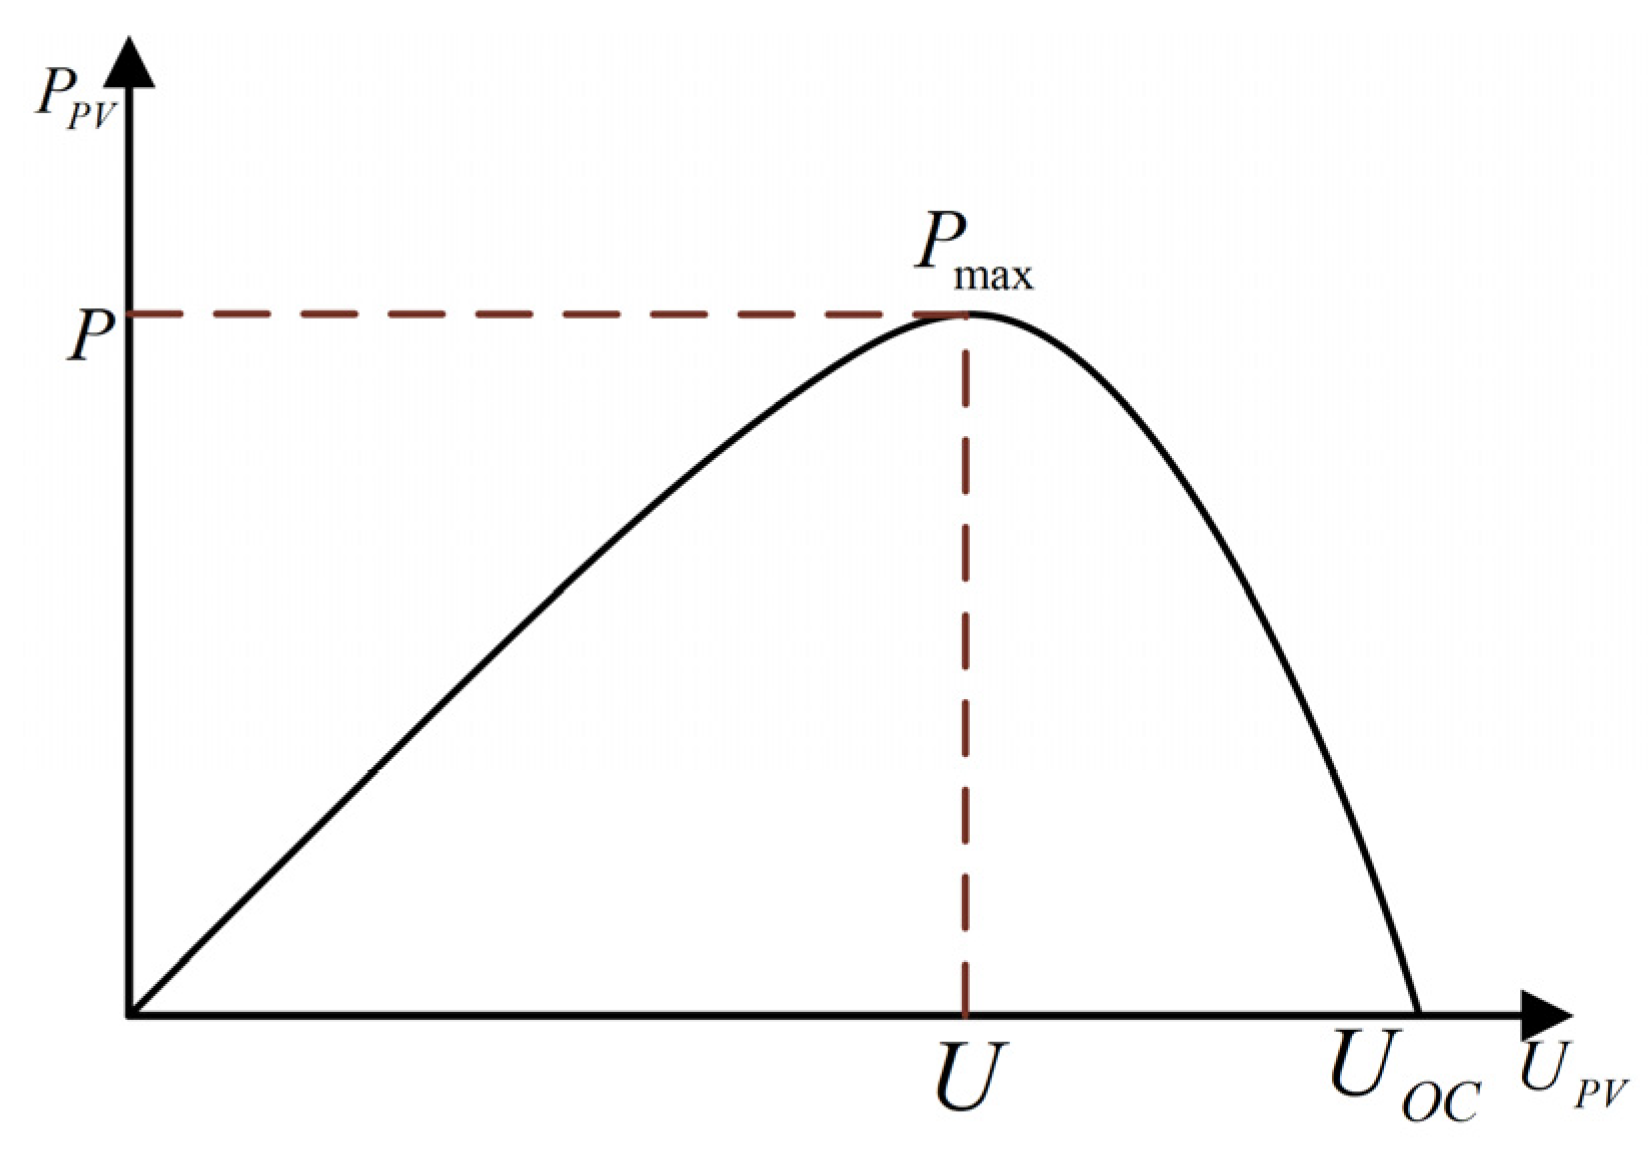
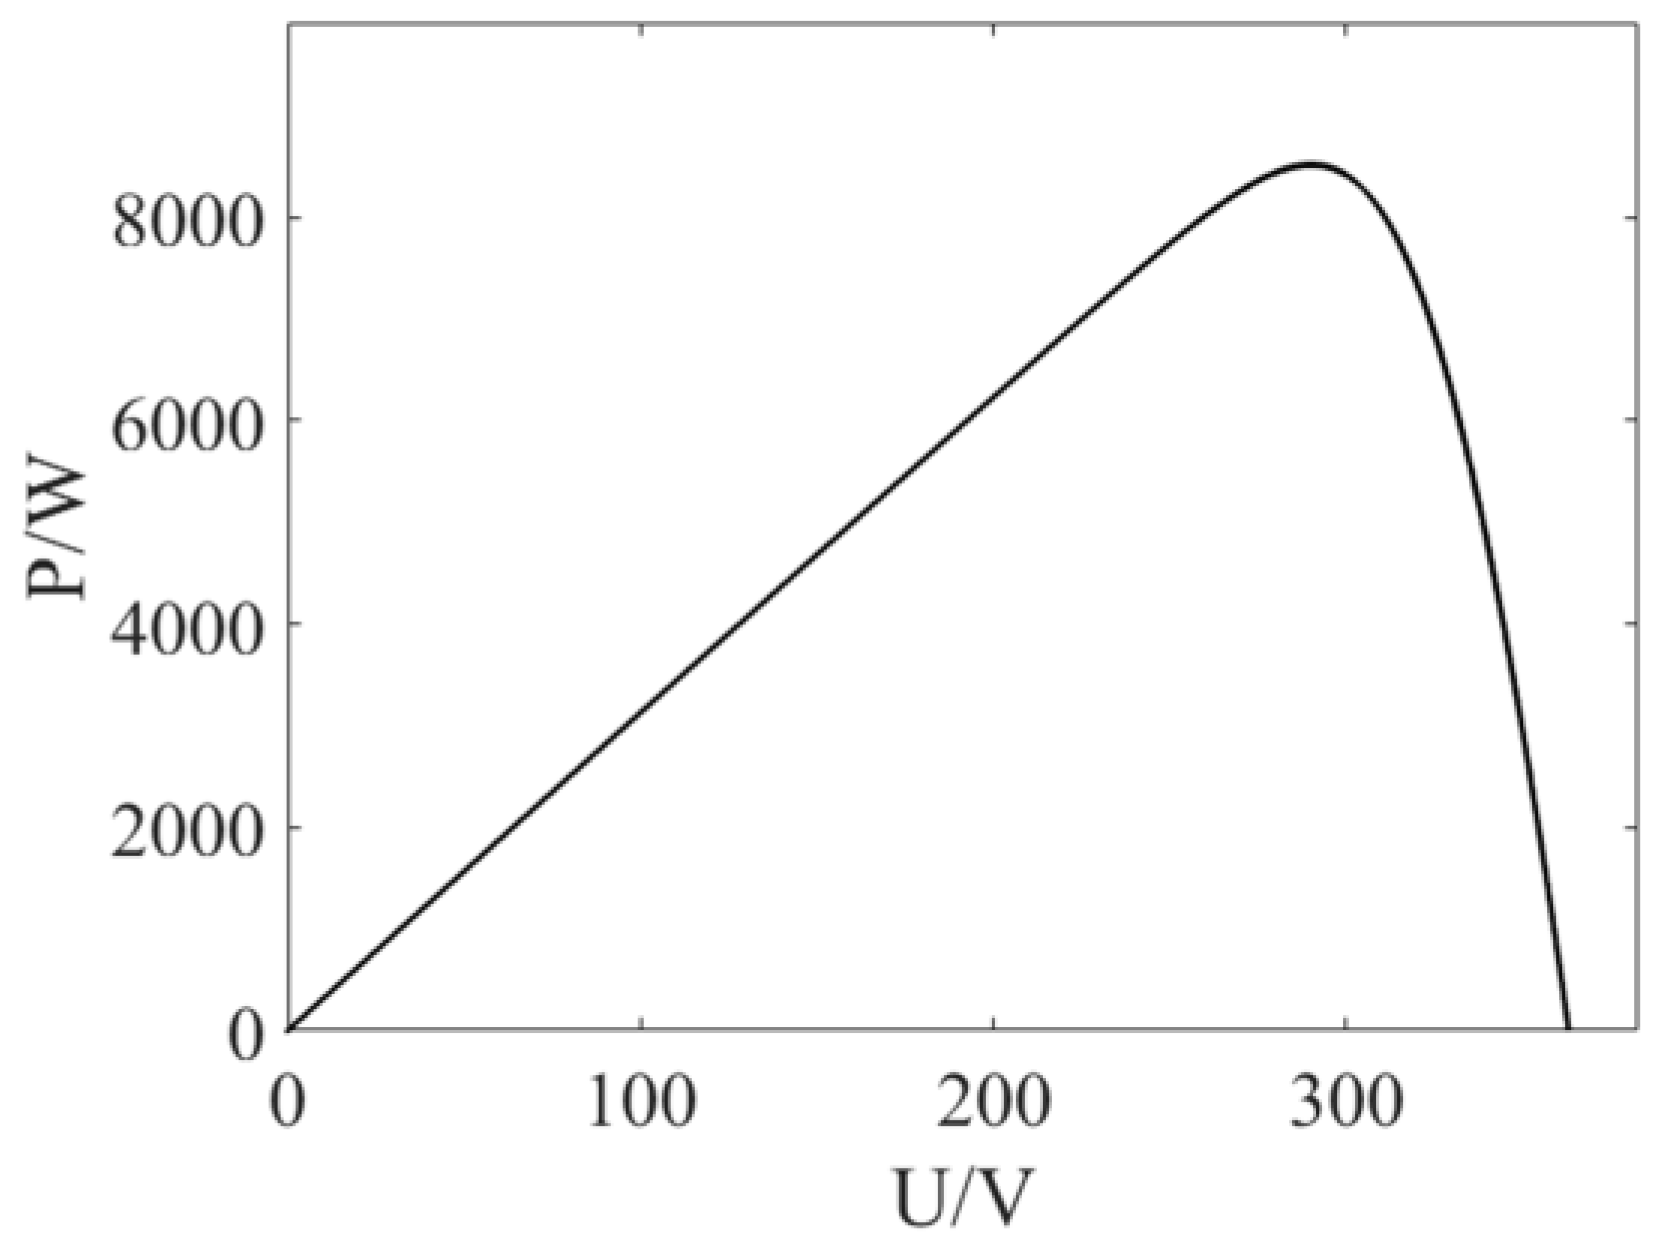
To define the stable operating range of the PV system, dynamic impedance matching analysis must be performed based on the output of their power–voltage (P-V) characteristic curves shown in
Figure 3.
The vertex of this curve corresponds to the MPP, with different electrical characteristics on either side. When the system operates on the left side of the curve, the PV cell exhibits high dynamic internal resistance, and its output characteristics resemble a constant current source. In this region, the irradiance primarily dominates the current, and the voltage increases linearly with the load impedance. If a sudden load change causes the voltage to drop into this region, the system may enter current saturation, requiring the MPPT algorithm to adjust the operating point actively. When the system operates on the right side of the curve, the PV cell exhibits low dynamic internal resistance, and its output characteristics approach those of a constant voltage source. The voltage stabilizes near the open-circuit voltage (with a typical degradation rate of 0.3%/°C), and the current rapidly decreases as irradiance drops. High temperatures or shading can cause voltage drift, requiring the implementation of temperature compensation circuits to prevent thermal runaway. According to impedance matching theory, the system reaches the maximum power transfer when the dynamic internal resistance of the PV cell matches the load’s equivalent impedance.
2.2. Principles and Limitations of Conventional MPPT Techniques
The output power–voltage relationship of PV systems exhibits significant nonlinearity, requiring dynamic optimization via MPPT control strategies. MPPT is typically implemented through a DC/DC converter, with its core workflow involving the real-time sampling of PV array voltage and current, calculating the MPP voltage reference via the MPPT algorithm, generating PWM signals based on deviations between the reference and measured voltages, and dynamically adjusting the Boost converter’s duty cycle to drive the operating point toward the MPP along the P-V curve. This closed-loop control suppresses power oscillations through dynamic impedance matching, ensuring stable MPP operation. Dominant MPPT algorithms include P&O and INC. The P&O method adjusts perturbation polarity by periodically disturbing the output voltage and observing power trends. Despite its simplicity, P&O is prone to misjudgment under rapid irradiance changes, leading to power losses.
The INC algorithm adjusts the perturbation voltage based on the relationship between the PV array’s output conductance and power variations to achieve MPPT. Specifically, when the incremental conductance (
) equals the negative incremental voltage (
), the slope of the P-V curve becomes zero, indicating that system has reached the MPP. If
, the positive slope of the P-V curve (
) implies that the operating point is below the MPP, and an increase in output voltage is required. Conversely, if
, a negative slope (
) signifies that the system has overshot the MPP, and a voltage reduction is necessitated. The slope of the P-V curve is defined as in Equation (4).
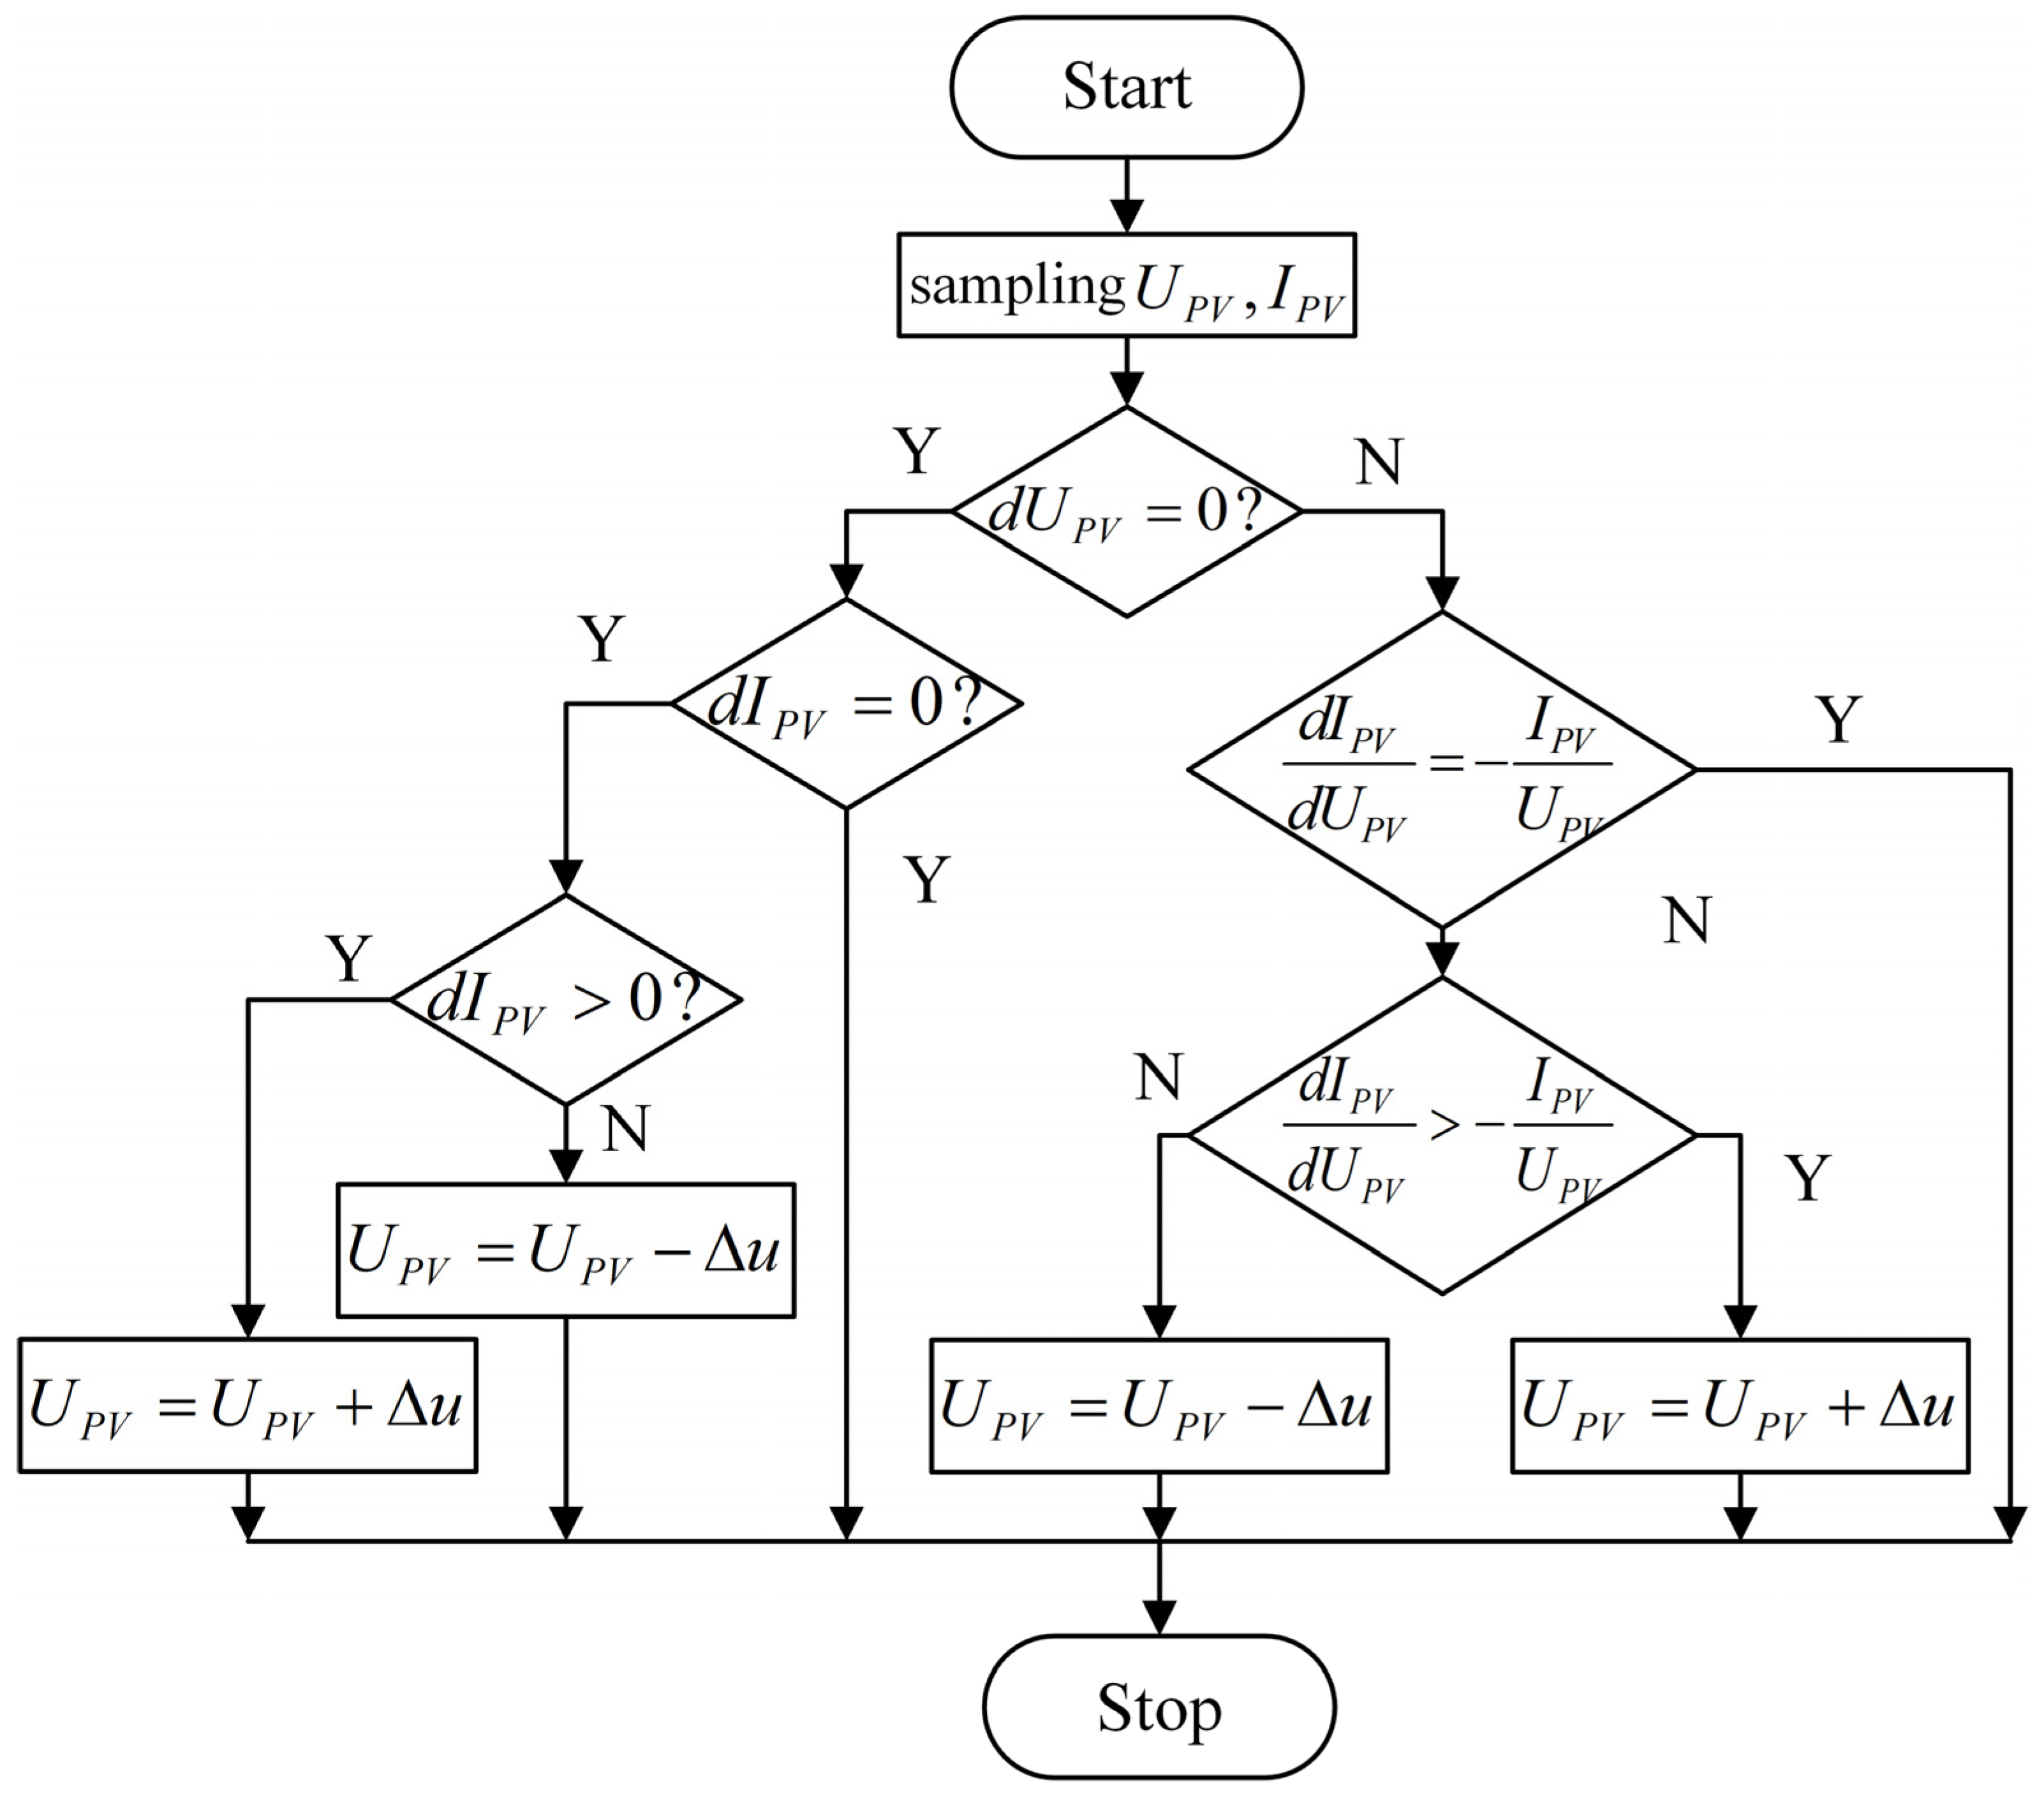
As indicated by the preceding analysis, the INC algorithm achieves a faster tracking of MPP shifts caused by irradiance variations and higher steady-state accuracy than P&O due to its direct mathematical reliance on the relationship between incremental conductance and voltage (rather than trial perturbations in P&O). The control workflow of the INC algorithm is illustrated in
Figure 4.
However, under complex dynamic conditions, abrupt fluctuations in environmental parameters significantly alter the quantity and distribution of extrema on the characteristic curves. The P-V and I-V curves of PV arrays exhibit multi-peak nonlinear time-varying characteristics. This causes INC algorithms designed with single-peak assumptions to fail in identifying the global MPP, reducing tracking efficiency to 60–75%. Concurrently, voltage step responses induced by algorithmic misjudgments, exacerbated by solar intermittency, result in high-frequency power oscillations.
2.3. Implementation of GWO in PV MPPT Systems
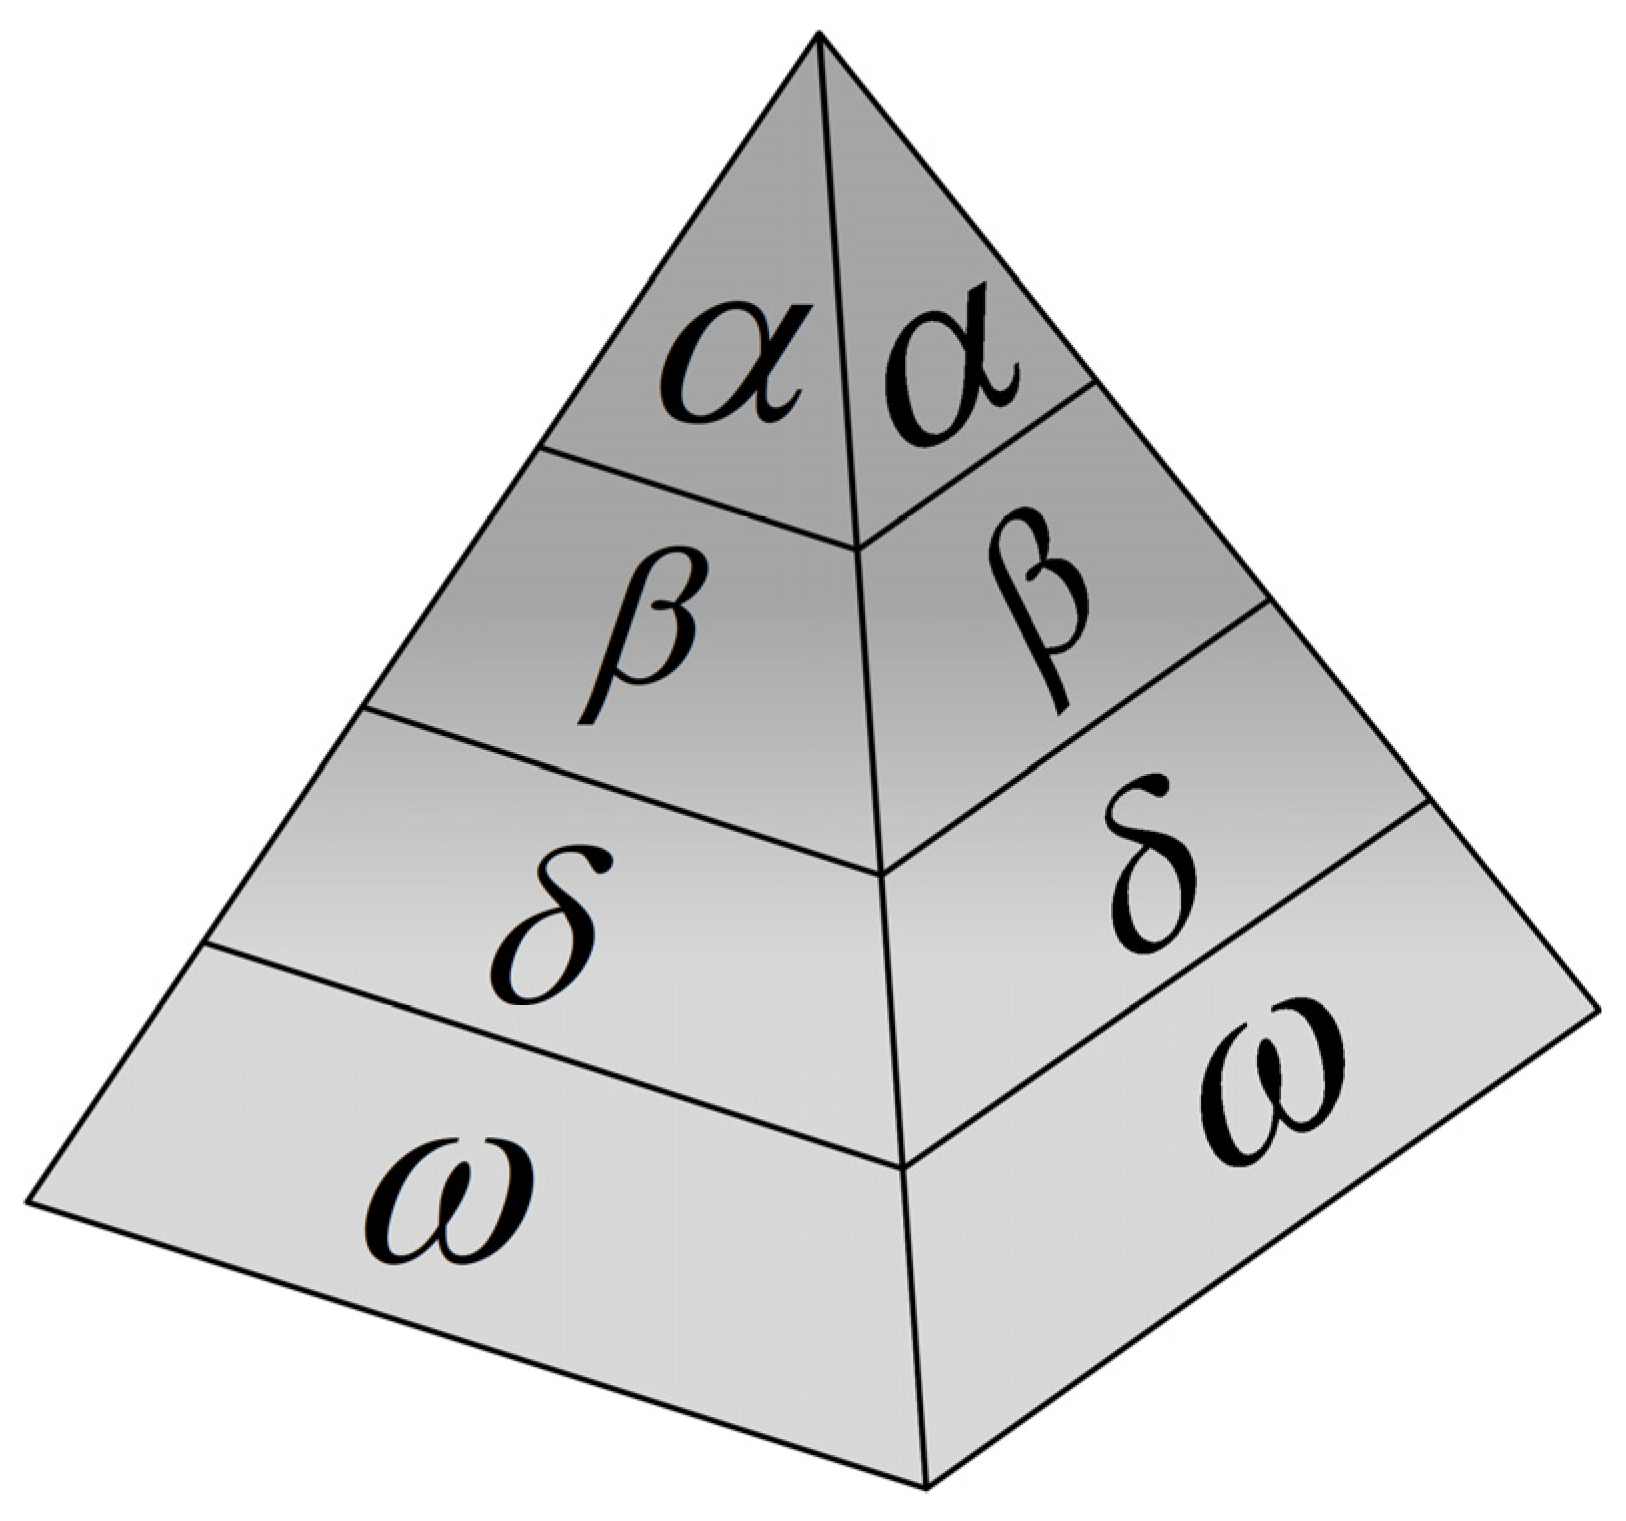
GWO is a biomimetic metaheuristic algorithm that mimics gray wolf packs’ social hierarchy and cooperative hunting behavior. Its core mechanism maps the optimization problem’s solution space into the prey search dynamics through a four-layer social hierarchy structure, as shown in
Figure 5.
In this hierarchy, the , and wolves represent the current best, second best, and third best solutions, guiding global exploration and local development. At the same time, the wolf serves as a candidate solution to follow the position update. The algorithm abstracts the optimization process into three iterative phases:
Global exploration phase: The pack disperses to search potential optimal regions based on , and wolves’ positions.
Encirclement and disturbance phase: Collaborative hunting narrows the search radius by encircling prey.
Local attack phase: Precise position adjustments lock the global optimum.
The adaptive equation governs the position update as follows:
Equation (5) defines the final position of the individual, which corresponds to the GMPP found in the MPPT technology. Equation (6) specifies the step size and direction in which the ω individual of the wolf pack moves towards the
,
and
individuals.
,
, and
are the positions of the
,
and
wolves, which correspond to the duty cycle candidates near the maximum power point in MPPT.
,
, and
represent the Euclidean distance between the current individual and the optimal, suboptimal, and third best solutions, respectively. In PV MPPT, these correspond to the adjustment step size between the current duty cycle and the optimal duty cycle, the reference direction for searching the suboptimal duty cycle, and the local disturbance reference for duty cycle search. X represents the current position of the gray wolf individual, i.e., the solution to be updated. The coefficients
and
dynamically balance the exploration and exploitation strengths, ensuring the algorithm maintains both convergence speed and accuracy in multi-peak optimization problems. The update formulas for coefficients
and
are defined as follows:
The parameter linearly decreases from 2 to 0 over iterations to govern the transition from global exploration to local exploitation, while and are random vectors uniformly distributed within the interval [0, 1].
In the deep coupling of GWO and PV MPPT control, the random perturbation coefficients and balance global exploration and local utilization through a dynamic adjustment mechanism, and their behavior is closely related to the nonlinear dynamic characteristics of the PV system. When faced with rapid changes in light or local shading, the algorithm amplifies the random perturbation weight of and increases the value of to ensure that , enhances the guidance weight of the , and wolves, expands the duty cycle search range to cover potential extreme values, forces the duty cycle search to jump out of the current area, scans the multi-peak power curve, and avoids the local extreme value trap. As the algorithm approaches the GMPP, the perturbation effect of gradually decreases, and the value of decreases, resulting in weakening the influence of the leader, giving priority to local fine-tuning, driving duty cycle fine-tuning, and focusing on the optimal area of fast peak locking while suppressing power oscillation. Additionally, the algorithm integrates weighted guidance from the , and wolves to establish a distributed cooperative search mechanism within the solution space. This reduces reliance on single-leader dominance and leverages swarm intelligence to mitigate local convergence risks, ultimately achieving high-efficiency global maximum power tracking under complex operating conditions.
3. Multi-Stage Collaborative Optimization Design of GWO-INC
In PV MPPT control, a single control strategy struggles to meet the dual demands of dynamic environment adaptability and steady-state regulation accuracy. GWO, based on a swarm intelligence collaboration mechanism, achieves strong global exploration capability through the dual parameter regulation of the convergence factor and population size. It demonstrates excellent local extremum avoidance properties in complex nonlinear scenarios and offers the advantage of low engineering complexity. On the other hand, although INC can achieve high-precision steady-state tracking, its performance is constrained by the sensitivity to the initial operating point, with a significant risk of mis-locking in multi-peak scenarios. By combining the strengths of both algorithms, the MPPT control can be implemented in a two-stage hybrid control architecture, as shown in
Figure 6.
Global Exploration Stage: The distributed search capability of GWO is leveraged to perform a wide-area scan of the power curve through the wolf pack collaboration mechanism, quickly locating the neighborhood of the maximum power point.
Local Fine-Tuning Stage: The system switches to INC, leveraging its deadbeat control characteristics to execute fine-grained duty cycle adjustments near the GMPP, ensuring tracking accuracy.
While the GWO-INC hybrid architecture effectively balances dynamic environmental adaptability and tracking precision, it still suffers from search path redundancy and insufficient convergence robustness under complex multi-disturbance scenarios. To address these limitations, this study proposes the High-Efficiency Gray Wolf Optimizer–Incremental Conductance (HE-GWO-INC) algorithm, which enhances GWO’s global search directional capability through a dynamic candidate solution focusing mechanism. The proposed algorithm, integrated with INC-phase adaptive step-size optimization and boundary constraint strategies, enables rapid convergence and ultra-low fluctuation tracking under multimodal disturbances. The core innovations are detailed in the following analysis.
3.1. Enhanced GWO Algorithm
To overcome the issue of low search efficiency caused by the uniform distribution of initial candidate points across the entire range, and to address the problem of old environment optimal solutions interfering with the search for new environments after a disturbance, which may lead to local optima, a dynamic candidate solution focusing mechanism and a location update strategy with a disturbance factor are proposed. The core of the dynamic focusing mechanism is that once an environmental disturbance is detected, a denser candidate point distribution is generated around the historical optimal solution, effectively narrowing the search range and accelerating the convergence process. Specifically, once an environmental disturbance is detected, a local candidate set is carefully constructed around the historical optimal duty cycle
to ensure the precision and efficiency of the search.
In this equation, represents the local search range of the candidate point distribution, covering the offset range of the typical MPP. and represent the physical limits of the duty cycle.
To further enhance the robustness and global search capability of the algorithm, a disturbance factor is introduced in the position update process. This disturbance factor effectively introduces randomness by adding a Gaussian disturbance term to the gray wolf position update formula, preventing the algorithm from prematurely converging to a local optimum. Specifically, the introduction of the Gaussian disturbance term allows for a controlled amount of random fluctuation in the position update process while maintaining overall consistency in the search direction. This helps the algorithm explore a broader solution space, enhancing both the breadth and depth of the global search.
The disturbance intensity coefficient controls the amplitude of the Gaussian disturbance , and its dynamic attenuation characteristic forms an adaptive search adjustment mechanism: in the early iterations, a higher σ value enhances the diversity of global exploration; in the later stages, decays exponentially to 0.1, enabling the nanoscale fine-tuning of the duty cycle in the local development phase. For dynamic disturbance scenarios, a global state reset protocol is designed. When environmental changes are detected, the following operations are performed: Reset the historical best solutions of the α/β/δ wolves to eliminate residual bias from the old environment’s data. Reconstruct the uniform candidate set based on Equation (9) to ensure an unbiased search in the new environment.
3.2. Enhanced INC Algorithm Design
In PV MPPT applications, conventional INC exhibits inherent limitations. Its fixed coarse/fine-tuning step sizes create an irreconcilable trade-off between dynamic response speed and steady-state accuracy. Noise in voltage/current sampling triggers directional misjudgments, inducing system oscillations. Near the GMPP, frequent direction-switching adjustments degrade tracking efficiency and cause unnecessary power loss. Additionally, the inadequate handling of physical constraints during duty cycle adjustments risks overshoot or sustained oscillations.
To address these challenges, this study proposes a five-level variable step-size strategy as described in Equation (11). This strategy dynamically adjusts step sizes based on real-time power variation rates, achieving an optimal equilibrium between rapid dynamic response and high-precision steady-state tracking.
In Equation (11), represents the multimodal adaptive variable, which reflects the change in the PWM duty cycle over adjacent control cycles. is the coarse adjustment step size, and is the fine adjustment step size. In the first stage, since the system power changes drastically and moves away from the MPP, a 1.5 times more considerable coarse adjustment step is used to speed up the approach to the MPP. Although the power has not yet stabilized in the second stage, it is close to the MPP, so the standard coarse adjustment step is used for rapid adjustment. In the third stage, with moderate power variation and the system near the MPP, a decaying coarse adjustment step is applied to achieve a smooth transition. In the fourth stage, when power fluctuation is minimal and the system is approaching a steady state, an enhanced fine adjustment step is used to suppress oscillations. Finally, in the fifth stage, when power is primarily stable and the system is steady, the standard fine adjustment step is used for precise maintenance.
Additionally, a directional memory factor,
, is introduced as a dynamic adjustment coefficient to suppress oscillations caused by power direction reversals and to balance tracking speed and steady-state stability. This factor’s core design concept is to use historical directional information to smooth the step-size adjustment process, thereby optimizing the algorithm’s overall performance.
In this equation, denotes the direction of power variation, with a value of +1 (indicating power increase) or −1 (indicating power decrease). represents the power difference between the current and previous control cycles. When a direction reversal is detected (e.g., from increasing to decreasing), the system triggers a 40% step-size decay to mitigate overshoot. Conversely, consistent power variation direction maintains the original step size to accelerate escape from local optima, ensuring rapid convergence toward the global optimum.
3.3. Enhanced Disturbance Detection Framework
In conventional GWO-INC MPPT control strategies, environmental mutations are typically detected using a single parameter—the power variation rate. However, this univariate detection approach proves inadequate in complex real-world scenarios. Specifically, reliance solely on the power variation rate renders the system vulnerable to noise interference and significantly degrades detection reliability in low-irradiance-gradient regions, potentially leading to complete failure. More critically, transient power fluctuations may falsely trigger algorithm resets, inducing frequent system oscillations that severely compromise control stability and efficiency. To address these limitations, this study introduces a multi-parameter joint criterion model. Building upon the traditional power variation rate criterion, the model incorporates a voltage variation rate criterion, establishing a coordinated power–voltage monitoring mechanism. This multidimensional, multi-indicator approach comprehensively captures environmental dynamics with enhanced accuracy, effectively mitigating noise-induced false triggering and misjudgments while improving the overall performance and robustness of MPPT control.
In this equation, represents the photovoltaic output power in the current sampling period; is the photovoltaic terminal voltage in the current sampling period; and is the power change rate, which reflects the instantaneous change intensity of the photovoltaic output power between adjacent sampling periods. A larger indicates that the current operating point is farther from the maximum power point. reflects the instantaneous change rate of the photovoltaic terminal voltage, which is strongly related to factors such as temperature and aging and can assist in distinguishing the type of environmental change. is a flag variable in the environmental fluctuation detection logic, with a value of 1 indicating that an environmental change has occurred, requiring a reset of the gray wolf group’s state to ensure a global search in the new environment. When , it means that the system is in a stable condition or experiencing minor disturbances, and no algorithm mode adjustment is needed, prioritizing steady-state accuracy and efficiency. is the power change rate threshold; is the voltage change rate threshold.
To further smooth the data and suppress noise, a moving average filtering technique is used to preprocess the raw sampling data.
In this equation, represents the filtered photovoltaic voltage, used to suppress noise interference and improve the reliability of environmental fluctuation detection. The filter coefficient controls the weighting of new sampled values within the range [0, 1], where higher values increase sensitivity to recent samples but reduce noise immunity. Adjusting the filter coefficient can balance the dynamic response speed, and the noise suppression ability can be balanced. is the time constant, and is the cut-off frequency in the middle of the sampling period.
The system will dynamically adjust the threshold based on Equation (17) in noisy environments, to enhance the anti-interference ability.
Within this framework,
represents the power standard deviation, and
corresponds to the average power within the sliding window. Under high-noise or low-power conditions, the system automatically relaxes these thresholds to reduce false triggering probabilities while maintaining robust environmental mutation detection.
To further enhance MPPT stability, an intelligent boundary protection strategy is integrated into the algorithm, as formulated in Equation (18), where is the safety margin, and its value is 0.5. and are physical boundaries, and the values set in this paper are 0.05 and 0.95. This strategy establishes a dynamic operational constraint framework that prevents control instability caused by duty cycle saturation, effectively acting as a safeguard mechanism to ensure bounded and stable PWM adjustments across all operating regimes.
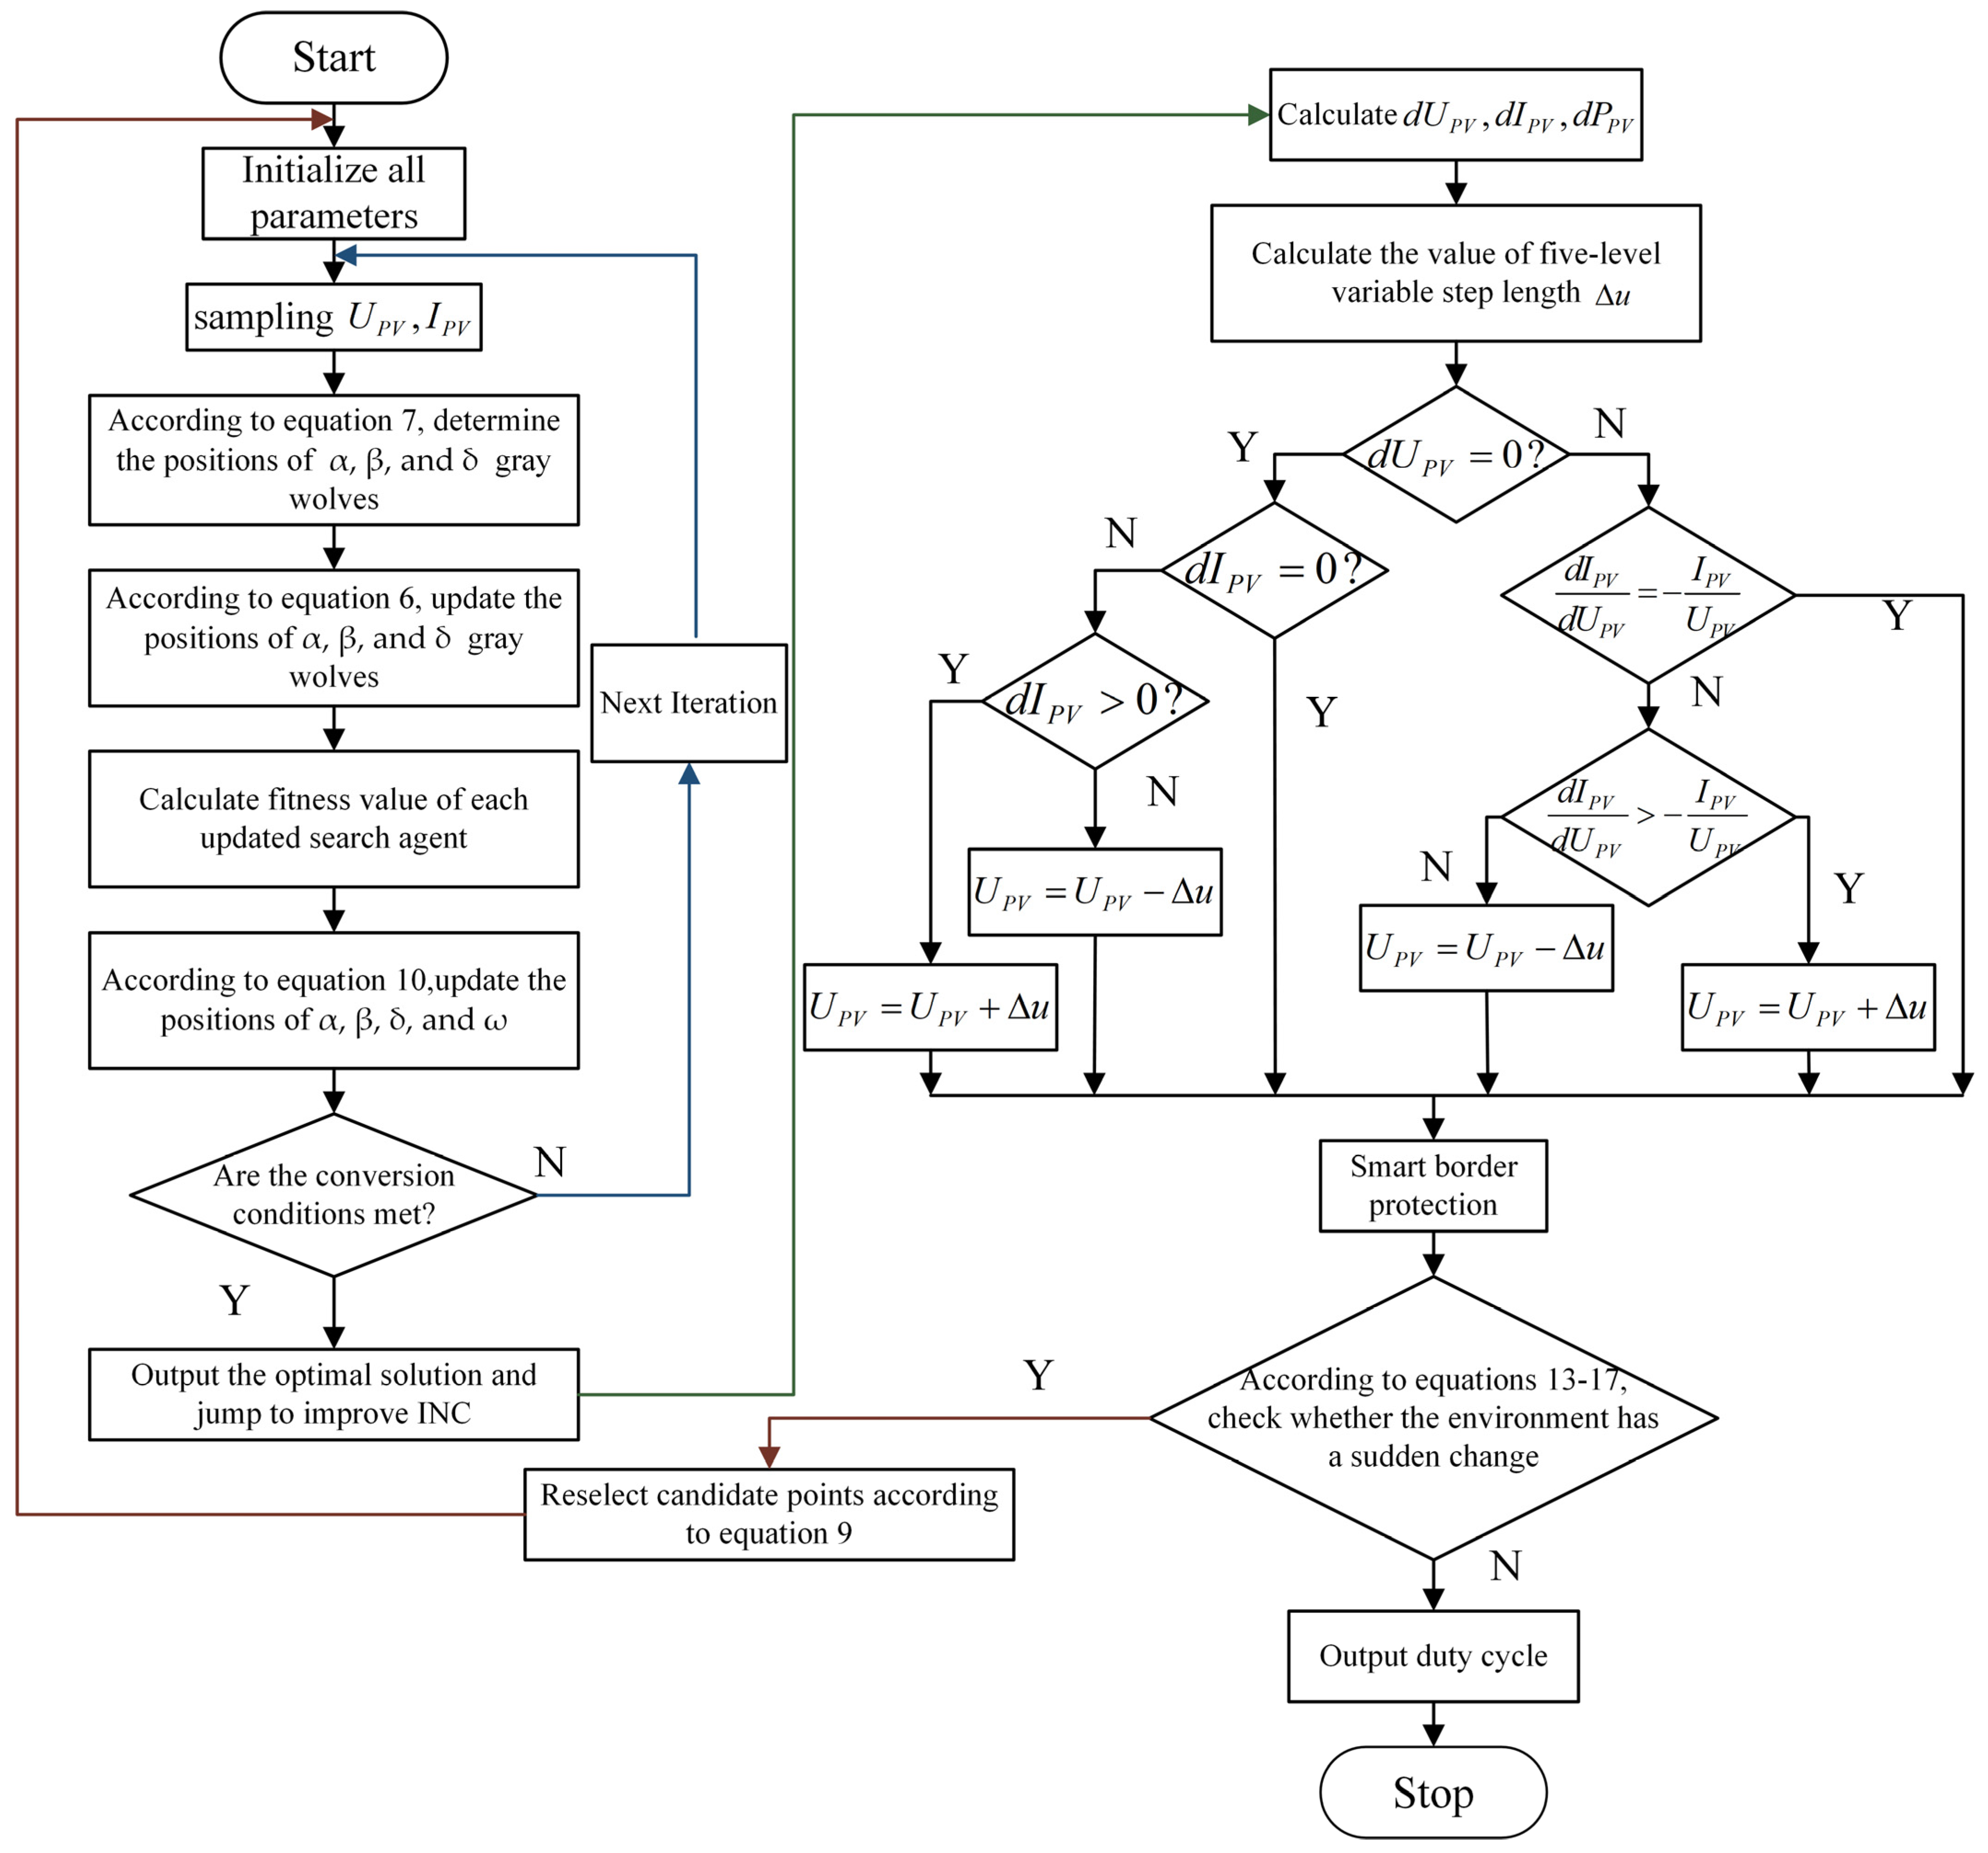
Based on the preceding analysis, the overall control flow of the HE-GWO-INC hybrid algorithm proposed in this study can be derived, as illustrated in
Figure 7.
4. Discussion
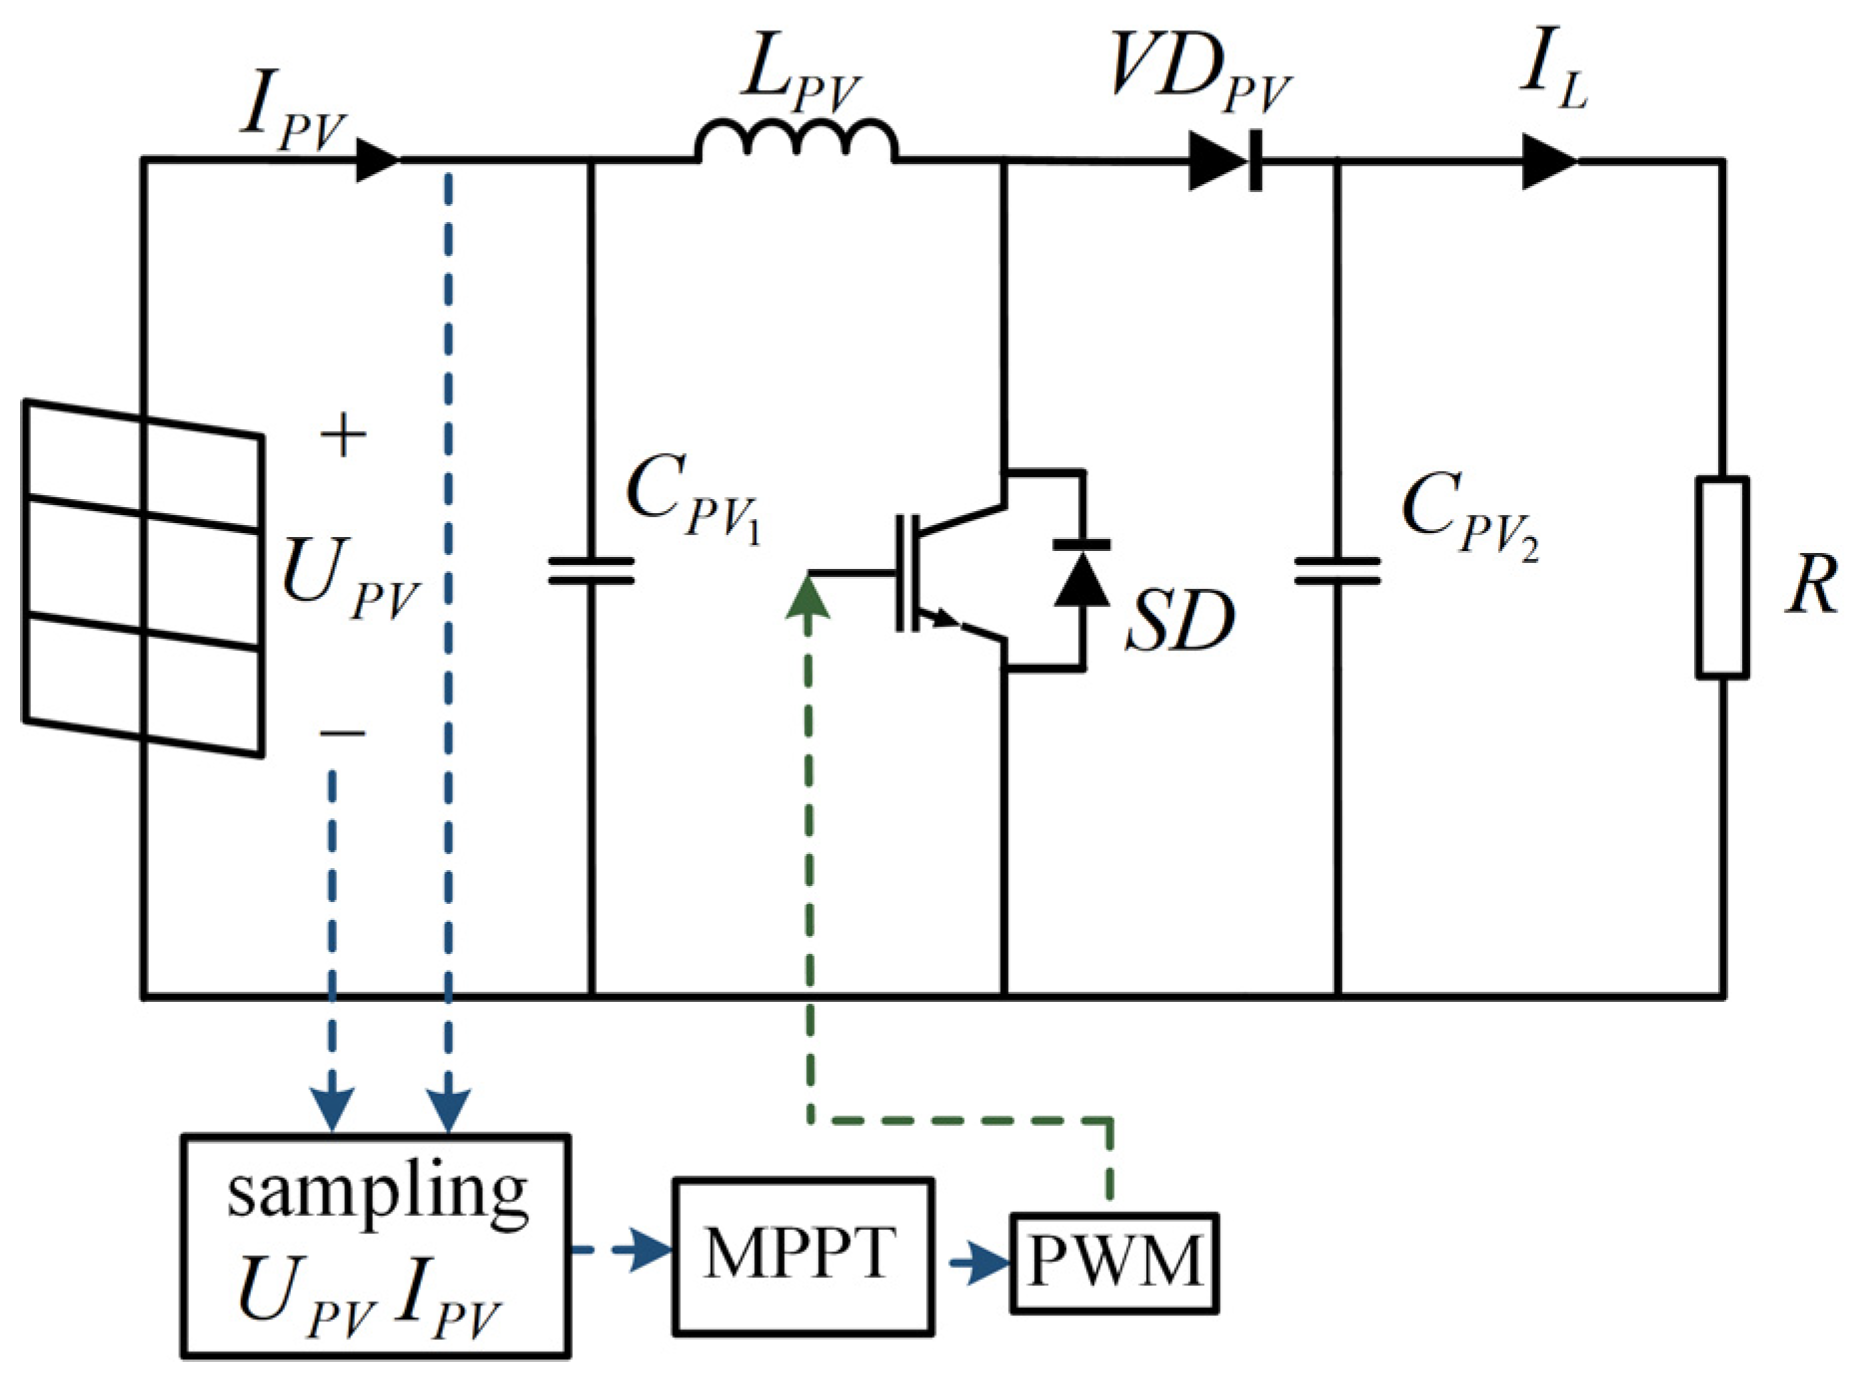
To assess the effectiveness of the HE-GWO-INC algorithm, we designed a photovoltaic MPPT control circuit, as depicted in
Figure 8. This system comprises four essential components: a photovoltaic array, a Boost converter, the MPPT control module, and a PWM generator. Key circuit elements include
(input filter capacitor),
(output filter capacitor),
(energy storage inductor),
(switching transistor),
(diode), and
(load).
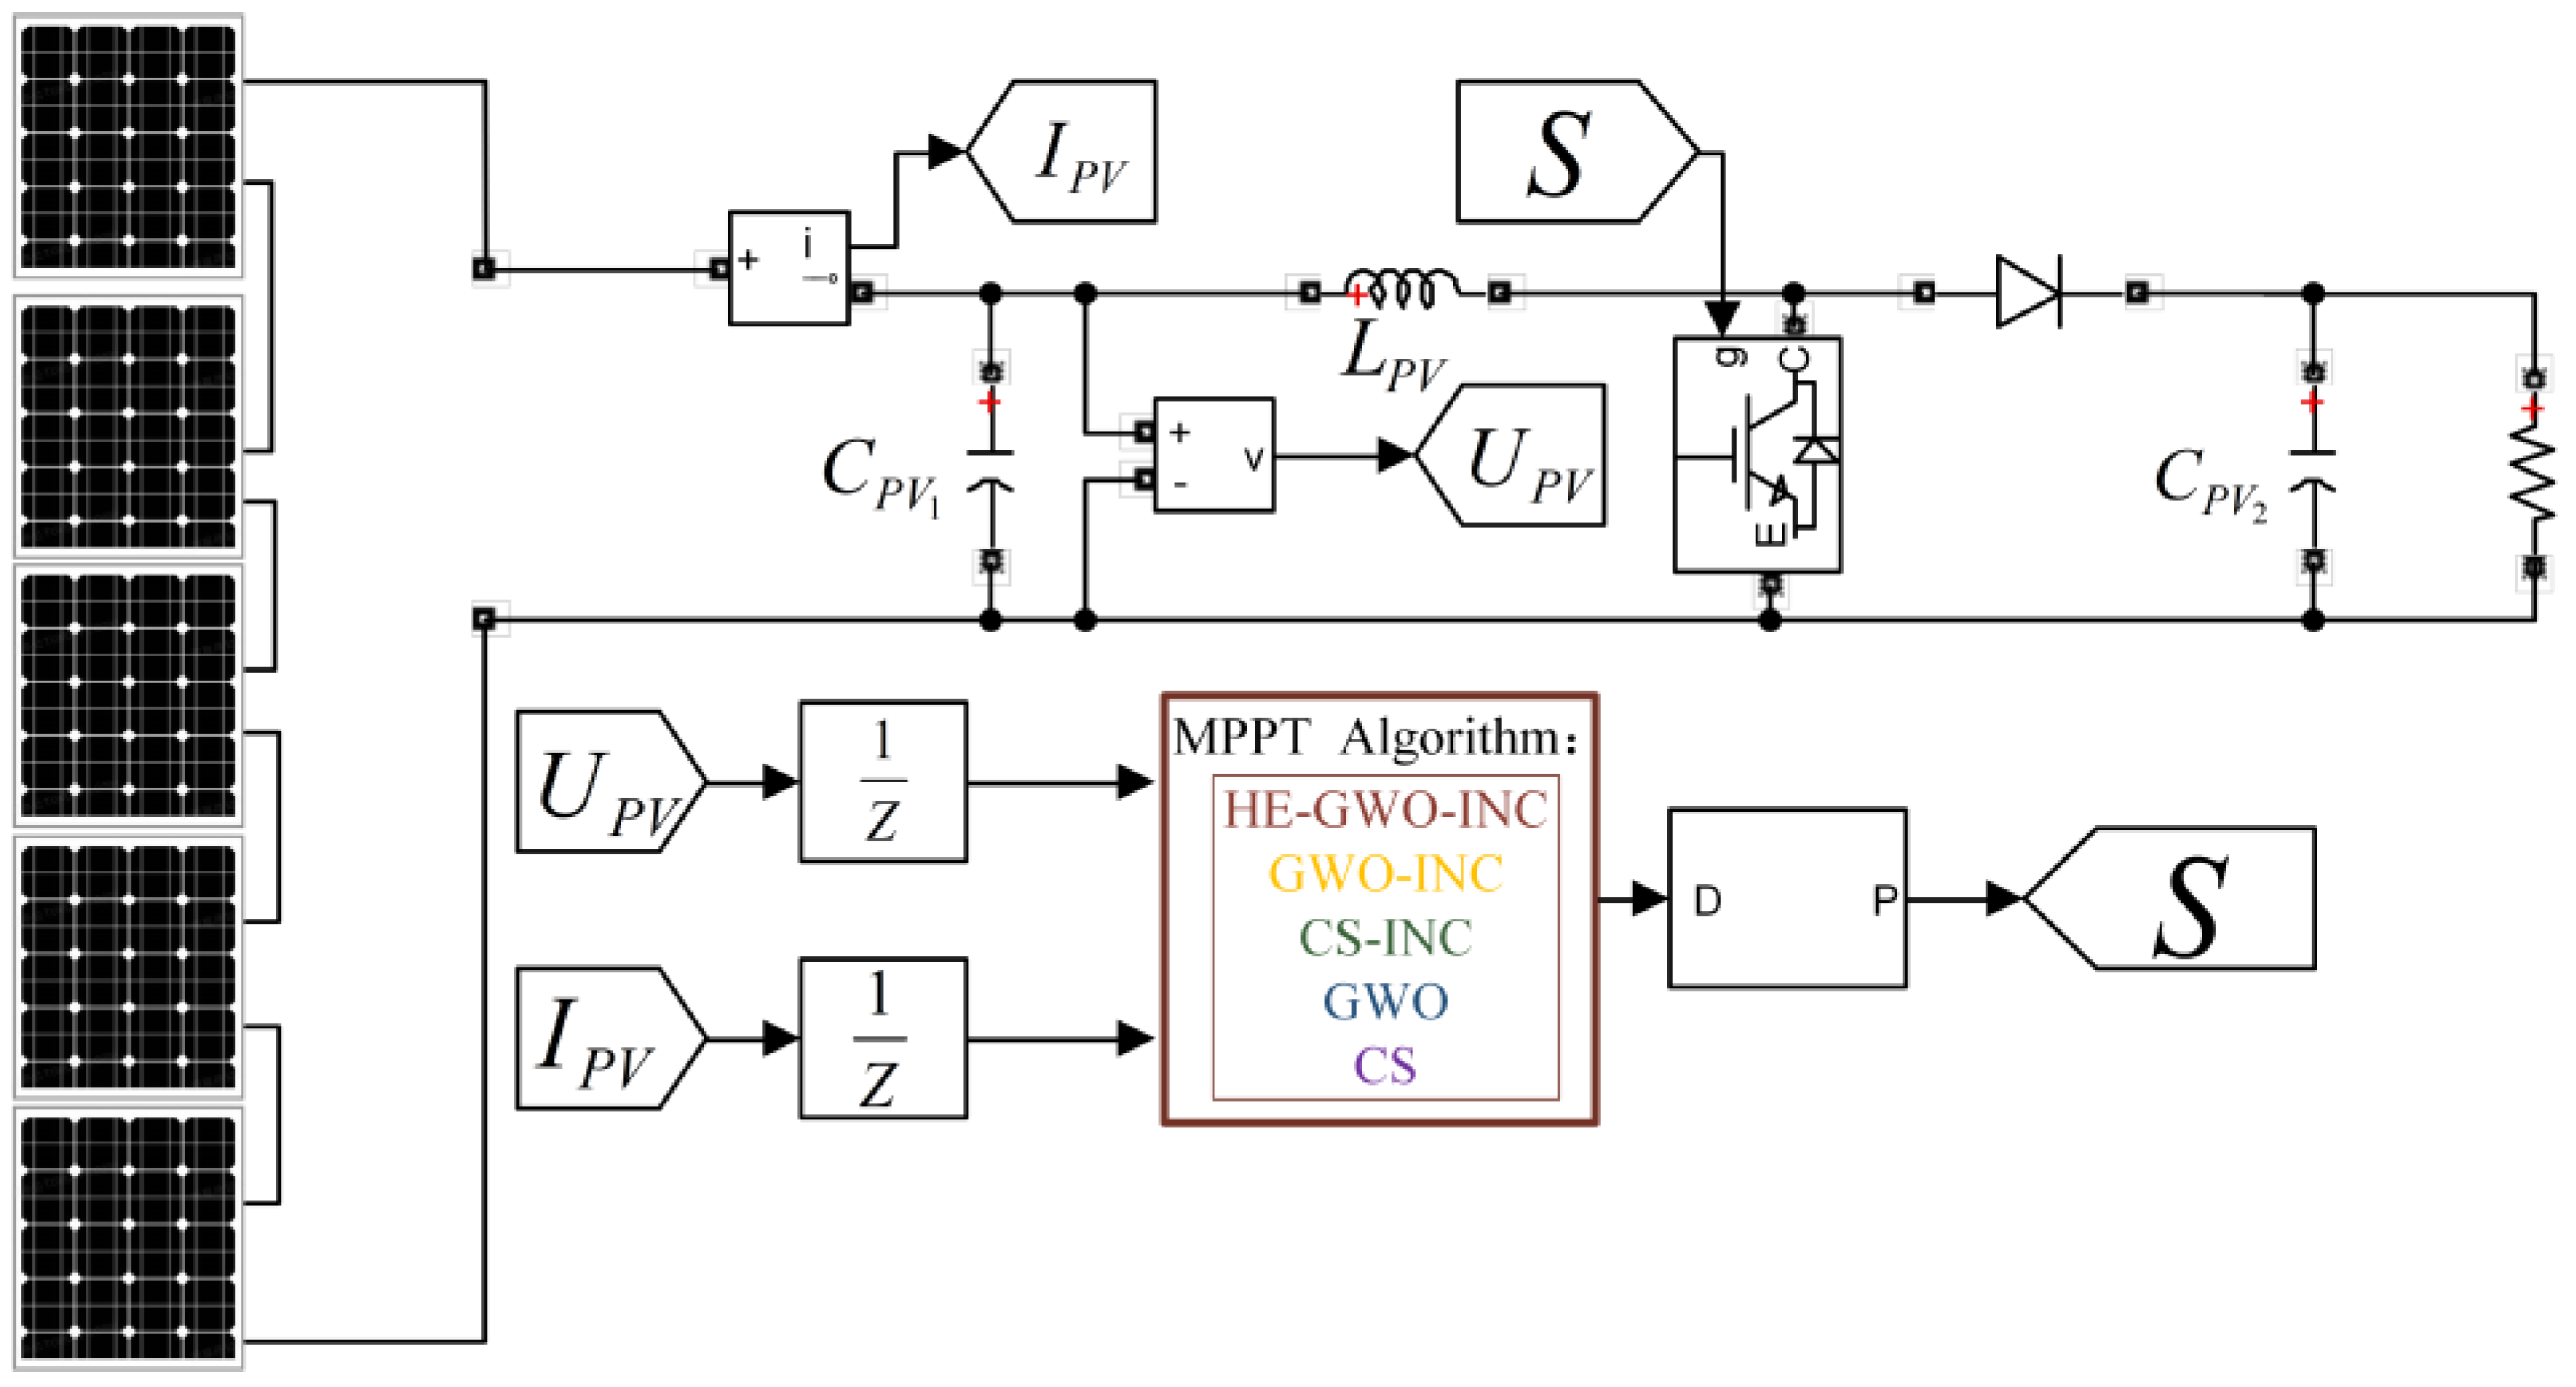
Following the circuit configuration in
Figure 8, a simulation model, as shown in
Figure 9, is established, with parameters detailed in
Table 1. The model employs five serially connected PV modules to form the photovoltaic array. The simulations were performed under three radiation conditions: standard test conditions, static partial shading, and dynamic partial shading. Five algorithms, GWO, GWO-INC, Cuckoo Search (CS), CS-INC, and HE-GWO-INC, were compared and analyzed to evaluate the performance of the proposed improved algorithm in the PV system. Among them, the CS algorithm simulates the parasitic breeding behavior of cuckoos to achieve random candidate solution generation and eliminate low-quality solutions. By incorporating the Lévy flight strategy, the algorithm enhances global search capability through random long jumps, reducing the risk of becoming trapped in local optima. Population updates are controlled by the host nest discovery probability, ensuring the retention of high-quality solutions while maintaining population diversity. Based on this, the CS-INC algorithm integrates the global search capability of the CS algorithm with the local tracking characteristics of the INC method to achieve improved MPPT performance [
29].
Calculating the tracking efficiency of the corresponding control technologies is necessary to compare the tracking effects of several control technologies more clearly. The calculation formulas are shown in Equations (19) and (20).
4.1. Simulation Under STC
Under standard test conditions (STC), all five PV modules maintained the nominal irradiance level (1000 W/m
2) and temperature (25 °C). The photovoltaic array exhibited a single-peak characteristic in its P-V curve, as demonstrated in
Figure 10. In this configuration, the maximum power output reached 8518 W, with the MPP voltage and current measured at 290 V and 29.37 A, respectively. Five distinct control techniques were evaluated through simulations spanning 1.2 s.
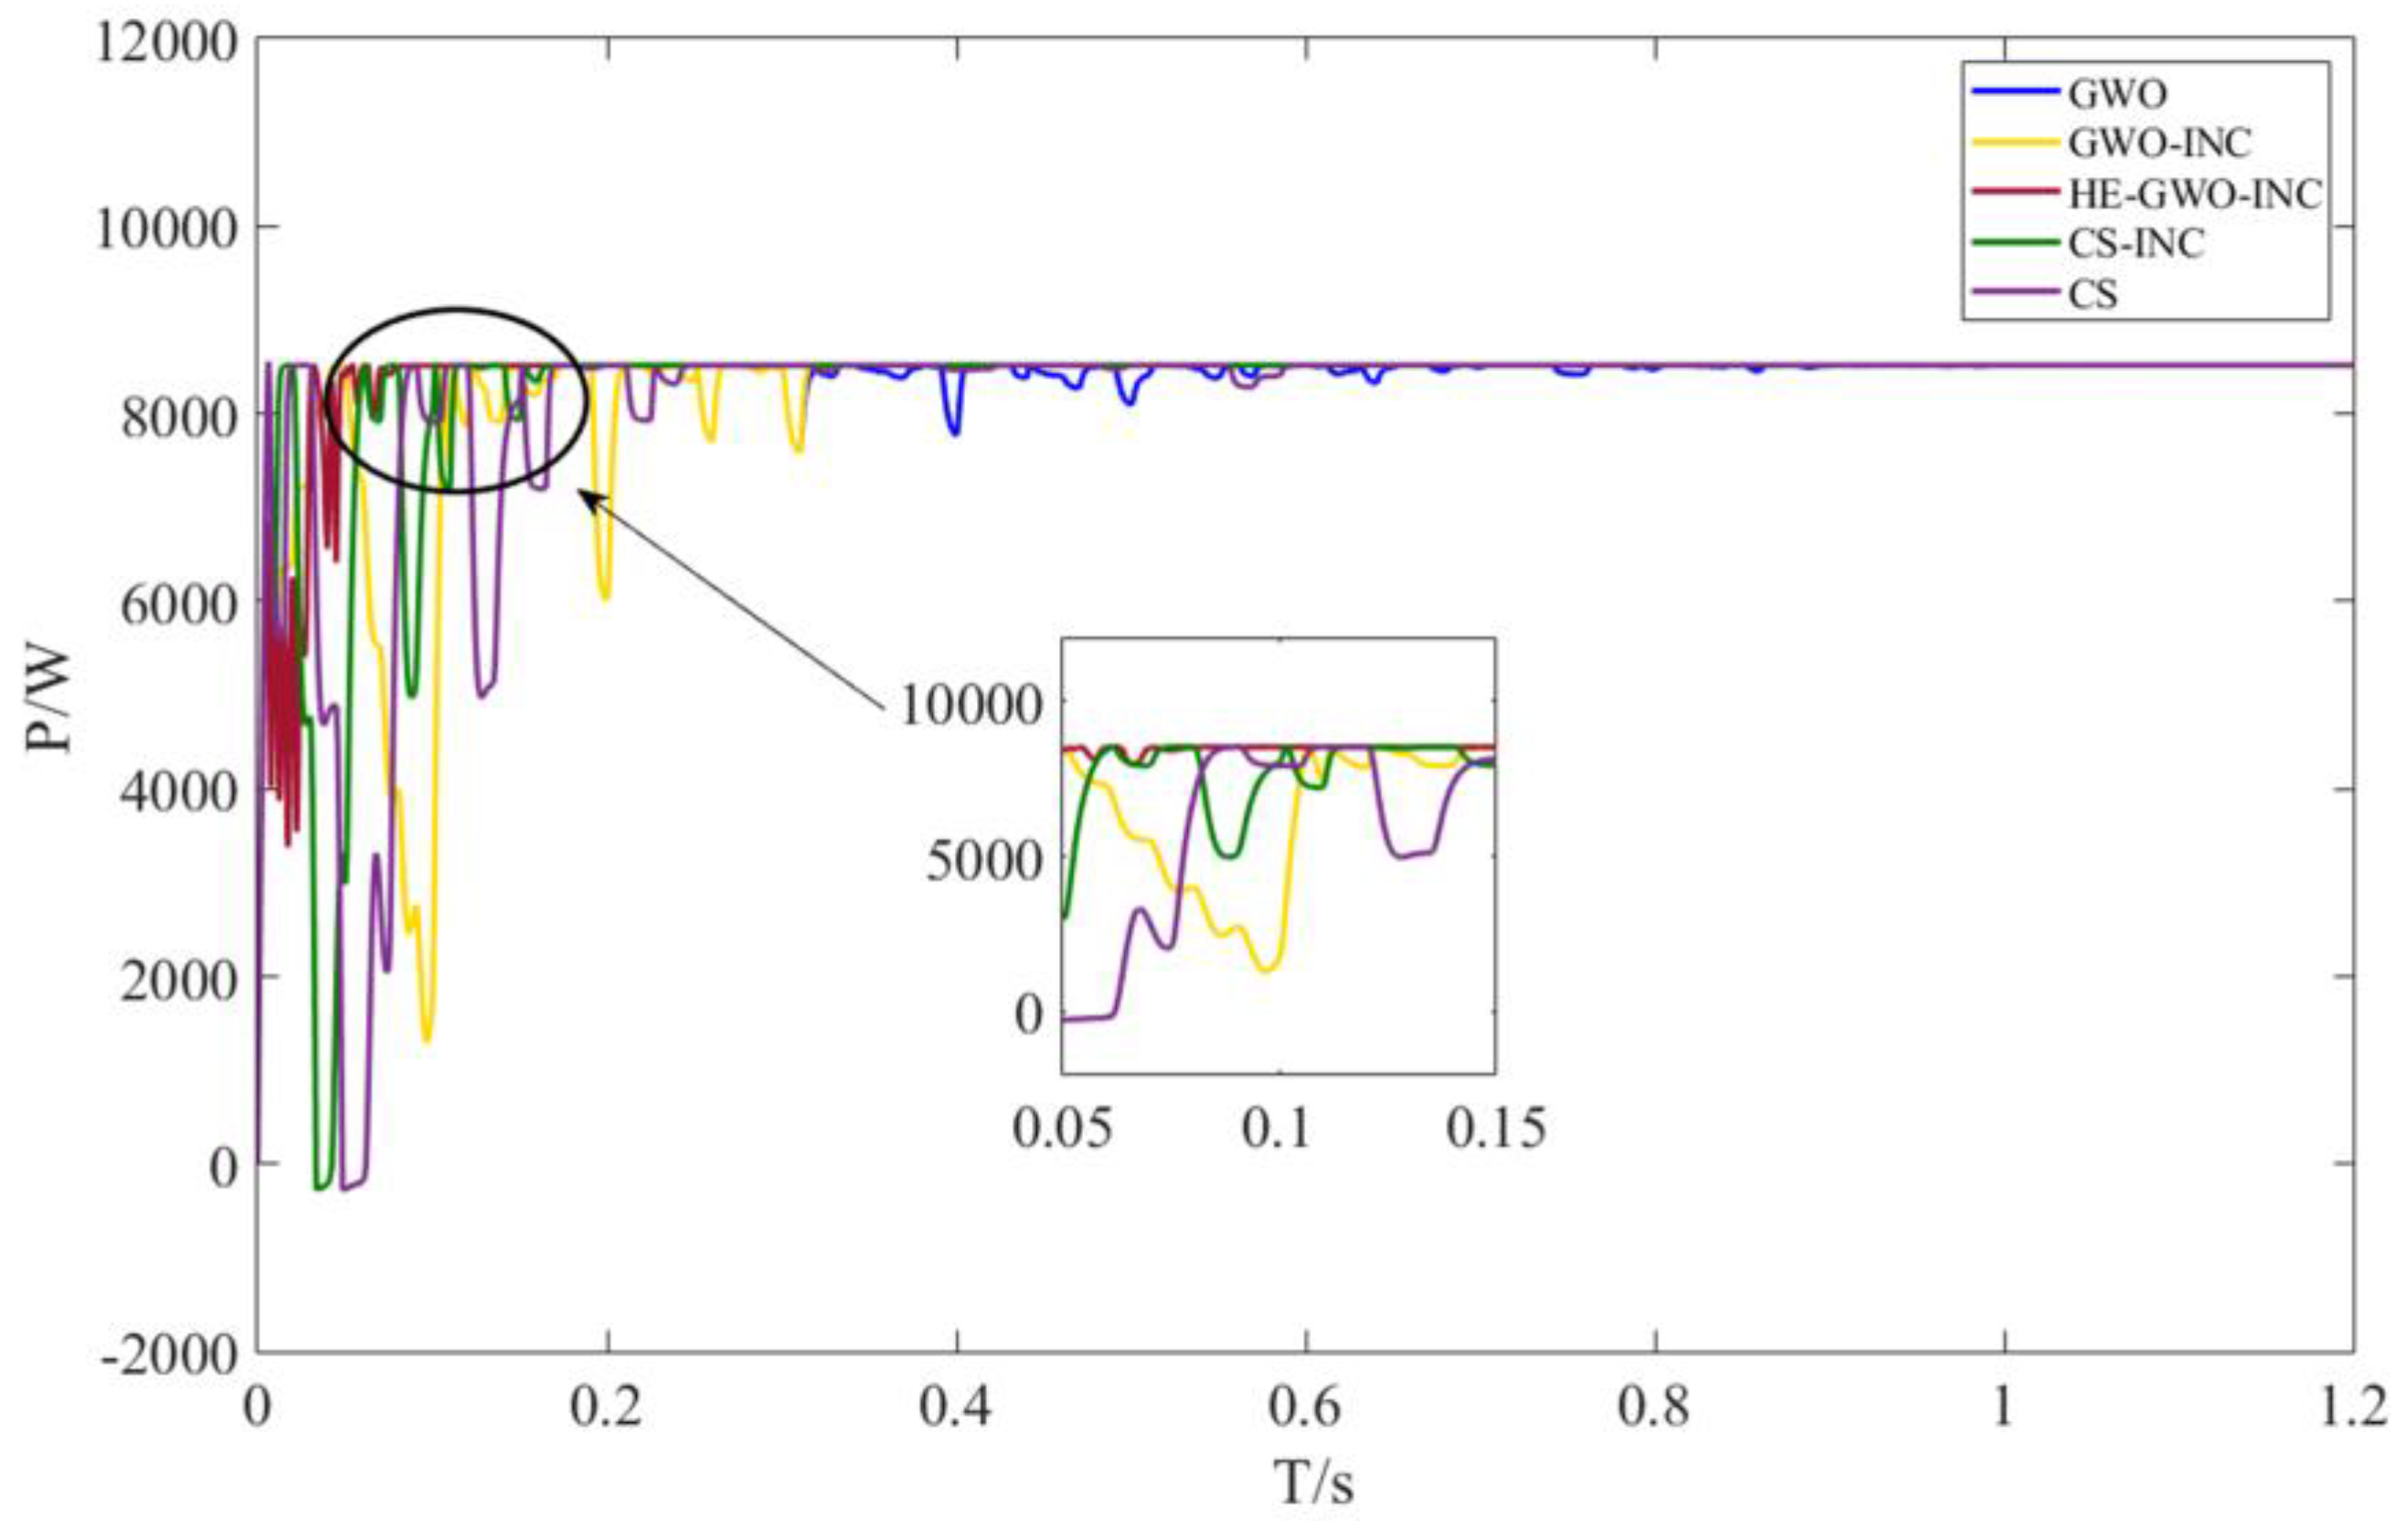
The simulation results presented in
Figure 11 indicate that the HE-GWO-INC algorithm offers considerable advantages in both speed and stability during maximum power point tracking.
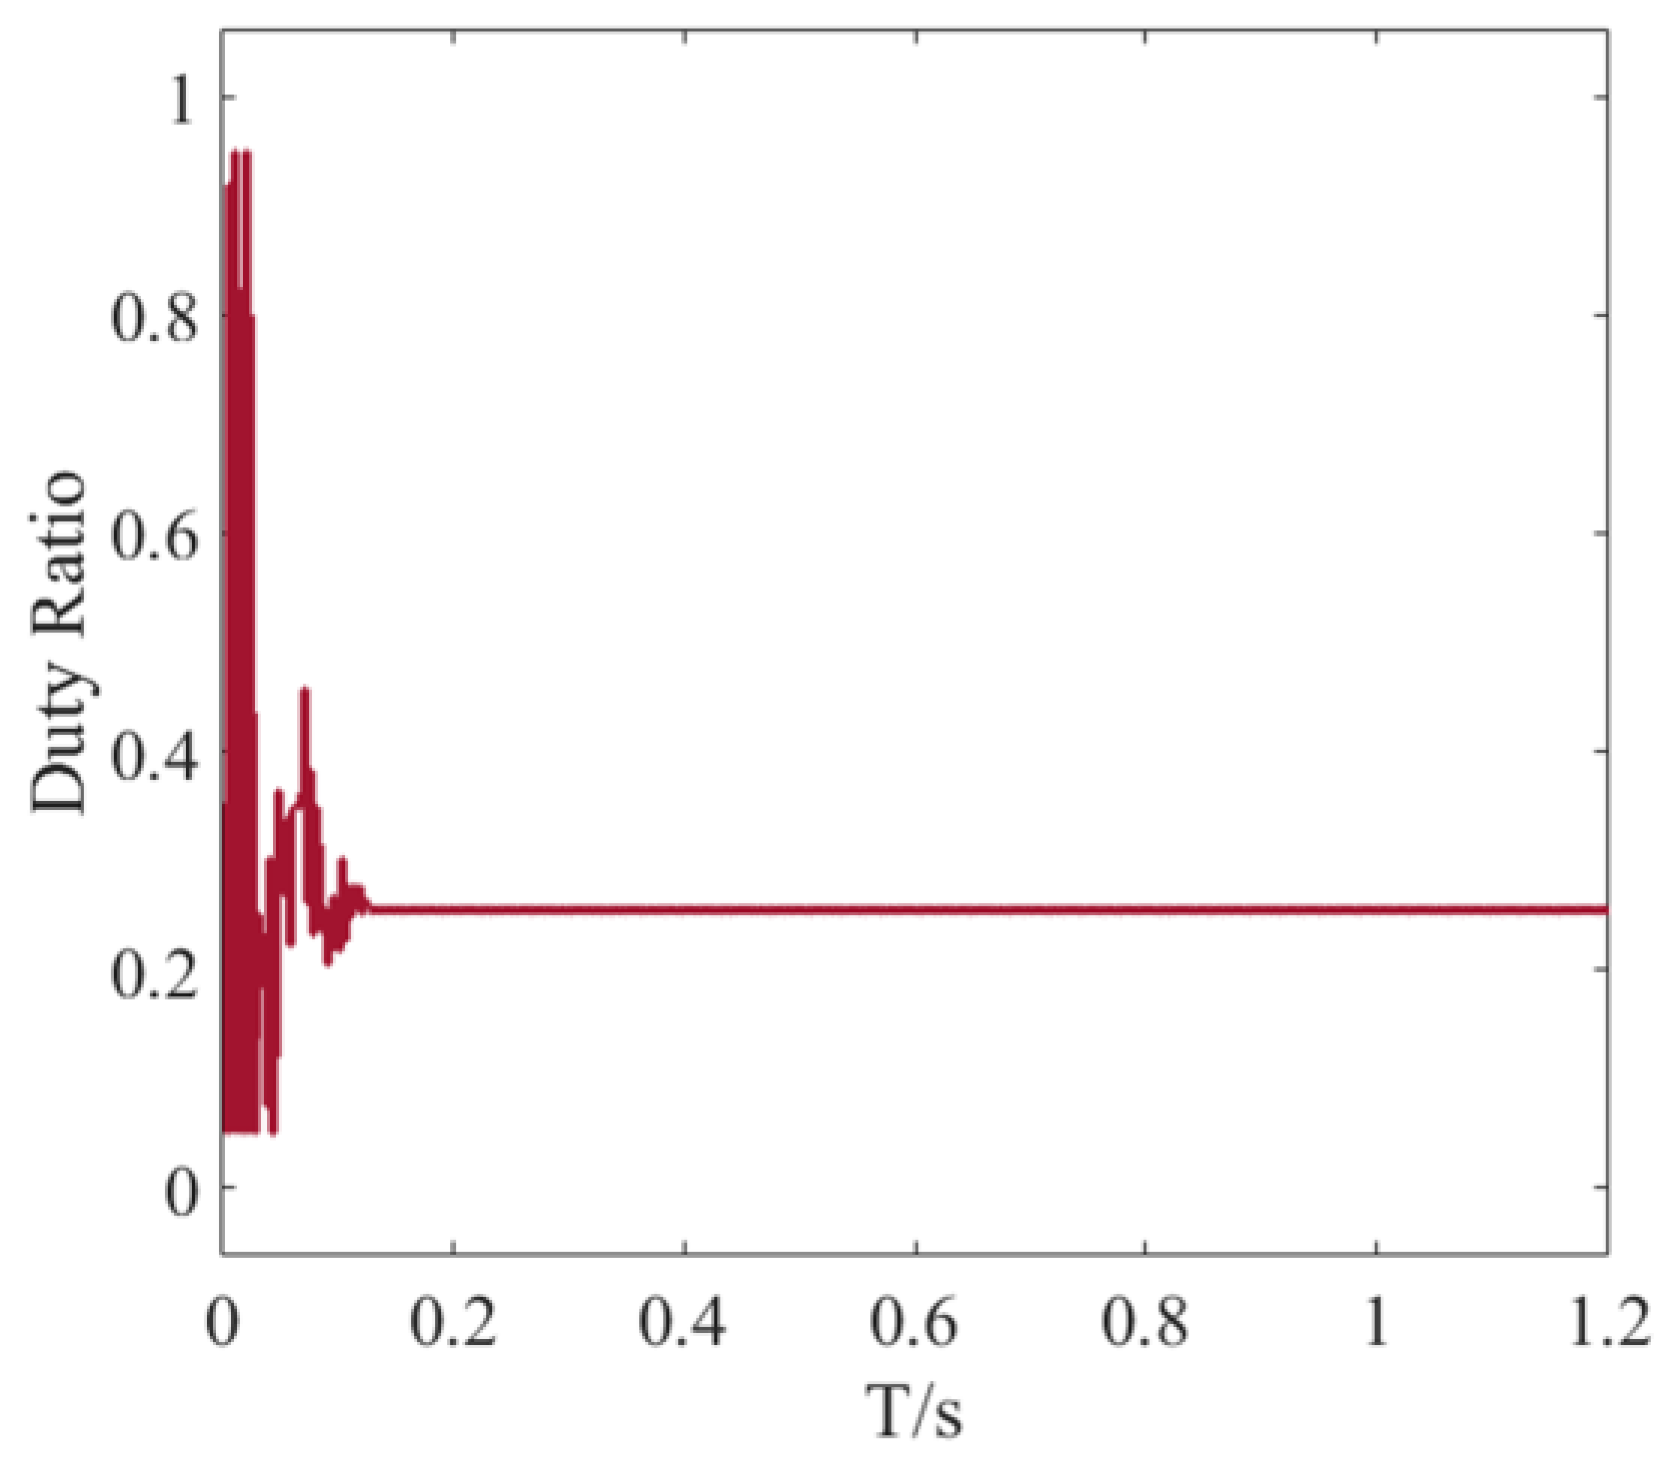
Figure 12 displays the duty cycle output obtained using the HE-GWO-INC algorithm in this scenario. Additionally, the simulation results for STC are systematically summarized in
Table 2.
Simulation data reveal that the HE-GWO-INC algorithm demonstrates significant overall performance advantages. Compared to the second best algorithm, its convergence speed is improved by 57.9%, and steady-state accuracy is enhanced by 61.4%. At the same time, power fluctuation amplitude is suppressed within ±0.3%, further optimized compared to the ±0.5% of the second best algorithm. The simulation results indicate that the algorithm effectively balances the trade-off between dynamic response and steady-state accuracy through a global–local collaborative strategy, achieving superior robustness and reliability under standard conditions. This provides a new solution for efficient energy management in photovoltaic systems.
4.2. Simulation Results Under Static Shading
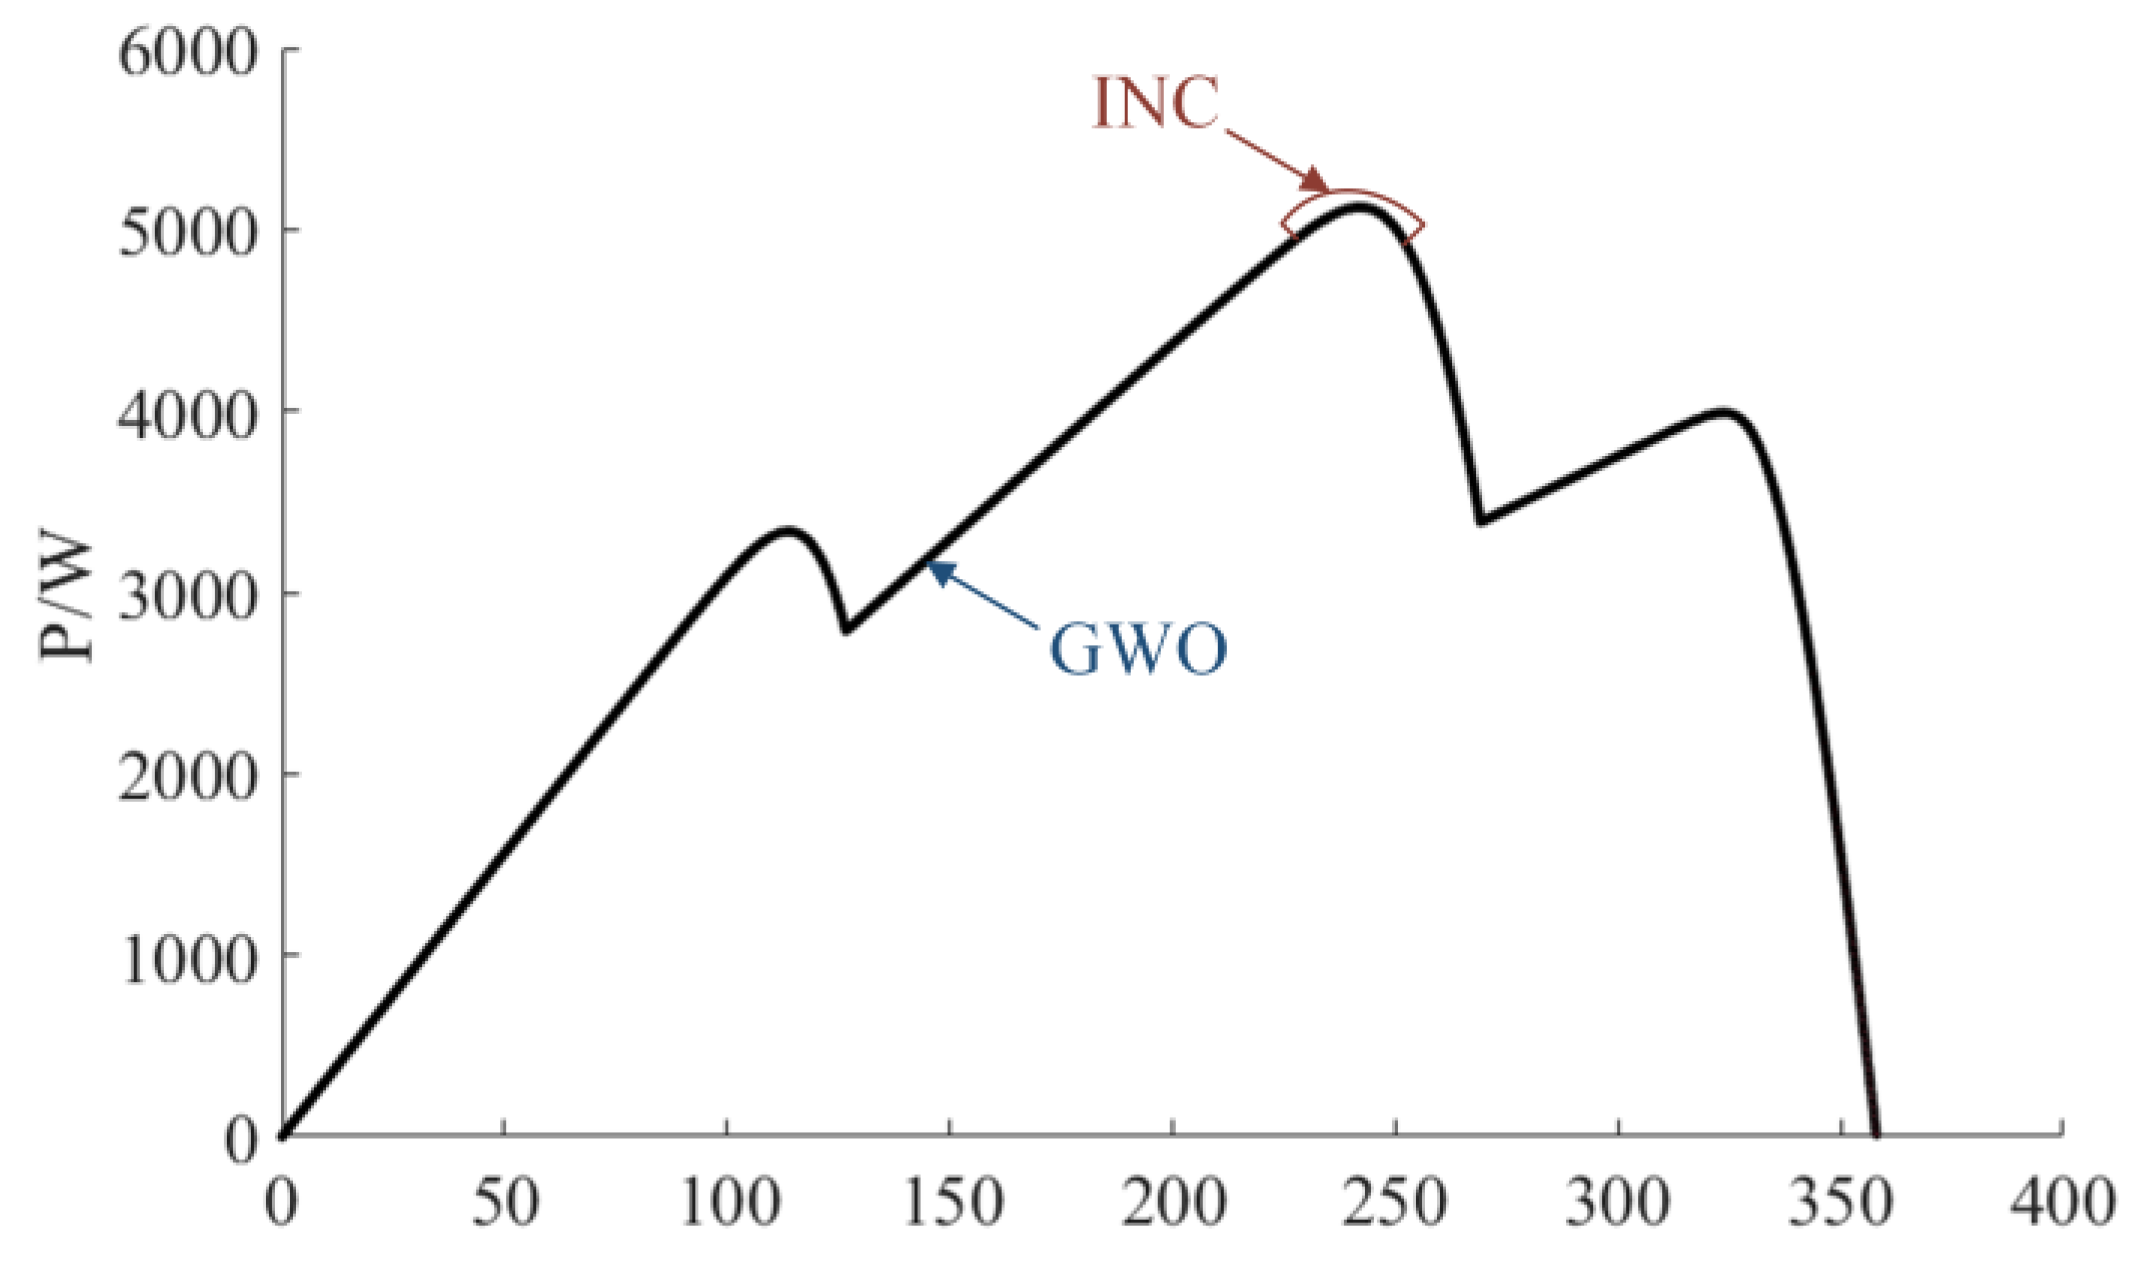
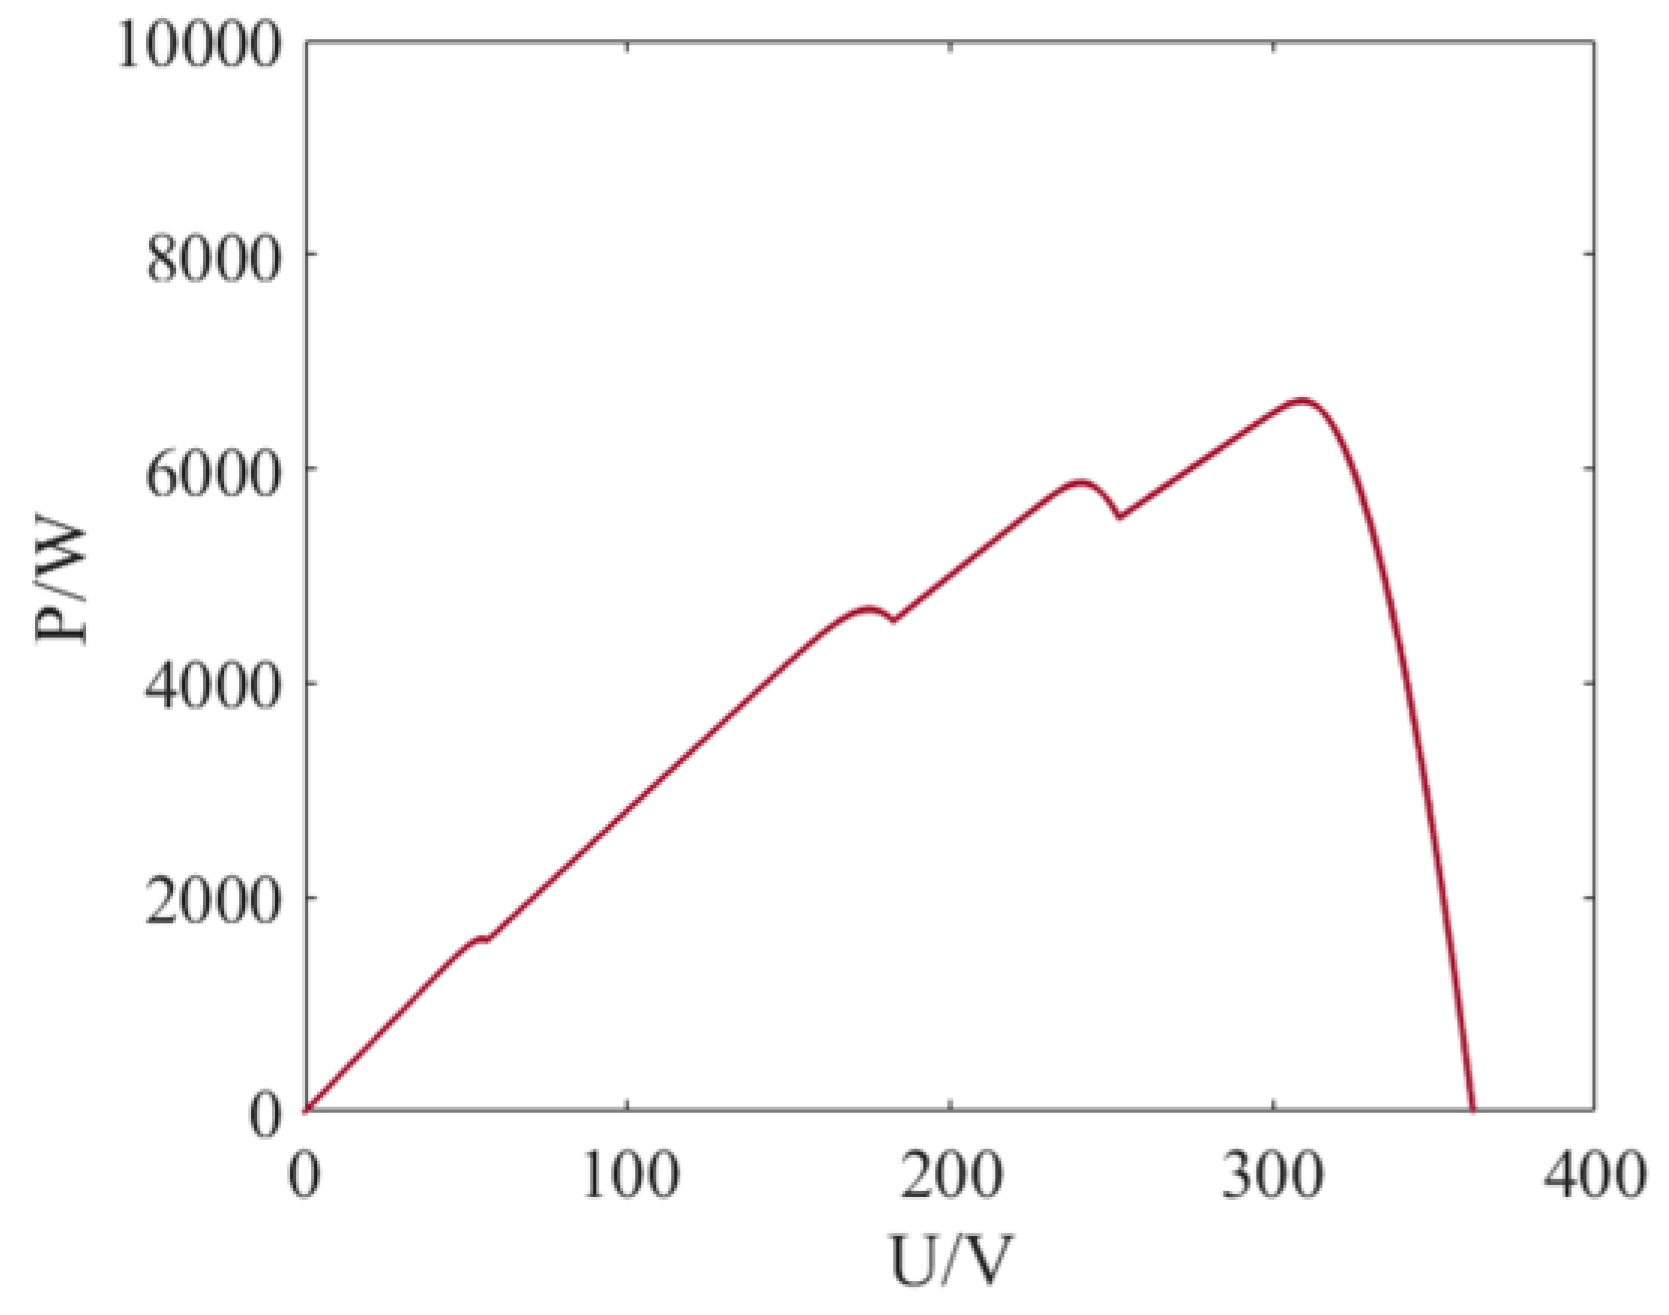
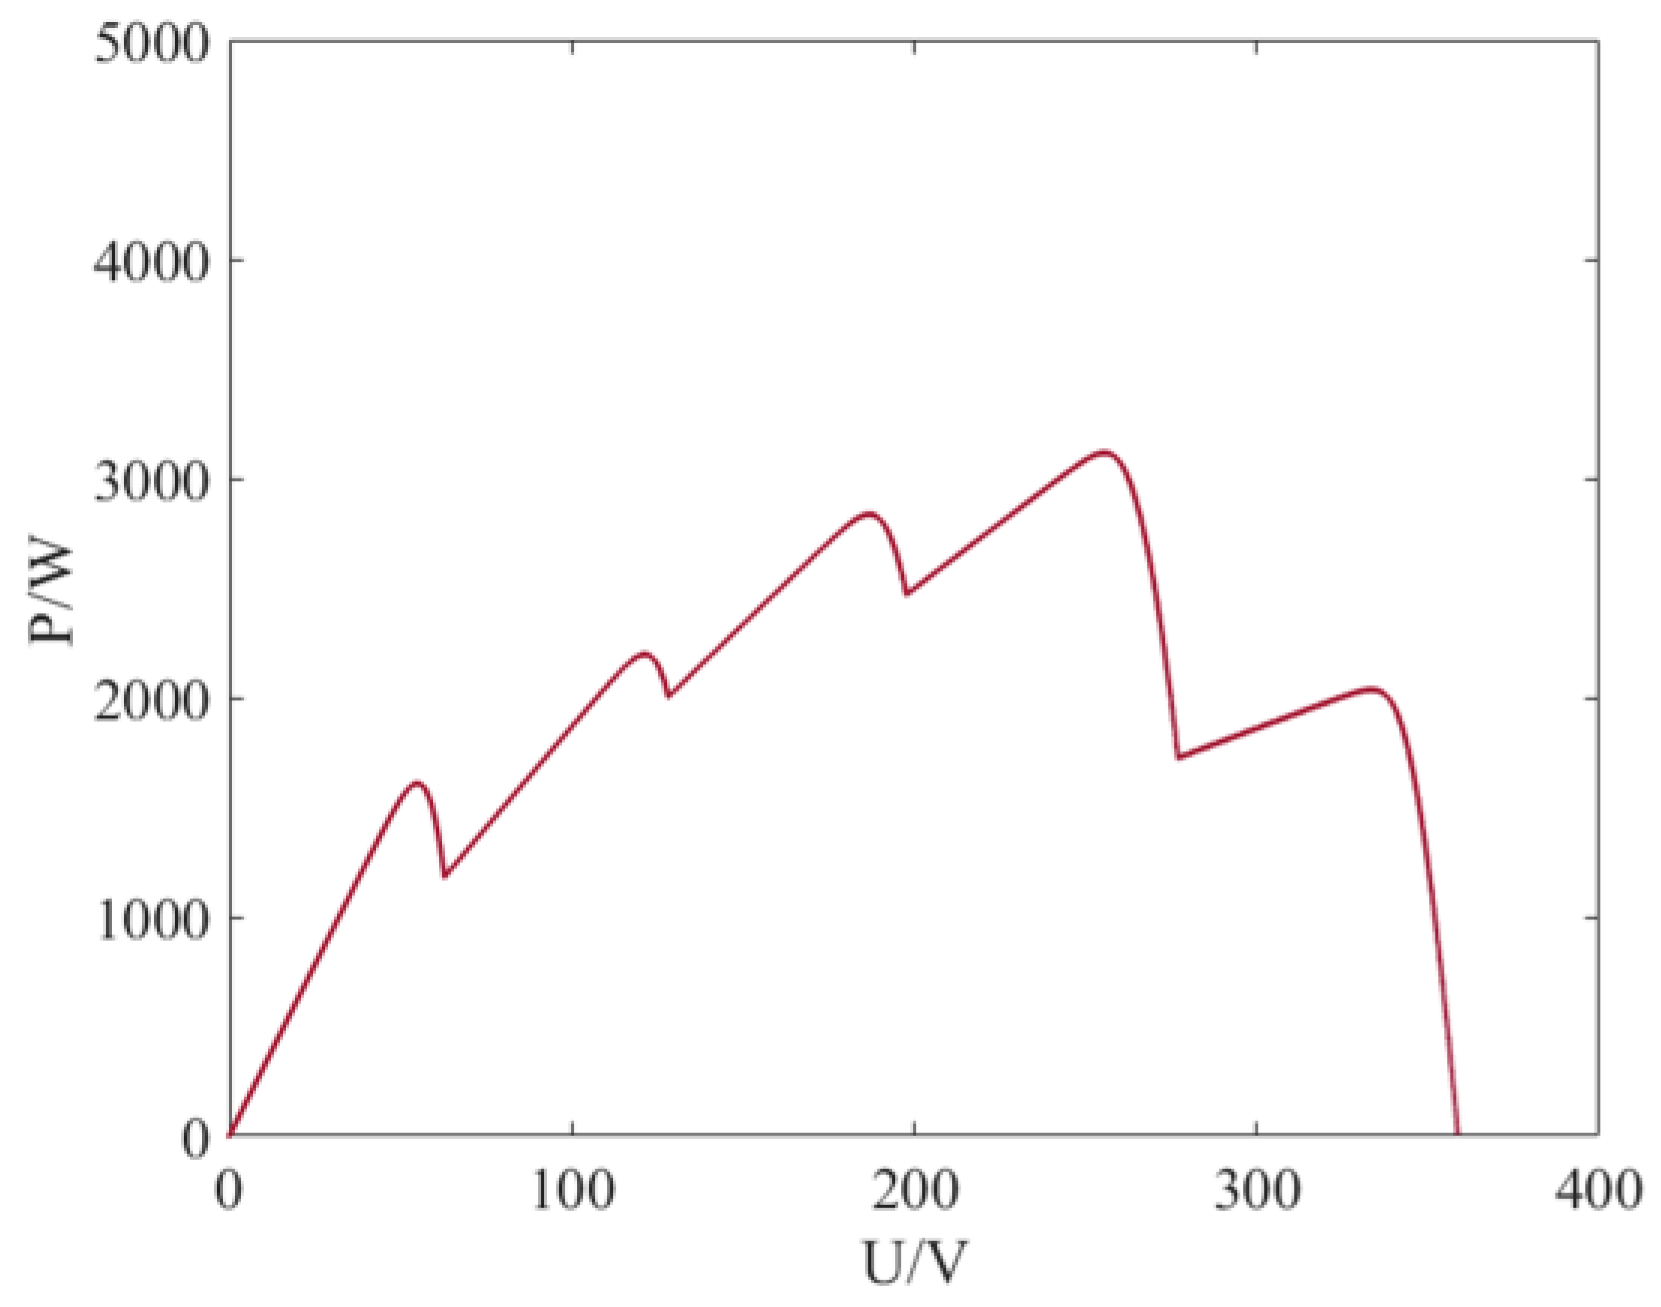
Under cloudy weather scenarios with non-uniform irradiance distribution, the partial shading effect causes the P-V characteristic curve of the photovoltaic array to exhibit multiple peaks, revealing the nonlinear output characteristics of photovoltaic systems under complex irradiance conditions. The experiment simulates the shading effect observed in real engineering applications by employing a gradient irradiance configuration of [1000, 800, 700, 900, 900] W/m
2 and a differentiated temperature distribution of [25, 23.5, 23, 24, 24] °C. As shown in
Figure 13, the P-V curve under this condition contains four local extrema, with the global maximum power point at 6634 W, representing a 22.0% power output reduction compared to STC. This phenomenon highlights the significant impact of partial shading on photovoltaic energy conversion efficiency, necessitating intelligent optimization algorithms for precise maximum power tracking in multi-peak scenarios.
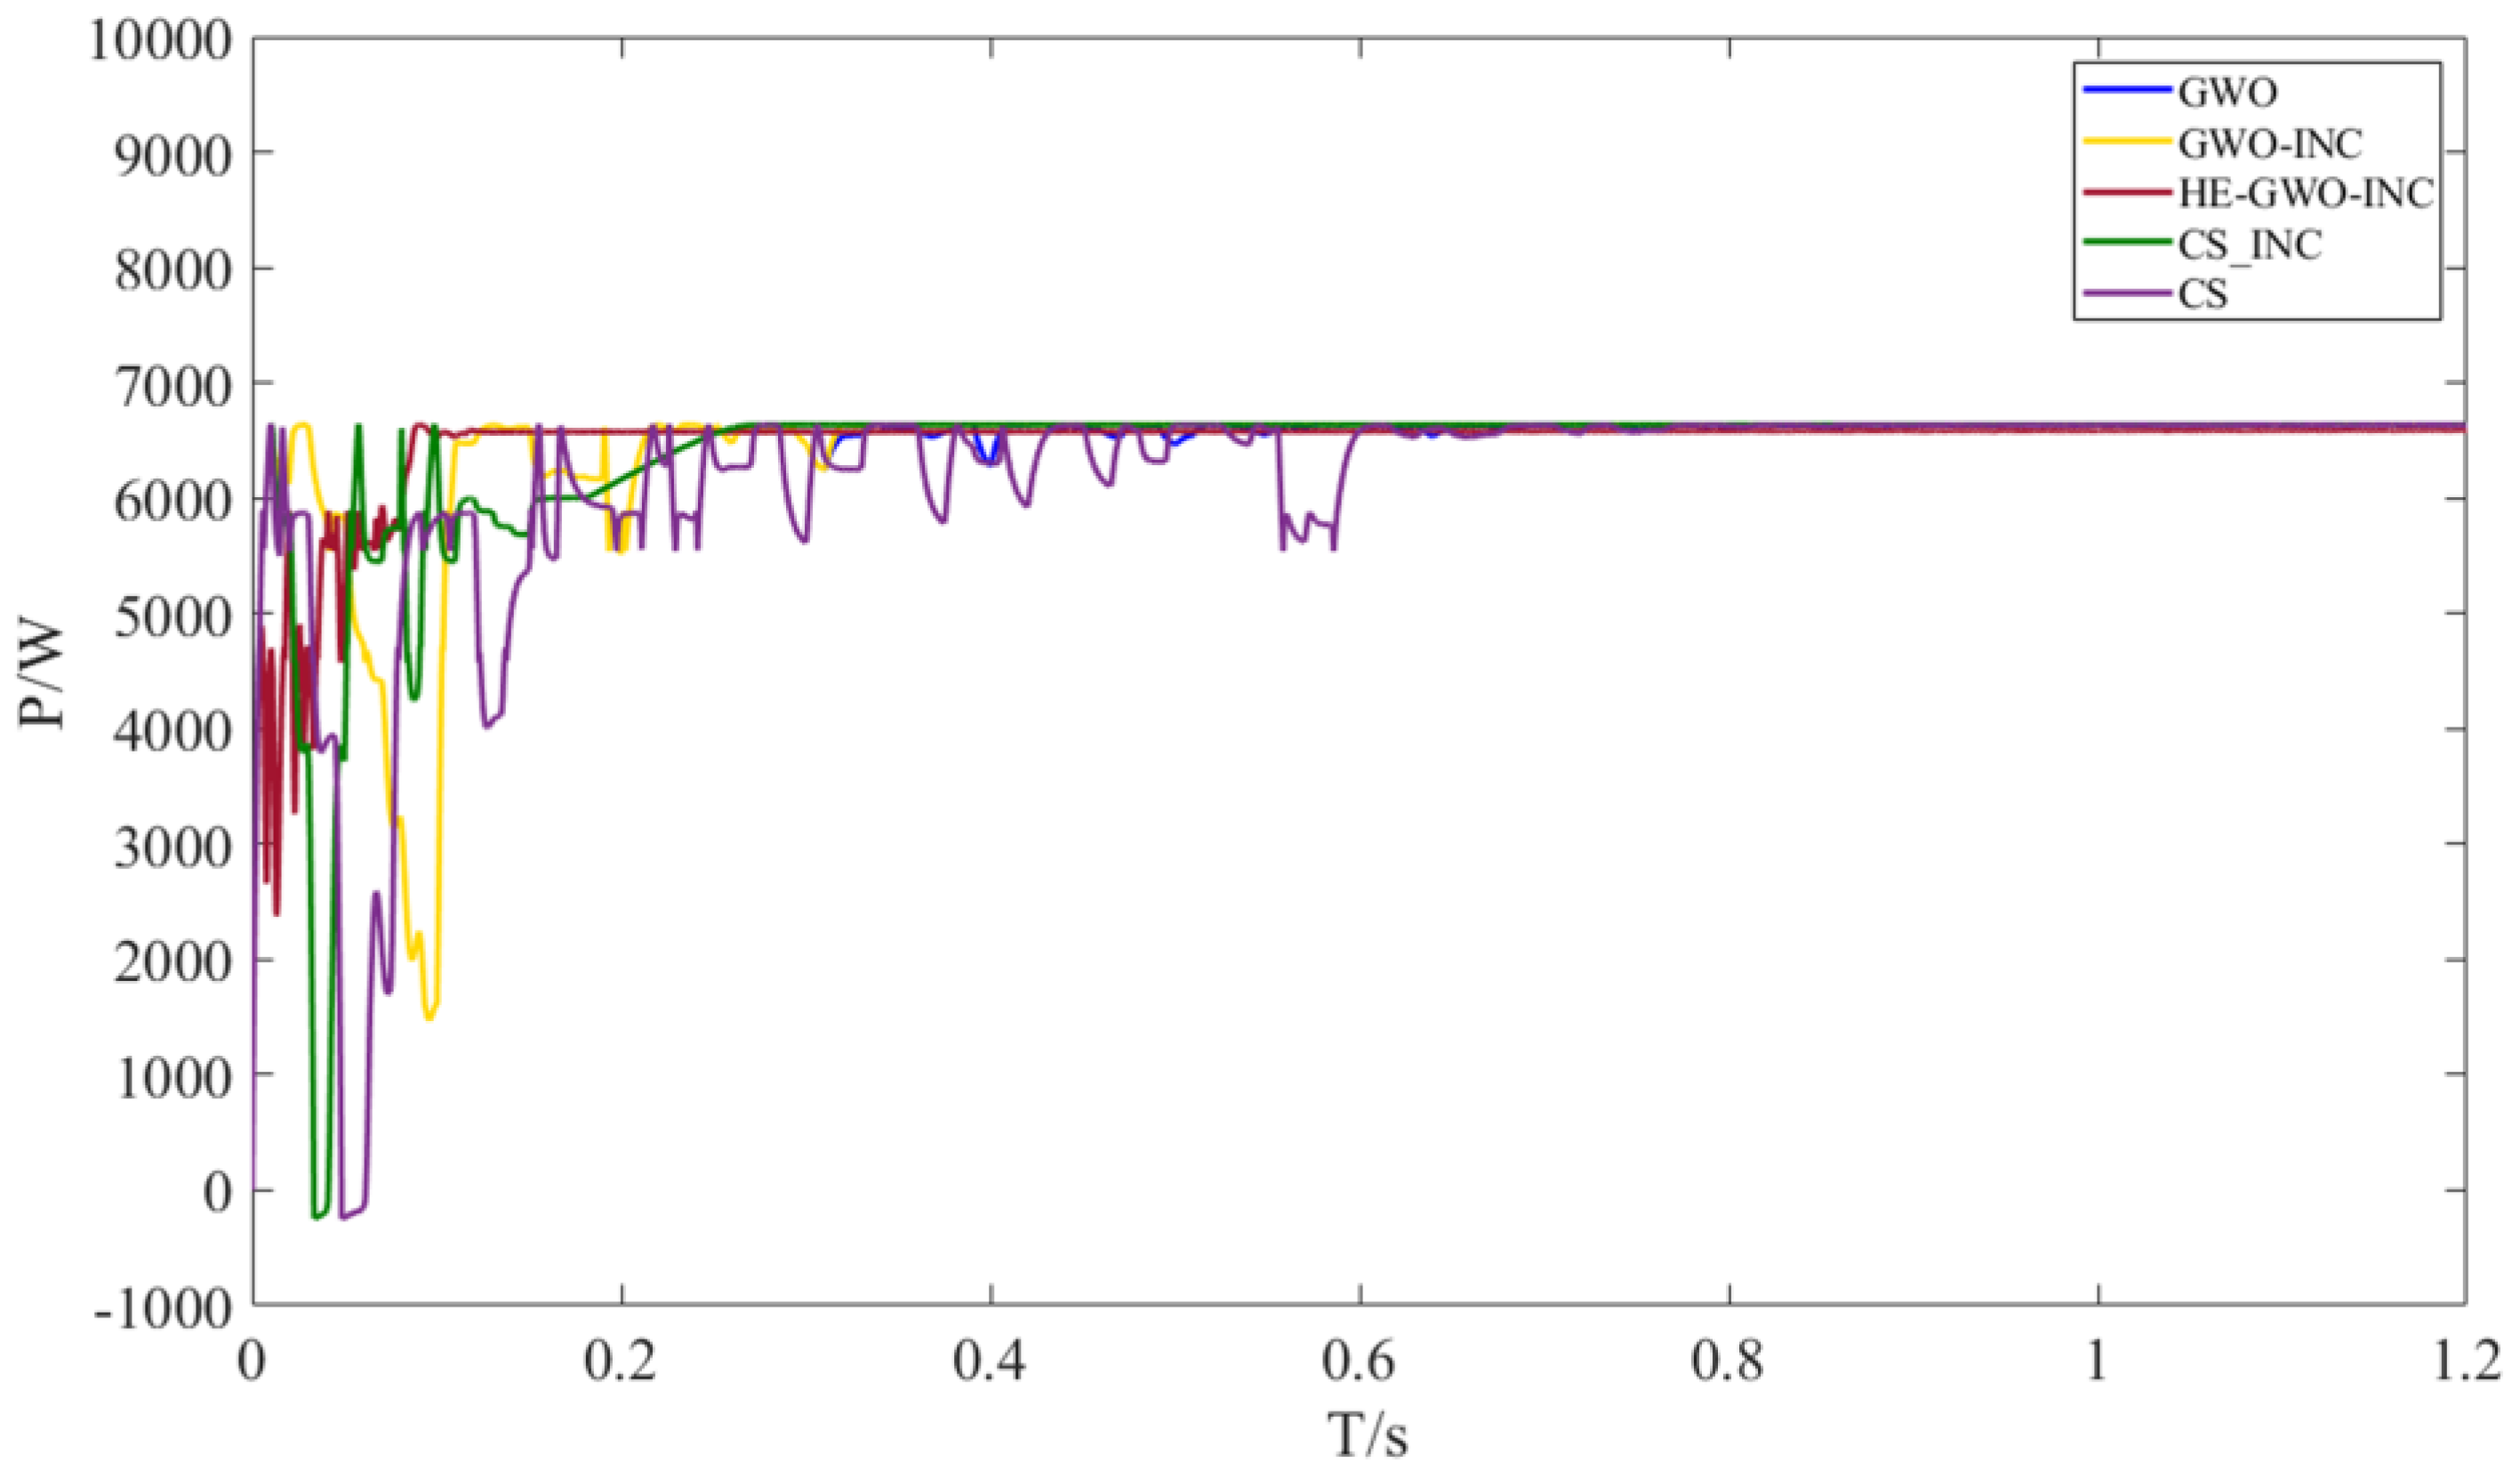
The simulation experiment under static shading conditions reveals the differences in global optimization capabilities among various MPPT algorithms in complex P-V characteristic surfaces. As shown in
Figure 14, the HE-GWO-INC algorithm achieves fast and precise MPP tracking in multi-peak scenarios by integrating the global rapid search capability of the improved GWO with the gradient tracking mechanism of the enhanced INC method. Its dynamic adjustment process is smooth, with no significant overshoot. In contrast, traditional hybrid algorithms, constrained by fixed step-size strategies and sensitivity to local extrema, exhibit a clear trade-off between convergence speed and steady-state accuracy. Meanwhile, basic intelligent algorithms, lacking a gradient-guided mechanism, are prone to local optima traps and persistent power oscillations.
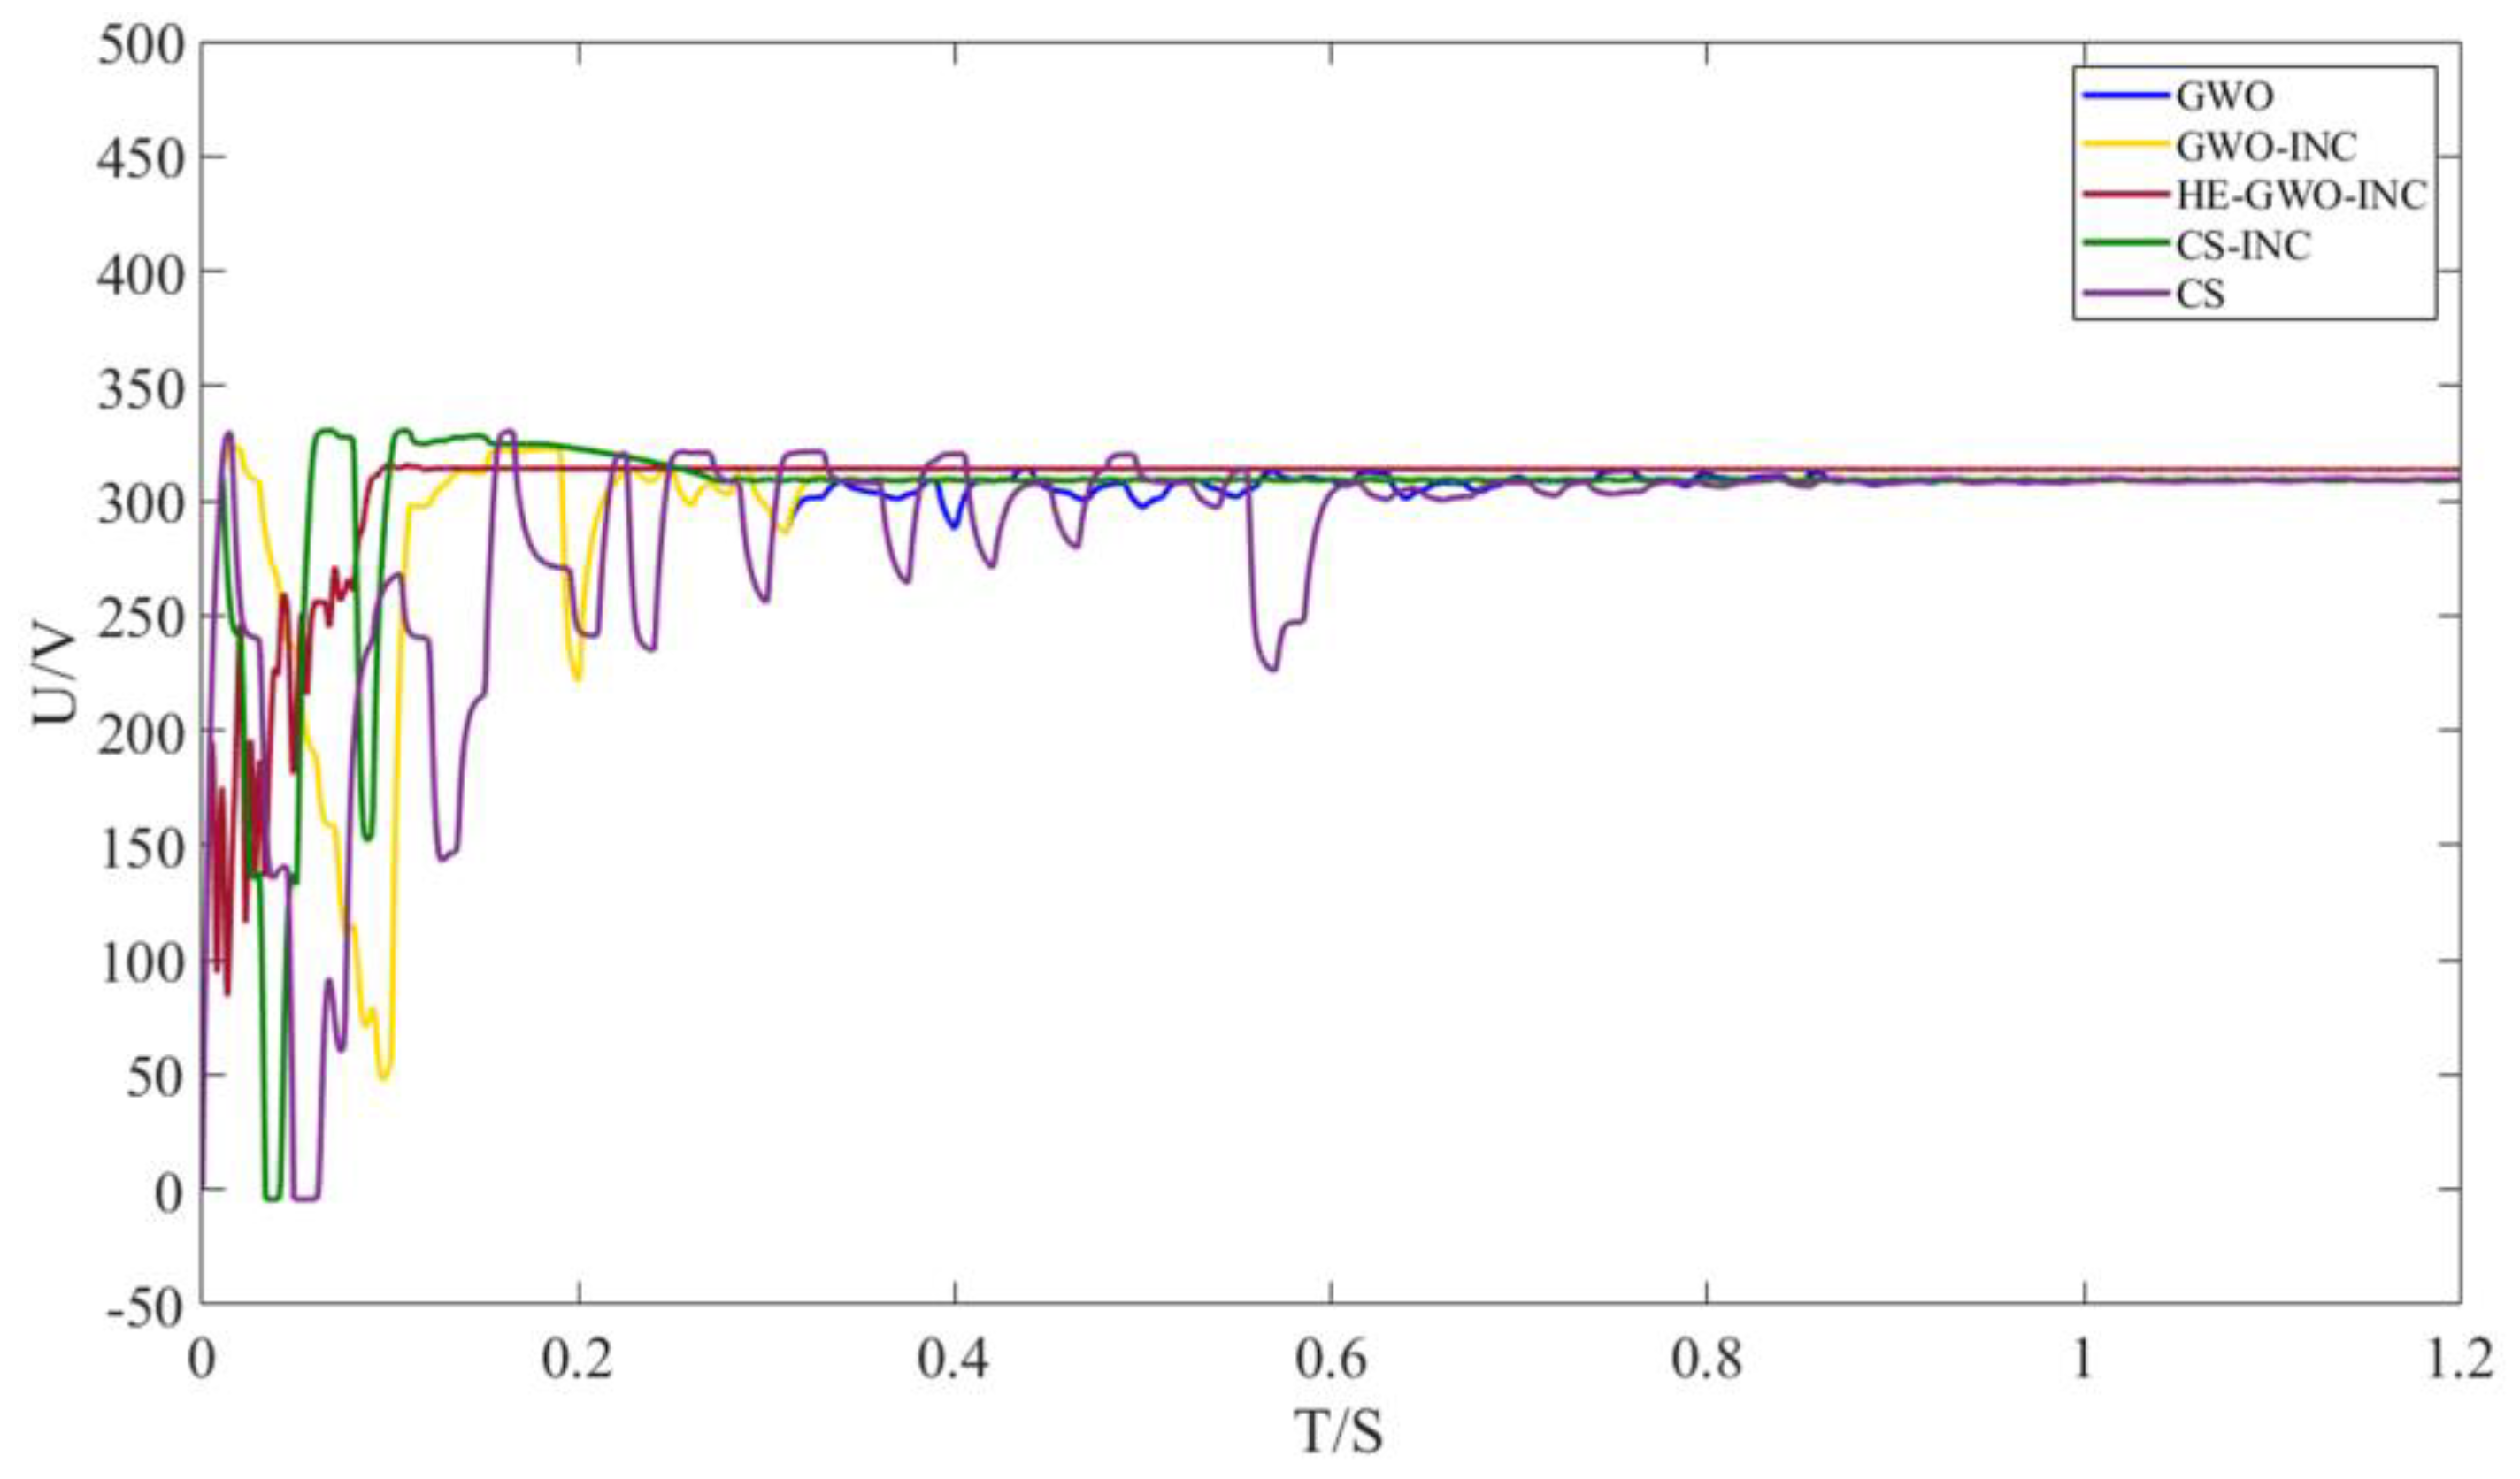
Furthermore,
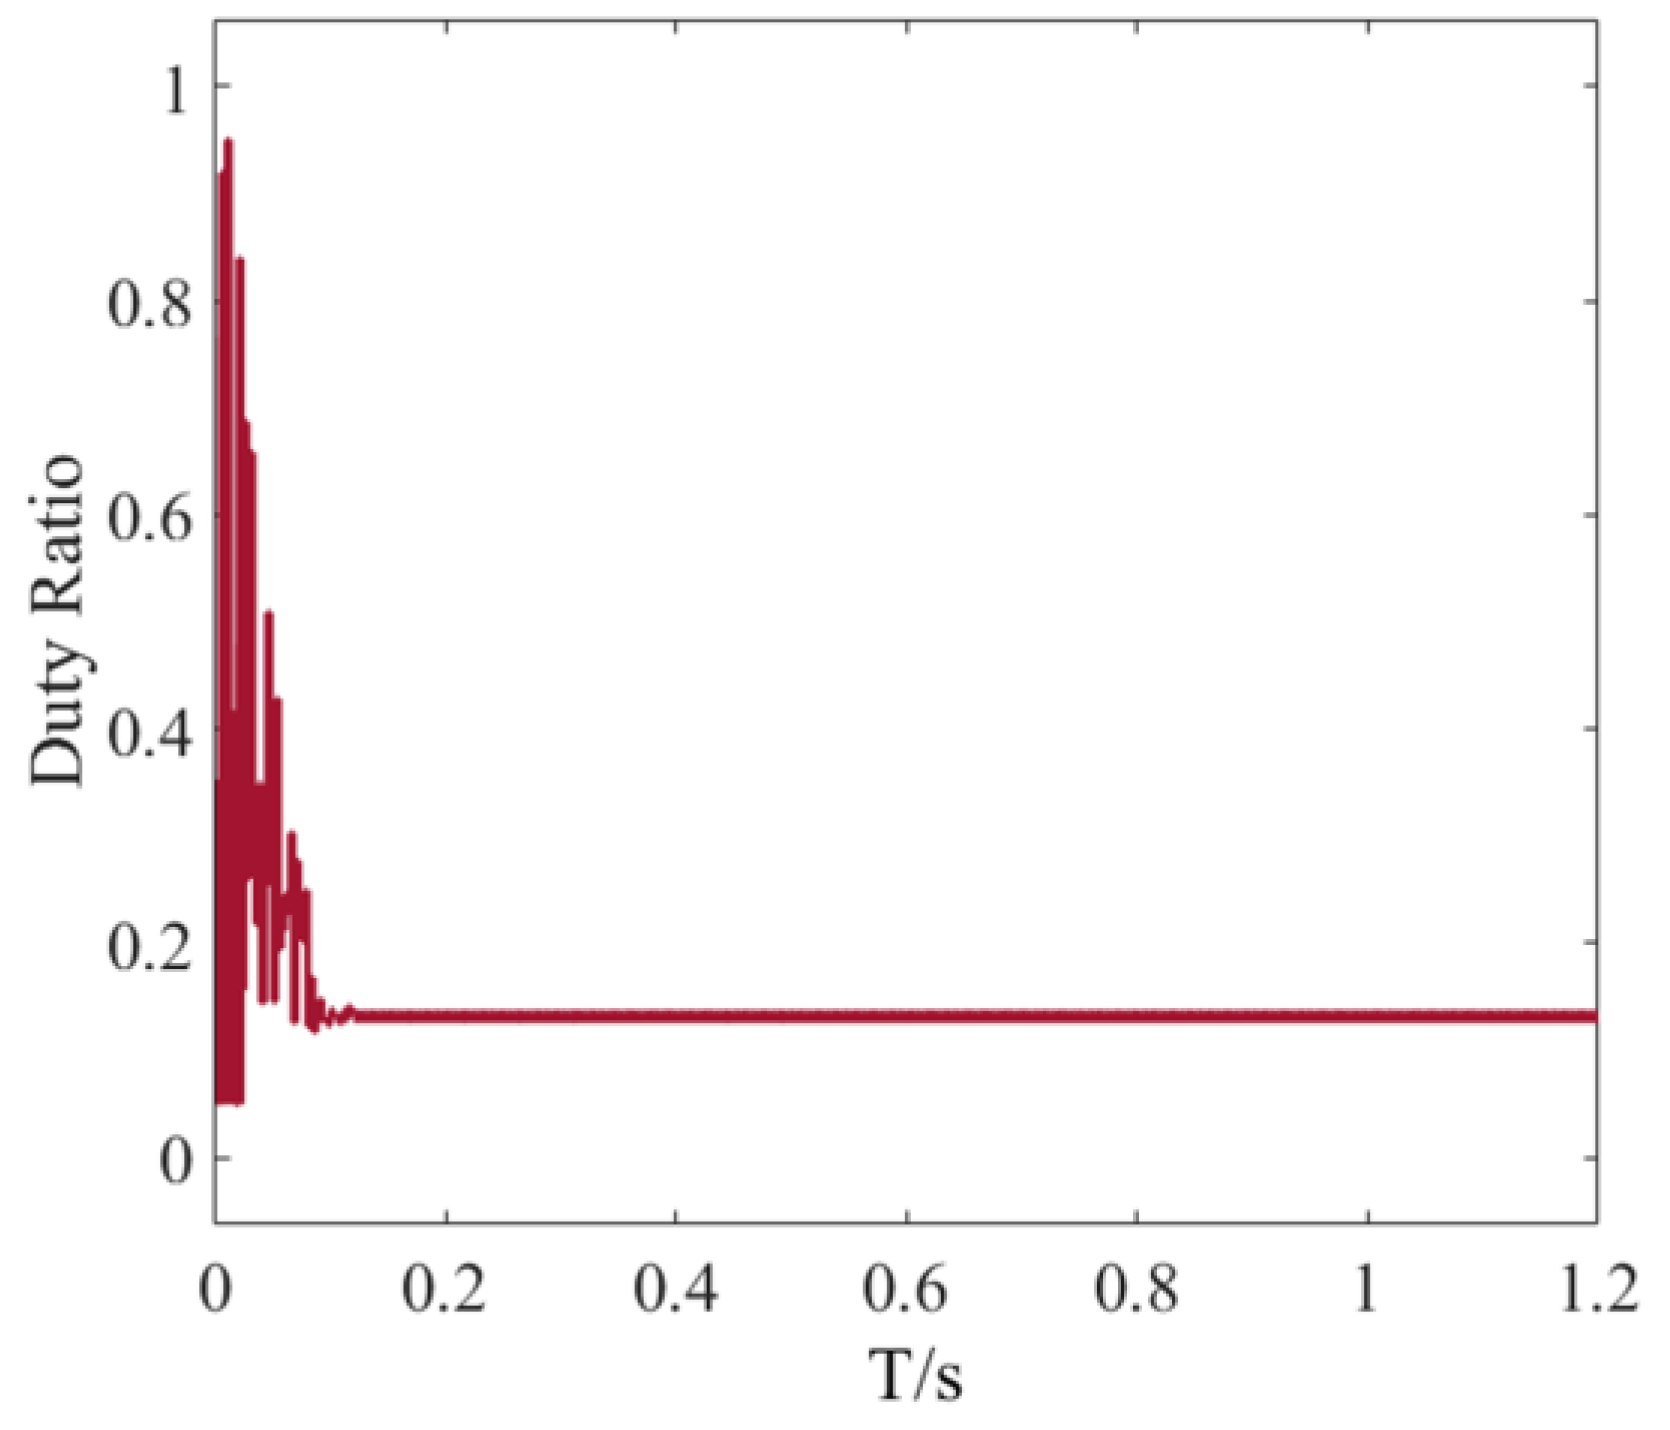
Figure 15 validates the engineering superiority of the hybrid architecture through voltage–time (V-T) dynamic response curves: HE-GWO-INC synergizes directional memory factors with adaptive boundary constraints, suppressing voltage ripple while attaining rapid steady-state convergence. The duty cycle output using the HE-GWO-INC algorithm in this scenario is shown in
Figure 16.
Table 3 systematically presents the quantitative simulation results for static shading conditions. Using the global maximum power reference value (6634 W) as a benchmark, the HE-GWO-INC algorithm demonstrates significant advantages in convergence speed and power stability: its convergence speed is improved by 57.9% compared to the second best algorithm, power fluctuation is strictly controlled within ±0.3%, and the relative error remains below 0.025%.
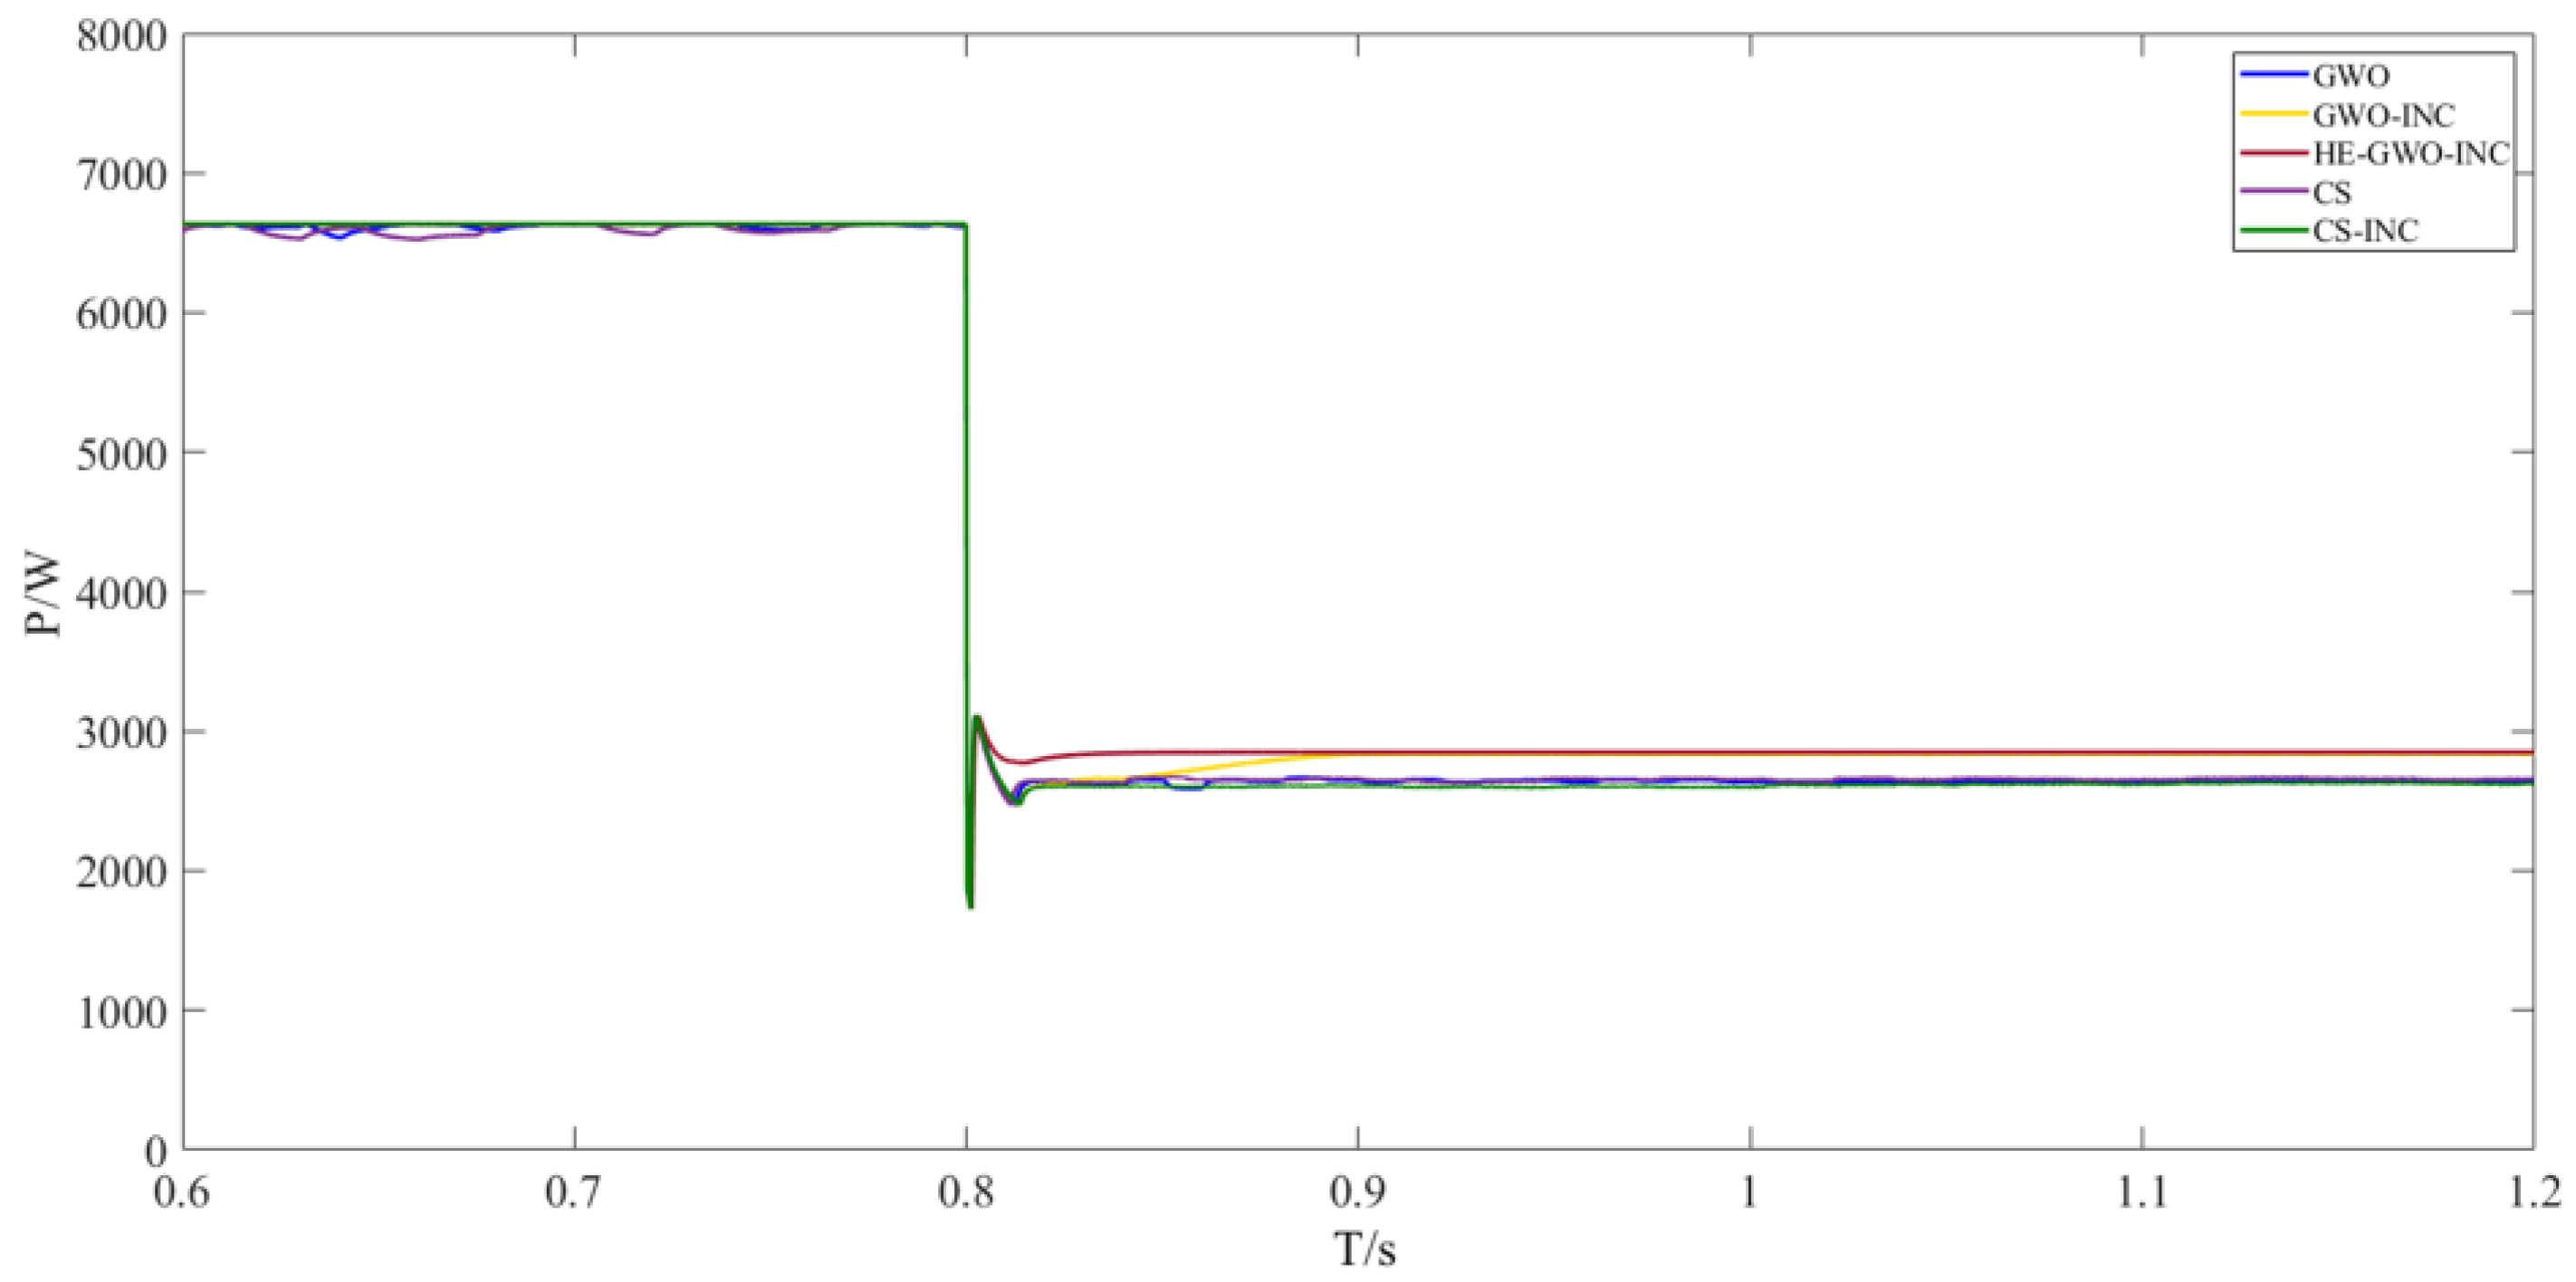
4.3. Simulation Results Under Dynamic Shading
In practical engineering scenarios, partial shading is often time-varying, leading to dynamic evolution in the PV array’s irradiance distribution and temperature profile. This dynamic behavior causes the P-V characteristic curves of PV systems to demonstrate pronounced non-steady-state features under multi-peak conditions. This study designs a simulation framework under dynamic shading conditions to simulate such complex scenarios accurately. At t = 0.8 s, the irradiance of partially shaded PV modules is adjusted to [1000, 400, 200, 600, 500] W/m
2 with the corresponding temperatures updated to [25, 18, 15, 22, 19] °C. The P-V curve under this scenario exhibits dynamic multi-peak evolution, as shown in
Figure 17, with the theoretical maximum power reduced to 3096 W (a 54.1% reduction compared to static shading conditions).
Under dynamic shading conditions, abrupt changes in irradiance distribution and temperature fields occurred across the PV array at t = 0.8 s, posing significant challenges to environmental disturbance perception and dynamic adaptation capabilities of MPPT algorithms. The HE-GWO-INC algorithm proposed in this study integrates a multi-parameter joint criterion module and dynamic threshold triggering mechanism (detailed in
Section 3.3) within its environmental detection framework. This enables condition identification within 0.01 s post-disturbance and initiates candidate solution refocusing procedures.
As demonstrated in
Figure 18, the algorithm achieves power stabilization under the new operating condition within 0.03 s after the abrupt change, attaining 99.3% steady-state power tracking accuracy, thereby validating the efficacy of its optimized environmental mutation response mechanism.
In contrast, conventional hybrid algorithms lacking practical environmental mutation detection logic exhibit 0.05–0.08 s response delays post-condition switching, and foundational intelligent algorithms constrained by fixed iteration cycles suffer from persistent power deviations and oscillations under dynamic shading scenarios.
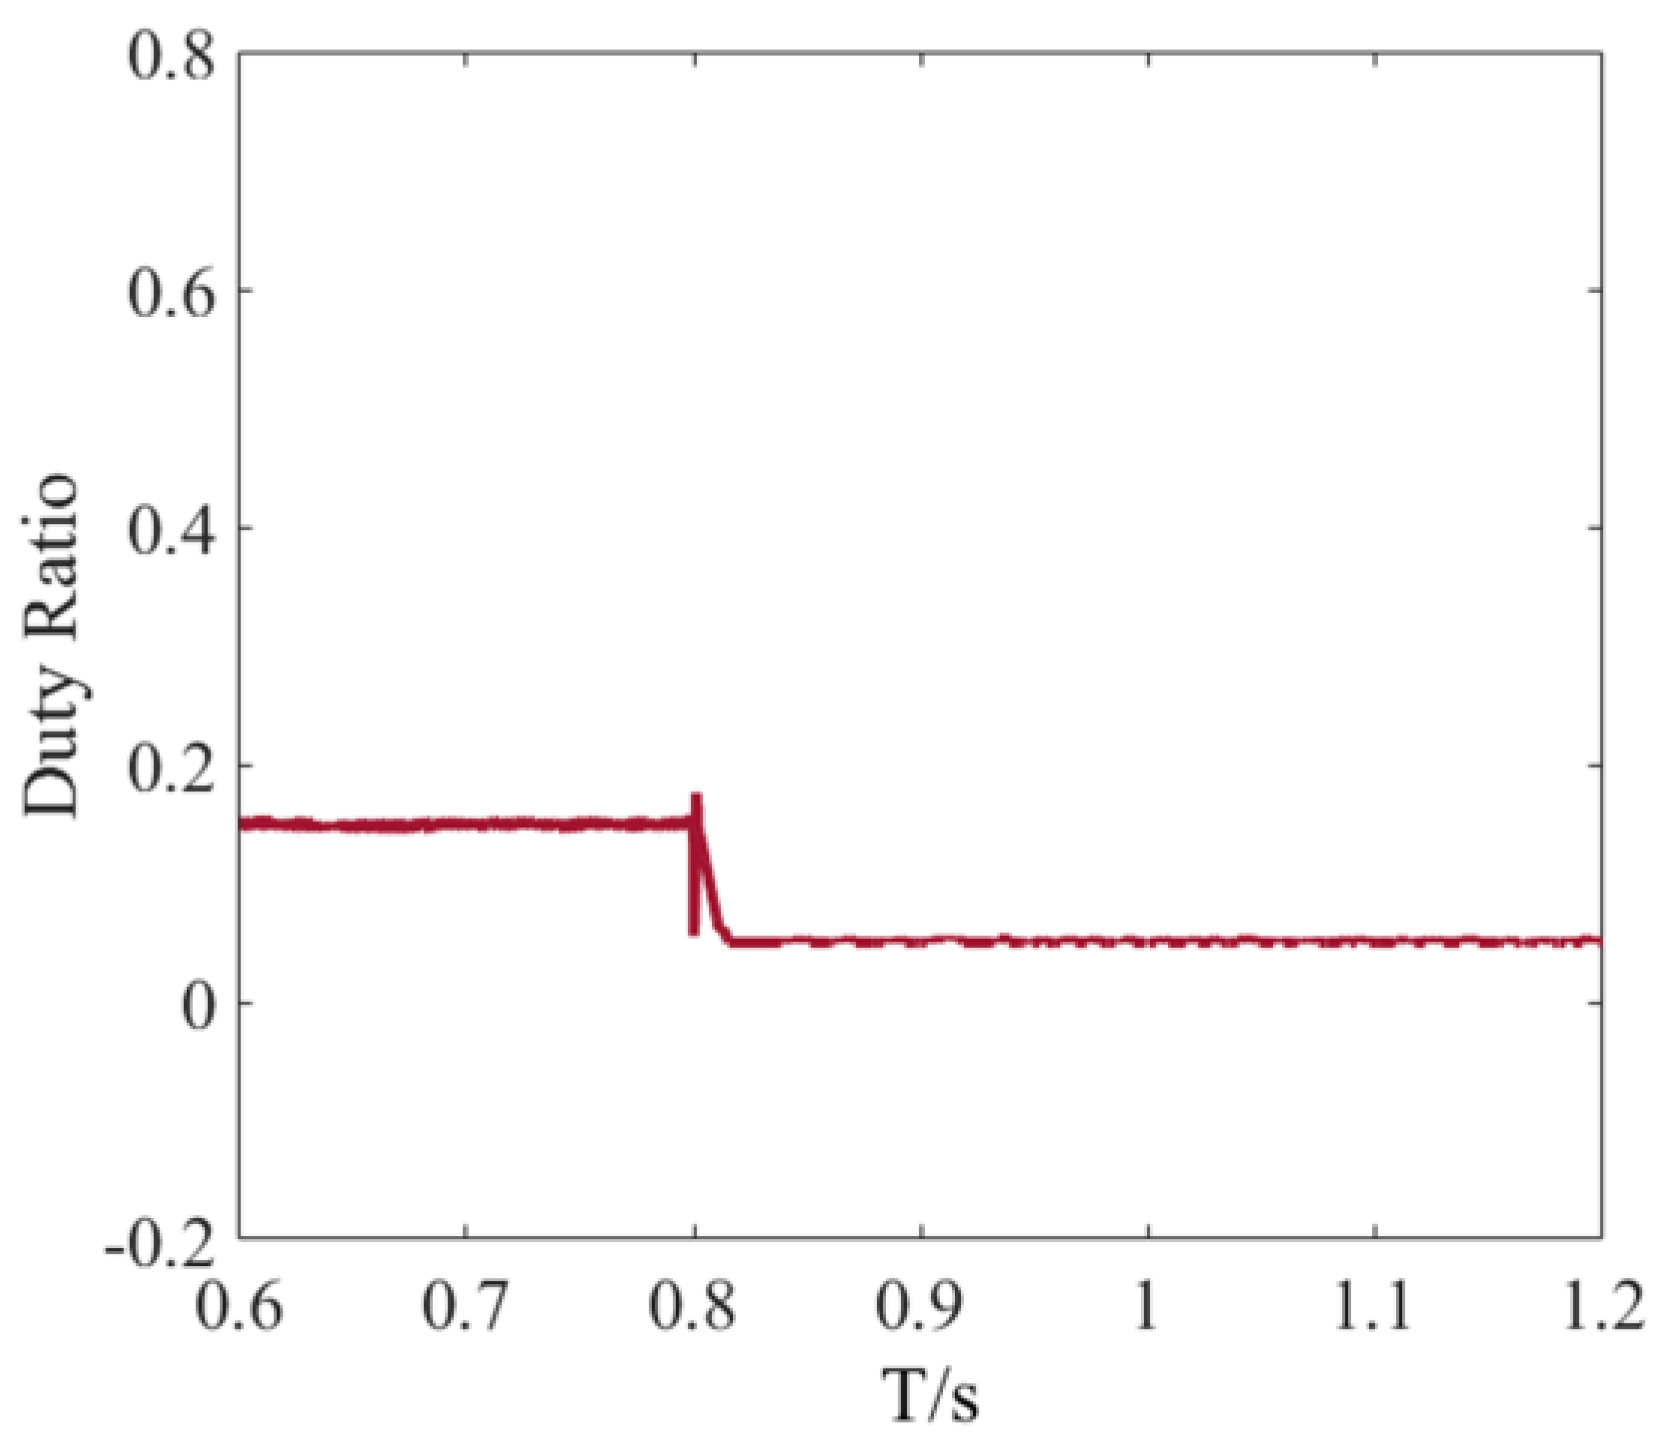
Figure 19 shows the duty cycle output using the HE-GWO-INC algorithm in this scenario.
Table 4 quantifies the performance metrics of all algorithms under dynamic shading conditions.
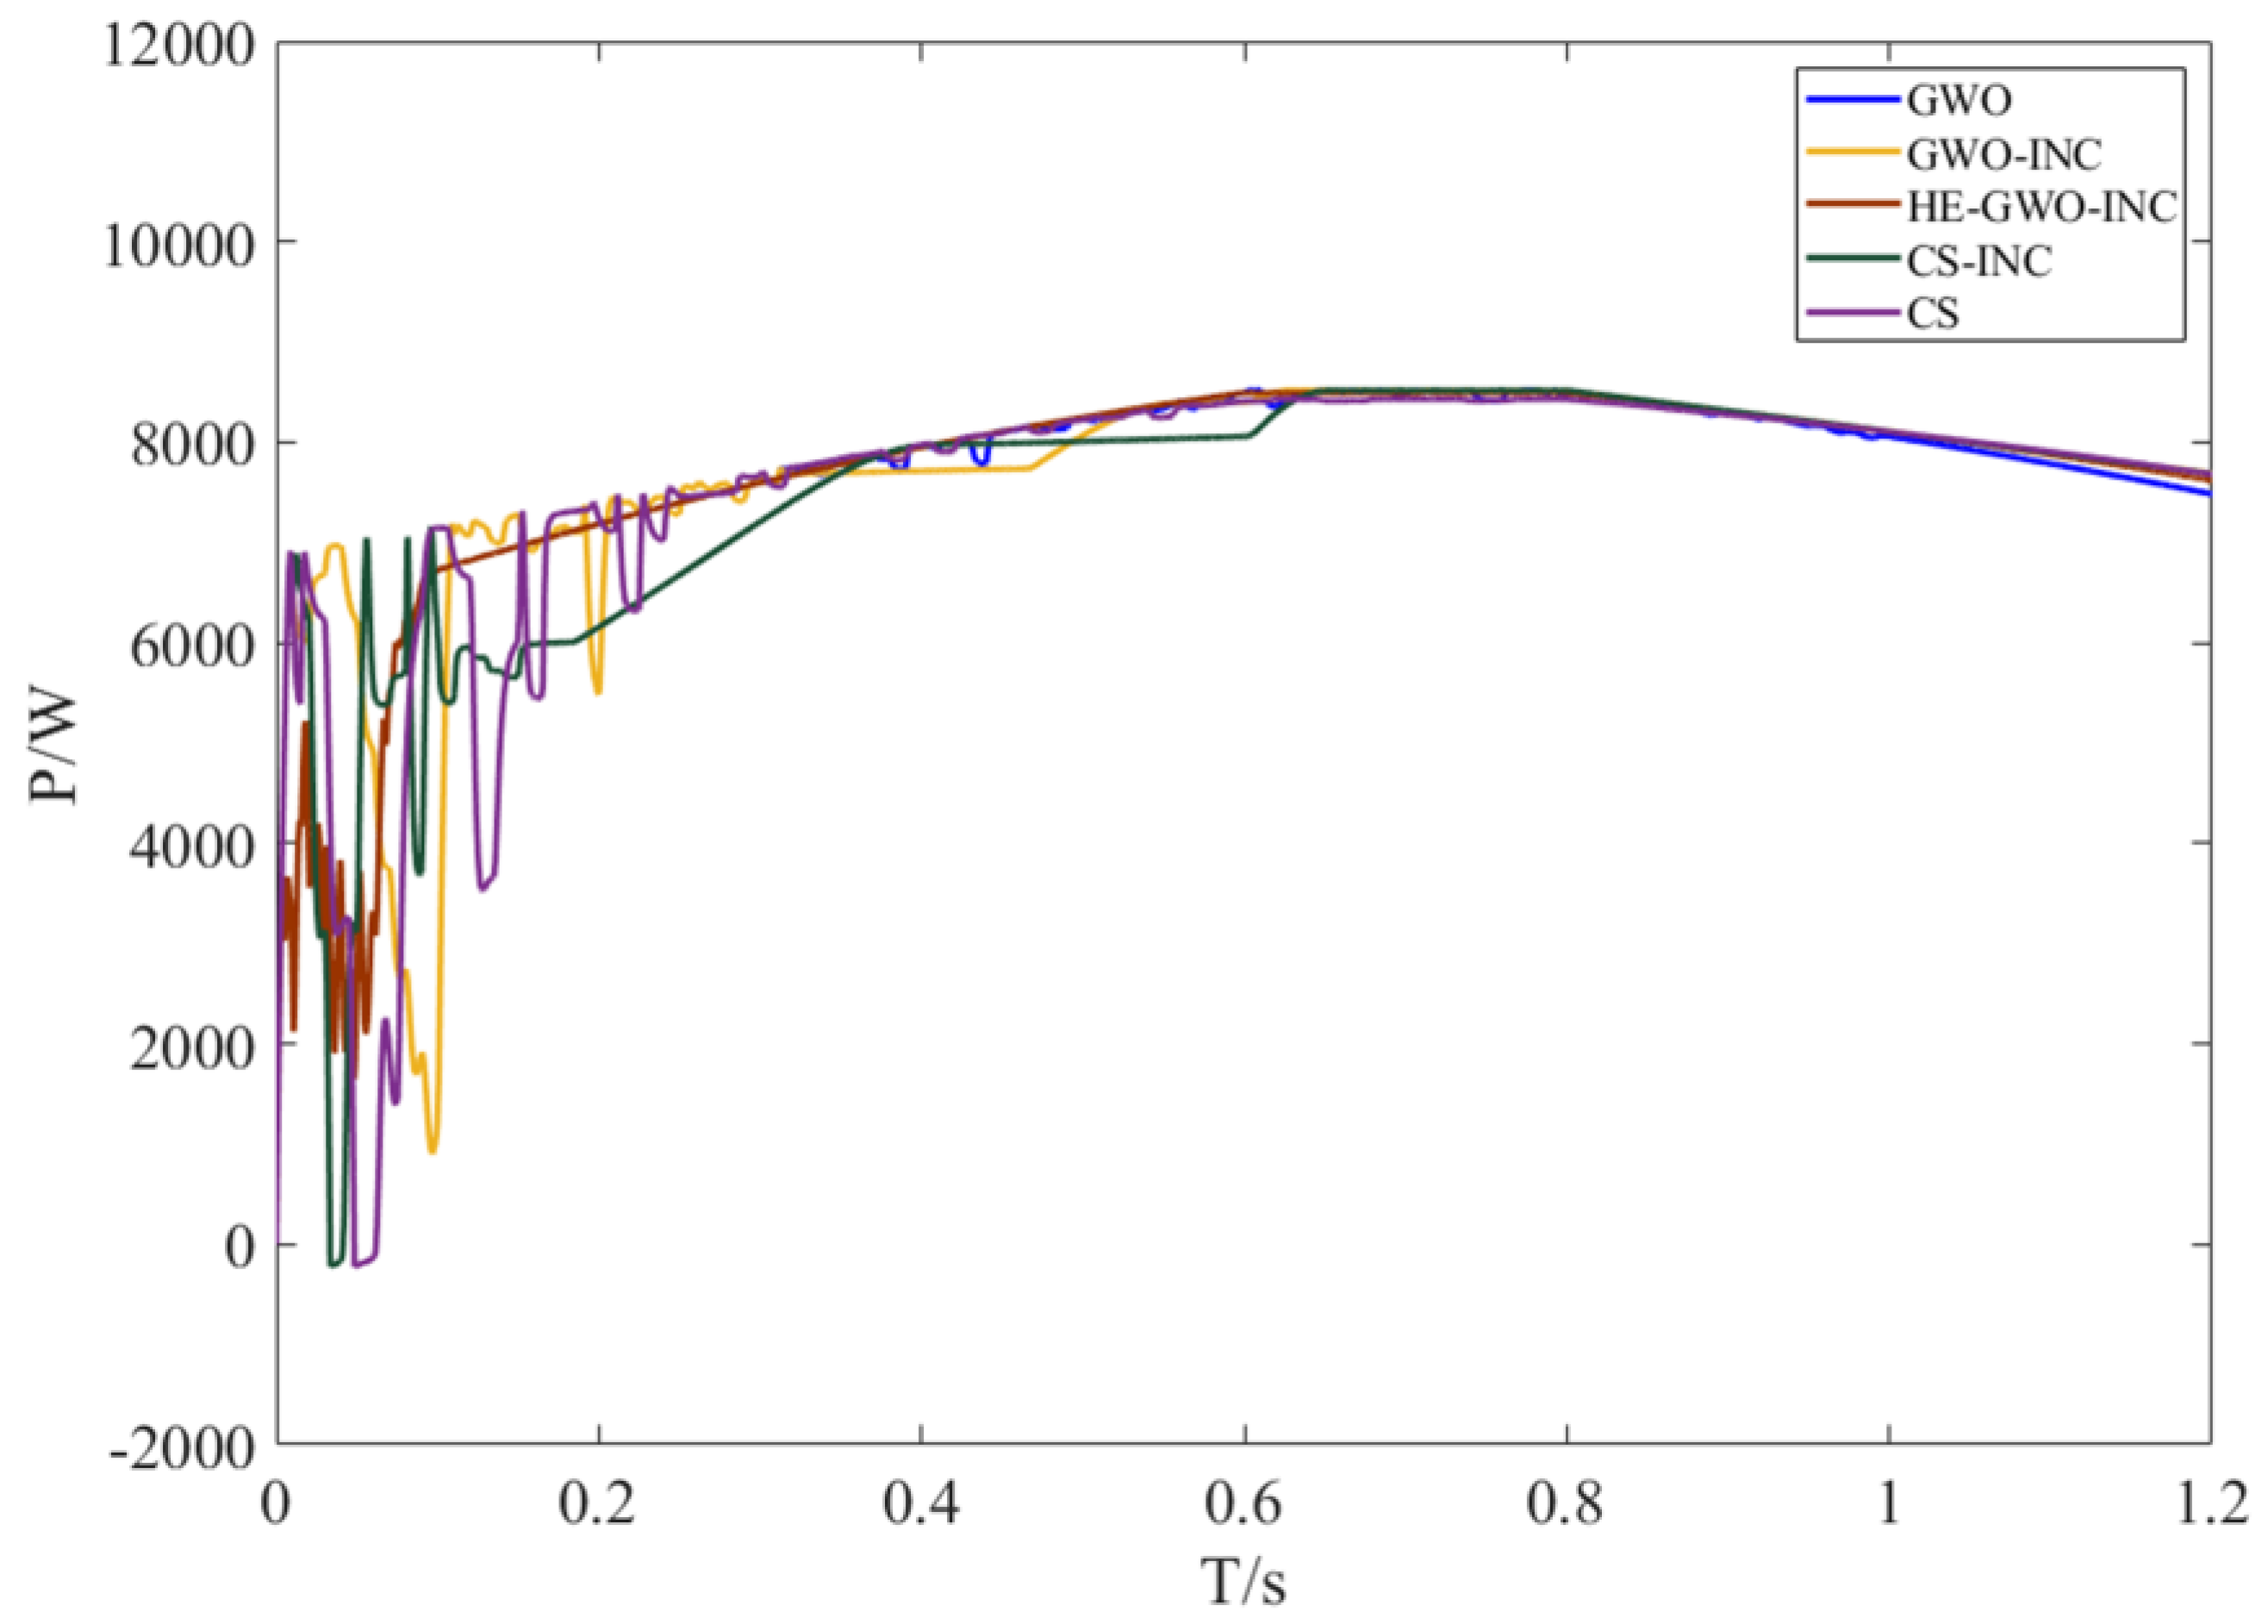
In another dynamic scenario, solar irradiance varies in a ramp-like manner. For instance, irradiance increases or decreases during sunrise and sunset with a positive or negative slope, respectively. To simulate this condition, in the simulation, the irradiance of five photovoltaic (PV) modules increases from 800 W/m2 to 1000 W/m2 with a positive slope over the time interval of 0–0.6 s, while the temperature rises from 23 °C to 25 °C, representing the irradiance enhancement process during sunrise. During this period, the theoretical maximum power of the PV modules increases linearly from 6872 W to 8518 W. Between 0.6 s and 0.8 s, both irradiance and temperature remain constant at 1000 W/m2 and 25 °C, respectively. From 0.8 s to 1.2 s, irradiance decreases with a negative slope from 1000 W/m2 to 900 W/m2, while the temperature drops to 24 °C, simulating the irradiance attenuation process during sunset. During this period, the theoretical maximum power of the PV modules decreases linearly from 8518 W to 7732 W.
The simulation results under the dynamic irradiance ramp variation scenario demonstrate the unique dynamic response characteristics of the HE-GWO-INC algorithm. As shown in
Figure 20, under the control of this algorithm, the PV system’s output power begins to stabilize at approximately 0.09 s and increases following the irradiance variations. However, during the initial transition phase, its output power is approximately 5.2–7.8% lower than that of conventional GWO-INC and CS-INC algorithms. Despite this reduction, the HE-GWO-INC algorithm significantly mitigates power fluctuations, enhancing operational stability. This characteristic stems from the conservative regulation strategy of the hybrid enhancement mechanism during the initial convergence phase, which suppresses power oscillations at the cost of a slight reduction in transient response accuracy, thereby improving system stability.
As irradiance enters a continuous increase phase, the HE-GWO-INC algorithm dynamically adjusts control parameters through its hierarchical optimization structure, enabling the output power to rise and gradually align with that of the comparison algorithms. During this period, the output power under the HE-GWO-INC algorithm increases from 6650 W to 8495 W, achieving an approximate tracking efficiency of 97.75%.
During the irradiance decay phase, the response time of the HE-GWO-INC algorithm remains comparable to that of other algorithms. However, its output power is approximately 1.2–3.7% higher than that of the conventional GWO algorithm and exhibits lower power fluctuations. During this period, the output power under the HE-GWO-INC algorithm decreases from 8495 W to 7680 W, with a tracking efficiency of approximately 99.54%, further validating its robustness in dynamic environments.
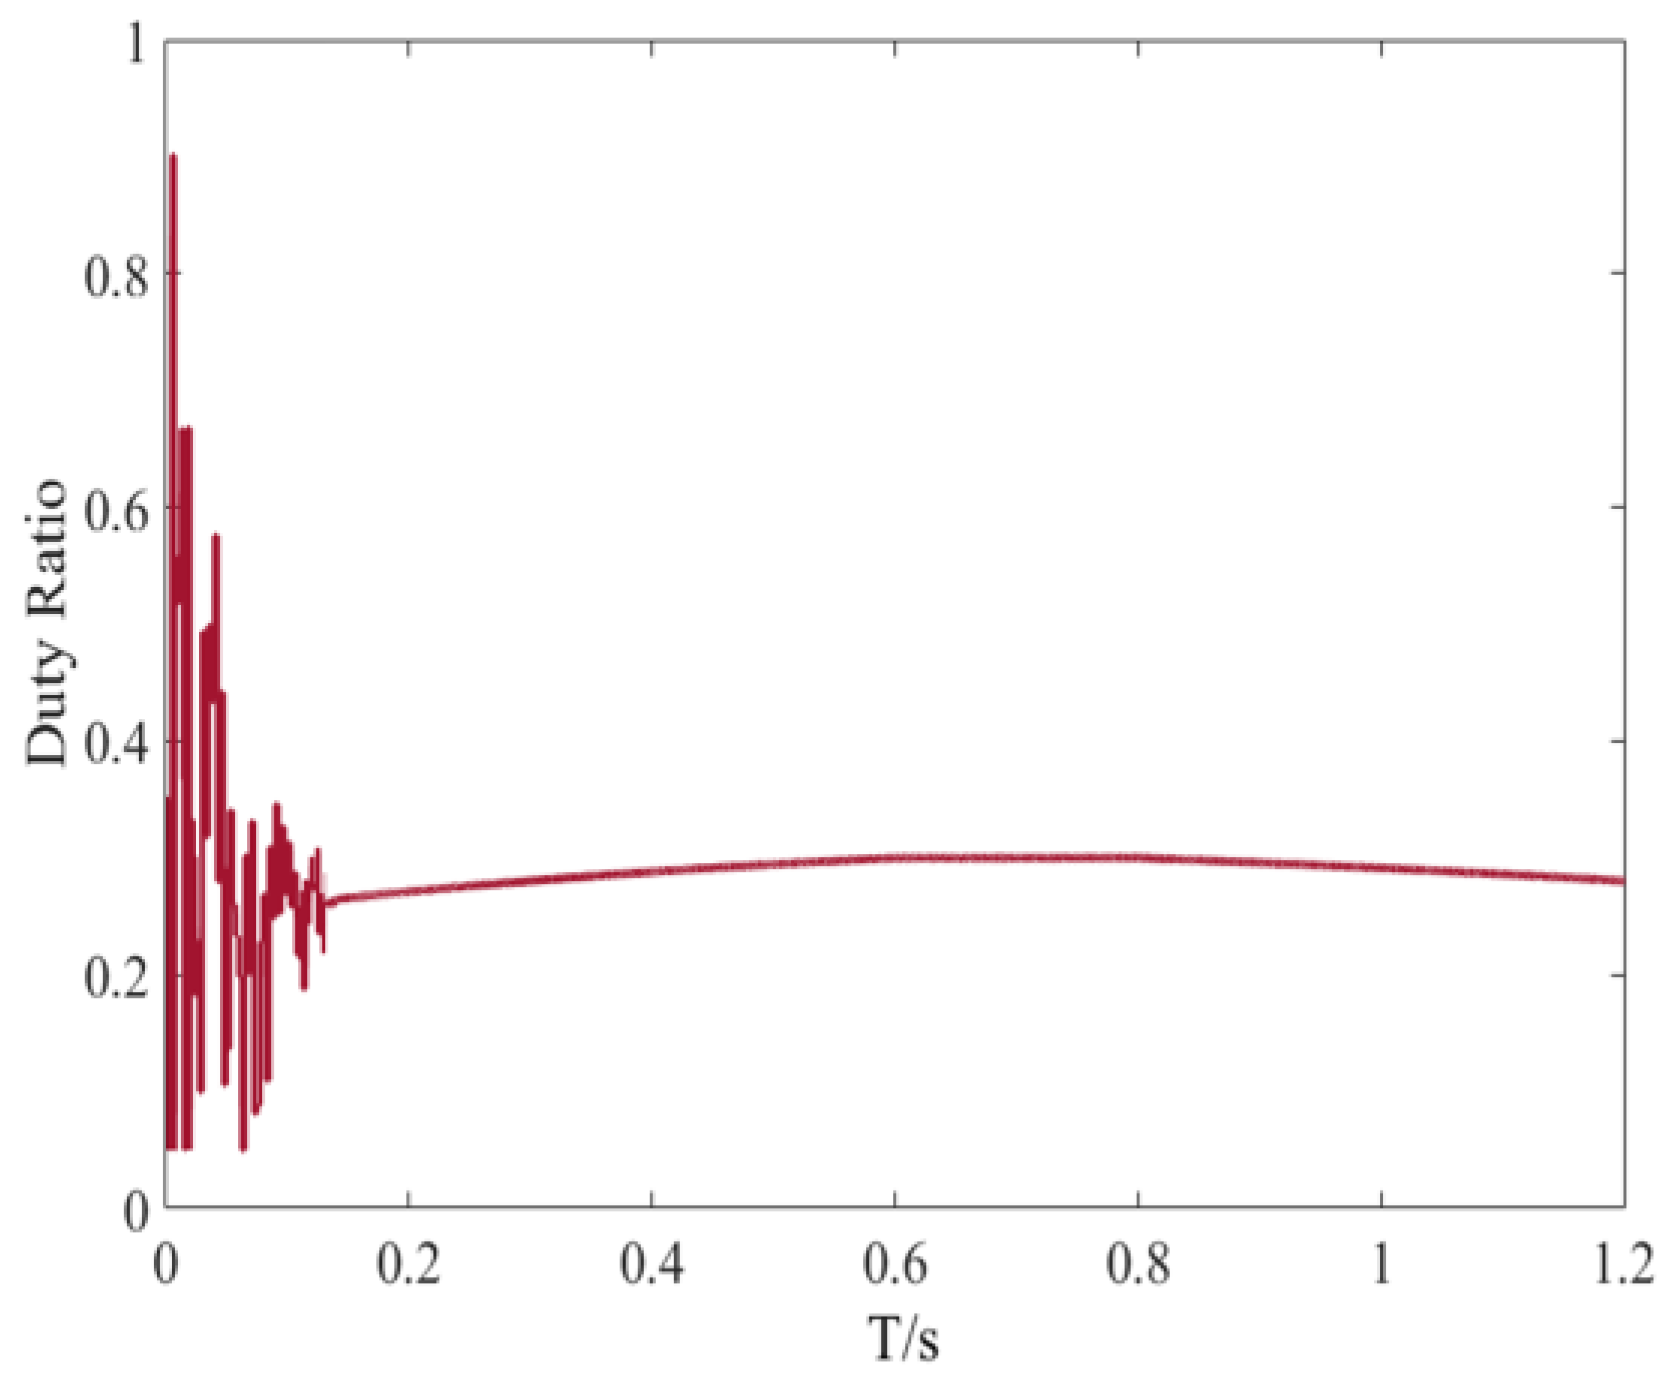
Figure 21 shows the duty cycle output using the HE-GWO-INC algorithm in this scenario.
Simulation studies show that the HE-GWO-INC algorithm demonstrates significant overall performance advantages in PV MPPT control. Compared to single global optimization methods, its hybrid architecture systematically improves tracking accuracy through the collaborative effects of global search and gradient correction mechanisms. The dynamic step-size adjustment mechanism further optimizes steady-state control capabilities under complex operating conditions, effectively suppressing oscillations caused by fixed step sizes in traditional methods. The algorithm exhibits the fastest convergence speed, the slightest steady-state error, and strict power fluctuation control in multi-scenario validation. Especially in environmental mutation scenarios, its adaptive response mechanism can quickly relocate the power point, verifying the algorithm’s robustness under complex lighting conditions.
5. Conclusions
The HE-GEO-INC algorithm proposed in this study shows significant comprehensive performance advantages in photovoltaic maximum power point tracking (MPPT) control. In the standard test scenario, the algorithm can track the maximum power point within 0.08 s, and the tracking efficiency reaches 99.983%. Under the static shading condition, the convergence time is 0.11 s, and the tracking efficiency remains 99.981%. Especially in sudden environmental change, the adaptive response mechanism can realize fast power point relocation. After the change, only 0.03 s can reach 96.78% of the theoretical maximum power. Compared with GWO, CS, and other algorithms, it shows apparent advantages in convergence speed, steady-state error, and power fluctuation control. However, it should be pointed out that in the case of extreme environmental mutations, tracking failures are still caused by the delayed response of detection mechanisms, which will become a critical breakthrough in subsequent research.
At the engineering realization level, the algorithm simulation experiment is carried out in MATLAB/Simulink R2023b, and the program is written in MATLAB language, which supports the automatic generation of C code through the Embedded Coder toolchain and can also be converted into other formal languages to be embedded in the hardware such as MCU and DSP. However, an increase in algorithm complexity results in more requirements for hardware computing resources, leading to a rise in the hardware cost of a single system. In the next step of this research, dynamic characteristic testing and engineering adaptability research in extreme environments will be carried out jointly with a power electronics laboratory and photovoltaic power station to achieve the reliability and economic breakthrough of the algorithm in practical engineering applications.


