Abstract
Climate extremes exacerbate household energy poverty, yet the policy impacts of various energy transition strategies remain underexplored. Leveraging a database of longitudinal socioeconomic–energy household-level data from China, we evaluate the micro-level effects of market-based policies—such as China’s energy quota trading—on households’ energy poverty and energy consumption patterns. We also assess the impact and equity outcomes of an inclusive energy subsidy strategy, including the Northern Clean Energy Program in China, on the health vulnerabilities of energy-poor households. Our findings reveal that while the energy quota trading policy has reduced the reliance on traditional energy sources, it has not sufficiently alleviated the economic burden on energy-poor households. In contrast, the Northern Clean Energy Program in China has significantly mitigated both health risks and economic pressures. These insights provide a robust foundation for optimizing climate change mitigation and energy transition strategies, ultimately promoting energy justice and a fair transition.
1. Introduction
Under climate change scenarios, climate shocks and climate extremes increase household energy demands; however, impoverished households often cannot bear these additional energy costs [1]. Consequently, these households either forgo the use of clean and safe energy or incur greater financial burdens to sustain their livelihoods, thereby exacerbating energy poverty. Energy poverty disproportionately and severely impacts vulnerable groups [2,3]. It not only limits households’ ability to access basic energy services but also leads to adverse health outcomes, further intensifying household vulnerability. Insufficient energy supply and high energy costs negatively affect households’ survival and health [4,5]. Household vulnerability, exacerbated by the impacts of climate change, particularly climate extremes, results from compounded issues such as energy poverty and health deprivation. Policy interventions represent effective tools that can either mitigate or amplify the damage incurred by households [6]. Different types of climate change mitigation and energy transition policies exert varying impacts on household vulnerability. Market-based energy policies, such as the energy quota trading policy (which in this study refers to China’s Pilot Scheme for Paid Use and Trading of Energy Quotas [7]), address the externalities of energy consumption by defining energy usage rights. By clarifying property rights and maintaining low transaction costs, these policies can achieve the Pareto-optimal allocation of resources through market adjustments [8,9,10]. Previous studies have demonstrated the potential and macro-level efficiency of the energy quota trading policy in reducing emissions, conserving energy, and generating economic benefits [11,12]. Furthermore, energy quota trading can promote intertemporal flow and efficient resource utilization, contributing to more balanced and robust economic development [13]. However, stakeholders in the energy quota trading market, driven by profit maximization, tend to pursue their own competitiveness and benefits, thereby transferring the emission reduction costs to consumers at the micro-level [14]. This dynamic may impede the broader benefits of market-based energy transition policies and could be detrimental to regional and household equity in the process of climate governance and the energy transition [15].
In contrast, inclusive energy transition policies are designed and implemented to address regional and micro-level inequalities in energy’s accessibility and affordability. In response to disparities in the energy resource distribution and access to energy services, these policies lower the barriers that prevent vulnerable groups from participating in the energy transition [16,17]. This enables households experiencing energy poverty to obtain affordable, clean energy more easily [18,19,20,21] and reduces the associated health risks [22,23]. For example, the Northern Clean Energy Program, which represents China’s Issuance of the Winter Clean Energy Program (2017 to 2021) in the Northern Region, has been implemented in northern areas. This program promotes adjustments in the energy structure and accelerates the transition to clean energy by selecting, based on the local conditions and residents’ actual energy consumption levels, clean energy transition strategies that incur the lowest implementation costs and emissions. It implements different clean energy transition strategies according to regional characteristics: urban areas prioritize centralized heating combined with decentralized clean heating; transitional urban–rural areas rely primarily on centralized heating with supplementary decentralized clean heating; and rural areas mainly use various forms of clean energy, such as geothermal, biomass, and solar energy, for heating [24]. The implementation of clean energy programs and strategies in China has reduced air pollutant emissions by adjusting the energy structure [25] and has impacted household energy consumption costs and payment capacities [26].
Few studies have integrated different types of climate response and clean energy strategies into an evaluative framework for household vulnerability [27]. Most of the existing work focuses on the impacts of singular market-based policies on poverty and inequality, such as carbon emission trading [28] and energy quota trading [29], often relying on simple economic indicators like low income to measure poverty [30]. In these studies, poverty is typically assessed using absolute measures such as low income, thereby overlooking the relative poverty and vulnerability of households in terms of their energy consumption and their ability to cope with health risks [31,32]. Energy poverty reflects a household’s inability to ensure both energy accessibility and affordability [33]. Moreover, energy-poor households face greater economic pressure when managing health issues and reducing health risks. When the financial burden of health damage exceeds their capacity to pay, households may fall into a cycle of “health damage–relative poverty”, making health vulnerability an important indicator of relative poverty [34]. This study focuses on analyzing households’ vulnerabilities in energy and health at the micro-level and incorporates these factors into an evaluation framework for both the energy quota trading policy and the Northern Clean Energy Program.
Currently, the research on mitigating the adverse impacts of energy transition stress on energy-poor households remains relatively limited [3]. Existing studies have largely focused on the macro-level benefits of market-based policies such as energy quota trading, which have proven effective in reducing emissions and optimizing the resource allocation [11,27]. However, these investigations often neglect the micro-level impacts of these policies [6,12]. In practice, these approaches may inadvertently shift the costs onto vulnerable households and worsen energy poverty, as well as related health risks [4]. Although some studies have started to examine inclusive energy transition policies like the Northern Clean Energy Program, they typically have only assessed the short-term outcomes and have not covered complete policy cycles or provided robust evaluations of their stability, costs, and benefits [25]. Consequently, the overall effectiveness of tailored, inclusive interventions in addressing the multifaceted challenges faced by energy-poor households remains poorly understood.
To address these limitations, our study uses data from the China Family Panel Studies (CFPS) (the CFPS is conducted by the Institute of Social Science Survey of Peking University (www.isss.pku.edu.cn/cfps, accessed on 2 December 2024)), a longitudinal household survey from 2012 to 2020, to investigate two critical research issues that still merit further exploration.
First, we build the difference-in-differences (DiD) framework [35] to analyze the effects of the market-based energy transition policy on households’ energy poverty and energy structure, considering regional variations and demographic inequalities that have often been overlooked in previous research.
Second, we evaluate the effects of inclusive energy subsidy policies on energy-poor households’ health vulnerability using a difference-in-difference-in-differences (DDD) method [36]. In particular, we explore how these policies might alleviate the vulnerability of energy-poor households by reducing health risks and medical burdens.
2. Materials and Methods
2.1. The Survey’s Design, Sampling, and Execution
We analyze 63,572 samples from 18,596 households using data from the longitudinal CFPS to investigate households’ energy poverty, health deprivation, and socioeconomic aspects. The CFPS are nationally representative surveys conducted biennially at the individual, household, and community levels. The CFPS surveys cover 25 provinces and regions in China, excluding Hong Kong, Macau, Taiwan, Xinjiang, Tibet, Qinghai, Inner Mongolia, Ningxia, and Hainan. Since the provinces included account for approximately 95% of the national population, the CFPS can be regarded as a representative dataset collection of households and all of their members nationwide [37]. To manage the survey costs and account for China’s vast regional disparities, the CFPS team employs a multi-stage probability sampling method with implicit stratification. The sampling process unfolds in three stages: in the first two stages, the CFPS team selects samples based on the official administrative divisions to leverage China’s hierarchical structure and achieve population coverage, and in the third stage, the CFPS team selects households using a circular systematic sampling method with a random starting point. The CFPS team conducts household and individual surveys using probability sampling proportional to each province’s population size.
The data collection is primarily conducted through face-to-face interviews, with online and telephone interviews serving as supplementary methods when necessary. The CFPS surveys include five primary types of questionnaires—community, family member, household, adult, and child—each designed to capture essential aspects of household life. These questionnaires are organized into four key modules: (1) a family roster that gathers the basic demographic details for all household members; (2) a household economic assessment covering income, expenses, and assets; (3) individual self-reports for respondents aged 10 and older; and (4) proxy questionnaires for children aged 0 to 15. In this study, we focus on CFPS data from 2012 to 2020, emphasizing a household-level analysis by merging the household data with the personal information on the heads of households. To improve the accuracy of our findings, we integrate cold wave data from the previous year, as the CFPS surveys typically occur mid-year. To further refine the analysis, we exclude households whose heads are younger than 16 or older than 80 years [38].
Based on the cleaning and processing of the CFPS, we construct a unified indicator system and database that integrates the household survey information. Moreover, in the evaluation analysis, we incorporate multiple factors related to the household characteristics and the characteristics of the heads of these households.
2.2. The Indicator System and Dataset
2.2.1. Indicators of Household Energy Poverty
To determine whether a household is experiencing energy poverty rather than just being low-income, we focus on the proportion of energy bills relative to income. This ratio serves as our benchmark for establishing the poverty line, moving beyond simply looking at the total energy expenditure. We use two key indicators to assess households’ energy poverty and energy transition. The first and most important indicator is the energy burden threshold (energy_poverty). A household is considered energy-poor if its energy costs exceed 10% of its income [39]. This measure effectively highlights households at a higher risk of facing significant energy expenses. The second indicator is a straightforward binary variable (solid_fuel) that identifies households that still rely on traditional fuels, such as coal or firewood, to measure households’ energy transition.
Given that calculating the energy poverty indicator involves assessing energy bills and energy burden thresholds, the formulas for determining the energy bills and energy burden are presented in Equations (1) and (2), respectively.
where refers to the total household energy expenditure, with , , and representing monthly electricity bills, monthly expenses for fuels, and the annual cost of central heating, respectively. Additionally, is calculated as the ratio of a household’s total energy bill to its income, where refers to the net income of the household.
2.2.2. Measurement of Households’ Health Vulnerability
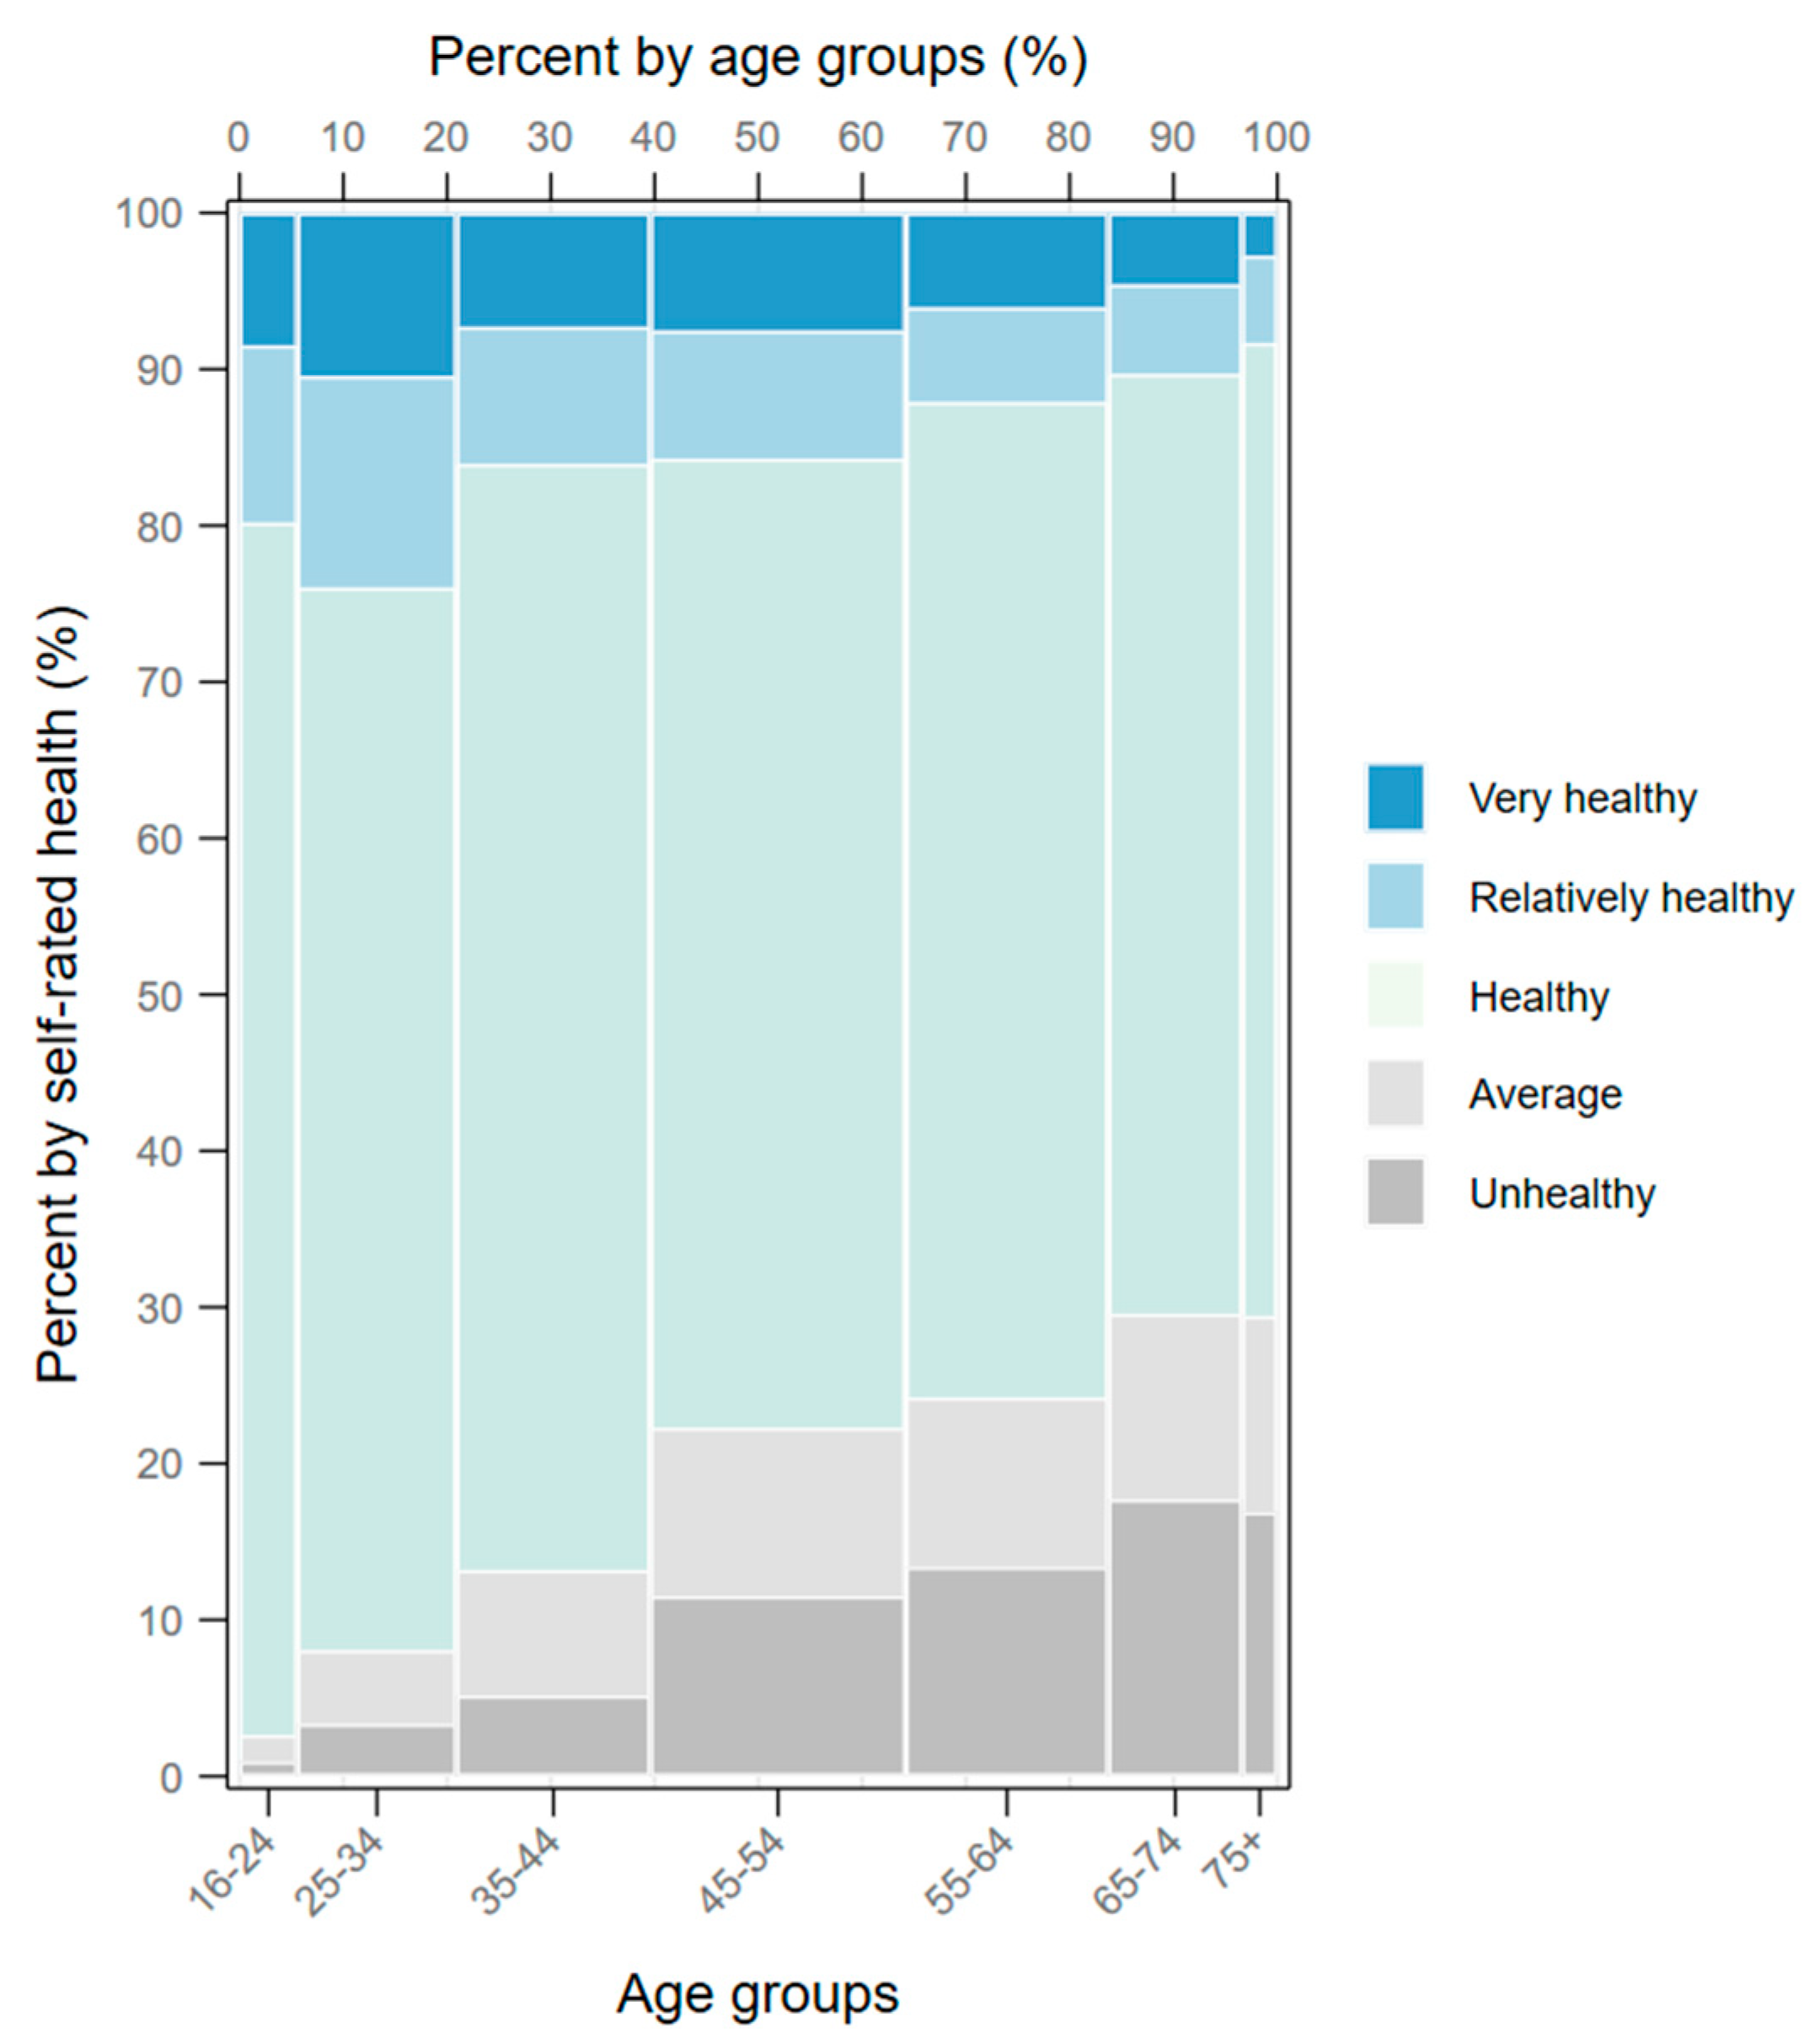
The evaluation framework for studying households’ health risk is constructed across multiple dimensions. First, we develop a direct health indicator—health deprivation (health_deprivation)—by examining the proportion of unhealthy individuals within a household. The first standard is self-rated health, which assesses individuals’ perceptions of their well-being on a five-level scale from “very healthy” to “unhealthy”. In contrast to traditional health metrics such as mortality and morbidity rates, self-rated health provides a broader understanding of overall health status [40]. Research demonstrates that self-rated health can predict objective outcomes, including mortality, disease incidence, and functional capacity [41,42]. This indicator captures health issues—such as chronic pain, fatigue, or psychological distress—that may not be reflected in standard medical evaluations. A rating of “average” or “unhealthy” often indicates underlying health problems, including mental health concerns. An analysis of the CFPS samples from 2012 to 2020 reveals a strong association between self-rated health and age (Figure 1): among individuals aged 55 and older, the proportion reporting “average” or “unhealthy” health increases, whereas a higher percentage of those aged 16–24 rate their health as “very healthy” or “relatively healthy”. This finding confirms the significant relationship between self-rated health and age factors that may influence households’ health deprivation. Moreover, age differences affect the use of energy devices, as older adults tend to conserve energy to reduce their expenses. Consequently, age is included as a control variable in subsequent analyses.

Figure 1.
The percentage of the population in different age groups classified by self-rated health status. There are five levels of self-rated health: “very healthy”, “relatively healthy”, “healthy”, “average”, and “unhealthy”. The X-axis represents different age groups, while the Y-axis represents the proportion of each self-rated health level within these age groups. The total height of each bar represents 100% of the age group, and the different-color segments within each bar indicate the proportion of each self-rated health status.
The second indicator is BMI, with values above 24 or below 18.5 considered unhealthy. BMI is widely accepted as a tool for determining whether an individual’s weight is appropriate for their height [43]. The data on height and weight are obtained from CFPS questions on “current height (cm)” and “current weight (0.5 kg)”. Deviations from the normal BMI range (18.5–24) that are too low indicate malnutrition, while deviations that are too high signal an increased risk of chronic conditions such as heart disease, hypertension, and diabetes.
The third indicator is recent hospitalization, which is assessed in the CFPS by asking whether a respondent has been hospitalized due to illness in the past 12 months. This measure reflects acute health issues and serves as an indicator of broader socioeconomic conditions that affect access to medical care.
To capture health vulnerability further, this study employs two additional indicators that integrate households’ economic burden, payment capacity, and ability to cope with health issues. The first indicator (catastrophic_health_expenditure), catastrophic health expenditure, identifies households that fall into severe medical distress. The second indicator (medical_burden) is the proportion of a household’s income allocated to healthcare over the past year, also referred to as the medical expenditure ratio or medical burden, which measures the economic dimension of a household’s health vulnerability. A catastrophic health expenditure status is defined as healthcare spending that exceeds 40% of a household’s net income, indicating that the household faces significant financial pressure in managing health risks and existing health problems. The medical expenditure ratio further underscores the intersection of health issues and economic stress.
In addition, we control several household characteristics in our analysis, including expenditure on equipment and daily necessities (expenditure_equipment_daily_goods), number of properties owned (num_properties_owned), and the proportion of cold wave days (cold_wave). We also control characteristics of the heads of households such as age, gender, residence type (urban or rural) (residence_type), marital status (marital_status), and social status (social_status). All of the variables are ln-transformed according to their characteristics. All of the indicators and variables used in this study are detailed in Table 1.

Table 1.
Variable descriptions.
2.3. Methodology
2.3.1. Identification Strategies
To identify the effects of the energy quota trading policy on households’ energy transition (i.e., the reduction in the usage of solid fuel) and energy poverty, we employ the DiD approach [35]. This method compares the changes over time in the effects of policy between regions where the energy quota trading policy has been implemented (the treatment group) and those that have not been affected by the policy (the control group). With the launch of the energy quota trading pilot in 2017, the pilot provinces (Zhejiang, Fujian, Henan, and Sichuan) are designated as the treatment group under a quasi-natural experimental framework, while the remaining provinces serve as the control group. We define the treatment and control groups using dummy variables. To assess the impact of the energy quota trading pilot on households’ energy poverty and consumption structure, we set the policy implementation period as 2017–2020—assigning a value of 1 during this period and 0 otherwise. The interaction term, formed by multiplying these two dummy variables, measures the effect of the energy quota trading policy.
In addition, to evaluate the impact of the Northern Clean Energy Program, an inclusive policy within the energy transition process, we establish its identification strategy using the DDD framework [36]. The program is implemented in northern China and primarily targets energy-poor households. Accordingly, we construct the treatment and control groups based on these cohorts: the treatment group includes energy-poor households in northern regions during the program implementation period (post-2017), while the control group comprises other households. In line with the characteristics of the CFPS sample, the identification strategy for the Northern Clean Energy Program focuses on energy-poor households in Beijing, Tianjin, Hebei, Shanxi, Liaoning, Jilin, Heilongjiang, Shandong, Shaanxi, Gansu, and Henan after 2017. The first step involves generating an interaction term between the northern region and the policy implementation period (post-2017), reflecting the initiation of the Northern Clean Energy Program. Building on this, we create separate interaction terms between the northern region and energy-poor households, and between the policy implementation period and energy-poor households, to isolate the program’s impact on energy-poor households in northern regions or during the program period. Accordingly, in our sample, following the initiation of the Northern Clean Energy Program in 2017, 1601 households were affected by the policy in 2018, with 1255 households affected in 2020. Moreover, considering the regional characteristics of the program’s implementation, we include an urban–rural residence type as a control variable in our evaluation. By combining these three dummy variables (northern province, energy-poor household, and the Northern Clean Energy Program implementation period), we construct a triple interaction term that captures the effects of the policy during the implementation period, primarily among households experiencing energy poverty.
2.3.2. Modeling Multiple Interaction Effects
Under the identification strategy constructed, we establish a combined model framework based on a two-way fixed-effect model and the DiD using Equations (3) and (4) to evaluate the impact of the energy quota trading pilot policy on households’ energy poverty and their proportion of solid fuel usage.
where we use the household energy poverty variable () and the energy transition variable () as the dependent variables and the energy quota trading pilot policy variable () as the main explanatory variable. In addition, we include control variables for households’ characteristics and the characteristics of heads of households () to account for multiple influencing factors. We also incorporate fixed effects for time () and fixed effects for household (); the fixed effects for household control for unobservable heterogeneity in households that may lead to endogeneity issues, and the fixed effects for time remove common trends over time, such as changes in economic policies and fluctuations in energy market prices. The term represents a random error. The estimated coefficient is used to measure the effect of the energy quota trading policy on households’ energy poverty in the pilot regions and to assess whether this policy has effectively promoted a transformation in the structure of households’ energy consumption.
We construct Equation (5) using a triple interaction term () to measure the effect of the Northern Clean Energy Program policy ().
where represents three indicators: the proportion of households’ medical expenditure (medical_burden), the degree of households’ health deprivation (health_deprivation), and the catastrophic health expenditure threshold (catastrophic_health_expenditure). Based on the identification strategy for the Northern Clean Energy Program, the explanatory variables are defined as follows: represents the interaction term for being in a northern region during the policy implementation period; represents the interaction term for energy-poor households in northern regions; and represents the interaction term for energy-poor households during the Northern Clean Energy Program implementation period. The variable denotes the triple interaction term () used to identify the Northern Clean Energy Program. The specification of the control variables, fixed effects for household, and fixed effects for time is consistent with Equations (3) and (4). The coefficient is the key indicator in this study for assessing the program’s impact on households’ health vulnerability. If is significantly negative, this suggests that the Northern Clean Energy Program can reduce the health vulnerability of energy-poor households by lowering the proportion of households’ medical expenditure relative to household income, as well as reducing the degree of health deprivation and catastrophic health expenditure. However, if is not statistically significant or is significantly positive, it indicates that the Northern Clean Energy Program either has no discernible policy effect or may even exacerbate the health issues faced by energy-poor households in the short term. This negative outcome could arise from increased household energy bills coupled with the effects of cold climatic conditions such that even with the subsidies provided by the Northern Clean Energy Program, energy-poor households remain unable to offset rising clean energy costs, ultimately leading to greater health damage and increased medical burdens.
Because this study employs the DiD and DDD models to compare the changes across different time points and groups, it captures the effects of the energy quota trading policy and the Northern Clean Energy Program through differences rather than absolute levels. These models typically include time effects, group effects, and interaction terms while setting a reference group to avoid perfect collinearity. For example, when constructing dummy variables and interaction terms, one level is omitted as the reference, preventing complete linear dependence. Moreover, since DiD and DDD focus on the changes before and after policy implementation, individual fixed effects are eliminated through differencing, which reduces the risk of multicollinearity further.
2.3.3. Dynamic Effects and Parallel Trends
To test for parallel trends, we establish models (6) and (7) testing for dynamic effects using the event study approach.
In Equations (6) and (7), the definitions of the dependent variables ( and ), control variables (), fixed effects for household (), and fixed effects for time () are consistent with those in Equations (3) and (4). denotes the dummy variable for the energy quota trading pilot, defined consistently with the treatment and control group settings in Equations (3) and (4). represents a dummy variable for a specific year. The interaction term () takes the value 1 when an observation belongs to the pilot group in a given year and 0 otherwise. The coefficient for this interaction term measures the annual difference between the pilot provinces and the other provinces (the control group).
2.3.4. Moderation Mechanisms
Building on Equation (8), we introduce moderating effects to assess the impact of the Northern Clean Energy Program on households’ health vulnerabilities (). Because centralized heating costs are mostly fixed and collected uniformly with little temporal variation, this study sequentially analyzes electricity bills and fuel expenses as moderating variables to evaluate how household energy cost factors moderate the effect of the Northern Clean Energy Program on health vulnerabilities.
where represents the Northern Clean Energy Program, represents each household’s monthly electricity bills () and fuel costs (), and is the interaction term for and the two moderation variables. The specification of the other variables remains the same as in Equation (5). The coefficient indicates the moderating effect on the policy effect of the Northern Clean Energy Program.
3. Results
3.1. The Impact of Market-Based Policies on Households’ Energy Poverty and Energy Structure
3.1.1. The Regional Characteristics of the Energy Quota Trading Pilots
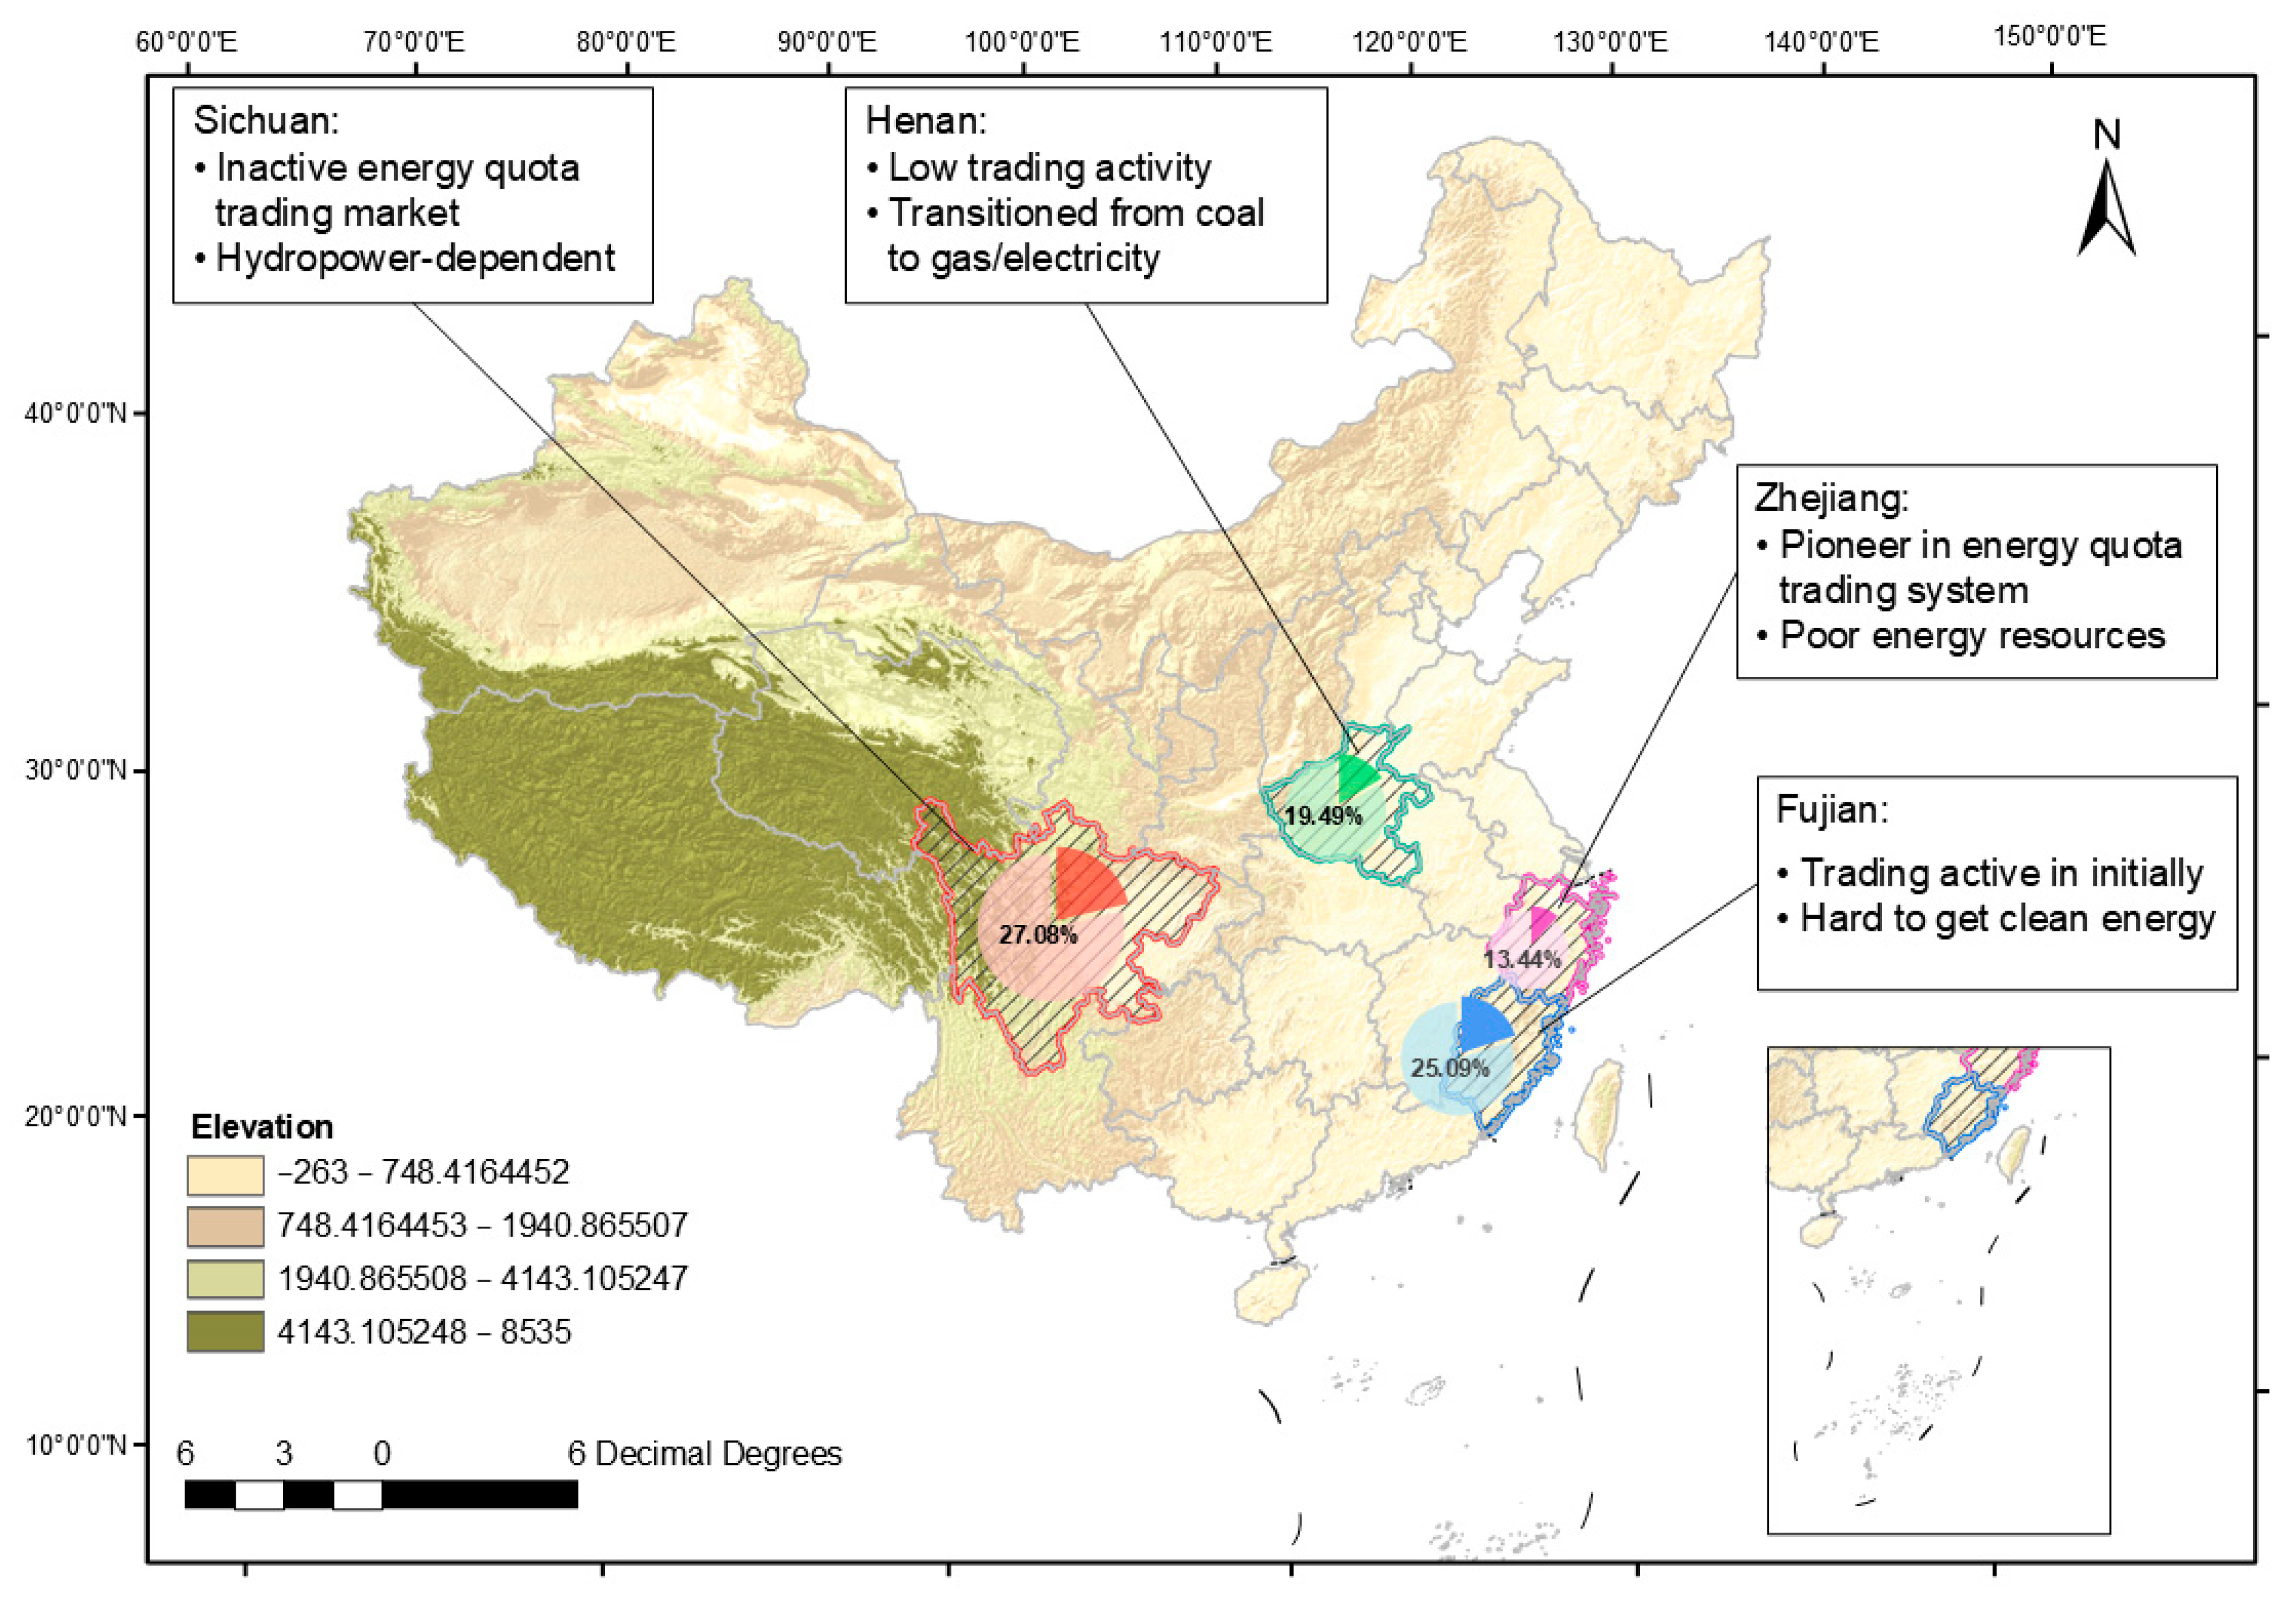
Considering that households face multiple impacts in the context of climate change and that household vulnerability, which may even be driven by climate extremes, may become increasingly pronounced or alleviated during the implementation of various climate change mitigation and energy transition policies, Figure 2 illustrates that the pilot regions for the energy quota trading policy exhibit varying levels in terms of households’ solid fuel usage and energy poverty. Zhejiang Province, the earliest region to adopt energy quota trading, maintains a highly active market using an incremental trading model. With an average energy-poor household proportion of 13.44%, Zhejiang shows the lowest level among the four pilot regions. While this may indicate that the energy quota trading policy is having a positive effect, it is also possible that Zhejiang’s status as an economically developed coastal province with higher income levels has contributed to this outcome.
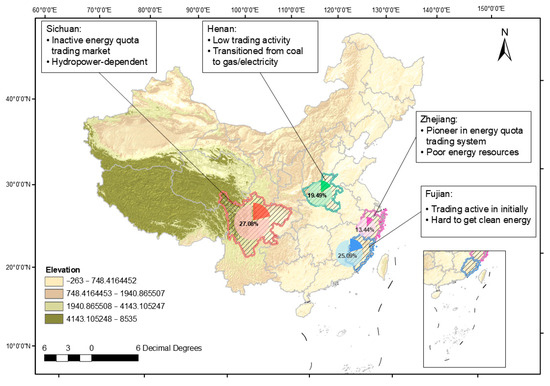
Figure 2.
Pilot regions’ energy quota trading market conditions and household energy poverty performance. Each pilot region is represented by a pie chart showing the average proportion of energy-poor households in that province.
A further analysis using the DiD model is needed to isolate the policy’s impact. Moreover, Zhejiang’s relatively poor endowment in energy resources and heavy reliance on imported energy raise energy security concerns, which could impede efforts to alleviate energy poverty. In contrast, the activity in Fujian’s energy quota trading market is concentrated primarily during the early stages of the pilot, and Fujian exhibits a comparatively high average proportion of energy-poor households. Despite its coastal location and abundant renewable energy resources, particularly hydropower and offshore wind, Fujian’s complex, mountainous terrain restricts the accessibility of modern energy in some regions. Additionally, technological and infrastructure limitations increase the cost of harnessing these renewable energy sources. The transition from traditional fossil fuels to renewables may also lead to higher electricity prices, thereby imposing a greater energy burden on households [44].
Both Henan and Sichuan Provinces have experienced relatively low trading volumes since the launch of their energy quota trading markets, indicating less market activity. Henan’s energy poverty level is lower than that of the other pilot regions, apart from Zhejiang, largely because the local governments in Henan have promoted a shift from a coal-dominated energy structure to greater reliance on natural gas and electricity for residential energy needs. As the only northern pilot region, Henan experiences relatively mild winters, even in areas without centralized heating, thus reducing the energy consumption driven by cold weather. However, Sichuan Province exhibits the highest average level of energy poverty among the four pilot regions. Although Sichuan possesses abundant hydropower resources, its hydropower generation remains highly sensitive to heat waves. Under extreme high temperatures, the hydropower output in Sichuan drops sharply, and other power sources, such as thermal power, are unable to compensate for this shortfall promptly. Consequently, an inadequate electricity supply forces residents to incur higher costs for their essential energy needs [45], thereby exacerbating households’ energy poverty.
3.1.2. The Impact of the Energy Quota Trading Policy on Households’ Energy Poverty
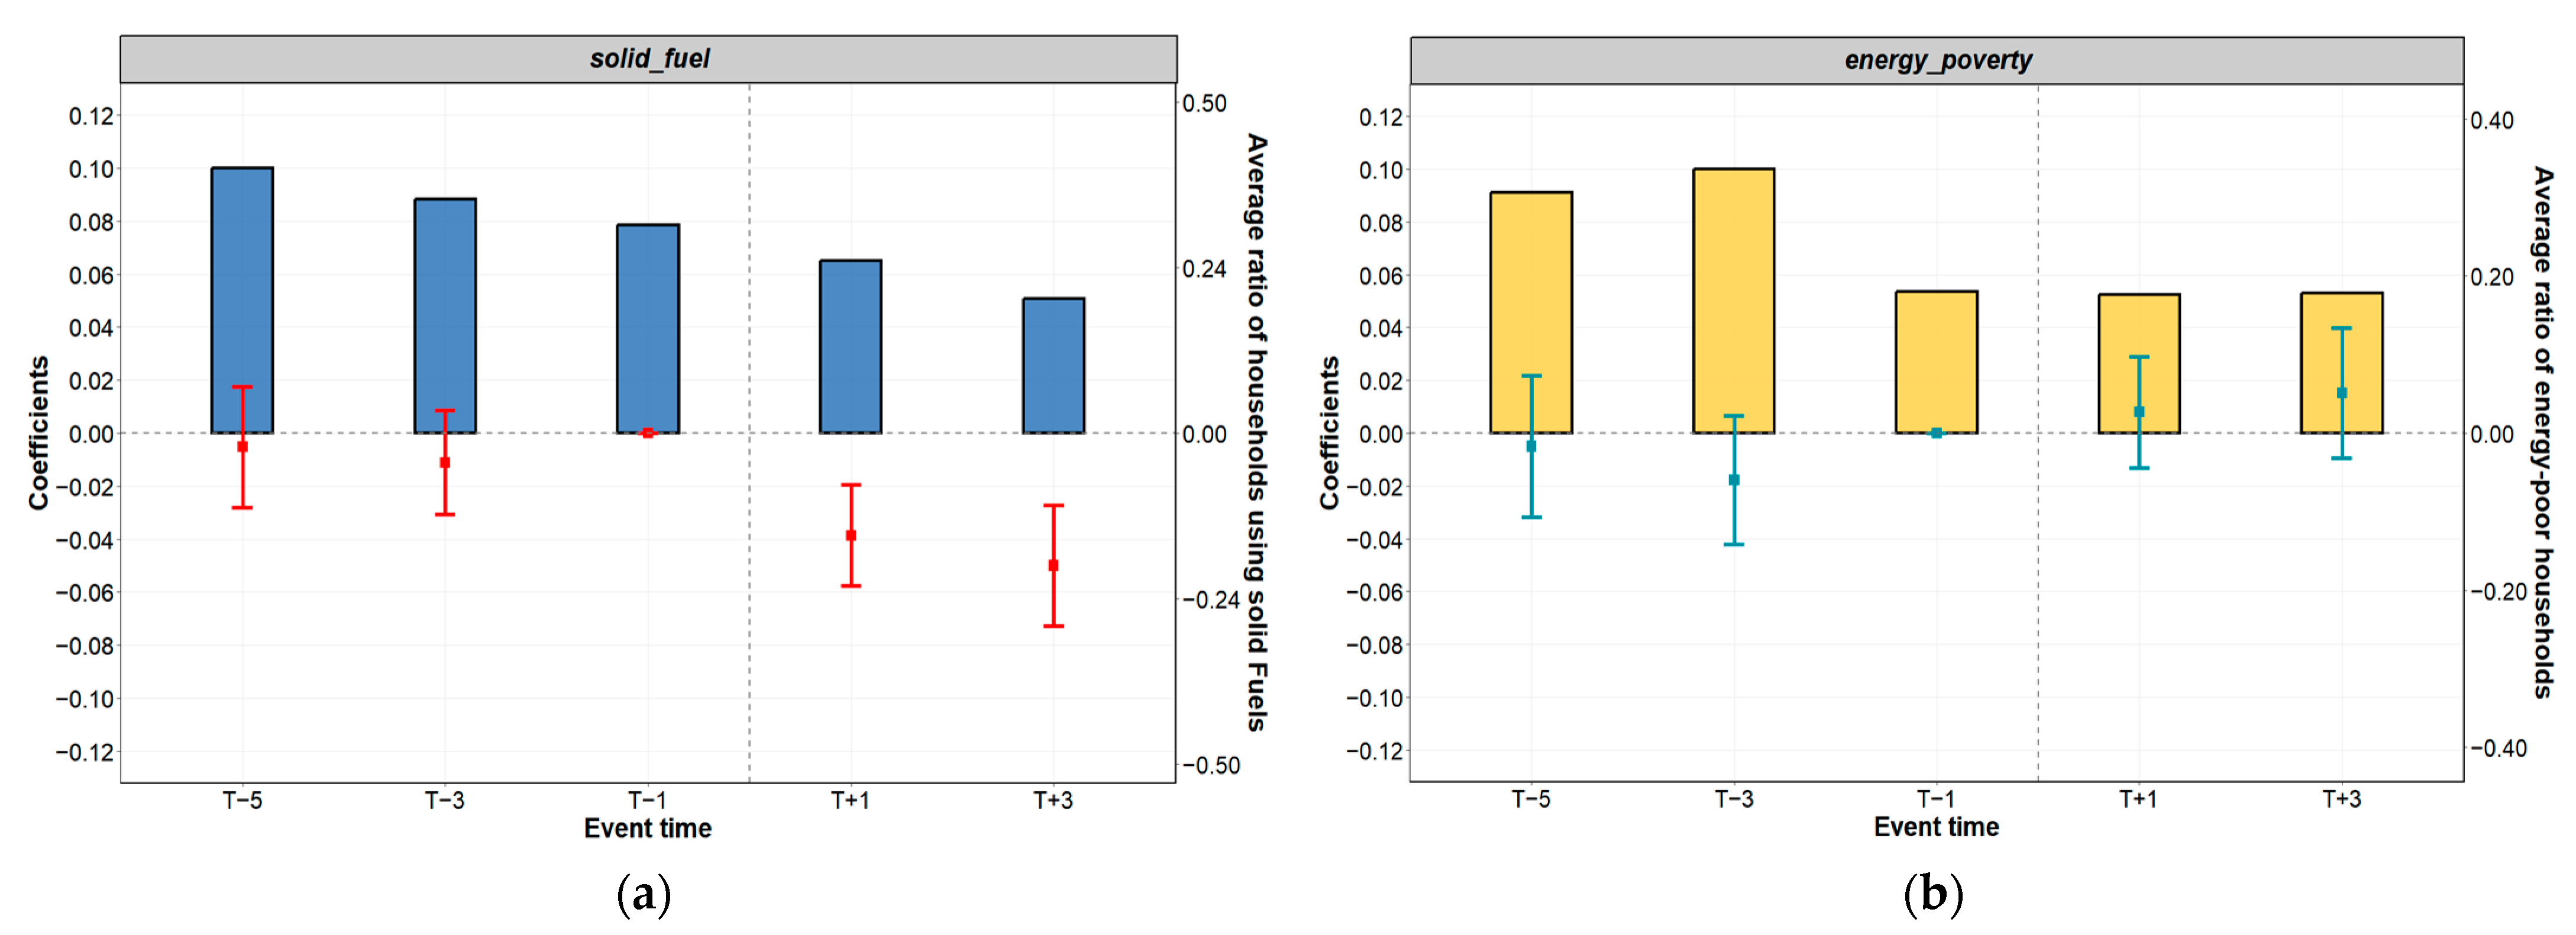
Before the energy quota trading policy was implemented, we conducted an event study and found that the regression coefficients for both energy poverty and solid fuel usage were centered around zero, with their 95% confidence intervals including zero (Figure 3). This suggests that there were no significant systematic differences between the pilot and non-pilot regions prior to the policy rollout, thereby confirming the validity of the assumption of parallel trends. After the policy’s introduction, however, effects gradually emerged across all pilot regions, with the regression coefficients progressively deviating from zero. Furthermore, our bar charts indicate that the proportion of households using solid fuels consistently declined over time, while the average proportion of energy-poor households displayed a fluctuating trend. Overall, following the policy’s implementation, the share of energy-poor households in the pilot regions remained relatively stable, with no significant changes observed.
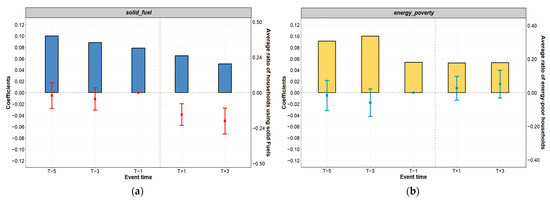
Figure 3.
Parallel trend test results and annual mean analysis. (a) The parallel trend test results for energy_poverty along with the average proportion of energy-poor households in the pilot regions; (b) the parallel trend test results for solid_fuel along with the average proportion of households using solid fuels in the pilot regions. Small green and red squares represent the regression coefficients, and the corresponding vertical green and red lines indicate the 95% confidence intervals. The gray dashed line denotes the start of the energy quota trading pilot. Time periods before and after the policy’s implementation are marked as “T” and “T+”, respectively, with “T1” serving as the baseline group. Yellow and blue bar charts show the average values for energy_poverty and solid_fuel for each time period.
After controlling the households’ characteristics and those of the heads of households, the energy quota trading policy (energy_quota) exhibits a negative effect on the proportion of solid fuel usage in households (solid_fuel) (Table 2). Specifically, the effect coefficient is −0.0380, with a p-value below the threshold for significance at the 99% level. This finding indicates that the policy has facilitated an energy transition in households by reducing the use of traditional fuels such as solid fuels. Our results show that the energy quota trading policy has increased the proportion of energy-poor households (energy_poverty) in the pilot regions. Specifically, the effect coefficient is 0.0179, with a p-value below the threshold for significance at the 95% level. This discrepancy may be attributed to differences in the indicators used to measure energy poverty and vulnerability, as our study focuses on a more micro-level sample and uses households’ energy poverty as a proxy for energy vulnerability.
Table 2.
Effects of the energy quota trading policy.
During the implementation of the energy quota trading policy, stakeholders—including policymakers, local governments, and energy users—have worked to control energy consumption and intensity. Under the centrally established energy quota standards, which are based on overall energy consumption targets, energy users incur costs for any usage that exceeds their allotted quota. This mechanism forces users to adjust their energy structure or pass these additional costs onto households. Simultaneously, policymakers adjust the stage-wise energy quota allocations in response to dynamic changes in the total energy consumption targets. These actions influence government agencies in the pilot provinces and prompt local governments to develop more detailed strategies for energy structure adjustments. As the final energy consumers, households bear a portion of the transition costs; under the influence of local government policies, they reduce their use of solid fuels and switch to renewable energy and non-solid fuels. Consequently, the energy quota trading policy enables households in the pilot provinces to achieve an energy transition. However, amid fluctuations in energy prices and increases in other costs, rising energy expenses may push some low-income or vulnerable households into energy poverty, as households with limited economic adaptability and insufficient resources to rapidly adjust to new renewable energy structures and higher energy bills experience an increase in energy poverty.
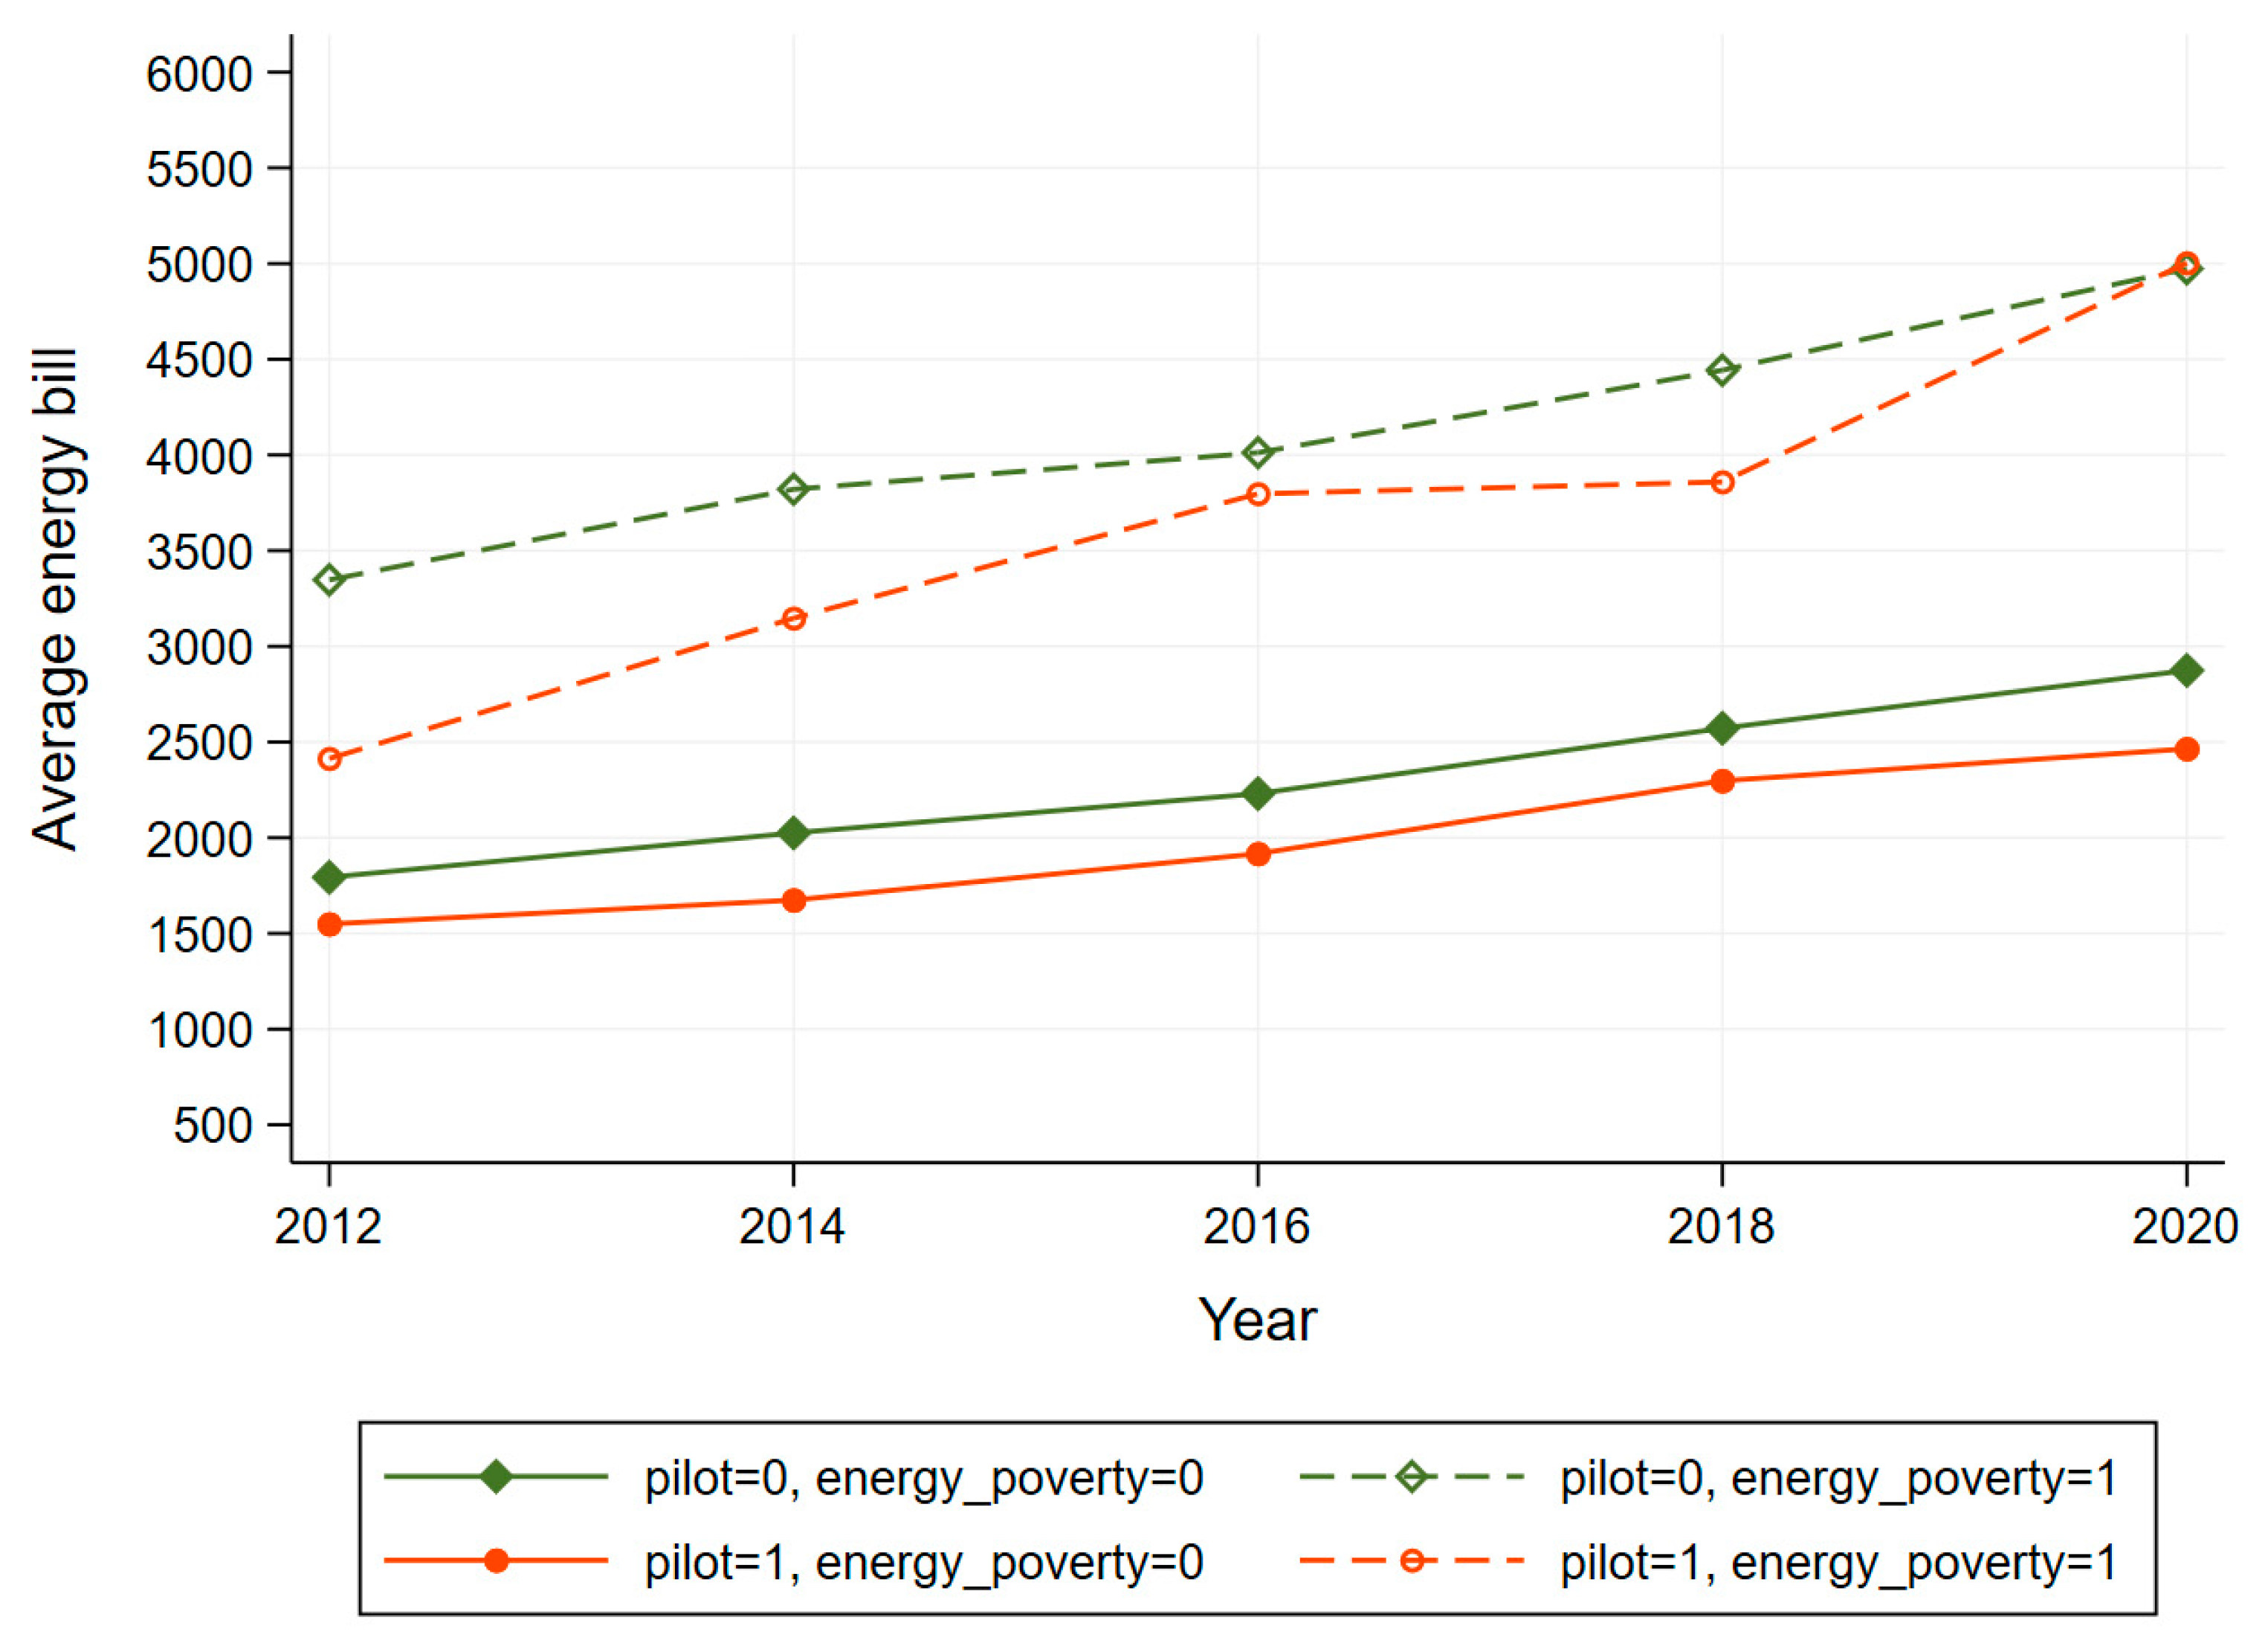
To investigate the mechanism of household energy costs, we compared the energy bills of the energy-poor and non-energy-poor households between pilot and non-pilot regions (Figure 4). We found that after the implementation of the energy quota trading policy, the energy bills of the energy-poor households in the pilot regions (treatment group) increased significantly, while those in the control groups did not exhibit significant changes. These findings indicate that under a market-based mechanism, rising energy prices may lead stakeholders such as enterprises to transfer the energy costs to consumers (households), thereby increasing households’ energy expenditure and exacerbating energy poverty.
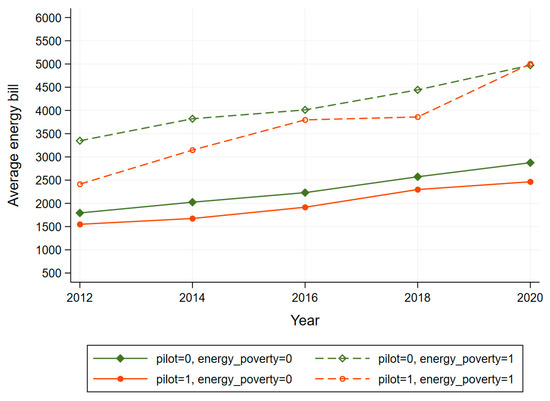
Figure 4.
Trends in energy bills across different groups. The solid line shows the mean trend for non-energy-poor households, while the dashed line shows the mean trend for energy-poor households. The green diamond markers represent non-pilot regions, and the orange-red circle markers represent pilot regions.
3.2. The Effects of Inclusive Policies on Energy-Poor Households’ Health Vulnerabilities
According to Figure 5, the geographic distribution of the average household energy burden across northern provinces is closely related to each province’s energy structure and economic development. In the northeastern region, dual pressures from energy and industrial transformation, combined with high latitude and climate sensitivity, result in a substantial demand for centralized heating and a heavy household energy burden. Moreover, the ongoing transformation of traditional heavy industries increases these burdens further. Following the implementation of clean energy transition measures and economic restructuring policies—such as converting from coal into electricity or gas and revitalizing old industrial bases in Northeast China—the household energy burdens in this region have declined. Although households’ energy costs increased during the early stages of the clean energy transition in 2016, improvements in the energy usage efficiency after the launch of the Northern Clean Energy Program for winter have reduced and stabilized these costs. It is also noteworthy that Shanxi Province, with its abundant coal resources, consistently shows a relatively high household energy burden; in vulnerable regions like Shanxi, targeted subsidies and inclusive policies for energy-poor households are particularly important.
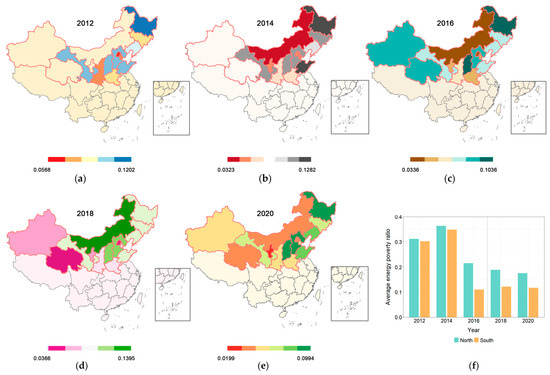
Figure 5.
Regional characteristics of energy burden and manifestations of energy poverty. (a–e) The average provincial energy burden in the northern region from 2012 to 2020, with the color bands moving from left to right indicating increasing values; (f) average energy poverty ratio between northern and southern China over the years.
In the northwestern region, households’ energy burdens exhibit an overall fluctuating trend. Although this region benefits from abundant solar and wind resources and a rapid renewable energy transition, its underdeveloped infrastructure and lower household incomes lead to relatively high energy expenditures. Figure 5f further illustrates the differences in energy poverty between the northern and southern regions. After the implementation of the Northern Clean Energy Program in 2017, the energy poverty situation in the north has improved markedly, with the average proportion of energy-poor households gradually decreasing. In contrast, the southern regions show little change or even a slight increase in their energy poverty, highlighting the beneficial impact of the Northern Clean Energy Program on vulnerable households in northern areas.
Although the energy quota trading policy has promoted adjustments in households’ energy structures and a shift toward renewable energy, its role in exacerbating household energy poverty has been largely overlooked in previous studies. We have identified negative impacts of the energy quota trading policy at the levels of households’ economic statis and energy costs. An increased energy burden may lead to adverse health outcomes. For example, energy-poor households may be forced to reduce their medical spending in order to meet rising energy costs. Climate change further exacerbates health damage [46]. Households facing energy poverty often lack the capacity to cope with health issues arising from extreme low temperatures. In northern regions, where the heating season is long, the energy demand is high, and heating costs are elevated, energy-poor households tend to cut back on their medical spending.
In response, policymakers have introduced inclusive energy policies, such as the Northern Clean Energy Program. In northern regions, governments have promoted energy structure adjustments during the initial stages of the energy transition through projects that convert coal into electricity or gas. They have also accelerated the shift to renewable energy by promoting air-source heat pumps, ground-source heat pumps, and clean coal technologies. Based on this context, we evaluated the policy effects of the Northern Clean Energy Program (Table 3) further. The results indicate that this inclusive policy has effectively protected the rights of vulnerable energy-poor households in the north. Specifically, the coefficients for the Northern Clean Energy Program (northern_clean_energy) indicate improved health outcomes for energy-poor households. The results are statistically significant at the 99% level for the reductions in the medical expenditure ratio (medical_burden) and for the decreased proportion of households experiencing catastrophic health expenditures (catastrophic_health_expenditure) and at the 95% level for lower degrees of health deprivation (health_deprivation).
Table 3.
The impact of the Northern Clean Energy Program on household health vulnerabilities.
Our findings suggest that these improvements have arisen from alleviated health issues rather than from deliberate reductions in medical spending to offset high energy costs. Furthermore, while the scale and structure of clean energy supply have been optimized in southern regions during the energy transition process, northern regions—facing more severe extreme weather conditions, particularly intensifying cold waves—require additional subsidized policy support to address lagging energy transitions and insufficient coordination capabilities [47].
3.3. The Mechanism Analysis
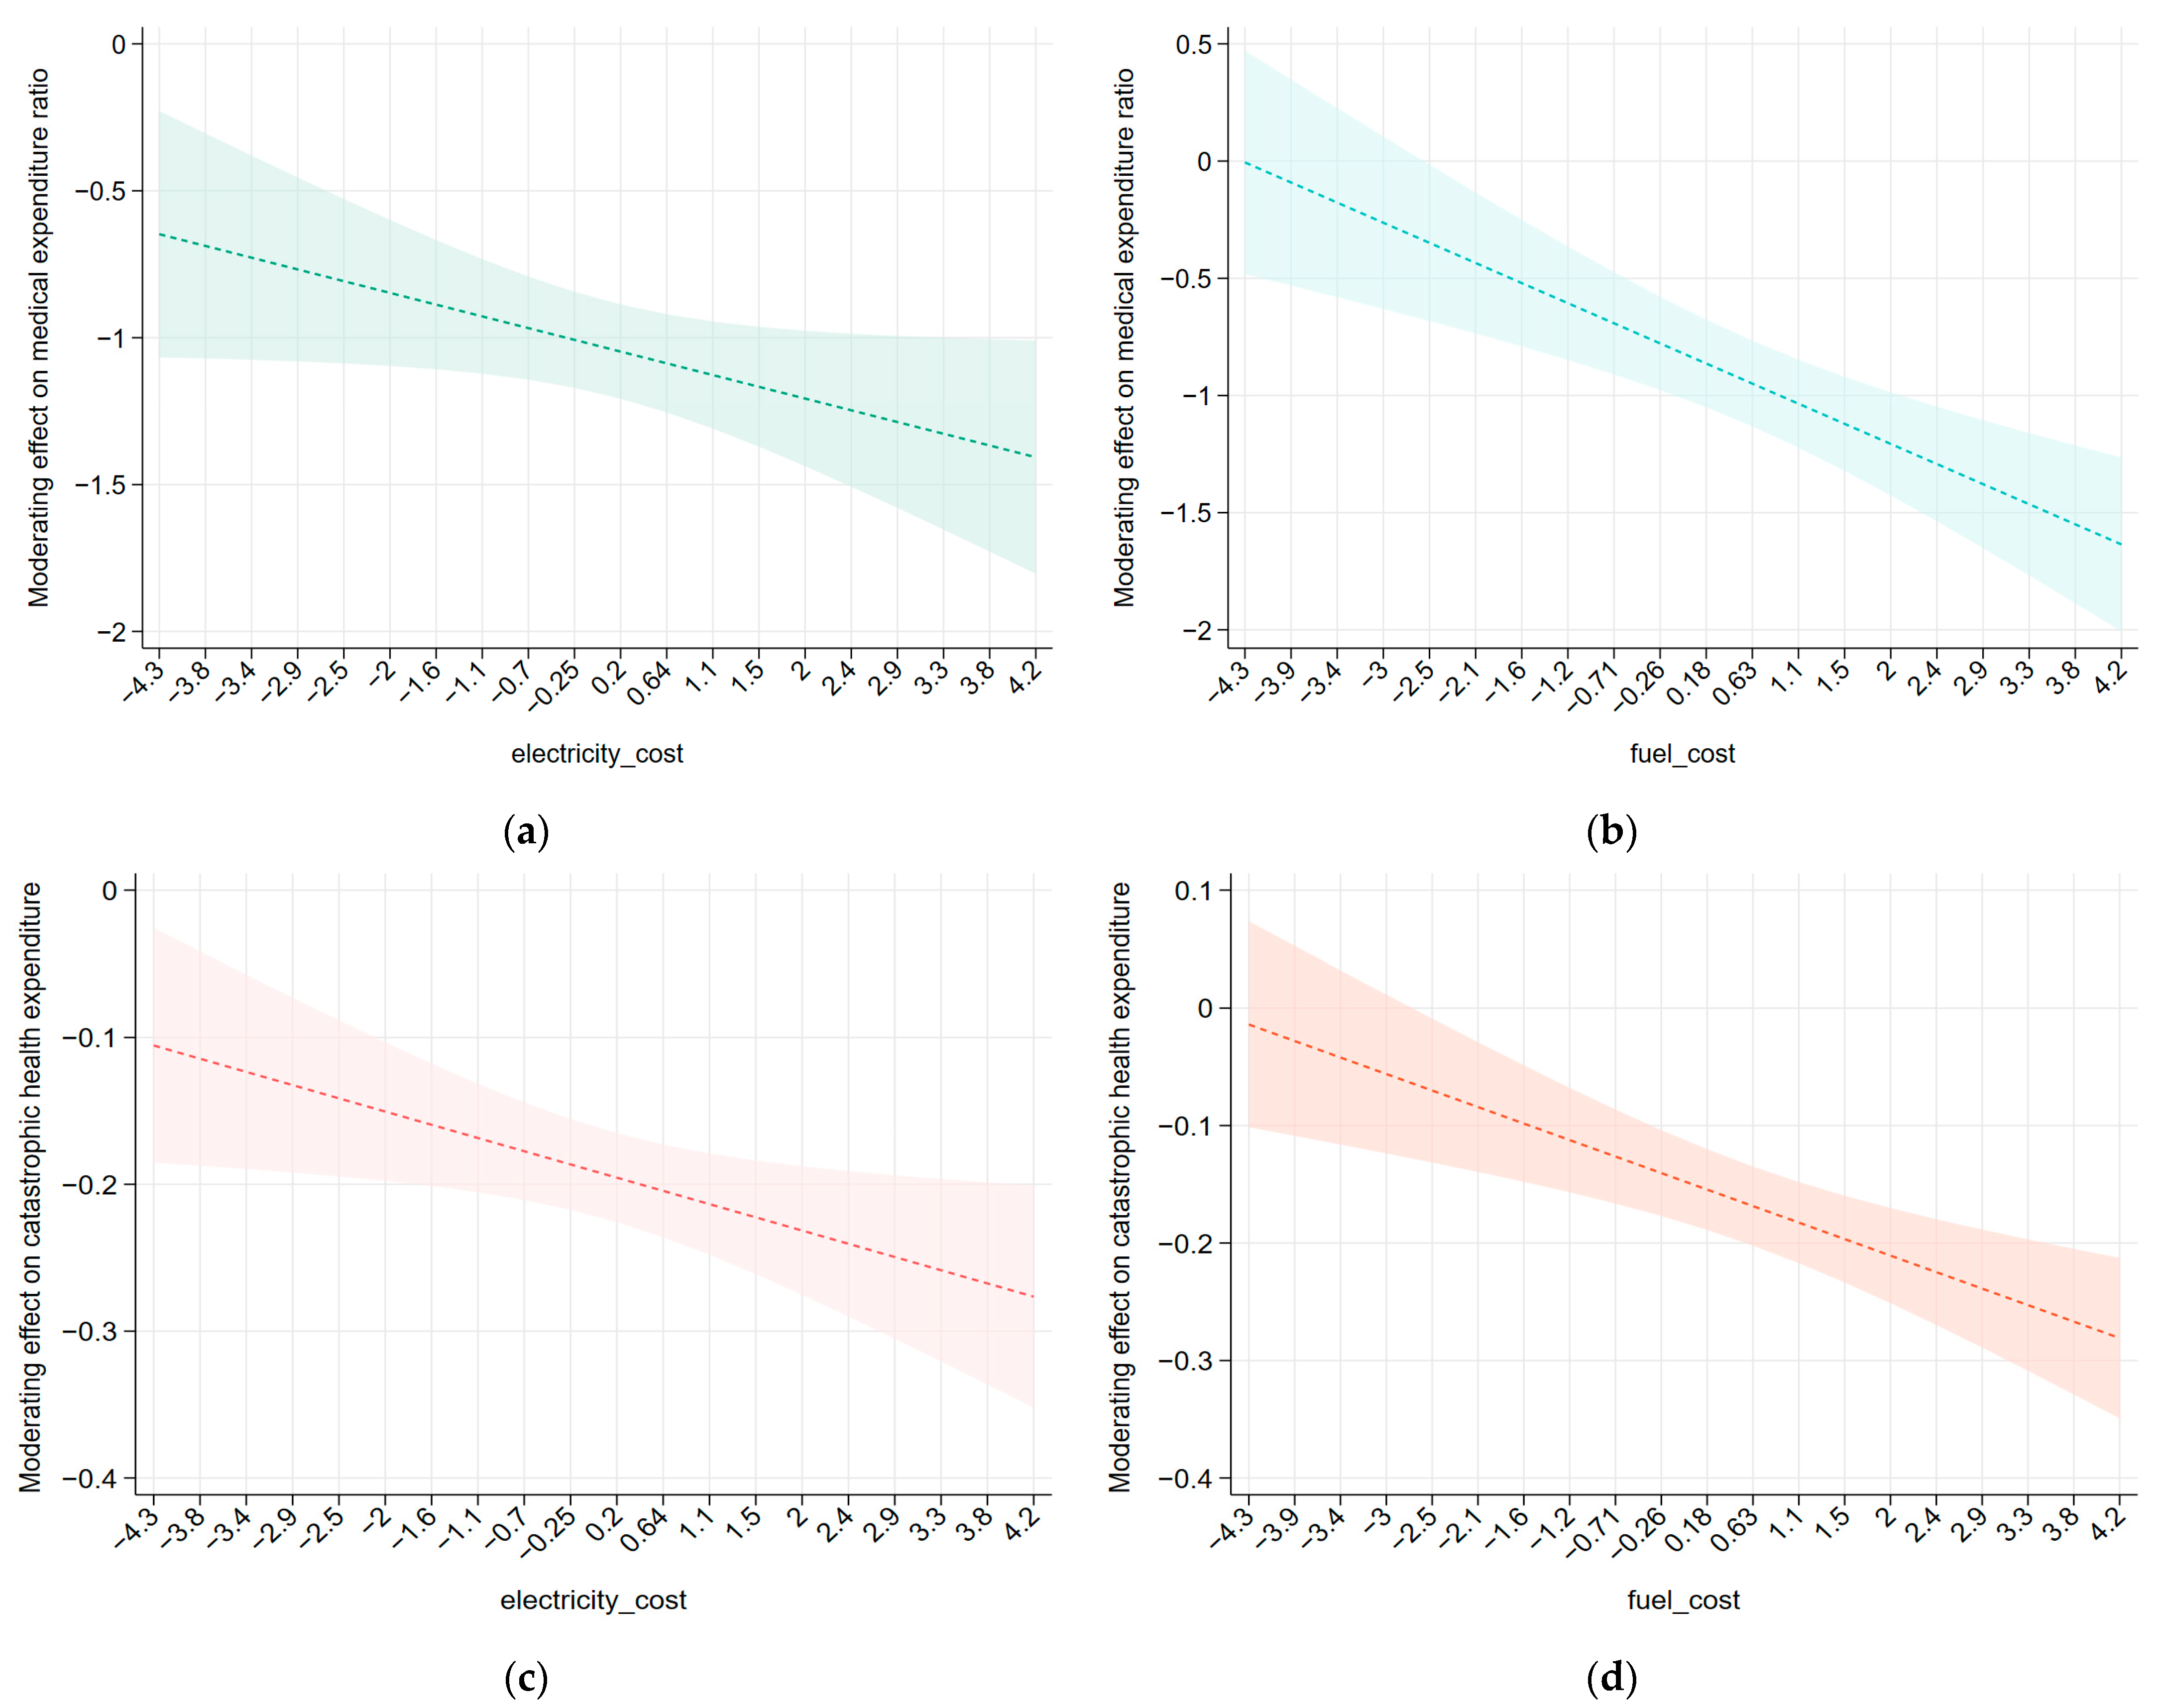
We observe similar moderation effects on households’ health vulnerability, although the degree of impact varies (Figure 6). Both household electricity bills and fuel costs strengthen the alleviating effect of the Northern Clean Energy Program on households’ health vulnerability. The program increases the use of clean energy in the energy consumption and transition process, which in turn raises the energy costs for northern households. However, the rise in energy costs—beyond the fixed centralized heating fees generally implemented in the north—leads to greater fluctuations in electricity and fuel expenditures, further enhancing the program’s effect in reducing both the proportion of medical expenditures and catastrophic health expenditures. Despite the increase in energy costs, the health issues of energy-poor households in the north improve. This improvement may be reflected in the fact that under the incentives of the program and government subsidies, northern residents install more efficient energy equipment or switch to renewable energy, thereby reducing their dependence on traditional, high-pollution energy sources and improving their living conditions. As a result, health vulnerability and inequality are mitigated. This also suggests that while the use of clean energy may increase energy usage burdens and costs, the transition in the energy structure toward clean energy is beneficial for improving residents’ health conditions and reducing the likelihood of disease.
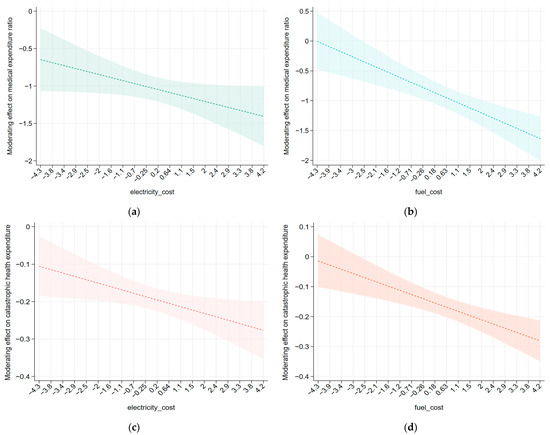
Figure 6.
The moderation effects of the Northern Clean Energy Program on household health vulnerability. (a) The moderation effect of electricity bills () on the proportion of medical expenditures; (b) the moderation effect of fuel costs () on the proportion of medical expenditures; (c) the moderation effect of electricity costs () on catastrophic health expenditures; (d) the moderation effect of fuel costs () on catastrophic health expenditures. In our analysis, the health deprivation indicator (used to measure health vulnerability) was excluded due to its insignificance. The dotted line represents the estimated effect based on Equation (8), and the shaded area surrounding the dotted line indicates the confidence interval. All of the moderating variables were ln-transformed and mean-centered.
3.4. The Sensitivity Test
Our analysis of the energy quota trading policy is based on the principles of the DiD model. To ensure the robustness of our results when applying the DiD method, we conducted a sensitivity analysis using two different testing approaches (Table 4).
Table 4.
Sensitivity test results.
The first approach involves shifting the policy implementation period forward to create a falsified policy period while retaining sample periods from regions that have never implemented energy quota trading. In doing so, we randomly select 2014 as a false start year for the energy quota trading pilot and replace the corresponding dummy variable related to the policy implementation period in our baseline interaction term. The second approach randomly constructs a treatment group from samples that have never implemented energy quota trading, with the remaining samples from regions that have never piloted the policy serving as the new control group. In this case, we replace the dummy variables related to the pilot and non-pilot group settings in the baseline interaction term. These sensitivity tests help validate the accuracy of our results and ensure the robustness of our findings regarding the effects of the energy quota trading policy.
4. Discussion
Ambitious energy transition policies may not necessarily target vulnerable populations [48,49], thereby deepening existing inequalities in energy and health. In regions with varying levels of development and distinct climate conditions, targeted and differentiated policies are essential. Our analysis further shows that during the implementation of market-based energy transition policies such as energy quota trading, households reduce their use of traditional solid fuels like coal and firewood, thereby shifting toward cleaner energy sources. However, this same policy has inadvertently intensified energy poverty in the pilot regions. Rising energy prices and increased expenditure due to extreme weather events, especially cold waves, may have led to an increase in the proportion of energy-poor households [50,51]. Although the energy quota trading policy has achieved positive outcomes at the macro-level in terms of the low-carbon transition and efficiency improvements, at the micro-level, vulnerable low-income households face greater economic pressure. These households have been unable to adapt to the rising costs associated with the energy transition, diminishing their ability to access and afford energy and ultimately worsening energy poverty. In light of these findings, policymakers and stakeholders must pay greater attention to the economic capacities of low-income households, particularly during periods of volatile energy prices and market fluctuations.
In contrast, the Northern Clean Energy Program has provided substantial subsidies and safeguards for energy-poor households, thereby enhancing social equity. This inclusive policy has significantly alleviated the health vulnerability of energy-poor households in the north. Following its implementation, there has been a marked reduction in health deprivation, the medical expenditure ratio, and the proportion of households facing catastrophic health expenditures. These results indicate that the policy has played a positive role in easing the economic pressures associated with health problems among energy-poor households. This program has helped reduce the use of traditional energy sources and improved residents’ health conditions, particularly during the winter heating period. When cold waves occur, the health damage to northern households is exacerbated further, making it even more difficult for energy-poor families to afford increased medical expenditures. Therefore, the formulation and implementation of the Northern Clean Energy Program are critically important to these households, as this policy yields tangible benefits by reducing both medical expenditures and catastrophic health costs.
One of the greatest challenges for energy-poor households during winter, especially under cold wave conditions, is an increase in energy costs. The Northern Clean Energy Program has promoted the adoption of energy transition technologies such as air-source and ground-source heat pumps and clean coal technologies. With the widespread installation of efficient and energy-saving equipment and the implementation of related subsidy strategies, energy-poor households have significantly reduced their reliance on traditional energy sources and solid fuels, thereby improving air quality and aiding in the prevention of respiratory and cardiovascular diseases. The introduction of clean heating technology not only reduces household energy burdens but also enhances residents’ overall health. Moreover, the implementation of the Northern Clean Energy Program has provided a strong impetus for social equity. By offering clean energy subsidies and transition strategies to northern households, this policy reduces economic pressures related to energy consumption and medical spending, thereby improving the quality of life for low-income groups and narrowing the health disparities among different socioeconomic segments. In northern areas, many households that rely on scattered coal burning are rural or energy-poor, and the Northern Clean Energy Program’s focus on these households ensures that the benefits of the clean energy transition extend to vulnerable groups.
We also examine the moderating mechanisms of households’ energy costs in the implementation of the Northern Clean Energy Program. Our analysis shows that both household electricity bills and fuel costs enhance the program’s mitigating effect on households’ health vulnerability, thereby accentuating the policy’s benefits. This finding illustrates that even inclusive energy transition policies have complex and variable effects. Although the transition to clean and sustainable energy increases households’ energy costs, these increases underscore the importance of energy subsidy policies in alleviating household economic burdens and reducing vulnerabilities related to energy poverty. Under the program’s incentives, local government agencies have installed more efficient, energy-saving equipment and promoted clean energy technologies, driving the upgrade and transition of household energy structures. This shift in the energy structure has significantly enhanced energy’s accessibility and affordability for households while also mitigating the other risks associated with energy poverty.
The innovations and contributions of this study are twofold. First, most studies on energy poverty and health issues have primarily focused on examining the relationship between these dimensions [52,53]. However, these investigations have often overlooked the influence of energy transitions on this relationship and failed to account for key household-level characteristics [54]. In contrast, our study innovatively examines the compounded effects of energy transition policies on the health vulnerabilities of energy-poor households.
Second, while most evaluations of energy transition policies have focused on the macro-level outcomes, such as emission reductions and economic growth [55,56], they have often neglected the significant potential impacts that these policies may have on households as micro-level units. We have developed a micro-level impact evaluation framework that is applicable to both market-based and inclusive energy transition policies. This framework enables us to analyze the combined effects of the energy quota trading policy and the Northern Clean Energy Program on households’ energy poverty and health vulnerability, as well as their potential to mitigate these vulnerabilities. In doing so, our study fills a critical gap in the literature on the micro-level impacts of energy transition policies, particularly in the area of inclusive energy subsidy policies.
5. Conclusions
The implementation of different energy transition policies may exacerbate households’ vulnerability and inequality, whereas inclusive policies mitigate the burden arising from the combined effects of health and energy vulnerability. Although the energy quota trading policy enhances the energy transition and the emission reduction performance at the macro-level, it inadvertently increases the economic pressures on energy-poor households. In contrast, as an inclusive policy, the Northern Clean Energy Program substantially alleviates the health problems and associated medical costs experienced by energy-poor households as a result of the energy transition. Therefore, when designing and implementing energy transition strategies, policymakers must consider household energy costs and other related issues. Only by balancing the efficiency of energy transitions with social equity and fairness can we promote a more just transformation of the energy structure and achieve a win–win situation for climate change mitigation. We recommend providing additional medical security in southern regions to ensure that energy-poor households receive timely and adequate healthcare during cold waves, thus reducing the risk of financial hardship due to excessive medical expenditures. Strengthening heating and cold-proofing infrastructure—such as expanding the coverage of centralized heating and installing better insulation materials—is also essential. For northern energy-poor households, the primary focus should be on providing energy assistance and heating subsidies to alleviate the economic burden of heating, improve the energy efficiency of heating facilities, and offer sufficient medical support to address residents’ health issues even amid climate shocks. Under the climate targets, energy transition measures aimed at mitigating climate change should be optimized by carefully balancing environmental goals with social equity and fairness. This approach will help ensure that the benefits of the energy transition and climate governance extend to the broader population, ultimately achieving equitable and sustainable development.
A critical area that requires further exploration in the study of energy poverty is intentional reductions in energy consumption in households as a way to manage financial pressures. In some cases, high energy spending might actually signal relative affluence because wealthier households can afford to use more energy without financial strain rather than energy poverty. Future research should develop methodologies to identify situations where households deliberately cut back on their energy use to cope with high costs. Moreover, studies could employ machine learning or other analytical techniques to model the determinants of socioeconomic efficiency, energy poverty, and health vulnerability. This would allow for a more nuanced simulation of various policy scenarios and provide valuable decision-making support for creating fair and efficient energy transition policies.
Author Contributions
Conceptualization: X.Y. Data curation: X.Y. and S.Y. Formal analysis: X.Y. Funding acquisition: P.J. Investigation: X.Y. and X.J. Methodology: X.Y. Software: X.Y. Supervision: P.J. Validation: P.J. Visualization: X.Y. Writing—original draft: X.Y. Writing—review and editing: Z.C. and P.J. All authors have read and agreed to the published version of the manuscript.
Funding
This research was funded by the Shanghai Science and Technology Commission (Grant No. 23ZR1404100), the Sino-German Center (Grant No. M-0049), and Fudan Tyndall Centre of Fudan University (Grant No. IDH6286315).
Data Availability Statement
The household-level data used in this study were provided by the Institute of Social Science Survey of Peking University (www.isss.pku.edu.cn/cfps, accessed on 2 December 2024) and can only be accessed through their registration process; direct sharing by the authors is not permitted. The other data presented in this study are available on request from the corresponding author.
Conflicts of Interest
The authors declare no conflicts of interest.
References
- Huang, L.; Nock, D.; Cong, S.; Qiu, Y. Inequalities across cooling and heating in households: Energy equity gaps. Energy Policy 2023, 182, 113748. [Google Scholar] [CrossRef]
- Carter, E.; Zhang, S.; Lai, K.H.; Yang, Y.; Li, D.; Huang, Y.; Ma, Y.; Shao, X.; Ebert, M.; Lamsal, T.N.; et al. Household transitions to clean energy in a multiprovincial cohort study in China. Nat. Sustain. 2020, 3, 42–50. [Google Scholar] [CrossRef] [PubMed]
- Wang, Q.; Li, X.; Zheng, Y.; Liu, X.; Lu, Y.; Zhou, N. Examining energy inequality under the rapid residential energy transition in China through household surveys. Nat. Energy 2023, 8, 251–263. [Google Scholar] [CrossRef]
- Ballesteros-Arjona, V.; Lopez-Villanueva, C.; Herrera-Gomez, A.; Molina-Garcia, A. What are the effects of energy poverty and interventions to ameliorate it on people’s health and well-being? A scoping review with an equity lens. Energy Res. Soc. Sci. 2022, 87, 102456. [Google Scholar] [CrossRef]
- Churchill, S.A.; Smyth, R. Energy poverty and health: Panel data evidence from Australia. Energy Econ. 2021, 97, 105219. [Google Scholar] [CrossRef]
- Liu, L.; Sheng, J. Energy quota trading and energy vulnerability: China’s energy quota trading pilot. Energy Policy 2024, 184, 113869. [Google Scholar] [CrossRef]
- National Development and Reform Commission of China. The Pilot Scheme for Paid Use and Trading of Energy Quotas. Available online: http://www.gov.cn/xinwen/2016-09/21/content_5110262.htm (accessed on 25 March 2025).
- Coase, R.H. The problem of social cost. J. Law Econ. 2013, 56, 837–877. [Google Scholar] [CrossRef]
- Crocker, T. The Structuring of Atmospheric Pollution Control Systems, Volume 1 of the Economics of Air Pollution; Harold Wolozin: New York, NY, USA, 1966; pp. 61–86. [Google Scholar]
- Dales, J.H. Pollution, Property and Prices: An Essay in Policy-Making and Economics. Univ. Tor. Law J. 1968, 19, 277–278. [Google Scholar]
- Yang, M.; Hou, Y.; Fang, C.; Duan, H. Constructing energy-consuming right trading system for China’s manufacturing industry in 2025. Energy Policy 2020, 144, 111602. [Google Scholar] [CrossRef]
- Pan, Y.; Dong, F. Design of energy use rights trading policy from the perspective of energy vulnerability. Energy Policy 2022, 160, 112668. [Google Scholar] [CrossRef]
- Wang, Y.; Hang, Y.; Wang, Q. Joint or separate? An economic-environmental comparison of energy-consuming and carbon emissions permits trading in China. Energy Econ. 2022, 109, 105949. [Google Scholar] [CrossRef]
- Xian, Y.; Wang, K.; Wei, Y.M.; Huang, Z. Opportunity and marginal abatement cost savings from China’s pilot carbon emissions permit trading system: Simulating evidence from the industrial sectors. J. Environ. Manag. 2020, 271, 110975. [Google Scholar] [CrossRef] [PubMed]
- Huang, H.; Roland-Holst, D.; Springer, C.; Lin, J.; Cai, W.; Wang, C. Emissions trading systems and social equity: A CGE assessment for China. Appl. Energy 2019, 235, 1254–1265. [Google Scholar] [CrossRef]
- Campos, I.; Brito, M.; De Souza, D.; Santino, A.; Luz, G.; Pera, D. Structuring the problem of an inclusive and sustainable energy transition—A pilot study. J. Clean. Prod. 2022, 365, 132763. [Google Scholar] [CrossRef]
- Chapman, A.; Okushima, S. Engendering an inclusive low-carbon energy transition in Japan: Considering the perspectives and awareness of the energy poor. Energy Policy 2019, 135, 111017. [Google Scholar] [CrossRef]
- Olivia, S.; Gibson, J.K. Household energy demand and the equity and efficiency aspects of subsidy reform in Indonesia. Energy J. 2008, 29, 21–39. [Google Scholar] [CrossRef]
- Romero Rodríguez, L.; Sánchez Ramos, J.; Guerrero Delgado, M.C.; Molina Félix, J.L.; Álvarez Domínguez, S. Mitigating energy poverty: Potential contributions of combining PV and building thermal mass storage in low-income households. Energy Conv. Manag. 2018, 173, 65–80. [Google Scholar] [CrossRef]
- Wirawan, H.; Gultom, Y.M.L. The effects of renewable energy-based village grid electrification on poverty reduction in remote areas: The case of Indonesia. Energy Sustain. Dev. 2021, 62, 186–194. [Google Scholar] [CrossRef]
- Zarepour, Z.; Wagner, N. Cash instead of subsidy: Assessing the impact of the Iranian energy subsidy reform on households. Energy Policy 2022, 168, 113145. [Google Scholar] [CrossRef]
- Llorca, M.; Rodriguez-Alvarez, A.; Jamasb, T. Objective vs. subjective fuel poverty and self-assessed health. Energy Econ. 2020, 87, 104736. [Google Scholar] [CrossRef]
- Gilbertson, J.; Grimsley, M.; Green, G. Psychosocial routes from housing investment to health: Evidence from England’s home energy efficiency scheme. Energy Policy 2012, 49, 122–133. [Google Scholar] [CrossRef]
- National Development and Reform Commission of China. Notice on the Issuance of the Winter Clean Energy Program (2017–2021) in the Northern Region. Available online: https://www.gov.cn/xinwen/2017-12/20/content_5248855.htm (accessed on 29 March 2025).
- Xue, W.; Wang, L.Y.; Yang, Z.; Xiong, Z.; Li, X.; Xu, Q.; Cai, Z. Can clean heating effectively alleviate air pollution: An empirical study based on the plan for cleaner winter heating in northern China. Appl. Energy 2023, 351, 121923. [Google Scholar] [CrossRef]
- Ma, R.; Deng, L.; Ji, Q.; Zhai, P. Environmental regulations, clean energy access, and household energy poverty: Evidence from China. Technol. Forecast. Soc. Chang. 2022, 182, 121862. [Google Scholar] [CrossRef]
- Chen, P.; Wu, Y.; Meng, J.; He, P.; Li, D.; Coffman, D.M.; Liang, X.; Guan, D. The heterogeneous role of energy policies in the energy transition of Asia–Pacific emerging economies. Nat. Energy 2022, 7, 588–596. [Google Scholar] [CrossRef]
- Zhang, G.; Zhang, N. The effect of China’s pilot carbon emissions trading schemes on poverty alleviation: A quasi-natural experiment approach. J. Environ. Manag. 2020, 271, 110973. [Google Scholar] [CrossRef]
- Wang, G.; Zhang, Q.; Li, Y.; Mclellan, B.C.; Pan, X. Corrective regulations on renewable energy certificates trading: Pursuing an equity-efficiency trade-off. Energy Econ. 2019, 80, 970–982. [Google Scholar] [CrossRef]
- Yao, S.; Zhang, Z.; Hanmer, L. Growing inequality and poverty in China. China Econ. Rev. 2004, 15, 145–163. [Google Scholar] [CrossRef]
- Bukari, C.; Broermann, S.; Okai, D. Energy poverty and health expenditure: Evidence from Ghana. Energy Econ. 2021, 103, 105565. [Google Scholar] [CrossRef]
- Thomson, H.; Snell, C.; Bouzarovski, S. Health, well-being and energy poverty in Europe: A comparative study of 32 European countries. Int. J. Environ. Res. Public Health 2017, 14, 584. [Google Scholar] [CrossRef]
- Zhang, S.; Guo, Q.; Smyth, R.; Yao, Y. Extreme temperatures and residential electricity consumption: Evidence from Chinese households. Energy Econ. 2022, 107, 105890. [Google Scholar] [CrossRef]
- Bloom, D.; Canning, D. The Health and Poverty of Nations: From theory to practice. J. Hum. Dev. 2003, 4, 47–71. [Google Scholar] [CrossRef]
- Card, D.; Krueger, A.B. Minimum wages and employment: A case study of the fast-food industry in New Jersey and Pennsylvania. Am. Econ. Rev. 1994, 84, 772–793. [Google Scholar] [CrossRef]
- Angrist, J.D.; Krueger, A.B. Does compulsory school attendance affect schooling and earnings? Q. J. Econ. 1991, 106, 979–1014. [Google Scholar] [CrossRef]
- Xie, Y.; Zhang, X.; Tu, P.; Ren, Q.; Sun, Y.; Lv, P.; Ding, H.; Hu, J.; Wu, Q. China Family Panel Studies User’s Manual, 3rd ed.; Peking University: Beijing, China, 2017. [Google Scholar]
- Zhou, Q.; Shi, W. Socio-economic transition and inequality of energy consumption among urban and rural residents in China. Energy Build. 2019, 190, 15–24. [Google Scholar] [CrossRef]
- Taylor, L. Fuel Poverty: From Cold Homes to Affordable Warmth. Energy Policy 1993, 21, 1071–1072. [Google Scholar] [CrossRef]
- Sigaud, L.; Daley, A.; Rubin, J.; Noblet, C. The effects of recent minimum wage increases on self-reported health in the United States. Soc. Sci. Med. 2022, 305, 115110. [Google Scholar] [CrossRef]
- Mossey, J.M.; Shapiro, E. Self-rated health: A predictor of mortality among the elderly. Am. J. Public Health 1982, 72, 800–808. [Google Scholar] [CrossRef]
- Zhong, M.; Qiang, D.; Wang, J.; Sun, W. Improving health and reducing health inequality: An innovation of digitalization? Soc. Sci. Med. 2024, 348, 116847. [Google Scholar] [CrossRef]
- WHO Expert Consultation. Appropriate body-mass index for Asian populations and its implications for policy and intervention strategies. Lancet 2004, 363, 157–163. [Google Scholar] [CrossRef]
- Lin, C.; Li, X. Carbon peak prediction and emission reduction pathways exploration for provincial residential buildings: Evidence from Fujian Province. Sustain. Cities Soc. 2024, 102, 105239. [Google Scholar] [CrossRef]
- Li, W.; Zhang, F.; Pan, L.; Li, Z. Scenario analysis of carbon emission trajectory on energy system transition model: A case study of Sichuan Province. Energy Strateg. Rev. 2023, 45, 101015. [Google Scholar] [CrossRef]
- Haines, A.; Kovats, R.S.; Campbell-Lendrum, D.; Corvalán, C. Climate change and human health: Impacts, vulnerability, and mitigation. Lancet 2006, 367, 2101–2109. [Google Scholar] [CrossRef] [PubMed]
- Dang, N.; Wang, Q.; Zhou, K.; Zhou, T. Coordinated transition of the supply and demand sides of China’s energy system. Renew. Sust. Energy Rev. 2024, 203, 114744. [Google Scholar] [CrossRef]
- Henry, C.L.; Baker, J.S.; Shaw, B.K.; Kondash, A.J.; Leiva, B.; Castellanos, E.; Vandenbergh, M.P.; Bell, S.E. How will renewable energy development goals affect energy poverty in Guatemala? Energy Econ. 2021, 104, 105665. [Google Scholar] [CrossRef]
- McGee, J.A.; Greiner, P.T. Renewable energy injustice: The socio-environmental implications of renewable energy consumption. Energy Res. Soc. Sci. 2019, 52, 102949. [Google Scholar] [CrossRef]
- Chen, H.; Gao, K.; Tian, S.; Sun, R.; Cui, K.; Zhang, Y. Nexus between energy poverty and sustainable energy technologies: A roadmap towards environmental sustainability. Sustain. Energy Technol. Assess. 2023, 56, 102949. [Google Scholar] [CrossRef]
- Muhammad, S.; Pan, Y.; Ke, X.; Agha, M.H.; Borah, P.S.; Akhtar, M. European transition toward climate neutrality: Is renewable energy fueling energy poverty across Europe? Renew. Energy 2023, 208, 181–190. [Google Scholar] [CrossRef]
- Nie, P.; Li, Q.; Sousa-Poza, A. Energy poverty and subjective well-being in China: New evidence from the China Family Panel Studies. Energy Econ. 2021, 103, 105548. [Google Scholar] [CrossRef]
- Zhang, Z.; Shu, H.; Yi, H.; Wang, X. Household multidimensional energy poverty and its impacts on physical and mental health. Energy Policy 2021, 156, 112381. [Google Scholar] [CrossRef]
- Carley, S.; Konisky, D.M. The justice and equity implications of the clean energy transition. Nat. Energy 2020, 5, 569–577. [Google Scholar] [CrossRef]
- Zhang, Y.; Guo, S.; Shi, X.; Qian, X.; Nie, R. A market instrument to achieve carbon neutrality: Is China’s energy-consumption permit trading scheme effective? Appl. Energy 2021, 299, 117338. [Google Scholar] [CrossRef]
- Che, S.; Wang, J. Policy effectiveness of market-oriented energy reform: Experience from China energy-consumption permit trading scheme. Energy 2022, 261, 125354. [Google Scholar] [CrossRef]

Disclaimer/Publisher’s Note: The statements, opinions and data contained in all publications are solely those of the individual author(s) and contributor(s) and not of MDPI and/or the editor(s). MDPI and/or the editor(s) disclaim responsibility for any injury to people or property resulting from any ideas, methods, instructions or products referred to in the content. |
© 2025 by the authors. Licensee MDPI, Basel, Switzerland. This article is an open access article distributed under the terms and conditions of the Creative Commons Attribution (CC BY) license (https://creativecommons.org/licenses/by/4.0/).