1. Introduction
The interdisciplinary approach to financial energy (cf. [
1]) allows it to be linked to the overall financial condition of an entity, which is influenced by various factors, including the utilization of equity and external capital, as well as the treatment of money as a source of energy [
2,
3]. Using the energy of finance, it is possible to increase the capacity of organizations and their ability to carry out their functions [
4]. Building on our previous research [
3,
5] and drawing upon Korol’s conceptualizations [
6,
7], this paper adopts the notion of “
financial energy of a farm”, defined as the entity’s overall financial situation. Financial energy allows organizations to make investments and serves as the basis for their development. The financial energy of agricultural holdings is therefore closely linked to their level of financial liquidity, indebtedness, and profitability. Agricultural holdings are characterized by a high or optimal level of financial liquidity [
8], which is related both to the specific nature of agricultural production and to the financial decision-making conditions of these entities. These farms maintain high inventory levels, which is associated with the continuity of agricultural production and with livestock farming. Moreover, the indebtedness of agricultural holdings remains relatively low [
3], which is determined by both micro- and macroeconomic factors. The profitability of agricultural holdings, in the context of financial energy, generally ensures their capacity for self-financing operations. It is also important in the process of obtaining external capital. Thus, sources of financial energy can be understood as the ability to self-finance operations, access to external capital, and its effective use—in other words, the broadly understood flow of money. The flow of financial energy in agricultural holdings is crucial for the development of individual farms as well as from a broader, global perspective. Consequently, it was considered that, financial energy is pivotal in shaping farms’ financial security. Drawing on the approach that considers money as a source of energy [
2], this paper explores the significance of financial energy for ensuring farm financial security. Financial security is understood as the ability of an agricultural holding to meet its current liabilities [
9], while also being capable of increasing the return on equity through the optimal use of its available resources.
Furthermore, financial security provides a sense of certainty in running a business and creates the conditions for its growth [
10]. Davydenko et al. [
11] point out the complexity of the concept of financial security and the need to take into account in this aspect both the external and internal risks of the business, the justification of the company’s development strategy, taking into account the changing external environment, as well as the company’s available financial resources, i.e., access to financial energy. In a broad sense, financial security is derived from the various categories of risks that directly or indirectly affect an entity’s financial position [
12]. The literature also emphasizes that financial security can be ensured not only by maintaining a stable financial position of an entity, but also through its strategic development and the creation of conditions that will enable the implementation of a financial mechanism capable of adapting to future changes in the environment, both internal and external [
13]. Financial energy may constitute the potential to create such a financial mechanism.
An interesting issue is the link between financial energy and financial security in the context of sustainable agricultural development. The idea of creating and implementing a development model that takes into account the necessity to meet the needs of future generations to the same extent as the current generation [
14] is extremely difficult and complex. This is due to both the importance of the problem and the global dimension of this issue, as well as the multidimensionality of the sustainable development goals of the 2030 Agenda [
15]. One important issue is the implementation of economic aspects. In this context, eliminating hunger and poverty is especially significant [
16]. Agriculture is therefore the sector around which many of the defined goals are focused. This is due to the fact that farmers manage the majority of natural resources. Therefore, they focus on activities aimed at eliminating hunger or poverty, as well as those related to environmental protection and adaptation to climate change.
In the context of sustainable development in agriculture, attention should be paid to the determinants for the functioning of farms [
17]. On the one hand, agriculture can lead to the degradation of the natural environment, but on the other hand, it creates natural assets. The positive, negative, or environmentally neutral effect of agricultural work depends on the practices used as well as the sources of energy used. The full sustainability of agriculture occurs only when significant changes occur simultaneously in three spheres: economic, ecological, and social [
17]. The sustainable development goals pay particular attention to small (small-scale) farms. The assumption is that the income of these entities should be doubled by 2030. Research conducted in the field of financial management of farms, in the sphere of both investment and operational activities, shows that there are many factors determining farm income [
18,
19,
20,
21,
22,
23]. Financial security takes into account many of the aspects discussed in this area; therefore, the identification of the determinants of the financial security of economically small farms is part of the trend of research on the sustainable development of agriculture. Research conducted using factor analysis proves that there is a need to take into account the specificity of agricultural activity when examining the financial security of farms [
24], as well as their economic power. The level of financial security of farms classified according to their economic size varies greatly, which is also linked to access to financial energy. Previous studies have shown that economic size determines the financial performance of farms [
8]. The strongest units make greater use of external financing sources and, at the same time, are exposed to a higher risk of doing business. Farms with a small economic size achieve higher profitability than medium-sized entities, which may result from a more cautious management strategy. Medium-sized entities, on the other hand, demonstrate high liquidity as well as financial independence. Therefore, there is a noticeable variation in financial management among farms of different economic sizes [
25], which confirms the need to analyze financial security separately for each economic size class.
Our previous study [
24] demonstrated that when conducting research on the financial security of farms, the direction of their production should be taken into account. In the course of the study, we proved that it is necessary to consider these factors separately for farms that focus on crop production and those that focus on livestock production [
24]. This study analyzes the importance of financial energy for farm financial security. The objective of the study is to assess the factors that determine the financial security of EU farms using factor analysis. The remainder of the paper is structured as follows:
Section 2 delineates the research methodology and data sources.
Section 3 presents the empirical research findings. The last section of the paper summarizes the results and propose potential areas that could be explored in future research.
2. Materials and Methods
The data source used in this study is FADN (Farm Accountancy Data Network) statistics. These data are collected in a uniform way for farms conducting agricultural activity in European Union (EU) countries that have a significant share in creating added value in agriculture [
26]. The FADN system includes a representative selection of farms in the sample based on the criteria of economic size, agricultural type, and geographical location, both at the level of the European Union as well as individual countries or FADN regions). The published data refer to an average farm in a given category. The data used were extracted taking into account geographical location and economic size. This research concerns the European Union and individual regions of European Union countries (spatial scope of research). Data for Great Britain were not included in the analyses. The subjective scope is an average European Union farm and average farms distinguished in individual regions and according to individual economic size classes. The economic size of a farm means the sum of the values of Standard Output (SO) of all agricultural activities occurring on the farm. Standard Output (SO) is the 5-year average value of production of a specific agricultural activity (plant or animal) obtained from 1 ha or 1 animal in 1 year, under average production conditions for a given region. In order to eliminate fluctuations in production values, averages from 5 years of the relevant period are used for calculations [
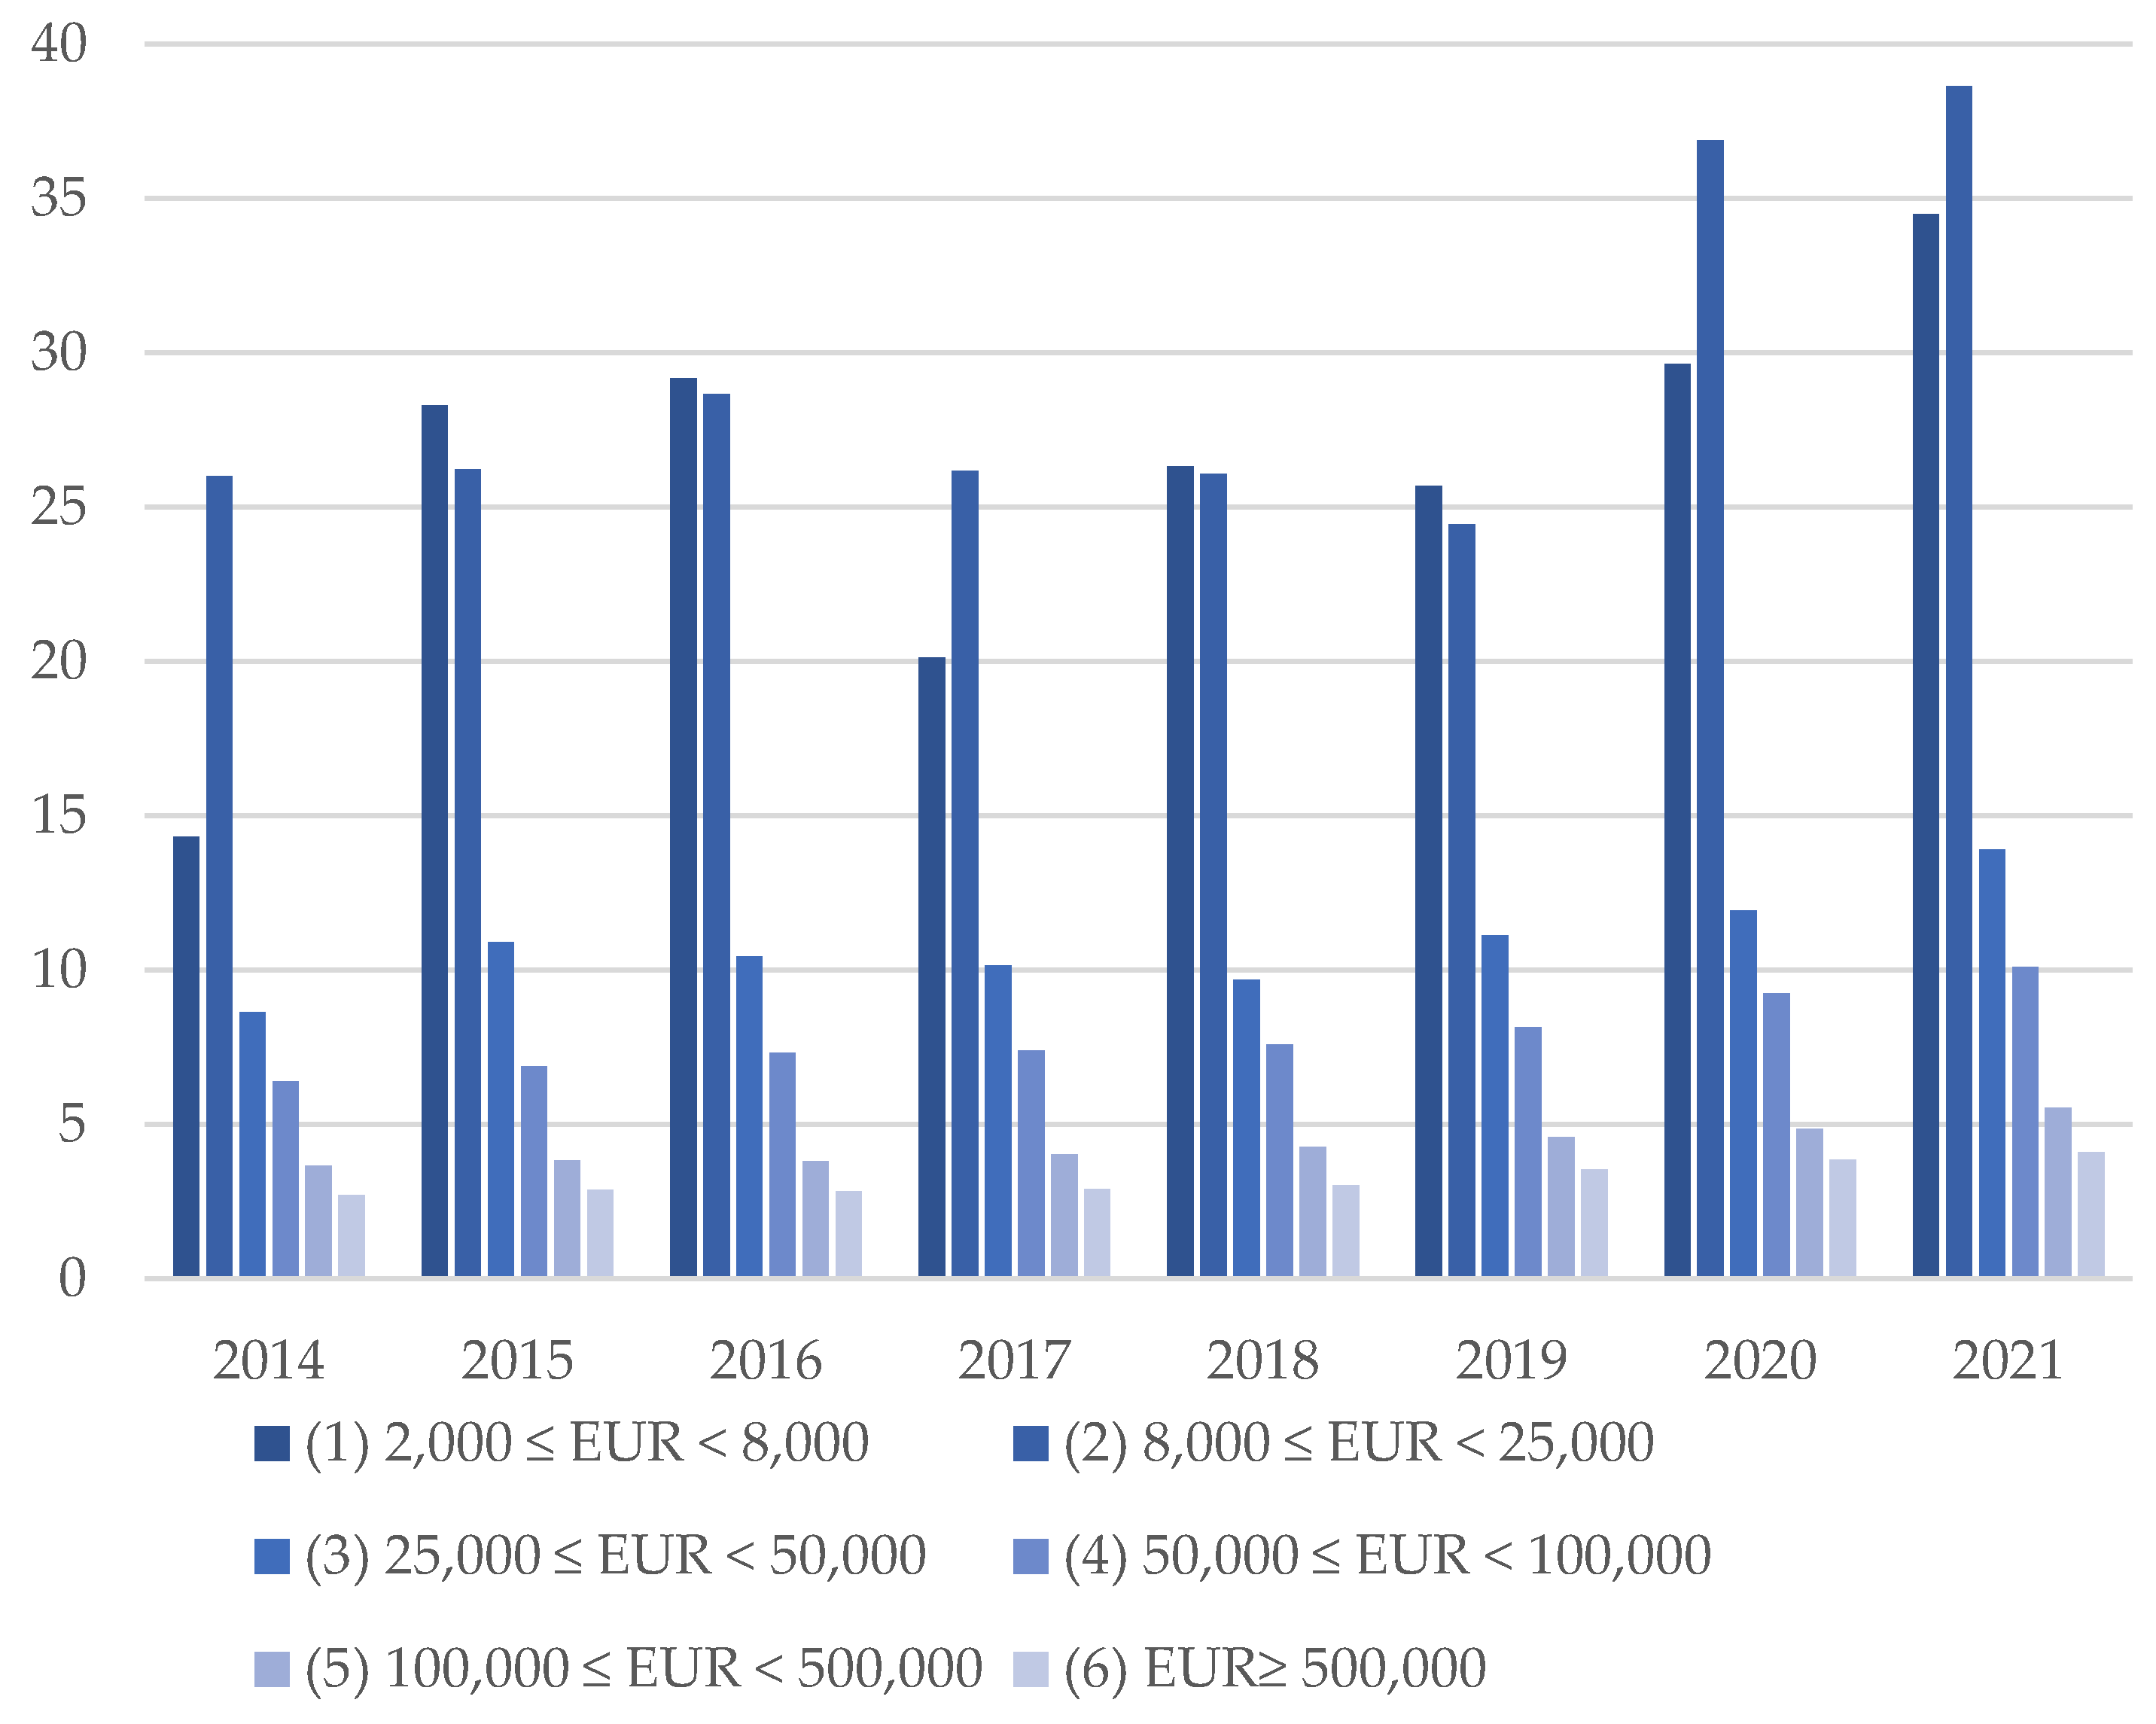
26]. On this basis, six classes of the economic size of farms can be distinguished: very small farms (1) where the sum of the values of Standard Output (SO) falls within the range of EUR 2000 to less than EUR 8000; small farms (2): 8000 ≤ EUR < 25,000; medium–small (3): 25,000 ≤ EUR <50,000; medium–large (4): 50,000 ≤ EUR < 100,000; large (5): 100,000 ≤ EUR < 500,000; and very large (6): ≥EUR 500,000. All analyses were conducted based on data provided by the EUFADN system [
27].
The temporal scope of the study for assessing the level of financial security of farms covers the years 2014–2021. For the factor analysis, data for these regions for 2014, 2017, and 2020 were adopted. The choice of three periods results from the fact that agriculture is characterized by high price variability and production value, which is related, among others, to natural risk [
28].
This research was carried out in two stages. The first included an assessment of the level of financial security of an average European Union farm, with particular emphasis on small farms. For this purpose, the indicator proposed by Ryś-Jurek [
29] was used:
where:
FS—Financial security ratio
GB—golden balance sheet rule (equity/fixed assets)
QR—quick ratio (current assets – inventory – non-breeding livestock)/current liabilities)
DR—total liabilities to total assets (total liabilities/total assets)
NWCTA—coverage of assets by net working capital ((current assets-current liabilities)/total assets))
PEC—profitability of equity capital (farm net income/equity)
A score of <0 means no financial security, (0.0–2.0) means a risk of losing financial security, (2.00–5.0) means financial security, (5.0–7.0) means high financial security, and a result >7.0 means above-threshold financial security. The research was carried out taking into account the breakdown into six classes of economic size.
In the second stage of the research, the links between the determinants of farm financial security were identified. Six classes of economic values distinguished within the FADN system have been divided into three groups. The small farm group included the very small (1) and small (2) classes. The medium group included medium–small (3) and medium–large (4) farms. The large group included large (5) and very large (6) entities. For this purpose, data on average farms separated by economic size in individual EU regions were obtained from the FADN System. In total, 1679 cases were taken into account, including 349 small farms, 690 medium-sized farms, and 640 large farms. Factor analysis was used in the research conducted in stage two.
The financial security of farms depends on a large number of correlated variables. Including all of them, e.g., in regression models, may lead to multicollinearity. Factor analysis was used instead of removing some variables, which would result in losing some of the information contained in them.
Factor analysis postulates that there are a small number of latent variables (factors) and that each observed variable contains part of one or more factors. This method reduces the number of variables in a different way than principal component analysis, which replaces the observed variables with several orthogonal linear combinations of those variables [
30,
31,
32,
33]. The main reason for choosing factor analysis was the possibility of identifying and naming these latent variables. PCA, in the presence of highly positively correlated variables, often produces orthogonal components that are difficult to interpret.
The validity of using factor analysis is checked using Bartlett’s test of sphericity and the Kaiser–Meyer–Olkin (KMO) measure, and both criteria are based on the analysis of the correlation matrix of observed variables [
34].
In matrix form, the model can be written using the formula [
32]:
where:
X—vector of observed variables
A = (aij)—matrix of coefficients of linear combinations called factor loadings
F—vector of common factors
U—vector of specific factors
B—diagonal matrix of factor loadings of specific components
Based on research conducted in earlier periods [
9,
10,
11,
12,
13,
29,
35,
36,
37,
38,
39,
40], our previous studies [
24], and the methodological assumptions of the FADN system, a set of variables shaping the financial security of European Union farms was identified (
Table 1). The first variable is Area, which reflects the size of the farm in terms of its area. Land is one of the basic production factors in agriculture. The next variables are Inputs and Taxes. Both influence the income level achieved by the surveyed entities. FixedAssets, Livestock, and Stock reflect the assets held, which are used in the agricultural production process. It was assumed that the level of investments made (GrossInv, NetInv) is also important for the financial security of farms. Moreover, taking into account the adopted definition of the financial energy of a farm, it can be assumed that its source is the following variables: NetIncome, CircCapital, LoMeLoans, ShLoans, CashFlow1, CashFlow2, and Subsidies. NetIncome is a variable that reflects the economic surpluses achieved by the farm. The increase in Farm Net Income meets the assumptions of implementing the economic aspects of the sustainable development goals. It also means the source of financial energy of the farm generated as a result of agricultural activity. The ability to self-finance the activity is also reflected by the variables CashFlow1 and CashFlow2. Financial energy obtained from internal sources is the most frequently used capital in agricultural production. Farm income is also supplied by subsidies for operating activity. In line with the FADN methodology, CircCapital represents the amount of cash held by a farm. Moreover, farms also obtain external capital, which, in the context of maintaining financial liquidity, impacts their overall financial security (LoMeLoans, ShLoans). The variables were tested in the second stage of the research.
Factor analysis was carried out in
R, ver. 4.3.0 [
41] using packages
psych [
42],
GPArotation [
43], and graphics package
ggplot2 when creating diagrams.
3. Results
The assessment of the financial security of small farms in the European Union began with presenting the indicator level for farms classified as small (very small farms (1) and small farms (2)), compared to other classes (
Figure 1). Detailed data on the individual economic size classes and the components of the financial security indicator are presented in
Table A1.
There are very large differences in the level of financial security of farms in different economic size classes. Small farms (groups 1 and 2) had an average index level of over 26, where from a level above 7, above-threshold financial security is demonstrated. It is worth emphasizing the high increase in the indicator level of this group in 2020–2021. The period of economic uncertainty contributed to an even more conservative strategy regarding the level of financial security. This was primarily due to the increase in financial liquidity (
Table A1). Medium-sized farms (groups 3 and 4) also showed above-threshold financial security; however, the average values in these groups were much lower. They did not exceed the level of 13.9. Those entities that achieved the highest economic size (groups 5 and 6) maintained an optimal or high level of financial security. In the context of the sustainable development of farms, the following question arises: What factors determine such a high level of financial security, which at the same time means low economic size? An increase in the income of these entities can also be achieved by optimizing the interaction between investment, financial, and operational decisions, including financial energy supply.
In the next stage of the research, the links between variables potentially determining the financial security of small farms were assessed, comparing them with all farms, as well as with the medium and large groups. These groups were differentiated from each other. Descriptive statistics of the variables are presented in
Table A2,
Table A3,
Table A4 and
Table A5. Small farms stand out from the other groups. They have a smaller area (median is 9.85 ha) and the value of fixed assets (79,984 EUR). This also affects the amount of economic surpluses generated. The medium farm income is PLN 7658.2 EUR, and for large entities 126,613.4 EUR.
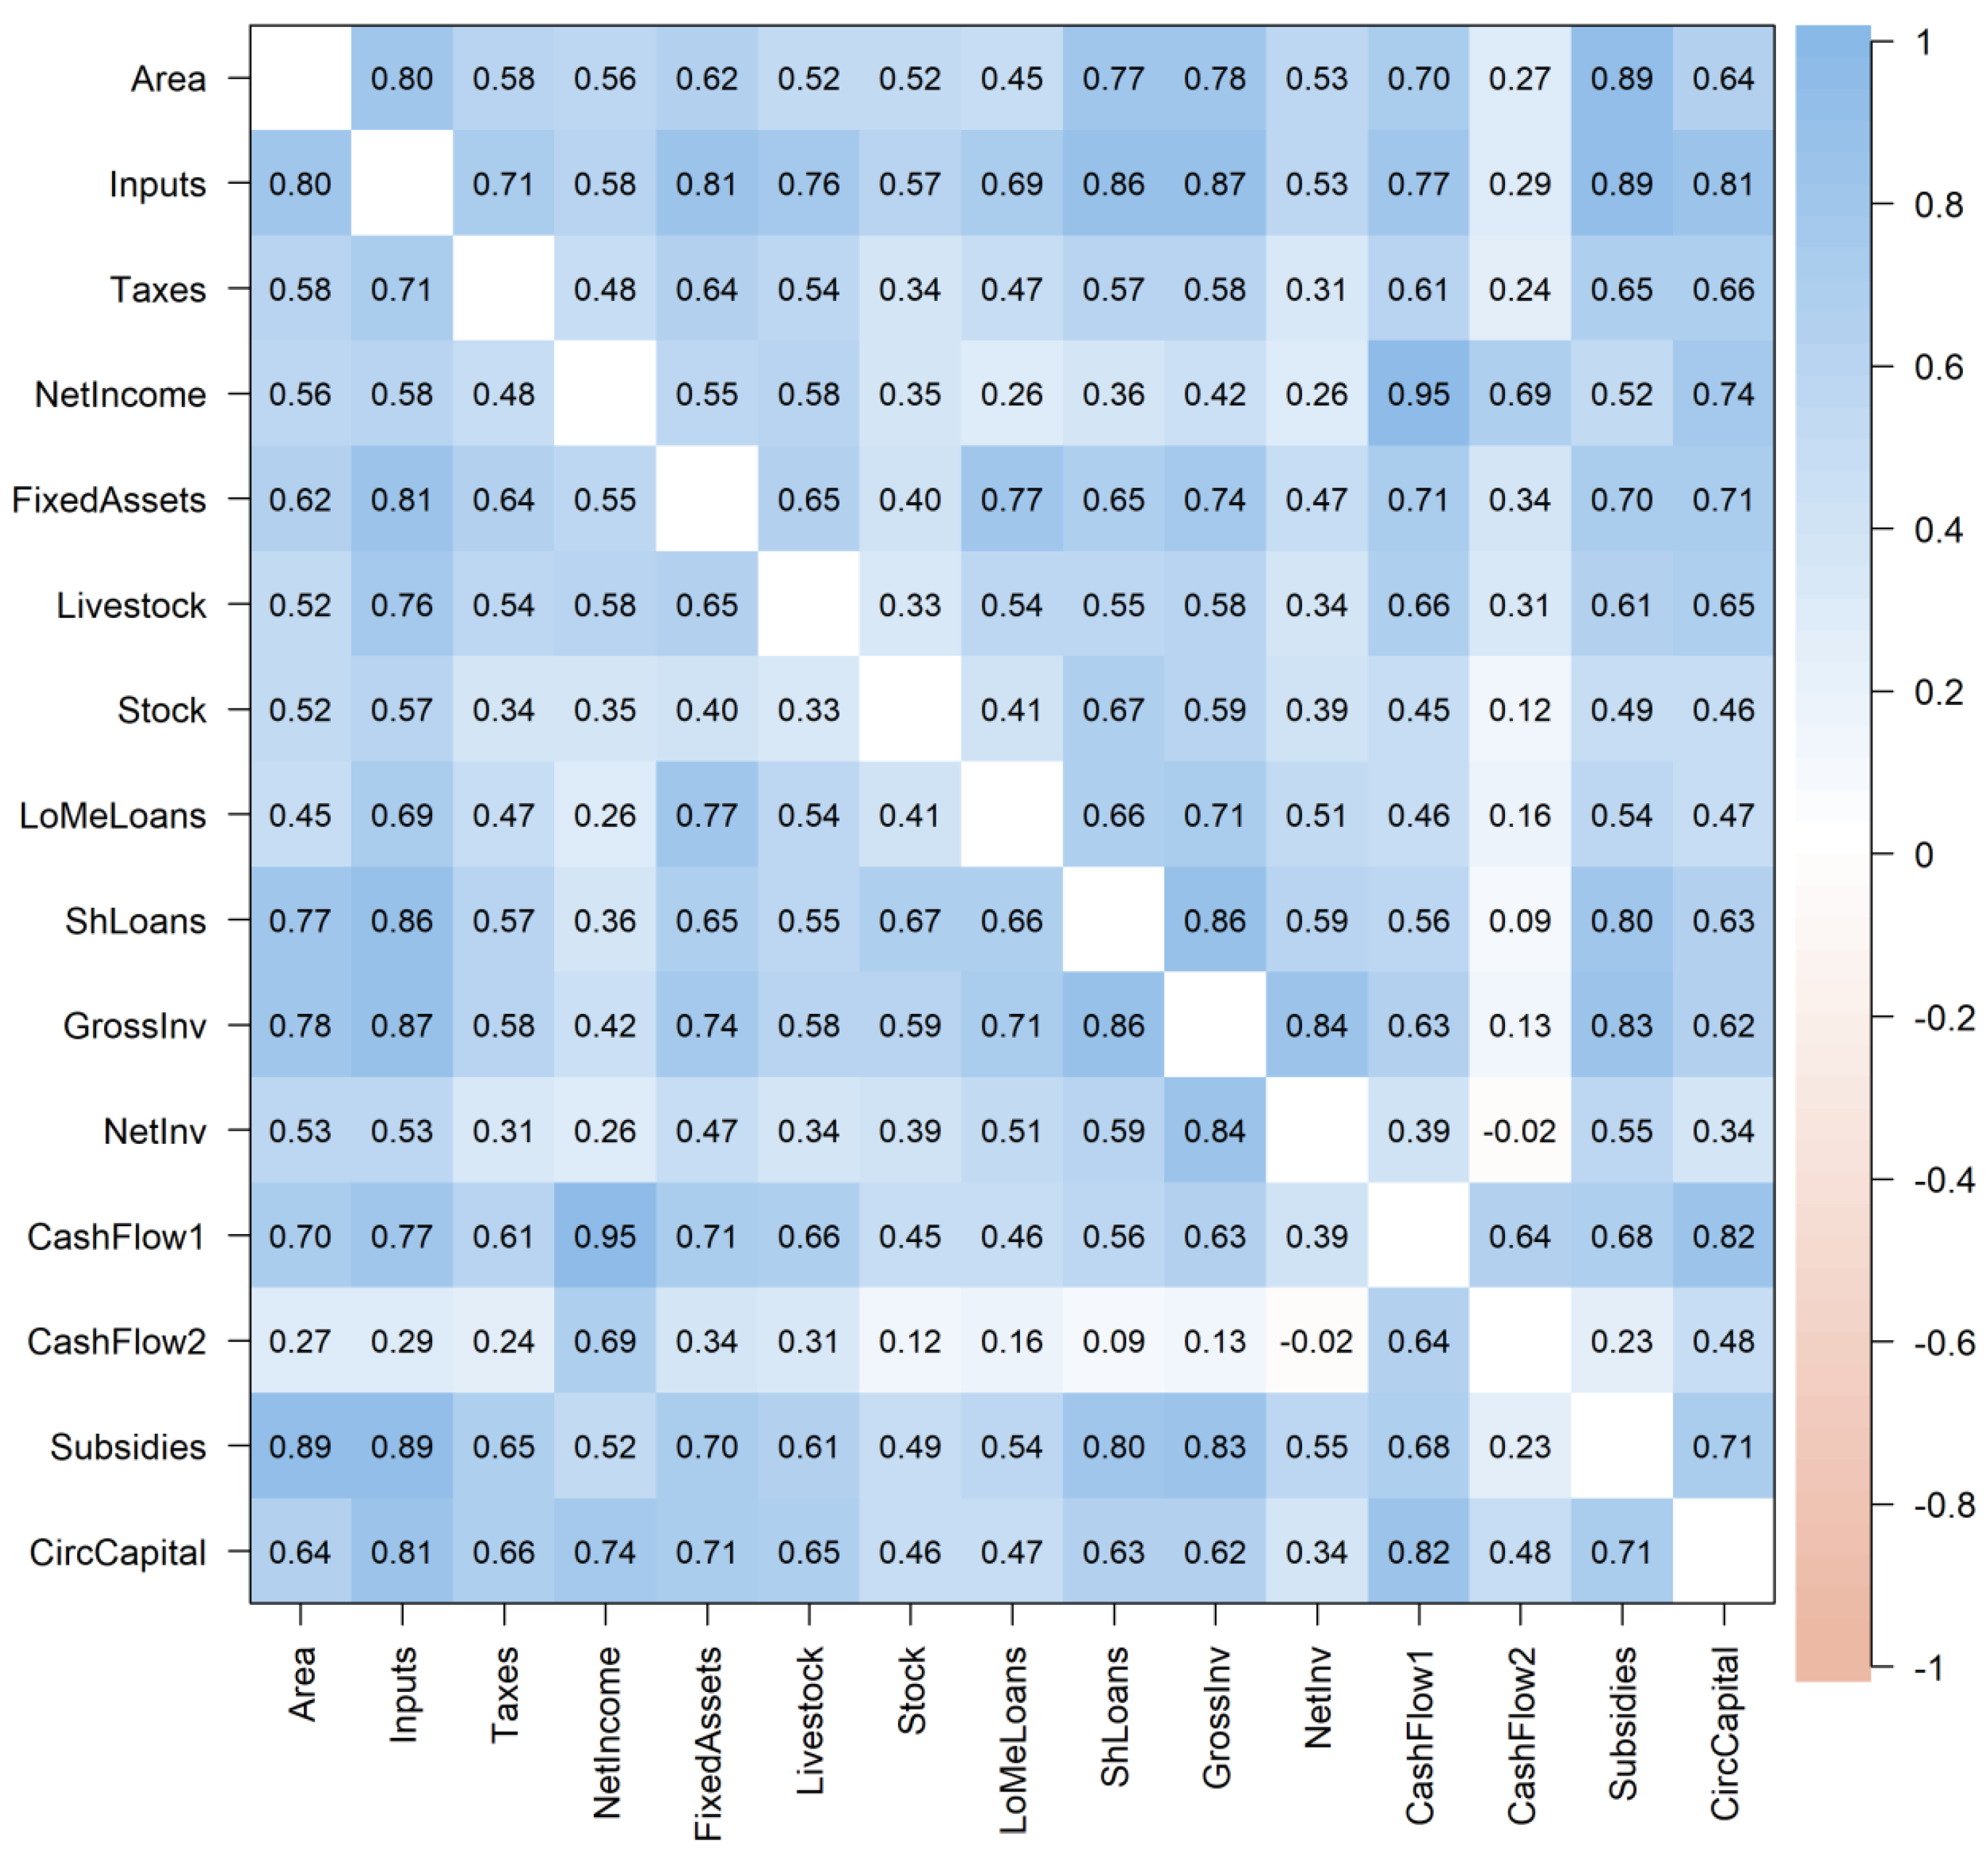
The variables selected for the study on the basis of merit are highly correlated with each other (
Figure 2).
The following variables achieved coefficients exceeding the level of 0.80: Area and Subsidies (0.89); Inputs together with CircCapital (0.81); Subsides (0.89); GrossInv (0.87); ShLoans (0.86); FixedAssets (0.81), as well as NetIncome with CashFlow1 (0.95); ShLoans from GrossInv (0.86); GrossInv with NetInv (0.84) and CashFlow1 and CircCapital (0.82). All but one variable (Area) are expressed in Euros. These variables have not been scaled so as not to change their actual weight. Area has been scaled to equate its mean with the average mean of the monetary variables.
The KMO measure of the adequacy of the selection of input variables for factor analysis was 0.86 for farms of all sizes; 0.61, 0.66 and 0.82 for small, medium, and large farms, respectively (all above the admissibility threshold of 0.6). The adequacy of the selection of individual variables (SMA) is given in
Table 2. Bartlett’s test of sphericity also confirmed the validity of using factor analysis (
in all four cases).
Most of the variables considered are, to one extent or another, related to the scale of farms in a given region; therefore, the assumption of the orthogonality of factors is unjustified. For this reason, a non-orthogonal oblimin rotation was used [
44].
First, the variables were reduced for all the surveyed farms in the European Union. Horn’s parallel analysis [
45] showed the optimal number of 4 factors. Loadings of variables with values above 0.1 in individual factors are presented in
Table 3.
The variables most loaded by factor 1 are Area, Subsidies (financial energy), ShLoans (financial energy), Inputs, Taxes, and Stock; factor 2—NetIncome (financial energy), CashFlow1 (financial energy), CashFlow2 (financial energy), and CircCapital (financial energy); factor 3—LoMeLoans (financial energy), FixedAssets, and Livestock; factor 4—NetInv and GrossInv. The allocation of variables to factors and factor loadings are presented in
Figure 3.
Thus, through factor analysis, out of fifteen variables shaping the security of farms from the regions of the EU countries, four synthetic factors emerged: factor 1:
operational activities; factor 2:
income and the ability to self-finance a business; factor 3:
working stock and the effects of long-term financial and investment decisions; factor 4:
investment activity. The names of the factors were assigned based on the author’s concept, taking into account both previous research presented in the literature [
9,
10,
11,
12,
13,
29,
35,
36,
37,
38,
39,
40] and the author’s own studies in this field [
24]. The cumulative variance index is 0.61, which is an acceptable level in social sciences [
46]. Then, the output variables were reduced for small farms, which are particularly important in the context of achieving the sustainable development goals. In this case, the optimal number of five factors was selected based on Horn’s parallel analysis. Loadings of variables with values above 0.1 in individual factors are presented in the
Table 4.
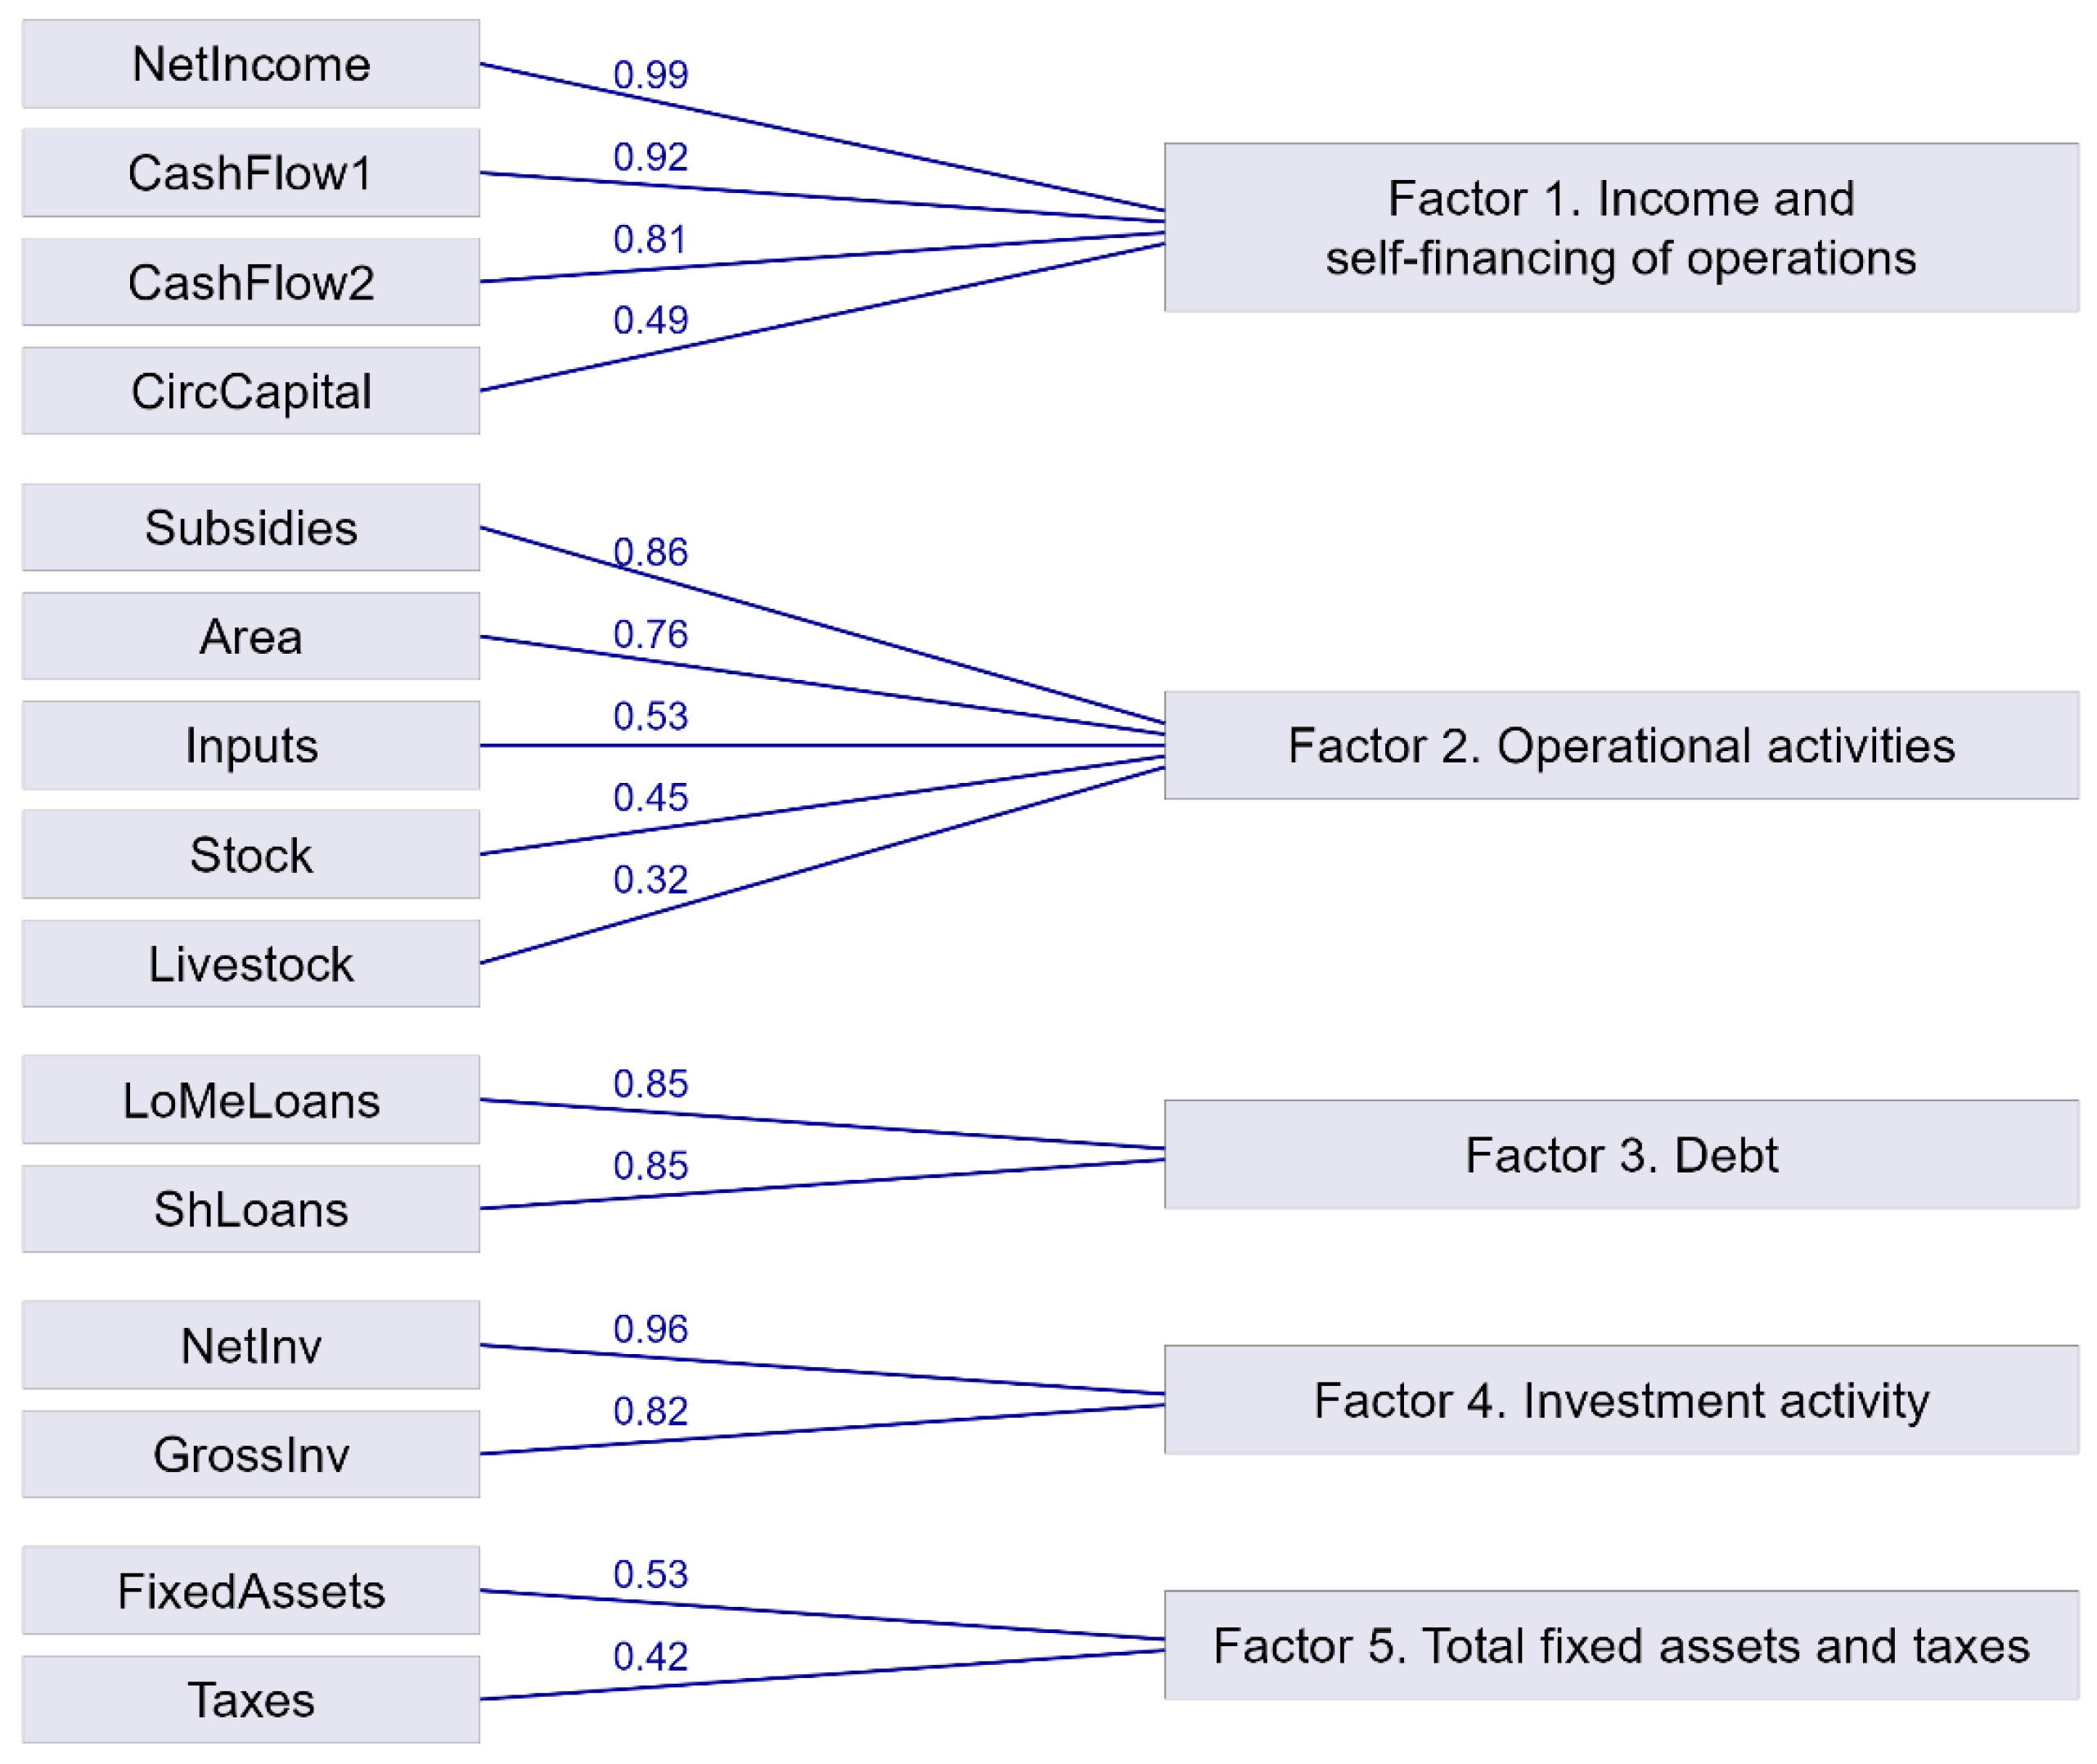
The variables most loaded by factor 1 are NetIncome (financial energy), CashFlow1 (financial energy), CashFlow2 (financial energy), and CircCapital (financial energy); factor 2—Subsidies (financial energy), Area, Inputs, Stock, and Livestock; factor 3—LoMeLoans (financial energy) and ShLoans (financial energy); factor 4: NetInv i GrossInv; factor 5—included: FixedAssets and Taxes. The allocation of variables to factors and factor loadings are presented in
Figure 4.
Reducing the variables to five factors allowed for the generalization of their names. Factor 1 was defined as income and the ability to self-finance a business, and factor 2 as operational activities. Factor 3 reflects debt, and the fourth one is investment activity. Factor 5 is fixed assets and taxes. The cumulative variance index is 0.64.
Similarly to all farms, for entities of medium economic size, Horn’s parallel analysis showed the optimal number of factors as 4. Loadings of variables with values above 0.1 in individual factors are presented in
Table 5.
The variables most loaded by factor 1 are Subsidies (financial energy), Inputs, Area, ShLoans (financial energy), Livestock and Stock; factor 2: NetIncome (financial energy), CashFlow1 (financial energy) and CashFlow2 (financial energy); factor 3: NetInv and GrossInv; factor 4: FixedAssets, LoMeLoans (financial energy), CircCapital (financial energy) and Taxes. The allocation of variables to factors and their factor loadings are presented in
Figure 5.
In the case of farms of medium economic size, the first factor isolated in the factor analysis is operational activities, factor 2 is income and the ability to self-finance a business, and factor 3 includes investment activity. The last of the extracted factors is Taxes, other current assets, and the effects of long-term financial and investment decisions. The cumulative variance index is 0.59.
In order to better assess the financial security of farms, the output variables for economically large farms were also reduced. In this case, 5 factors were identified. Loadings of variables with values above 0.1 in individual factors are presented in
Table 6.
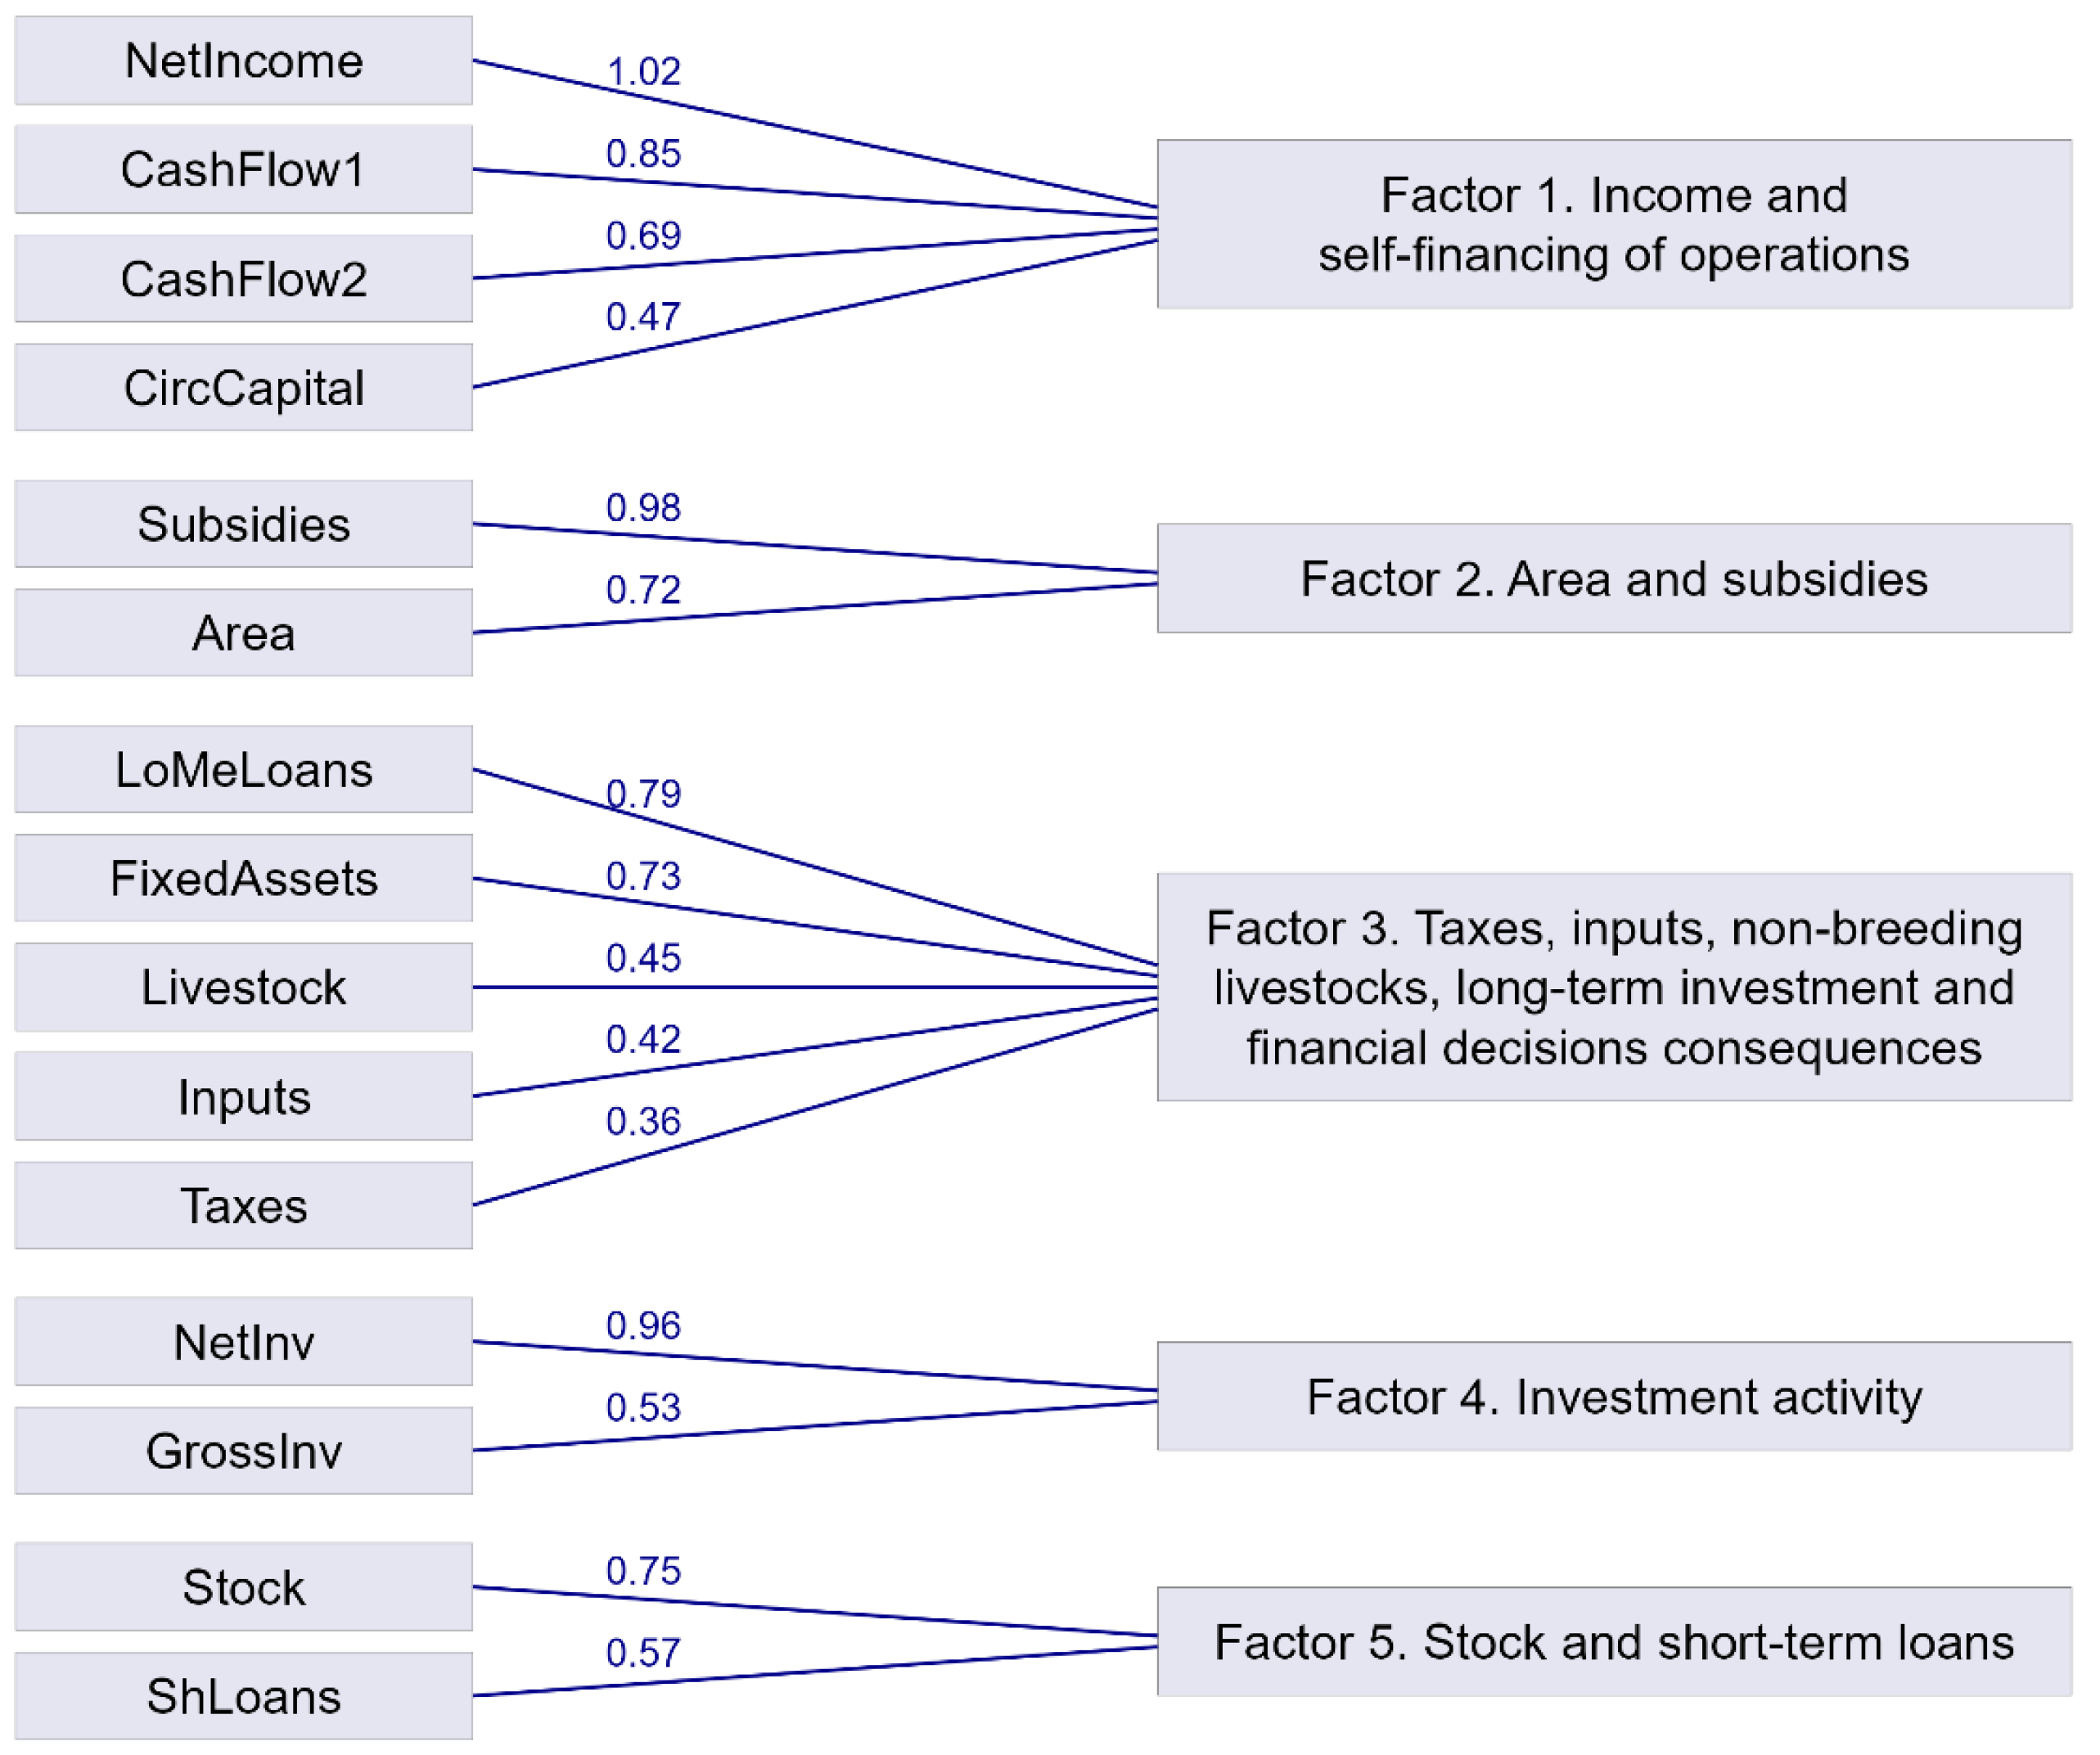
The variables most loaded by factor 1 are NetIncome (financial energy), CashFlow1 (financial energy), CashFlow2 (financial energy), and CircCapital (financial energy); factor 2: Subsidies (financial energy) and Area; factor 3: LoMeLoans (financial energy), FixedAssets, Livestock, Inputs, and Taxes; factor 4: NetInv and GrossInv; factor 5: Stock and ShLoans (financial energy). The allocation of variables to factors and factor loadings are presented in
Figure 6.
In the case of economically strong farms, out of fifteen variables shaping the security of farms from the regions of the EU countries, extracted according to the FADN methodology, five synthetic factors were identified thanks to factor analysis. The factors were given the following names: 1—income and the ability to self-finance a business, 2—land and subsidies for operating activities, 3—taxes, costs, trading stock, and the effects of long-term financial and investment decisions, 4—investment activity, and 5—inventories and short-term liabilities. The cumulative variance index is 0.61.
4. Discussion and Conclusions
The aim of this paper was to assess the factors that determine the financial security of EU farms using factor analysis. This article discusses four issues that are important for the functioning of farms and have been the subject of extensive scientific research: financial energy [
1,
2,
3,
4,
5,
6,
7], financial security [
9,
10,
11,
12,
13,
24,
29,
35,
36,
37,
38,
39,
40], the economic size of farms [
8], and the goals of sustainable development [
11,
15,
16,
17]. The results obtained contribute to the ongoing discussion on the interrelation of these four fundamental issues. Financial energy, understood as the treatment of money—namely, the ability to increase equity and access debt capital—is a key factor in shaping the financial security of farms. An interdisciplinary approach to the issue of financial energy makes it possible to emphasize its importance in achieving sustainable development goals. The acquisition of financial energy provides farms with the ability to initiate processes through which this energy is multiplied. This is an important issue both in terms of optimizing the level of financial security and increasing farm income (in line with the implementation of sustainable development goals), as well as shaping the economic size of a given entity.
This study used data on farms participating in the FADN. The economically weakest entities show an index more than 8 times higher than economically strong units. However, it is economically strong units that generate higher income. These results confirm the view presented in the literature regarding the high level of financial security among farms, particularly small entities [
29]. The reasons for this may include, among others, the relationship between the level of financial liquidity and farm profitability. While a risky liability management strategy would typically be expected to support higher profitability, in the case of farms, these trends may be reversed [
47].
Factor analysis allowed for the reduction of 15 variables potentially determining financial security to several factors, without a significant loss of the information contained within them. This study thus confirmed the applicability of factor analysis to the variables shaping the financial security of European Union farms. Based on factor analysis, it was shown that the output variables reduce in a different way for all farms: small, medium, and large. In the case of all farms, four factors were identified. In this case, the factor that explains the largest part of the phenomenon turned out to be
operational activities. The situation is similar in the case of medium-sized entities. This factor includes, among others: variables reflecting the farm area, subsidies for operating activities (financial energy), but also costs incurred. Operational activity is a key factor influencing financial security and largely depends on the inflow of capital (financial energy). In the context of sustainable agriculture, there is a discussion about, among other things, the need to incur high costs of fertilizing the land and sources of energy used, which contributes to lower profitability of agricultural production [
48,
49,
50,
51,
52]. This also has implications for the financial security of these entities. In the case of small and large economic entities, the first factor is
income and the ability to self-finance a business. It includes income from the family farm, as well as cash flow, which means the ability to self-finance the activity. This factor thus provides an inflow of financial energy. It should be noted here that farms show a high tendency to use equity capital to finance their activities [
53]. If a farm generates financial energy in the form of own capital, then it is financially secure. In the case of very large farms, the share of debt in the structure of financing sources was, on average, 16%, while in the case of very small farms it was 0.38% (
Table A1). In the factor analysis, only for small farms did a separate factor of
Debt appear, which contains variables expressing short-term and long-term liabilities. This demonstrates how important it is for small farms to have access to financial energy from external sources. There is a need for continued research in this area. These farms demonstrate above-threshold financial security, which may affect the amount of economic surpluses achieved. Moreover, debt capital is considered a source of financial energy that determines investment activity and, therefore, the amount of economic surpluses [
3]. The realization of the sustainable development goals in relation to the increase in the income of small (small-scale) farms requires research into the financial and investment decisions made by these entities. It is worth emphasizing that, despite significant differences in the level of financial security between farms with the lowest and highest economic size, these entities exhibit smaller disparities in terms of profitability indicators. The ROE ratio (measured as farm net income to net worth) is, on average, 2.2 times higher for the economically strongest farms compared to the weakest ones. The ROA ratio (measured as farm net income to total assets) is 1.4 times higher (
Table A1). These findings confirm the need for further research in this area, particularly in the context of the excessive accumulation of assets by these entities relative to the economic surpluses they generate [
54,
55].
The conducted research therefore contributes to both the literature and practice. It is part of the trend of research on the financial aspects of achieving the sustainable development goals. Small farms constitute a large part of all European Union farms and are therefore responsible for food security. Moreover, in their case, increasing income is a complex process that should involve both changes in production techniques and the process of understanding financial, investment, and operational decisions, which is also linked to access to financial energy. Therefore, the conducted research constitutes a source of information for agricultural advisory institutions. There is a need to educate farms on the determinants of the use of external sources of financing in the context of a possible reduction in the level of financial security, while increasing the income of small farms.
The obtained results constitute a continuation of research in the field of financial security of agricultural farms [
24] and the use of financial energy [
3,
4,
5]. At the same time, they indicate directions for further research. There is a need to conduct analysis in the field of financial determinants of achieving sustainable development goals. An important issue in this regard is the connection between the achievement of small farm income growth and the above-threshold financial security that small (small) farms maintain. It is typical for farms to have a high correlation of variables. Through factor analysis, the present study reduced the correlated variables to several factors without significant loss of information contained within them. In the next stage of the research, the strength and direction of the impact of the selected variables on the financial security of European Union farms will be tested. This is particularly important in the context of achieving the sustainable development goals relating to agriculture.


