Abstract
This study is dedicated to exploring and verifying the application of a miniature Venturi sensor for measuring the flowrate of supercritical CO2 and associated gas in downhole environments. With the rapid development of CO2 gas injection technology and Carbon Capture, Utilization, and Storage (CCUS) technology, the demand for accurate measurements of a CO2 and CH4 mixed-medium flowrate is increasing. This paper combines theoretical analysis, simulation design, and experimental validation to determine the optimized structure of a miniature Venturi and to select appropriate pressure sensors, comparing the accuracy of the Local Pressure Method (LPM) and Differential Pressure Method (DPM) in measuring differential pressure. The experiments were conducted using the water flow calibration facility and the gas–liquid two-phase flow rig at Tianjin University, comparing the LPM based on Keller pressure sensors with the DPM based on EJA110A transmitters. The results indicate that the relative error range of the differential pressure measurement is −16.64% to −0.72%, and the absolute error range is −5.19 kPa to −0.24 kPa, meeting the measurement requirements for underground applications. This validates the rational design of the miniature Venturi sensor and the feasibility of using the LPM in downhole.
1. Introduction
The rapid development of CO2 gas drive technology has led to its increased adoption in oil fields to enhance crude oil recovery rates. Additionally, injecting CO2 underground is a critical component of Carbon Capture, Utilization, and Storage (CCUS) technology [1].
Currently, most carbon emissions are associated with fossil fuels, and these substantial CO2 emissions severely impact the environment, being a primary cause of global warming. Addressing these CO2 emissions is crucial for achieving China’s sustainable and green development goals. With accumulating project experience, CCUS is increasingly recognized as an effective solution for managing large industrial emissions of greenhouse gases, prompting more countries to invest in this technology [1,2].
The associated gas produced during offshore oil field extraction contains significant CO2, which, when injected underground as an injection medium, can save costs and enhance extraction efficiency, extending the well’s lifespan. During the injection, the increase in well depth and the resulting rise in underground temperature and pressure transform the CO2 from a gaseous to a supercritical state. This study deals with complex injection materials, including high-content supercritical CO2, CH4, and a small amount of water in the underground associated gas, where the supercritical CO2 possesses the viscosity of a gas and the density of a liquid. The significant density ratio of supercritical CO2 to CH4 results in substantial slip, leading to a homogenous flow behavior similar to wet gas after high-speed mixing [3,4], posing significant measurement challenges in the industrial sector that are closely linked to economic benefits [5].
To control the underground injection volume and ensure injection safety, a reliable measurement method that can quantify the flowrate of supercritical CO2 underground associated gas and that fits the spatial constraints of well installation is needed. Throttle flow meters, known for their high accuracy, low cost, and extensive research, play a vital role in industrial flowrate measurement. Venturi sensors, as throttle flow meters with low pressure loss and high durability, are widely used for single-phase and multiphase flow measurement. However, their application in measuring the flowrate of CO2 wet gas is rarely reported.
In the field of industrial measurement, throttle flow meters are among the most widely used and common flow meters, being used extensively to measure gases, liquids, and multiphase fluids. Their long-term usage has proven their reliability, robustness, repeatability, and low maintenance requirements, given their lack of moving parts. The operating principle of throttle flow meters is based on the Bernoulli equation, where constriction in the pipeline, such as orifice plates, Venturi tubes, or flow nozzles, causes a pressure drop [3,6].
The ISO 5167:2 international standard [7] specifies the structural design requirements, installation, and calibration methods that are applicable to throttle flow meters in full-pipe flow conditions. Throttle flow meters also have ample research backing their use in wet gas measurement, with detailed methodologies provided in the ISO 11583 standard [8], which outlines the structural design requirements for throttling devices and the methods used to calculate flowrate and uncertainty.
Throttle flow meters are extensively used in CO2 injection for enhanced oil recovery and CCUS projects, with orifice plates and Venturis being the most common applications. Researchers like G. Collie [9] have reviewed flowrate measurement technologies for CO2 in CCS transport, suggesting that differential pressure measurement is a cost-effective and reliable method. Kehinde Adefila and others [10] used average pitot tubes for CO2 wet gas flowrate measurement, achieving an error margin within ±1.5% and appropriate correction factors. Ueno. S and colleagues [11] employed nozzles to measure CO2 gas–liquid two-phase flow, visualizing nozzle flow using Particle Image Velocimetry (PIV).
Researchers like M. Mohitpour [12] have proposed that CO2 captured in CCS processes can be used for enhanced oil recovery (EOR), presenting new pipeline designs for CO2 storage and measuring the CO2 flowrate with orifice flow meters. M. Reader Harris and others [13] have assessed the accuracy of orifice plates in measuring the CO2 flowrate both theoretically and experimentally, validating their applicability for compressible fluid measurement. Experiments by Oakes. F. G and team [14] confirmed the accuracy of using orifice plates to measure gaseous and supercritical CO2.
Joo Hyun Park and colleagues [15] measured the supercritical CO2 flowrate with a Venturi flow meter under pressures ranging from 7.379 to 7.836 MPa, with an uncertainty of 0.1% to 2.8%. Joseph Sauerbrun [16] utilized a Venturi flow meter for measuring the flow in the main loop of supercritical CO2 convective heat transfer tests, achieving an accuracy of ±0.5%.
This paper investigates the feasibility of measuring differential pressure using a miniature Venturi sensor based on the LPM. LPM stands for the Local Pressure Method, which means using two separate pressure sensors instead of one differential pressure sensor to measure the pressure difference in the Venturi. Initially, the limited installation space within the downhole gas injection work barrel is considered, alongside the requirement for the measuring instruments to withstand high temperatures and pressures to function correctly underground. Therefore, the structural design of the DN 15 miniature Venturi and the selection of pressure sensors must account for the instrument’s suitability in such harsh underground conditions. Subsequently, water experiments were conducted to verify the consistency between the model’s differential pressure measurement range and the simulation results. Finally, wet gas experiments were carried out to validate the feasibility of using the LPM as an alternative to the Differential Pressure Method (DPM).
2. Sensor Design and Selection
2.1. Optimization Design of Miniature Venturi Sensor Based on LedaFlow
LedaFlow is an advanced transient multiphase flow simulator co-developed by SINTEF in Norway, ConocoPhillips, and Total. The LedaFlow simulator is based on 16 equations, including the conservation equations of mass, momentum, and energy, along with volume constraint equations, facilitating the solution of a one-dimensional multiphase and multi-field model. LedaFlow can solve the mass balance equations for nine fields, specifically including continuous gas, oil, water, and two discrete fields for each phase. It solves the momentum and energy equations for three continuous phases, and solves a one-dimensional multiphase, multi-field model.
To accommodate the installation space restrictions and flow measurement requirements of downhole gas injection work strings, this study designed a miniature Venturi sensor. The design ensures that the outer diameter does not exceed 42 mm, while accurately measuring the flowrate of a CO2-CH4 mixed medium under pressure conditions of 30–50 MPa and temperature conditions of 120–150 °C, within the range of a 3 × 10⁴~13 × 104 Nm3/d volume under standard conditions (Temperature = 20 °C, Pressure = 0.101325 MPa) per day.
The Venturi sensor is a throttle-type flow sensor designed based on Bernoulli’s principle, which calculates the flowrate by measuring the differential pressure as the fluid flows through the sensor. The single-phase mass flowrate formula derived based on Bernoulli’s principle is as follows.
In the formula, C represents the discharge coefficient, β represents the throttle ratio, ε represents the expansibility factor, D is the inlet diameter, ρ is the fluid density, and Δp is the measured differential pressure. In the structural design of the Venturi sensor, the main factors affecting the differential pressure signal are the inner diameter D of the Venturi sensor and the throttle ratio β. In β = d/D, d is the inner diameter of the throat of Venturi. Therefore, when designing the downhole Venturi sensor, it is necessary to optimize the inner diameter D and the throttle ratio β to ensure that the fluid is fully developed while meeting the spatial requirements, thus obtaining the ideal differential pressure signal.
In our previous study [6], in order to select the appropriate Venturi sensor structure, we used simulation methods to compare the differential pressure generated by different Venturi structures under fixed conditions. Ultimately, considering the simulation results and manufacturability, we selected the DN 15 (D = 15 mm), β = 0.4 miniature Venturi structure. Based on the ISO 5167-4 [17] international standard, the design parameters include a contraction angle of 21°, an expansion angle of 7°, a straight tube section before the throat of 10 D, a throat length of 1 d, a straight tube section after the throat of 6 D, and a wall roughness of 0.006 mm. As shown in Figure 1, three pressure tapping points (P1, P2, and P3) were set to optimize the accuracy of the pressure measurement. The front differential pressure, the rear differential pressure and the total pressure loss of the Venturi are denoted by the symbols ∆p1, ∆p2, and ∆ploss, respectively.
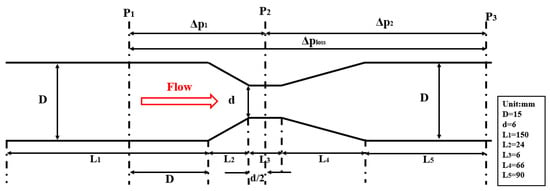
Figure 1.
Schematic diagram of the miniature Venturi sensor structure.
Using LedaFlow simulation software (LedaFlow Engineering v2.10.269.038), we set the boundary conditions with the mass inlet and pressure outlet, specifying the multiphase components for fluid calculations.
The grid partitioning of the simulation model was designed based on the pressure drop characteristics of the Venturi sensor. The grid was denser in regions with significant pressure changes, such as the contraction section, throat, and expansion section, while sparser grids were used in the upstream and downstream straight pipe sections. Specifically:
- Upstream Straight Pipe Section: 40 grids with sizes ranging from 1.5 to 5.25 mm.
- Contraction Section: 20 grids with a size of 1.2 mm.
- Throat Section: 10 grids with a size of 0.6 mm.
- Expansion Section: 40 grids with a size of 1.7 mm.
- Downstream Straight Pipe Section: 40 grids with sizes ranging from 2.25 mm to 9 mm.
We conducted grid independence verification to ensure the accuracy and reliability of the simulation results. This involved comparing the simulation results for models with different total grid counts (150, 75, and 39).
The simulation results obtained from models with total grid counts of 150, 75, and 39 are compared. Table 1 presents the grid independence verification results for the miniature Venturi sensor under the operating conditions of pressure of 50 MPa, a temperature of 120 °C, and a flowrate of 3 × 10⁴ Nm3/d. ∆p1 represents the upstream pressure drop, ∆p2 represents the downstream pressure drop, and ∆ploss represents the total pressure loss, all measured in MPa.

Table 1.
Comparison of differential pressure calculation results for miniature Venturi sensor with different grids.
In Table 1, each column represents the simulation results for ∆p1, ∆p2, and ∆ploss obtained from the simulation. Each row includes the simulation results for different grid models, as well as the relative error results of the simulation.
As shown in Table 1, the computation time increases significantly with the total grid count. Taking the simulation results of the model with a total grid count of 150 as the reference value, the relative error range of the simulation results of the model with a total grid count of 75 is within −0.12% to 0.43%, and the relative error range of the simulation results of the model with a total grid count of 39 is within −6.39% to 28.21%. It can be observed that the relative error of the model with a total grid count of 75 is within ±0.5%, while the relative error of the model with a total grid count of 39 is within ±30%. Considering both simulation efficiency and error, selecting a total grid count of 75 for the simulation model is reasonable.
Based on these comparisons, we selected the model with 75 grids as it provided a good balance between computational efficiency and accuracy.
After establishing the miniature Venturi structure, our previous study [6] investigated how its pressure drop is influenced by temperature, pressure, and the flow rate. In the simulation, the mixed medium consisted of 50 mol% CO2, 49.85 mol% CH4, and 0.15 mol% H2O. As shown in Figure 2a, the maximum differential pressure of 14.09 MPa occurs at P = 30 MPa, T = 150 °C, and F = 13 × 104 Nm3/d. The minimum differential pressure, 0.37 MPa, is observed at P = 50 MPa, T = 120 °C, and F = 3 × 10⁴ Nm3/d. These findings provide a basis for selecting appropriate pressure sensors and assessing the feasibility of using the LPM method for differential pressure measurement.
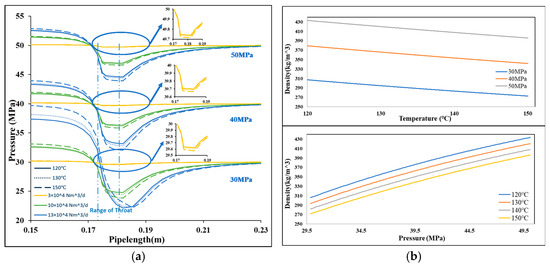
Figure 2.
The simulated pressure drop results and the density change of CO2–CH4 mixture: (a) Simulated pressure drop results (F = 3~13 × 104 Nm3/d, P = 30~50 MPa, T = 120~150 °C); (b) Relationship between temperature, pressure and density of mixed medium.
Figure 2b illustrates the relationship between temperature, pressure, and the density of the CO2–CH4 mixture. The results indicate that as the temperature increases, the density of the medium decreases, whereas a higher pressure leads to a greater density. According to Equation (1), the differential pressure rises when the density decreases and decreases when the mass flow rate is reduced. This explains the observed variations in differential pressure.
2.2. Selection of Pressure Sensors
To achieve differential pressure measurement with the miniature Venturi, a compilation and selection of parameters for pressure and differential pressure sensors available on the market were conducted. In order to ensure the optimal performance and reliability of the measurement system, a thorough evaluation of various sensors was necessary. According to project requirements, the engineering prototype is designed to be installed inside a downhole casing, providing flow measurement functions. The selected pressure sensor must have a measurement accuracy higher than ±0.3 %FS and meet the downhole conditions of 150 °C and 60 MPa. Due to the structural limitations of the casing, the maximum outer diameter of the prototype should not exceed 42 mm. Additionally, the prototype must also retain the pressure-bearing wall thickness and integrate structures such as pressure guide holes, wiring holes, radial seals, live nuts, and pins. Therefore, the radial dimension of the pressure sensor must be less than 15 mm. The performance parameters of the pressure and differential pressure sensors are shown in Table 2.

Table 2.
Pressure and differential pressure sensor performance parameters.
As shown in Table 2, due to different measurement principles, the size of the differential pressure sensors is much larger than that of the pressure sensors. Therefore, this project uses the pressure sensor to measure the differential pressure of the Venturi. Pressure sensors that meet the requirements for range, pressure resistance, and operating temperature include Keller (Model: 6LHP) and Huba Control. However, the size of Huba Control’s pressure sensor is larger than that of Keller 6LHP, and Keller 6LHP has a better measurement accuracy, at ±0.25 %FS. Therefore, the Keller 6LHP pressure sensor was chosen to measure the differential pressure of the Venturi. This pressure sensor has a maximum pressure resistance of 150 MPa, maximum temperature resistance of 180 °C, a measurement range of 0~60 MPa, and an accuracy of ±0.25 %FS, fulfilling the measurement requirements.
3. Room Temperature and Atmospheric Pressure Water Experiment of Miniature Venturi
To verify the consistency between the designed prototype’s experimental and the simulated differential pressure results, this study conducted a room-temperature and atmospheric pressure water experiment on Tianjin University’s water flow rig, based on a 3D-printed prototype model.
3.1. Tianjin University’s Water Flow Rig
Figure 3 is a diagram of Tianjin University’s water flow rig. The rig consists of essential components such as a water pump, test pipelines, a standard meter, a weighing rig, and a control system. Figure 3 is a diagram of Tianjin University’s water flow rig. The rig consists of essential components such as a water pump, test pipelines, a standard meter, a weighing rig, and a control system. This facility is designed to provide a comprehensive platform for conducting experiments and studies on water flow characteristics, particularly in the context of differential pressure measurements and flow rate determinations. The water pump ensures a consistent supply of water, while the test pipelines allow for the introduction of various flow conditions and the placement of sensors for data collection. The standard meter serves as a reference for flow rate measurements, ensuring the accuracy and reliability of the experimental results.
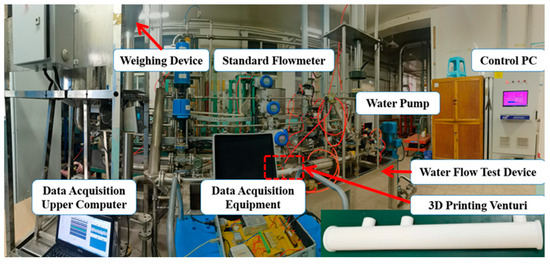
Figure 3.
Diagram of Tianjin University’s water flow rig.
For the miniature Venturi sensor structure determined in Section 2.1, a 3D-printed prototype model with an inlet diameter of 15 mm and a throttle ratio of 0.4 was fabricated. The schematic diagram of the 3D-printed Venturi prototype is shown in Figure 4.

Figure 4.
Schematic diagram of the 3D-printed Venturi prototype: (a) Schematic diagram of the prototype appearance; (b) Schematic diagram of the prototype cross-section.
During installation, the pressure tapping of the prototype model should face downward to eliminate the influence of air in the pressure tapping tube. The instrument used was the EJA110A (Yokogawa, Tokyo, Japan) differential pressure transmitter, with a range of 0~500 kPa and an accuracy of 0.05%.
This rig, based on the static weighing method and the standard meter method, constructs an adjustable water flowrate in a liquid-phase single closed-loop system. By adjusting the frequency of the water pump inverter, the rig can control the liquid-phase volumetric flowrate within the range of 0.3 to 12.0 m3/h.
The design parameters of the water flow rig are shown in Table 3. The overall uncertainty of the water flow rig is 0.03 (k = 2), supporting a flow range of 0.3 to 12 m3/h, with flow stability reaching more than 0.2%.

Table 3.
The design parameters of Tianjin University’s water flow rig.
3.2. Water Experiment Results and Discussion
The experimental conditions for the water flowrate experiment are shown in Table 4.

Table 4.
Range of water flowrate experimental conditions.
During the experiment, the same experimental condition was measured three times, and the average of the three results was taken as the final measurement result. The summary of the water flowrate experimental results is presented in Table 5.

Table 5.
Summary of water flowrate experimental results.
The table includes information on the experimental condition points and results. The experimental condition information includes the flowrate q, velocity U and throat velocity Uth, and the experimental results include ∆p1, ∆ploss, the pressure loss ratio ∆ploss/∆p1, the discharge coefficient C, and the repeatability of ∆p1. According to the table, the repeatability range of the flowrate is 0.08~0.56%, and the repeatability range of the front differential pressure is 0.01~0.15%, indicating the good repeatability of the experiment. As the flowrate increases, ∆p1, ∆ploss, and ∆ploss/∆p1 increase. ∆p1 varies between 20.24 and 522.92 kPa, while the total pressure loss, ∆ploss, spans from 4.15 to 261.75 kPa. The ratio of ∆ploss to ∆p1 ranges from 20.52% to 50.05%. Regarding the discharge coefficient C, its values fluctuate significantly across a range of 0.900 to 0.984. However, this variation narrows down to a range of 0.90 to 0.91, indicating lesser fluctuation, particularly under conditions of higher flowrates.
The measurement errors of the sensor might be the main reason for this experimental phenomenon. In the low flowrate range of 0.6~1.0 m3/h, ∆p1 varies between 20.24 and 50.94 kPa, which is at the lower measurement limit of the differential pressure transmitter, within only 10% of the range.
Figure 5 shows a comparison of the front differential pressures ∆p1 between the simulation and the experiment, with flowrate q on the horizontal axis and ∆p1 on the vertical axis. The simulation data are derived from LedaFlow’s computational results under the same conditions. The figure shows that the difference between the simulation and experimental results is small.
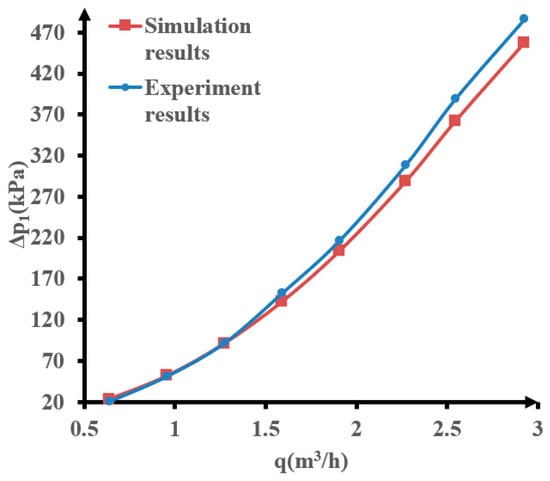
Figure 5.
Comparison of simulated and experimental ∆p1.
To further analyze the error, the simulated and experimental differential pressure results are listed in Table 6.

Table 6.
Comparison of simulated and experimental ∆p1.
As can be seen from Table 6, taking the experimental differential pressure as the true value, the relative error between the simulation and experiment for ∆p1 is within ±5%, and the absolute error range is −19.06~0.88 kPa. The error may stem from the adjustment error of the flowrate points and the machining error of the 3D-printed prototype model.
In summary, the differential pressure data obtained from the water flowrate experiment on the prototype model validates the consistency between the designed prototype’s experimental and the simulated differential pressure results. Therefore, the water experiment results can verify the reliability of the simulated estimated differential pressure measurement range. Considering that the structural design of the Venturi sensor was completed through simulation methods [6], this water flow experiment also further validated the rationality of the sensor’s structural design.
4. Miniature Venturi LPM Validation Experiment
To validate the feasibility of using the Local Pressure Method (LPM) instead of the Differential Pressure Method (DPM) under different experimental conditions, we conducted wet gas experiments at room temperature with a pressure range of 0.3~0.7 MPa on Tianjin University’s gas–liquid two-phase flow rig, based on a stainless steel standard Venturi prototype.
4.1. Tianjin University’s Gas–Liquid Two-Phase Flow Rig
Figure 6 shows the test section of the wet gas experiment, utilizing a stainless steel standard Venturi prototype.
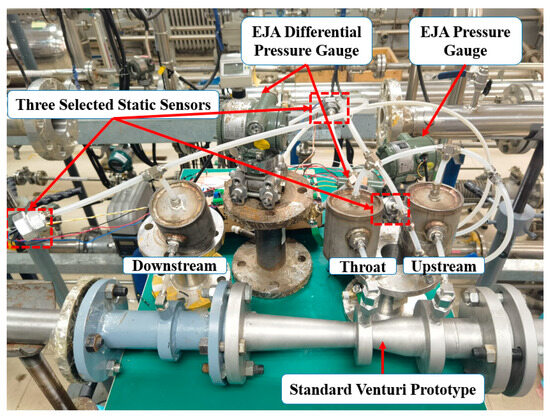
Figure 6.
The test section of Tianjin University’s gas–liquid two-phase flow rig.
The stainless steel Venturi used had an inlet diameter (D) of 50 mm and a throttle ratio (β) of 0.55. The primary reason for using different Venturi models was the limitations of the wet gas test rig. The test rig can only accommodate pipe diameters of 50 and 80 mm, and its overall pressure boosting capability is limited to 200 kPa. Using the DN 15 3D printed Venturi in this setup would have resulted in an excessive pressure drop, exceeding the rig’s capacity. Therefore, we opted for the existing DN 50 Venturi prototype, which is better suited to the wet gas experiments without causing significant pressure loss.
The wet gas experiment compared the results of measuring the differential pressure using the Local Pressure Method (LPM) and the differential pressure method (DPM). Instead of using an EJA differential pressure transmitter to directly measure the differential pressure signal of the Venturi, two Keller 6LHP pressure sensors are installed at the upstream and throat positions of the Venturi tube. The differential pressure is obtained by subtracting the throat pressure from the upstream pressure. This result is then used to evaluate the accuracy of the LPM method and compare its error with the measurements from the EJA differential pressure transmitter.
The EJA pressure transmitter has a range of 0~10 MPa with an accuracy of ±0.05%, and the EJA differential pressure transmitter has a range of 0~500 kPa, also with an accuracy of ±0.05%. Since the maximum test pressure was only 0.7% of the Keller pressure sensor’s range, this experiment aimed to verify the feasibility and error range of the LPM as an alternative to the differential pressure method.
The design parameters of the gas–liquid two-phase flow rig are shown in Table 7. This experimental setup, based on the standard meter method, is a gas–liquid dual closed-loop system capable of adjusting both the air and water flowrates. The air phase flowrate can be adjusted from 5.89 m3/h to 400 m3/h by regulating the air compressor’s frequency or adjusting the bypass valve, while the water flowrate is controlled by altering the water pump’s frequency, ranging from 0.03 m3/h to 8 m3/h.

Table 7.
The design parameters of Tianjin University’s gas–liquid two-phase flow rig.
The rig is designed to withstand a maximum pressure of 1.6 MPa, with the fan capable of providing a maximum boost of 200 kPa. Regarding accuracy, the uncertainties of the air flow and water flow are controlled within 0.004 (k = 2) and 0.0028 (k = 2). The stability of air flow is better than 0.8%, and the stability of water flow is better than 0.29%, respectively, ensuring highly stable and reliable flowrate measurements.
4.2. Wet Gas Experiment Results and Discussion
The experiment aimed to compare the measurement results between the LPM and the DPM. As illustrated in Figure 7, the experiment focused on measuring the upstream differential pressure (∆p1) of the Venturi, where EJA-Pup and EJA-DP represent the upstream pressure and ∆p1 of the Venturi, respectively, as measured by the EJA transmitter. The throat pressure, denoted as EJA-Pth, is calculated by taking the difference between EJA-Pup and EJA-DP. K-Pup and K-Pth refer to the upstream and throat pressures measured by Keller pressure sensors. The differential pressure obtained using the LPM, denoted as K-DP, is determined by the difference between the K-Pup and K-Pth measurements.
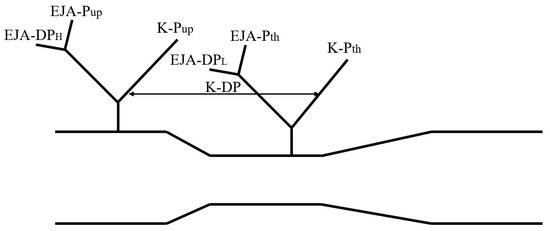
Figure 7.
Measurement positions of the LPM and the DPM.
The wet gas experimental conditions are summarized in a table, employing the method of converted volume to simulate the downhole gas injection flowrates under different Liquid Volume Fractions (LVFs), using the volumetric flowrate of air at standard conditions as a reference.
As shown in Table 8, the wet gas experiments were conducted at an ambient temperature, with pressures (P) of 0.3 MPa, 0.5 MPa, and 0.7 MPa, and a gas-phase superficial velocity (Usg) of 18 m/s, 20 m/s, and 25 m/s, respectively. For each Usg, different LVFs were tested, including 0.1%, 0.5%, 1.0%, 2.0%, and 3.0%, with the XLM range being 0.01 to 0.3. The total mass flowrate of the wet gas (m) ranged between 0.22 and 1.44 kg/s, corresponding to a standard condition air volumetric flowrate range of 2.03 to 10.35 × 10⁴ Nm3/d.

Table 8.
Test matrix of wet gas experiment.
4.2.1. Comparison of EJA and Keller Sensor Measurements at 0.3 MPa
Figure 8 compares the measurements of the Keller sensor and EJA transmitter at a pressure of 0.3 MPa and a Usg of 25 m/s.
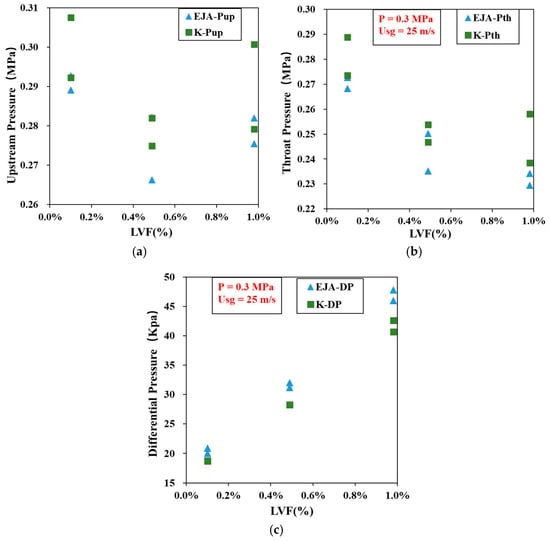
Figure 8.
Comparison of EJA and Keller sensor measurements at 0.3 Mpa: (a) Upstream pressure measurement results; (b) Throat pressure measurement results; (c) Differential pressure measurement results.
Figure 8 displays three experimental conditions where each condition was tested twice at different times. The x-axis represents the Liquid Volume Fraction (LVF), ranging from 0.1% to 1.0%. In graph (a), the y-axis shows the upstream pressure measurements, ranging from 0.26 to 0.31 MPa. Graph (b) presents the throat pressure measurements, with values between 0.22 and 0.30 MPa. Graph (c) illustrates the front differential pressure measurements, ranging from 15 to 50 kPa. In the legend, blue triangles represent the EJA transmitter measurements, while green squares denote the Keller sensor measurements.
In graph (a), the measurement values of EJA-Pup fluctuate around 0.3 MPa, attributed to variations in adjusting the pressure condition. Figure 8 indicates that the Keller sensor measurements consistently align with the EJA transmitter readings, demonstrating consistency between the two measurement methods. The experimental results at 0.3 MPa are summarized in Table 9.

Table 9.
Summary of wet gas flowrate experimental results (P = 0.3 MPa, Usg = 25 m/s).
Table 9 summarizes the experimental results under a pressure of 0.3 MPa and a superficial gas velocity of 25 m/s. As shown in both Table 9 and Figure 8, the differential pressure values measured by LPM (K-DP) increase steadily with an increasing LVF, which is consistent with flow theory. The relative error between the Keller sensors (K-Pup, K-Pth) and EJA reference sensors ranges from −0.16% to 10.21%, with absolute errors between −0.47 and 23.91 kPa. When using EJA-DP as the true value, the relative error in the differential pressure K-DP ranges from −11.73% to −6.51%, and the absolute errors range from −5.34 to −1.32 kPa.
Overall, at a low pressure (0.3 MPa), the LPM approach can track the increase in the differential pressure as the LVF rises, but larger relative errors are observed when the differential pressure is small. This is partly due to the low measurement range operating point and the difference method used in LPM, which may amplify error.
4.2.2. Comparison of EJA and Keller Sensor Measurements at 0.5 MPa
Figure 9 compares the measurement results of the Keller sensor and the EJA transmitter under a 0.5 MPa and a Usg of 20 m/s.
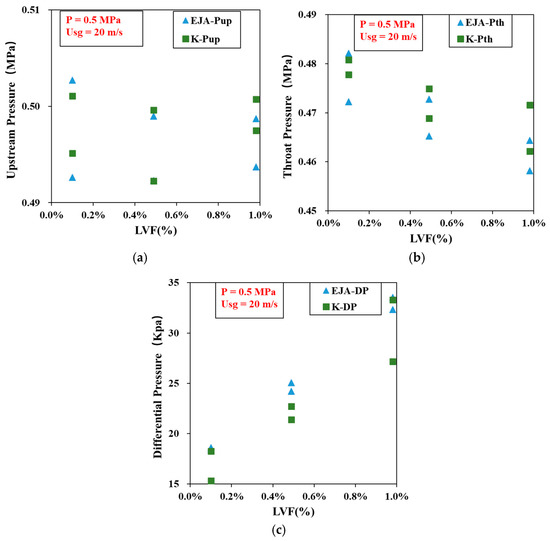
Figure 9.
Comparison of EJA and Keller sensor measurements at 0.5 Mpa: (a) Upstream pressure measurement results; (b) Throat pressure measurement results; (c) Differential pressure measurement results.
As illustrated in Figure 9, the graph features the Liquid Volume Fraction (LVF) on the x-axis, ranging from 0.1% to 1.0%. In graph (a), the y-axis represents the upstream pressure measurements, with values between 0.49 and 0.51 MPa. Graph (b) shows the throat pressure measurements on the y-axis, ranging from 0.45 to 0.49 MPa. In graph (c), the y-axis corresponds to the front differential pressure measurements, with values ranging from 15 to 35 kPa.
In graph (a), the measurement values of EJA-Pup fluctuate around 0.5 MPa. From Figure 9, it can be observed that the measurements from the Keller sensors consistently align with the measurements from the EJA transmitter, indicating a consistent correlation between the two types of measurements. The experimental results at 0.5 MPa are detailed in Table 10.

Table 10.
Summary of wet gas flowrate experimental results (P = 0.5 MPa, Usg = 20 m/s).
Table 10 presents the results for P = 0.5 MPa and a lower superficial gas velocity of 20 m/s. As in Table 9, K-DP increases with LVF. The relative errors in pressure measurements by the Keller sensors remain within −0.33% to 1.56%, with absolute errors from −1.63 to 7.18 kPa. For the differential pressure, relative errors in K-DP compared to EJA-DP range from −16.64% to −0.72%, with absolute values from −5.19 to −0.24 kPa.
It is worth noting that, compared with the 0.3 MPa case, the accuracy improves slightly at 0.5 MPa, and the LPM method continues to follow the trend of rising K-DP with increasing LVF. The error ranges fall within acceptable bounds for practical wet gas measurement, though deviations are more prominent at very low LVFs.
4.2.3. Comparison of EJA and Keller Sensor Measurements at 0.7 MPa
Figure 10 compares the measurement results of the Keller sensor and the EJA transmitter at a pressure of 0.7 MPa and a Usg of 18 m/s.
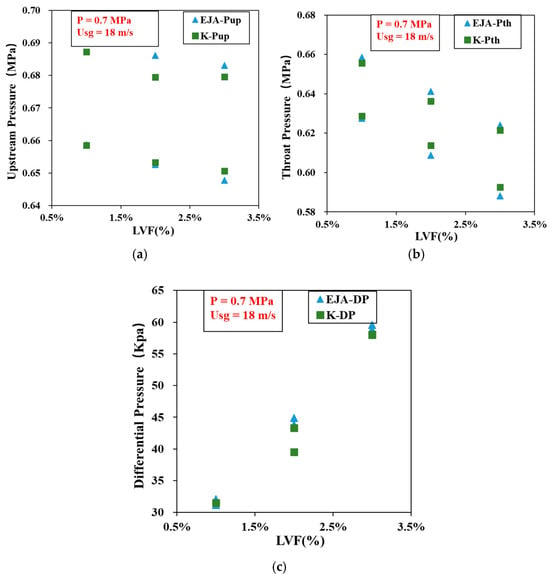
Figure 10.
Comparison of EJA and Keller sensor measurements at 0.7 Mpa: (a) Upstream pressure measurement results; (b) Throat pressure measurement results; (c) Differential pressure measurement results.
Figure 10 displays the graph where the x-axis represents LVF, with a range from 1.0% to 3.0%. In graph (a), the y-axis shows the upstream pressure measurement values, which range from −0.64 to 0.70 MPa. Graph (b) has its y-axis representing the throat pressure measurement values, with a range from 0.58 to 0.68 MPa. In graph (c), the y-axis corresponds to the front differential pressure measurement values, ranging from 30 to 65 kPa.
In graph (a), the measurement values of EJA-Pup fluctuate around 0.7 MPa. Observations from Figure 10 indicate that the Keller sensor measurements consistently align with the EJA transmitter’s measurements, demonstrating consistent correlation between the two. The experimental results at 0.7 MPa are summarized in Table 11.

Table 11.
Summary of wet gas flowrate experimental results (P = 0.7 MPa, Usg = 18 m/s).
Table 11 summarizes the results under a higher pressure (0.7 MPa) and lower superficial gas velocity (18 m/s). As LVF increases, the differential pressure K-DP shows a generally rising trend. The relative errors in upstream and throat pressure measurements by Keller sensors range from −0.96% to 0.81%, and the corresponding absolute errors lie between −6.59 and 4.96 kPa. For K-DP, the relative error ranges from −10.02% to −1.40%, and the absolute errors range from −4.41 to −0.62 kPa.
These results demonstrate that at higher pressure levels, where the pressure sensors operate closer to the middle of their measurement range, the LPM method yields more stable and lower relative errors. This reinforces the method’s applicability in downhole environments with higher operating pressures.
Although the errors were generally within acceptable bounds, a more detailed breakdown of their potential sources helps to clarify their origin and influence on practical deployment. First, a notable source of measurement error stems from the operating range of the Keller pressure sensors. With a full scale of 0–60 MPa and an accuracy of ±0.25% FS, these sensors were operating within a narrow range of 0.3–0.7 MPa during the wet gas experiments. This means that the target measurement values were close to the lower bound of the sensor’s range, potentially increasing the relative measurement error. Second, since the LPM approach relies on the differential pressure obtained by subtracting two absolute pressure readings, any measurement error may be amplified—potentially doubled—in the differential calculation. Additionally, the use of a long signal wire in the test setup may introduce noise or signal degradation, further contributing to the observed discrepancies.
These factors, if not mitigated, could impact the accuracy of LPM-based flow measurements in practical field applications. However, in high-pressure downhole environments, the absolute pressures are typically closer to the middle range of the sensor’s span, which would help reduce relative errors. Moreover, if both pressure readings (K-Pup and K-Pth) exhibit similar directional biases (i.e., both overestimated or both underestimated), some of the resulting errors in differential pressure can offset each other. On the other hand, if the biases are in opposite directions, the error will be amplified.
To reduce the impact of these errors in future applications, several improvements can be considered. These include shortening the signal transmission lines, adding shielding to reduce electromagnetic interference, and applying signal filtering techniques to suppress noise. In sum, while the LPM method shows good potential for downhole wet gas flow measurement, especially given that the errors observed fall within the acceptable threshold of a 12% flow accuracy tolerance for downhole projects (with 24% differential pressure accuracy tolerance), careful attention to sensor selection and installation can further improve the reliability and accuracy of the system.
5. Conclusions
This study, grounded in detailed theoretical analysis, simulation design, and rigorous experimental validation, has successfully demonstrated the potential application of miniature Venturi sensors based on the Local Pressure Method (LPM) for measuring the flowrate in downhole environments with high concentrations of supercritical CO2-associated gas. The experimental results show:
(1) The structural design of the miniature Venturi sensor and the selection of pressure sensors meet the spatial constraints within the downhole gas injection work string and the requirements for flowrate measurement in downhole environments.
(2) Water flow experiments based on the 3D printed prototype model confirmed the consistency between simulation and experiment, validating the rationality of the miniature Venturi sensor’s structural design.
(3) The comparison of the Local Pressure Method (LPM) and Differential Pressure Method (DPM) for measuring differential pressures validated the feasibility of the LPM under specific conditions. Although LPM measurements involve some errors, the overall errors are small, with the relative error range between −16.64% and −0.72% and the absolute errors ranging from −5.19 to −0.24 kPa, fulfilling the requirements for downhole wet gas flowrate measurement.
In our previous study [18], a neural network-based model was developed to estimate the liquid mass fraction and total mass flowrate using simulated pressure data. Although this approach is not applied in the present work, it may serve as a valuable supplement to the Local Pressure Method (LPM) in future flowrate measurement applications, especially in complex multiphase flow scenarios.
(4) The successful implementation of this study provides a new technical approach for the flowrate measurement of wells with high concentrations of supercritical CO2-associated gas, which is especially relevant for CO2 gas injection and CCUS projects.
Through this research, we have validated the differential pressure measurement range of the designed 3D Venturi prototype and demonstrated that the LPM method, although less precise than dedicated differential pressure transmitters, achieves acceptable accuracy. This is especially valuable in downhole environments, where LPM provides a practical and reliable solution under space constraints. Compared to DPM, LPM offers advantages such as a wider measurable range and smaller sensor size. However, it may introduce larger errors due to the subtraction of two separate readings and requires more complex sensor installation. Therefore, the LPM is well suited for scenarios involving large differential pressures and limited installation space, particularly when combined with error compensation and filtering techniques. Future work can focus on optimizing sensor layout and improving signal processing to enhance measurement accuracy.
Author Contributions
Conceptualization, C.Z. and W.Y.; methodology, D.X. and L.K.; investigation, S.W. and Z.C.; writing—original draft, C.Y. and S.J.; writing—review and editing, C.Y. and S.J.; resources, C.Z. and W.Y.; supervision, C.Y. and S.J. All authors have read and agreed to the published version of the manuscript.
Funding
This research received no external funding.
Data Availability Statement
The data are unavailable due to privacy.
Acknowledgments
We sincerely thank the anonymous reviewers for their detailed and constructive comments, which greatly contributed to improving the quality of this paper.
Conflicts of Interest
Authors Chunfeng Zheng, Wanyou Yang, Dedong Xue, Lei Kou and Sheng Wang were employed by the Engineering Company, Energy Development Limited Company of CNOOC. The remaining authors declare that the research was conducted in the absence of any commercial or financial relationships that could be construed as a potential conflict of interest.
References
- Edouard, M.N.; Okere, C.J.; Ejike, C.; Dong, P.; Suliman, M.A. Comparative numerical study on the co-optimization of CO2 storage and utilization in EOR, EGR, and EWR: Implications for CCUS project development. Appl. Energy 2023, 347, 121448. [Google Scholar]
- International Energy Agency, Net Zero by 2050; IEA: Paris, France, 2021.
- Xu, Y.; Cao, L.F.; Yuan, C. Study of the factors influencing the over-reading characteristics of the precession Venturi. Flow Meas. Instrum. 2023, 89, 102272. [Google Scholar]
- Yan, C. Gas-Liquid Two-Phase Flow, 3rd ed.; Harbin Engineering University Press: Harbin, China, 2017; pp. 1–7. [Google Scholar]
- Shao, D.; Yan, Y.; Zhang, W.B. Dynamic measurement of gas volume fraction in a CO2 pipeline through capacitive sensing and data driven modelling. Int. J. Greenh. Gas Control 2019, 94, 102950. [Google Scholar]
- Xu, Y.; Jia, S.-J.; Yuan, C. A Study of Downhole Gas Injection Flow Measurement Method. In Proceedings of the IEEE Instrumentation and Measurement Technology Conference, Kuala Lumpur, Malaysia, 22–25 May 2023. [Google Scholar]
- ISO 5167:2; Measurement of Fluid Flow by Means of Pressure Differential Devices Inserted in Circular Cross-Section Conduits Running Full—Part 2: ORIFICE Plates. ISO: Geneva, Switzerland, 2003.
- ISO 11583:2012; Measurement of Wet Gas Flow by Means of Pressure Differential Devices Inserted in Circular Cross-Section Conduits. ISO: Geneva, Switzerland, 2012.
- Collie, G.; Nazeri, M.; Jahanbakhsh, A.; Lin, C.; Maroto-Valer, M. Review of flowmeters for carbon dioxide transport in CCS applications. Greenh. Gases Sci. Technol. 2017, 7, 10–28. [Google Scholar] [CrossRef]
- Adefila, K.; Yan, Y.; Sun, L.; Wang, T. Flow measurement of wet CO2 using an averaging pitot tube and coriolis mass flowmeters. Int. J. Greenh. Gas Control. 2017, 63, 289–295. [Google Scholar]
- Ueno, S.; Tsuru, W.; Kinoue, Y.; Shiomi, N.; Setoguchi, T. PIV measurement of carbon dioxide gas-liquid two-phase nozzle flow. Fluids Engineering Division Summer Meeting. Am. Soc. Mech. Eng. 2015, 57213, V01AT20A002. [Google Scholar]
- Mohitpour, M.; Jenkins, A.; Nahas, G. A generalized overview of requirements for the design, construction, and operation of new pipelines for CO2 sequestration. J. Pipeline Eng. 2008, 7, 237–251. [Google Scholar]
- Reader-Harris, M.J.; Barnett, J.; Mistry, K. Orifice Plate Pressure Loss Ratio: Theoretical Work in Compressible Flow and Experimental Work in CO2. In Proceedings of the FLOMEKO 2019 Conference, Lisbon, Portugal, 26–28 June 2019. [Google Scholar]
- Oakes, F.G.; White, J.T. Measurement of CO2 Flow in Its Supercritical and Gaseous Phases. SPE Prod. Eng. 1987, 2, 209–217. [Google Scholar] [CrossRef]
- Park, J.H.; Cha, J.E. Measurements of the flow of supercritical pressure carbon dioxide through venturi flow meter. Flow Meas. Instrum. 2023, 91, 102364. [Google Scholar] [CrossRef]
- Sauerbrun, J. Design and Characterization of a High pressure Flow Loop for Heat Transfer Experiments of Supercritical Carbon Dioxide. Master’s Thesis, Embry-Riddle Aeronautical University, Daytona Beach, FL, USA, 2023. [Google Scholar]
- ISO 5167-4; Measurement of Fluid Flow by Means of Pressure Differential Devices Inserted in Circular Cross-Section Conduits Running Full—Part 4: Venturi Tubes. ISO: Geneva, Switzerland, 2003.
- Xue, D.; Kou, L.; Zheng, C.; Wang, S.; Jia, S.; Yuan, C. Dual-Parameter Prediction of Downhole Supercritical CO2 with Associated Gas Using Levenberg–Marquardt (LM) Neural Network. Fluids 2024, 9, 177. [Google Scholar] [CrossRef]
Disclaimer/Publisher’s Note: The statements, opinions and data contained in all publications are solely those of the individual author(s) and contributor(s) and not of MDPI and/or the editor(s). MDPI and/or the editor(s) disclaim responsibility for any injury to people or property resulting from any ideas, methods, instructions or products referred to in the content. |
© 2025 by the authors. Licensee MDPI, Basel, Switzerland. This article is an open access article distributed under the terms and conditions of the Creative Commons Attribution (CC BY) license (https://creativecommons.org/licenses/by/4.0/).


