1. Introduction
Currently, in Korea, several new technology facilities, such as HVDC and FACT, have been installed and operated in response to the continuous increase in renewable energy and transmission volume. The uncertainty about the operation of power systems is increasing because of the uncertainty from rigid power sources, such as renewable energy, and the complex operation of new technology facilities. As a countermeasure, research on the monitoring and control of the systems using real-time data is continuously conducted; however, research on the Jeju system has not been as actively conducted as that on the land system. Jeju Island is the most active area in Korea for the expansion and supply of renewable energy; however, the load of the system is small, and it is an independent system linked to HVDC with land. In this study, to resolve the uncertainty of the current and future operation of the Jeju power system, an index is proposed to determine transient stability in real time using the Thevenin impedance calculation technique. As mentioned earlier, for special and complex systems such as the Jeju system, the Thevenin impedance of the power system can be estimated based on real-time data, and the transient stability can be determined. This could contribute to the stable operation of the power system by expanding it in the future and reflecting it in the operation of the land system.
According to the recently announced KOREA 10th power supply and demand plan, the solar and wind facility plans for 2024 are 324 and 581 MW, respectively. However, solar and wind facility plans for 2036 are expected to increase by approximately seven times to approximately 2345 and 1586 MW, respectively [
1]. Therefore, approximately 3 GW of renewable energy will be added over the next 10 years. However, when renewable energy is connected to a power system, it has numerous advantages, as well as fatal disadvantages. Unlike conventional generators, renewable energy sources have rigid power characteristics and cannot actively control active and reactive power. In addition, because these sources do not provide sufficient rotational inertia, transient stability problems may arise in the event of large-scale disturbances, such as generator dropouts and transmission line faults.
In addition, because the rotator does not provide sufficient inertial energy, problems with transient stability may arise in the event of large-scale disturbances, such as generator dropouts and track drops [
2]. If renewable energy access continues to increase, the impact of the transient stability problems that may arise on the power system must be considered. Unexpected situations can occur in a power system, such as sudden increases in load, track drops, or generator drops. Stability can be interpreted from several perspectives. Among them, the stability interpretation that is typically considered is phase-angle stability. The phase-angle stability was also reclassified to include transient and small signal stability [
3,
4,
5,
6]. In particular, transient stability is a phenomenon that significantly affects the stability of a power system and refers to an unexpected situation or an unstable reaction state in which the power system shows interference for a short time. A power system consists of various components such as power plants, electric wires, and substations, and power flows such as voltage, current, and frequency are generated between them [
7,
8,
9]. In this case, the possibility of a transient stability problem may increase if the dynamic interaction between components is not stably controlled. When a generator drops or a track accident occurs, the frequency decreases, and the voltage becomes unstable, resulting in synchronous degeneration in serious cases. This is often associated with transient stability. Transient stability can also be expressed as the ability to maintain and recover synchronization. Failure to maintain synchronization in a power system can lead to major disturbances and cause an imbalance between the power supply and demand [
10,
11,
12].
Currently, many substations and power plant systems have a Phasor Measurement Unit (PMU) installed at key points. A PMU is a device that can measure the key variables of a power system in real time with high resolution; thus, it is possible to accurately grasp and monitor the state of the power system. Numerous studies have been conducted owing to these advantages. One of the methods for evaluating the voltage stability using a PMU is the wide-area voltage stability index (WAVI). The WAVI is a method for determining voltage stability using the maximum transmission law by dividing the system into power generation and load areas using real-time phasor information of the voltage and current acquired from the PMU [
13,
14,
15,
16,
17]. In addition, research is underway to calculate the Thevenin impedance using the PMU data and plot a power-phase angle curve. Thus, an area method such as determining the transient stability using the power-phase difference angle curve may also be used [
18,
19].
In the past, methods for determining transient stability using Korean power system data were primarily used. Many studies have used static data rather than real-time data. Representative methods include determining the transient stability using the difference in the phase angle of the generator by eliminating the generator from the system. Each real generator has its inertia. After an accident, if it does not immediately stabilize as soon as it moves to a new equilibrium point of inertia, the phase difference angle fluctuates around the equilibrium point for a certain period. In this situation, synchronous degeneration occurs when the magnitude of the phase-difference angle exceeds the unstable range above the transient stable extreme power. Accordingly, the kinetic energy and effective power change rates of the generators were reviewed. The effective power change rate was that if a failure occurred near the power generation stage in the system, the electricity produced by the generator could not be effectively transferred, resulting in the release of significantly less electrical energy compared to the mechanical energy in the generator. Using the energy action that accelerates the rotation of the generator, the degree of influence of the generator was examined by observing the rate of change in the tide flowing through the transmission line when the generator was dropped. In addition, based on the kinetic energy, the greater the rotational kinetic energy among the generators experiencing degeneration in the event of a failure, the greater the energy reduction effect in the event of a generator dropout, which was used to analyze the transient stability [
20,
21,
22,
23,
24]. In addition, a method was proposed for confirming that the electrical output of the equivalent generator increased and the mechanical output decreased after reconstructing the stability index for the maximum export (SIME) analysis after shutting off the generator [
25,
26,
27].
In this study, the Thevenin impedance was estimated using real-time data, unlike the previously studied voltage stability monitoring index and transient stability monitoring methods. Using this approach, an index was presented to determine transient stability through the improved equal-area method by plotting a power-phase angle curve. The proposed index can determine the current degree of transitional stability in real time for possible future failures. This is an index that can visually provide the transient stability level to the system operator. In the future, a method will be presented for determining changes in transient stability due to continuous renewable energy connections.
The core research question addressed in this study is as follows:
“How can transient stability be assessed in real time with limited system-wide data, particularly in the presence of high renewable energy penetration?”
To answer this question, a novel real-time transient stability assessment method is proposed. Unlike conventional approaches that require extensive offline simulations and full system information, this method utilizes only real-time Phasor Measurement Unit (PMU) data to determine transient stability. The key innovations of this study include the following:
The proposed method estimates Thevenin equivalent impedance dynamically using PMU measurements, allowing for real-time stability monitoring without requiring detailed system modeling.
- b.
Integration of an Improved Equal Area Criterion (EAC)
While the Equal Area Criterion (EAC) is traditionally applicable only to a single-machine infinite bus (SMIB) system, this study reinterprets EAC by introducing a new reference bus, enabling its application to complex multi-machine power systems.
- c.
Introduction of a Transient Stability Discrimination Index (TSDI)
A new transient stability discrimination index (TSDI) is introduced, which provides a stability ranking rather than an exact critical clearing time (CCT), making it a computationally efficient tool for real-time grid operations.
This study differs from previous research in the following key aspects:
Conventional transient stability assessment methods rely on full system modeling and offline simulations, whereas the proposed method enables real-time assessment using only PMU data and Thevenin impedance estimation.
- b.
Practicality for Renewable Energy-Dominant Grids:
Traditional methods often assume synchronous machine dynamics, which do not fully account for the increasing presence of inverter-based renewable energy sources (RESs).
The proposed method provides a generalized approach that can be applied to modern grids with high RES penetration, where conventional synchronous-based approaches may no longer be effective.
- c.
Computational Efficiency:
The proposed method does not require solving complex time-domain simulations, significantly reducing computational overhead, and making it feasible for real-time control center applications.
Section 2 explains the process of calculating the Thevenin impedance, which is a parameter for determining transient stability, using the Thevenin impedance calculation technique.
Section 3 introduces the transient stability and equal-area methods. In
Section 4, the parameters required by the equal-area method mentioned in
Section 3 are measured and calculated using case studies. In
Section 5, the future development prospects of the discrimination theory are briefly presented along with a review of the results.
4. Case Study
Renewable energy is clean energy with low water consumption and sustainable power generation; however, large volatility and unpredictable uncertainty in the output negatively affect the operation of the power system. To confirm this, the transient stability was determined by comparing the area change according to the connection between renewable energy and the power system.
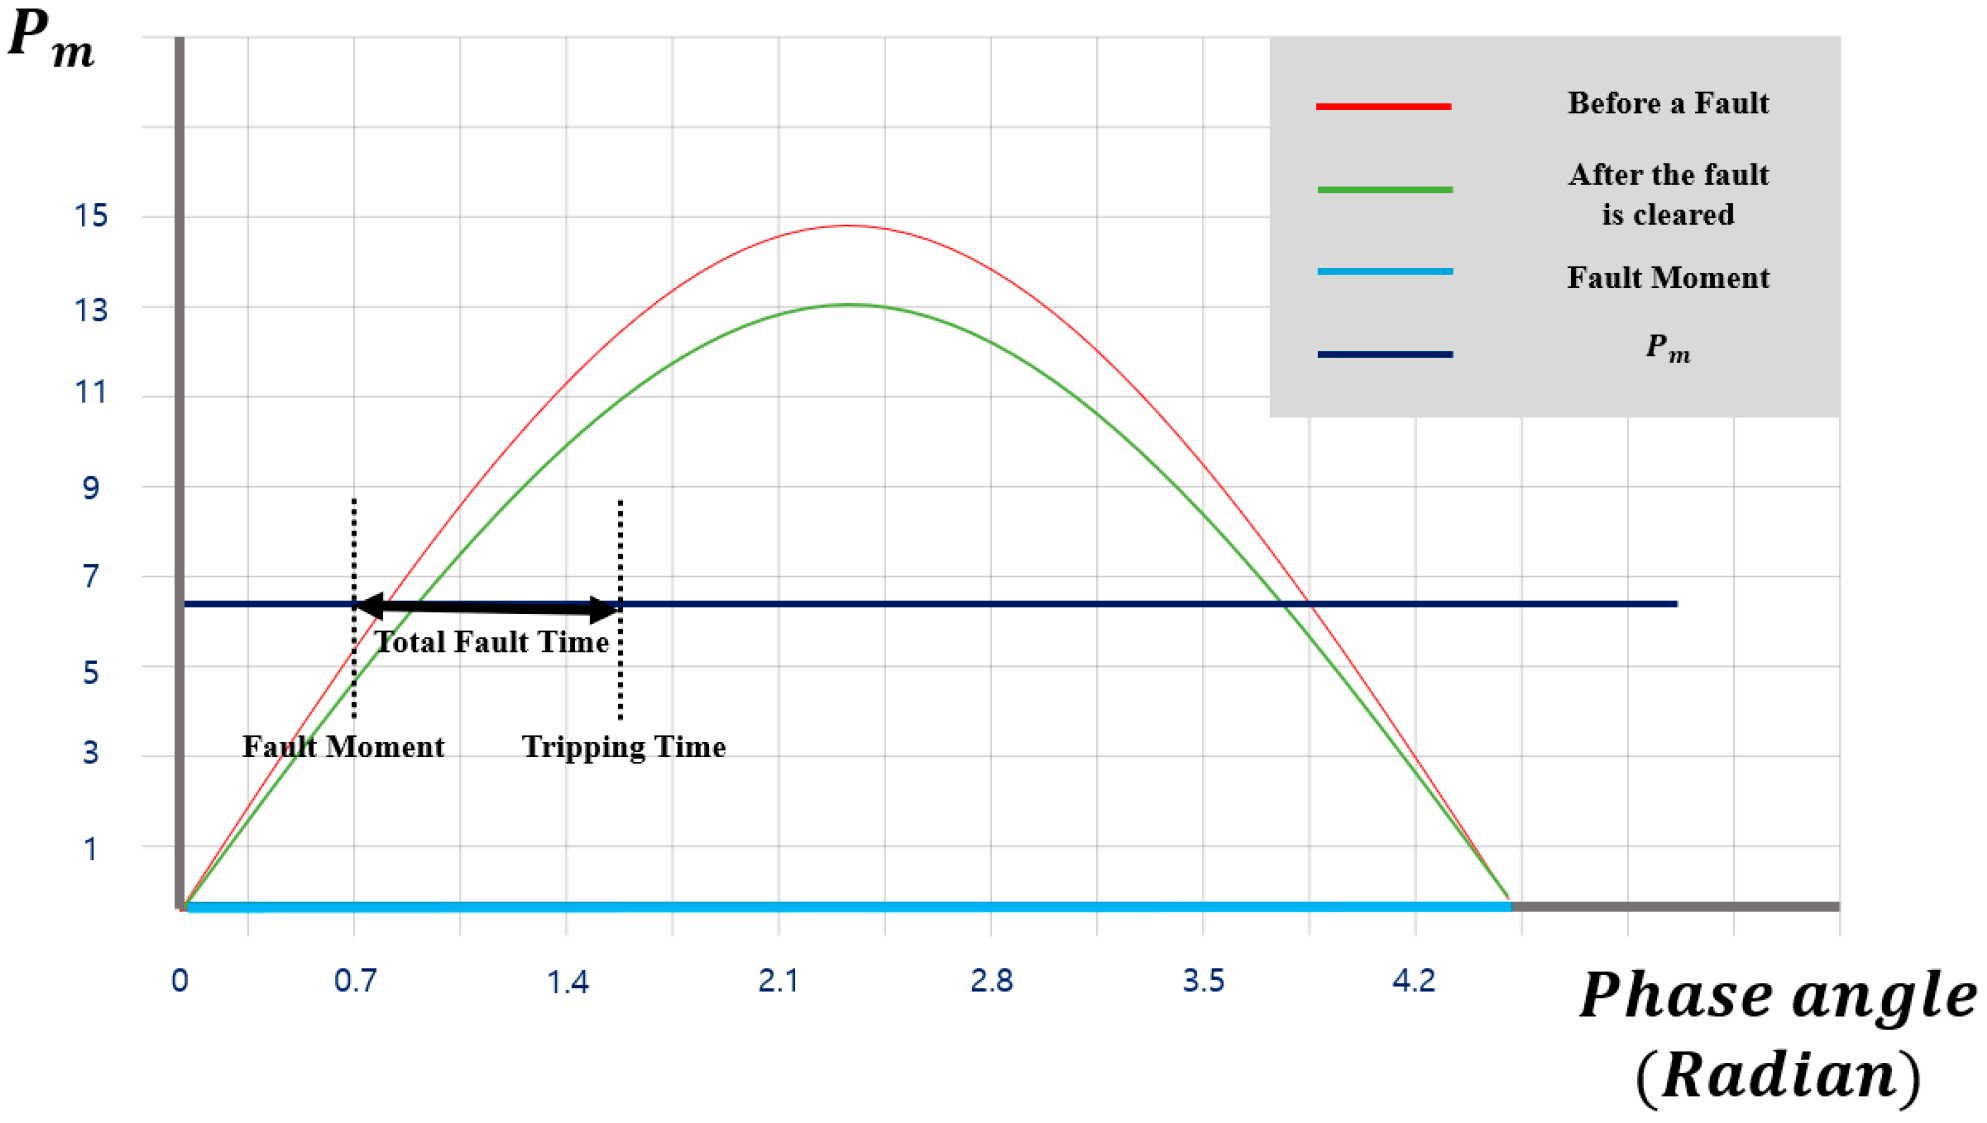
In this section, the accident scenario is selected using the PSS/E204_OFF_Peak Jeju system data provided by KEPCO to obtain the normal load voltage (VL), total voltage (VTh), load impedance (ZL), and Thevenin impedance (ZTh) values. Recently, there have been many accidents in which HVDC has failed temporarily. The cause of occurrence is the cooling system components, such as controller component defects. Accordingly, a failure scenario was used for a track with a large current on the Jeju–Jindo HVDC bus line. The first step was to determine the transitional stability using the scenario. The transitional stability determination index Sindex was used to determine the transitional stability, using the area ratio of the equal-area method. Second, the rate of renewable energy use continues to increase owing to climate change and new energy projects. If Korea’s 10th electricity supply and demand plan is reflected, it is projected that by 2036, approximately 30% of Jeju Island’s renewable energy facilities will be installed. However, if renewable energy, which is inertial and weather-affected, is added without connection to the system stability, it will be a problem for the power system. Therefore, by installing additional renewable energy in the scenario, the transient stability was compared using a system that increased the current and renewable energy by 30%.
Third, to determine the accuracy using previously applied results, the accuracy was verified by comparison with the voltage stability index (WAVI). The difference between the Sindex and WAVI is that Sindex determines the stability using the area of the equal-area method, whereas the WAVI is determined using the load impedance and Thevenin impedance. Compared to WAVI, Sindex has the advantage of being able to check stability and visualize parameters in real time. In addition, it is one of the advantages of critical clearing time (CCT) through visualization time.
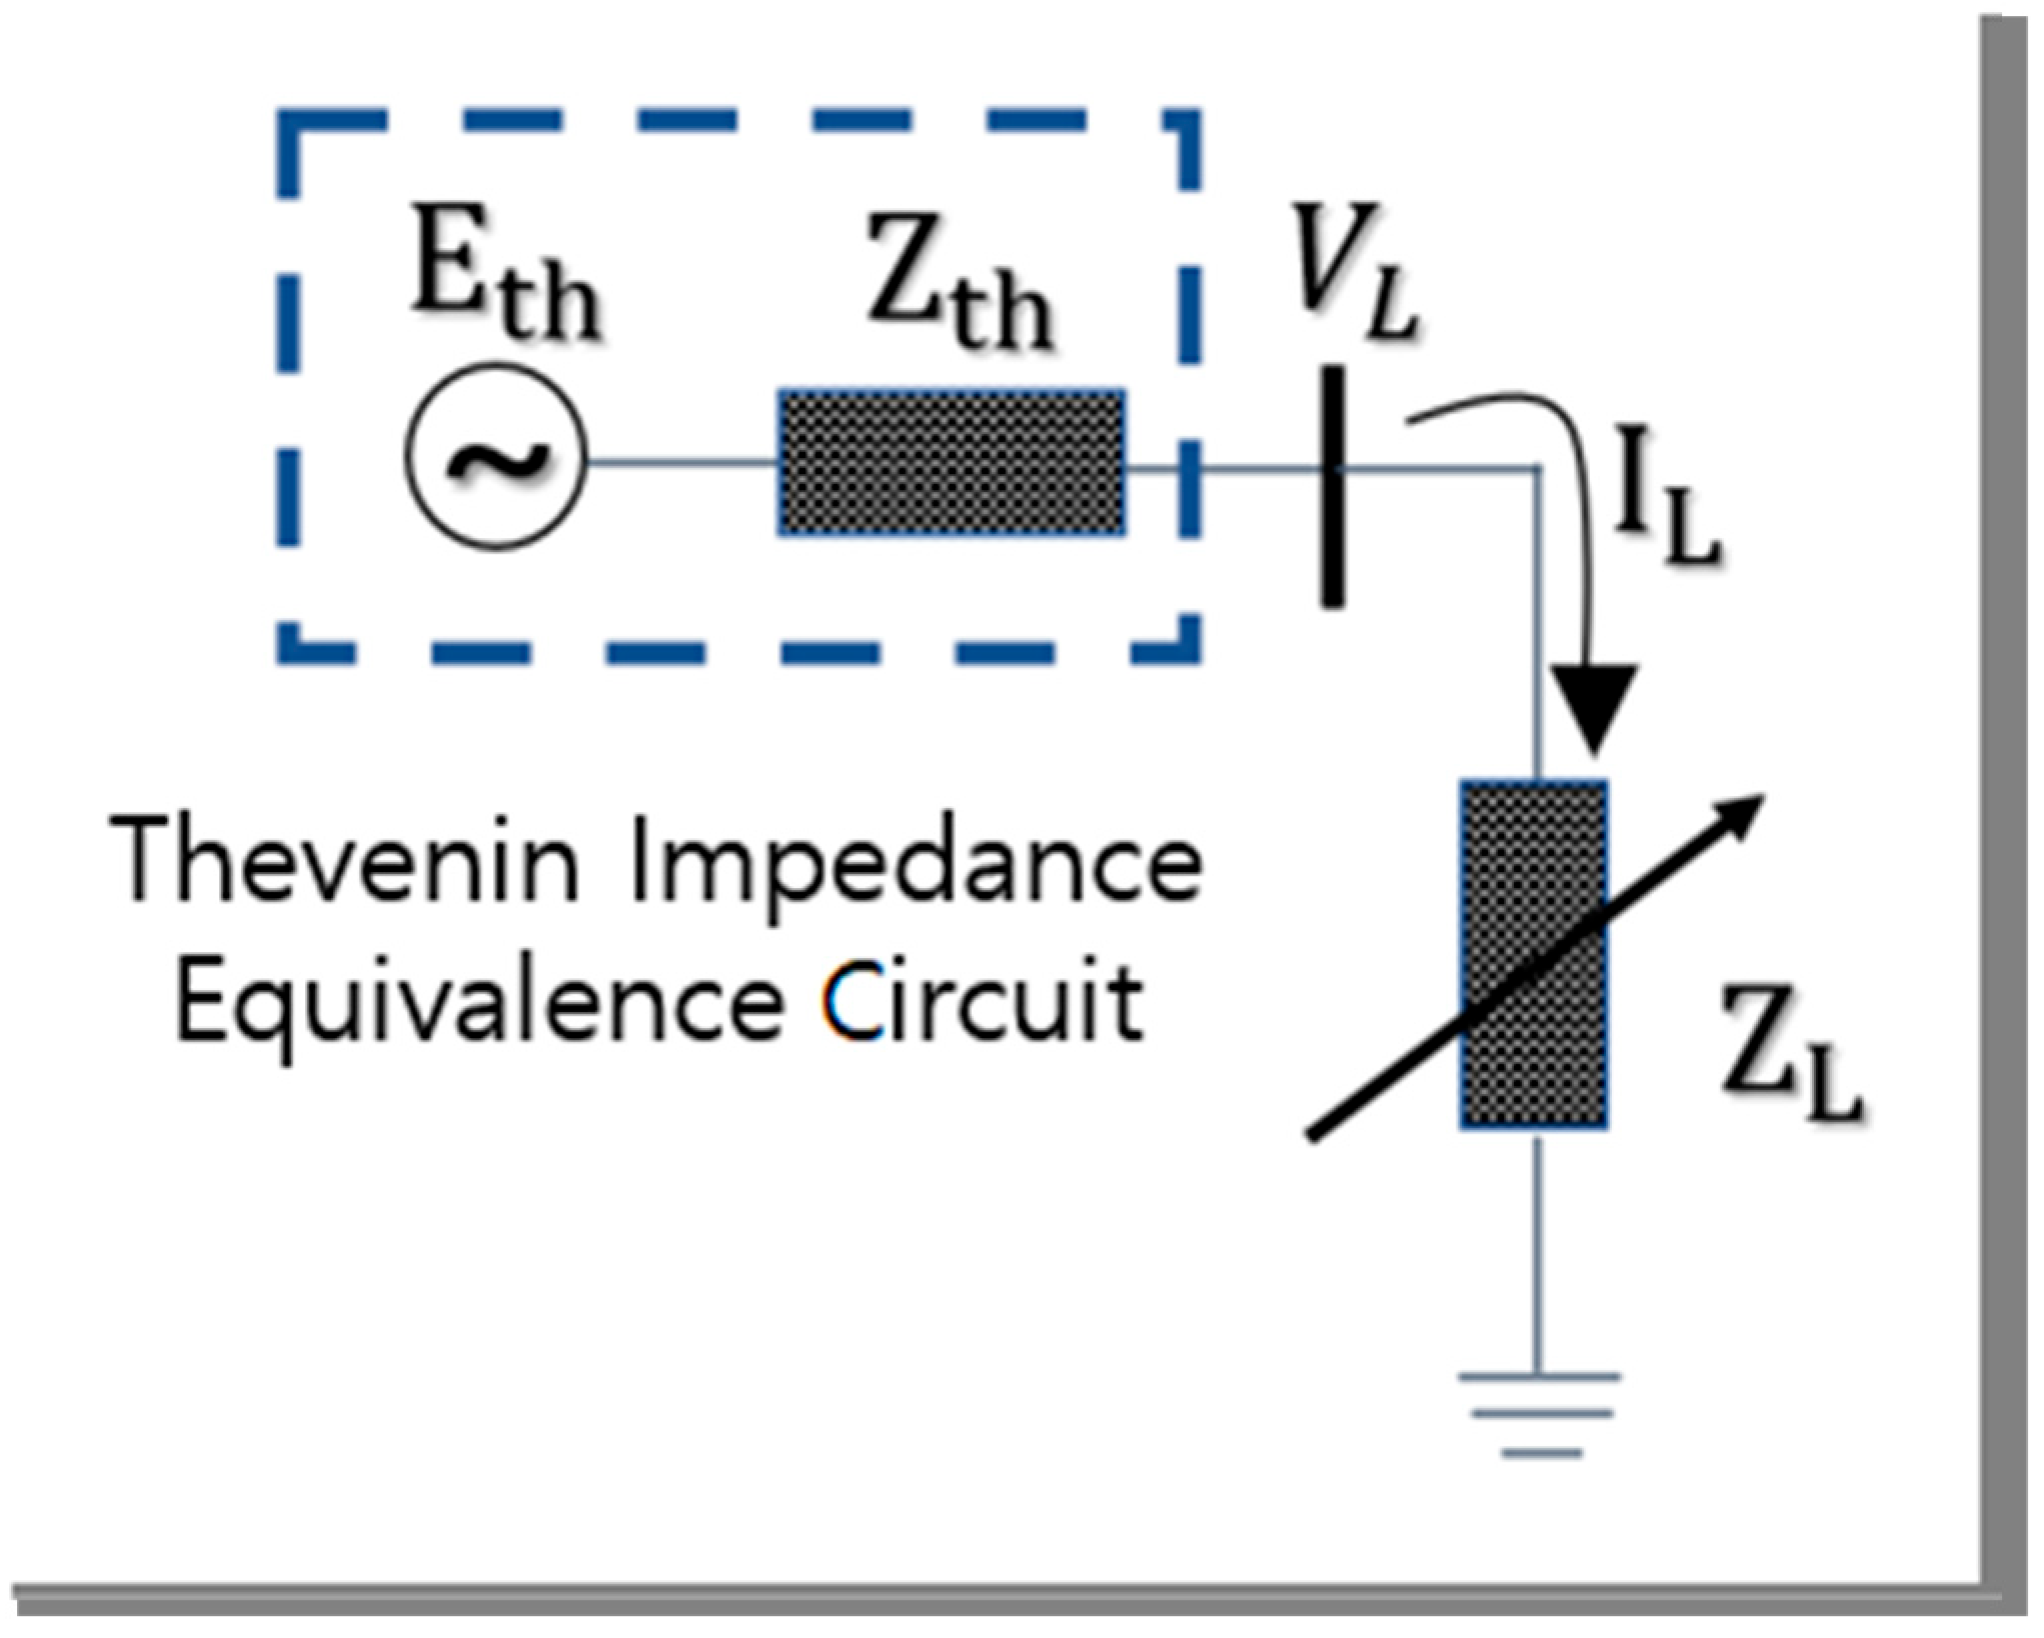
4.1. Measurement and Calculation of Bus VL, VTh, ZTh, ZL
Through PSS/E Bird calculation analysis, the voltage and phase angle of the parameters required for the transient stability determination index of the steady state and the state after the failure was eliminated were measured using the line failure connected to the HVDC bus. In addition, the voltage and impedance values of the failure state were assumed to be zero and infinite, respectively. This is because the impedance was assumed to be infinite because the accident state was caused by a three-phase short circuit that forced the voltage and current to drop instantaneously. The load bus was measured and calculated using 12 Jeju system data points.
The Thevenin impedance was calculated using V
L and VTh using the Thevenin impedance calculation method described in
Section 2. The complex power (S
L) values were calculated using the active and reactive powers of the load installed on the load bus.
4.2. Define and Calculate Transient Stability Discrimination Index
The transient stability determination index S
index uses the equal-area method. Therefore, power is required before and after failure elimination. The equation for plotting the power-phase angle curve using the parameters shown in
Table 1,
Table 2,
Table 3,
Table 4,
Table 5,
Table 6 and
Table 7 is as follows:
Using these parameters, the power-phase angle curve can be obtained using the phase angle curve equation.
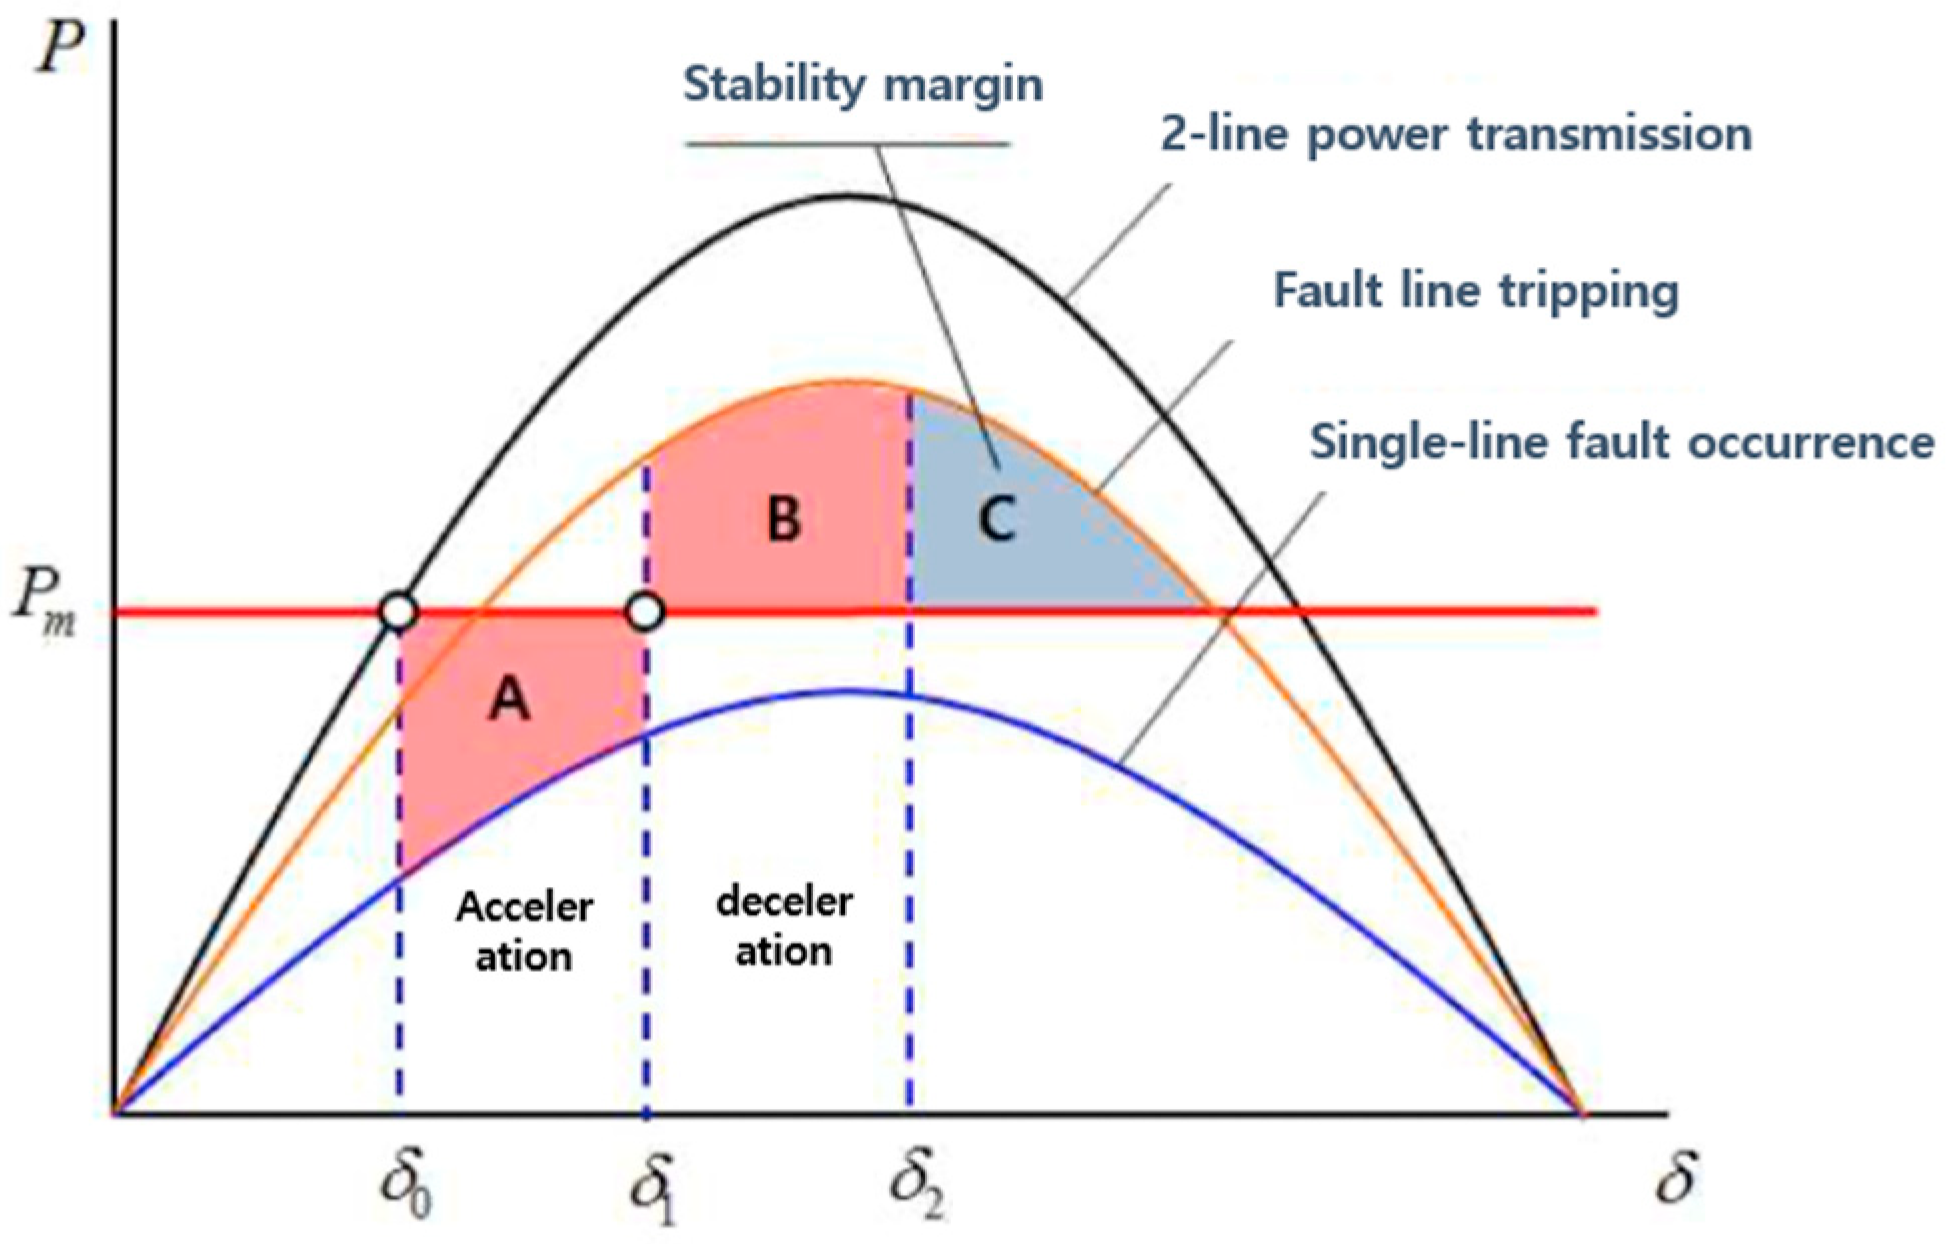
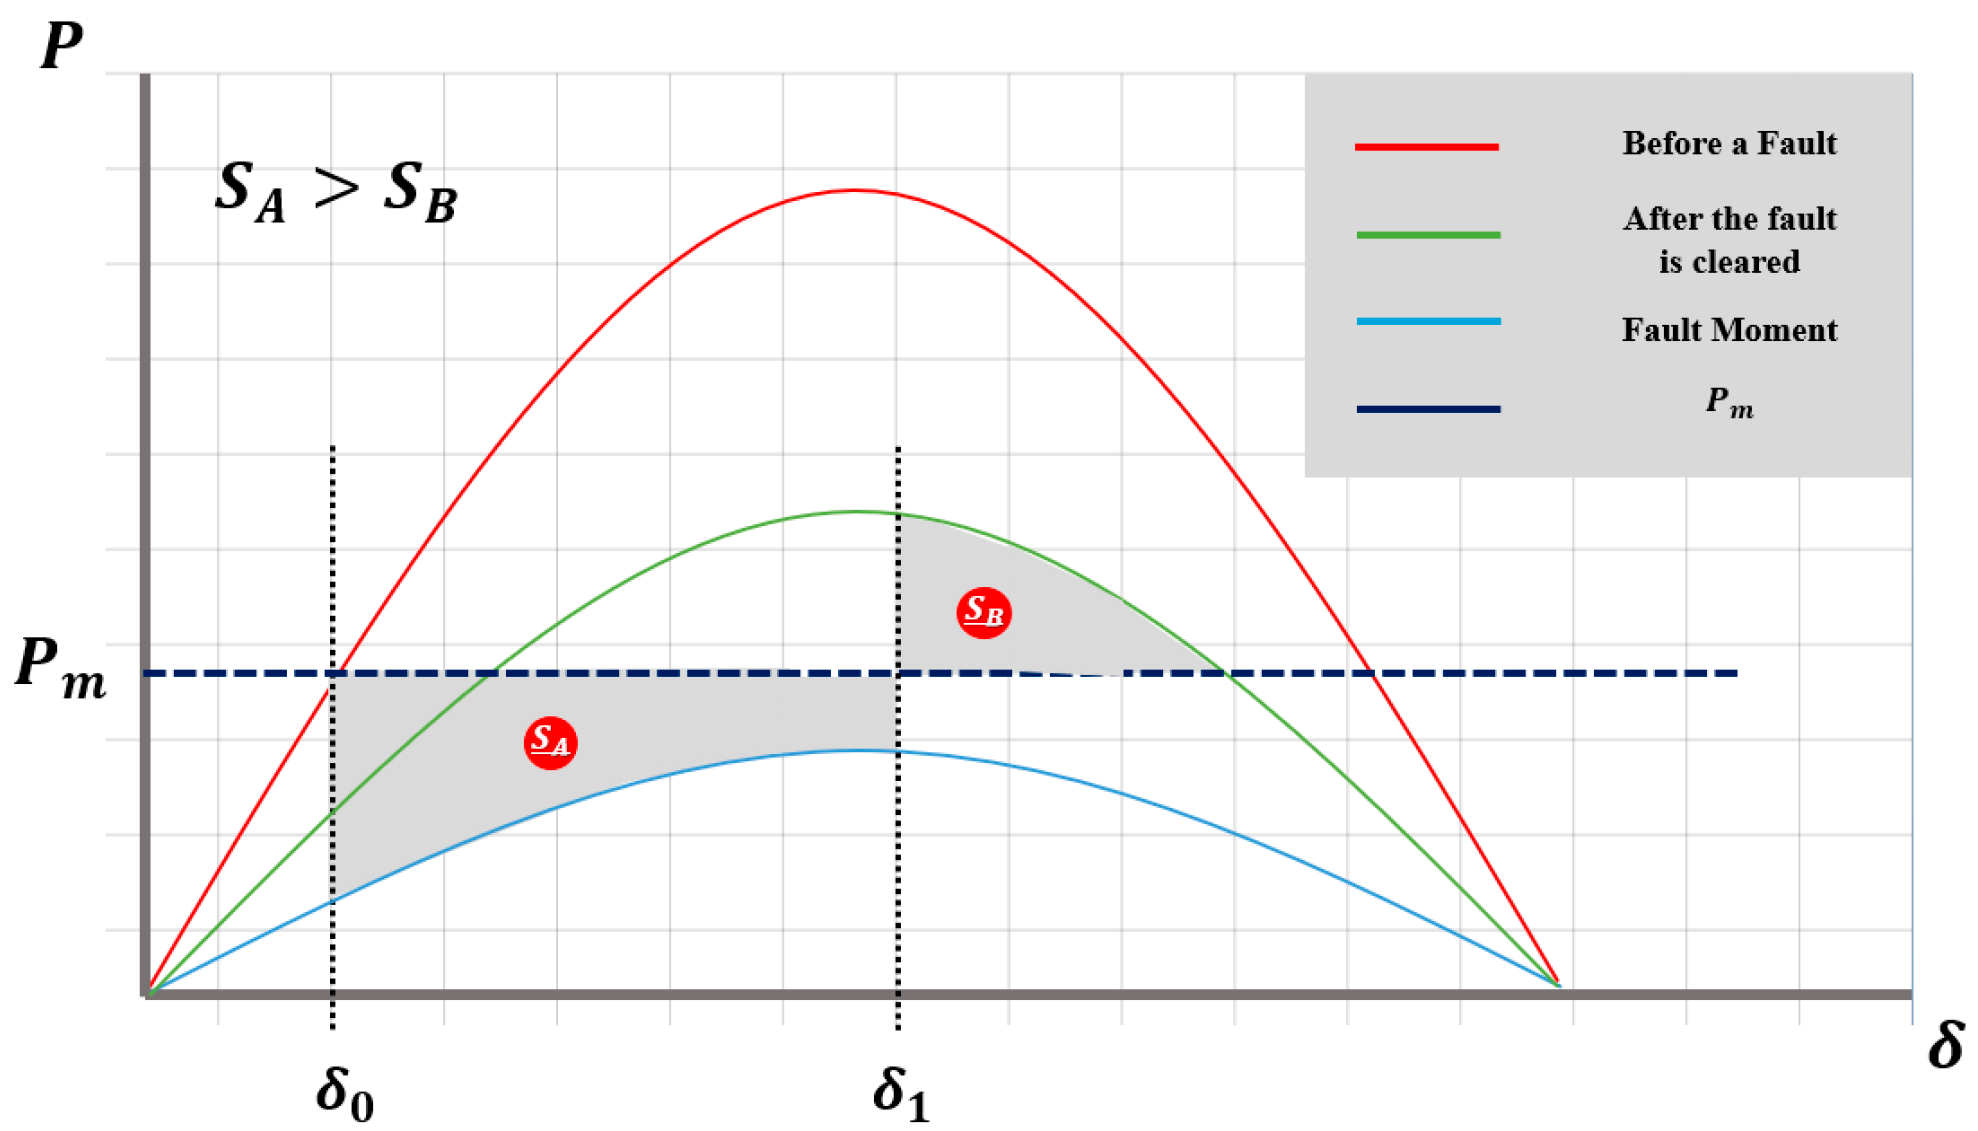
As shown in
Figure 3, area A is represented by S
A, and areas B and C are represented by S
B to calculate the two values and use the ratio of the areas to determine the transient stability discrimination index S
index. To calculate the area, the mechanical input (P
m), lead angle (θ), lead angle difference (∆θ), premise voltage (V
Th), load voltage (V
L), and Thevenin impedance (Z
Th) were required. This area was obtained using integrals. However, because there was no integral symbol in the equation, and thus no power-lead angle curve during failure, the mechanical input (P
m), i.e., the generator input, could be assumed vertically, and the lead angle difference (∆θ) horizontally, enabling calculation using the formula for the area of a rectangle. Furthermore, each lead angle (θ) was defined using a number, where θ
0 represented the lead angle at the point of failure, θ
1 represented the lead angle at the point of recovery, and θ
2 was defined as the lead angle at which maximum critical operation was possible. Based on
Figure 3 above, the equation for calculating the area using the equal-area method was as follows:
During failure, because the state was a three-phase short-circuit state, V
Th = 0, the part in Equation (8) written with the integral symbol may be omitted. Therefore, from Equation (8), S
A can be expressed as follows.
The S
A and S
B areas were calculated using the equations above.
Table 5 presents the S
A and S
B area calculations.
The transient stability determination index S
index could be defined using the calculated values of S
A and S
B areas. S
index was used for the deceleration, acceleration, and transient stability margin areas using the area theory of the equal-area method. As mentioned in
Section 3, the acceleration area was defined as S
A, and the area obtained by adding the deceleration area and transient stability margin area was defined as S
B. After an accident occurs in the power system, the critical part that can block the accident is in a critical state when the S
A area and S
B area are similar. If the S
B area is larger than the S
A area, it can be deduced that the transient stability is inadequate. In the opposite case, it can be deduced that the transitional stability is good. Based on this, S
index can be defined by Equation (11). In conclusion, if S
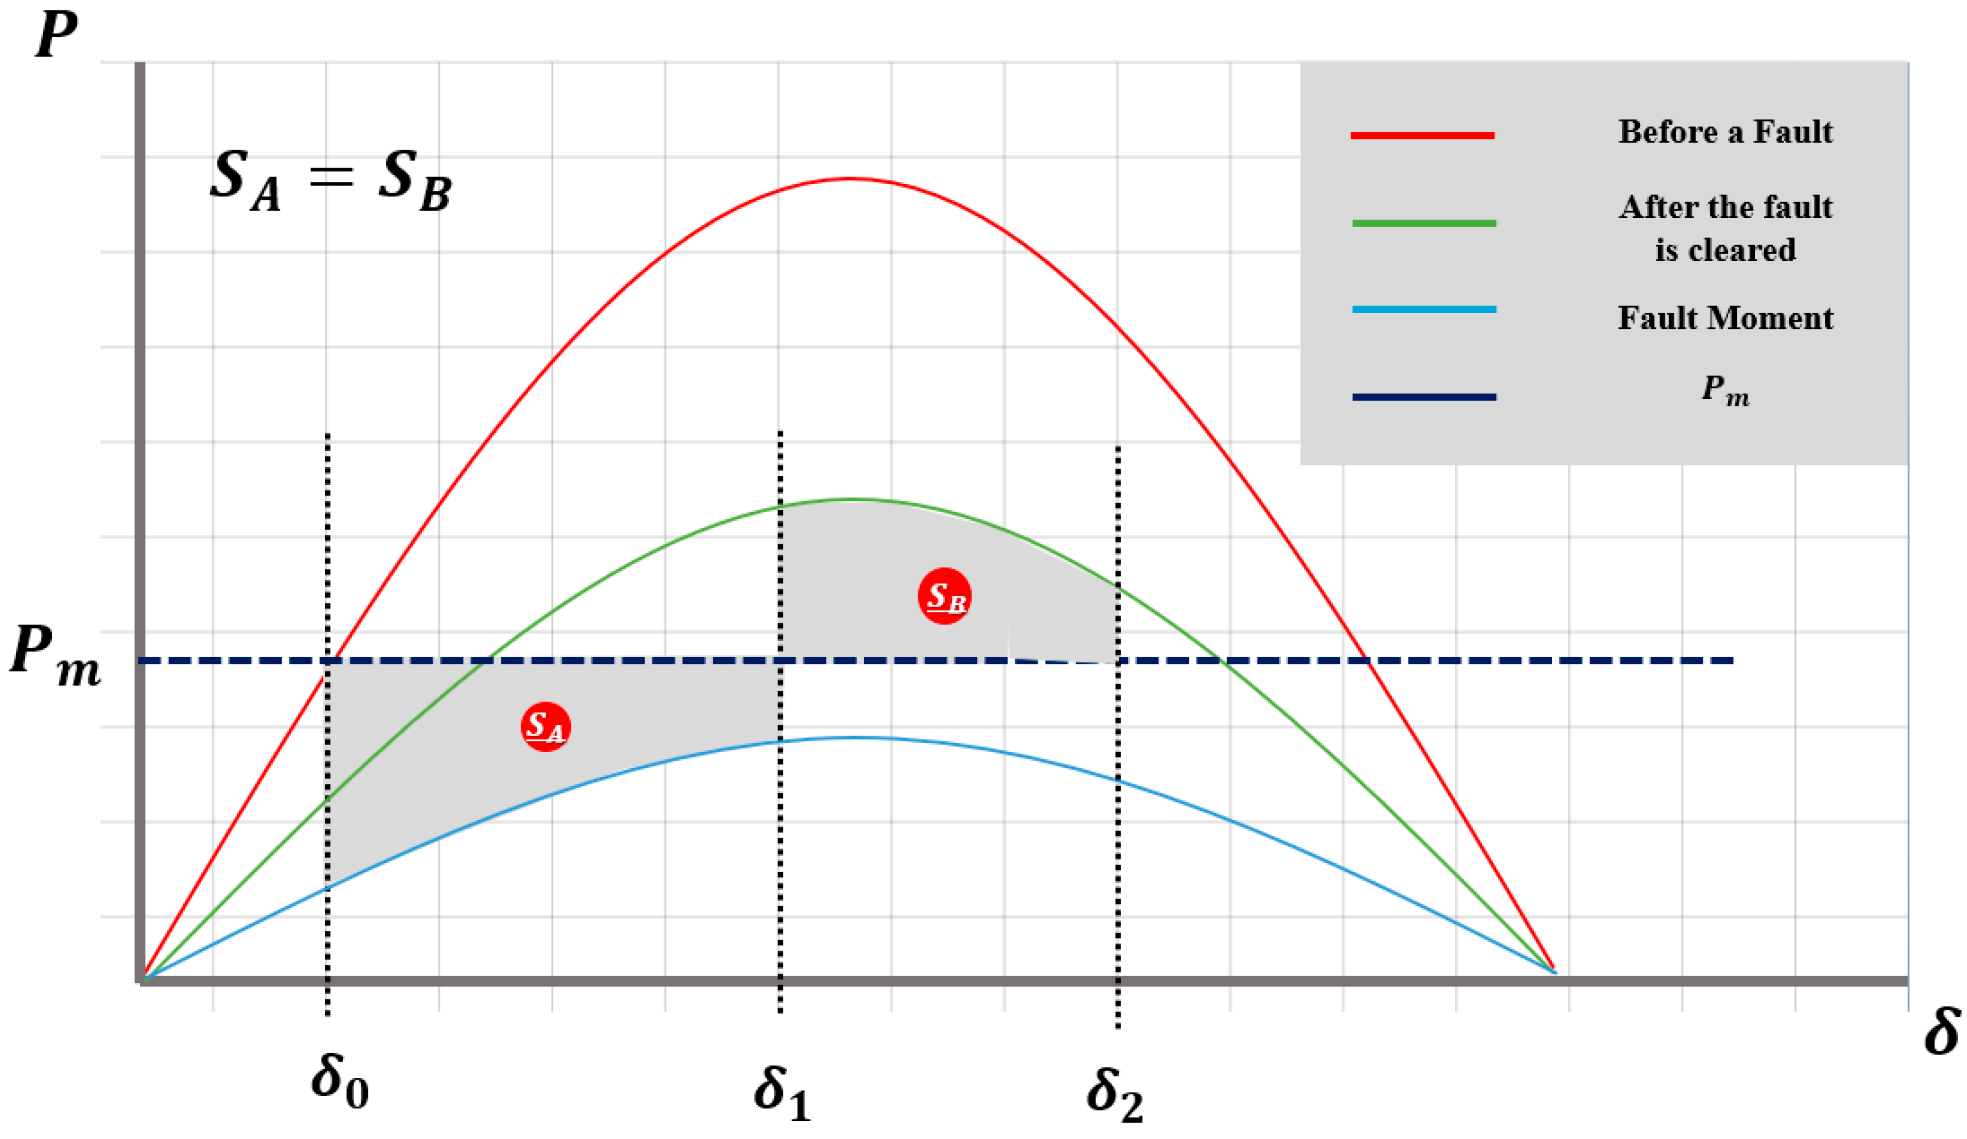
index is less than “1”, it can be inferred that the transient stability is stable, and if it is greater than “1”, it can be expected that the transient stability is unstable.
Figure 4 shows the critical state in which the S
A and S
B areas are the same. In
Figure 5, because the S
A area was larger than the S
B area, the transient stability state was a stable curve.
Based on Equation (11), the transient stability discrimination index value was defined using the areas of S
A and S
B.
Table 6 shows the S
index for each bus line substituted into Equation (11) using these parameters.
Based on
Table 6, the S
index values, which are the transient stability discrimination indices, are not greater than “1”; therefore, it can be concluded that there is room for transient stability in the current Jeju system. Thus, it is expected that even if additional renewable energy facilities are installed, they will not significantly affect the transition stability. However, if renewable energy that does not exist in inertia is added to the land system, which has more power supply and demand than the Jeju system, it is expected that the generator input operating point will increase more than before, the S
A will increase, and the S
B will decrease; thus, the transient stability may not be good.
4.3. Calculation of Sindex Index Based on Additional Renewable Energy Facilities
This section examines the process of precisely analyzing and calculating the effects of introducing additional renewable energy facilities on the Sindex index. The Sindex value of the transient stability determination index according to the introduction of the additional renewable energy installation confirms the margin of transient stability compared to that before the additional installation. In particular, calculating the transient stability discrimination index to evaluate the efficiency and stability of renewable energy can be used to quantitatively determine the stability of an energy system following the introduction of new facilities.
The value of an additional renewable energy facility depends on the generator input. According to the 10th plan for the supply and demand of electricity in Korea, the current generator input value was 563.4 [MW] as of 2024, and there is a plan to increase the installation of an additional 30% renewable energy facilities in the future. Based on this, the renewable energy ratio of the system was increased by 30%, and the generator input value was selected as 733.55 [MW]. The table below lists the Sindex calculation values according to the additional installation energy.
Later, when renewable energy facilities were connected to the system, the transient stability was determined using the equal-area method. The S
index values presented in
Table 6 and
Table 7 show the area change and transient stability discrimination index. It is confirmed that there was a change in the area, but the margin of the transient stability decreased; however, it did not have a significant effect. Renewable energy is highly volatile because it depends on the weather conditions. In addition, it is necessary to monitor power generation and supply power effectively in real time; however, renewable energy resources are inertial, and the power supply is not constant. If additional renewable energy facilities are installed, the transitional stability will inevitably be poor.
4.4. Verification of the Accuracy of Transient Stability Discriminant Sindex
In this study, the S
index was defined according to the equal-area method using the perturbation equation theory, and the accuracy of the transient stability discrimination index was verified using the WAVI [
5] index. WAVI is a voltage stability monitoring index that uses the Thevenin and load impedance data measured and calculated in this system. WAVI is a technique that can determine the voltage stability through information measured in the installation area without system information and can estimate the state of the system according to the system change. The maximum power that an equivalent power source can transmit to a load occurs when the Thevenin impedance equals the load impedance. When the maximum power-transfer law is applied to the power system, the limit value of the power that can be supplied to the load bus is the load power when the Thevenin impedance is equal to the load impedance. Thus, the positive voltage instability phenomenon on the impedance plane can be explained by the impedance ratio, and the stable conditions for the voltage stability can be defined by the following equation:
Using Equation (12), the WAVI was calculated using the system load impedance and Thevenin impedance of the system as of 2024 and a system whose renewable energy ratio increased by 30% in the future. The table below shows the calculated WAVI values.
According to
Table 8, because the WAVI did not exceed “1”, it was inferred that there was no problem with the transitional stability in the system. It can be concluded that there was no problem in determining the index by area and the transitional stability using the equal-area method. However, because the WAVI and S
index indices for the data with additional renewable energy facilities installed were larger, the transition stability was less stable than that of the existing system [
10,
11,
12,
13,
14]. Based on this, it can be confirmed that the transient stability was reduced if renewable energy was additionally installed in the system. Moreover, the WAVI, the existing voltage stability index, and S
index values using the theory of the equal-area method were considered to have no problems with accuracy, because the margin of the transient stability decreased when renewable energy was connected.
5. Discussion
This study introduces a real-time transient stability assessment method that utilizes Thevenin impedance estimation and an improved Equal Area Criterion (EAC) to provide stability rankings using limited PMU data. The key contributions of the proposed method are as follows:
Minimal Data Requirement: Unlike conventional methods requiring full system parameters, this approach estimates transient stability using only real-time PMU data.
Computational Efficiency: The method eliminates the need for time-domain simulations, allowing real-time implementation.
Practical Application to Renewable Energy Systems: The method effectively evaluates transient stability in high RES-penetrated grids, where traditional inertia-based approaches may not be suitable.
- b.
Comparison with Conventional Methods
Traditional transient stability assessment methods, such as time-domain simulations (TDS) and direct methods based on Lyapunov energy functions, require detailed system modeling and extensive computation time. These methods are well suited for offline studies but may not be feasible for real-time grid operations.
The proposed method provides a real-time alternative by utilizing Thevenin impedance estimation and a stability discrimination index. While a direct comparison with full offline simulations is difficult, results show that the proposed method provides stability rankings comparable to the wide-area voltage stability index (WAVI). This validates the method’s ability to assess transient stability efficiently using real-time data.
- c.
Limitations and Future Work
Despite its advantages, the proposed method has some limitations:
Approximate Stability Assessment: Unlike TDS, which determines precise critical clearing times (CCTs), the proposed method focuses on stability ranking, which may not provide exact fault tolerance margins.
Impact of RES Dynamics Not Fully Modeled: The study assumes that renewable energy sources behave as constant power injections, which simplifies analysis but does not fully capture fast inverter dynamics. Future work will incorporate detailed inverter-based modeling to improve accuracy.
Limited Validation with Real System Data: Further case studies and testing on actual power grids will strengthen the method’s applicability for industry use.
The proposed method provides a fast, real-time tool for grid operators to assess transient stability and take preventive actions before system instability occurs. As power systems move toward higher renewable energy penetration, real-time assessment techniques such as this will become increasingly important to ensure secure operation without relying on traditional synchronous machine-based stability models.


