1. Introduction
Multiphase fluid displacement in porous media governs fundamental processes spanning hydrocarbon migration, petroleum charging, geological CO
2 sequestration, and groundwater remediation [
1,
2,
3,
4]. In petroleum systems, oil-water two-phase flow within reservoir rocks critically determines hydrocarbon migration pathways and accumulation efficiency during basin development [
5]. During petroleum charging processes, pore-scale interfacial phenomena significantly influence oil phase distribution and connectivity, directly affecting ultimate hydrocarbon distribution and trap filling efficiency [
6,
7]. Recent advances in X-ray micro-computed tomography (micro-CT) have significantly improved our ability to visualize and quantify fluid distributions at micrometer scales [
8], enabling direct observations of wettability effects [
9] and capillary-dominated displacement processes [
10]. Nevertheless, significant challenges remain in characterizing transient petroleum migration dynamics under reservoir conditions [
11], particularly regarding the formation and evolution of preferential migration pathways [
12,
13].
Recent experimental studies have primarily focused on water-displacing-oil processes (production scenarios) rather than oil-displacing-water processes (charging scenarios). In production-oriented research, Li et al. [
14] demonstrated that water injection breaks larger oil clusters into smaller clusters or disconnected droplets, reducing oil relative permeability. Setiawan et al. [
15] observed that in water-wet media, water proceeds along pore walls, moving oil to pore centers, where it becomes trapped with characteristic convex interfaces. Georgiadis et al. [
16] reported that during imbibition, as non-wetting phase saturation decreases, the largest cluster disintegrates into smaller clusters. Conversely, during drainage processes that more closely resemble petroleum charging, the non-wetting phase behavior follows different patterns—the largest cluster expands at the expense of smaller ones, with its relative volume ranging from 65% to 99%. Song et al. [
17] further observed that wettability significantly influences these displacement patterns, with intermediate-wet conditions producing network-pattern residual oil. These observations highlight the distinct differences between production and charging processes, with few studies systematically investigating oil-displacing-water dynamics relevant to petroleum migration and accumulation.
Significant technological advances have enhanced our capability to visualize multiphase flow in porous media. Laboratory-based micro-CT systems can now achieve sub-minute temporal resolution for dynamic imaging, enabling the capture of rapid phenomena, such as Haines jumps and cooperative pore-filling events [
18,
19]. Synchrotron-based imaging offers temporal resolution down to milliseconds while maintaining micrometer-scale spatial resolution [
10], facilitating the observation of previously unidentified pore-scale processes such as droplet fragmentation [
20] and interface pinning at rough surfaces [
21]. Our previous work using digital radiography (DR) differential analysis revealed non-monotonic patterns in oil saturation evolution within large pores of tight reservoirs [
22], suggesting complex microscopic flow dynamics during petroleum charging that traditional endpoint saturation methods cannot adequately characterize.
Despite these advances, current dynamic displacement studies face several significant challenges. First, while conventional CT systems have improved significantly, they still encounter inherent trade-offs between spatial resolution, temporal resolution, and field of view [
23,
24]. Most systems lack sufficient temporal resolution (typically > 15 s) to capture transient flow phenomena while maintaining high spatial resolution and representative sample volumes [
25]. Second, temperature effects on displacement dynamics remain poorly understood despite their critical importance in petroleum systems. Temperature variations can significantly alter both rock properties [
26] and fluid transport mechanisms [
27], with implications for petroleum migration efficiency that current pore-scale models still struggle to fully capture [
28,
29]. Third, existing experimental setups rarely permit continuous flow rate variations under controlled temperature conditions while maintaining the capability for high-resolution 3D imaging, limiting our understanding of the complex relationship between flow conditions and preferential pathway development.
Here, we present a systematic investigation of oil-water displacement dynamics in Berea sandstone using a novel experimental platform that integrates online micro-CT imaging with real-time fluid displacement monitoring. Unlike previous studies focusing primarily on water-displacing-oil processes, our research specifically targets oil-displacing-water dynamics to model petroleum migration and charging mechanisms. Our approach employs high-resolution (3.78 μm) imaging coupled with continuous flow rate variation (0.10–0.35 mL/min) at two distinct temperatures (20 °C and 50 °C), enabling detailed characterization of dynamic fluid distribution patterns. Through this experimental investigation, we address three fundamental questions: (1) How do temperature and flow rate influence oil saturation patterns during petroleum charging processes? (2) What characteristics govern the dynamic evolution of oil clusters through successive injection conditions? (3) How do preferential migration pathways develop and respond to changing temperature conditions? Our findings provide quantitative insights into petroleum migration mechanisms, with implications for understanding hydrocarbon distribution and accumulation patterns in sedimentary basins.
2. Materials and Methods
2.1. Sample and Fluid Properties
The experimental investigation utilized Berea sandstone as the primary test medium. This quartzitic sandstone features a homogeneous pore structure with moderate petrophysical properties [
30,
31,
32], characterized by a porosity of 17.6%. The core sample was precision-cut to dimensions of 6 mm in diameter and 10 mm in length to achieve sufficient spatial resolution in micro-CT imaging while ensuring representative pore-scale fluid distribution observations.
The aqueous phase comprised a 20 wt% potassium iodide (KI) solution, selected for its comparable density and viscosity to pure water, along with enhanced X-ray attenuation for improved phase contrast imaging. For the oil phase, reagent-grade kerosene was chosen as a non-polar organic displacement fluid. While kerosene lacks the complex polar compounds (asphaltenes, resins) present in crude oils that can alter fluid-rock interactions, it provides several critical advantages for this systematic study: (1) rheological properties similar to light crude oil (density and viscosity), (2) chemical stability ensuring reproducible fluid properties across multiple experimental cycles, (3) minimal interaction with the rock matrix, preserving the natural water-wet characteristics of Berea sandstone, and (4) well-defined composition that reduces experimental variability. No wettability-altering treatments were applied to the core sample, ensuring that the observed displacement dynamics represent the intrinsic behavior of oil-water systems in water-wet sandstone. This selection allowed us to isolate the specific effects of temperature and flow rate on displacement dynamics, which was the primary objective of our investigation. The significant difference in X-ray attenuation between the KI solution and kerosene facilitated robust phase differentiation in the CT images, enabling accurate quantification of fluid distributions [
33].
2.2. Experimental Apparatus and Procedure
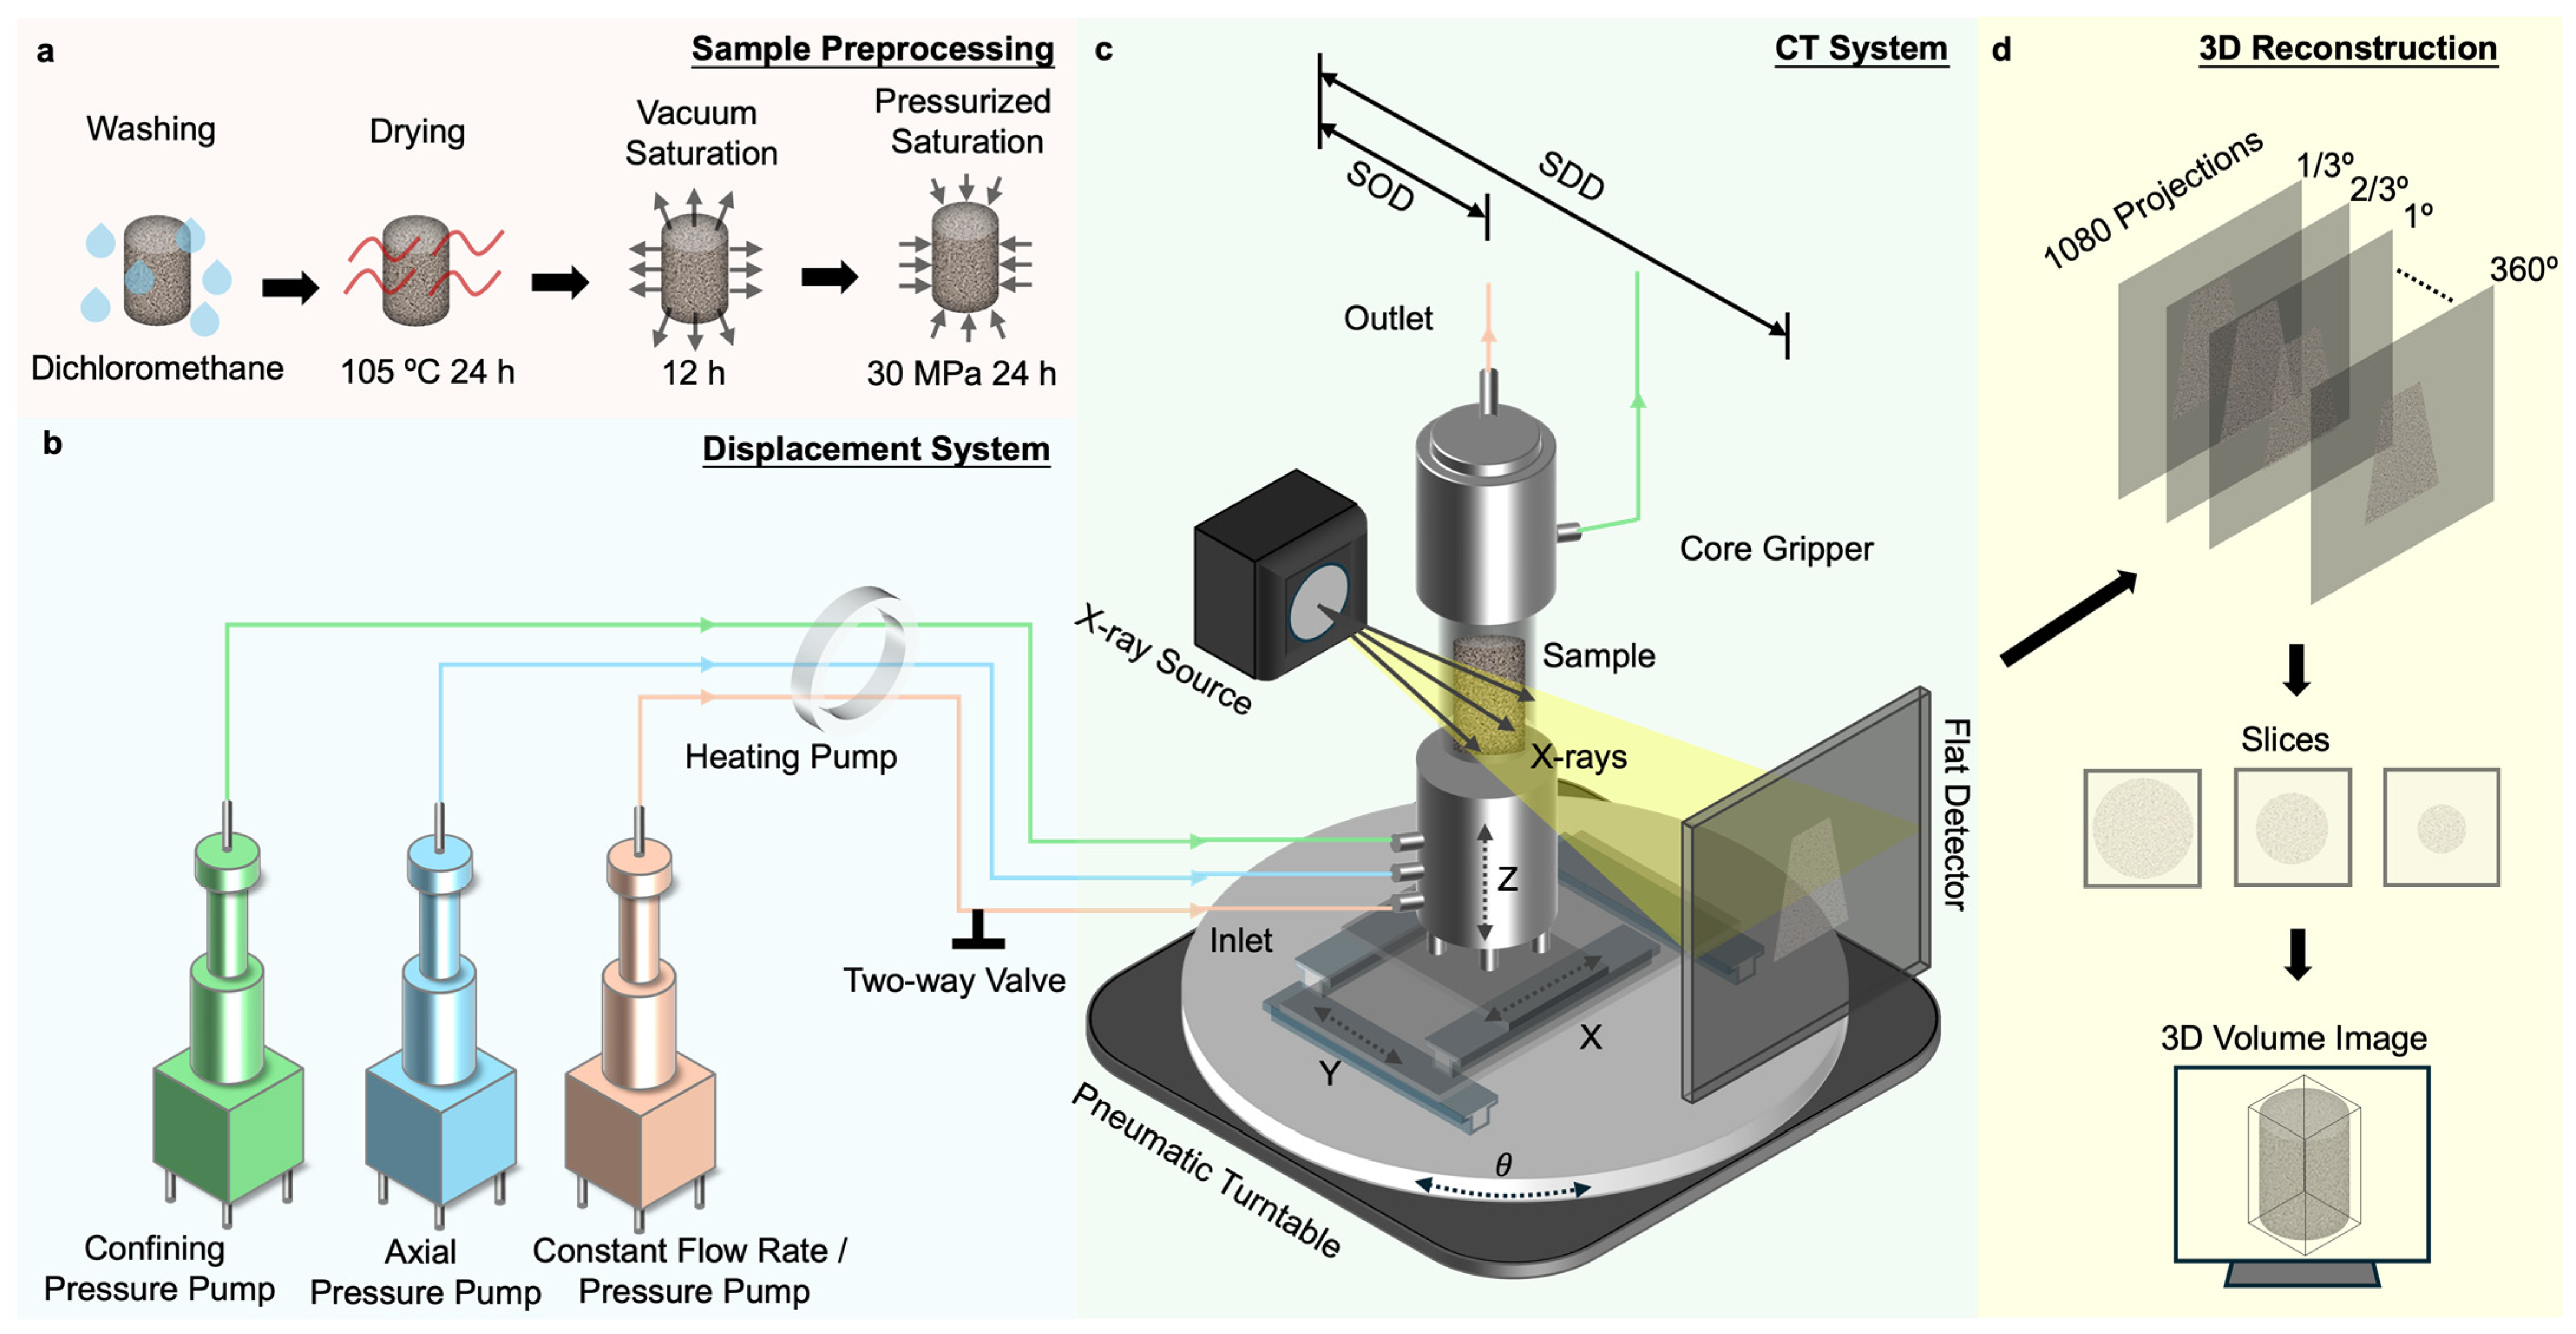
The experimental investigation was conducted using the Three-Dimensional Visualization and Online Analysis Platform for Multiphase Flow at the Institute of Mechanics, Chinese Academy of Sciences (
Figure 1). The system comprises two primary modules: an X-ray three-dimensional microscopic imaging system and a fluid displacement apparatus. The imaging system features a Tianjin Sanying nanoVoxel 3502E microfocus CT scanner (Sanying Precision Instruments Co., Ltd, Tianjin, China), with a resolution capability ranging from 500 nm to 127 µm, accommodating multiple scanning modes, including digital radiography (DR), stepwise, continuous, and helical scanning protocols. The fluid displacement apparatus consists of a core holder, precision control pumps, and a heating system. The core holder utilizes dual piston pumps with deionized water to maintain constant confining and axial pressures. A piston accumulator connected to the holder’s inlet is driven by a constant-rate/pressure pump, enabling either constant-rate or constant-pressure injection, with a maximum pressure output of 70 MPa and flow rates ranging from 0.02 to 30 mL/min. The system also includes a heating pump for thermal control of the injected fluid, while outlet pressure is regulated through a back-pressure valve maintained by a piston pump.
To facilitate continuous observation during the fluid injection process, the core holder was mounted on a pneumatic rotary stage within the self-shielding enclosure of the micro-CT system, connected to the external displacement module via a 360° rotatable flexible tubing system. A two-way valve installed in the inlet line allows for fluid switching while maintaining the core sample state within the holder, ensuring experimental continuity.
The system’s spatial resolution
is governed by the following relationship:
where
represents the detector element size,
(source object distance) denotes the distance between the X-ray source and the sample rotation center (limited by holder dimensions), and
(source detector distance) represents the distance between the X-ray source and the flat detector. The ratio
determines the geometric magnification factor.
To optimize resolution by increasing and reducing , a core holder shell was fabricated using 10% carbon fiber-reinforced polyimide material. This material selection allows for minimal shell thickness while maintaining structural integrity, thereby minimizing . The holder design achieves a spatial resolution of 3.78 μm for 6 mm diameter core samples while sustaining simultaneous pressures of 30 MPa (axial, confining, and injection fluid), sufficient for resolving the primary pore structure in Berea sandstone.
The entire procedure was repeated at 50 °C using the same core sample. This approach eliminated pore structure variability as a confounding factor, allowing us to isolate temperature effects on displacement dynamics. Between experimental sequences, the sample underwent the complete cleaning and saturation protocol described below to ensure consistent initial conditions. The experimental procedure comprises three phases:
Core Sample Preparation: The core sample was first thoroughly cleaned with dichloromethane to eliminate any hydrocarbon residues, followed by drying at 105 °C for 24 h to remove all moisture. To ensure consistent initial saturation conditions across all experiments, we implemented a two-stage saturation protocol: the core sample was placed in a pressure vessel containing a 20 wt% KI solution, subjected to vacuum for 12 h to facilitate complete air removal from the pore space, and subsequently saturated at 30 MPa for 24 h to ensure approaching full saturation.
Base Imaging: The core sample was mounted in a core holder under 7 MPa confining pressure and 4 MPa axial pressure to ensure stability and prevent fluid bypass. KI solution was injected at a constant rate while monitoring the flooding process in real time using DR imaging [
22]. Quantitative analysis of baseline micro-CT scans confirmed near-complete water saturation, establishing a reproducible initial condition for all displacement experiments. Upon achieving steady-state conditions, CT scanning was performed using predetermined parameters (
Table 1) while maintaining continuous injection. These scans served as base data for subsequent analysis, providing optimal visualization of the pore structure.
Oil Flooding: Following the KI solution injection, oil flooding was conducted in situ. At 20 °C, kerosene was initially injected at 0.10 mL/min, with the flow rate incrementally increased by 0.05 mL/min up to 0.35 mL/min. This flow rate range was selected to ensure precise experimental control and optimal imaging quality, while the 0.05 mL/min increments provided sufficient resolution for detecting the non-monotonic saturation patterns observed in our experiments. At each flow rate, the system automatically recorded flow rate, cumulative volume, and differential pressure data. Real-time DR monitoring assessed the flooding status, followed by CT scanning at steady state. The entire procedure was repeated at 50 °C following the same sample preparation protocol.
The scanning parameters (
Table 1) were determined through extensive optimization tests specifically designed for Berea sandstone imaging. These parameters were found to provide optimal imaging quality for this experimental setup while maintaining practical scan durations. The scanning protocol acquired one projection image per 1/3° of rotation, yielding 1080 projections over a complete 360° scan. Six flow rates were tested at each temperature, resulting in a total of 12,960 images (2 temperatures × 6 flow rates × 1080 projections).
2.3. Data Processing
The experimental protocol generated 12,960 projection images, which were reconstructed into two sets of three-dimensional volumes at 20 °C and 50 °C. Each set comprised six volumes corresponding to flow rates ranging from 0.10 to 0.35 mL/min. Reconstruction parameters, including window width, were standardized within each set to ensure grayscale value comparability. The initial reconstruction yielded volumes of 1920 × 1920 × 1536 pixels with a spatial resolution of 3.78 µm. To mitigate artifacts from beam hardening, ring effects, and resolution limitations at the volume periphery, the data was truncated to 1540 × 1540 × 1000 pixels.
Image registration was implemented to compensate for core sample displacement across different flow rates, ensuring precise spatial correlation at the pore scale. The Li thresholding algorithm [
34,
35,
36] was employed to segment the images into discrete water phase (KI solution) and oil phase (kerosene) regions, followed by binary conversion. Connected component analysis was then performed to identify and label distinct oil and water clusters, enabling quantification of their geometric (volumetric) and topological (connectivity) properties [
37].
The analysis protocol proceeded through the following sequential steps:
Spatial Distribution Analysis: The three-dimensional volume data was analyzed through detailed slice-by-slice examination in both axial and radial directions. Specifically, we segmented the volume into 1000 axial slices (perpendicular to flow direction) and 770 concentric radial rings to quantify local oil saturation variations from inlet-to-outlet and center-to-edge, respectively. For each individual slice or ring, we calculated the local oil saturation as the ratio of oil-phase voxels to total voxels within that specific slice or ring. This detailed spatial analysis approach, rather than whole-core averaging, was essential for identifying the non-monotonic saturation patterns that constitute our primary findings.
Cluster Volume Distribution Analysis: Oil and water clusters were hierarchically classified by volume, with their relative proportions analyzed as a function of flow rate to identify dominant flow patterns.
Overlap Coefficient Analysis: The spatial correlation between oil clusters at successive flow rates was quantified through an overlap coefficient, defined as the ratio of common voxels to the total voxels of the smaller cluster, characterizing the dynamic cluster evolution.
3. Results and Discussion
3.1. Analysis of Oil Saturation Distribution Characteristics in Core Sample
To investigate the spatial distribution of oil saturation within the core sample, quantitative analyses were conducted in both axial and radial directions. The three-dimensional data volume was segmented into 1000 axial slices and 770 concentric rings to examine the oil saturation distribution from inlet-to-outlet and center-to-edge, respectively. Significant dominant patterns in oil saturation variations were identified in both directions, exhibiting non-monotonic characteristics.
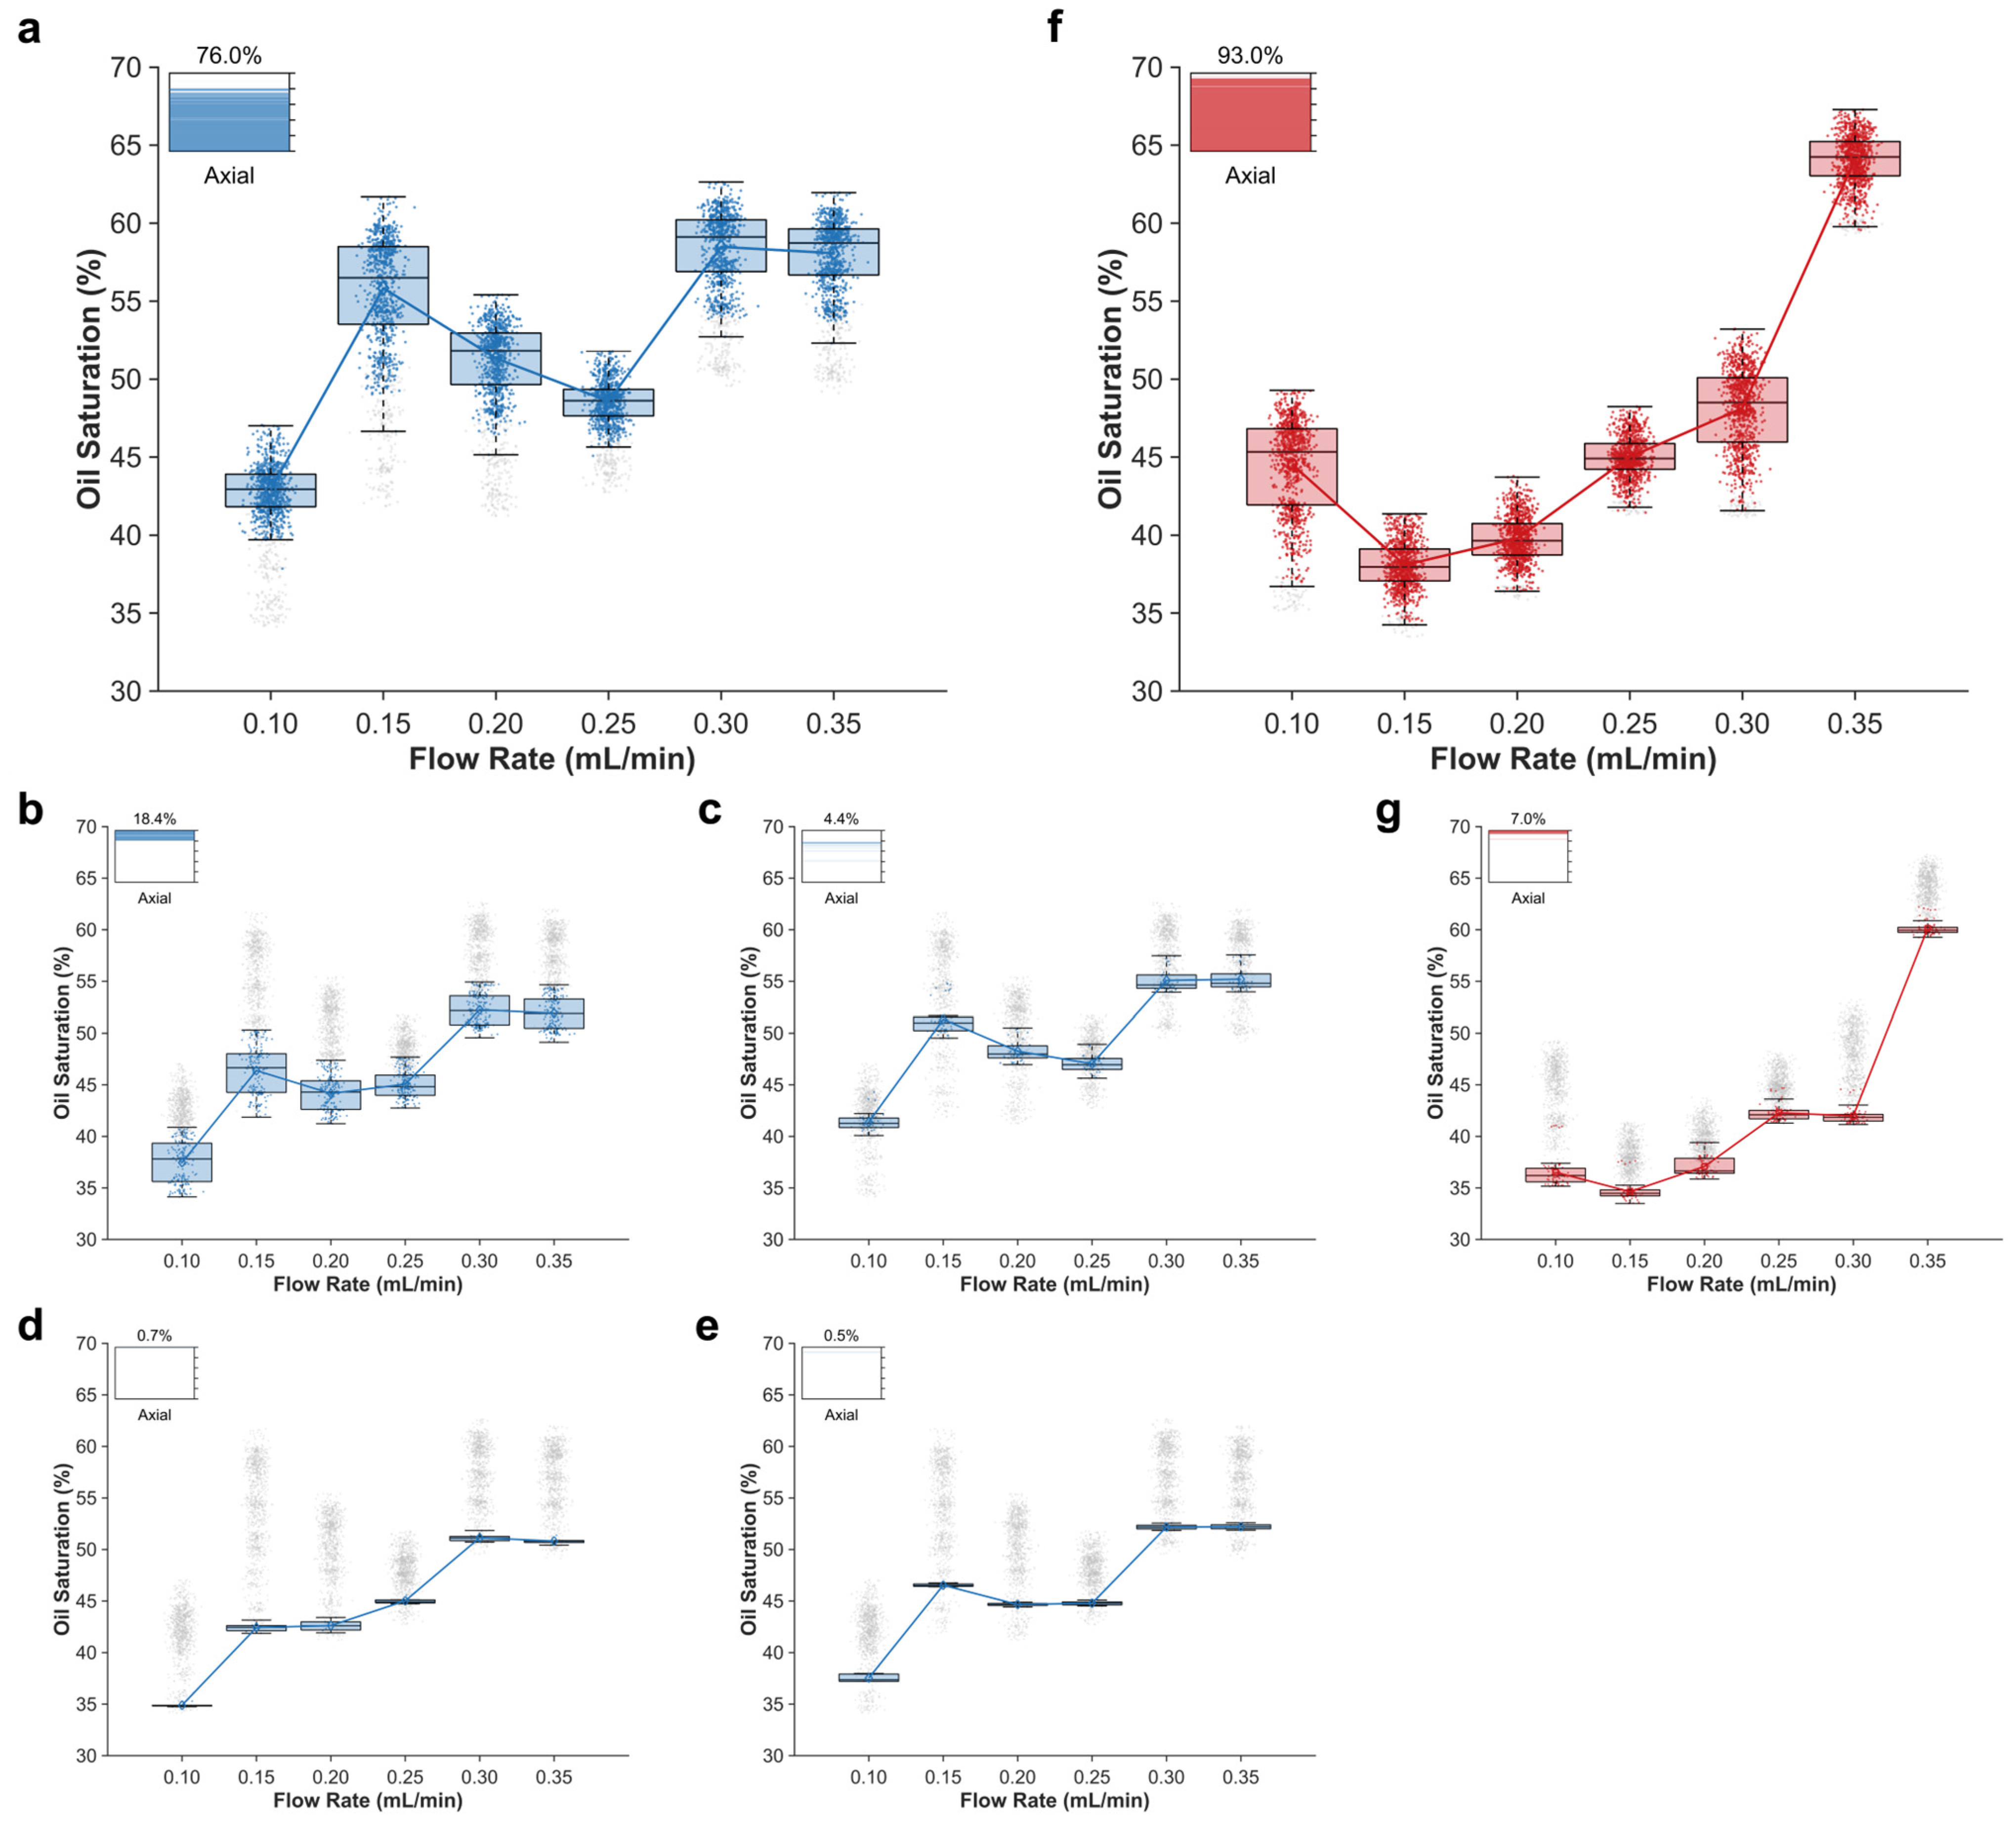
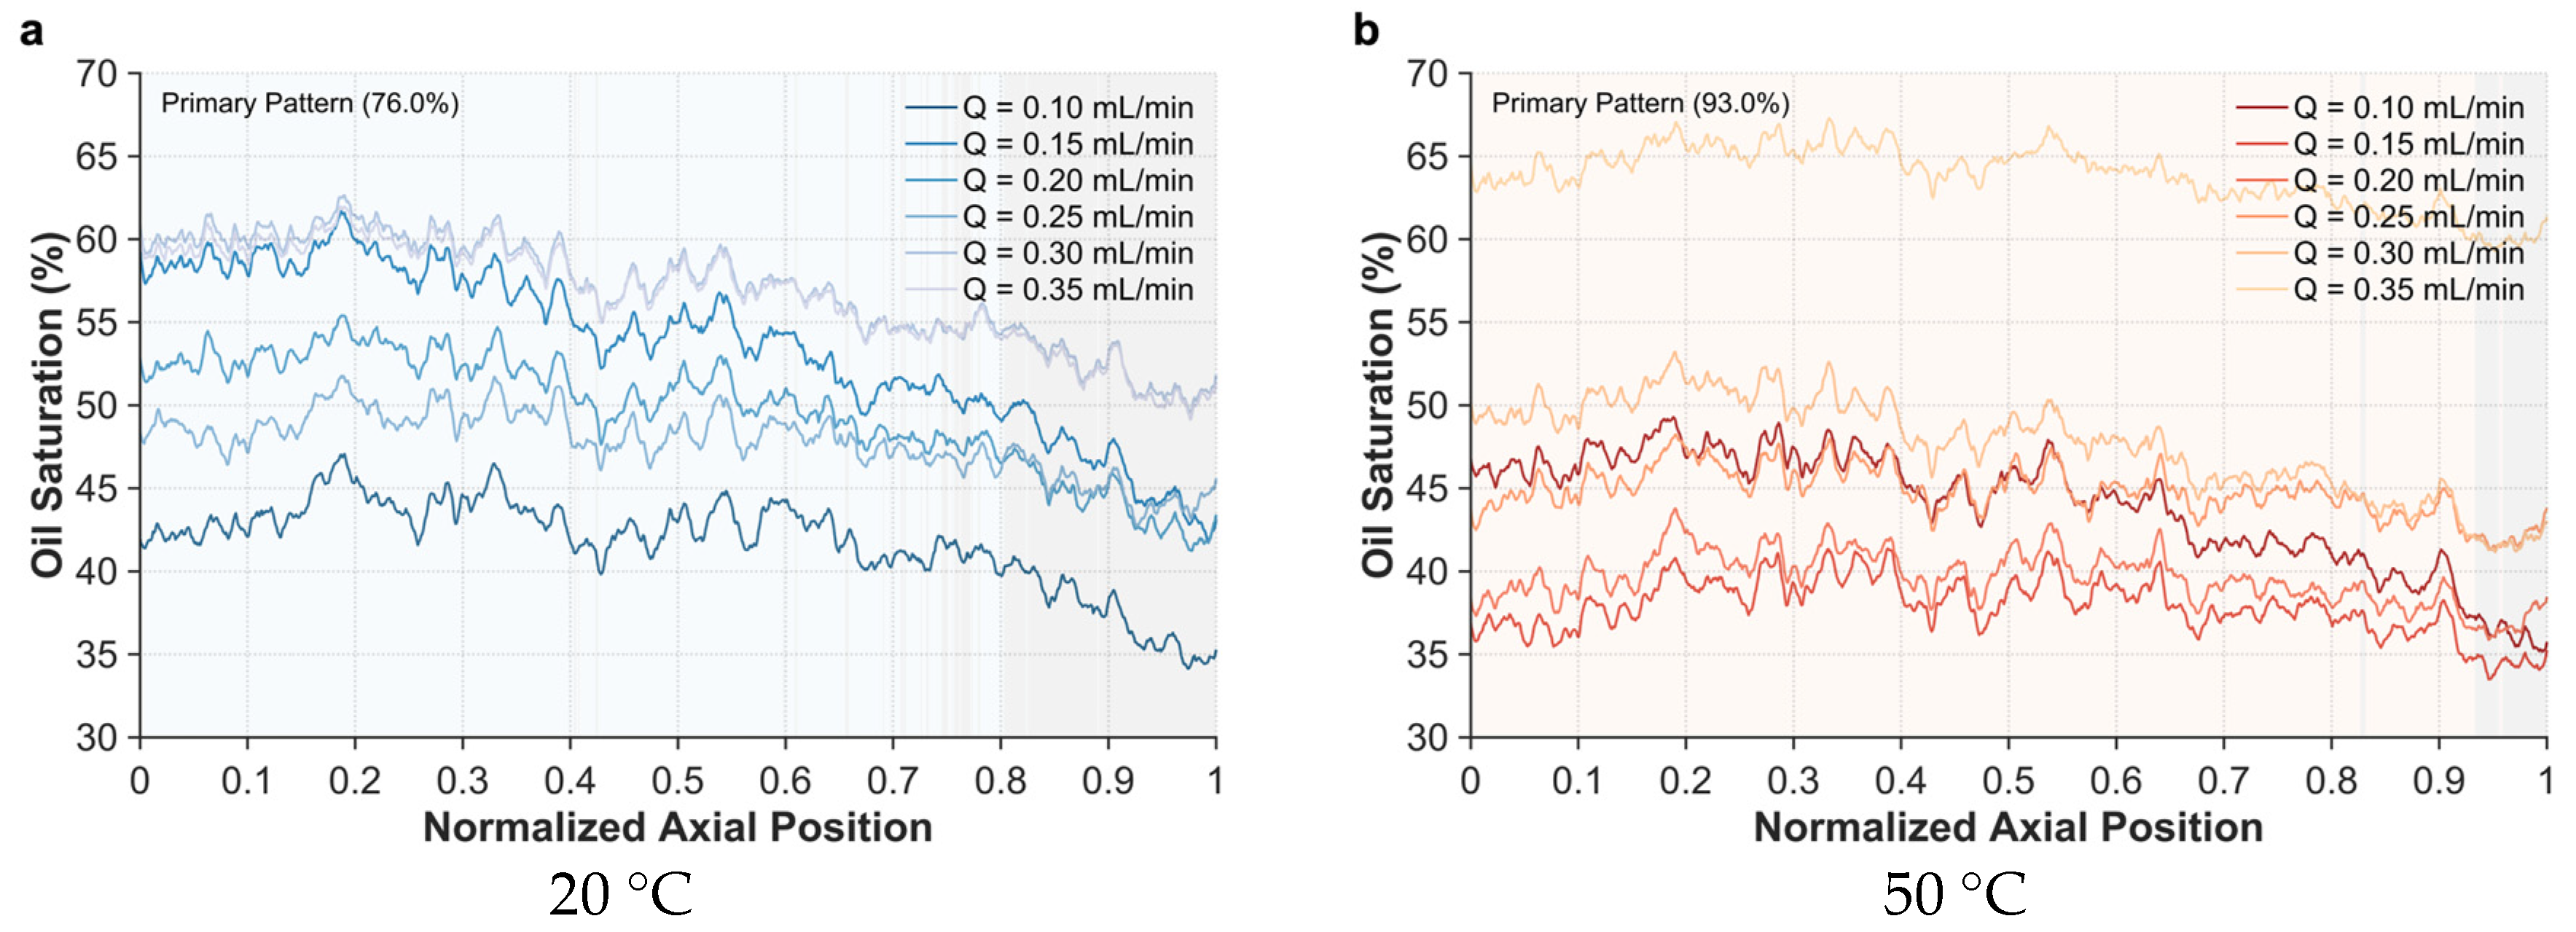
In the axial direction at 20 °C, five distinct patterns of oil saturation variation were identified. The dominant pattern (
Figure 2a) exhibited an N-shaped variation, comprising 76.0% of the observations and predominantly occurring at the core sample inlet region. The remaining four patterns, designated as secondary patterns, are illustrated in
Figure 2a–e, with their respective proportions and locations indicated in the upper left corner of each figure. At 50 °C, two patterns were observed, with the dominant pattern (
Figure 2f) displaying a V-shaped variation, accounting for 93.0% of the observations and similarly concentrated at the core sample inlet region. The analysis revealed that the dominant patterns were consistently associated with higher average oil saturation values at the core sample inlet region, with the elevated temperature of 50 °C yielding a higher proportion of dominant patterns. Notable differentiation between dominant and secondary patterns emerged at flow rates exceeding 0.20 mL/min.
The axial distribution of oil saturation (
Figure 3) reveals distinct spatial patterns of dominant and secondary modes. The dominant modes are denoted by blue (20 °C) and red (50 °C) columnar shading, while secondary modes are indicated by gray columnar shading. At 20 °C, a significant gradient in oil saturation is observed between the inlet and outlet regions, whereas at 50 °C, this gradient diminishes substantially, indicating a more uniform axial distribution at elevated temperatures.
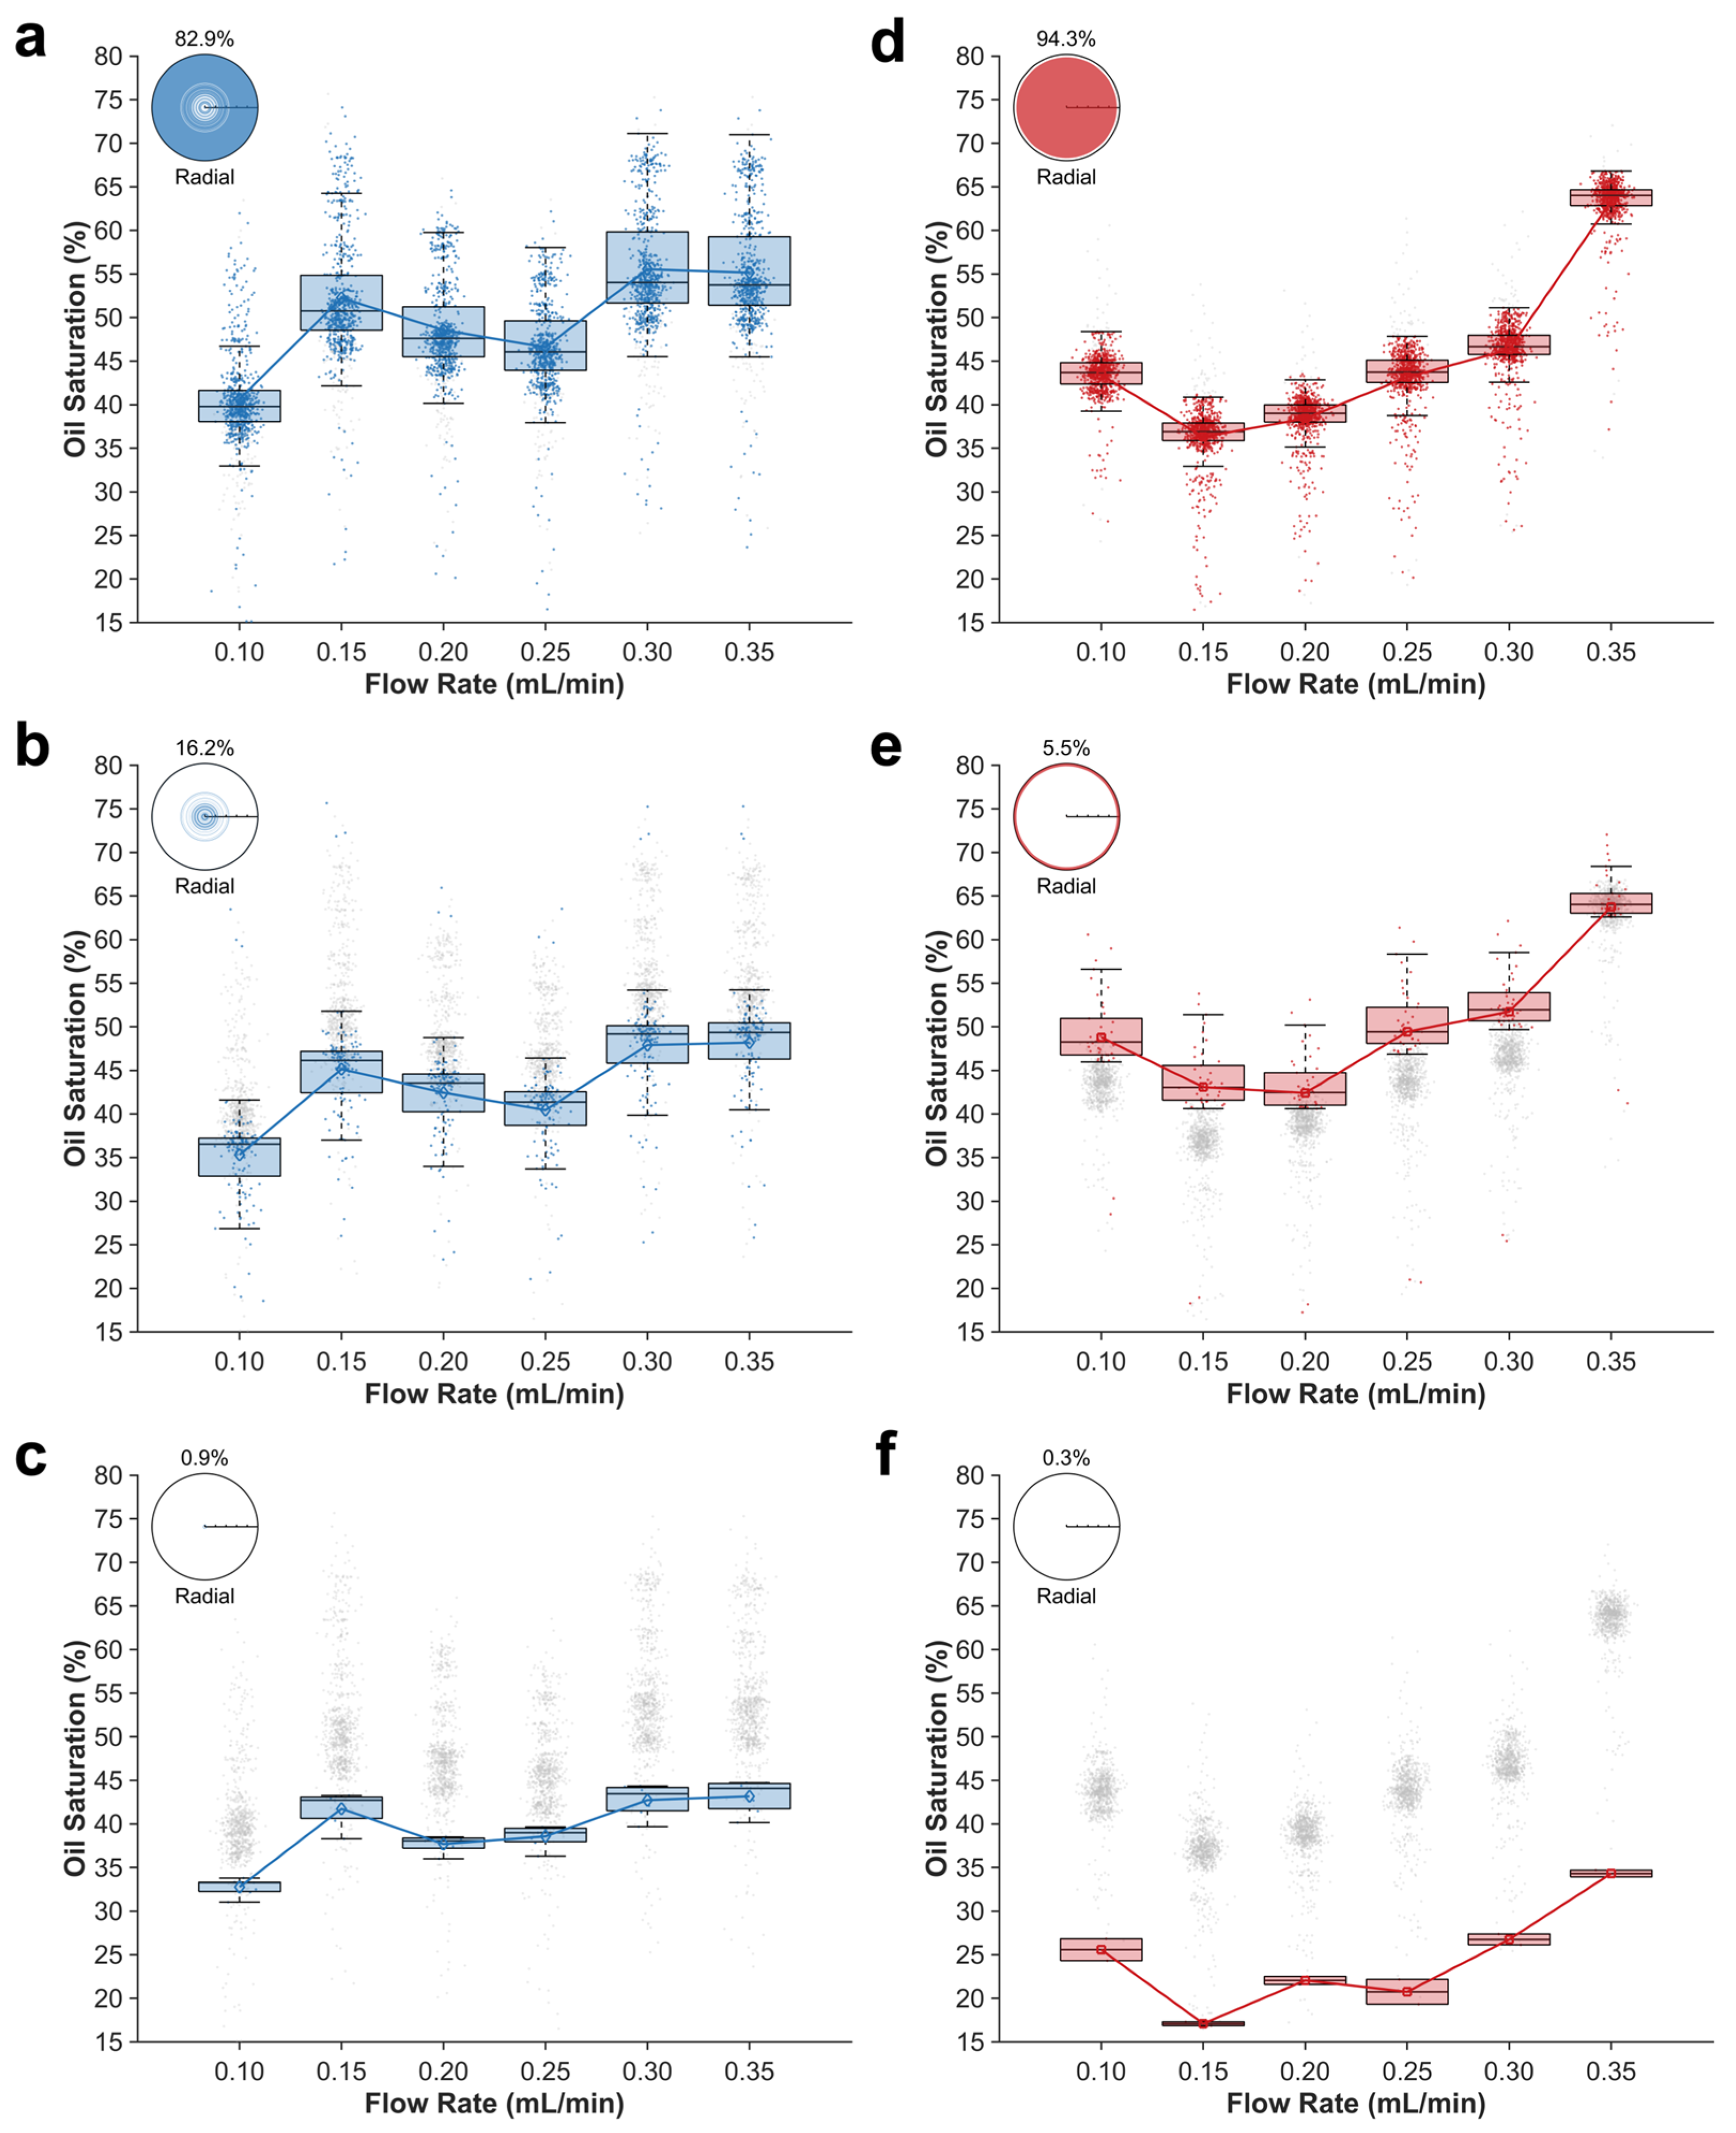
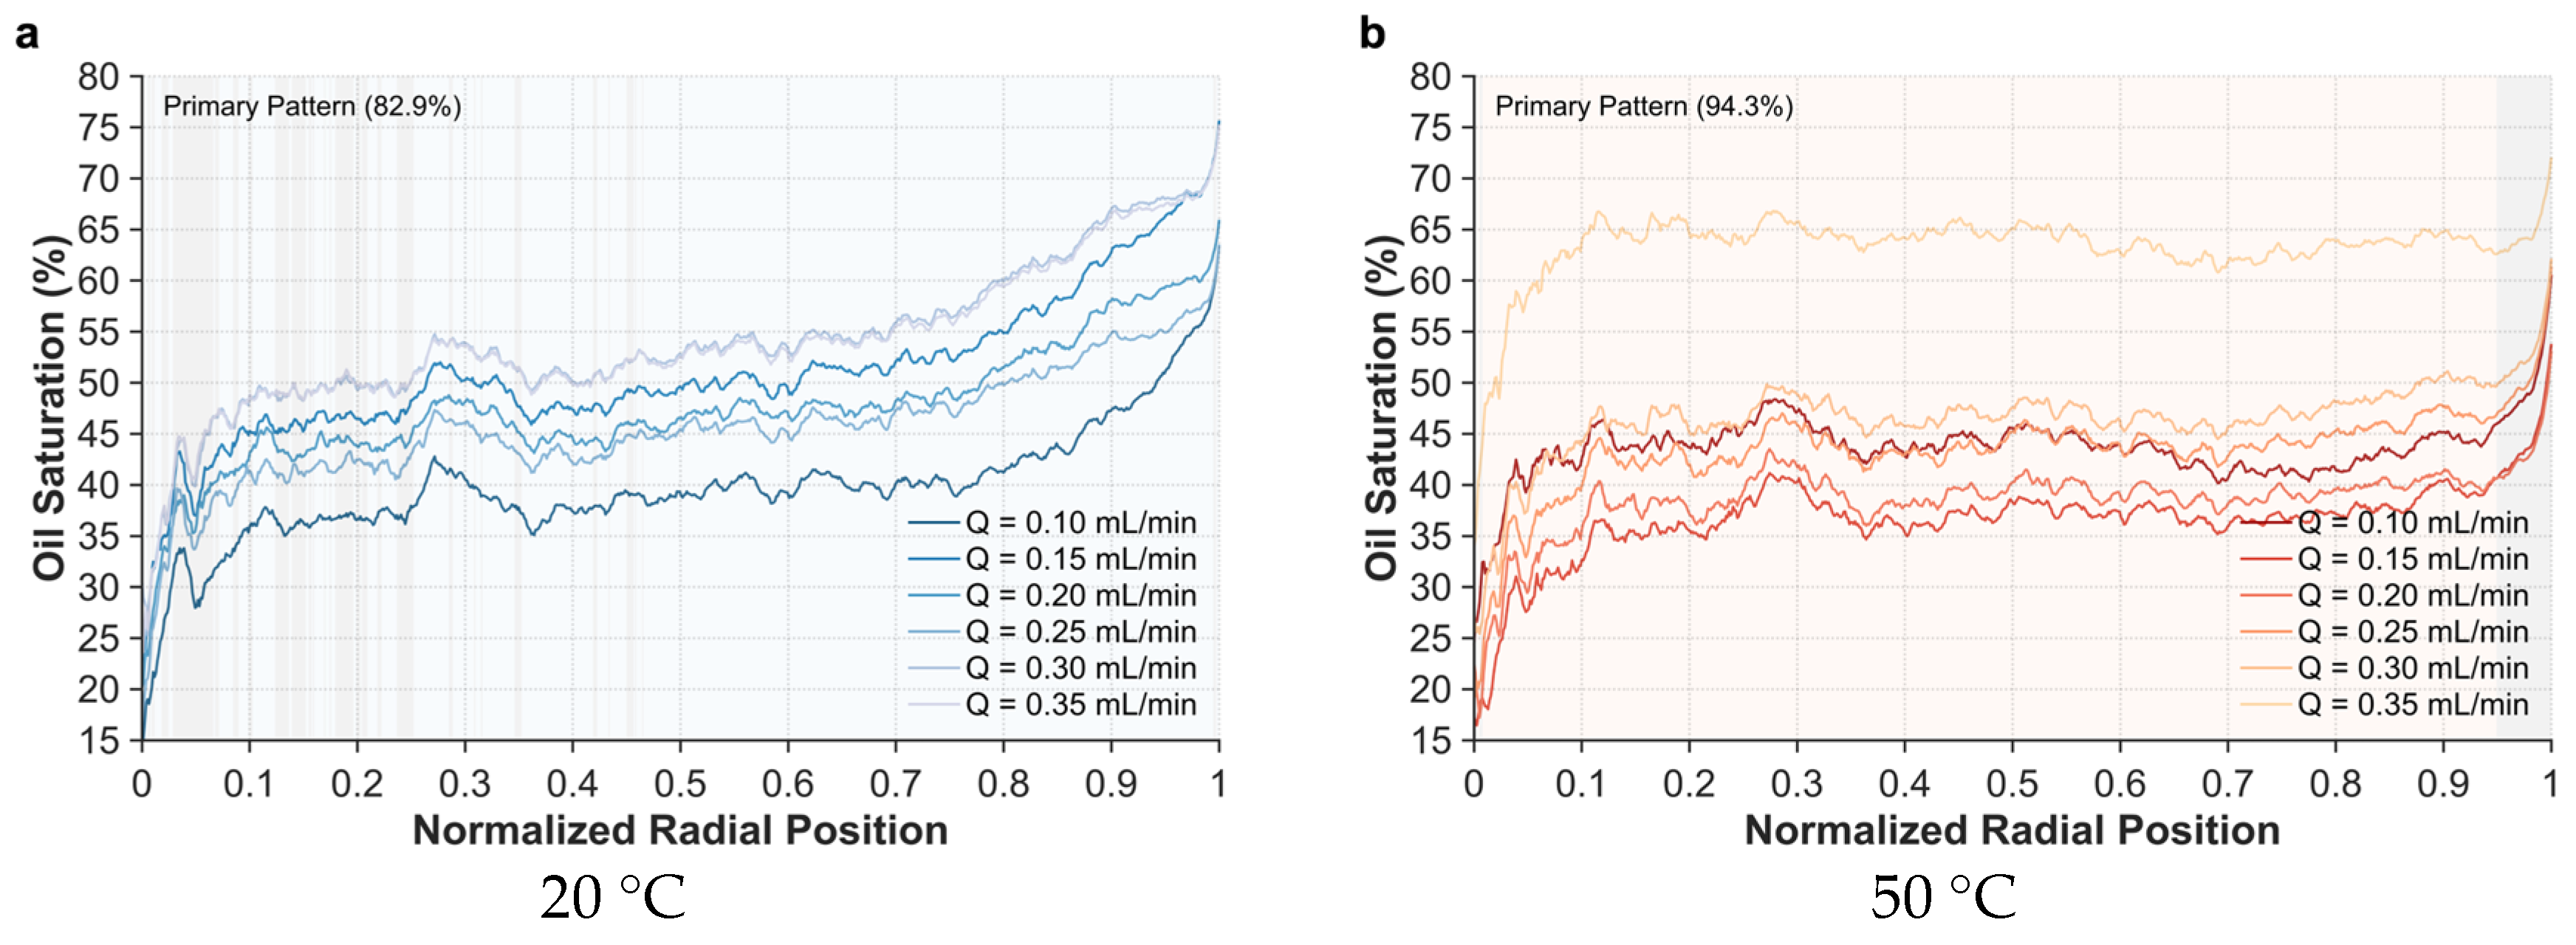
In the radial direction, analyzed through concentric circles, similar dominant and secondary mode distributions were observed. Three distinct patterns emerged at both 20 °C and 50 °C, with the dominant modes exhibiting N-type (
Figure 4a) and V-type (
Figure 4d) distributions, comprising 82.9% and 94.3% of observations, respectively. The dominant mode at 20 °C extends throughout the core sample except for the central region, while at 50 °C, it encompasses all areas except the peripheral region. Secondary modes, representing minor proportions (0.3–16.2%), are distributed across other core sample regions with notably lower mean saturation values. The distinction between dominant and secondary modes becomes particularly pronounced at flow rates exceeding 0.20 mL/min.
The radial distribution of oil saturation (
Figure 5) further demonstrates the contrasting dominant mode patterns between 20 °C and 50 °C. At both temperatures, significantly higher oil saturation is observed in the peripheral regions compared to the central regions, with elevated temperatures promoting more uniform radial distribution.
This analysis reveals distinct dominant patterns in core oil saturation, accounting for 76.0–94.3% of observations. We propose that these spatially coherent distribution patterns indicate the presence of preferential flow paths, warranting further quantitative analysis of flow characteristics.
3.2. Analysis of Flow Cluster Evolution Characteristics in Core Sample
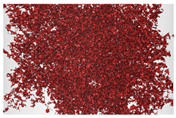
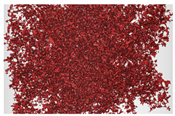
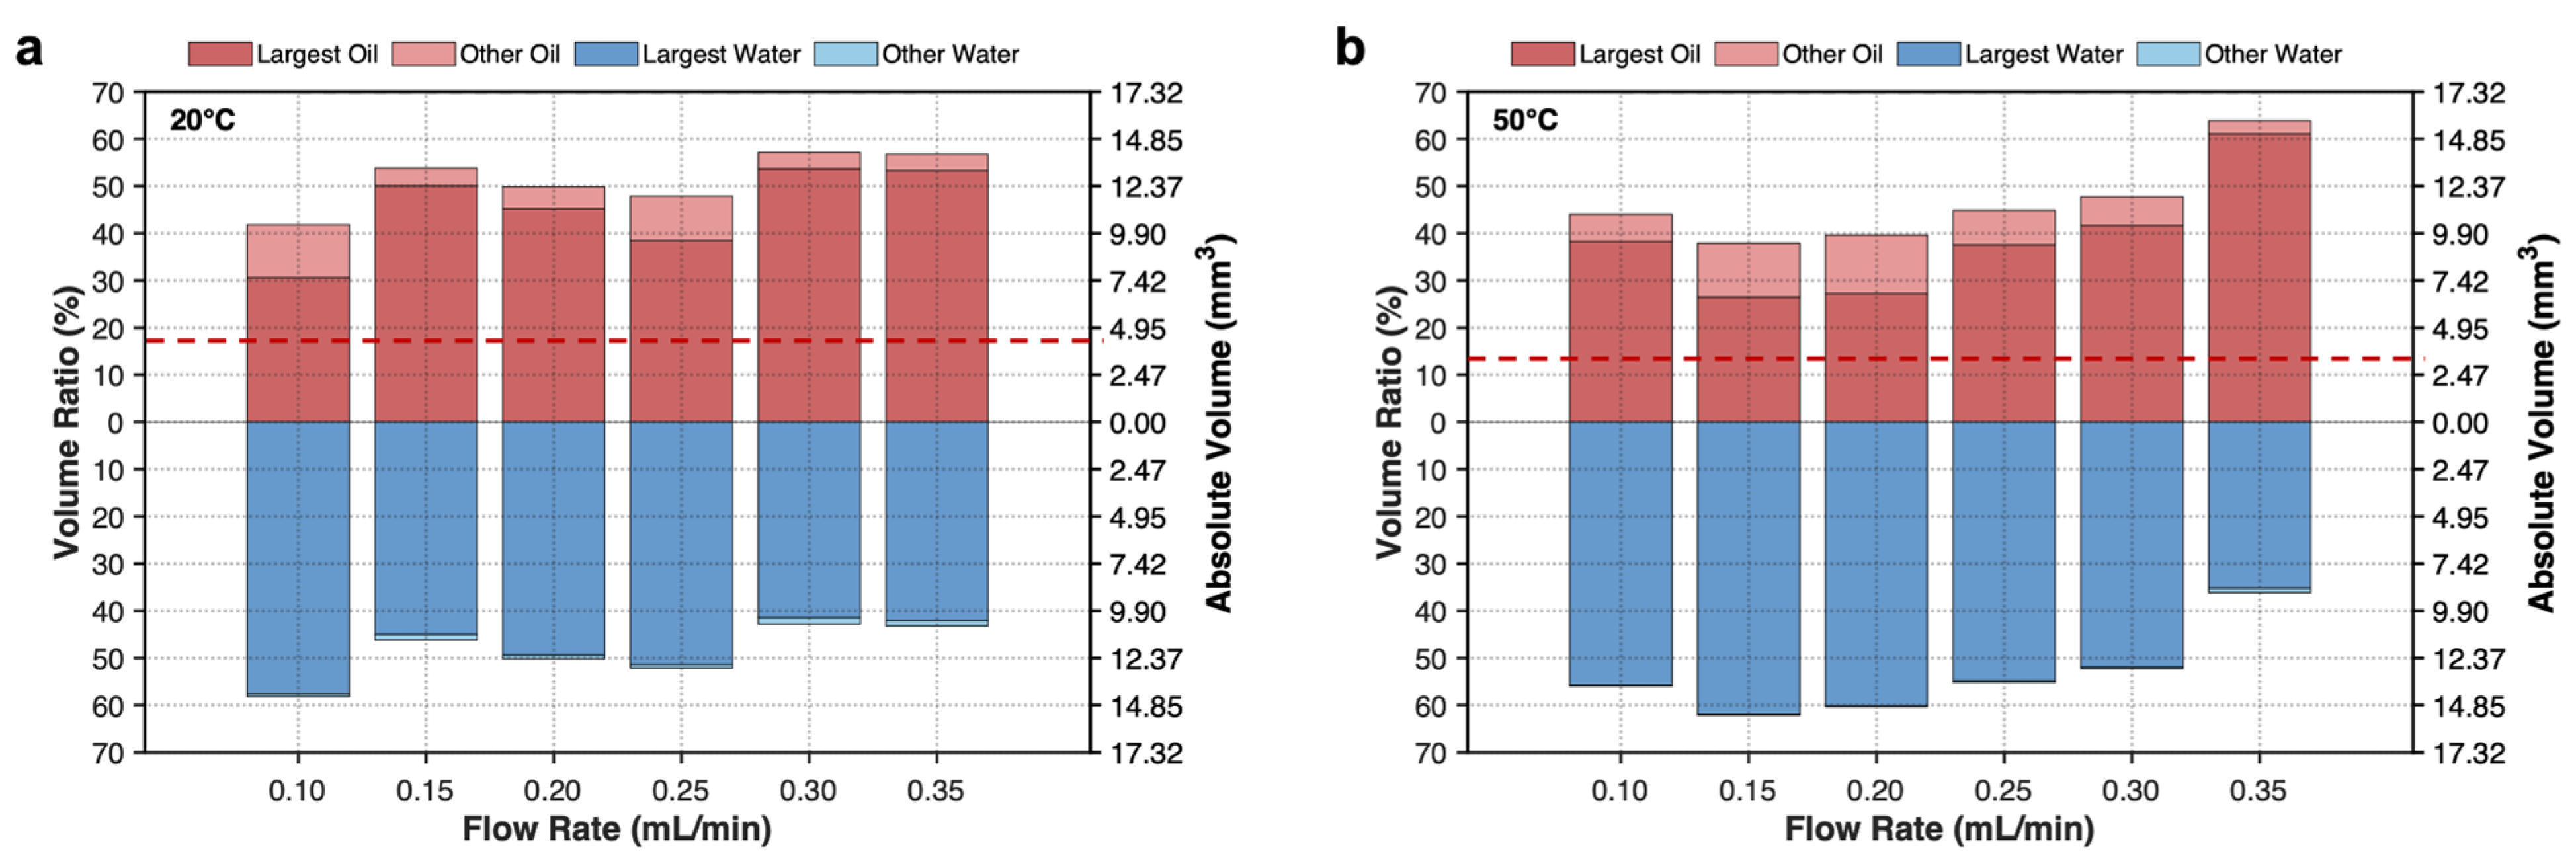
Initially, we conducted an analysis of flow cluster volume distributions (
Figure 6). The labeled water and oil clusters were sorted by volume, with the largest water and oil cluster designated as the primary water and oil cluster, respectively. The remaining clusters were classified as secondary water and oil clusters.
The results demonstrate that variations in primary oil cluster volume with injection flow rate correlate with their respective dominant mode characteristics. The exceptionally high proportion explains the global consistency in oil saturation variations. Analysis of the primary water cluster reveals a consistent proportion exceeding 98%, indicating that the water phase maintains continuity throughout the imbibition process, with secondary water clusters having negligible impact on overall flow dynamics. Consequently, variations in core oil saturation can be attributed to interactions between the primary oil cluster and the continuous primary water cluster.
Analysis of secondary oil cluster volumes reveals a significant inverse correlation with the primary oil cluster volume: an increase in primary oil cluster volume corresponds to a decrease in secondary oil cluster volumes, and vice versa. This inverse relationship suggests that with increasing injection flow rates, a dynamic transformation process occurs between the primary and secondary oil clusters, characterized by merging and splitting behaviors of the primary oil cluster. To quantitatively evaluate this dynamic evolution pattern, we implemented an overlap analysis methodology (
Figure 7) to examine the spatial relationships between oil clusters at adjacent flow rates.
To illustrate the overlap analysis methodology, we consider two adjacent flow rates: The process is classified as merging if the primary oil cluster at the higher flow rate exceeds that at the lower flow rate and as splitting if the opposite occurs. This process is quantitatively characterized through the overlap ratio between primary and secondary oil clusters at adjacent flow rates.
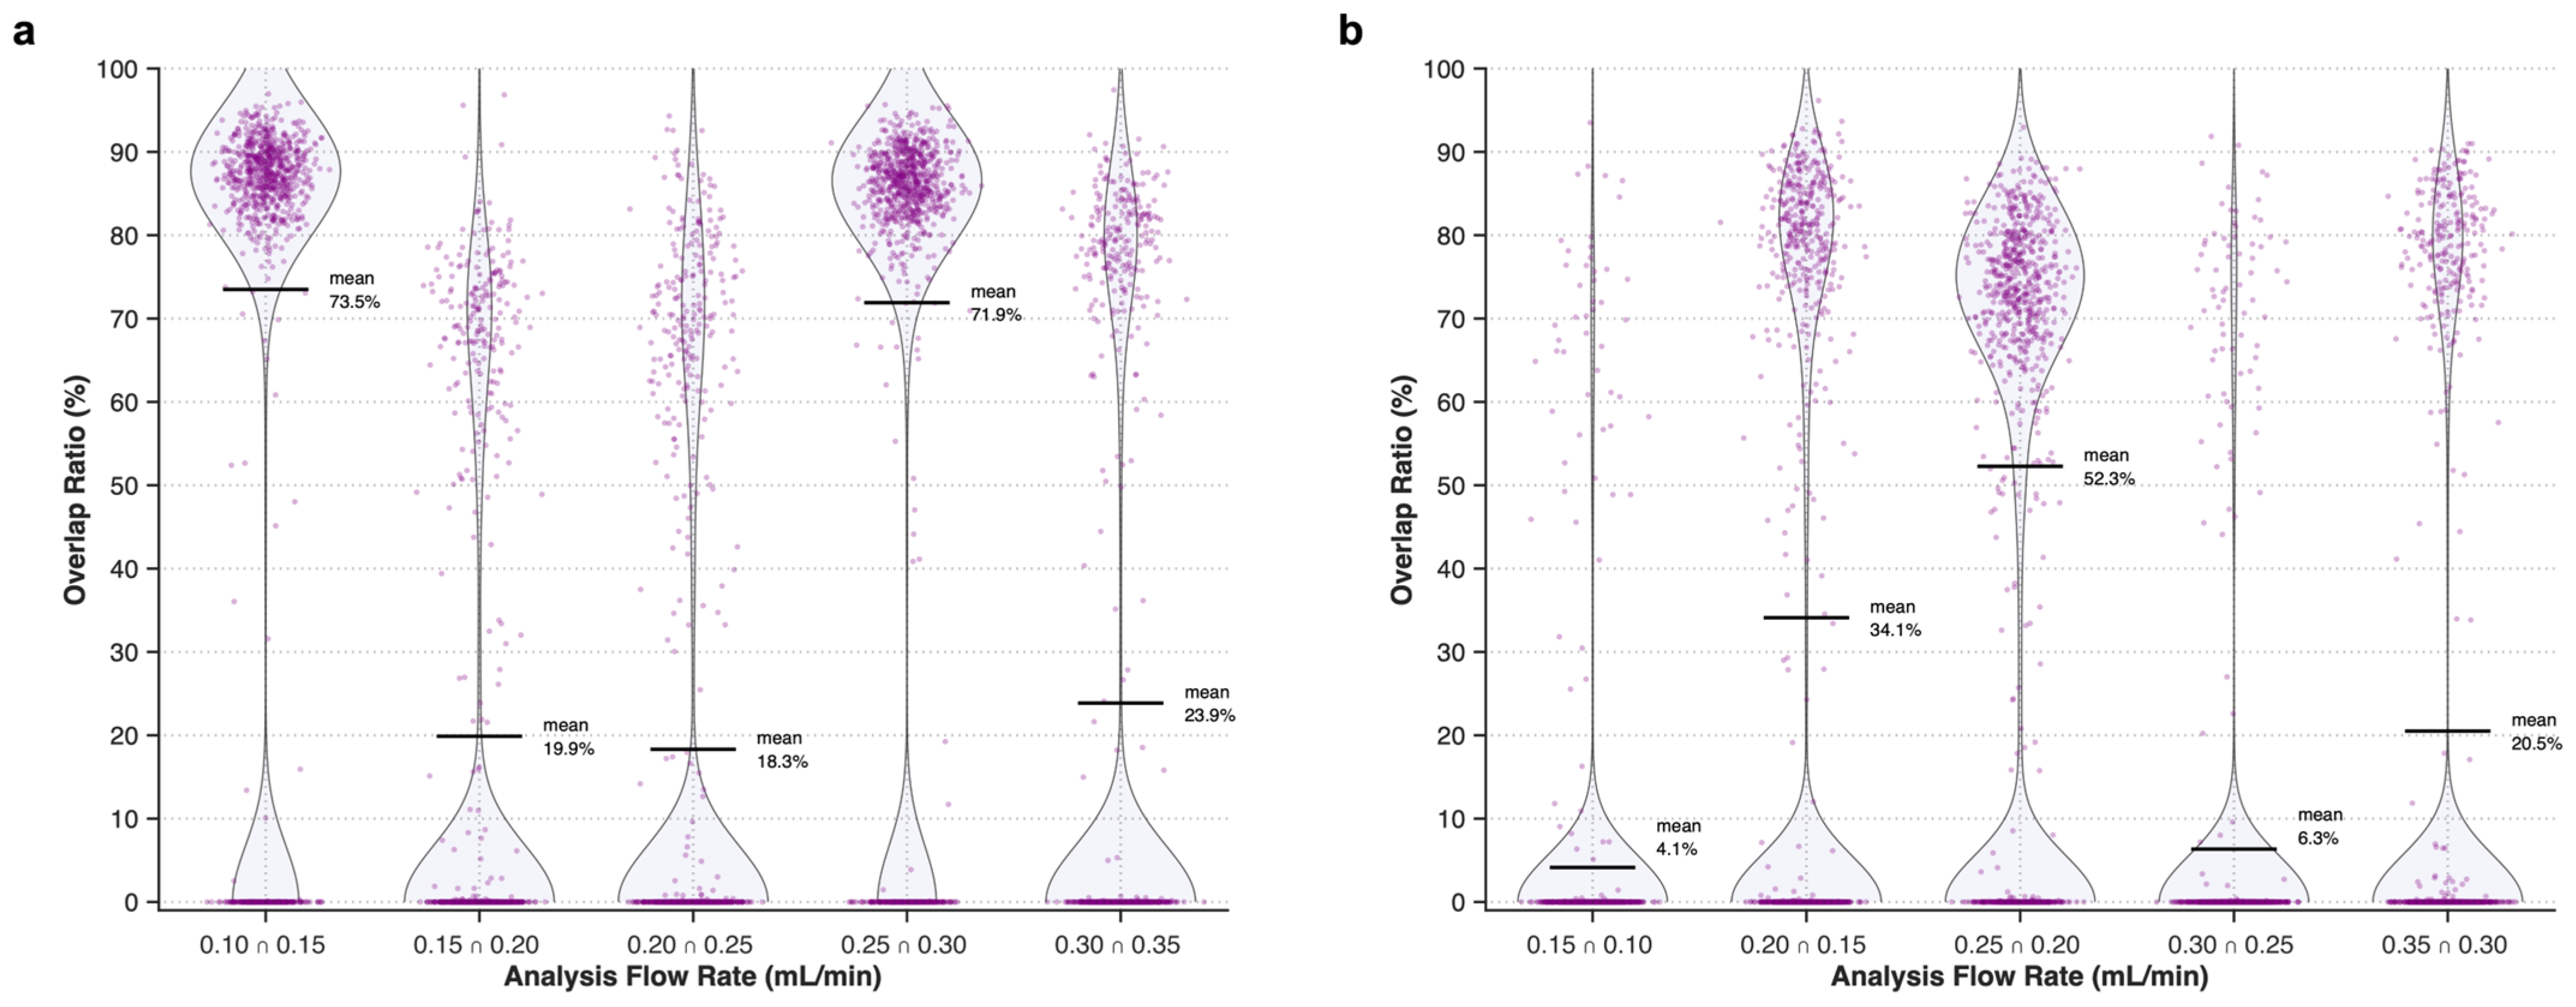
Each flow rate condition generates oil clusters on the order of 105, with the majority being relatively small in volume. To analyze the dynamics of the largest oil cluster, we examined the overlap between the 1000 largest oil clusters by volume at adjacent flow rates, which constitute over 90% of the oil phase and sufficiently represent its primary characteristics. The notation 0.10 ∩ 0.15 denotes the overlap analysis between secondary oil clusters (2–1000 largest oil clusters by volume) at 0.10 mL/min and the largest oil cluster at 0.15 mL/min. The mean overlap values are weighted by cluster volumes to represent the overall interaction between these oil clusters and the largest oil cluster.
At 20 °C (
Figure 8), the largest oil cluster exhibits volume increases at flow rates of 0.15 mL/min and 0.30 mL/min relative to preceding rates (
Figure 6a), indicating predominant merging behavior. The mean overlap values for 0.10 ∩ 0.15 and 0.25 ∩ 0.20 show significant increases, with violin plots displaying characteristic hourglass distributions. This pattern indicates substantial overlap between secondary oil clusters and the largest oil cluster, with mean overlap percentages of 73.5% and 71.9%, respectively. Conversely, at 0.20 mL/min and 0.25 mL/min, the largest oil cluster volume decreases, demonstrating dominant splitting behavior. The corresponding overlap distributions for 0.20 ∩ 0.15 and 0.25 ∩ 0.20 exhibit hourglass patterns with mean overlap values of 34.1% and 52.3%, respectively.
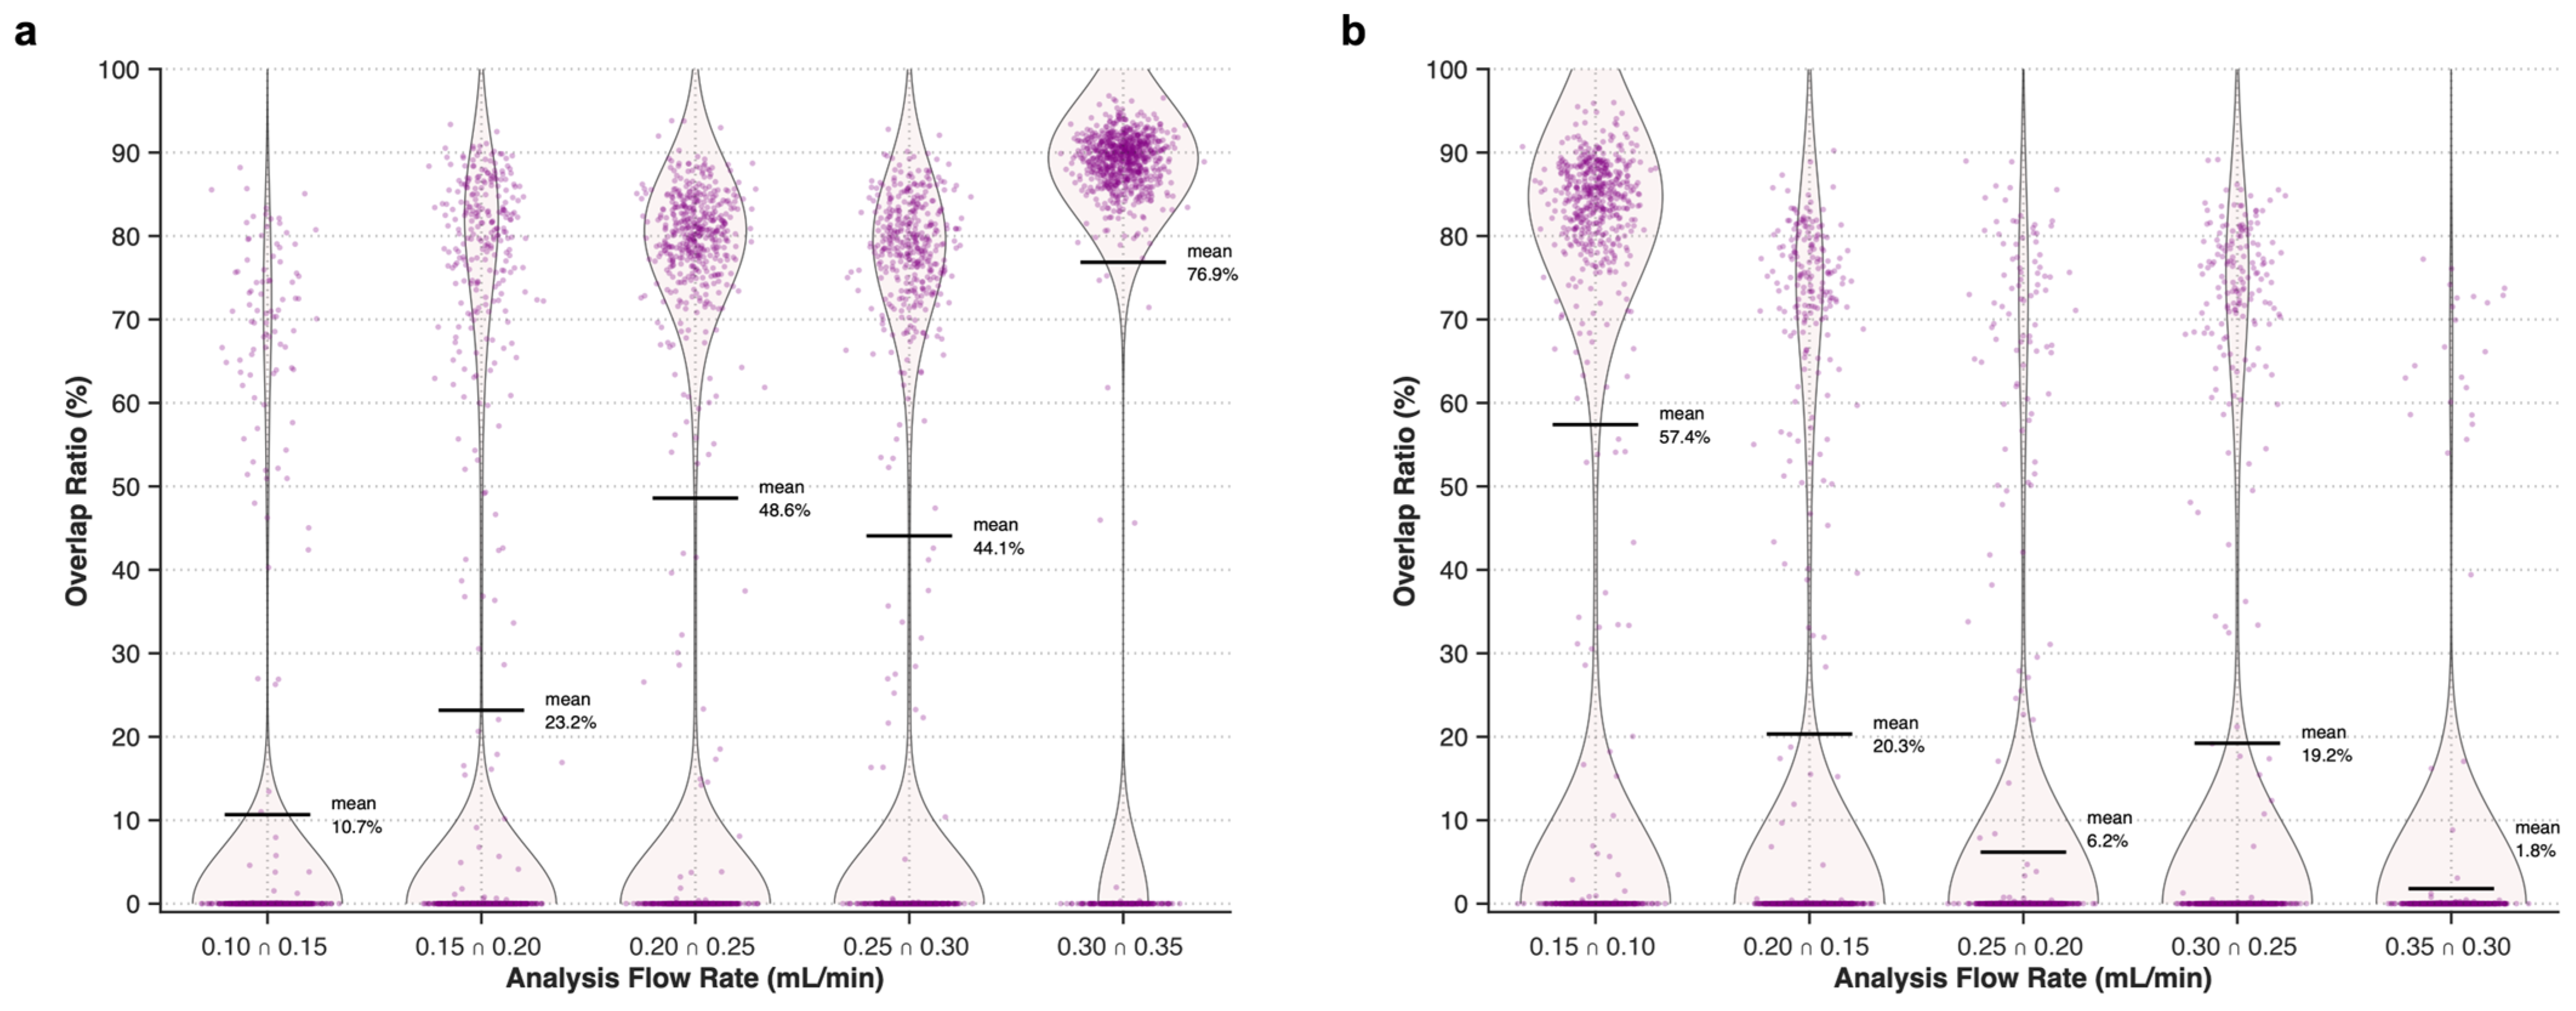
At 50 °C (
Figure 9), merging processes dominate in the flow rate range of 0.25–0.35 mL/min, achieving a maximum mean overlap of 76.9%. Significant splitting behavior is observed only at 0.10 mL/min, with a mean overlap of 57.4%.
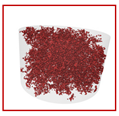
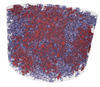
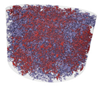
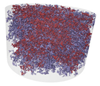
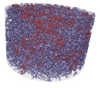
The overlap analysis quantitatively characterizes the coexisting dynamic evolution patterns of merging and splitting in the largest oil cluster. As demonstrated in
Figure 7, the system comprises three cluster types: water clusters (white), the largest oil cluster (consisting of a stable red core and connected unstable purple regions), and secondary oil clusters (isolated purple clusters). The largest cluster undergoes two primary evolution mechanisms with changing flow rates: (1) extension of existing flow paths and merging with adjacent clusters to form new pathways and (2) fragmentation of unstable regions by water clusters to form new isolated clusters. These processes occur simultaneously, with merging dominating during volume increase and splitting prevailing during volume decrease of the largest oil cluster.
3.3. Preferential Flow Path
Analysis reveals that the largest oil cluster constitutes the dominant component of oil saturation variations within the core sample, exhibiting significant volumetric occupation and flow rate-dependent dynamic evolution. Flow rate modifications induce continuous fragmentation and coalescence processes in unstable regions of the largest oil cluster until the system achieves equilibrium. However, the largest oil cluster maintains stable regions that persistently retain their oil phase configuration without participating in fragmentation or coalescence interactions. These observations led us to define the term “preferential flow pathways” as those stable regions within the pore network that consistently maintain oil phase occupation across all tested flow rates, functioning as persistent transport channels for oil movement through the porous medium, in contrast to “unstable regions” that undergo dynamic phase changes in response to varying flow conditions.
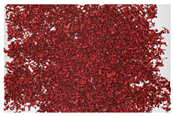
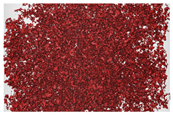
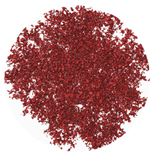
Spatial distribution analysis of the largest oil cluster under varying flow rates revealed two distinct regions: (1) stable regions maintaining consistent oil phase presence, designated as preferential flow pathways and (2) unstable regions exhibiting flow rate-dependent fragmentation-coalescence behavior, evolving in conjunction with the preferential flow pathways. Three-dimensional visualization results (
Table 2) demonstrate that the preferential flow pathways (red) predominantly occupy the core sample’s central region, displaying temperature-dependent structural complexity, while unstable regions (purple) concentrate in peripheral zones. The preferential flow pathways occupy 17.1% and 13.6% of the pore volume at 20 °C and 50 °C, respectively (indicated by red dashed lines in
Figure 6). The three views of the preferential flow path (
Table 3) can provide a clear contrast for complex three-dimensional structures.
3.4. Implications for Macroscopic Flow Properties
The temperature-dependent saturation patterns and preferential flow pathways identified in this study have significant implications for macroscopic flow properties, particularly relative permeability behavior. The transition from N-type to V-type saturation patterns with increasing temperature suggests a fundamental shift in pore-scale displacement mechanisms that would likely manifest in relative permeability curves.
Foroughi et al. demonstrated that stable preferential flow paths significantly influence the critical oil saturation thresholds in relative permeability curves through their work on incorporating sub-resolution porosity into multiphase flow models [
29]. The preferential pathways we identified (occupying 17.1% and 13.6% of pore volume at 20 °C and 50 °C, respectively) likely represent critical oil-phase connectivity that determines relative permeability endpoints. Their subsequent framework for multiphase pore-scale modeling [
38] further established that spatial distribution patterns of non-wetting phases directly correlate with the shape of relative permeability curves, suggesting our N-type and V-type patterns would produce distinctly different macroscopic flow behaviors. Wang et al., in their study on multi-scale pore connectivity impacts on two-phase flow, showed that temperature-induced changes in pore-scale flow regimes can shift relative permeability crossover points [
27]. Their finding that temperature effects manifest differently in various pore size classes aligns with our observation of temperature-dependent displacement patterns in different regions of the sample.
Our findings provide direct experimental evidence for the microscopic displacement mechanisms underlying temperature-dependent relative permeability variations in sandstones. Future work should integrate these pore-scale observations with core-scale relative permeability measurements to develop more predictive models for temperature-sensitive multiphase flow behavior in reservoir rocks.
4. Conclusions
This investigation utilized an online experimental platform combining real-time micro-CT imaging with oil-water displacement to systematically analyze oil-displacing-water processes in Berea sandstone, employing high-resolution imaging (3.78 μm) coupled with quantitative analytical methods. Experiments were conducted under varying flow rates (0.10–0.35 mL/min) and temperatures (20 °C and 50 °C). Our analysis followed a systematic approach: (1) slice-based spatial analysis identified dominant non-monotonic patterns in oil saturation; (2) cluster volume analysis revealed these patterns were driven by dynamics of the largest oil cluster; and (3) overlap coefficient quantification exposed merging-splitting processes while identifying stable regions that constitute preferential flow pathways. Through this methodical process and implementing axial and radial analysis, flow cluster volume statistics, and overlap analysis, we obtained several key findings:
Core Oil Saturation Variations: Axial and radial analyses revealed that during oil injection, core oil saturation variations exhibited predominant patterns constituting 76.0–94.3% of the total change, manifesting as non-monotonic N-type (at 20 °C) and V-type (at 50 °C) distributions.
Flow Cluster Dynamics: Flow cluster volume and overlap analyses demonstrated that the largest oil cluster drives global consistency in oil saturation variations, with its merging-splitting dynamic evolution patterns quantified as a function of flow rate.
Preferential Flow Paths: Temperature-dependent preferential flow paths were identified, exhibiting distinct morphological characteristics at 20 °C and 50 °C, occupying 17.1% and 13.6% of the pore volume, respectively.
This research provides experimental evidence for understanding petroleum migration-accumulation mechanisms through quantitative characterization of microscopic oil-water two-phase flow behavior. The non-monotonic saturation patterns we identified suggest that during petroleum migration, oil saturation along migration pathways varies in complex ways rather than following simple gradient patterns, which helps explain heterogeneous petroleum distribution observed in natural systems. The temperature-dependent transition from N-type to V-type patterns indicates that burial depth significantly influences migration pathway development and saturation distribution, providing insights into how petroleum charge characteristics evolve during basin development. The identified preferential flow pathways represent critical migration conduits that likely control ultimate hydrocarbon distribution and trap-filling efficiency. Future investigations should address flow characteristics across diverse lithologies and expanded temperature ranges, as well as examine the microscopic mechanisms governing preferential path formation.


