
Natural Gas–Hydrogen Blends to Power: Equipment Adaptation and Experimental Study


Abstract
1. Introduction
2. Equipment and Experimental Procedure
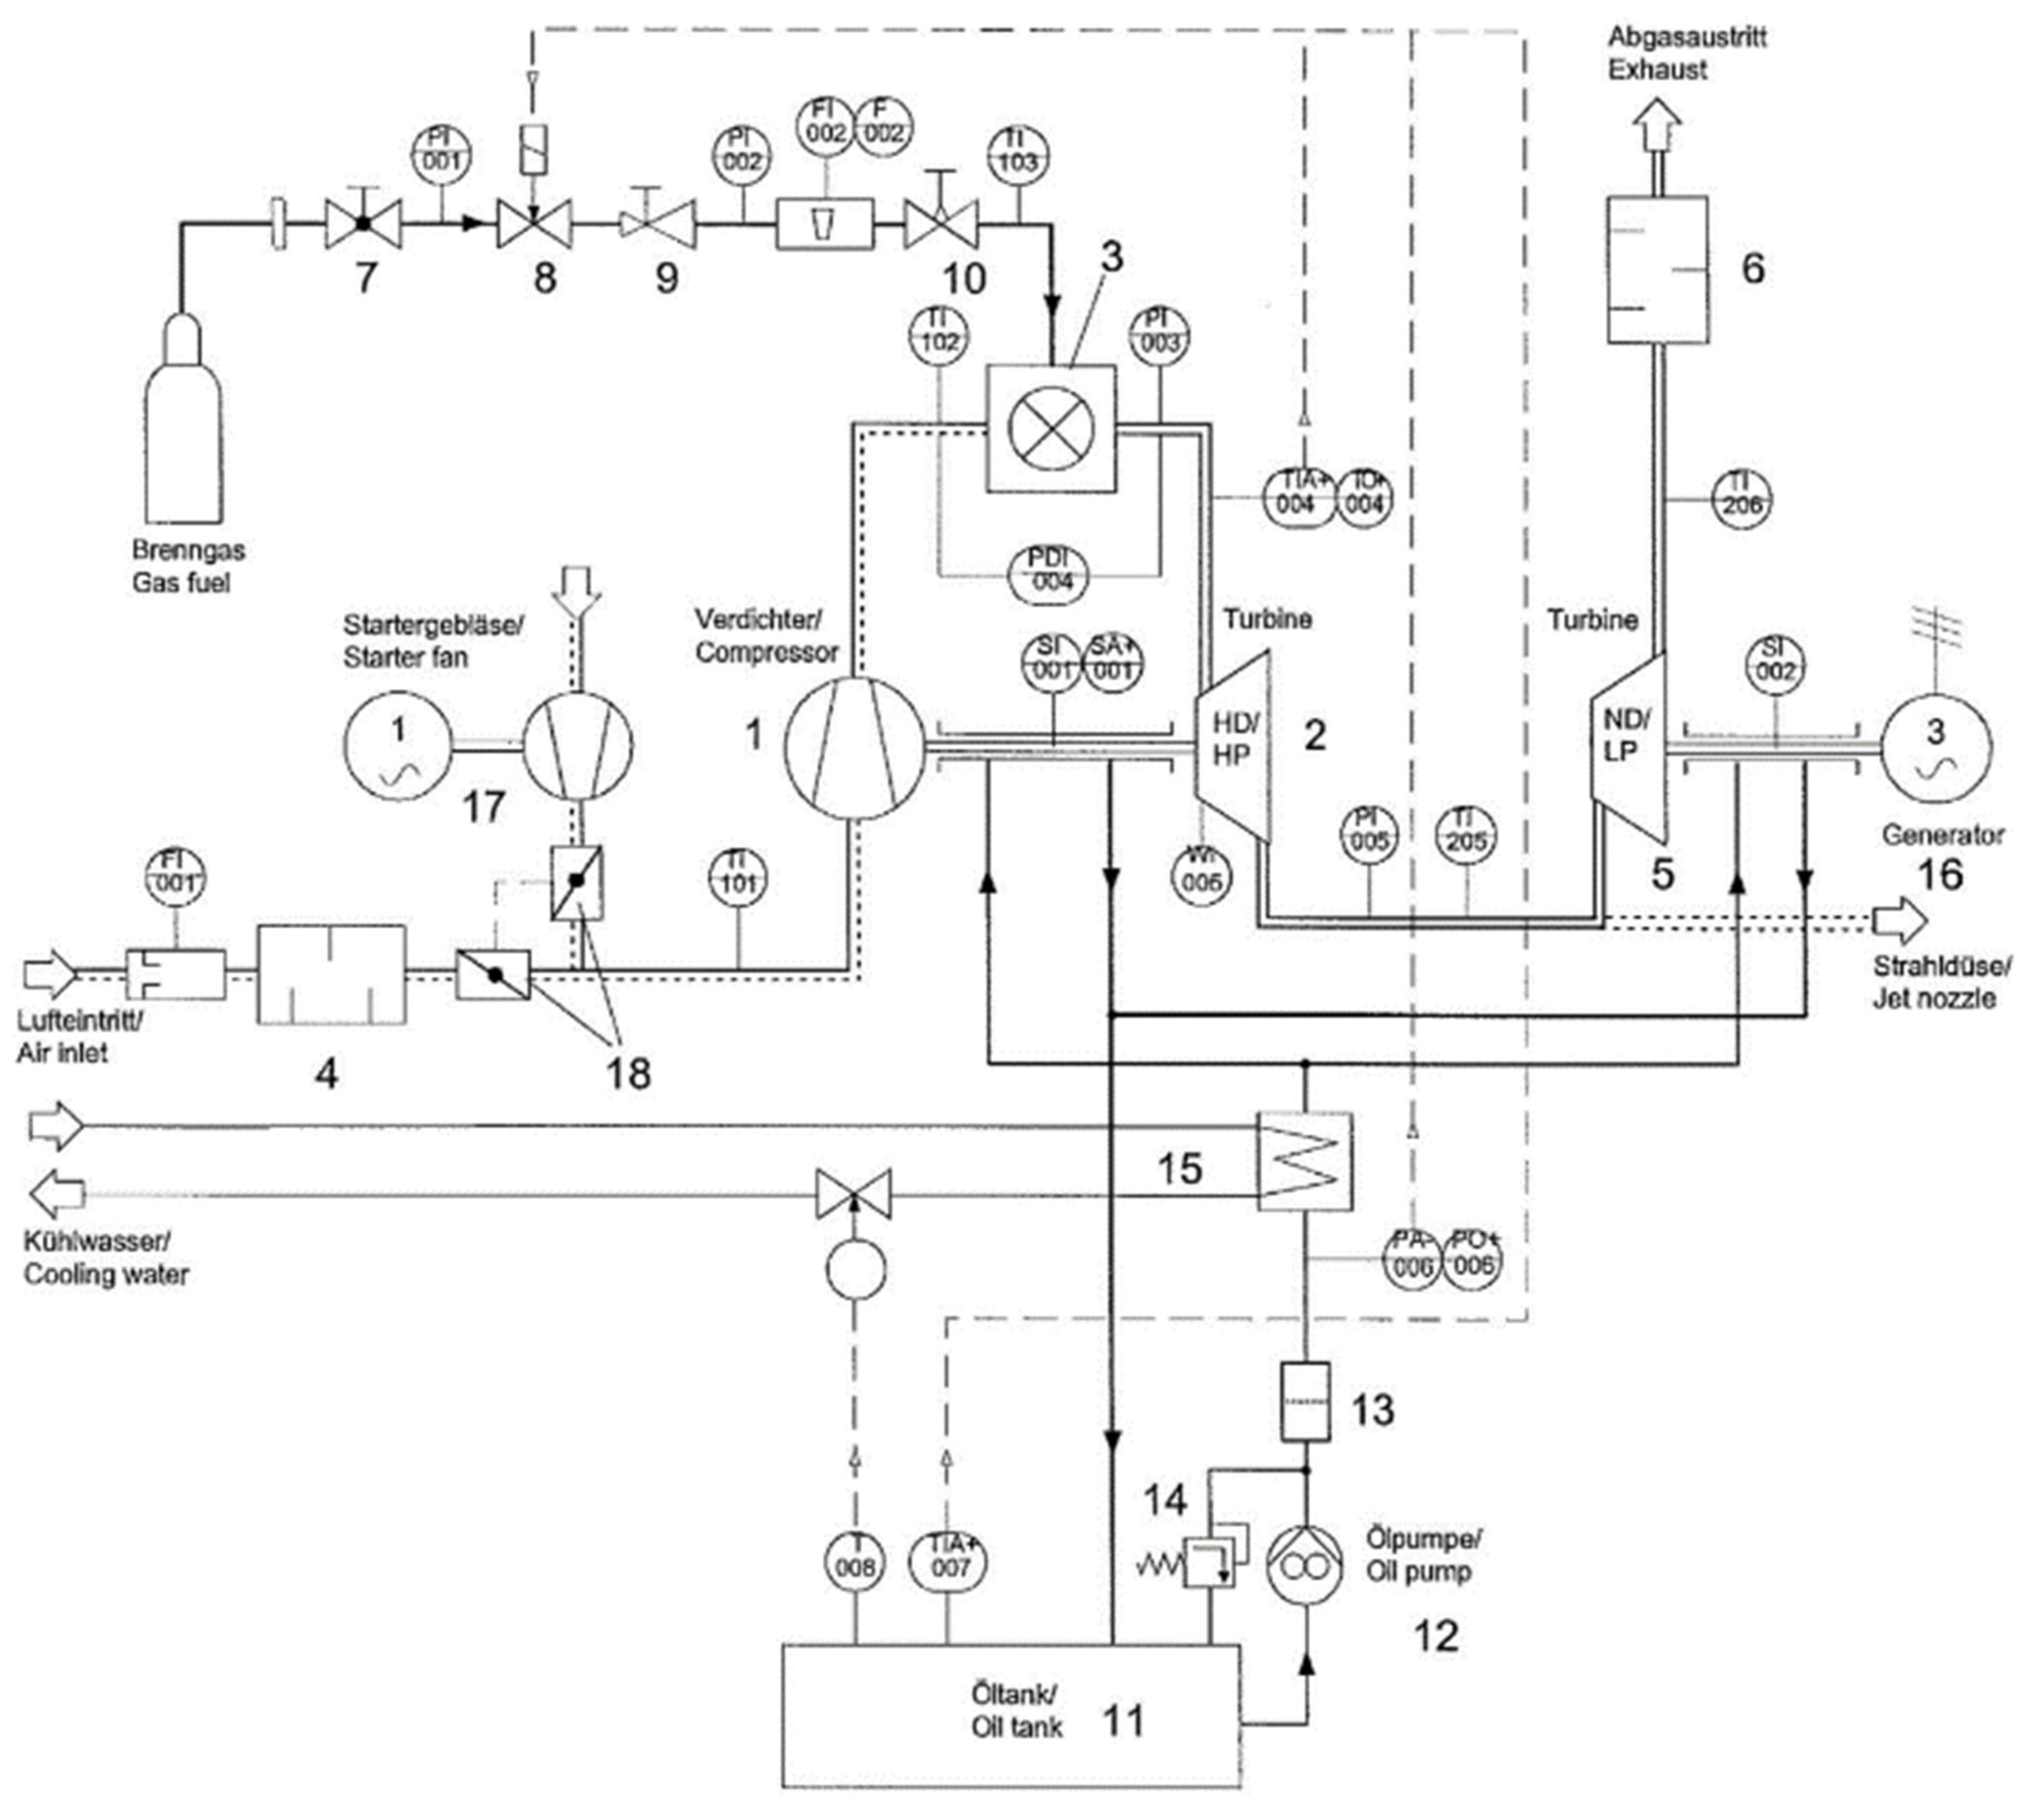
2.1. Experimental Equipment
- Gas generator, composed of a compressor and a turbine that operate within a speed range of 60,000 to 120,000 revolutions per minute, along with the combustion chamber and a noise-attenuated air inlet;
- Power turbine characterized by operating speeds ranging from 10,000 to 40,000 revolutions per minute and delivering a maximum power of around 2 kW, equipped with an exhaust silencer and connected to the electric generator via a 1:11 belt transmission ratio;
- Fuel system, including a main valve, a quick shut-off valve, a pressure regulator, a control valve, and an injector;
- Ignition system, featuring a spark plug and an ignition transformer;
- Lubrication system, consisting of a tank, an oil filter, a pressure regulator that ensures operation between 2 and 4 bar, an oil cooler, and a pump;
- Electric generator, with an efficiency of 74% and a maximum electrical power of 1.5 kW, including a converter, ballast resistors, and a power indicator;
- Starting system, which includes a starter fan with a power of 1 kW, a speed of 30,000 rpm, and a maximum pressure of 10 kPa, along with the air flow regulation vanes;
- Instrumentation and control, equipped with measurement probes for temperature, flow, rotation speed, and pressure, as well as an automatic shutdown system that is activated whenever any of the following conditions are met:
- Gas generator turbine inlet temperature above 1100 °C or below 600 °C;
- Lubrication oil temperature above 100 °C;
- Oil circuit pressure below 2 bar;
- Gas generator speed exceeding 130,000 revolutions per minute.
2.2. Procedure
- Starting the turbine according to the manufacturer’s instructions;
- Stabilizing the rotation speed of the gas generator at 80,000 revolutions per minute;
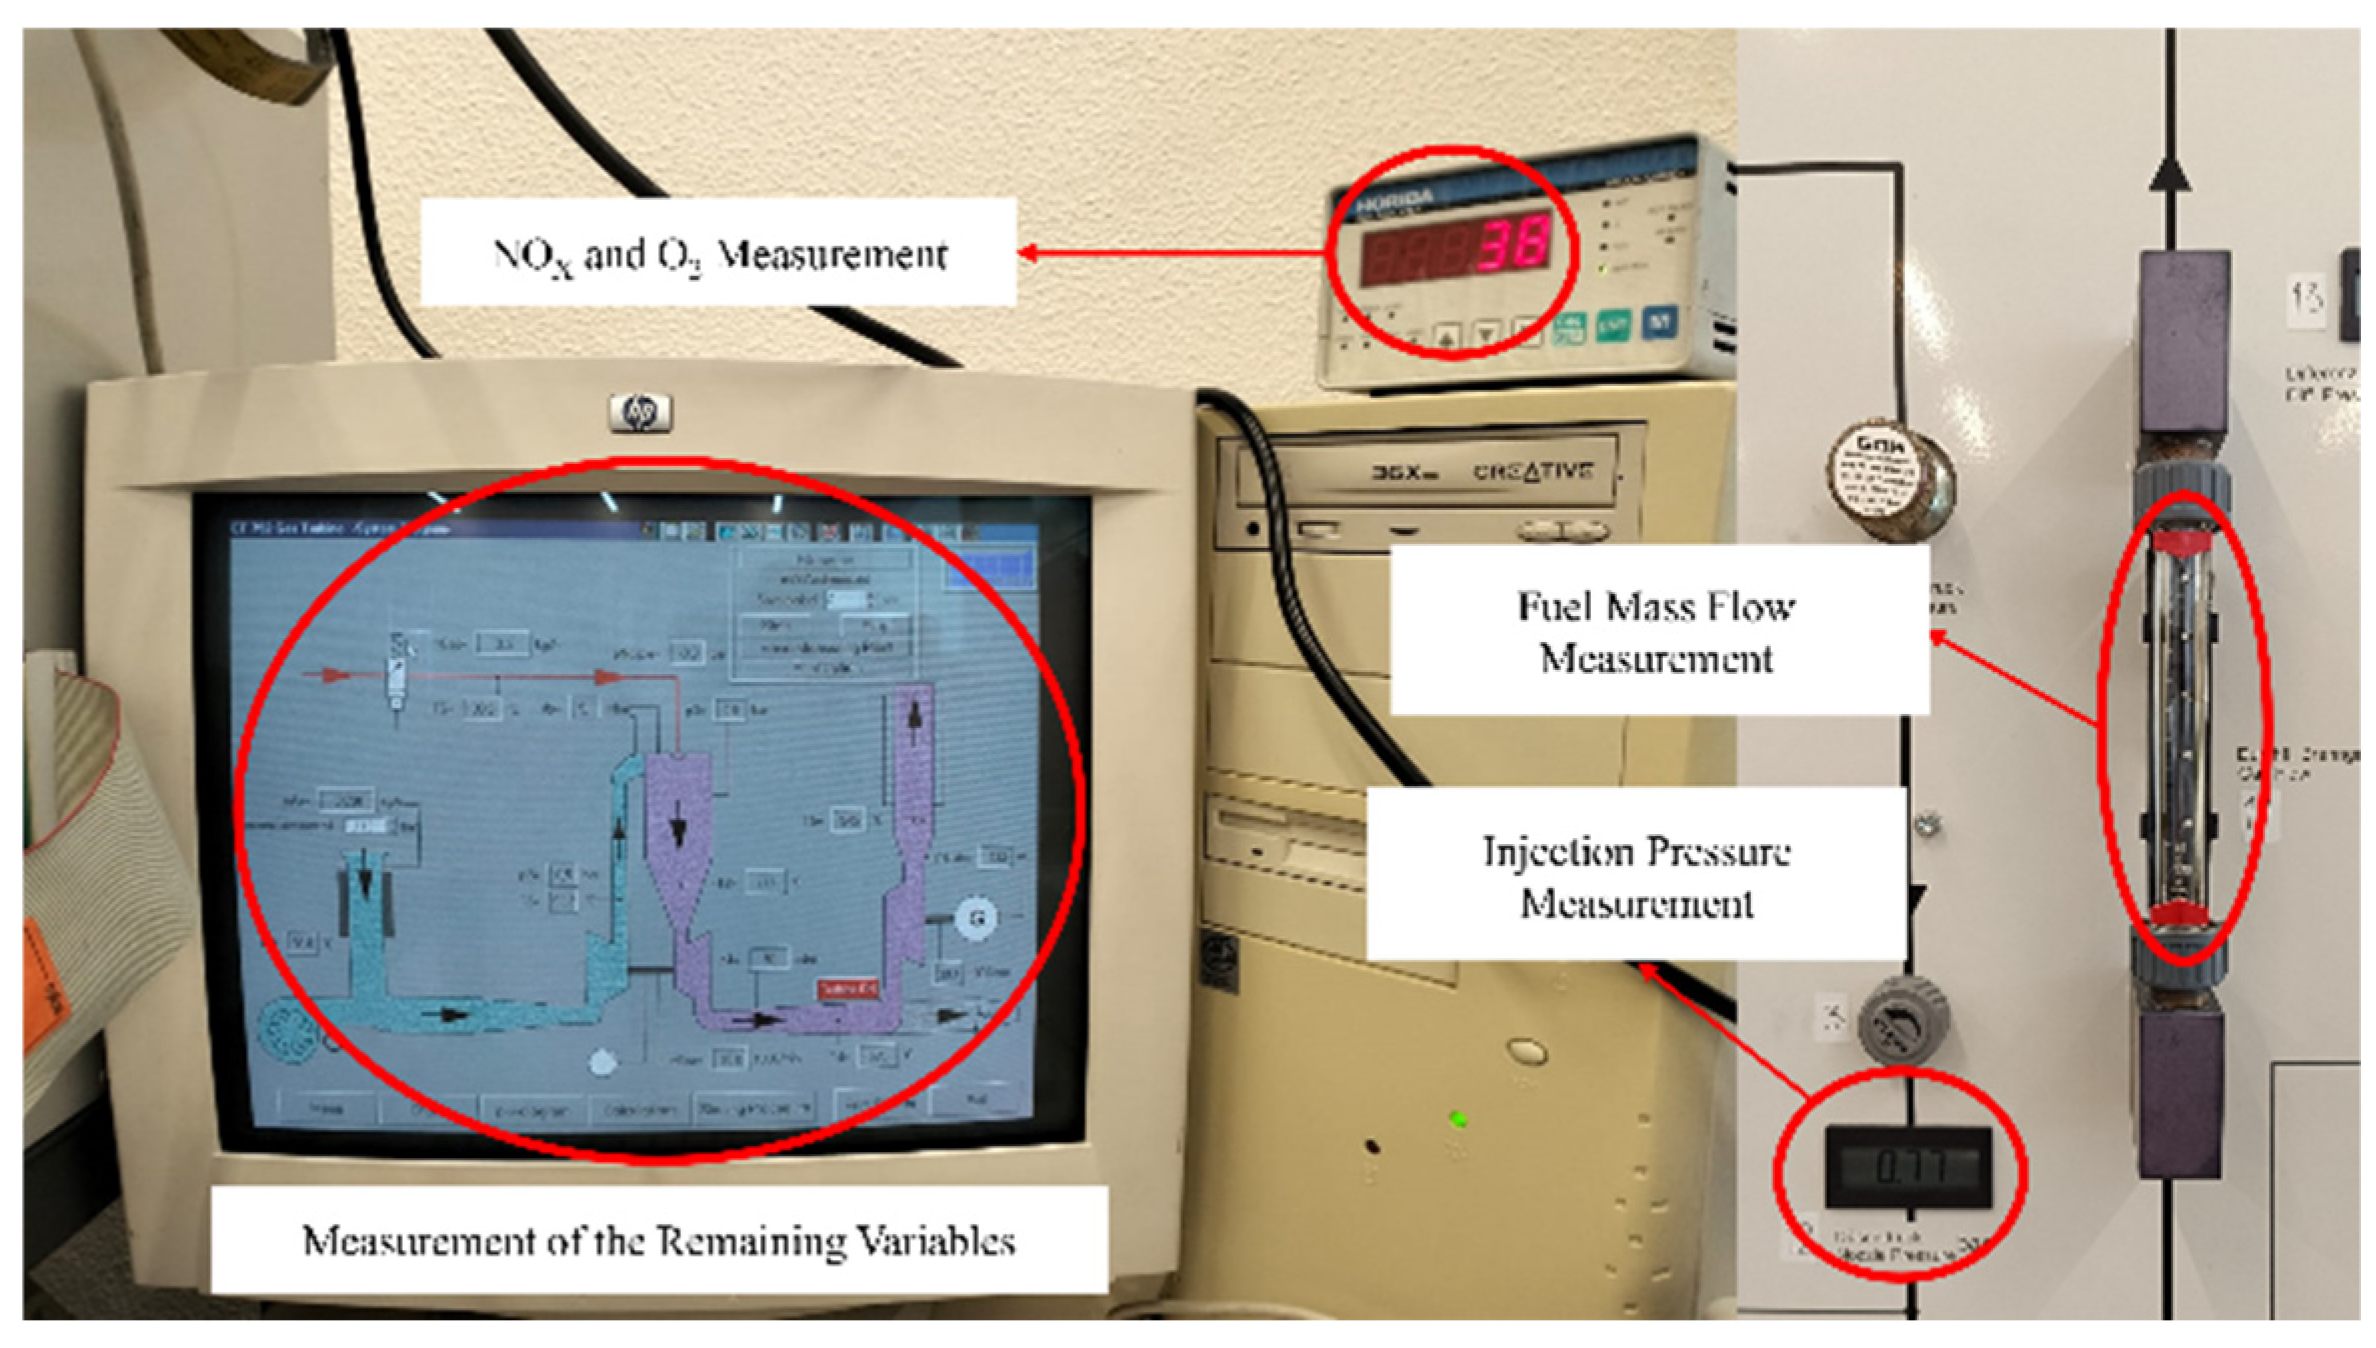
- Data collection, as indicated in Figure 2, where values were recorded for the following variables: air flow, fuel flow, gas temperature, compressor inlet temperature, compressor outlet temperature, pressure drop in the combustion chamber, injection pressure, turbine inlet temperature, turbine inlet pressure, power turbine inlet temperature, power turbine inlet pressure, power turbine outlet temperature, gas generator rotation speed, power produced, NOx concentration, and O2 concentration;
- Repeating the second and third steps for speeds of 90,000, 100,000, 110,000, and 120,000 revolutions per minute. Stabilizing the gas generator speed and collecting the data on this last speed require maximum efficiency, as operating the bench for long periods with electrical outputs exceeding 1.5 kW is not recommended;
- The process is repeated for a new gas mixture, with the equipment being cooled between tests.
2.3. General Description of the Mechanism of NOx Formation
3. Results
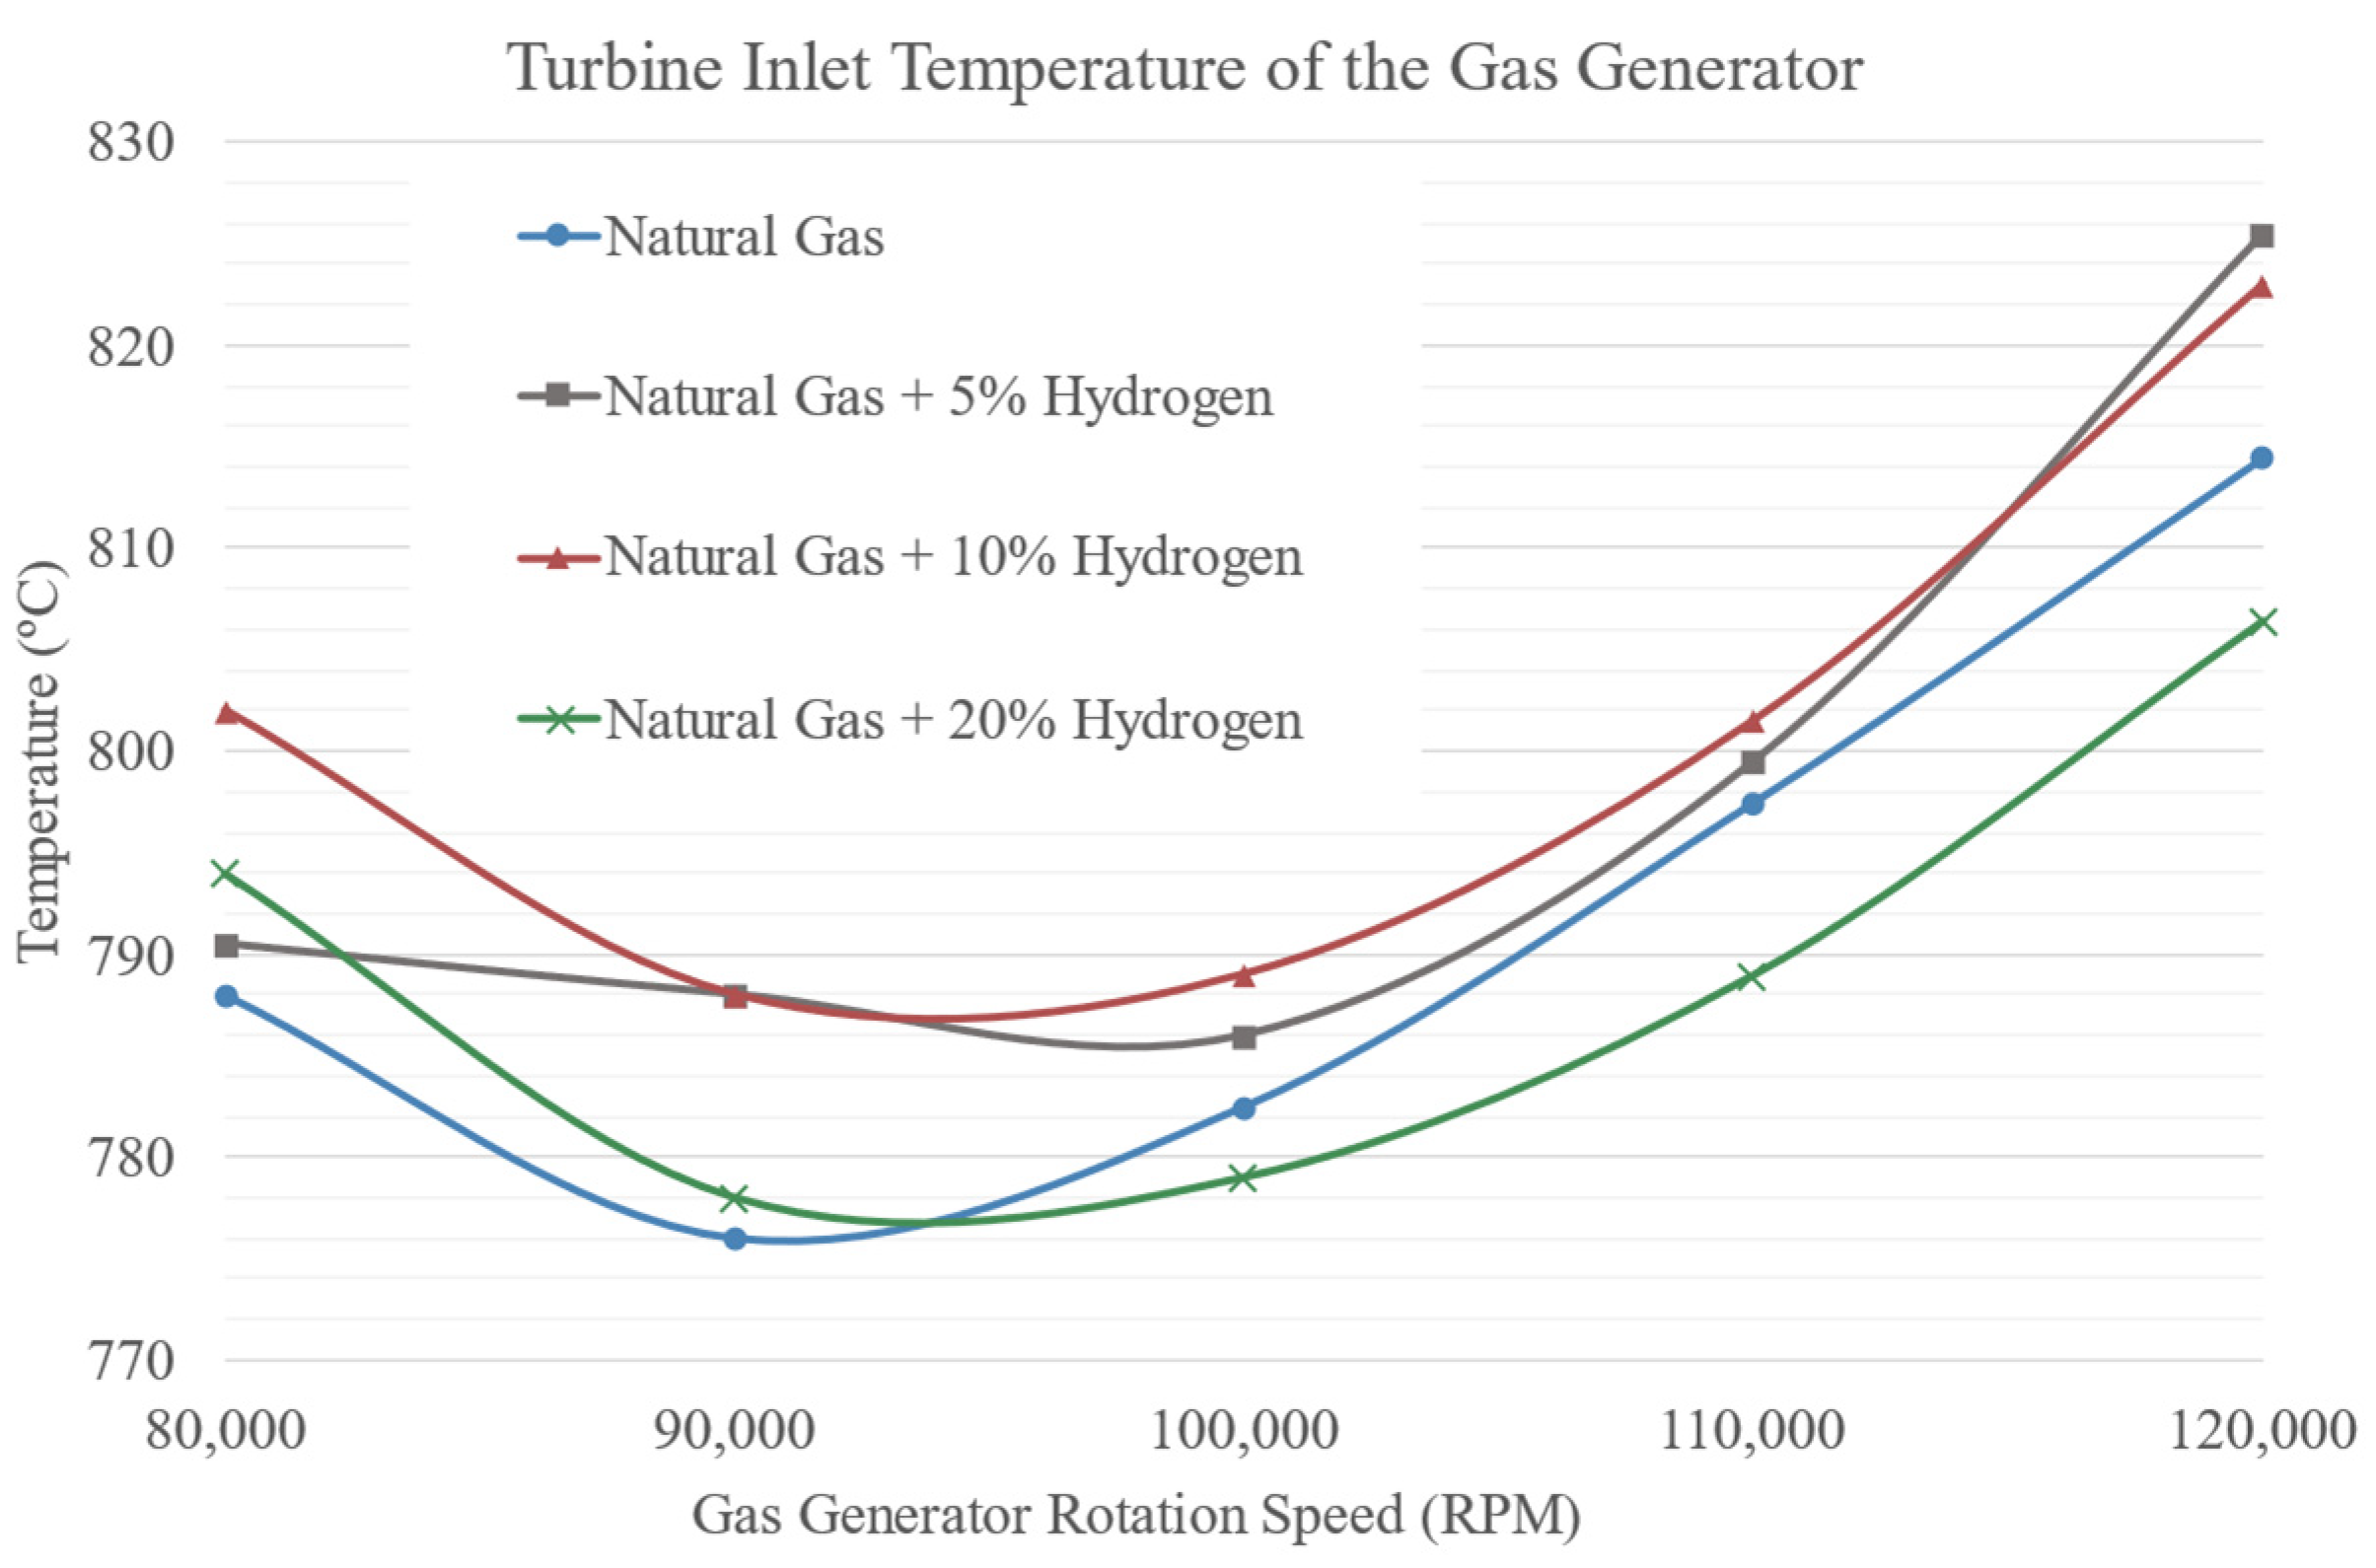
3.1. Temperatures
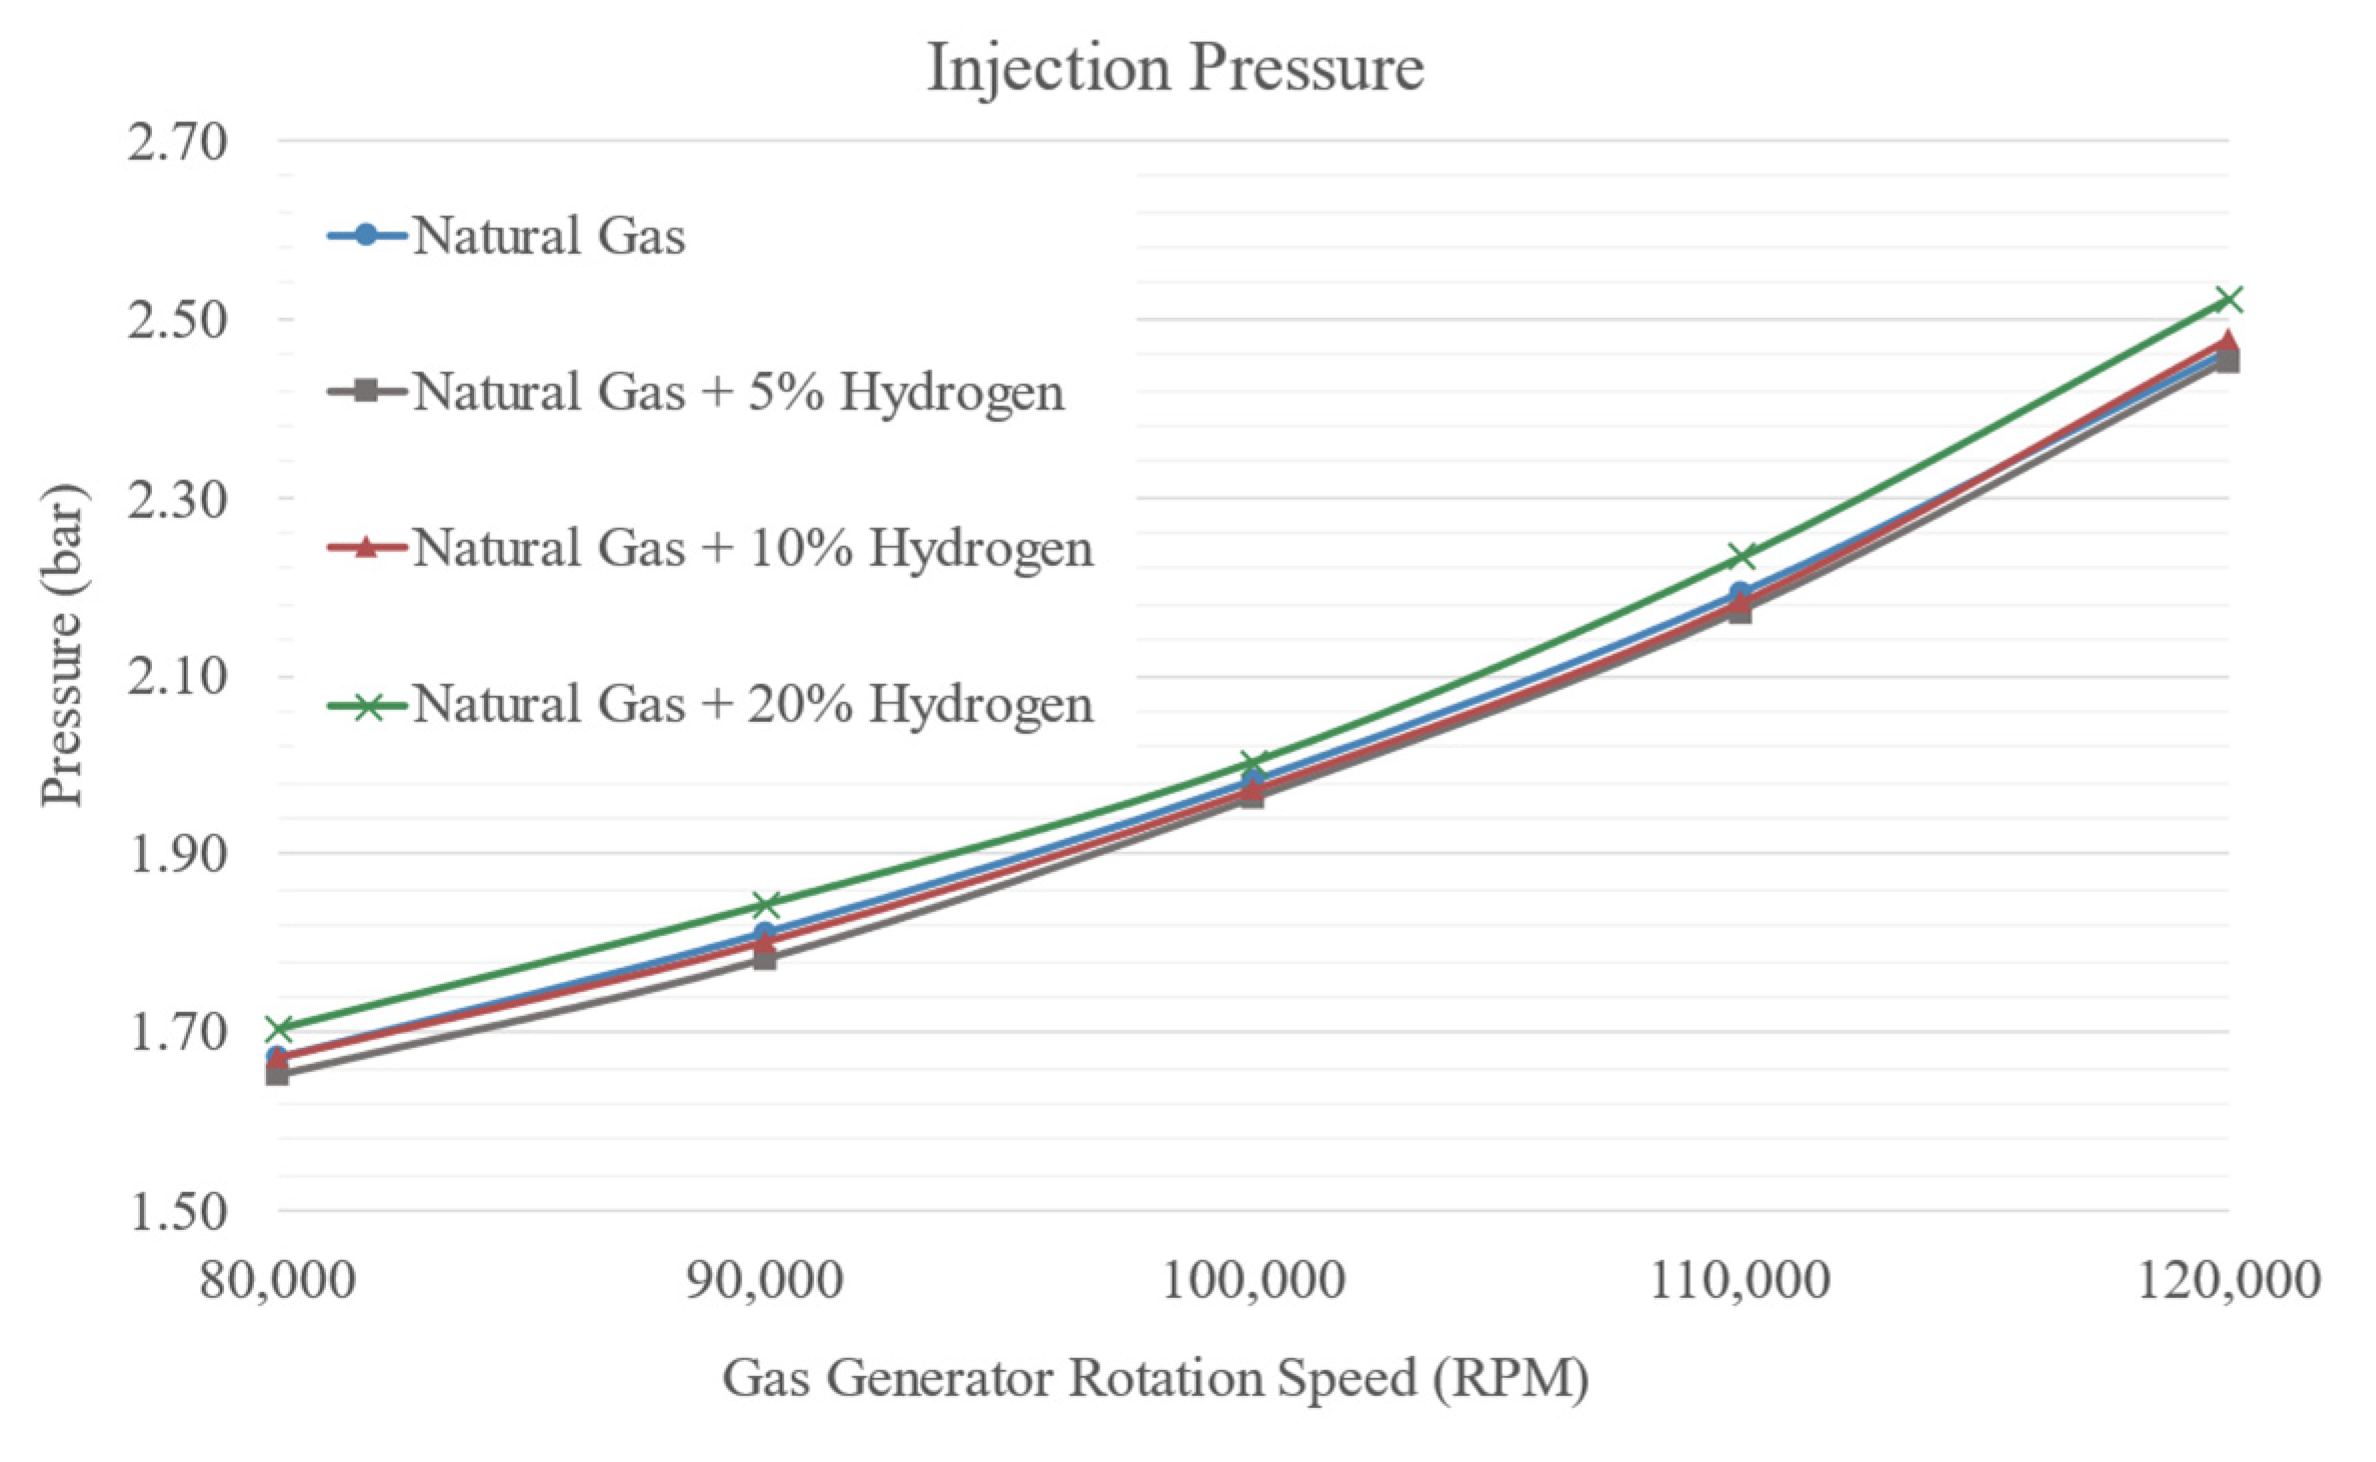
3.2. Pressures
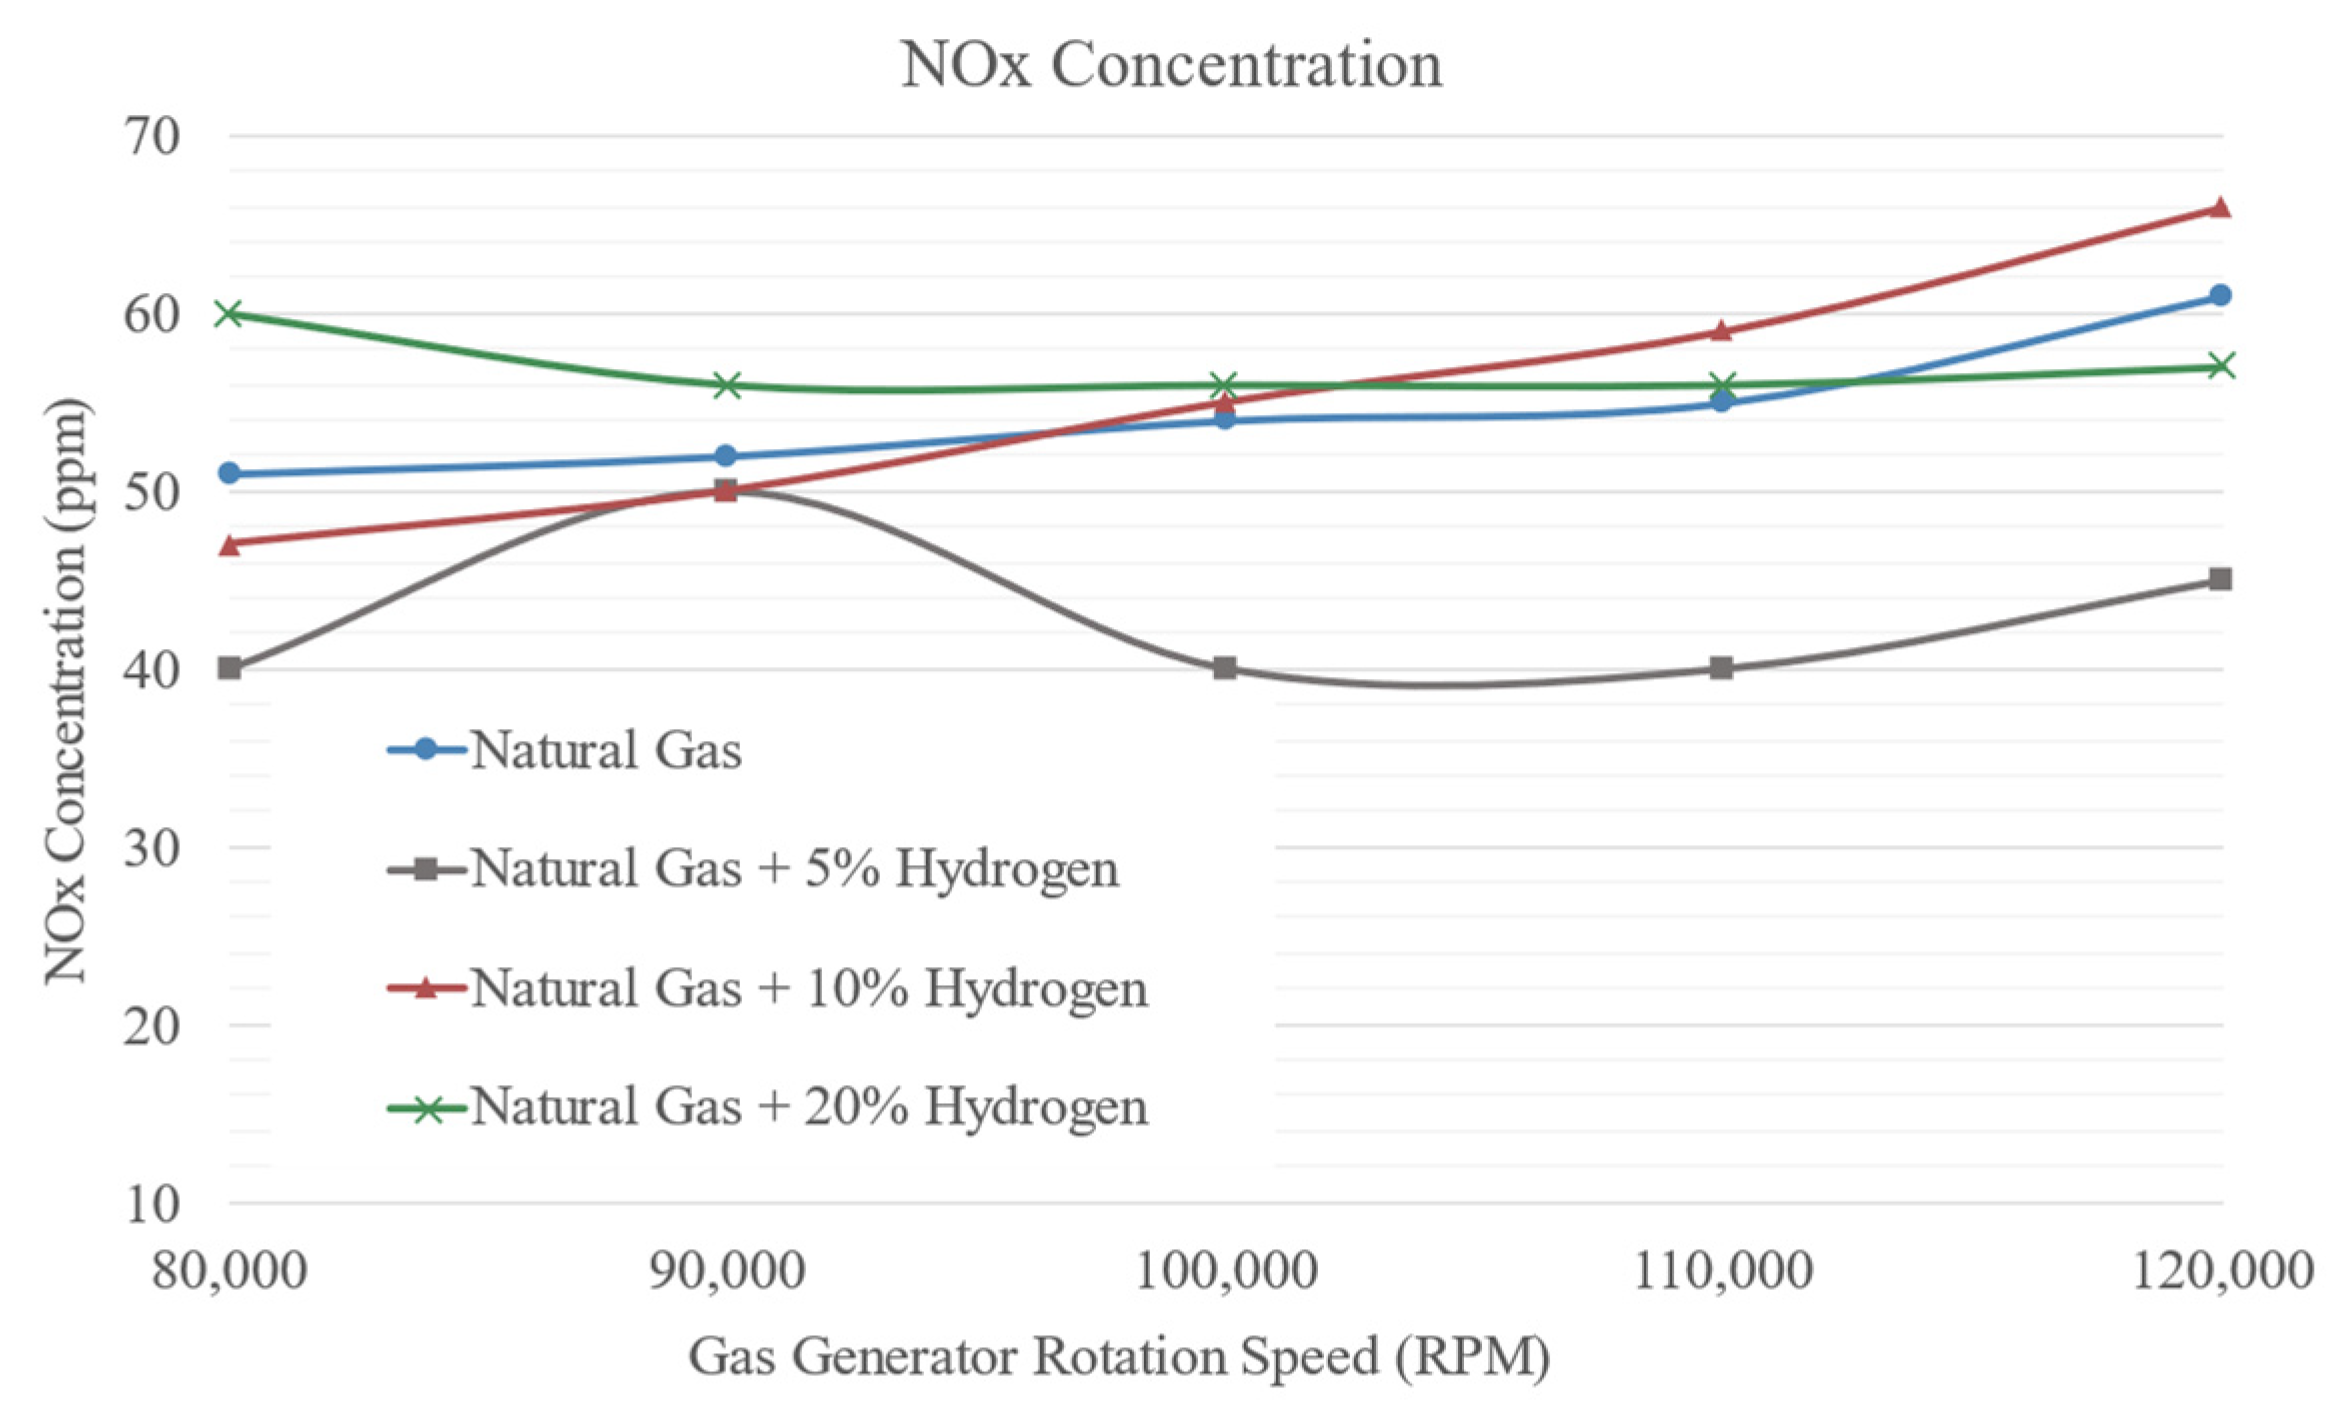
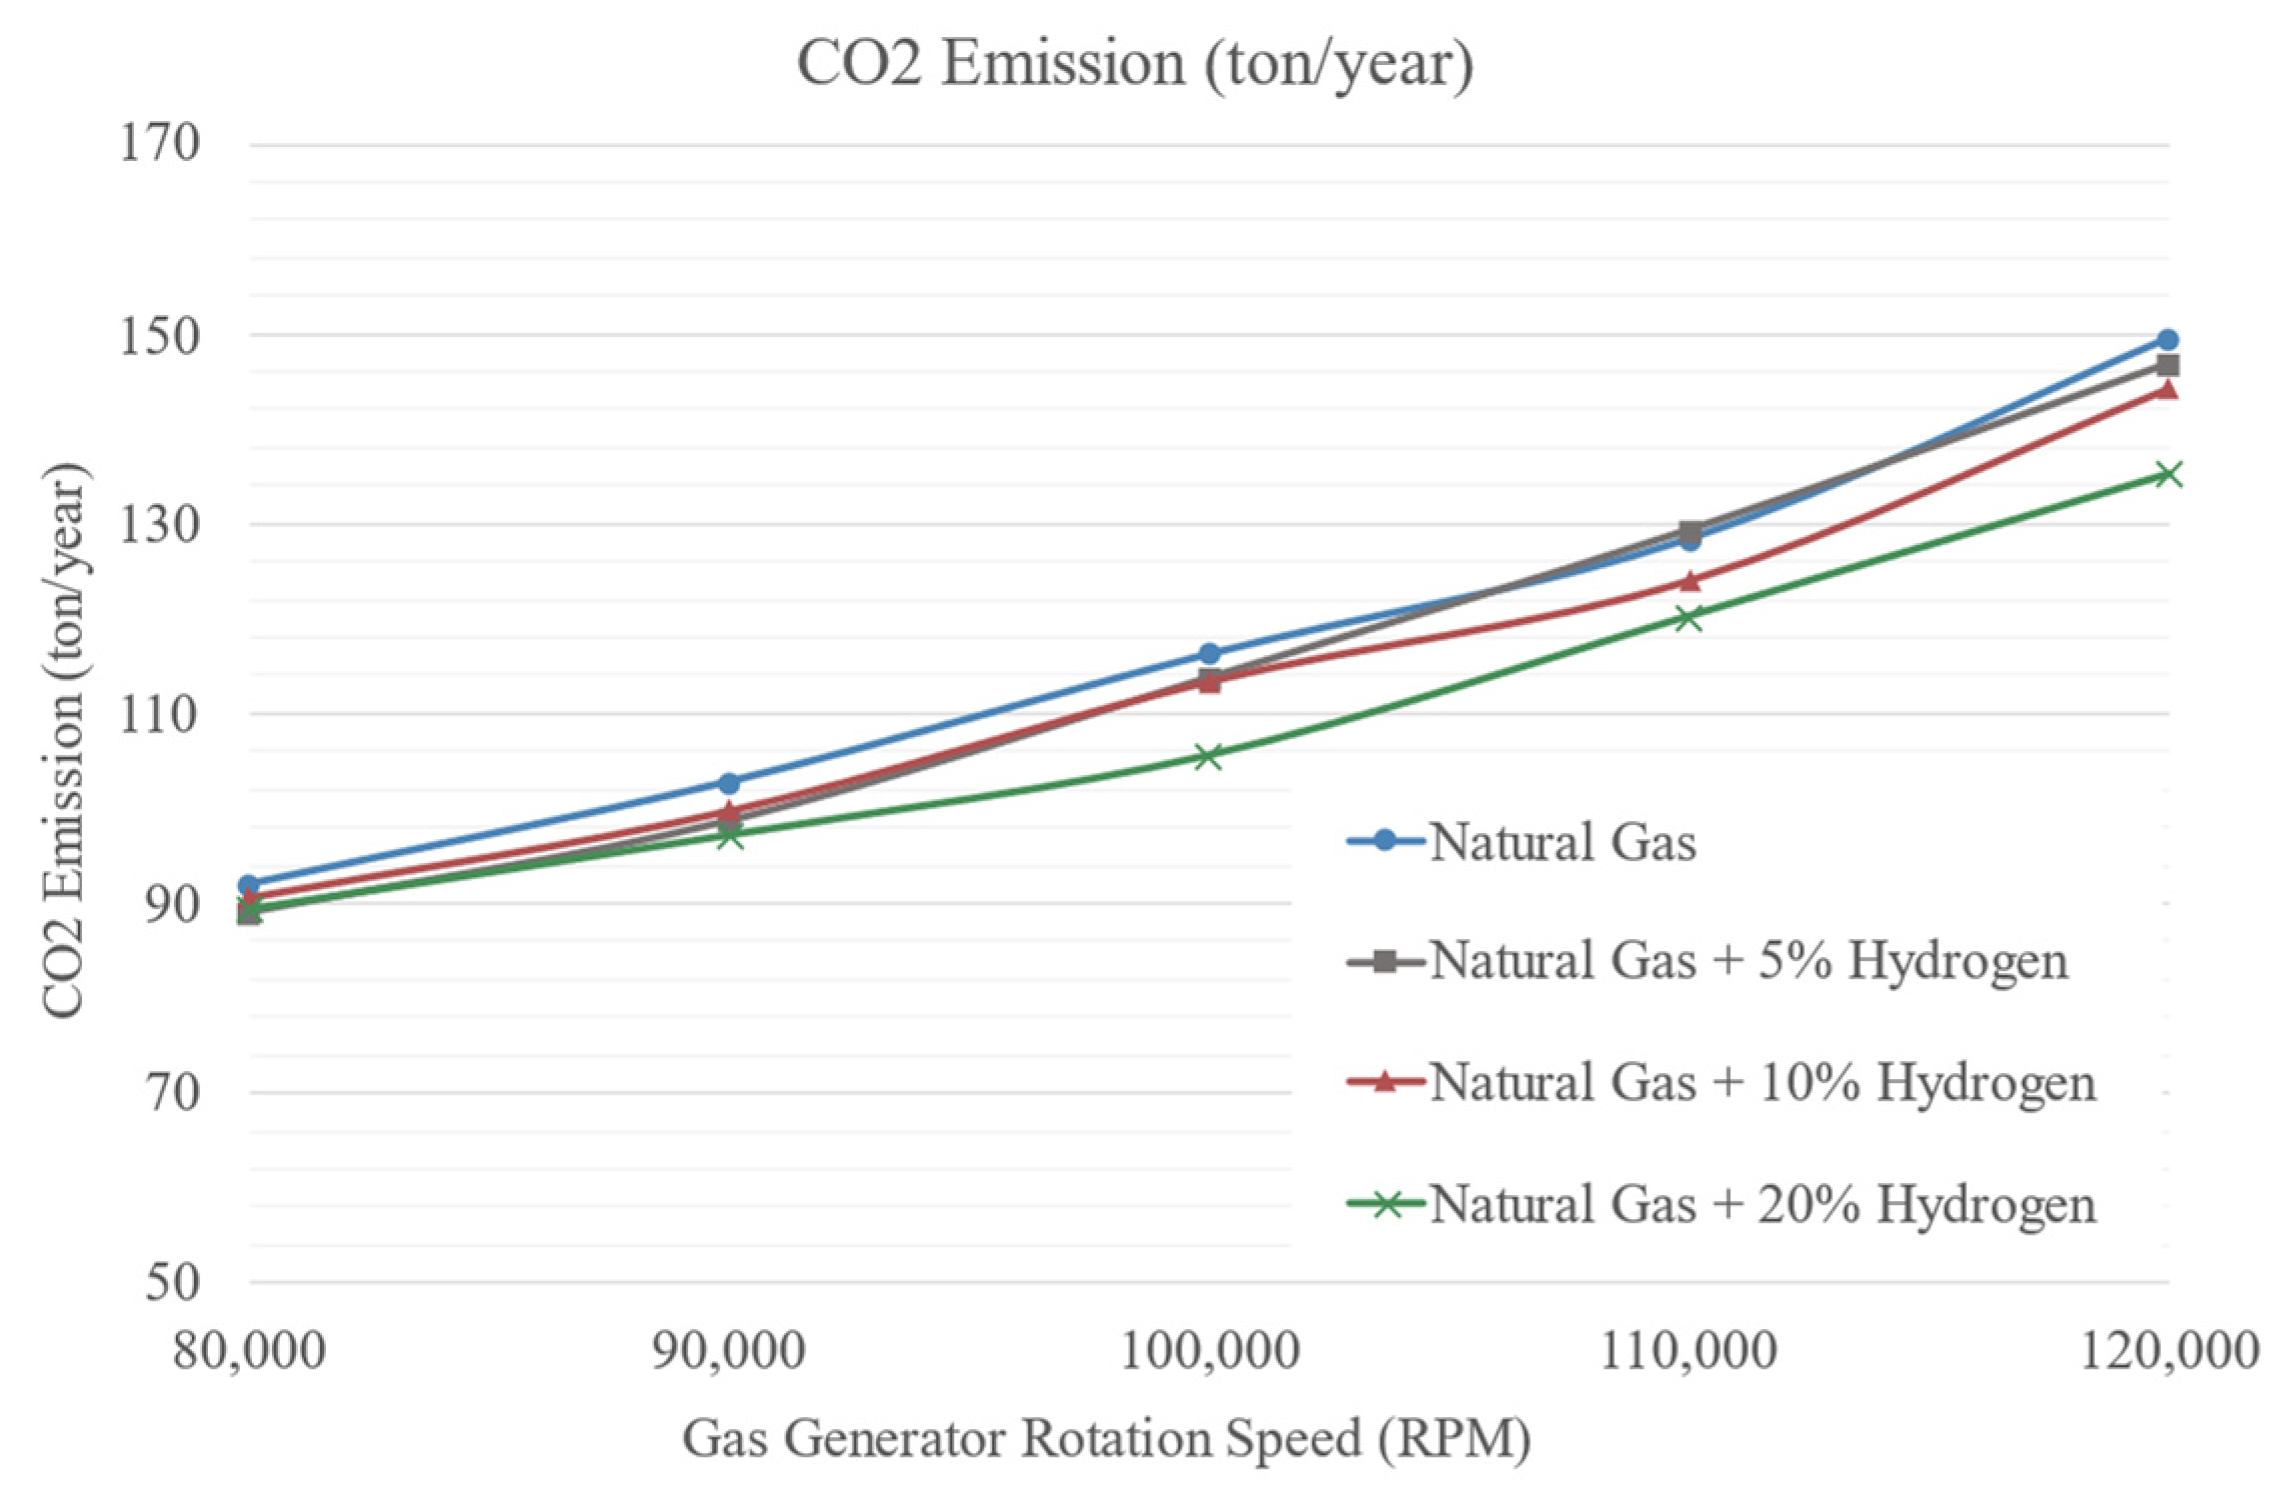
3.3. Combustion
3.4. Power and Efficiency
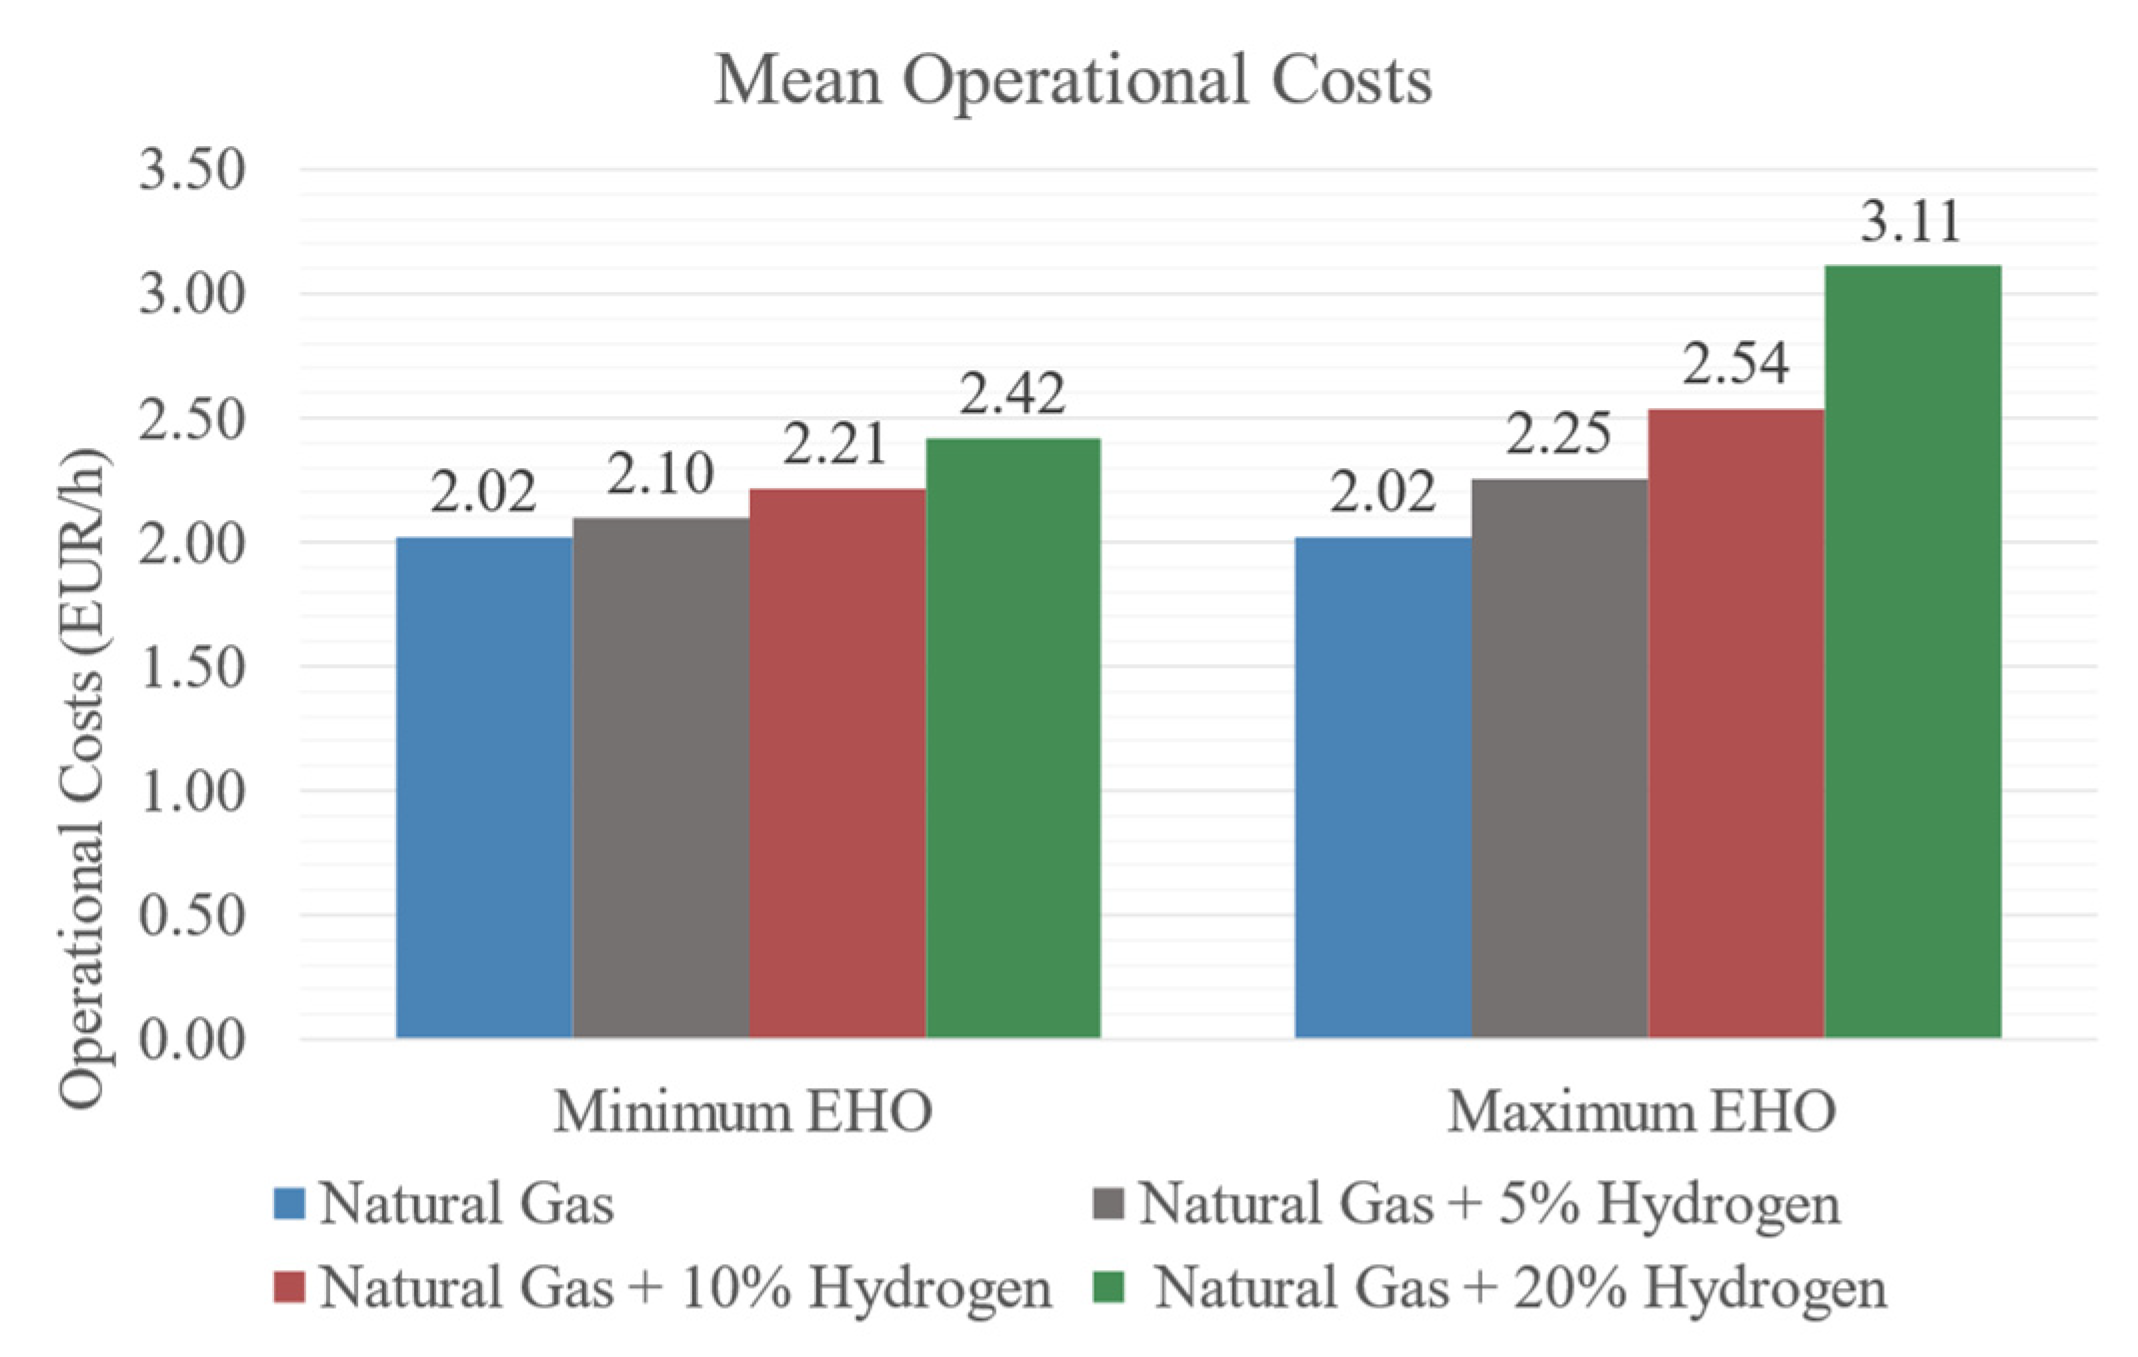
3.5. Operational Costs
4. Conclusions
Author Contributions
Funding
Data Availability Statement
Acknowledgments
Conflicts of Interest
References
- Ministry of Environment and Energy Transition; Environmental Fund; Portuguese Environment Agency. Roadmap for Carbon Neutrality 2050 (RNC2050)—Long-Term Strategy for Carbon Neutrality of the Portuguese Economy by 2050. June 2019. Available online: https://www.portugal.gov.pt/download-ficheiros/ficheiro.aspx?v=%3D%3DBAAAAB%2BLCAAAAAAABACzMDexBAC4h9DRBAAAAA%3D%3D (accessed on 23 March 2025).
- Ministry of Environment and Energy Transition; Environmental Fund; Portuguese Environment Agency. National Energy and Climate Plan 2021–2030 (PNEC 2030). Portugal, December 2019. Available online: https://energy.ec.europa.eu/system/files/2020-06/pt_final_necp_main_en_0.pdf (accessed on 23 March 2025).
- Cristello, J.B.; Yang, J.M.; Hugo, R.; Lee, Y.; Park, S.S. Feasibility Analysis of Blending Hydrogen into Natural Gas Networks. Int. J. Hydrogen Energy 2023, 48, 17605–17629. [Google Scholar] [CrossRef]
- Isaac, T. HyDeploy: The UK’s First Hydrogen Blending Deployment Project. Clean Energy 2019, 3, 114–125. [Google Scholar] [CrossRef]
- Silva, B. Floene Abastece 82 Clientes no Seixal com 12% de Hidrogénio na Rede de Gás. Jornal de Negócios. Available online: https://www.jornaldenegocios.pt/empresas/energia/detalhe/floene-ja-abastece-82-clientes-no-seixal-com-12-de-hidrogenio-na-rede-de-gas (accessed on 15 September 2023).
- Sorgulu, F.; Ozturk, M.; Javani, N.; Dincer, I. Experimental Investigation for Combustion Performance of Hydrogen and Natural Gas Fuel Blends. Int. J. Hydrogen Energy 2023, 48, 34476–34485. [Google Scholar] [CrossRef]
- Ozturk, M.; Sorgulu, F.; Javani, N.; Dincer, I. An Experimental Study on the Environmental Impact of Hydrogen and Natural Gas Blend Burning. Chemosphere 2023, 329, 138671. [Google Scholar] [CrossRef] [PubMed]
- Fichtner, J.; Gegner, A.; Ninow, J.; Kapischke, J. Hydrogen Enriched Natural Gas as Fuel for CHP Units. Int. J. Hydrogen Energy 2023, 48, 35280–35290. [Google Scholar] [CrossRef]
- Domingues, N. Industry 4. In 0 in maintenance: Using condition monitoring in electric machines. In Proceedings of the 2021 International Conference on Decision Aid Sciences and Application (DASA), Sakheer, Bahrain, 7–8 December 2021; pp. 456–462. [Google Scholar] [CrossRef]
- Ge, B.; Ji, Y.; Zhang, Z.; Zang, S.; Tian, Y.; Yu, H.; Chen, M.; Jiao, G.; Zhang, D. Experiment Study on the Combustion Performance of Hydrogen-Enriched Natural Gas in a DLE Burner. Int. J. Hydrogen Energy 2019, 44, 14023–14031. [Google Scholar] [CrossRef]
- Loving, C.; Mastantuono, G.; Rahman, R.K.; Kim, G.; Vasu, S.S.; Pigon, T.; Hernandez, A.; Cloyd, S. Extended Testing of the Auto-Ignition Characteristics of Hydrogen–Natural Gas Mixtures for the Safety of Power Plants. ASME J. Eng. Gas Turbines Power 2025, 147, 031031. [Google Scholar] [CrossRef]
- Marin, G.; Titov, A.; Akhmetshin, A.; Ishalin, A. Increasing the efficiency of a conversion gas turbine engine by adding hydrogen to fuel gas. Int. J. Hydrogen Energy 2025, 97, 649–656. [Google Scholar] [CrossRef]
- Ahang, M.; del Granado, P.C.; Tomasgard, A. Investments in green hydrogen as a flexibility source for the European power system by 2050: Does it pay off? Appl. Energy 2025, 378 Pt A, 124656. [Google Scholar] [CrossRef]
- Qi, S.; Li, Y.; Zhou, S.; Jing, Q.; Zhang, L.; Zhou, R.; Chen, W.; Li, T. The premixed flame structure and combustion mechanism of clean hydrogen mixed with multi-component natural gas. Fuel 2024, 372, 132240. [Google Scholar] [CrossRef]
- Zhang, M.; Wang, J.; Huang, Z. Turbulent flame structure characteristics of hydrogen enriched natural gas with CO2 dilution. Int. J. Hydrogen Energy 2020, 45, 20426–20435. [Google Scholar] [CrossRef]
- Topolski, K.; Reznicek, E.P.; Erdener, B.C.; San Marchi, C.W.; Ronevich, J.A.; Fring, L.; Chung, M. Hydrogen Blending into Natural Gas Pipeline Infrastructure: Review of the State of Technology; National Renewable Energy Lab.: Golden, CO, USA, 2022. [Google Scholar]
- GE Vernova. Hydrogen Fueled Gas Turbines. Available online: https://www.gevernova.com/gas-power/future-of-energy/hydrogen-fueled-gas-Turbines (accessed on 23 March 2023).
- Ansaldo Energi. H-class GT36 Turbines. Available online: https://www.ansaldoenergia.com/offering/equipment/turbomachinery/gt36 (accessed on 23 March 2025).
- Long Ridge. Hannibal Power Plant. Available online: https://www.longridgeenergy.com/about (accessed on 23 March 2025).
- Mahajan, D.; Tan, K.; Venkatesh, T.; Kileti, P.; Clayton, C.R. Hydrogen blending in gas pipeline networks—A review. Energies 2022, 15, 3582. [Google Scholar] [CrossRef]
- Rahman, M.N.; Shahril, N.; Yusup, S. Hydrogen-Enriched Natural Gas Swirling Flame Characteristics: A Numerical Analysis. CFD Lett. 2022, 14, 100–112. [Google Scholar] [CrossRef]
- Gunt Hamburg. Instructions Manual ET792 Small Gas Turbine Demonstration Unit; Gunt Hamburg: Barsbüttel, Germany, 1998. [Google Scholar]
- Domingues, N.; Costa, J.M.; Paulo, R.M. Technical-Economic Feasibility Study of a Tri-Generation System in an Isolated Tropical Island. Int. J. Energy Optim. Eng. (IJEOE) 2022, 11, 1–26. [Google Scholar] [CrossRef]
- REN.REN Data Hub. Available online: https://datahub.ren.pt/pt/gas-natural/mercado/ (accessed on 12 September 2024).
- European Hydrogen Observatory. Cost of Hydrogen Production. Available online: https://observatory.clean-hydrogen.europa.eu/index.php/hydrogen-landscape/production-trade-and-cost/cost-hydrogen-production (accessed on 14 September 2024).


| Substance | Natural Gas | GN + 5% H2 | GN + 10% H2 | GN + 20% H2 |
|---|---|---|---|---|
| Methane (CH4) | 92.4% | 87.8% | 83.2% | 73.9% |
| Ethane (C2H6) | 4.8% | 4.6% | 4.3% | 3.8% |
| Propane (C3H8) | 2.1% | 2.0% | 1.9% | 1.7% |
| Butane (C4H10) | 0.7% | 0.6% | 0.6% | 0.6% |
| Hydrogen (H2) | - | 5.0% | 10.0% | 20.0% |
Disclaimer/Publisher’s Note: The statements, opinions and data contained in all publications are solely those of the individual author(s) and contributor(s) and not of MDPI and/or the editor(s). MDPI and/or the editor(s) disclaim responsibility for any injury to people or property resulting from any ideas, methods, instructions or products referred to in the content. |
© 2025 by the authors. Licensee MDPI, Basel, Switzerland. This article is an open access article distributed under the terms and conditions of the Creative Commons Attribution (CC BY) license (https://creativecommons.org/licenses/by/4.0/).
Share and Cite
Valente, R.; Costa, J.M.; Domingues, N.S. Natural Gas–Hydrogen Blends to Power: Equipment Adaptation and Experimental Study. Energies 2025, 18, 1922. https://doi.org/10.3390/en18081922
Valente R, Costa JM, Domingues NS. Natural Gas–Hydrogen Blends to Power: Equipment Adaptation and Experimental Study. Energies. 2025; 18(8):1922. https://doi.org/10.3390/en18081922
Chicago/Turabian StyleValente, Ruben, Jorge M. Costa, and Nuno Soares Domingues. 2025. "Natural Gas–Hydrogen Blends to Power: Equipment Adaptation and Experimental Study" Energies 18, no. 8: 1922. https://doi.org/10.3390/en18081922
APA StyleValente, R., Costa, J. M., & Domingues, N. S. (2025). Natural Gas–Hydrogen Blends to Power: Equipment Adaptation and Experimental Study. Energies, 18(8), 1922. https://doi.org/10.3390/en18081922