Article

An Analysis of the Characteristics of Internal Flow Losses of Seawater Circulation Pumps in Nuclear Power Plants Based on the Entropy Production Theory

1
China Nuclear Power Engineering Co., Ltd., Beijing 100840, China
2
National Research Center of Pumps, Jiangsu University, Zhenjiang 212013, China
*
Author to whom correspondence should be addressed.
Energies 2025, 18(8), 1909; https://doi.org/10.3390/en18081909
Submission received: 12 March 2025 / Revised: 3 April 2025 / Accepted: 7 April 2025 / Published: 9 April 2025
(This article belongs to the Section B4: Nuclear Energy)

Abstract

:
The seawater circulation pump represents the pump product with the largest flow rate within nuclear power plants. Its energy consumption accounts for a substantial portion of the energy consumed by nuclear power plants. To investigate the internal flow characteristics of the seawater circulation pump and optimize the performance while reducing energy consumption, taking the seawater circulation pump as the research object, the entropy production of each flow passage component of the pump under different flow conditions are analyzed by employing numerical simulation based on the entropy production theory. Additionally, the entropy production mechanisms of the impeller and volute are specifically analyzed. The results demonstrate that under different flow conditions, the impeller and volute are the main flow components contributing to entropy production losses for the entire pump. The leading and trailing edges of the blade and the shroud are the main locations where entropy production occurs in the impeller. Excessive attack angle and circulation are the main factors leading to entropy production. The throat area of the volute is the main entropy production area of the volute, and the secondary flow and vortex caused by flow separation are the main causes of entropy production.

1. Introduction

The climate change triggered by global warming [1,2] is one of the most pressing and severe challenges that the world is currently confronted with. Extreme weather events have exerted a significant impact on the global ecosystem and human society. To effectively address this significant challenge, countries worldwide are committed to reducing energy consumption in production [3,4,5] while promoting the development of clean energy and striving to reduce dependence on fossil fuels [6]. As a clean and reliable energy source, nuclear energy demonstrates enormous potential in providing necessary base-load power, thereby attracting great attention from decision-makers [7]. At present, nuclear energy technology is rapidly advancing, and nuclear power accounts for more than 11% [8] of global power generation.
The seawater circulating pump is a vital component in the circulating cooling water system of the conventional island of a nuclear power plant. Its function is to pressurize the circulating medium, seawater, and then transport it to the condenser. The seawater circulating pump is the type of pump with the largest flow rate in a nuclear power plant, and its energy consumption accounts for a considerable portion of the total energy consumption of the nuclear power plant, exerting a significant influence on such indicators as the power generation capacity of the power plant, the vacuum of the condenser, and the auxiliary power consumption rate. Consequently, researching the internal flow conditions and energy losses of the seawater circulating pump plays a crucial role in optimizing the operating state of the nuclear power plant, reducing energy consumption, and improving the economic benefits of the nuclear power plant.
The seawater circulating pump usually adopts the structural form of a mixed-flow pump. To date, many scholars have conducted relevant research on its internal flow characteristics. Lu et al. [9] studied the unsteady flow characteristics of the seawater circulating pump and the influence mechanism of the induced flow on the rotating system. They calculated the internal flow in the volute of the mixed-flow seawater circulating pump under different flow velocities by using the numerical simulation method. Dai et al. [10] studied the pressure fluctuation characteristics of the seawater circulating pump by simulating the three-dimensional unsteady flow. The results showed that the flow has the characteristic of periodic fluctuation, and the frequency components of the pressure fluctuations at the monitoring points in the entire flow passage of the pump are basically the same. Bing et al. [11] established a loss model for the impeller of the mixed-flow pump by systematically summarizing various loss calculation formulas and predicted the impeller performance of the mixed-flow pump and the performance curve of the adjustable-blade mixed-flow pump model. Li et al. [12] discussed the mechanism of internal energy loss in the mixed-flow pump under stall conditions based on the Shear Stress Transport (SST) k-ω turbulence model. They identified the vortices in the impeller by using the Q-criterion method and characterized the turbulence intensity by using turbulent kinetic energy (TKE).
In the past, the efficiency formula was usually adopted to simply evaluate the flow losses of hydraulic machinery. However, this method only assesses the energy conversion ability of hydraulic machinery from a macroscopic perspective and fails to accurately identify the specific locations of flow losses in various components as well as the causes of these losses [13]. Since the entropy production analysis method can not only quantitatively evaluate the flow losses of hydraulic machinery but also qualitatively determine the locations where the main flow losses occur, it has been gradually used in recent years to assess the irreversible flow losses existing in the operation process of hydraulic machinery [14,15,16]. Kan et al. [17] conducted an entropy production analysis on the influence of the tip leakage flow of an axial-flow pump, revealed the main components and sources of energy losses, and analyzed the distribution of energy losses at different positions within the pump under different working conditions. Kock et al. [18] calculated the entropy production in the fluid domain based on the Reynolds-averaged Navier–Stokes equations and believed that entropy production comprises four distinct mechanisms: dissipation in a mean and fluctuating velocity field and heat flux in a mean and fluctuating temperature field. Yang et al. [19] carried out a flow loss analysis, analyzed the characteristics of hydraulic losses within the pump, and revealed the locations and distribution characteristics of flow losses. Bejan et al. [20], in view of the characteristics of turbulent flow, considered that entropy production is caused by the mean velocity and fluctuating velocity. Ji et al. [21,22] applied the entropy production theory to study the tip leakage and flow losses of the mixed-flow pump and found that as the tip leakage flow increases, the entropy production within the impeller also increases. Fei et al. [23] studied the changes in energy losses at different cavitation development stages and revealed the internal relationship between the leakage flow and cavitation vortices. Li et al. [24] optimized the guide vane opening in the pump as turbine mode and obtained the optimal guide vane opening based on the variation law of entropy production.
To summarize, the method of using the entropy production theory to study the fluid energy flow losses has gradually developed and matured. However, at present, there are still relatively few studies on the internal flow characteristics and energy loss mechanisms of the seawater circulating pump. Therefore, the main contribution of this research lies in taking the seawater circulating pump as the research object and studying the internal flow and energy loss characteristics of the seawater circulating pump based on the entropy production theory and the numerical simulation method, providing a reference basis for optimizing the flow conditions of the seawater circulating pump in nuclear power plants and reducing energy consumption.
The main contents of this research are organized as follows: Section 2 introduces the numerical simulation calculation methods used in the research. Section 3 analyzes the internal flow characteristics and energy losses of the seawater circulating pump based on entropy production. Section 4 presents the conclusions.

2. Numerical Simulation Methods and Experimental System

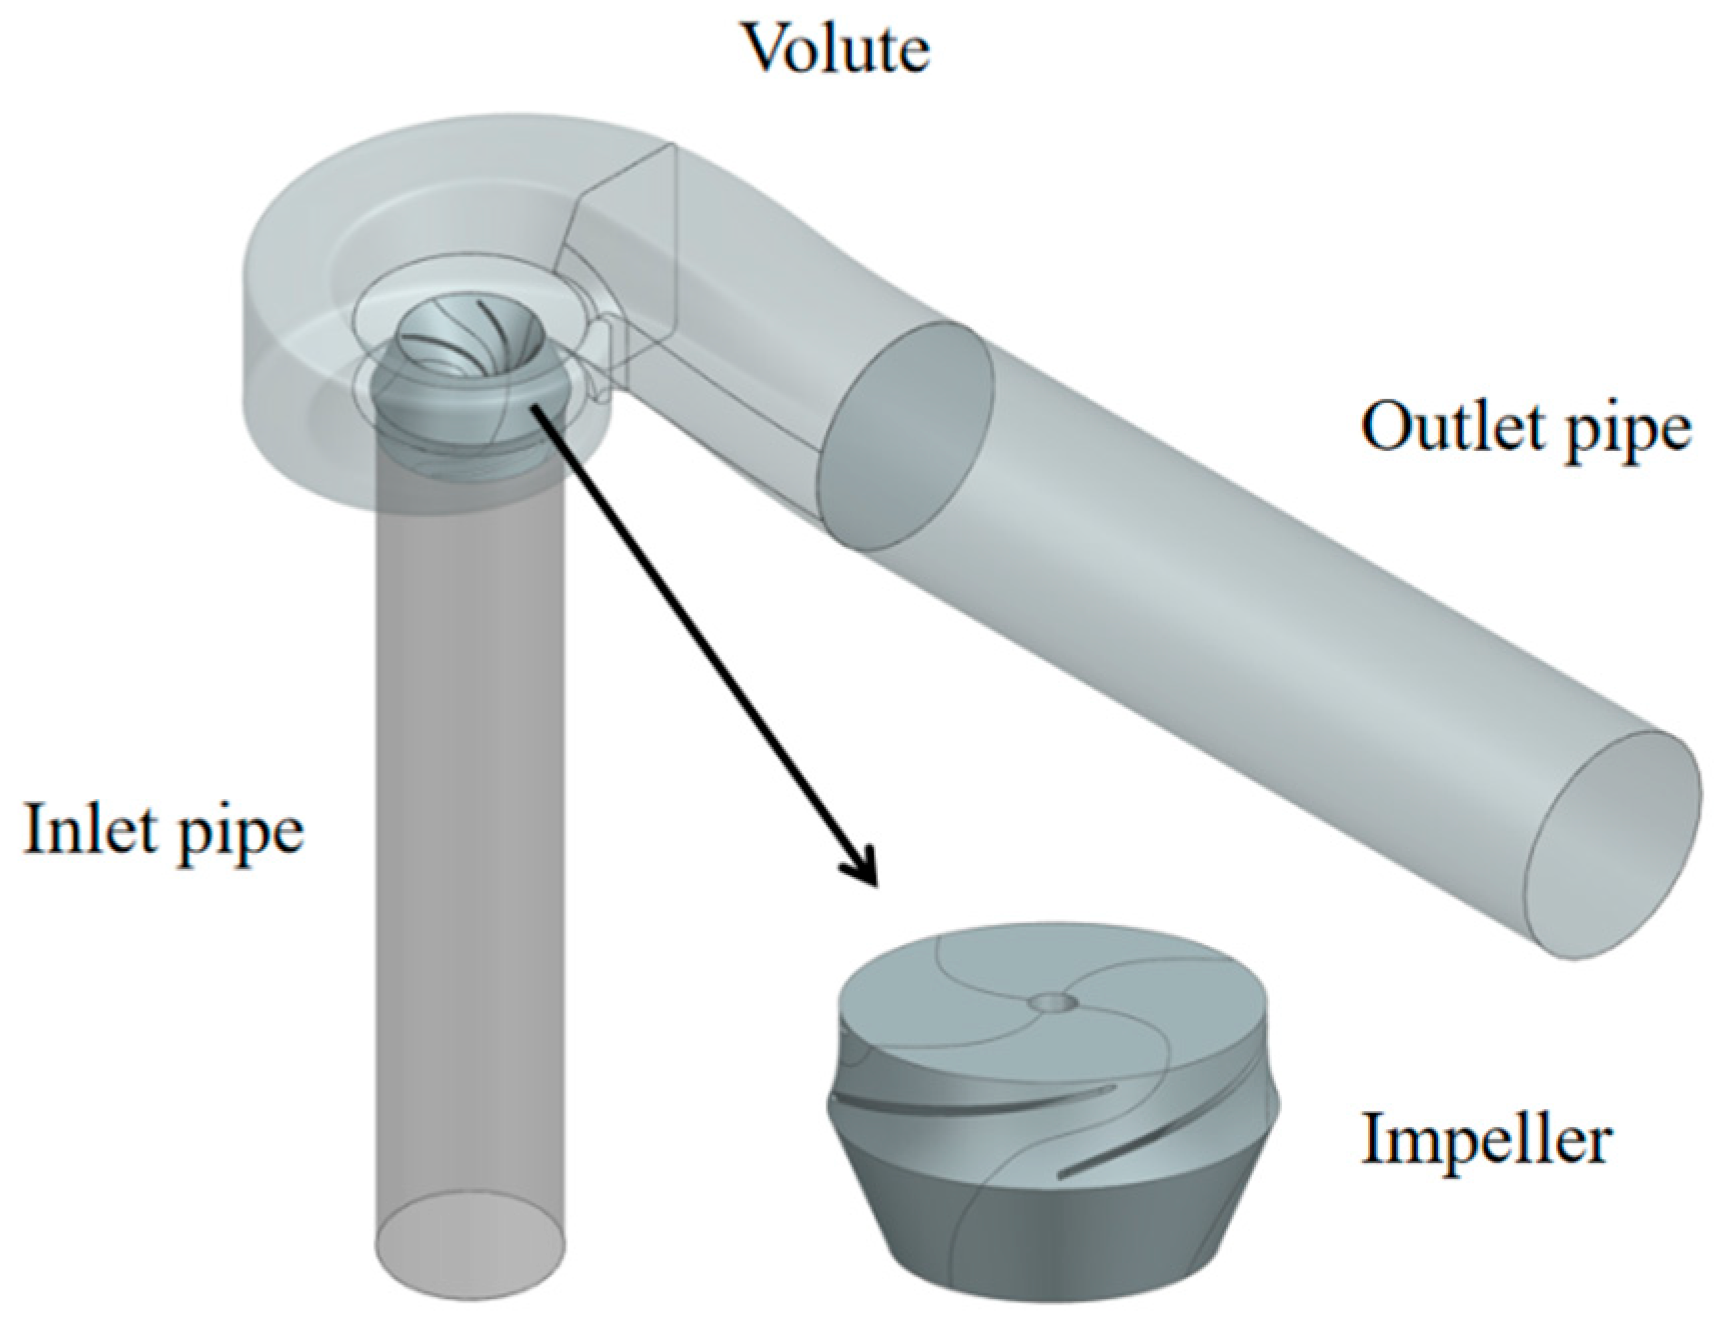
2.1. Three-Dimensional Pump Modeling

The scaled-down model of the seawater circulating pump in a nuclear power plant is selected as the research object. The main design performance parameters of this model pump are shown in the following Table 1.
The water body model of the model pump consists of the following four flow passage components: the impeller, the volute, the inlet section, and the outlet section. Three-dimensional modeling was carried out separately for each flow passage component of the model pump according to the above-mentioned main design performance parameters. The resulting model is shown in Figure 1.

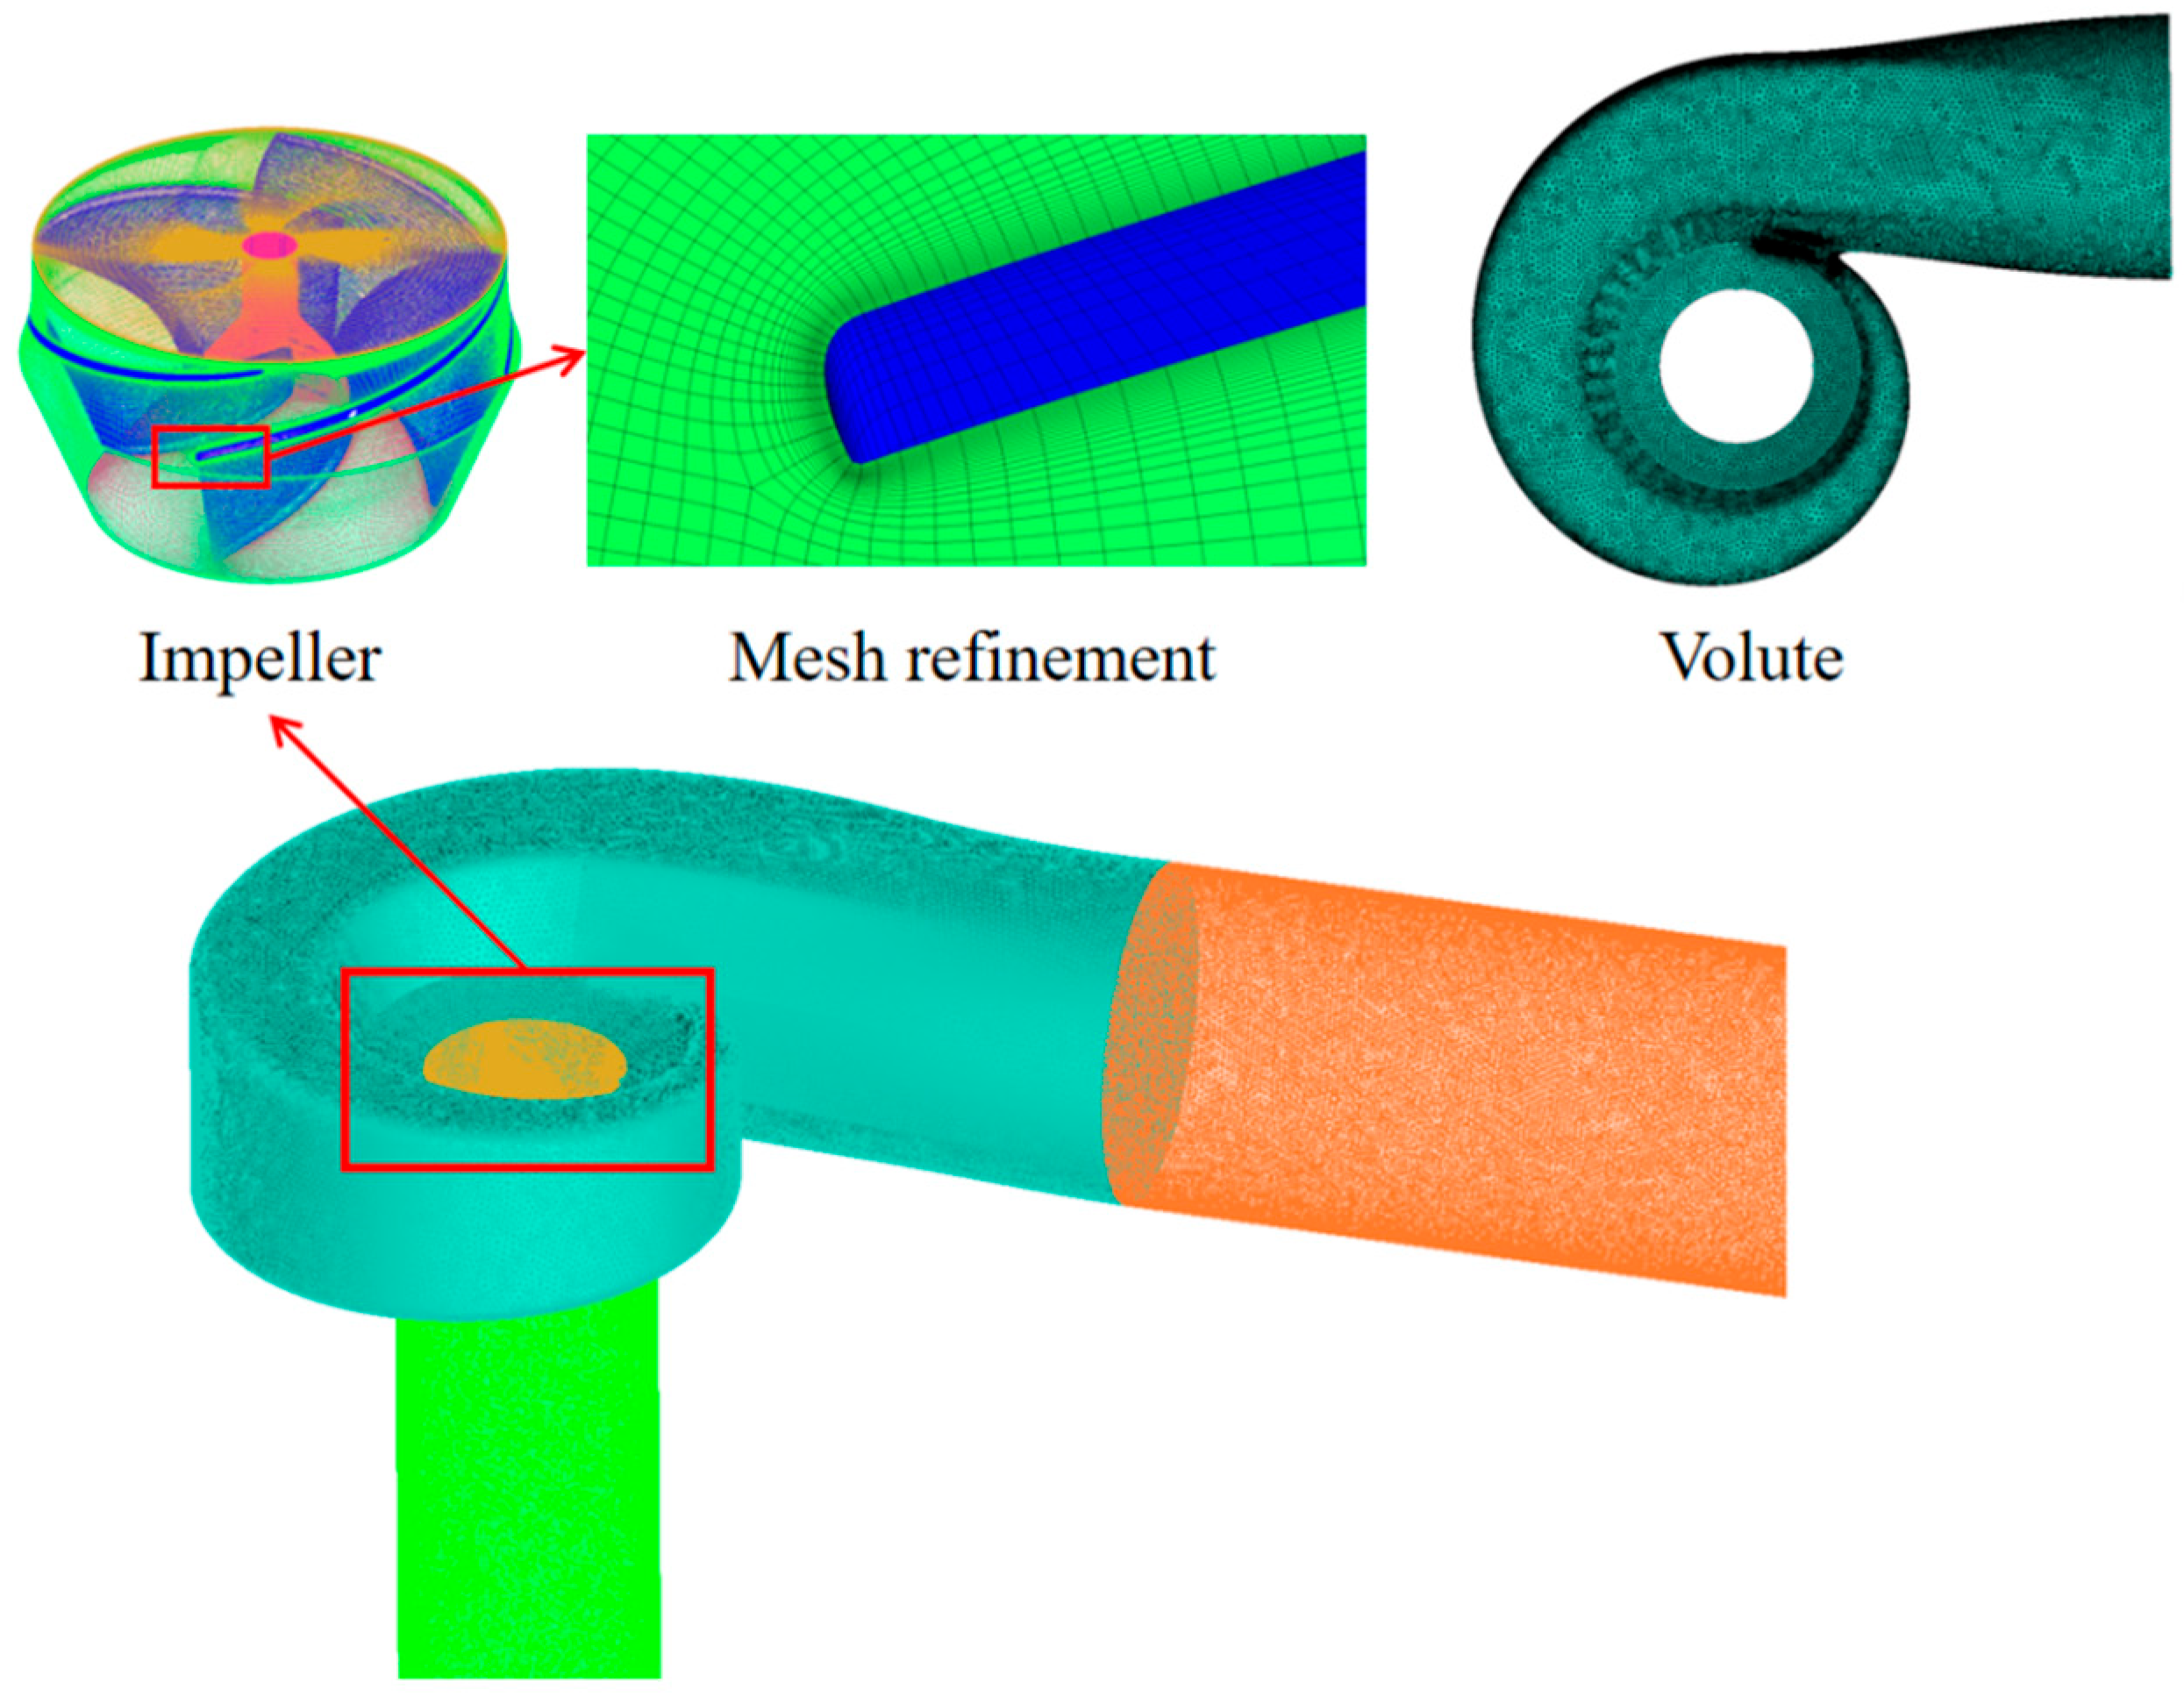
2.2. Mesh Generation

Ansys ICEM 2020R1 was employed to conduct mesh generation for the fluid domain of the pipeline pump. Local refinement was carried out for some complex flow regions, and boundary layers were added in the near-wall areas, as shown in Figure 2. Tetrahedral unstructured meshes were adopted for the inlet and outlet sections of the seawater circulating pump, and mesh optimization was performed near the main shaft and the rim walls. For the impeller section, hexahedral structured meshes were used, and mesh generation was completed in the TurboGrid 2020R1 software. Mesh layering and refinement were carried out near the blade surfaces to ensure good mesh quality near the walls.
Meshes serve as the carriers for simulation and analysis in numerical simulation calculations, and their quality and quantity directly affect the accuracy of Computational Fluid Dynamics (CFD) numerical simulation calculations. To reduce the impact of the number of meshes on the simulation results, mesh independence verification was conducted, and the results are shown in Figure 3. As can be seen from the figure that when the number of meshes is relatively small, there are certain errors in the calculation results, which affect the calculation accuracy. With the increase in the number of meshes, the calculation results gradually become stable. When the number of meshes reaches 2.78 million, the errors in the calculation results are relatively small and are basically maintained within 2%, which is within the allowable error range. Considering the computational efficiency of numerical simulation during the calculation process, in this paper, the number of computational meshes for the whole flow field in the numerical simulation calculation of the seawater circulating pump is determined to be 2.78 million.

2.3. Boundary Conditions

The internal flow of the seawater circulating pump was calculated based on ANSYS CFX. The impeller was defined as the rotating domain, while the inlet and outlet sections and the volute were defined as the stationary domains. The reference pressure was set to 0. The inlet boundary condition was set as the pressure inlet, and the outlet boundary condition was set as the mass flow outlet. All walls were set as no-slip smooth walls. Data transfer between the inlet section and the impeller, as well as between the impeller and the volute, was achieved by setting rotating–stationary interfaces. Data transfer between the volute and the outlet section was realized by setting stationary–stationary interfaces. The connection between meshes was implemented using a General Grid Interface (GGI). Steady-state calculations were adopted with a convergence accuracy of RMS = 10−4. The rotating–stationary interfaces in the steady-state calculations were set as Frozen Rotor. The SST k-ω model was used as the turbulence model, presented as follows:
D ρ k D t = x j Γ k k x j + G k Y k + S k
D ρ ω D t = x j Γ ω ω x j + G ω Y ω + S ω + D ω
where Γ , G k , Y, S ,   G ω , and D represent the effective diffusion coefficient, turbulent kinetic energy source term, dissipation equation source term, divergence term, user-defined source term, and orthogonal divergence term, respectively.

2.4. Entropy Production Theory

The entropy production theory originates from the second law of thermodynamics and represents the energy loss caused by all irreversible processes. During the operation of the seawater circulating pump, energy loss is inevitable. By using the entropy production theory to calculate the energy loss of the seawater circulating pump, the unstable flow regions within the pump can be determined, and at the same time, the magnitude of energy loss can be quantified. Given that the change in water temperature during the operation of the seawater circulating pump is extremely small, the entropy production caused by heat transfer can be ignored. Therefore, for this seawater circulating pump, only the viscous dissipation entropy production and the turbulent dissipation entropy production need to be considered.
The Reynolds-averaged method regards turbulent motion as a combination of time-averaged and instantaneous fluctuations. The instantaneous velocity consists of the time-averaged velocity u ¯ and the fluctuating velocity u . The entropy production rate caused by turbulent dissipation can also be written as two parts. The first one is the average term of the entropy production rate, and its calculation formula is as follows:
S p r o , D ¯ = μ T 2 u ¯ x 2 + v ¯ y 2 + w ¯ z 2 + v ¯ x + u ¯ y 2 + w ¯ x + u ¯ z 2 + v ¯ z + w ¯ y 2
The other one is the fluctuating term of the entropy production rate, and its calculation formula is as follows:
S p r o , D = μ e f f T 2 u x 2 + v y 2 + w z 2 + v x + u y 2 + w x + u z 2 + v z + w y 2
When using the Reynolds-averaged method to calculate the flow field, it is quite difficult to directly obtain the fluctuating velocity to determine the turbulent dissipation entropy production rate. Therefore, Kock and Herwig [18,25] established the correlation between the turbulence model and the fluctuating term of the entropy production rate. For the flow field simulation using the k-ω turbulence model, it can be calculated using the following formula (where β = 0.09, k represents the turbulent kinetic energy, and ω represents the turbulent vortex frequency):
S p r o , D = β ρ m k ω T
In order to improve accuracy when calculating the entropy production rate near the wall, the following formula is often used in general research to calculate the viscous dissipation entropy production caused by wall shear stress:
S p r o , W = τ w v w T
In the formula, τ w represents wall shear stress, and v w represents the velocity of the first layer of mesh near the wall. Each item of entropy production is obtained by integrating the local entropy production rate, and the formula is as follows:
Δ S p r o , D ¯ = V S p r o , D ¯ d V
Δ S p r o , D = V S p r o , D d V
Δ S p r o , W = A S p r o , W d A
The total entropy production of the whole computational domain Δ S can be obtained by calculating the sum of the average entropy production of turbulent dissipation Δ S p r o , D ¯ , the fluctuating entropy production of turbulent dissipation Δ S p r o , D , and the viscous dissipation entropy production Δ S p r o , W , and the formula is as follows:
Δ S = Δ S p r o , D ¯ + Δ S p r o , D + Δ S p r o , W
In the formula, the subscript V of the integral represents the region of volume integration; dV represents the integral variable; the subscript A of the integral represents the region of area integration; and dA represents the integral variable.

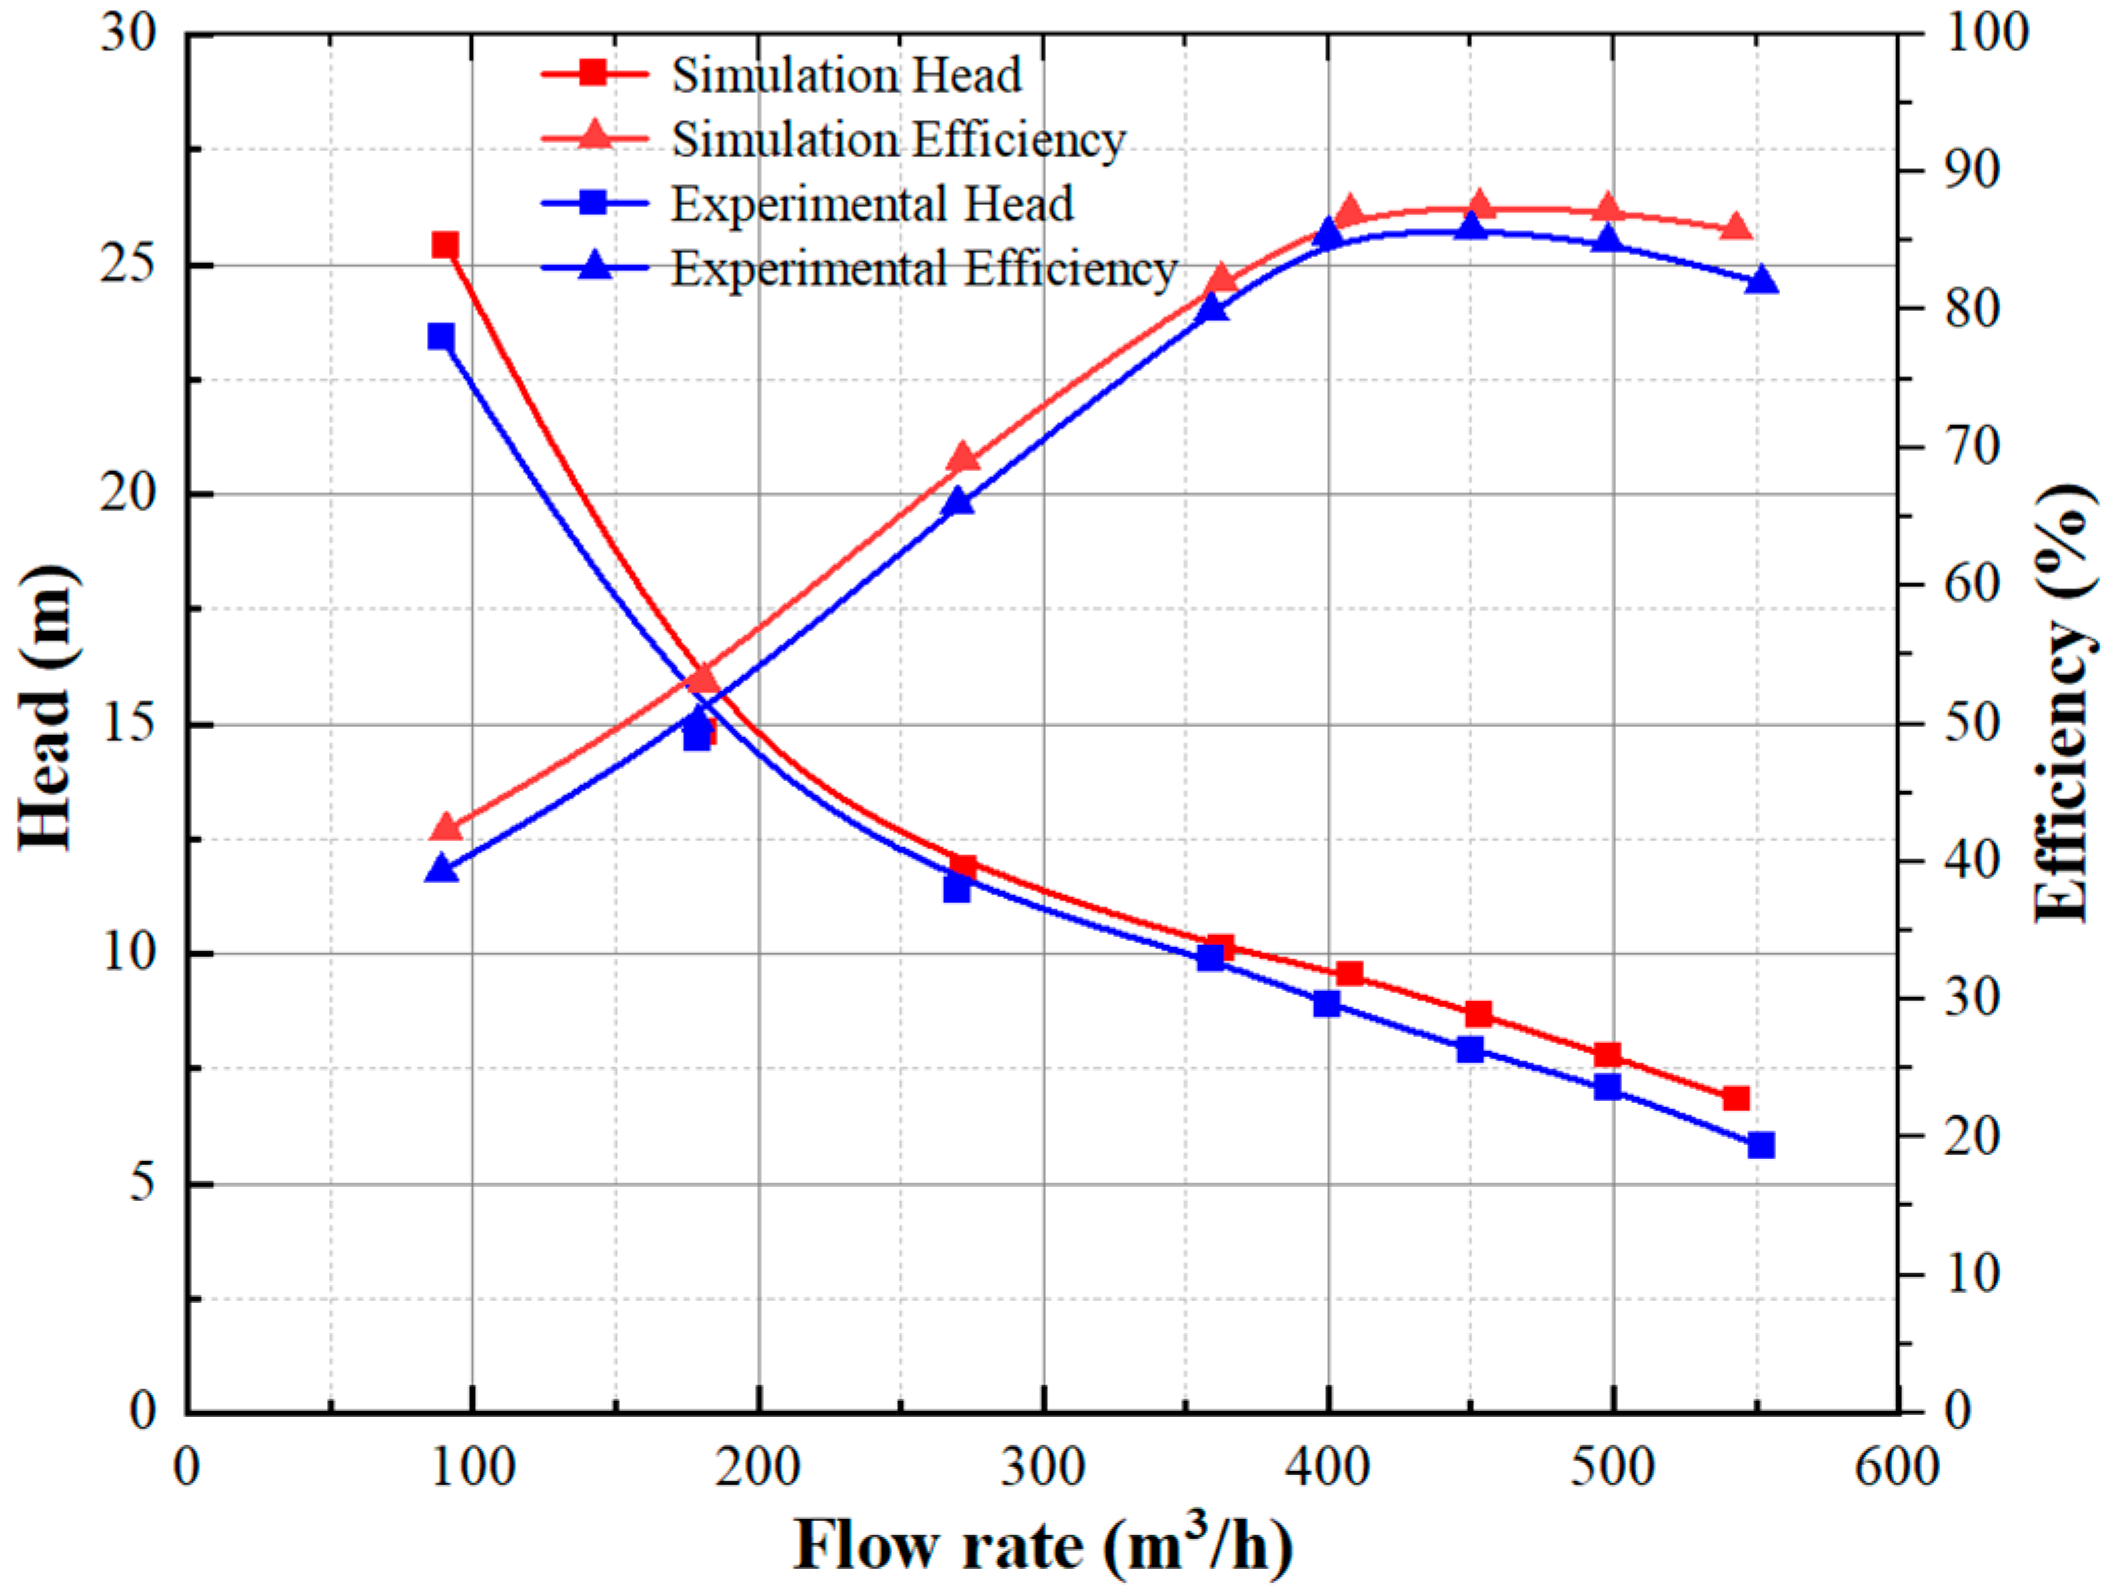
2.5. Experimental Verification

To verify the accuracy of the calculation results, a test platform for the model pump of the seawater circulating pump was set up. The described test apparatus is a closed-loop structure, which includes a model pump, a pressure stabilizing tank, an electromagnetic flowmeter, a pressure gauge, pipelines, and valves. Figure 4 shows the design drawing and the on-site layout drawing of the test platform for the model pump of the seawater circulating pump.
Exhaust valves are installed at the inlet and outlet pipelines of the surge tank and the pump. Before the start of the test, all excess gas in the pipelines and the surge tank need to be removed to ensure that the initial inlet condition of the pump is at standard atmospheric pressure. During the test, the inlet pressure of the test pump is changed by controlling Valve 1, and the outlet pressure and flow rate of the test pump are changed by controlling Valve 2. Pressure Transmitter 1 is responsible for measuring the inlet pressure of the test pump, and Pressure Transmitter 2 is responsible for measuring the outlet pressure of the test pump. The flow rate through the test pump is measured using an electromagnetic flowmeter. The specific parameters of each measuring instrument are shown in Table 2.
An external characteristic test of the seawater circulating pump was carried out on the test bench. The test started from the maximum flow rate. Valves 1 and 2 were opened to the maximum, and the fluid flowed from the inlet to the outlet of the pump. After the flow within the system became stable, the data were recorded. Subsequently, Valve 2 was gradually closed to reduce the flow rate, and the above experimental steps were repeated. When testing different flow rate working conditions, each group of flow rate working conditions was tested three times, and the average values of the head and efficiency obtained under each group of flow rate working conditions were taken to draw the performance curve of the seawater circulating pump.
The external characteristic curve was plotted based on the test data of the seawater circulating pump. The external characteristic results obtained from numerical simulation were compared with those obtained from the tests, and the comparison results are shown in Figure 5. It can be seen from the external characteristic curve that the numerical simulation results have the same changing trend as the relevant test data. As the flow rate increases, the head of the seawater circulating pump gradually decreases, and the efficiency reaches the highest efficiency point when Q = 453 m3/h. The characteristics of the performance curve are stable within the entire flow range. The overall error between the numerical simulation and test results does not exceed 5%, which conforms to the actual engineering situation, indicating that this numerical simulation method is feasible.

3. Results and Discussion

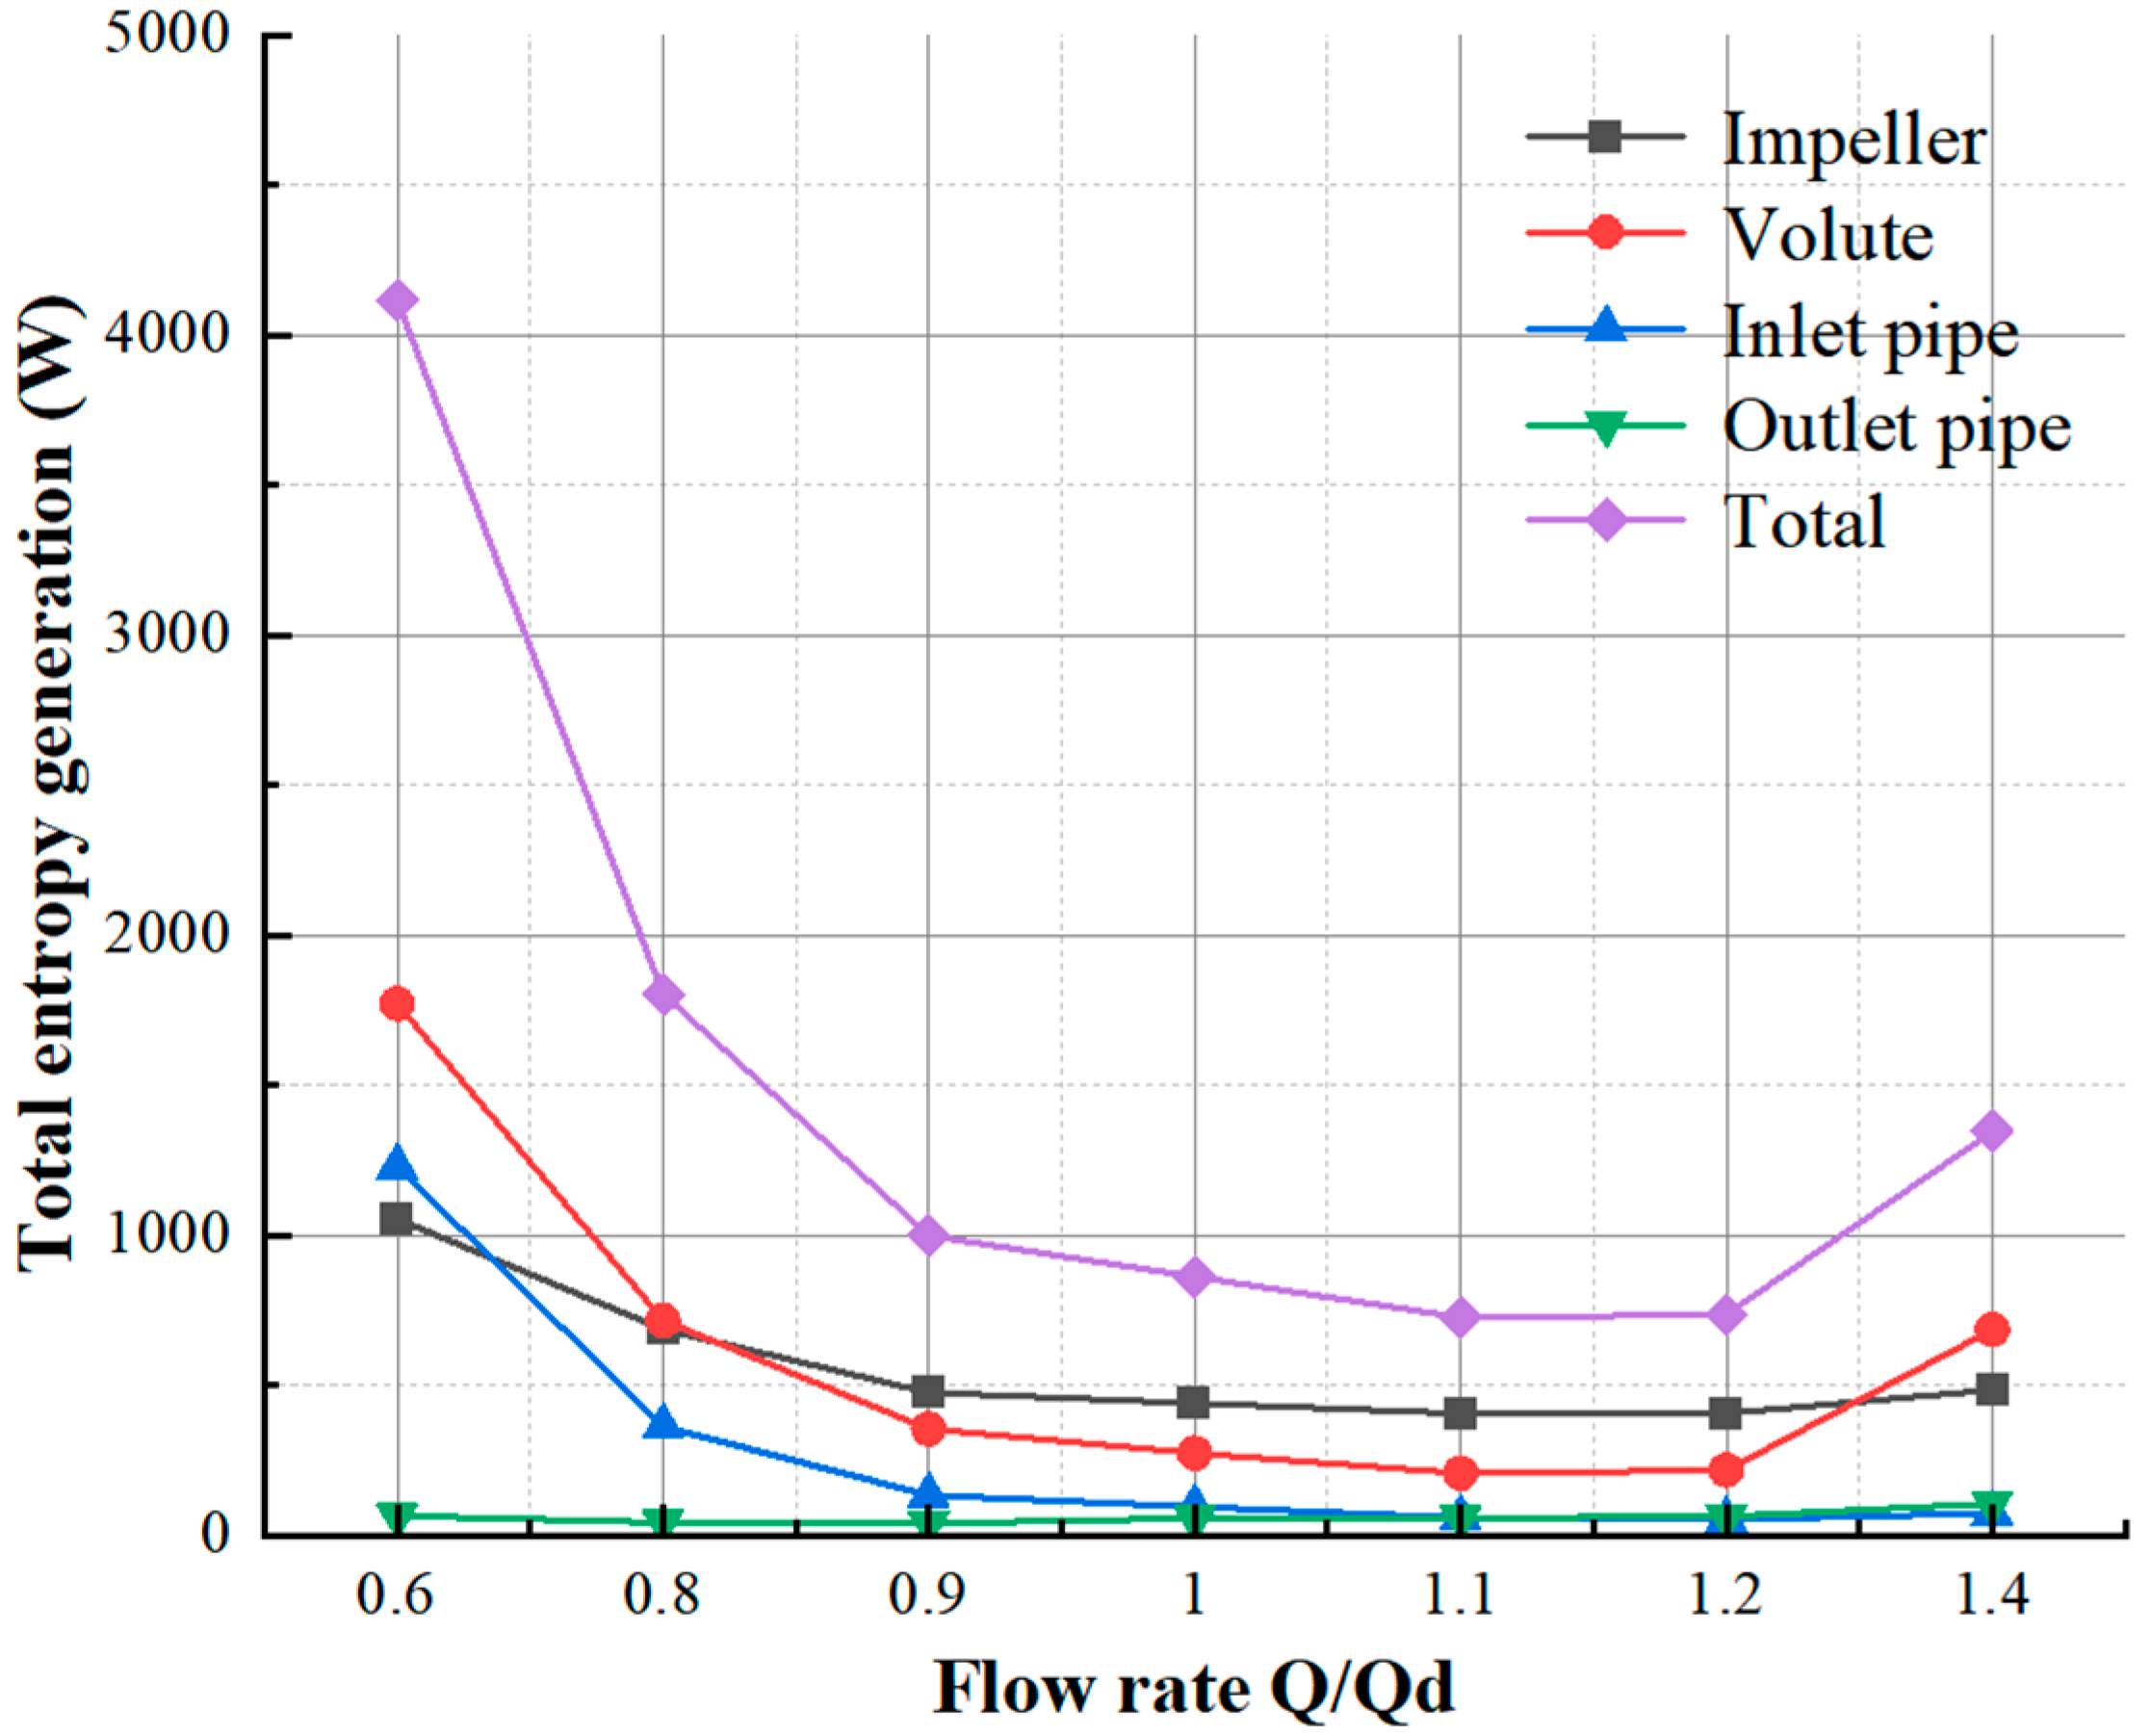
3.1. Analysis of Entropy Production Variation with Flow Rate

The calculation results of the entropy production of each flow passage component and the total entropy production of the seawater circulating pump under different working conditions are shown in Figure 6. As the flow rate increases, the total entropy production of the seawater circulating pump first gradually decreases and then gradually increases. Near the design point working condition (approximately 1.1 Q), the total entropy production drops to the lowest point, and the total entropy production of the seawater circulating pump under the design working condition is 724 W. When deviating from the design condition, the total entropy production increases significantly and can reach 4114 W at the low flow rate working condition (0.6 Q). When the flow rate is near the design working condition (0.9 Q–1.2 Q), the entropy production value of the impeller does not change much and fluctuates around 430 W. When deviating from the design working condition, the entropy production of the impeller increases accordingly, which is consistent with the variation law of the total entropy production of the seawater circulating pump. When the flow rate is near the design working condition (0.9 Q–1.2 Q), the entropy production value of the volute will change slightly, with the variation range being between 205 W and 352 W. When deviating from the design working condition, the entropy production of the volute increases significantly, which is consistent with the variation law of the total entropy production of the seawater circulating pump, and exceeds the entropy production of the impeller at the working conditions of 0.8 Q and 1.4 Q. The entropy production value of the inlet section shows a monotonically decreasing trend under different working conditions. The entropy production is as high as 1228 W at the low flow rate working condition (0.6 Q). As the flow rate increases, the entropy production of the inlet section also gradually decreases. At the high flow rate working condition (1.4 Q), the entropy production of the outlet section is only 51 W. The entropy production of the inlet section always remains at a relatively low level under different working conditions and fluctuates between 38 W and 105 W.

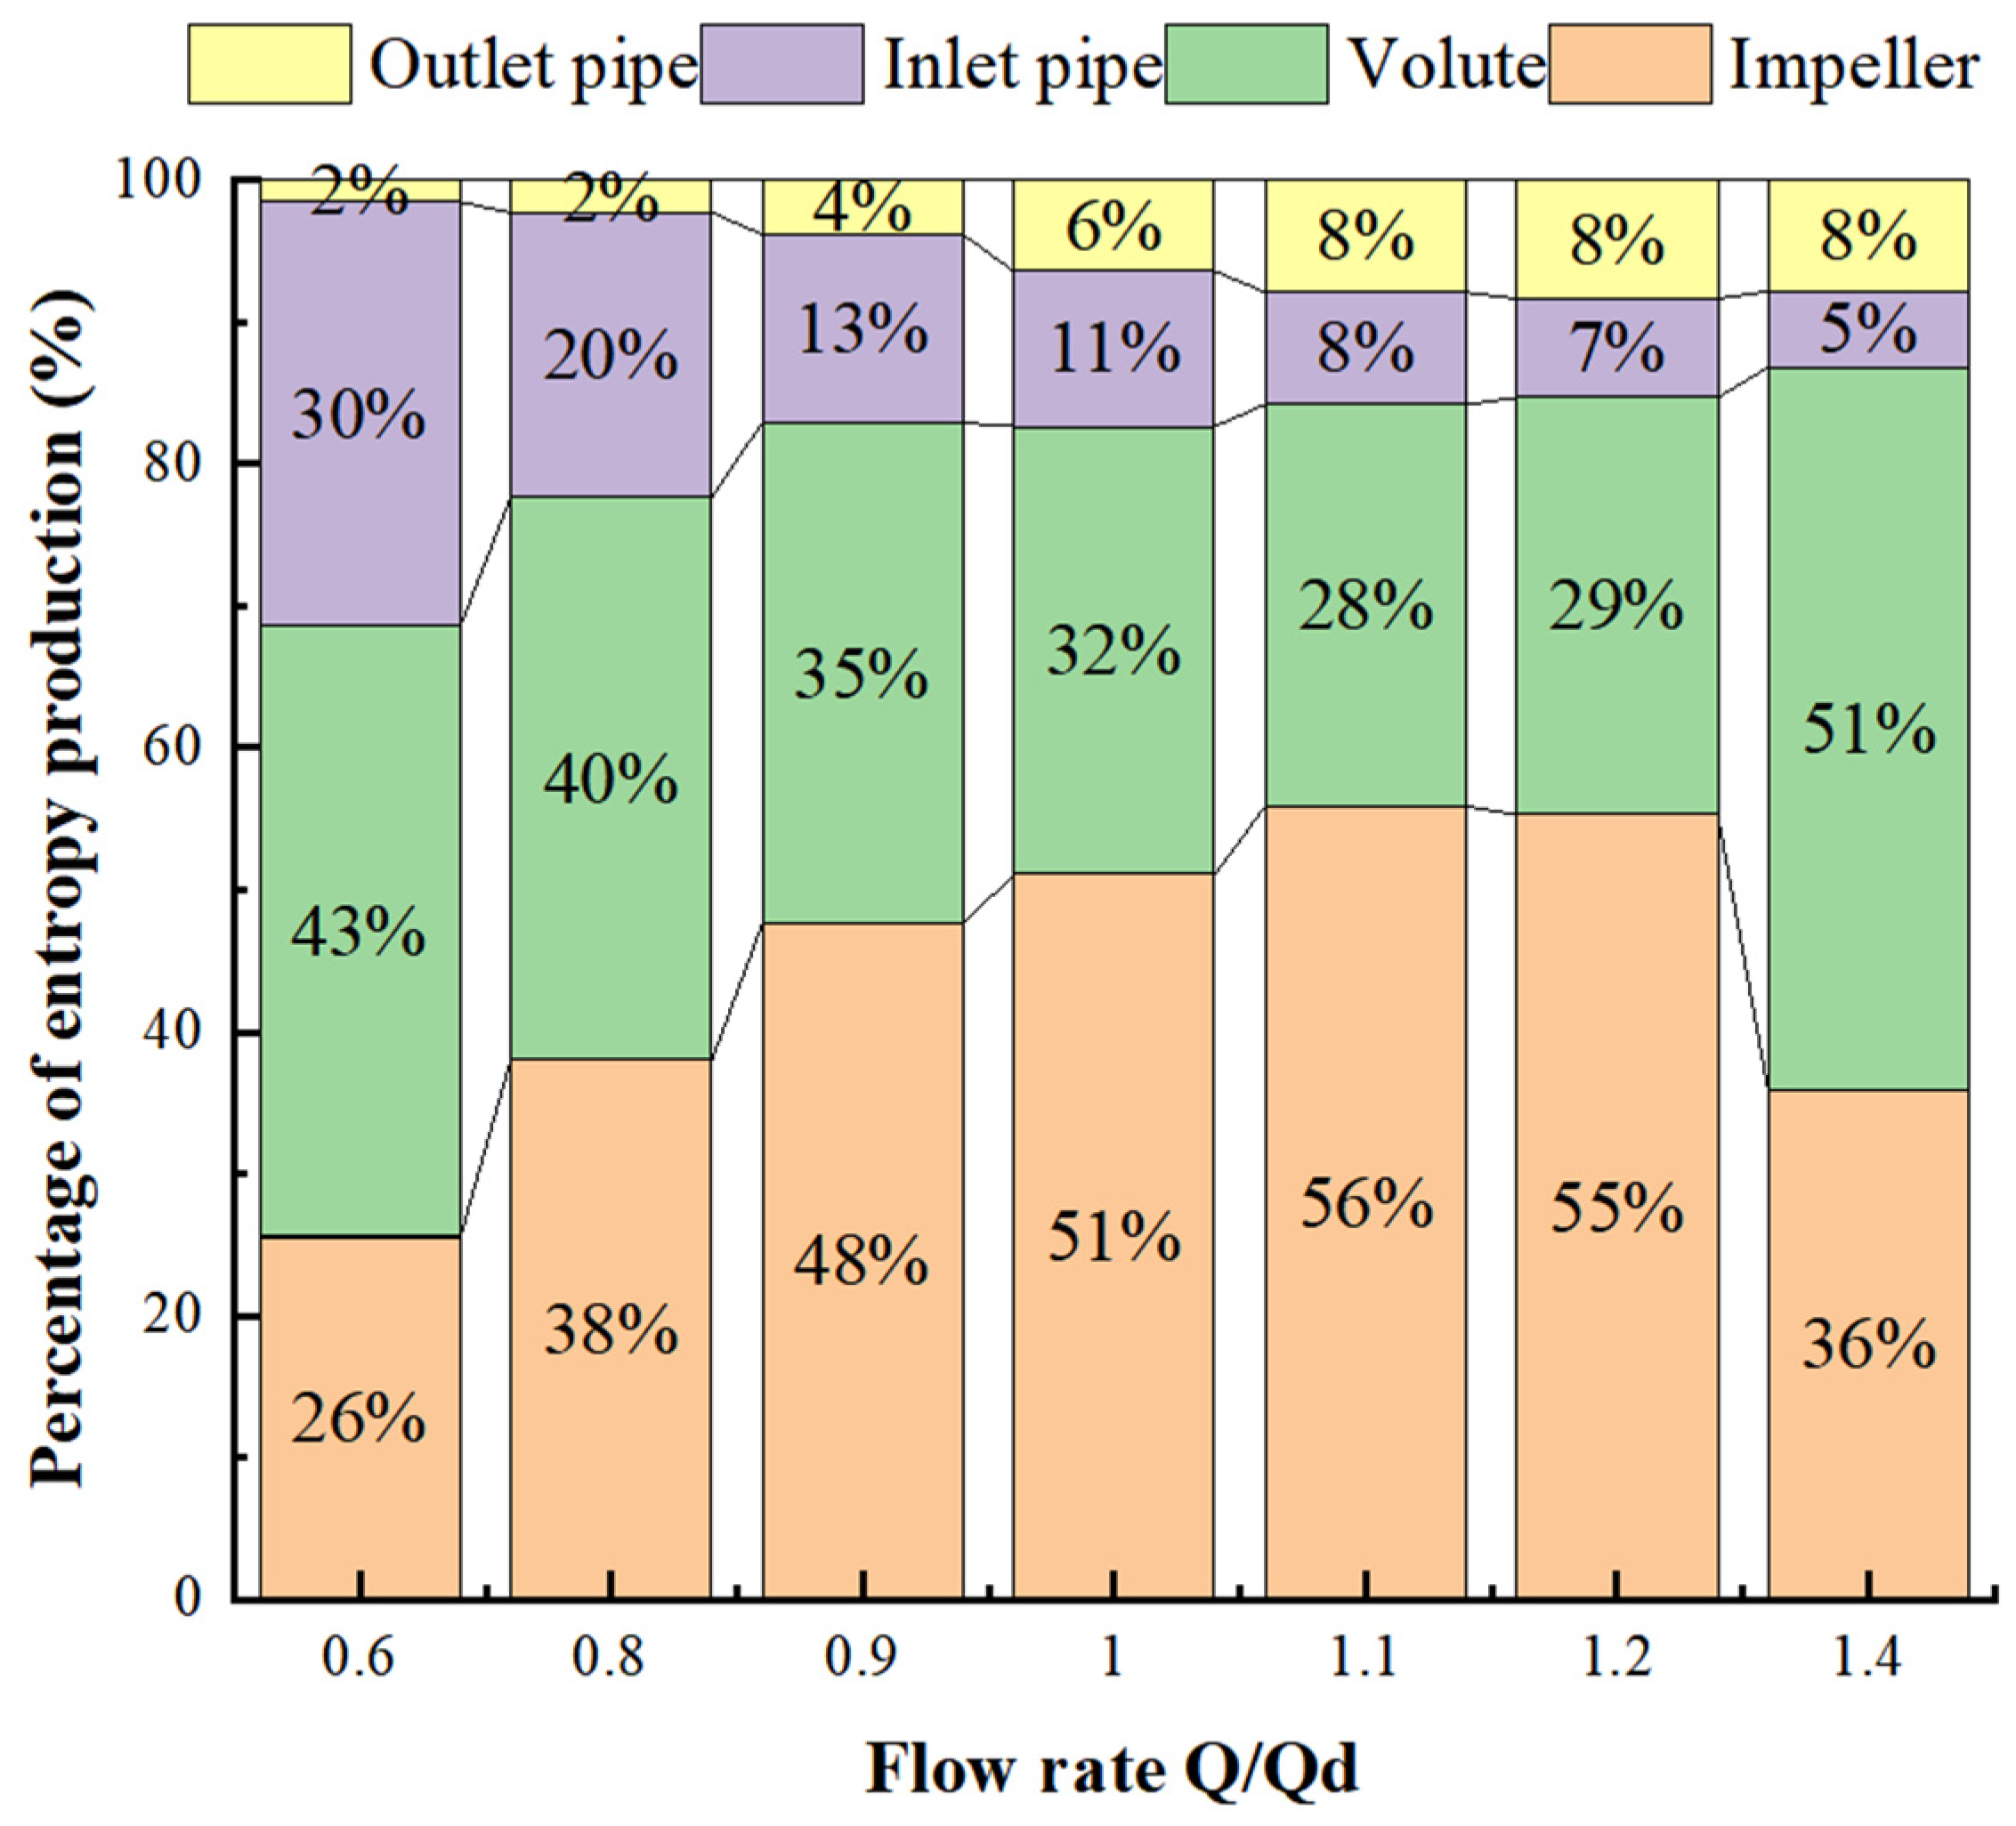
3.2. Entropy Production Proportion of Different Flow Passage Components

To further study the energy losses caused by different flow passage components during the flow process and to conduct a specific analysis on the flow passage component with the largest energy loss, a comparison was made regarding the total entropy production generated by the inlet section, impeller, volute, and outlet section under the design working condition. The proportion of entropy production generated by each flow passage component is shown in Figure 7.
It can be seen from the figure that the proportion of the entropy production of the impeller first increases and then decreases as the flow rate increases. Near the working condition point (1.1 Q), the proportion of the entropy production of the impeller reaches the maximum value, accounting for 56%. When the flow rate deviates from the design working condition, the proportion of the entropy production of the impeller gradually decreases and drops to 26% at 0.6 Q. On the contrary, the proportion of the entropy production of the volute first decreases and then increases as the flow rate increases. Near the working condition point (1.1 Q), the proportion of the entropy production of the volute reaches the minimum value, accounting for 28%. When the flow rate deviates from the design working condition, the proportion of the entropy production of the volute gradually increases and rises to 51% at 1.4 Q. The proportion of the entropy production of the inlet section gradually decreases as the flow rate increases. Under the low flow rate working condition, the proportion of the entropy production of the inlet section is the largest, accounting for 30%, and then it gradually decreases. When the flow rate reaches 1.4 Q, the proportion of the entropy production is only 5%. The proportion of the entropy production of the outlet section has never fluctuated much with the change in the flow rate, and it is always below 10%. The sum of the proportions of the entropy production of the impeller and the volute is generally above 80%. It can be seen from this that the entropy production of the seawater circulating pump during the operation process is mainly concentrated in the impeller and the volute parts. The losses of the impeller and the volute are the main reasons for the hydraulic losses of the seawater circulating pump. Therefore, the following section will present a specific analysis on the internal flow situations of the impeller and the volute.

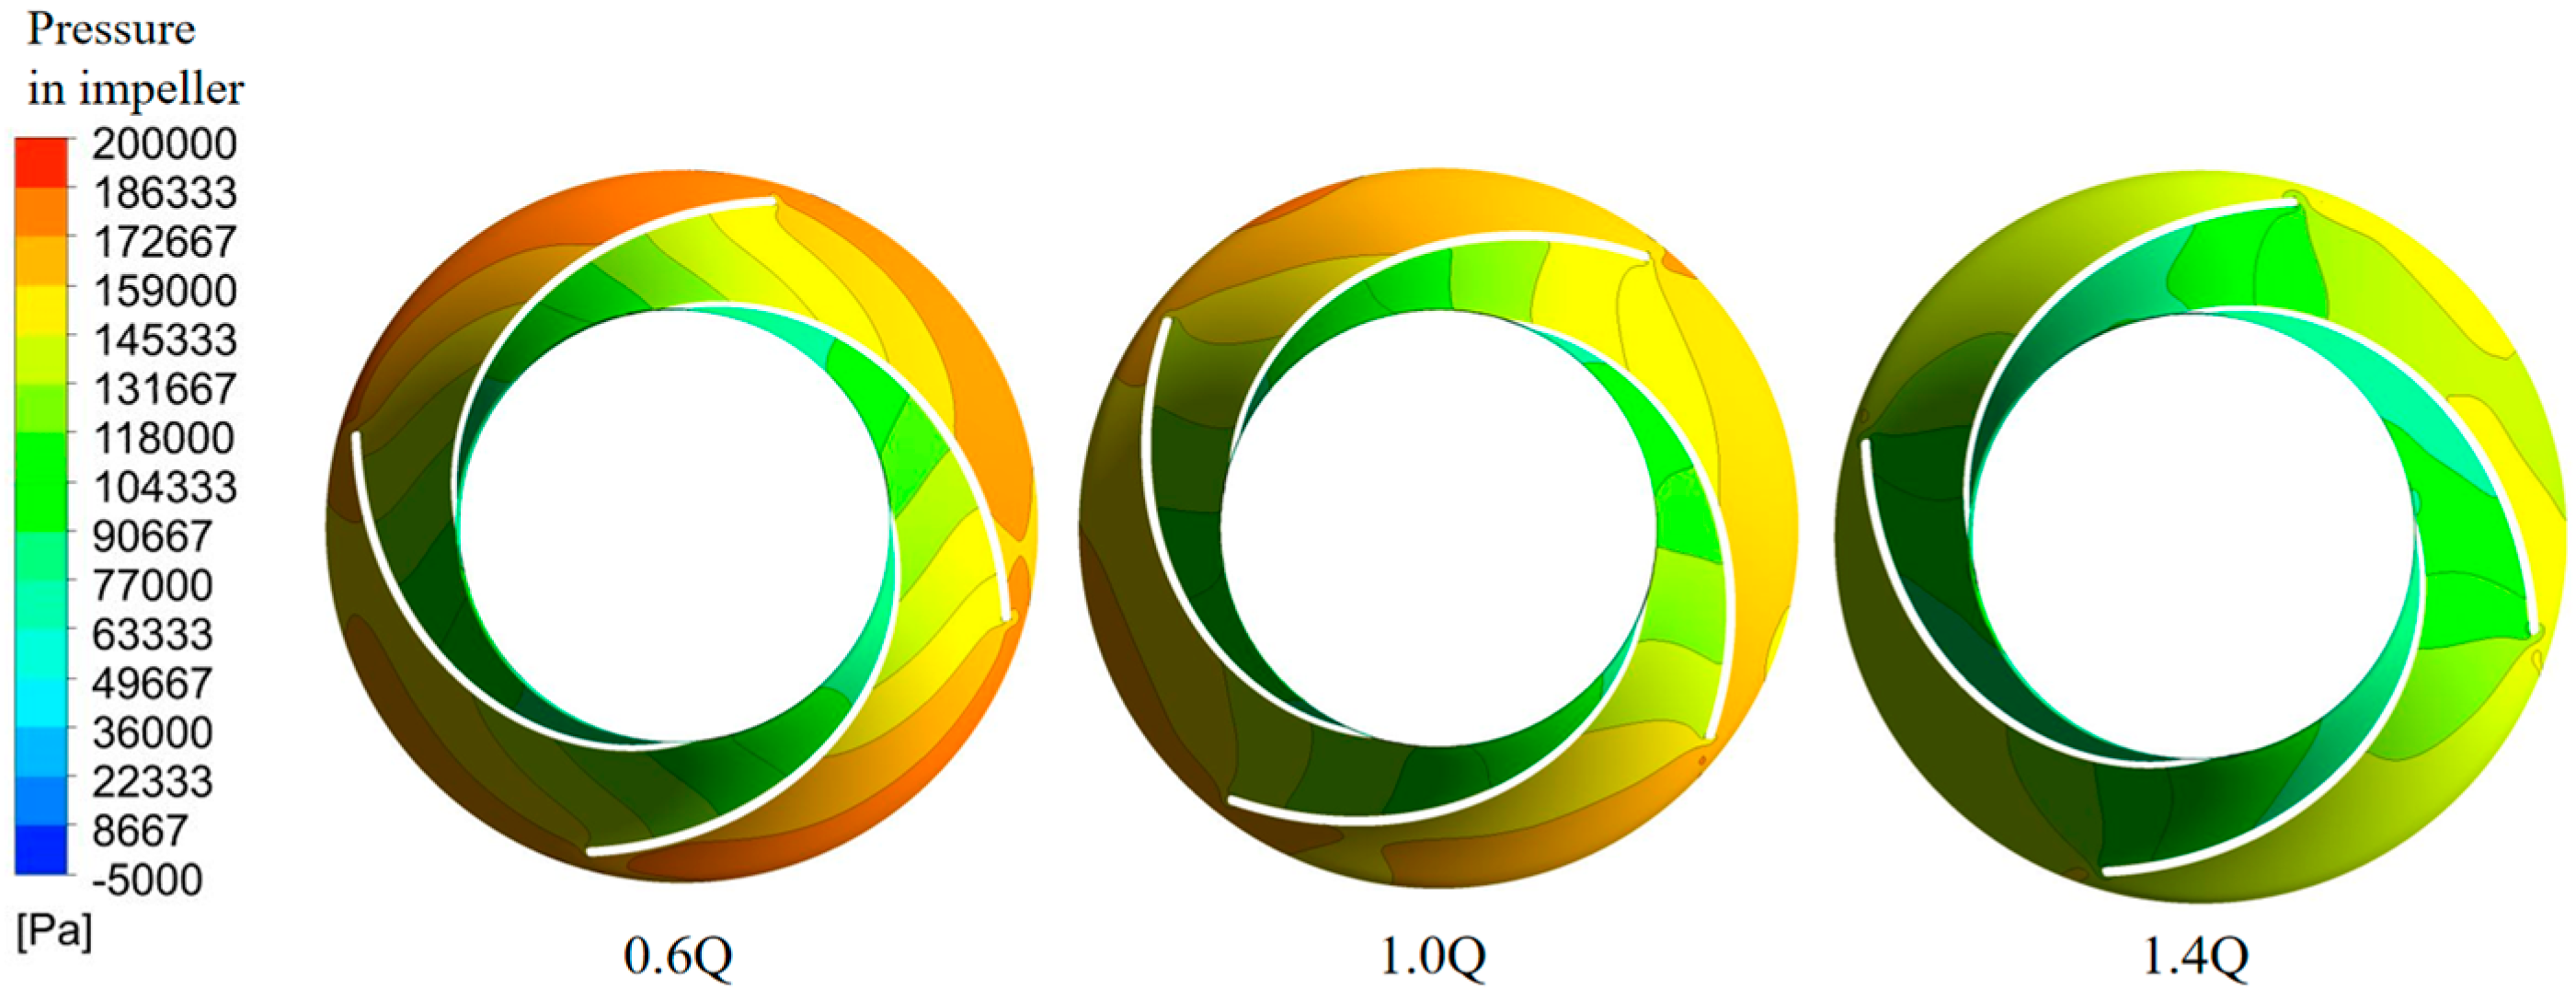
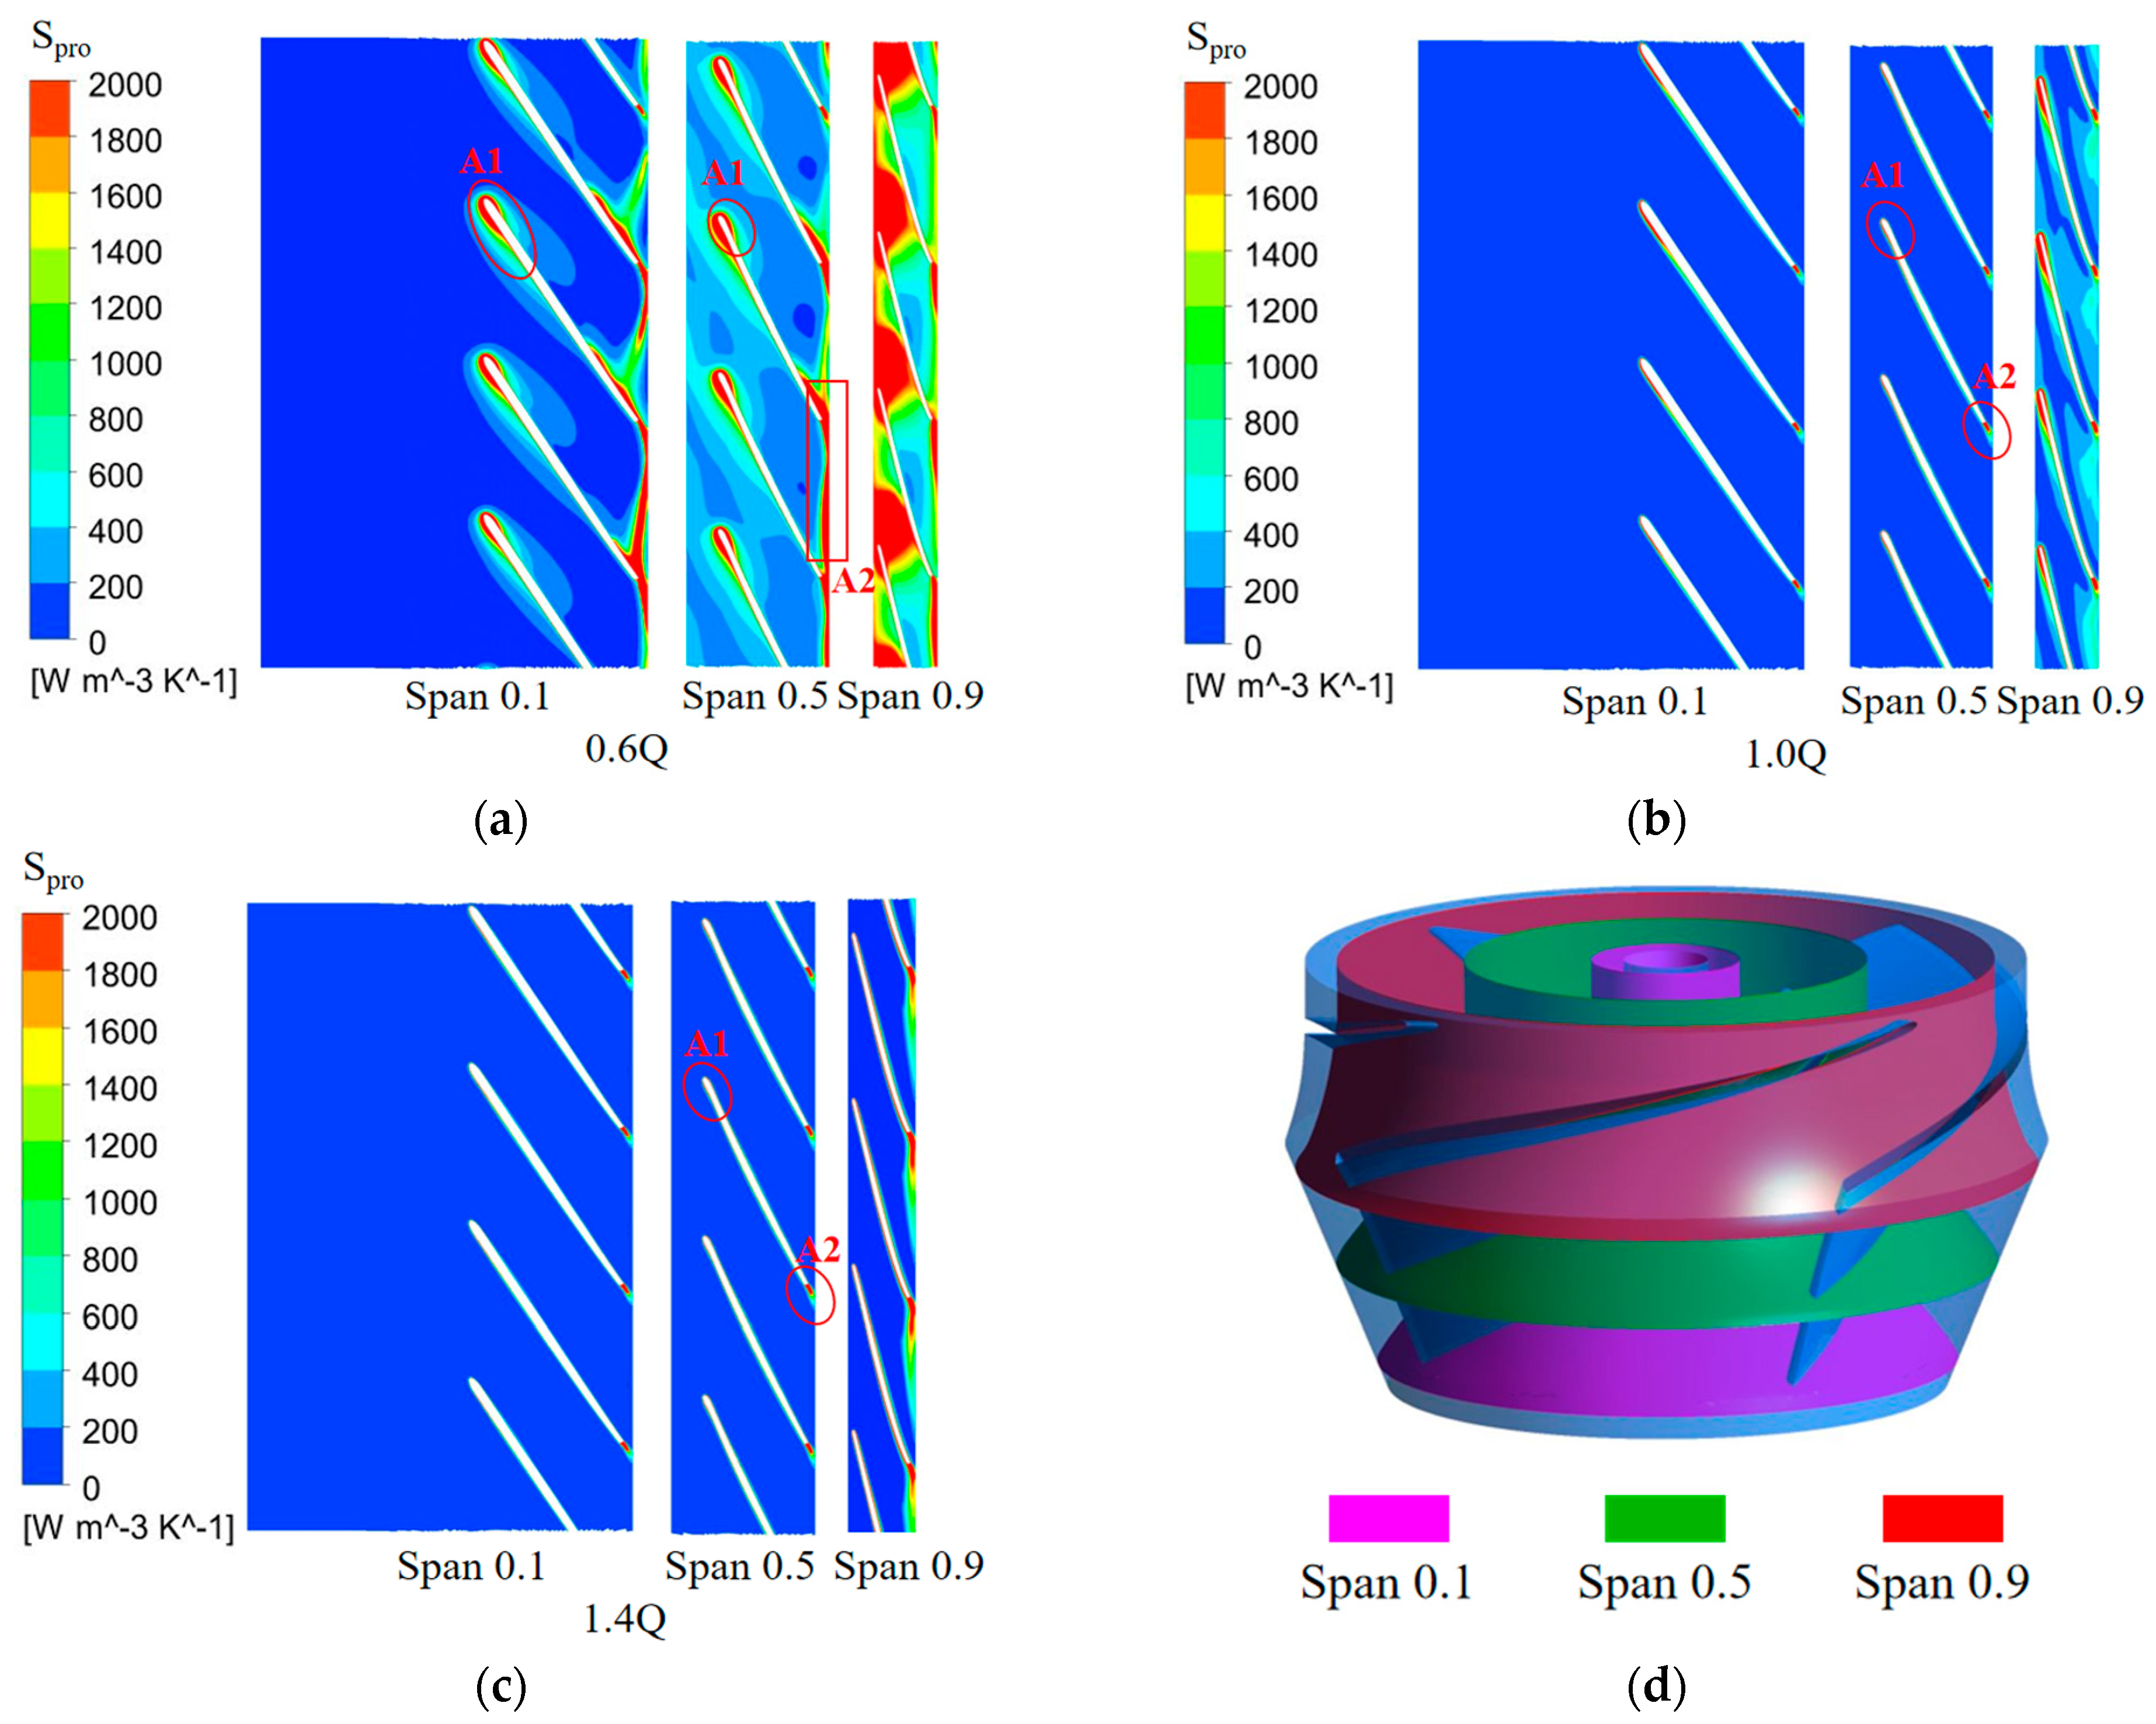
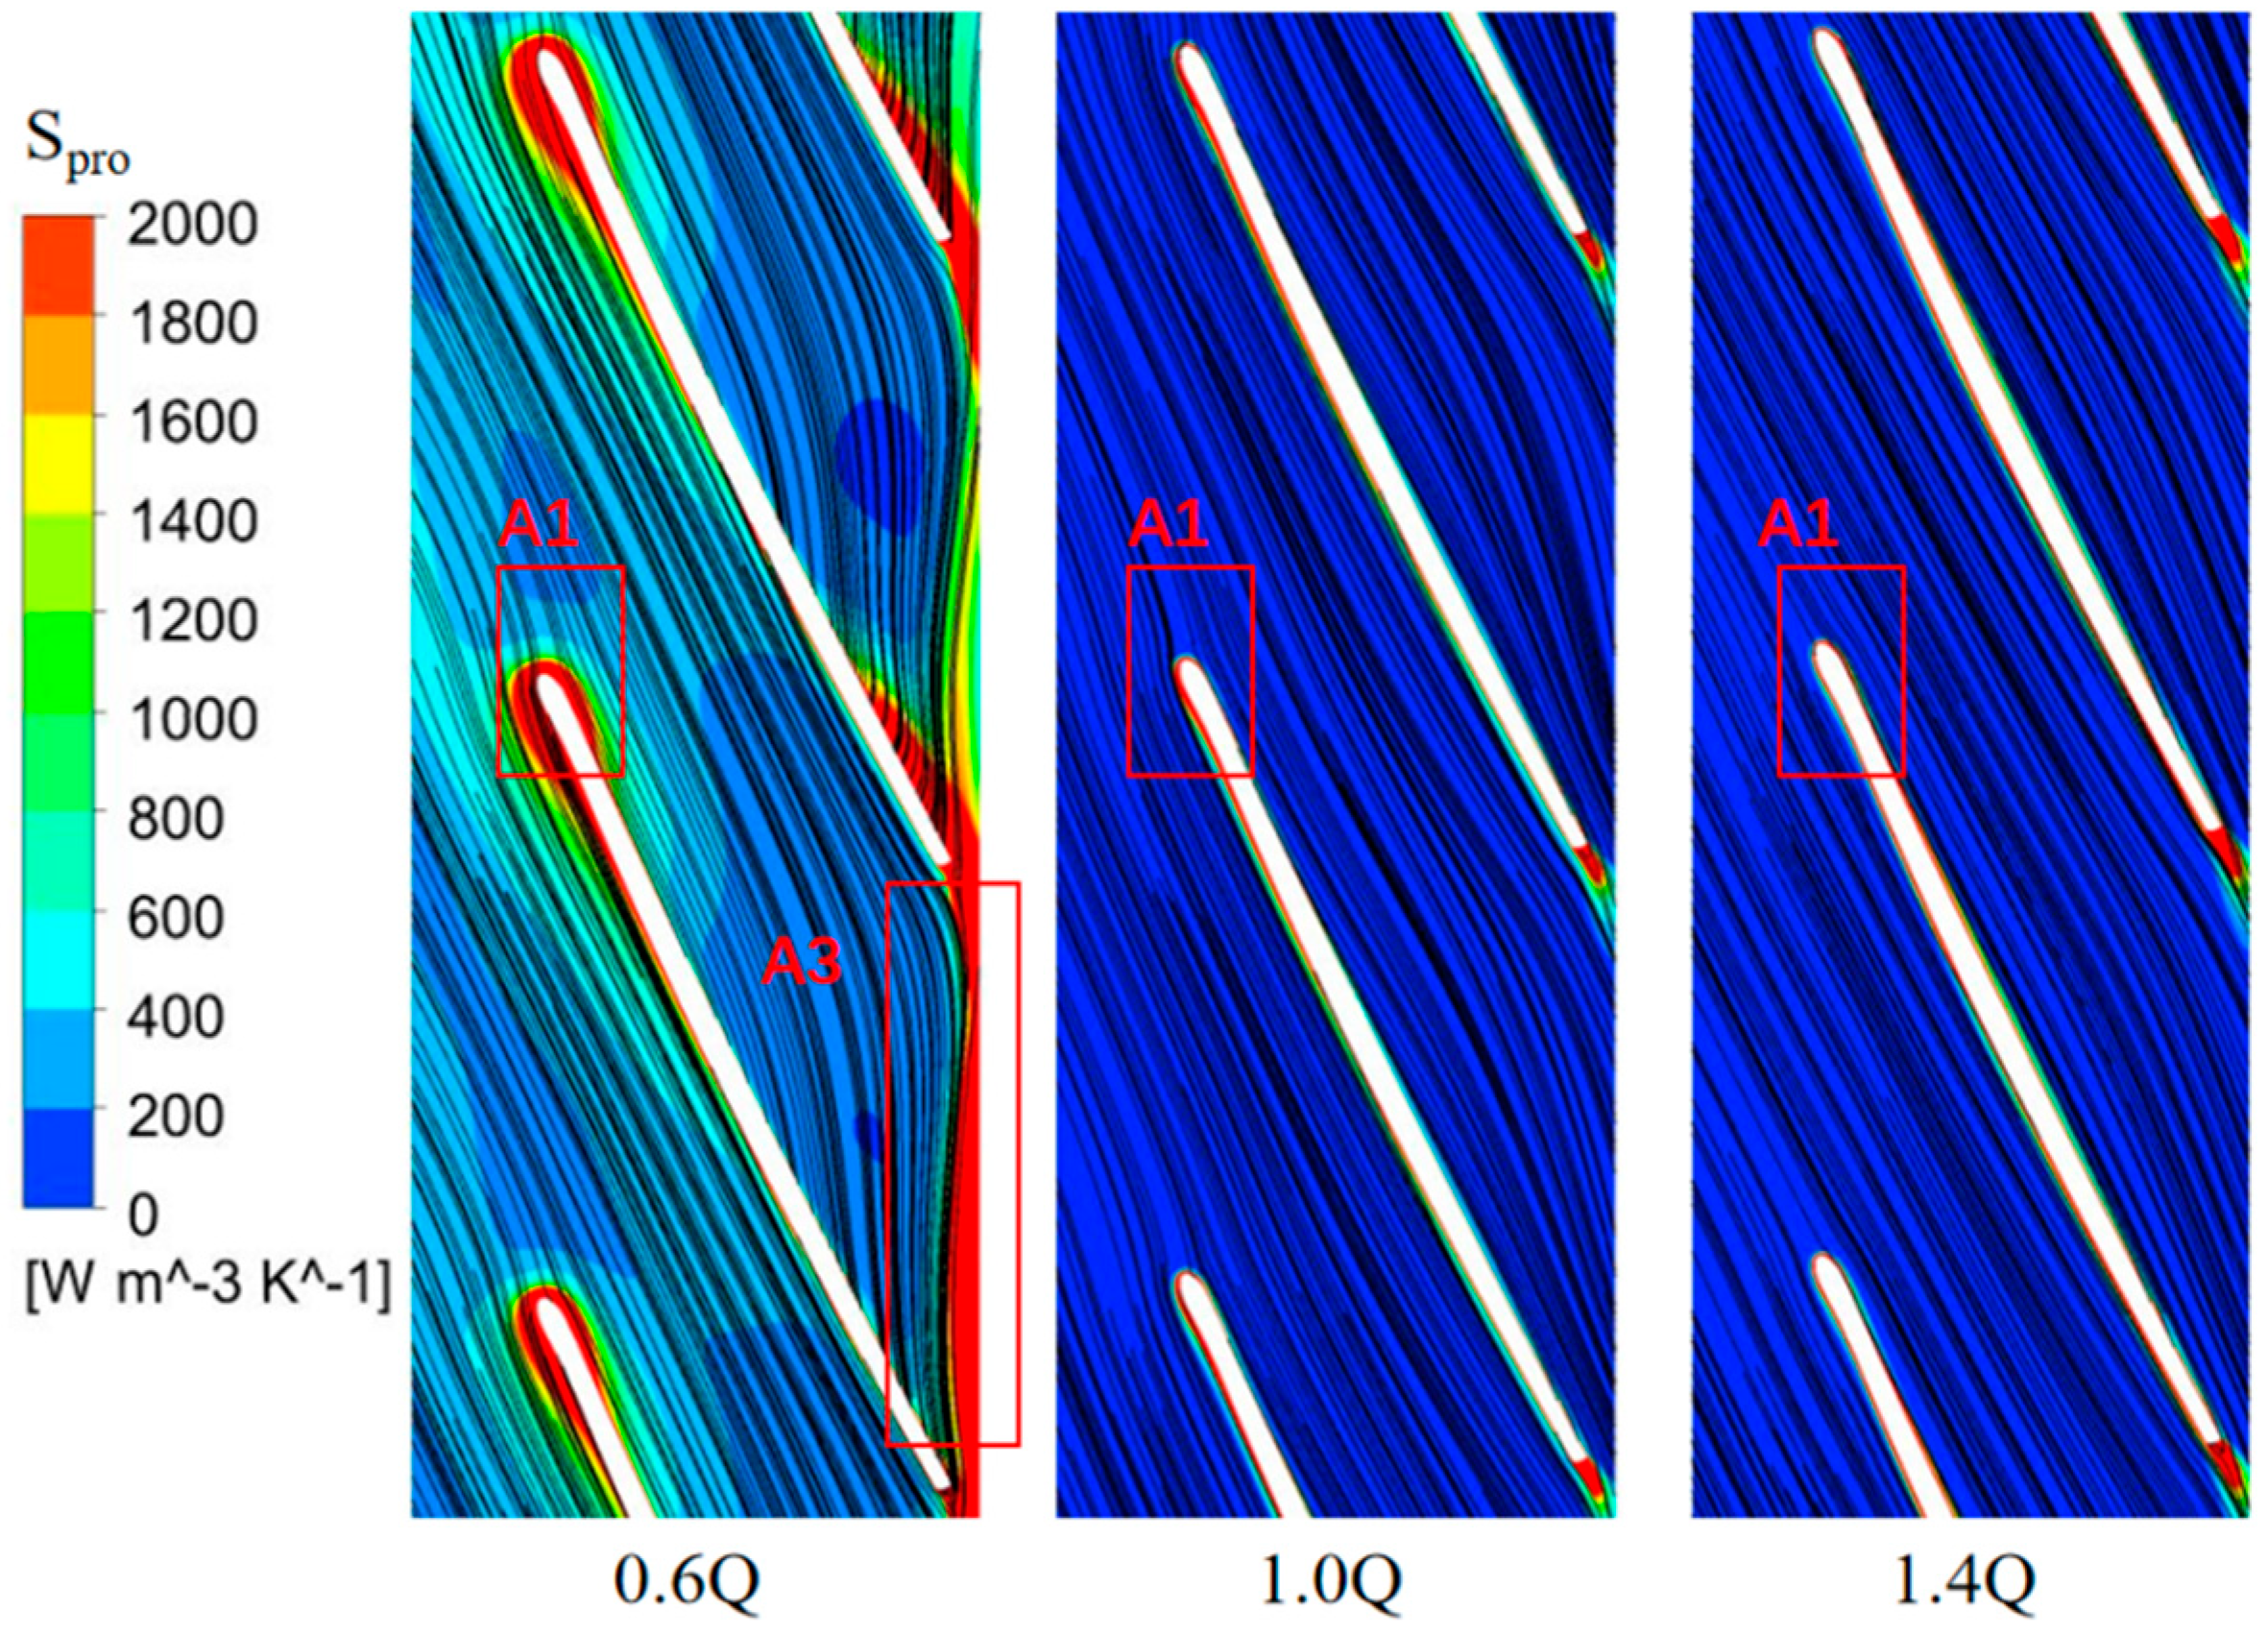
3.3. Analysis of Internal Flow and Entropy Production in Impeller

To further analyze the internal flow characteristics of the seawater circulating pump, the pressure nephograms inside the impeller of the seawater circulating pump under different working conditions were intercepted, and the results are shown in Figure 8. Under the design working condition point (1.0 Q), taking the center of the impeller of the seawater circulating pump as the origin, the pressure gradually increases along the radial direction and is distributed relatively evenly, reaching the extreme value at the edge of the impeller. Meanwhile, a small non-uniformly distributed high-pressure region appears at the outer diameter of the impeller, which may be caused by the mismatch between the impeller and the volute, resulting in adverse phenomena such as fluid impact and backflow, and increasing the energy loss. The pressure on the pressure side of the blade is significantly lower than that on the suction side because the blade exerts a pressure effect on the fluid during the rotation process, causing the static pressure of the fluid near the pressure side to increase. Under the low flow rate working condition (0.6 Q), the pressure variation rule is similar to that under the design working condition, showing a uniform increasing trend along the radial direction. However, compared with the design working condition, the maximum internal pressure of the impeller under the low flow rate condition is significantly increased. On the contrary, under the high flow rate working condition, although the pressure also shows a uniform increasing trend along the radial direction, the maximum internal pressure is significantly decreased.
Through the quantitative analysis in the previous section, it was determined that during the operation of the seawater circulating pump, the entropy production loss of the impeller is one of the main parts of the total entropy production loss of the whole pump. In order to better analyze the reasons for this, three impeller sections, shown in the following figure, were selected for research.
In order to analyze the reasons for the high entropy production rate of the impeller, entropy production distribution diagrams under different flow rate working conditions were plotted, as shown in Figure 9. It can be clearly seen from the figure that the entropy production of the impeller under the low flow rate working condition is much higher than that under the standard working condition and the high flow rate working condition, which is consistent with the quantitative analysis results of the impeller’s entropy production with respect to the flow rate working conditions in the previous section. By observing Figure 9, it can be seen that a highlighted entropy production area appears in the leading edge region, A1, of the blade under different working conditions, and entropy production gradually decreases as the flow rate increases. This is because when the flow rate is relatively small, the incidence angle of the fluid relative to the leading edge of the blade is relatively large. The incidence angle refers to the angle between the incoming flow direction and the geometric chord line of the leading edge of the blade. As shown in Figure 9, when the incidence angle is too large, it will cause the fluid to generate a transverse flow near the leading edge of the blade, resulting in energy loss. As the flow rate increases, the incidence angle of the fluid gradually decreases and tends to stay within a reasonable range. When the incidence angle approaches the design value, the fluid can enter the blade passage more smoothly, reducing the transverse flow of the fluid near the leading edge of the blade and thus reducing the energy loss.
Apart from the leading edge of the blade, a relatively high entropy production area, A2, also emerges at the trailing edge of the blade. The reason for this phenomenon is that under low flow rates, an obvious pressure gradient is generated in the fluid at the outlet of the impeller. The pressure gradually decreases from the maximum outer diameter to the center, which causes the flowing medium to separate under the influence of the adverse pressure gradient and form a circulation flow, as shown in Figure 10. The existence of the circulation flow will disrupt the normal flow of the mainstream, disturbing the originally orderly energy conversion process of the mainstream fluid and further resulting in energy losses. As the flow rate increases, the kinetic energy of the fluid also increases, enabling it to flow along the blade surface more smoothly, reducing the possibility of boundary layer separation, thereby alleviating the circulation flow phenomenon caused by the separated flow and reducing energy losses.
It can be clearly seen from the entropy production diagram that there is a large high entropy production region at the front shroud, which indicates that the energy generated at the front shroud suffers relatively large losses. Therefore, the entropy production at the front shroud is analyzed separately. As shown in Figure 11, under the low flow rate working condition, the flow state of the fluid in the inlet pipeline is unstable, resulting in relatively large differences in the fluid velocity entering the impeller both in the radial and circumferential directions. When this non-uniform velocity distribution reaches the front shroud, a transverse pressure gradient will be generated due to the velocity gradient. According to the Bernoulli’s equation, pressure is related to velocity, and the difference in velocity will make the pressure distribution at the front shroud non-uniform, thus triggering a secondary flow perpendicular to the mainstream direction. As the flow rate gradually increases, the flow velocity entering the impeller also increases, and the flow state of the fluid in the pipeline becomes more stable. Consequently, the transverse pressure gradient generated by the velocity gradient at the front shroud is weakened, the secondary flow gradually disappears, and the entropy production decreases.

3.4. Analysis of Internal Flow and Entropy Production in Volute

Sections of the volute under different flow rates were taken, and an entropy production analysis was conducted. The internal entropy production distribution, velocity nephogram, and streamline distribution are shown in Figure 12 and Figure 13.
It can be seen from Figure 12 that as the flow rate increases, the entropy production at the volute first decreases and then increases, and the entropy production of the volute reaches the lowest value near the design working condition point, which is consistent with the quantitative analysis results of the volute’s entropy production with respect to the flow rate working conditions mentioned above. It can be seen from the entropy production diagram that the throat area of the volute is the main area where entropy production occurs. According to the streamline analysis of the impeller in the previous section, there is a circulation flow at the outlet of the impeller under the low flow rate working condition. Therefore, there is also a relatively obvious high entropy production area in the region where the fluid enters the volute from the impeller. After these circulation flows enter the throat of the volute, they will interact with the mainstream in the throat, generating a secondary flow perpendicular to the mainstream direction, increasing the entropy production and energy losses. As the flow rate increases, the circulation flow at the outlet of the impeller gradually decreases, and the secondary flow in the throat area also weakens accordingly. Therefore, the entropy production in the throat area near the design working condition point is significantly reduced. In the case of high flow rates, the fluid enters the throat of the volute at a relatively high speed. Due to the large inertia of the fluid, when encountering the relatively complex geometric shape of the volute throat, part of the fluid separates from the mainstream due to inertia. These separated fluids form an unstable flow state in local areas and then generate vortices and carry out entropy production.

4. Conclusions

Regarding the research problem on the internal flow of the seawater circulating pump, numerical simulation and entropy production theory were adopted to analyze the internal energy losses of the seawater circulating pump and their causes. The following conclusions were drawn:
(1)
The total entropy production of the seawater circulating pump first decreases and then increases with the flow rate, reaching the lowest value near the design working condition. The impeller and the volute account for the largest proportion of entropy production. The proportion of entropy production of the impeller reaches its maximum value near the design working condition and decreases when deviating from the design working condition; the proportion of entropy production of the volute is opposite to that of the impeller, reaching the minimum value near the design working condition and increasing after deviating from the design working condition.
(2)
The regions of the leading edge, trailing edge, and front shroud of the blades of the seawater circulating pump become the main areas where entropy production occurs in the impeller due to reasons such as excessive incidence angles and circulation flows.
(3)
The entropy production of the volute is mainly concentrated in the throat area, and relatively high entropy production occurs due to reasons such as circulation flows and vortices, which increase energy losses.

Author Contributions

Conceptualization and writing—original draft preparation, Y.Z.; methodology and writing—review and editing, Q.H.; software, H.S.; validation, H.L.; investigation, H.C.; supervision and investigation, Q.K.; resources and project administration, Q.F. All authors have read and agreed to the published version of the manuscript.

Funding

This research received no external funding.

Data Availability Statement

The data presented in this study are available on request from the corresponding author. The data are not publicly available due to confidentiality agreements related to the nuclear power plant.

Conflicts of Interest

Authors Yifan Zhi and Qian Huang was employed by the company China Nuclear Power Engineering Co., Ltd. The remaining authors declare that the research was conducted in the absence of any commercial or financial relationships that could be construed as a potential conflict of interest.

References

  1. Kerr, R.A. Global warming is changing the world. Science 2007, 316, 188–190. [Google Scholar] [CrossRef] [PubMed]
  2. Hansen, J.; Ruedy, R.; Sato, M.K.I.; Lo, K. Global warming continues. Science 2002, 295, 275. [Google Scholar] [CrossRef] [PubMed]
  3. Pang, Y.; Tang, P.; Li, H.; Marinello, F.; Chen, C. Optimization of sprinkler irrigation scheduling scenarios for reducing irrigation energy consumption. Irrig. Drain. 2024, 73, 1329–1343. [Google Scholar] [CrossRef]
  4. Song, M.; Wang, S.; Yu, H.; Yang, L.; Wu, J. To reduce energy consumption and to maintain rapid economic growth: Analysis of the condition in China based on expended IPAT model. Renew. Sustain. Energy Rev. 2011, 15, 5129–5134. [Google Scholar] [CrossRef]
  5. González-Gil, A.; Palacin, R.; Batty, P.; Powell, J.P. A systems approach to reduce urban rail energy consumption. Energy Convers. Manag. 2014, 80, 509–524. [Google Scholar] [CrossRef]
  6. Ulucak, R.; Erdogan, S. The effect of nuclear energy on the environment in the context of globalization: Consumption vs production-based CO2 emissions. Nucl. Eng. Technol. 2022, 54, 1312–1320. [Google Scholar]
  7. Mahmood, N.; Wang, Z.; Zhang, B. The role of nuclear energy in the correction of environmental pollution: Evidence from Pakistan. Nucl. Eng. Technol. 2020, 52, 1327–1333. [Google Scholar] [CrossRef]
  8. Horvath, A.; Rachlew, E. Nuclear power in the 21st century: Challenges and possibilities. Ambio 2016, 45, 38–49. [Google Scholar] [CrossRef] [PubMed]
  9. Lu, J.; Yao, X.; Zheng, H.; Yan, X.; Liu, H.; Wu, T. Analysis of Unsteady Internal Flow and Its Induced Structural Response in a Circulating Water Pump. Water 2024, 16, 1294. [Google Scholar] [CrossRef]
  10. Dai, C.; Kong, F.-Y.; Dong, L. Study on Pressure Fluctuations of Unsteady Flow in a Circulating Water Pump. Adv. Sci. Lett. 2012, 9, 50–55. [Google Scholar] [CrossRef]
  11. Bing, H.; Tan, L.; Cao, S.; Lu, L. Prediction method of impeller performance and analysis of loss mechanism for mixed-flow pump. Sci. China Technol. Sci. 2012, 55, 1988–1998. [Google Scholar] [CrossRef]
  12. Li, W.; Ji, L.; Li, E.; Shi, W.; Agarwal, R.; Zhou, L. Numerical investigation of energy loss mechanism of mixed-flow pump under stall condition. Renew. Energy 2021, 167, 740–760. [Google Scholar] [CrossRef]
  13. Chen, L.; Yang, Y.; Song, X.; Zhang, X.; Gong, Y. Integrated optimization design of multiphase pump based on adaptive sparse grid method. Ocean Eng. 2024, 29, 117235. [Google Scholar] [CrossRef]
  14. Pei, J.; Shen, J.; Wang, W.; Yuan, S.; Zhao, J. Evaluating hydraulic dissipation in a reversible mixed-flow pump for micro-pumped hydro storage based on entropy production theory. Renew. Energy 2024, 225, 120271. [Google Scholar] [CrossRef]
  15. Wang, H.; Wang, C.; Zhou, L.; Ji, L.; Yang, Y.; Shi, W.; Agarwal, R.K. An entropy efficiency model and its application to energy performance analysis of a multi-stage electric submersible pump. Energy 2024, 288, 129741. [Google Scholar]
  16. Zhou, R.; Liu, H.; Dong, L.; Ooi, K.T.; Dai, C.; Shao, C.; Zhao, Y. Energy loss assessment of a two-stage pump under natural flow in the marine cooling system based on entropy production theory. Therm. Sci. Eng. Prog. 2023, 43, 101976. [Google Scholar] [CrossRef]
  17. Kan, K.; Zhang, Q.; Xu, Z.; Zheng, Y.; Gao, Q.; Shen, L. Energy loss mechanism due to tip leakage flow of axial flow pump as turbine under various operating conditions. Energy 2022, 255, 124532. [Google Scholar] [CrossRef]
  18. Kock, F.; Herwig, H. Local entropy production in turbulent shear flows: A high-Reynolds number model with wall functions. Int. J. Heat Mass Transf. 2003, 47, 2205–2215. [Google Scholar] [CrossRef]
  19. Yang, F.; Li, Z.; Hu, W.; Liu, C.; Jiang, D.; Liu, D.; Nasr, A. Analysis of flow loss characteristics of slanted axial-flow pump device based on entropy production theory. R. Soc. Open Sci. 2022, 9, 211208. [Google Scholar] [CrossRef] [PubMed]
  20. Bejan, A.; Herwig, J. Entropy generation through heat and fluid flow. Appl. Mech. 1983, 50, 475. [Google Scholar] [CrossRef]
  21. Ji, L.; Li, W.; Shi, W.; Chang, H.; Yang, Z. Energy characteristics of mixed-flow pump under different tip clearances based on entropy production analysis. Energy 2020, 199, 117447. [Google Scholar] [CrossRef]
  22. Ji, L.; Li, W.; Shi, W.; Tian, F.; Agarwal, R. Effect of blade thickness on rotating stall of mixed-flow pump using entropy generation analysis. Energy 2021, 236, 121381. [Google Scholar] [CrossRef]
  23. Fei, Z.; Zhang, R.; Xu, H.; Feng, J.; Mu, T.; Chen, Y. Energy performance and flow characteristics of a slanted axial-flow pump under cavitation conditions. Phys. Fluids 2022, 34, 035121. [Google Scholar] [CrossRef]
  24. Li, D.; Qin, Y.; Wang, J.; Zhu, Y.; Wang, H.; Wei, X. Optimization of blade high pressure edge to reduce pressure fluctuations in pump turbine hump region. Renew. Energy 2022, 181, 24–38. [Google Scholar] [CrossRef]
  25. Kock, F.; Herwig, H. Entropy production calculation for turbulent shear flows and their implementation in CFD codes. Int. J. Heat Fluid Flow 2005, 26, 672–680. [Google Scholar] [CrossRef]
Figure 1. Circulating water pump model.
Energies 18 01909 g001
Figure 2. Mesh model of circulating water pump.
Energies 18 01909 g002
Figure 3. The effect of the number of grids on head and efficiency.
Energies 18 01909 g003
Figure 4. Circulating water pump test system. (a) Circulating water pump test rig. (b) Circulating water pump test site.
Energies 18 01909 g004
Figure 5. Comparison of simulations and experimental results.
Energies 18 01909 g005
Figure 6. Entropy production with flow rate.
Energies 18 01909 g006
Figure 7. The entropy production of each domain in the design point.
Energies 18 01909 g007
Figure 8. Contours of static pressure with different flow rates in span 0.5 of impeller.
Energies 18 01909 g008
Figure 9. Entropy production distributions of different sections of the impeller under different flow rates. (a) Entropy production diagram of impeller at 0.6 Q flow rate. (b) Entropy production diagram of impeller at 1.0 Q flow rate. (c) Entropy production diagram of impeller at 1.4 Q flow rate. (d) Position diagram of different sections of impeller.
Energies 18 01909 g009
Figure 10. Entropy production and streamline distribution at span of 0.5 of impeller.
Energies 18 01909 g010
Figure 11. Entropy production and streamline distribution at span of 0.9 of impeller.
Energies 18 01909 g011
Figure 12. Entropy production diagrams of volute under different flow rates.
Energies 18 01909 g012
Figure 13. Velocity vector and streamline distribution of volute under different flow rates.
Energies 18 01909 g013
Table 1. The main design parameters of the model.
ParametersValue
Nominal flow rate453 m3/h
Design head8 m
Nominal rotating speed1450 r/min
Impeller blade number4
Impeller hub number26.6 mm
Inlet diameter300 mm
Outlet diameter350 mm
Table 2. Range and accuracy of measurement apparatus.
ApparatusPurposeRangeAccuracy
Pressure TransmitterInlet pressure−0.1~1.6 (Mpa)±0.1%
Pressure TransmitterOutlet pressure0~0.5 (Mpa)±0.1%
Electromagnetic FlowmeterFlow rate0~4000 (m3/h)±0.3%
Disclaimer/Publisher’s Note: The statements, opinions and data contained in all publications are solely those of the individual author(s) and contributor(s) and not of MDPI and/or the editor(s). MDPI and/or the editor(s) disclaim responsibility for any injury to people or property resulting from any ideas, methods, instructions or products referred to in the content.

