Abstract
This study proposes a bi-level optimization strategy to determine the optimal location and capacity for energy storage systems. Before applying the proposed bi-level optimization scheme, the PV output data are clustered by the K-means algorithm, and an active power–voltage sensitivity strategy is presented to identify nodes with high sensitivity in the clustered PV output data. Based on the data of the clustered nodes, a bi-level optimization model is established to determine the optimal location, rated power, and capacity of energy storage using the particle swarm optimization (PSO) algorithm. Finally, compared with traditional voltage sensitivity methods, some case studies with the proposed scheme are executed in the IEEE-33 bus system, which reveals better performance in reducing voltage deviation, network losses, and economic costs.
1. Introduction
Under the “Dual Carbon” goals, the extensive integration of distributed photovoltaic (PV) systems into distribution networks has introduced a series of adverse impacts on their safe and stable operation [1]. In distribution networks, the values of resistance and reactance are relatively close, leading to voltage fluctuations caused by changes in both active and reactive power at the nodes [2]. The massive integration of PV systems often results in reverse active power flow, significantly affecting the distribution network’s voltage and causing certain nodes to exceed the upper voltage limit [3]. Additionally, the PV output is characterized by significant randomness and variability. This limits the effectiveness of traditional voltage regulation equipment, as their response speed is insufficient to address voltage excursions caused by PV output fluctuations [4]. Energy storage, with its high flexibility and advantages such as rapid response and flexible charging/discharging capabilities, has emerged as a promising solution [5]. With the rapid advancement of energy storage technology, the application of energy storage devices as voltage regulation equipment in distribution networks with distributed PV integration has garnered widespread attention [6].
The optimization goal of energy storage devices with voltage regulation capability in high-proportion renewable energy distribution networks is to determine their optimal location, capacity, and power. Ref. [7] established an energy storage configuration model with objectives such as peak shaving, valley filling, and voltage regulation. Genetic algorithms were employed to identify optimal grid connection points across different scenarios. The node with the highest probability of being selected as the optimal connection point was chosen as the global best location for energy storage. Ref. [8] utilized a particle swarm optimization algorithm to solve an energy storage configuration model. This model considered voltage regulation and cost, ultimately determining the optimal grid connection point and capacity for energy storage. Ref. [9] combined improved deep embedded clustering with K-means clustering to analyze photovoltaic and load data. Typical scenarios for energy storage optimization were generated, and a genetic algorithm was used to solve the established bi-level optimization model, yielding the optimal energy storage configuration. Ref. [10] addressed convergence issues in traditional multi-objective optimization algorithms by improving the ocean predator algorithm. The enhanced algorithm was applied to solve energy storage configuration problems. Ref. [11] enhanced the multi-objective particle swarm algorithm to expand the solution coverage range and improve global search capabilities. This enhancement effectively increased the economic efficiency of power grid operations. Ref. [12] considered the configuration of hydrogen and electrochemical energy storage systems to improve voltage quality. A model was established with economic indicators, power loss, and voltage fluctuations as the objectives, optimizing the comprehensive energy storage system. Ref. [13] constructed a dynamic energy storage configuration model by analyzing the seasonal energy storage requirements of distribution networks. Site selection plans for each season were identified, significantly reducing system network losses under voltage over-limit conditions. Ref. [14] aimed to determine the location and capacity of energy storage using an improved genetic algorithm. The objectives focused on voltage quality and construction cost. However, the aforementioned studies have primarily relied on power flow models to establish the relationship between voltage and node power. They have not fully considered the impact of power injection changes on voltage distribution. Moreover, in distribution networks with a large number of nodes, the use of intelligent algorithms alone to identify energy storage access points can lead to slow convergence and local optima due to the extensive number of candidate nodes.
In addition, many scholars have incorporated voltage sensitivity into energy storage configuration problems. Voltage sensitivity intuitively reflects the impact of power changes at each node on the overall system voltage [15]. For example, references [16,17,18] used voltage sensitivity to calculate the electrical distance as the basis for cluster division. They achieved cluster regional voltage autonomy by configuring energy storage devices in each cluster. However, this approach has limitations. The demand for voltage regulation may vary across regions at the same time. The energy storage configuration method based on cluster partitioning does not fully consider the coordination of energy storage devices among clusters. This may lead to wasted energy storage resources or the premature depletion of energy storage capacity in certain clusters, negatively impacting the entire system. Ref. [19] proposed an alternative approach, which identifies the node with the highest sensitivity above the upper voltage limit as the energy storage grid connection point by calculating the temporal voltage sensitivity. However, this method does not consider scenarios where the voltage exceeds the lower limit. Additionally, the approach to calculating the capacity and power for grid-connected energy storage is difficult to optimize effectively.
To address the challenges in the current research, this paper proposes a bi-level optimization strategy for a battery energy storage system (BESS) configuration based on improved voltage sensitivity. (Note: The term “energy storage” in the subsequent sections specifically refers to battery storage). The PV output data are clustered by the K-means algorithm, and an active power–voltage sensitivity strategy is presented to identify nodes with high sensitivity in the clustered PV output data. Based on clustering node data, this study establishes a bi-level optimization model. In the upper-level model, the optimal location and capacity of energy storage are determined with the lowest investment costs. In the lower-level model, the minimum voltage deviations, minimum network losses, and maximum economic benefits are considered, where the optimal solutions are obtained using the particle swarm optimization (PSO) algorithm. Compared with the conventional strategies, the proposed scheme can comprehensively evaluate the sensitivity of voltage deviation to changes in active power under various operating scenarios. Meanwhile, the proposed scheme can more accurately identify nodes with significant impact.
The remainder of this paper is organized as follows: Section 2 introduces the improved active power–voltage sensitivity analysis, detailing the limitations of the traditional methods and proposing a comprehensive multi-scenario sensitivity calculation based on the K-means clustering algorithm. Meanwhile, Section 2 presents the bi-level optimization model for energy storage configuration, with the upper level focusing on minimizing investment costs and the lower level addressing operational objectives, such as voltage deviation, network losses, and economic benefits. Section 3 describes the solution process using an improved niche particle swarm optimization algorithm, which efficiently identifies optimal energy storage locations, capacities, and power ratings. Section 4 validates the proposed method through simulations on a modified IEEE-33 node test system, demonstrating its effectiveness in voltage regulation, network loss reduction, and cost efficiency. Finally, Section 5 concludes the paper by summarizing the key contributions and outlining future research directions.
2. Improved Active Power–Voltage Sensitivity Analysis
2.1. Traditional Active Power–Voltage Sensitivity Scheme
The relationship between the voltage and power of each node in a system with N nodes can be represented by the following equation:
where Pi and Qi are the active and reactive power injected at the node i; Ui is the voltage amplitude at the node i; δij is the voltage phase angle difference between i and j; Gij and Bij are the conductance and susceptance, respectively, between i and j.
By taking partial derivatives of the above equation, the matrix of the modified equation can be obtained as follows:
From the Jacobian matrix above, it can be intuitively seen that the amplitude of voltage is simultaneously affected by the active and reactive power of each node. When we only consider the impact of active power changes on the node voltage and set ∆Qn to 0, we can ultimately obtain the relationship between the voltage amplitude and the active power:
Equation (3) can be expanded as follows:
The values of active power–voltage sensitivity at each node are as follows:
where the voltage sensitivity in (15) denotes the quantitative value of the impact of changes in the active power of a node on its voltage. In traditional distribution networks, the absence of distributed power sources causes voltage amplitude to decrease gradually as the transmission line distance increases. Under heavy load conditions, node voltage exceeding the limit usually occurs at the end of the transmission line. Traditional active voltage sensitivity effectively measures the impact of active power changes on the voltage amplitude in such scenarios.
However, integrating large-scale distributed PV systems has changed this pattern. Nodes prone to voltage limit violations are no longer limited to the line end but are irregularly distributed throughout the network. Additionally, traditional active voltage sensitivity is calculated based on a specific operating condition at a given moment. It fails to fully capture the impact of active power changes under different operating conditions or on nodes experiencing voltage limit violations.
The volatile and seasonal nature of distributed PV output leads to significant fluctuations in the network’s operational status. As a result, traditional active voltage sensitivity is insufficient for analyzing the influence of nodes with substantial PV connections on those exceeding voltage limits. In summary, traditional methods are no longer suitable for assessing node interactions in large-scale PV-integrated distribution networks.
2.2. Modified Multi-Scenario Comprehensive Voltage Sensitivity Scheme
In response to the limitations of traditional active power voltage sensitivity analysis methods, this paper proposes an improved approach that comprehensively considers the diversity of PV daily output curves and the impact of large-scale PV integration on intraday voltage fluctuations in distribution networks, including the location, timing, and magnitude of voltage violations. Firstly, the PVsyst 7.2 software is employed to simulate the annual operation of a PV power generation system in a specific region, obtaining PV output curves and related datasets. Based on the simulated data, the K-means clustering algorithm is applied to classify the PV daily output data into four typical scenarios (as shown in Appendix A Table A1), and the statistical proportion of days each scenario represents in a year is calculated. Subsequently, under these four typical PV output scenarios, a comprehensive monitoring and analysis of voltage violations at each node in the distribution network over a 24-h period are conducted. Finally, by integrating the characteristics of voltage violations across different scenarios, times, and nodes, the traditional active power voltage sensitivity calculation method is refined to achieve a more accurate assessment of voltage sensitivity.
Traditional active voltage sensitivity has limitations in describing how individual node power affects the overall voltage of the distribution network. Specifically, it fails to address situations where certain nodes exceed voltage limits. As a result, the calculated sensitivity does not adequately highlight the impact on nodes experiencing voltage violations.
To address this issue, this study proposes a refined approach. It suggests that the influence of node power on nodes with no voltage violations can be ignored in sensitivity calculations. Instead, the amplitude of voltage limit violations is used as a weighting factor. This adjustment ensures the sensitivity analysis focuses on nodes most affected by voltage overruns, offering a more precise and targeted evaluation of voltage stability. The proposed method is mathematically expressed as follows:
where αij,k,t is the influence coefficient of node i when the active power of node j changes at the time t in scenario k; ωi,k,t is the voltage over the limit weight of node i at time t in scenario k; Vi,k,t is the voltage of node i at the time t in scenario k; Vmax is the maximum allowable voltage limit for the distribution network; Vmin is the lower limit of voltage allowed for the distribution network; βij,k,t is the coefficient of the influence of change in the active power of node j at time t in scenario k on the over-limit voltage of node i.
In PV-penetrated distribution networks, the location of PV access may result in both overvoltage and undervoltage nodes relative to the reference voltage at the same time. For nodes with high voltage sensitivity that exceed the upper limit, if they also significantly affect the undervoltage nodes, regulating the overvoltage may cause the undervoltage nodes to drop below the lower limit, leading to undesirable outcomes. Similarly, addressing undervoltage issues may trigger unexpected overvoltage problems. Therefore, it is essential to separately calculate the voltage sensitivity for overvoltage and undervoltage based on the specific voltage violations in the distribution network.
Among the equations, Lmdj,k,t,h and Lmdj,k,t,l are the voltage sensitivity values at the upper and lower nodes of voltage crossing, respectively, at the time t in scenario k; hi,k,t and li,k,t are the voltage crossing upper and lower weights, respectively; Vref is the rated voltage of the distribution network; ϕH and ϕL are the set of times when the voltage crosses the upper and lower limits in the distribution network, respectively.
Voltage sensitivity is typically calculated based on the node voltage magnitudes and phase angles under specific grid conditions. However, the rapid intra-day fluctuations in PV output and connected load variations cause significant node voltage differences over time, leading to corresponding changes in the active power–voltage sensitivity.
To better identify nodes that significantly affect voltage violations during critical periods, this study integrates daily voltage over-limit scenarios. It calculates the active power sensitivity across different time intervals and assigns weights to reflect their importance.
Among the equations, Lmdj,k,h and Lmdj,k,l are the combined voltage sensitivity values when the voltage crosses the upper and lower limits, respectively; qt and et are the weight of voltage exceeding the upper limit and voltage falling below the lower limit at time t, respectively; Nh,t and Nl,t are the number of nodes that cross the upper and lower limits, respectively; Vmax,t is the maximum voltage at each node in the set of time t when the voltage exceeds the upper limit; Vmin,t the minimum voltage among all nodes at time t in the set of times when the voltage exceeds the lower limit.
PV systems exhibit significant variations in daily output curves across seasons. This requires voltage sensitivity calculations for different PV output scenarios. However, directly calculating active voltage sensitivity under varying scenarios cannot effectively address the unique voltage regulation needs from different PV output patterns.
To overcome this limitation, this study characterizes active voltage sensitivity in the distribution network. This is achieved by integrating different daily PV output scenarios through Equation (9).
Among the equations, Lmdj,hz and Lmdj,lz are the improved multi-scenario integrated active sensitivity values; Gk is the proportion of all PV daily output scenarios in scenario k in a year; n is the number of PV daily output scenarios; Nk,h is the number of instances in scene k where the voltage exceeds the upper limit; Nk,l is the number of instances in scene k where the voltage exceeds the lower limit.
2.3. Modified Voltage Sensitivity with Consideration of Energy Storage
Distribution networks have a complex multi-branch structure. Focusing on a single node alone is not enough to solve voltage issues effectively. Additionally, integrating energy storage devices changes the voltage distribution significantly. This requires recalculating the voltage sensitivity. To address this, this paper uses the following formulas to calculate the active voltage sensitivity after energy storage integration.
Firstly, the power correction factor is calculated for nodes with voltage exceeding the upper and lower limits:
Among the equations, χs and χx are the correction factors for the upper and lower voltage limits; When the voltage surpasses the upper limit in the distribution network, the voltage at node m represents the maximum voltage amplitude(Vn,max); conversely, when the voltage falls below the lower limit, the voltage at node k corresponds to the minimum voltage amplitude(Vn,min); αm,n is the voltage sensitivity coefficient of the maximum node n to node m of the trans-ceiling integrated voltage sensitivity; αk,l is the voltage sensitivity coefficient of the minimum node l to node k of the trans-ceiling integrated voltage sensitivity. The corrected voltage is shown in the following equation:
In the equation, UNc is the voltage before correction; UN is the voltage after correction; χ is the voltage correction factor. The corrected voltage is obtained at each moment in each scenario through the above formula. If there is no voltage exceeding the limit, the sensitivity calculation ends, and the backup node is selected. If there is still voltage exceeding the limit, the sensitivity calculation in Section 2.2 is repeated.
3. A Bi-Level Energy Storage Optimization with Consideration of Multi-PV Output
3.1. Upper-Level Optimization Model
The upper-level optimization model aims to minimize the investment cost of energy storage and plans the location and power of energy storage access.
3.1.1. Upper-Level Objective Function
The upper-level optimization objective is to minimize the investment cost of energy storage, which is calculated by the following formula:
Among the equations, CT-BESS is the annual investment cost of the energy storage equipment; NBESS is the number of configurations of the energy storage equipment; PBESS,n,max is the power allocated to the nth energy storage device; EBESS,n is the rated capacity of nth BESS; a and b are the energy storage unit power cost and unit capacity cost, respectively; μCRF is the annual financial recovery rate; y is the service life of the energy storage device; r is the discount rate.
3.1.2. Upper-Level Model Constraints
In the equation, Pn,min is the minimum rate power for node access to the energy storage; Pn,max is the maximum rated power of energy storage access; PBESS,max is the rated power of the energy storage.
3.2. Lower-Level Optimization Model
The lower-level optimization model focuses on four objectives. These include minimizing voltage deviation, maximizing operational revenue, reducing network losses, and minimizing net load fluctuations. It plans the 24 h output of energy storage devices across different scenarios.
3.2.1. Lower-Level Objective Function
The objective is to minimize the investment cost of energy storage, which is calculated by the following formula:
- The energy storage maintenance cost is calculated as follows:
In the equation, PBESS,n,t is the power of the nth storage at time t, Cs is the storage operating cost factor, and Cy is the storage operating cost.
- Energy storage operation revenue:
The energy storage charging and discharging costs based on grid time-of-day tariffs when charging and discharging the energy storage system are calculated as follows:
Among the equations, is the cost of energy storage electricity sales; is the purchase of energy storage electricity sales; Mt,s(t) is the time-of-use electricity prices at time t in scenario s; Pch,i,s(t) and Pdisc,i,s(t) are the ith charging and discharging power rates, respectively, in scenario s; Smax is the maximum number of scenarios; T is the number of hours in each scenario;
- The voltage deviation of the distribution network is calculated as follows:
Among the equations, Vi,t is the voltage of node i at time t; T is the number of moments in a day; Dt is the drift rate of system at time t, and it stands for the degree of deviation of the nodal voltage from the rated voltage at time t; Dσ is the overall system voltage excursion rate for 24 h a day.
- The network losses are calculated as follows:
In the equations, is the sum of the active network losses in the system; nl is the total number of branches; Ploss,l,t is the network losses at time t of branch l.
- The fluctuation of the net load is calculated as follows:
Among the equations, is the net load of the system at time t in scenario s; is the total power of the energy storage equipment at time t in scenario s; is the sum of all photovoltaic outputs of the system at time t in scenario s; Fnet is an indicator of net load fluctuations.
3.2.2. Lower-Level Constraint Conditions
- The branch power constraint is calculated as follows:
In the formula, is the actual active power transmitted on the branch between nodes i and j; is the maximum active power allowed to be transmitted on the branch between nodes i and j.
- The voltage constraint is calculated as follows:
In the formula, Vi is the voltage of node i.
- The state of charge (SOC) constraint for energy storage is calculated as follows:
In the formula, SOCmin and SOCmax are the minimum and maximum values of the state of charge of the energy storage device, respectively; SOCi is the real-time state of charge of the nth energy storage device.
3.3. Solutions for Proposed Optimization Problem with Improved Niche PSO
This paper uses an improved niche PSO algorithm to solve the energy storage optimization model [20]. Figure 1 outlines the process of the improved niche PSO algorithm used to solve the bi-level energy storage optimization problem. The algorithm first calculates the upper and lower limit voltage sensitivities for each node using the improved active voltage sensitivity method. Nodes with the highest sensitivity values are selected as candidate nodes for energy storage placement, significantly reducing the number of candidate nodes and avoiding local optima. These candidate nodes are then integrated into the bi-level optimization model. The upper-level model minimizes the energy storage investment costs, while the lower-level model optimizes the operational objectives, such as voltage deviation, network losses, and economic benefits. This hierarchical approach ensures a comprehensive and efficient energy storage configuration. The improved niche PSO algorithm enhances the global search capabilities and avoids premature convergence, ensuring optimal results for both the location and capacity of energy storage systems.
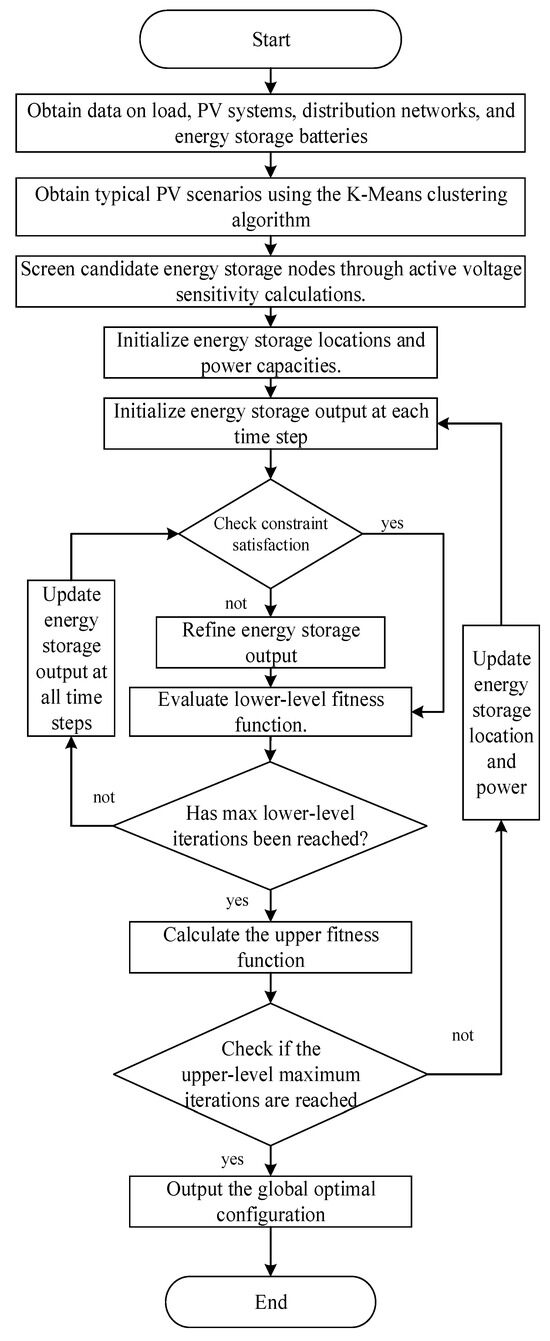
Figure 1.
Process of the improved niche particle swarm optimization algorithm.
4. Simulation Results
This article takes the IEEE33 node distribution network connected to distributed photovoltaics as an example to verify the proposed location and capacity strategy for energy storage. The topology diagram is shown in Figure 2.

Figure 2.
Example topology diagram.
In this article, the minimum unit of photovoltaic power is defined as one group, with a rated power of 50 KW per group. Table 1 provides the configuration details of the distributed PV systems in the IEEE-33 bus network. Four PV groups were connected at Nodes 8, 26, 28, and 32, with rated powers of 1000 kW, 1500 kW, 1500 kW, and 2000 kW, respectively. The high PV penetration at these nodes significantly impacted the network’s voltage profile, especially during peak generation periods.

Table 1.
Table of distributed PV system parameters.
Using PVsyst software, a simulation of the photovoltaic (PV) power generation system in a specific region was conducted, obtaining annual PV output curves and related data. Based on these simulated data, a clustering analysis method was employed to thoroughly analyze the annual power generation characteristics of a single set of PV panels. Ultimately, four representative typical power generation scenarios were extracted (the data are detailed in Table A1 of Appendix A).
Figure 3 shows four typical photovoltaic daily output scenario curves obtained using the K-means clustering algorithm for a single group of photovoltaic panels. These scenarios represent distinct patterns of PV generation over a year, capturing the variability caused by seasonal and weather-related factors. Scenario 1, accounting for 33.42% of the year, exhibited moderate PV output with consistent fluctuations. Scenario 2, representing 23.01% of the year, showed the highest PV output, especially during midday, reflecting days with optimal solar irradiance. Scenario 3, covering 30.96% of the year, displayed lower PV output with significant variability, characteristic of partially cloudy days. Scenario 4, accounting for 12.60% of the year, depicted minimal PV output, typical of overcast days or winter months. These scenarios are critical for understanding the diverse operational conditions of the distribution network and designing energy storage systems that adapt to varying PV generation patterns.
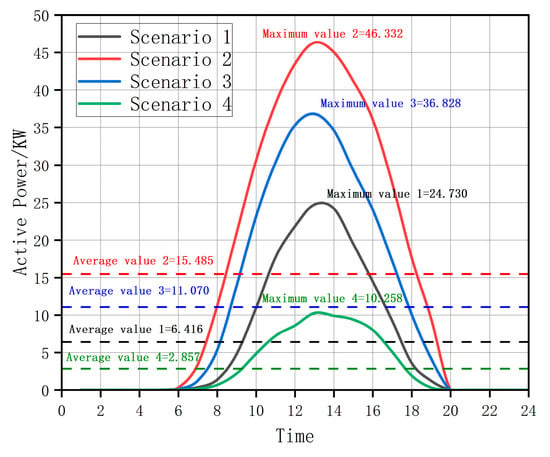
Figure 3.
Typical daily output scenarios of a single group of PV panels.
The total active load in the system was 3715 KW (per-unit value of 1), which was used as the reference value to obtain the typical daily load curve, as shown in Figure 4.

Figure 4.
Typical daily load curve.
Figure 4 illustrates the typical daily load curve for the IEEE-33 bus system, derived from the total active load of 3715 kW (per-unit value of 1). The curve exhibits two distinct peak periods: a morning peak around 9:00–10:00 and an evening peak from 18:00 to 21:00. The load remains relatively stable during off-peak hours, with a slight dip during midday. This daily load pattern is critical for optimizing energy storage operations, as it highlights periods of high demand, when energy storage systems must discharge to support the grid, and periods of low demand, when they can charge. The energy storage configuration must account for these load variations to ensure efficient voltage regulation and minimize network losses.
Table 2 outlines the time-of-use electricity pricing scheme used in the optimization model. The pricing periods include peak (09:00–14:00, 18:00–21:00), off-peak (07:00–09:00, 14:00–18:00, 21:00–23:00), and low demand (00:00–07:00, 23:00–24:00), with corresponding prices of 0.975, 0.510, and 0.195 CNY/kWh, respectively. The TOU pricing scheme incentivizes energy storage systems to charge during low-price periods and discharge during high-price periods, maximizing economic benefits while maintaining voltage stability.

Table 2.
Time-of-use electricity pricing table.
4.1. Optimized Active Power–Voltage Sensitivity Calculation
To calculate the power sensitivity at a certain moment, the voltage of each node at that moment needs to be obtained. MATPOWER was used to calculate the voltage of each node at each moment in this scenario.
Figure 5 shows the node voltage waveforms for the first four scenarios of energy storage configuration, highlighting the impact of PV generation on the voltage distribution. In Scenario 2, which represents the days with the highest PV output, certain bus voltages exceeded the upper limit at midday due to reverse power flow from the distributed PV systems. Conversely, during the evening peak load period, voltages dropped below the lower limit, especially in Scenarios 3 and 4, where PV output was minimal. These voltage violations underscore the need for energy storage systems to mitigate overvoltage and undervoltage issues. The differences in the voltage profiles across the scenarios emphasize the importance of a multi-scenario optimization approach to ensure robust energy storage performance under varying PV and load conditions.
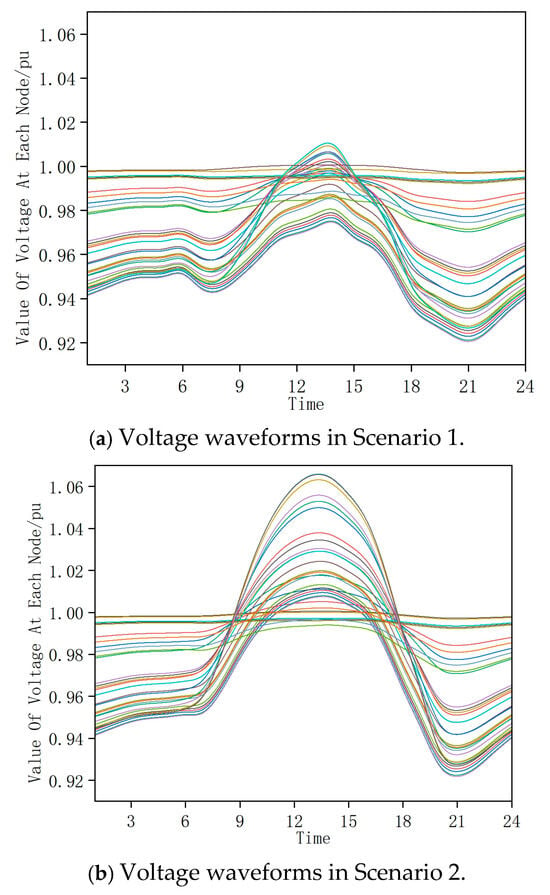
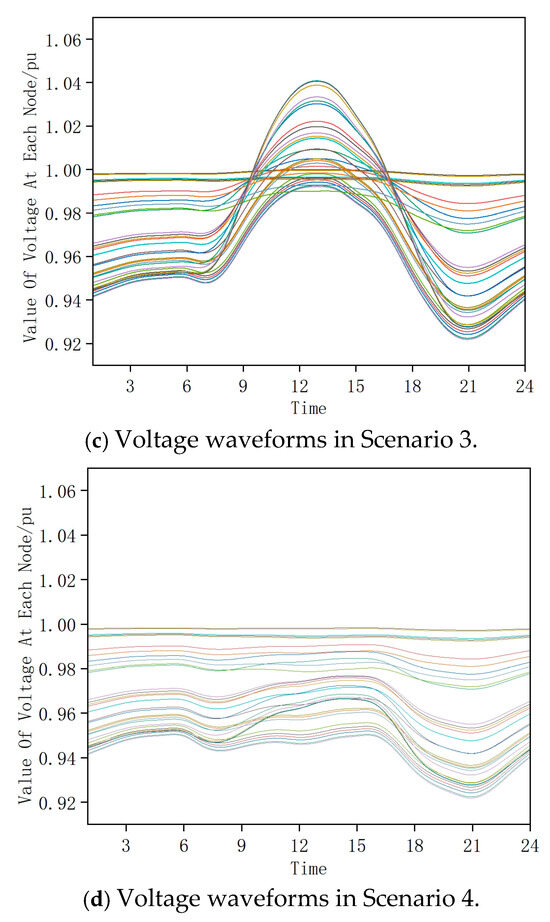
Figure 5.
Pre-storage configuration of node voltages across scenarios.
This study calculated the traditional active power–voltage using the standard IEEE 33-bus system. For the first time, the proposed method was applied to compute the upper and lower limit active power sensitivities, as illustrated in Figure 6. The voltage sensitivity data in Figure 6 have been normalized for clarity.
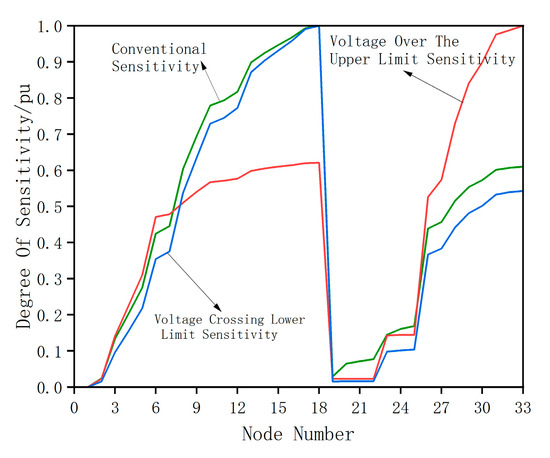
Figure 6.
Comparison of improved primary voltage sensitivity with traditional sensitivity.
As shown in Figure 6, the voltage sensitivity calculated by the proposed method was significantly higher than the traditional sensitivity near Node 30 for the upper voltage limit. This is because most photovoltaic systems in the improved IEEE 33-node system are connected near Node 30. The rapid increase in photovoltaic output at noon caused current reverse flow on the branch between Nodes 26 and 33, leading to voltage violations.
From the voltage violation analysis in Figure 5, it is clear that the nodes exceeding the upper voltage limit were all located on the branch between Nodes 26 and 33. According to the IEEE 33-node topology, Nodes 26–33 were influenced by the voltage at Node 6. Assuming the grid as an infinite power source, the voltage at Node 6 was affected by the power flow through Nodes 2–5.
The power changes in Nodes 7–18 and Nodes 26–33 had similar effects on the voltage at Node 6. However, power fluctuations on the branch between Nodes 26 and 33 directly influenced the voltages at these nodes due to their inherent impedance. This unique characteristic was absent in other nodes not on the 26–33 branch.
Therefore, the sensitivity to voltage upper limit violations was naturally higher for Nodes 26–33, as confirmed in Figure 6. The proposed method fully considers the voltage regulation needs of violation-prone nodes and selects nodes with significant impacts. The same logic applies to the lower voltage limit sensitivity, which traditional methods cannot achieve. After one calculation, Nodes 15, 16, 17, 18, 30, 31, 32, and 33 were identified as candidate nodes for further analysis.
Verification using Equations (10) and (11) showed that the nodes selected for over-limit voltage sensitivity met the requirements, while those for under-limit voltage sensitivity required optimization, prompting a secondary calculation, as illustrated below:
As shown in the Figure 7, the power changes at Nodes 16, 17, and 18 still significantly affected the lower voltage limit violations across the system after modification. However, their impact was noticeably reduced compared to before the voltage correction. This is because the voltages of the nodes sensitive to their power changes were adjusted. The presence of the remaining voltage violations suggests that these nodes were less affected by the power changes at Nodes 16, 17, and 18. Therefore, it was necessary to continue identifying the nodes with high sensitivity to these violations as potential candidates for energy storage.

Figure 7.
Comparison of voltage upper-limit sensitivity before and after modification.
On the other hand, the voltage sensitivity near Node 33 increased rapidly after the modification. This indicates that the voltages of some nodes remained low even after correcting the nodes most affected by Node 18. These nodes were more sensitive to the power changes at Nodes 33, 32, and 31. Thus, Nodes 33, 32, and 31 were selected as candidate nodes in this step.
Considering both the upper and lower voltage limit sensitivities, Nodes 15, 16, 17, 18, 30, 31, 32, and 33 were identified as the final candidate nodes for further analysis.
4.2. Analysis of Comparison Results of Energy Storage Optimization Configuration Plans
From the improved over-limit and under-limit voltage sensitivity analyses, the top four nodes with the highest sensitivity values were selected as the candidate nodes for energy storage integration. These nodes were incorporated into a bi-level optimization model for energy storage configuration, yielding the optimal energy storage allocation results, as shown in the Table 3:

Table 3.
Energy storage configuration for two schemes.
Table 3 compares the energy storage configuration strategies based on the improved voltage sensitivity method and the traditional voltage sensitivity method. The improved method identified Nodes 18, 32, and 33 as the optimal access points, with capacities of 4770 kWh, 2610 kWh, and 2180 kWh, and power ratings of 370 kW, 190 kW, and 220 kW, respectively. In contrast, the traditional method selected Nodes 11, 12, and 17, with capacities of 5580 kWh, 4700 kWh, and 5080 kWh, and power ratings of 600 kW, 470 kW, and 520 kW. The results demonstrate that the improved method, by precisely targeting nodes with high voltage sensitivity, not only ensured effective voltage regulation across diverse operational scenarios but also minimized the scale and complexity of the energy storage system, offering a more efficient and cost-effective solution.
Table 4 and Table 5 provide a comparative analysis of the performance of energy storage systems using improved active voltage sensitivity and traditional sensitivity across four distinct scenarios. The results demonstrate the economic and operational advantages of the improved active voltage sensitivity method over the traditional sensitivity approach.

Table 4.
Economic benefit comparison of energy storage using two methods in four scenarios.

Table 5.
Operational performance of energy storage systems under two methods.
In this study, the waveforms in Scenarios 2 and 4 are presented in detail because they determine the maximum power and capacity requirements of the energy storage system, respectively. Scenario 2, with the highest PV output, requires maximum power to mitigate overvoltage conditions, while Scenario 4, with the lowest PV output, requires maximum capacity to address undervoltage conditions. This ensures that the storage system is robust across all scenarios. Although Scenarios 1 and 3 were used in the optimization process, they are not shown in detail as they do not impose extreme system requirements.
The actions and SOC of the energy storage device in Scenario 2 are shown in Figure 8. Among them, P1, P2, and P3 represent the power of Energy Storage 1, Energy Storage 2, and Energy Storage 3, respectively, while SOC1, SOC2, and SOC3 represent the state of charge (SOC) of Energy Storage 1, Energy Storage 2, and Energy Storage 3, respectively.
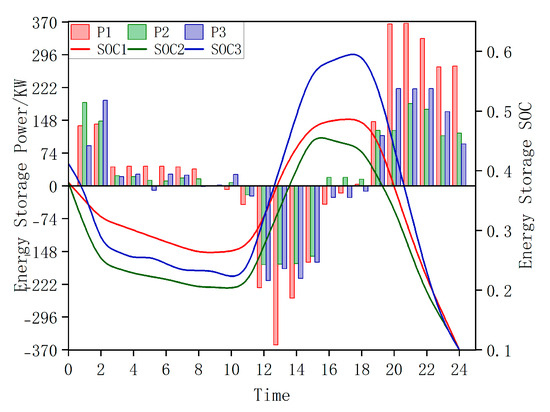
Figure 8.
Energy storage action and SOC in Scenario 2.
Figure 8 and Table 3 show that all three energy storage systems absorbed power at their maximum rated capacity during the peak photovoltaic generation period at noon. This maintained the system voltage just below the upper limit. A similar pattern was observed during the evening load peak period.
This demonstrates that the configured energy storage power at each node represents the minimum rated power required to prevent voltage limit violations. Thus, the optimal configuration achieves both voltage quality assurance and cost minimization for energy storage power.
The actions and SOC of the energy storage devices in Scenario 4 are shown in Figure 9.
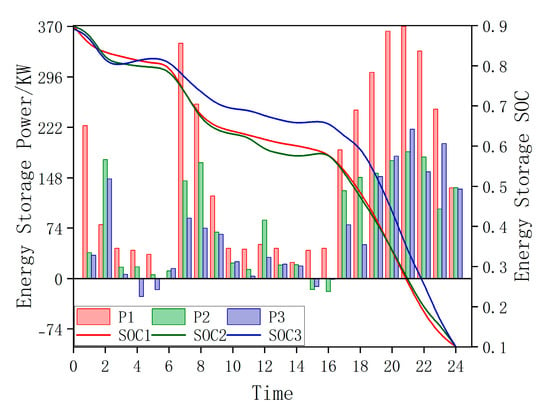
Figure 9.
The actions and SOC of the energy storage device in Scenario 4.
In Scenario 4, the photovoltaic system maintained a low power output all day. As shown in Figure 5, the voltage distribution at various times indicates that all node voltages in the distribution network remained below the rated voltage of 12.66 kV.
To address voltage deviation and reduce line losses, the energy storage system should actively output active power. This elevates the distribution network voltage level and minimizes active power transmission from the front end to the terminal, effectively reducing line losses. Figure 9 illustrates the operational status of the energy storage system, fully validating this conclusion.
This paper set the per-unit value range for voltage fluctuation at 0.95–1.05. Through the optimal configuration of the energy storage system, the simulation results, as shown in Table 6 and Figure 10, demonstrate the voltage distribution at each node across four typical scenarios. With the effective regulation of the energy storage system, the voltage of all nodes in the distribution network was precisely controlled within the specified range, completely eliminating voltage violation incidents.

Table 6.
Voltage extreme values in four scenarios after energy storage configuration.
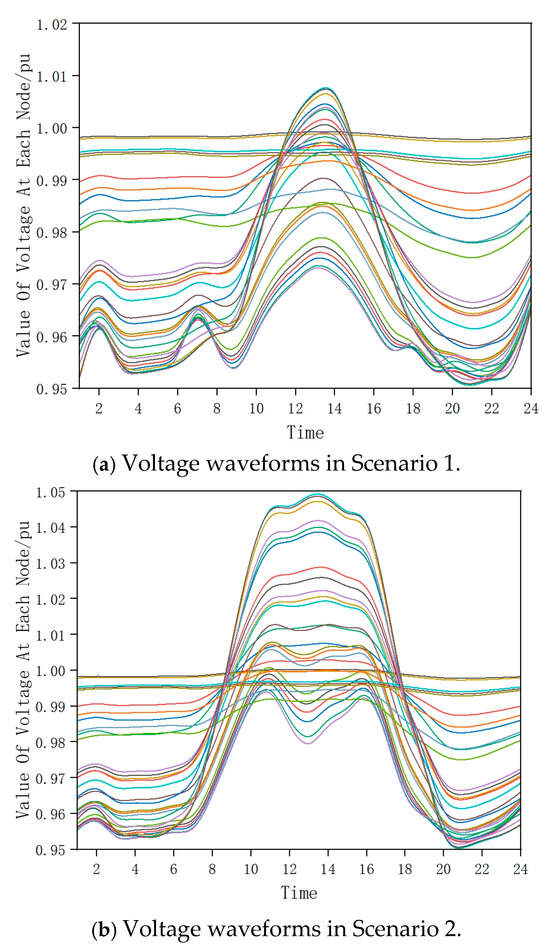
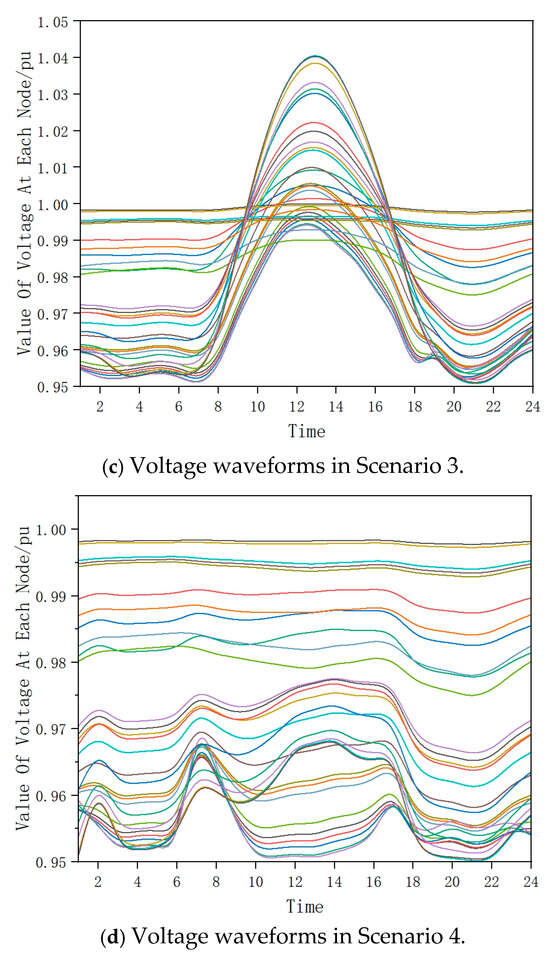
Figure 10.
Node voltage at each moment after configuring energy storage.
In the traditional active voltage sensitivity approach, Nodes 11–18, with larger values, were selected as candidate nodes for energy storage access and incorporated into the bi-level optimization of energy storage configuration. The resulting energy storage configuration Scheme 2 is shown in Table 3.
The actions and SOC of the energy storage device in Scenario 2 are shown in Figure 11.
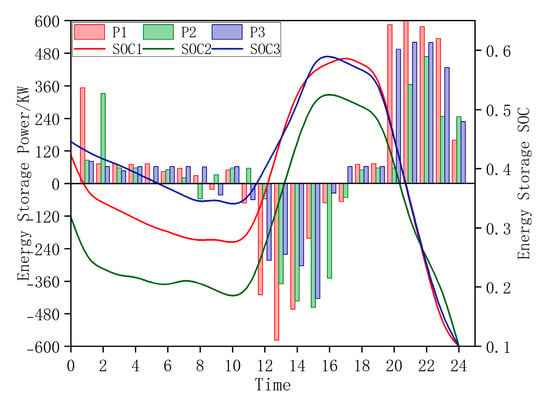
Figure 11.
The actions and SOC of the energy storage device in Scenario 2.
In Figure 11, it can be observed that energy storage configuration Scheme 2 operated at maximum power output during the peak load period from 21:00 to 22:00 in Scenario 2, successfully regulating the voltage within the specified range. This behavior is similar to Scheme 1. However, by comparing Figure 11 with Figure 8, it is evident that Scheme 2 required the energy storage system to deliver more power to the grid to maintain the node voltages above the minimum allowable level.
While Nodes 11–18 had a significant overall impact on the distribution network voltage, the analysis of Figure 7 reveals that certain nodes were less influenced by them but more affected by the power variations near Node 33. When the voltages of these nodes dropped below the lower limit, the energy storage devices at Nodes 11–18 had to exert more effort to raise the voltages to the required range.
Through the revised voltage sensitivity calculation proposed in this study, it was accurately identified that Nodes 30–33 had a substantial influence on the voltages at these nodes. By configuring the energy storage at Nodes 30–33, voltage regulation could be achieved with less power. The same principle applies when the voltage at Node 33 and its neighboring nodes exceeds the upper limit. Consequently, Scheme 2 demands energy storage devices with greater power and capacity, resulting in higher construction costs.
The integrated network loss of the system at each moment before and after the configuration of energy storage was calculated by Equation (17), as shown in Figure 12.

Figure 12.
Multi-scenario line losses with and without energy storage.
In Figure 12, it can be observed that the line losses in the distribution network were reduced after implementing energy storage Schemes 1 and 2. Between 0:00 and 10:00, the line losses for both schemes were similar. However, significant differences emerged during the midday and evening periods.
At midday, when the photovoltaic output was at its peak, there was a high demand for voltage regulation to prevent exceeding the upper limit. Traditional Scheme 1, which did not account for this need, required energy storage to draw more power from the grid to maintain voltage stability. This increased the current flowing to the storage devices, resulting in higher line losses compared to Scheme 2.
In the evening, the demand for voltage regulation to prevent dropping below the lower limit was substantial. Scheme 1, constrained by cost considerations, could not excessively increase the storage capacity to minimize line losses. In contrast, Scheme 2, with its larger capacity and power due to strategic placement, effectively reduced line losses during this period. Additionally, its location on the branch of Nodes 1–18, where line losses were the highest, further enhanced its effectiveness. Consequently, Scheme 2 exhibited lower line losses in the evening compared to Scheme 1.
5. Conclusions
This paper addresses the issues of over-voltage at certain nodes due to high photovoltaic penetration and under-voltage during nighttime heavy load conditions in distribution networks, proposing an energy storage configuration strategy for voltage limit violation management. The proposed method offers the following advantages:
- The proposed improved voltage sensitivity calculation comprehensively considers the sensitivity of voltage violation nodes across multiple scenarios and time periods. It separately calculates the sensitivity for nodes exceeding the upper voltage limit and those below the lower voltage limit, providing a more targeted approach. This enhancement effectively addresses the limitations of traditional voltage sensitivity methods.
- To address the impact of energy storage integration on distribution network voltages, this paper employed voltage correction calculations to assess whether the voltage regulation requirements are met after storage deployment. If the requirements are not satisfied, the process continues to identify additional nodes, ensuring that no potential node capable of aiding voltage regulation is overlooked. The case study demonstrated that the proposed voltage sensitivity calculation method can quickly and accurately identify nodes with significant influence on voltage violations. This approach substantially reduces the number of candidate nodes for energy storage integration, enhancing the efficiency and precision of the configuration process. Through systematic verification and iteration, the method ensures optimal storage placement while maintaining voltage stability across the network.
- The bi-level optimization model developed in this paper comprehensively considers factors such as energy storage costs, voltage deviations, and network losses. By solving the model, the optimal location, capacity, and power of the energy storage system are determined. The simulation results demonstrate that the proposed energy storage configuration method not only satisfies voltage constraints but also balances the economic efficiency and practicality of energy storage deployment.
Author Contributions
Conceptualization, B.G., Q.D., G.Z. and J.H.; Methodology, Q.D. and G.Z.; Software, G.Z. All authors have read and agreed to the published version of the manuscript.
Funding
This research was funded by [the Natural Science Foundation of Jiangxi Province, China] grant number [No. 20232BAB214065, 20242BAB25285, No. 20232BAB214061, No. 20242BAB25287].
Data Availability Statement
The original contributions presented in the study are included in the article, further inquiries can be directed to the corresponding author.
Conflicts of Interest
The authors declare no conflict of interest.
Appendix A

Table A1.
Daily single group PV panel output data for four typical scenarios.
Table A1.
Daily single group PV panel output data for four typical scenarios.
| Scenario 1 PV Daily Output (KW) | Scenario 2 PV Daily Output (KW) | Scenario 3 PV Daily Output (KW) | Scenario 4 PV Daily Output (KW) | |
|---|---|---|---|---|
| 1 | 0 | 0 | 0 | 0 |
| 2 | 0 | 0 | 0 | 0 |
| 3 | 0 | 0 | 0 | 0 |
| 4 | 0 | 0 | 0 | 0 |
| 5 | 0 | 0 | 0 | 0 |
| 6 | 0.111 | 0.308 | 0.111 | 0.030 |
| 7 | 0.150 | 3.404 | 1.226 | 0.150 |
| 8 | 1.352 | 11.235 | 5.315 | 0.664 |
| 9 | 4.808 | 20.973 | 13.932 | 2.196 |
| 10 | 10.960 | 30.651 | 23.181 | 4.840 |
| 11 | 17.684 | 38.151 | 30.340 | 7.217 |
| 12 | 21.815 | 43.500 | 35.304 | 8.604 |
| 13 | 24.730 | 46.332 | 36.828 | 10.258 |
| 14 | 24.177 | 45.038 | 34.597 | 9.901 |
| 15 | 19.480 | 41.197 | 29.292 | 9.398 |
| 16 | 14.480 | 36.068 | 24.040 | 8.013 |
| 17 | 9.241 | 27.584 | 17.203 | 5.085 |
| 18 | 3.604 | 17.656 | 10.078 | 1.910 |
| 19 | 1.214 | 9.544 | 4.223 | 0.306 |
| 20 | 0 | 0 | 0 | 0 |
| 21 | 0 | 0 | 0 | 0 |
| 22 | 0 | 0 | 0 | 0 |
| 23 | 0 | 0 | 0 | 0 |
| 24 | 0 | 0 | 0 | 0 |
References
- Guo, X.; Miao, G.; Wang, X.; Yuan, L.; Li, W.; Wu, E.; Yibulayimu, X. Risk Assessment of Distribution Network Operation with Scale Distributed Photovoltaics. J. Phys. Conf. Ser. 2024, 2728, 012071. [Google Scholar] [CrossRef]
- Hu, X.; Liu, Z.W.; Wen, G.; Yu, X.; Liu, C. Voltage control for distribution networks via coordinated regulation of active and reactive power of DGs. IEEE Trans. Smart Grid 2020, 11, 4017–4031. [Google Scholar] [CrossRef]
- Iioka, D.; Fujii, T.; Orihara, D.; Tanaka, T.; Harimoto, T.; Shimada, A.; Goto, T.; Kubuki, M. Voltage reduction due to reverse power flow in distribution feeder with photovoltaic system. Int. J. Electr. Power Energy Syst. 2019, 113, 411–418. [Google Scholar]
- Petinrin, J.O.; Shaabanb, M. Impact of renewable generation on voltage control in distribution systems. Renew. Sustain. Energy Rev. 2016, 65, 770–783. [Google Scholar]
- Bayod-Rújula, Á.A.; Tejero-Gómez, J.A. Analysis of the Hybridization of PV Plants with a BESS for Annual Constant Power Operation. Energies 2022, 15, 9063. [Google Scholar] [CrossRef]
- Zheng, F.; Meng, X.; Xu, T.; Sun, Y.; Zhang, N. Voltage Zoning Regulation Method of Distribution Network with High Proportion of Photovoltaic Considering Energy Storage Configuration. Sustainability 2023, 15, 10732. [Google Scholar] [CrossRef]
- Li, Q.; Zhou, F.; Guo, F.; Fan, F.; Huang, Z. Optimized energy storage system configuration for voltage regulation of distribution network with PV access. Front. Energy Res. 2021, 9, 641518. [Google Scholar]
- Wang, H.; Wang, J.; Piao, Z.; Meng, X.; Sun, C.; Yuan, G.; Zhu, S. The Optimal Allocation and Operation of an Energy Storage System with High Penetration Grid-Connected Photovoltaic Systems. Sustainability 2020, 12, 6154. [Google Scholar] [CrossRef]
- Liao, J.; Lin, J.; Wu, G. Two-layer optimization configuration method for distributed photovoltaic and energy storage systems based on IDEC-K clustering. Energy Rep. 2024, 11, 5172–5188. [Google Scholar]
- Xiao, X.; Shi, M.; Zhou, Q.; Wei, Y.; Zhao, B. Multiobjective optimization configuration of energy storage in distribution networks based on improved marine predator algorithm. Energy Storage Sci. Technol. 2023, 12, 2565. [Google Scholar]
- Parvin, M.; Yousefi, H.; Noorollahi, Y. Techno-economic optimization of a renewable micro grid using multi-objective particle swarm optimization algorithm. Energy Convers. Manag. 2023, 277, 116639. [Google Scholar]
- Xuan, J.; Chen, Z.; Zheng, J.; Zhang, Z.; Shi, Y. Optimal planning of hybrid electric-hydrogen energy storage systems via multi-objective particle swarm optimization. Front. Energy Res. 2023, 10, 1034985. [Google Scholar]
- Luo, Y.; Tian, P.; Yan, X.; Xiao, X.; Ci, S.; Zhou, Q.; Yang, Y. Energy Storage Dynamic Configuration of Active Distribution Networks—Joint Planning of Grid Structures. Processes 2023, 12, 79. [Google Scholar] [CrossRef]
- Chiang, M.-Y.; Huang, S.-C.; Hsiao, T.-C.; Zhan, T.-S.; Hou, J.-C. Optimal Sizing and Location of Photovoltaic Generation and Energy Storage Systems in an Unbalanced Distribution System. Energies 2022, 15, 6682. [Google Scholar] [CrossRef]
- Zad, B.B.; Lobry, J.; Vallée, F. A new voltage sensitivity analysis method for medium-voltage distribution systems incorporating power losses impact. Electr. Power Compon. Syst. 2018, 46, 1540–1553. [Google Scholar] [CrossRef]
- Hao, M.; Lan, J.; Wang, L.; Lin, Y.; Wang, J.; Qin, L. Optimized Dual-Layer Distributed Energy Storage Configuration for Voltage Over-Limit Zoning Governance in Distribution Networks. Energies 2024, 17, 1847. [Google Scholar] [CrossRef]
- Huaidong, Y.; Sha, J.; Bai, G. A Method for Calculating Electrical Distance between Nodes Based on Voltage-Reactive Power Sensitivity. In Proceedings of the 2021 IEEE Sustainable Power and Energy Conference (iSPEC), Nanjing, China, 23–25 November 2021. [Google Scholar]
- Chen, J.; Wei, X.; Zhang, T.; Liu, Y.; Ma, Y.; Bian, G. Advanced Methodology for Optimal Allocation of Reactive Voltage Control Utilizing Sensitivity Matrix Analysis and Distance Evaluation Metrics. In Proceedings of the 2024 IEEE 7th Student Conference on Electric Machines and Systems (SCEMS), Macao, China, 6–8 November 2024. [Google Scholar]
- Zhang, N.; Zhao, S.; Wang, R.; Yang, J.; Yang, T.; Zhao, S. Optimization of Energy Storage in Distribution Networks Based on Voltage Sensitivity Offset. In Proceedings of the 2023 IEEE 7th Conference on Energy Internet and Energy System Integration (EI2), Hangzhou, China, 15–18 December 2023. [Google Scholar]
- Yu, P.; Guo, M.; Ling, Z.; Wang, S.; Sun, Q.; Chu, T. Bi-level Optimization Scheduling of Source Load Storage in Park Grids Based on Niche APSO Algorithm. In Proceedings of the 2024 5th International Conference on Mechatronics Technology and Intelligent Manufacturing (ICMTIM), Nanjing, China, 26–28 April 2024. [Google Scholar]
Disclaimer/Publisher’s Note: The statements, opinions and data contained in all publications are solely those of the individual author(s) and contributor(s) and not of MDPI and/or the editor(s). MDPI and/or the editor(s) disclaim responsibility for any injury to people or property resulting from any ideas, methods, instructions or products referred to in the content. |
© 2025 by the authors. Licensee MDPI, Basel, Switzerland. This article is an open access article distributed under the terms and conditions of the Creative Commons Attribution (CC BY) license (https://creativecommons.org/licenses/by/4.0/).