
Multi-Objective Optimization-Driven Research on Rural Residential Building Design in Inner Mongolia Region

Abstract
1. Introduction
2. Literature Review
2.1. Multi-Objective Optimisation of Building Energy Efficiency
2.2. Village Housing Performance Study
3. Methodology
3.1. Overview of the Study
3.2. Multi-Objective Optimisation Model Creation
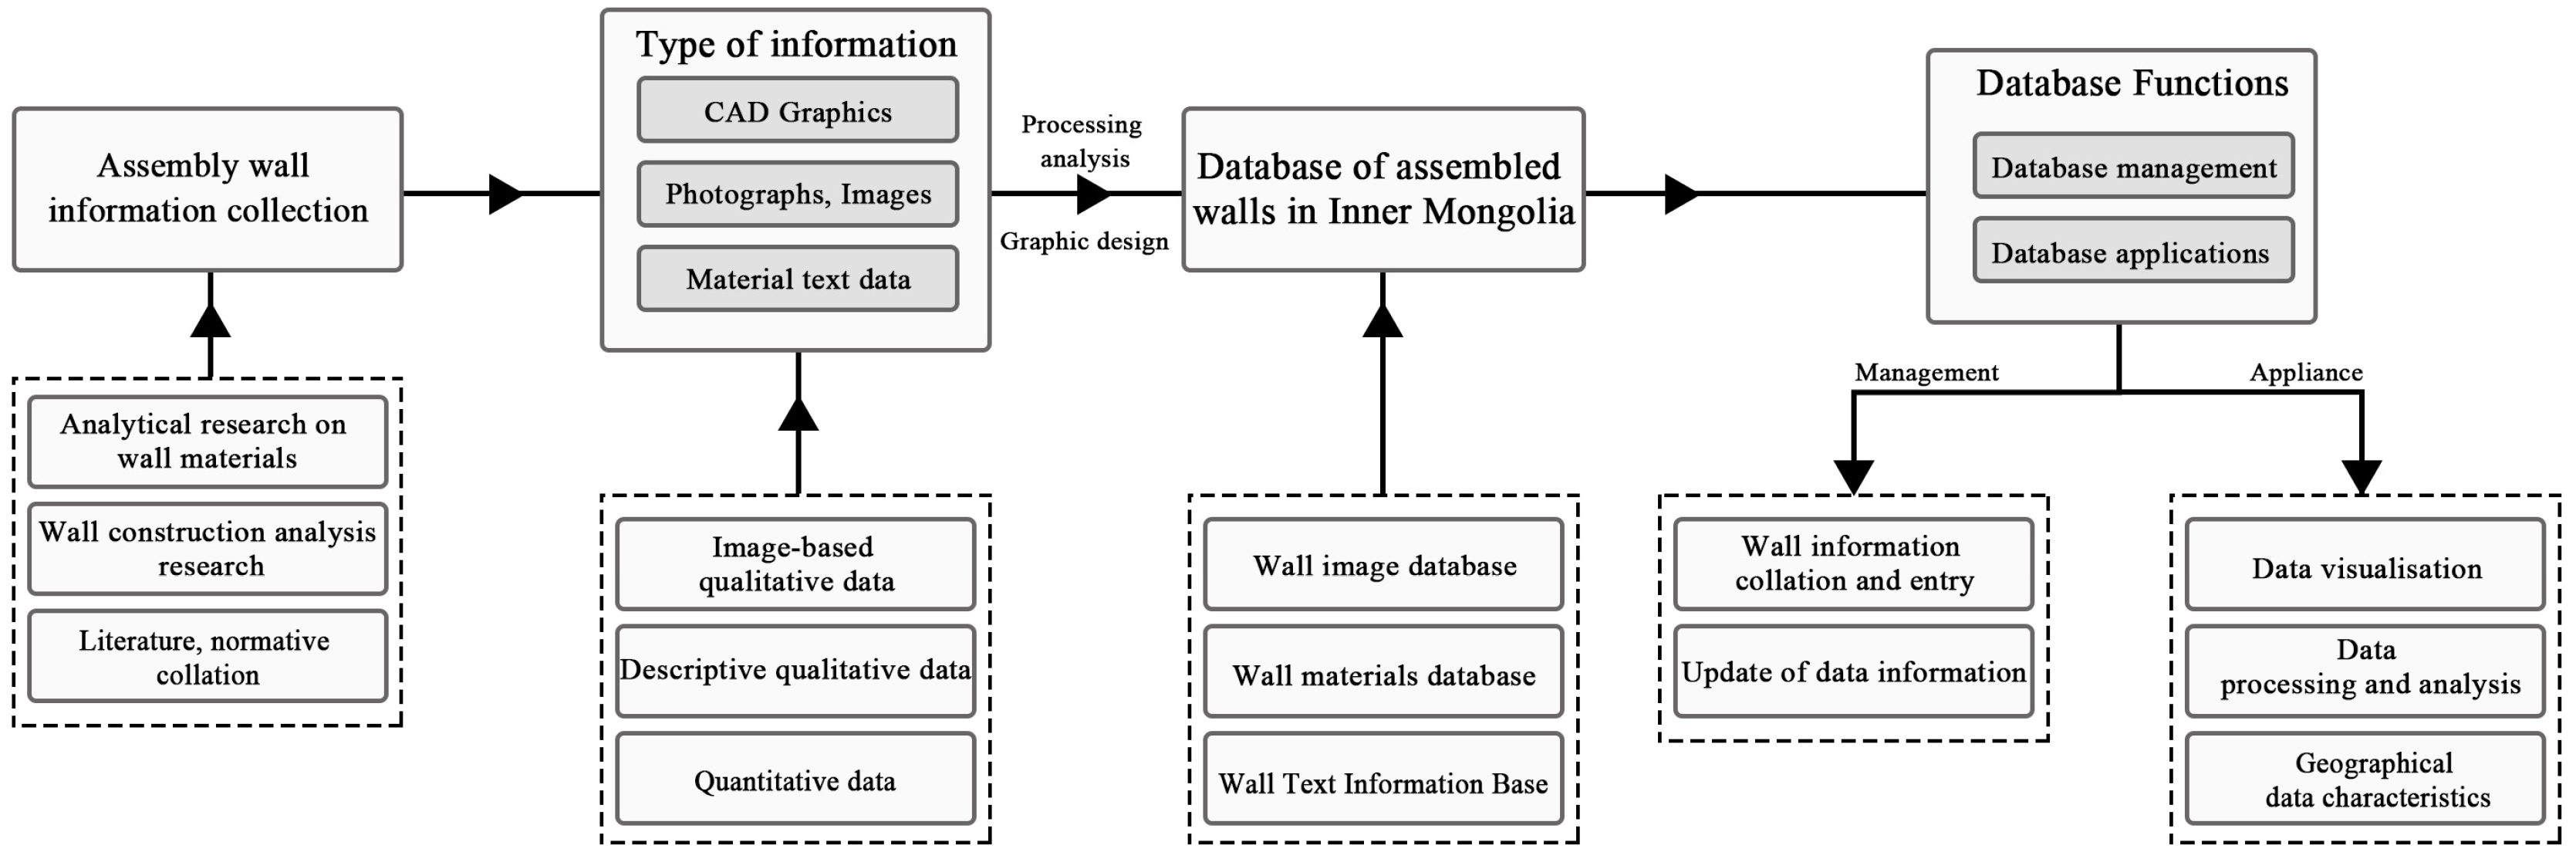
3.2.1. Residential Wall Database Construction
3.2.2. Multi-Objective Optimisation Theory and Model Creation
3.2.3. Model-Related Parameter Settings
3.3. Parameter Sensitivity Analysis
3.3.1. Optimisation Parameter Correlation Analysis
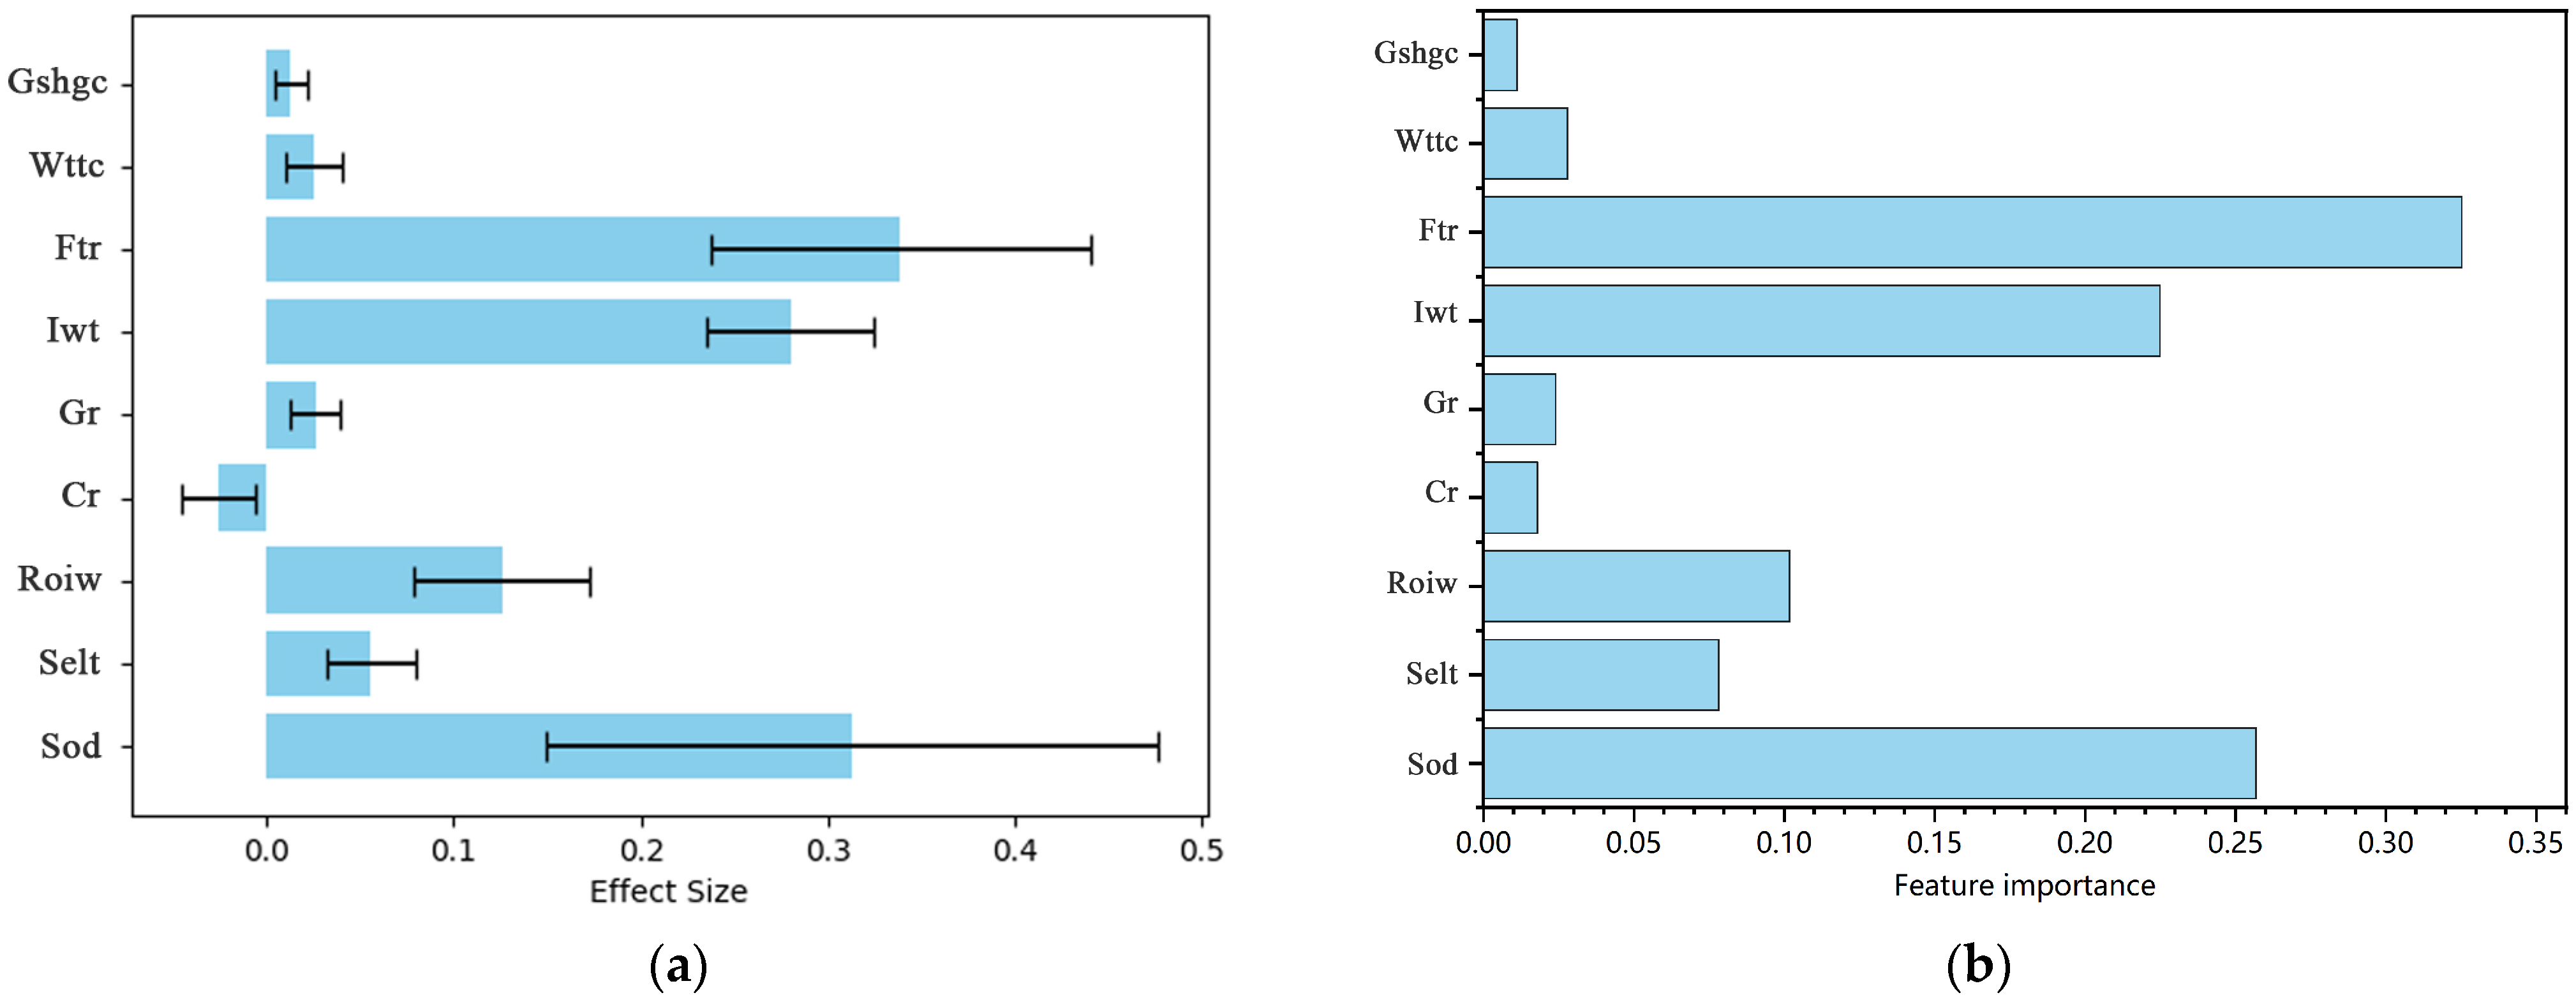
3.3.2. Sensitivity Analysis of Building Energy Consumption
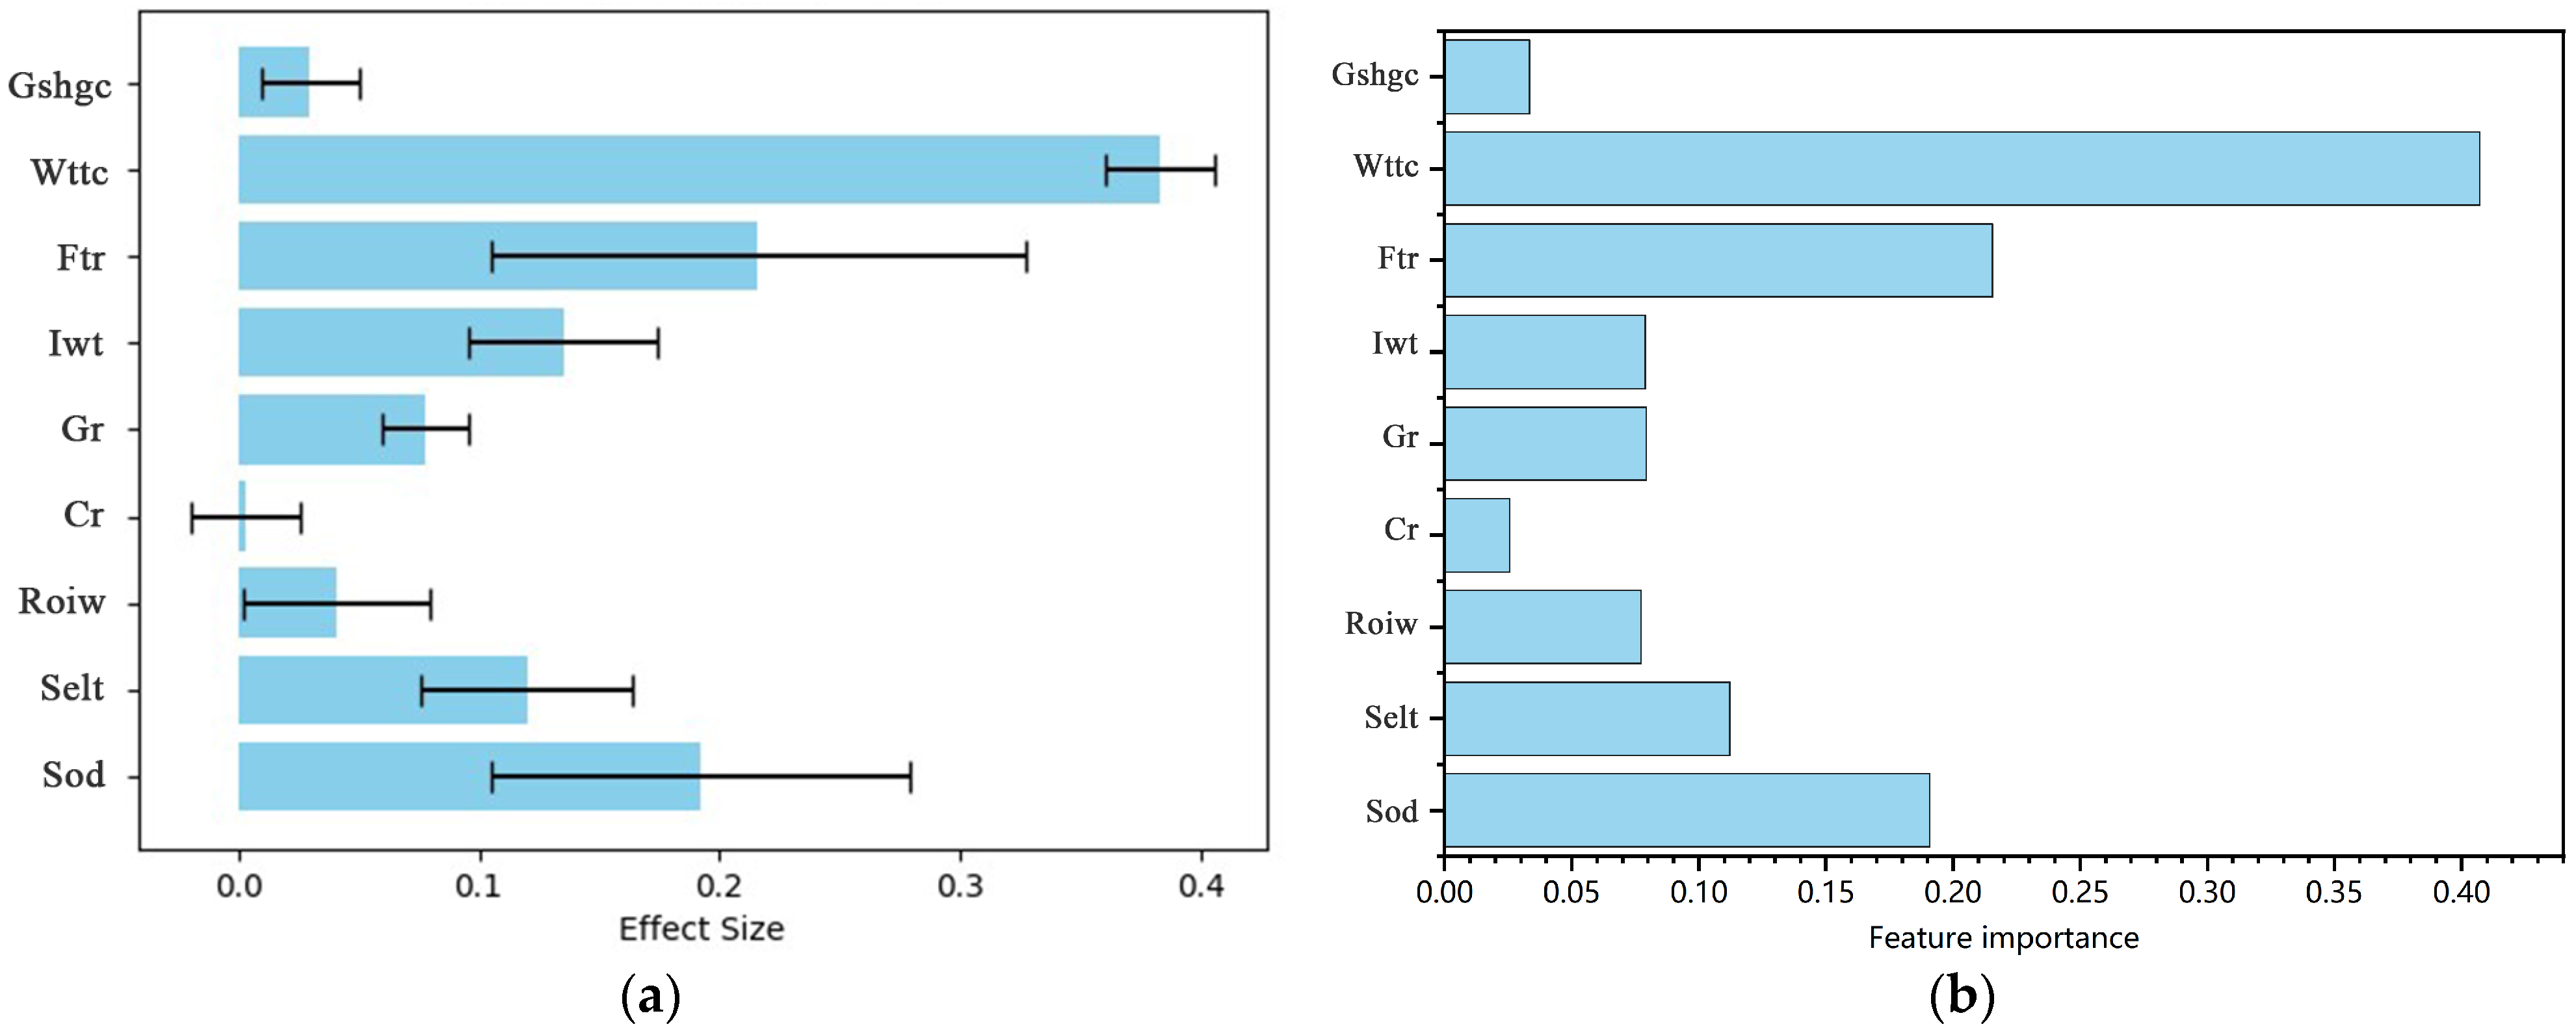
3.3.3. Sensitivity Analysis of Thermal Comfort
3.3.4. Sensitivity Analysis of Indoor Lighting
3.4. Case Study
3.4.1. Case Overview
3.4.2. Case Building Related Parameters
3.5. Performance Analysis of Typical Rural Buildings
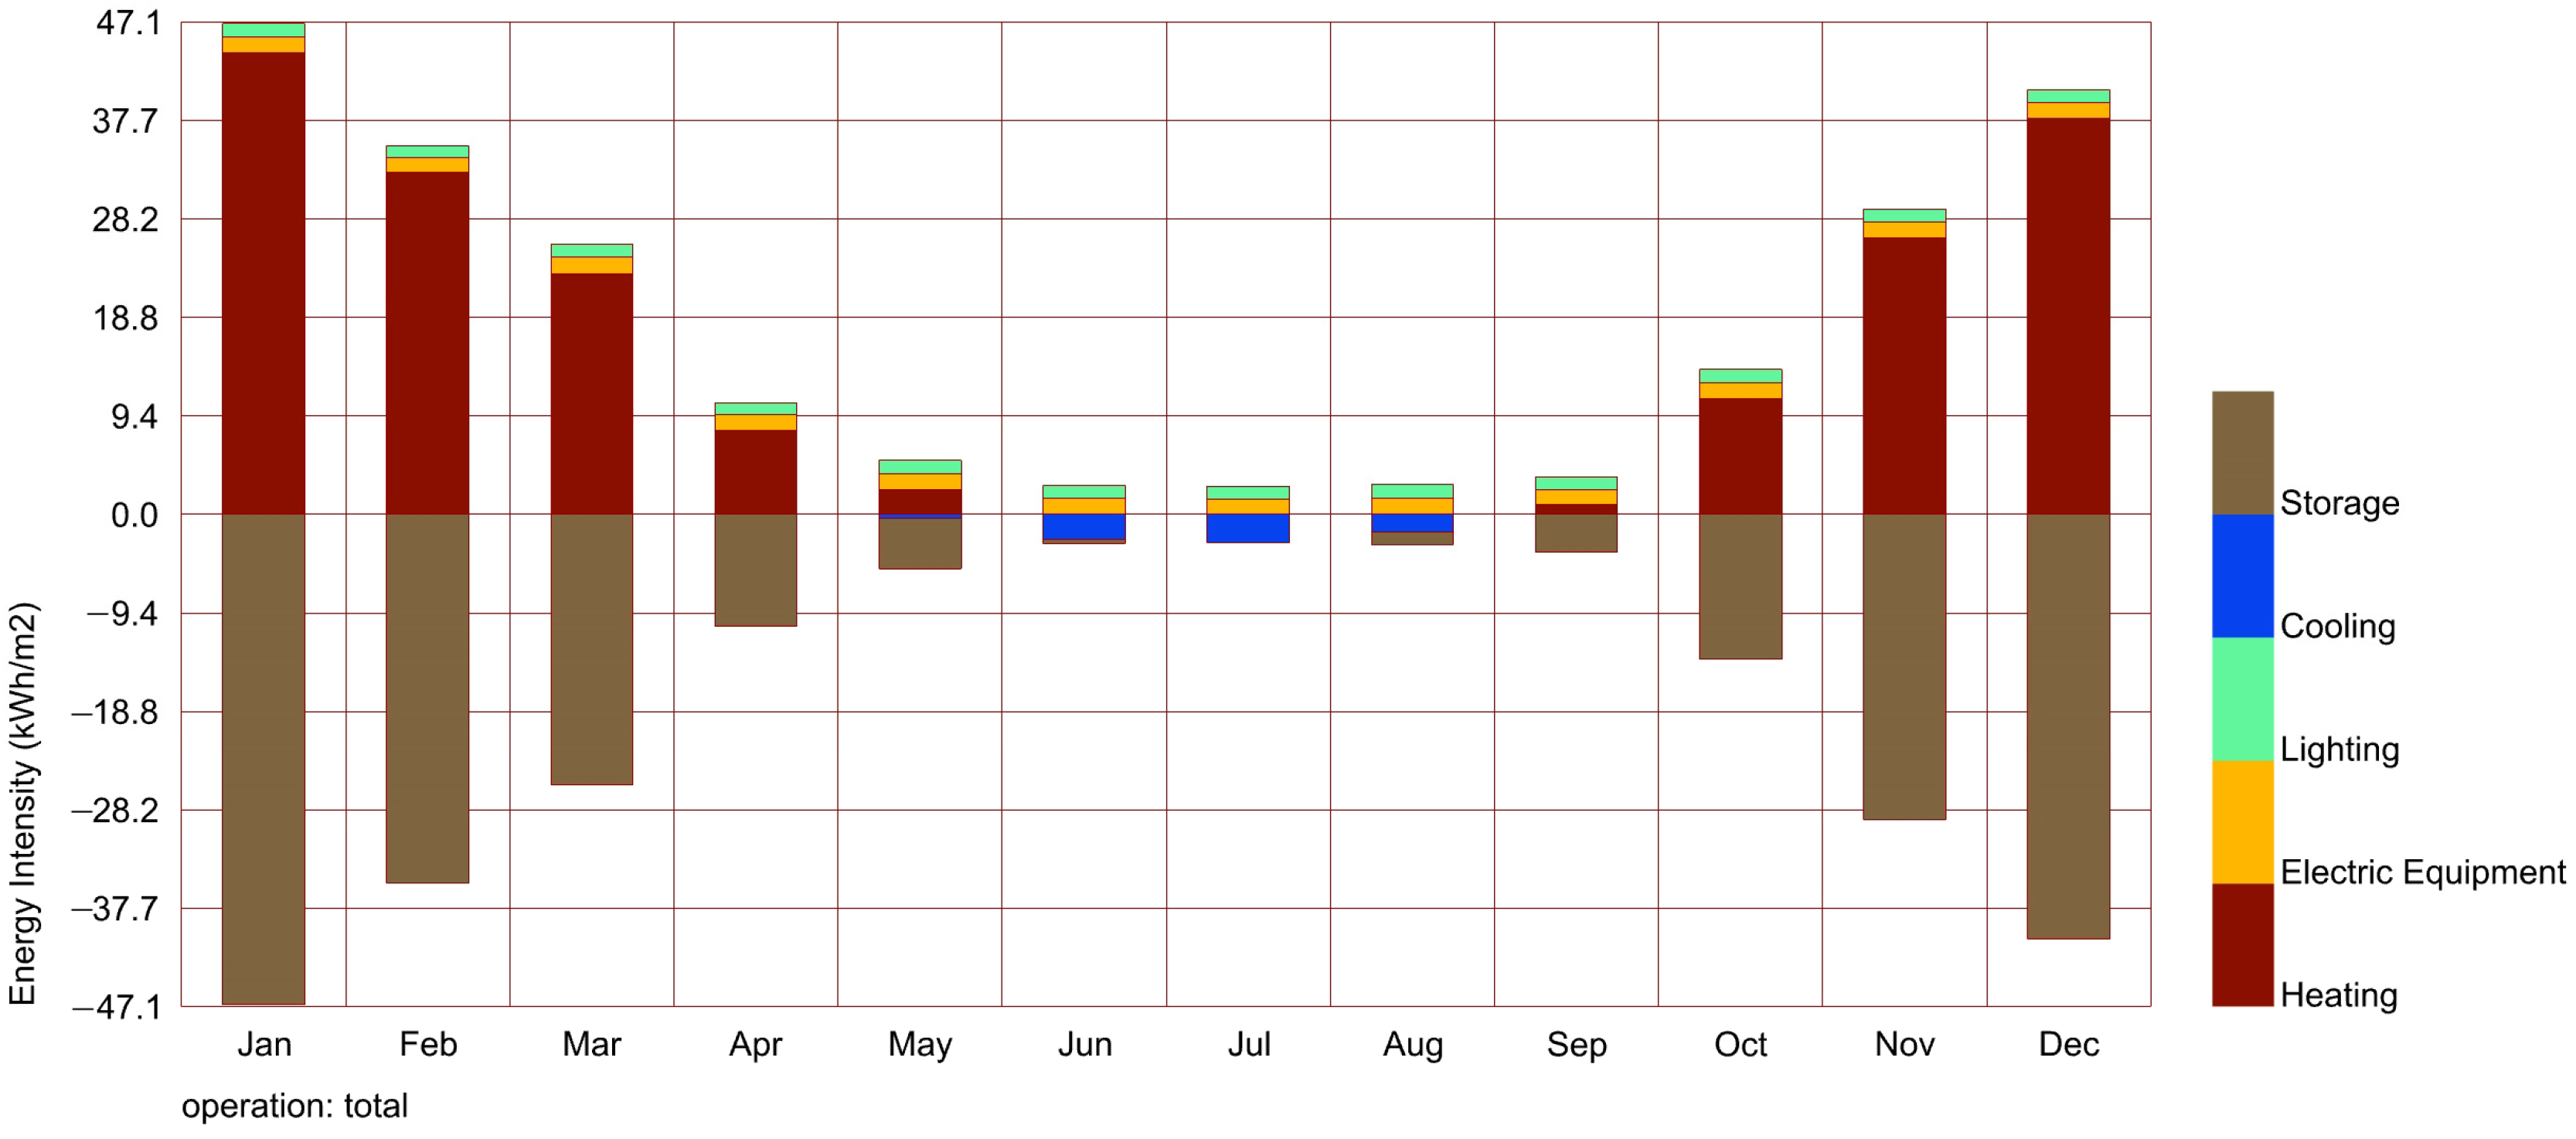
3.5.1. Analysis of Building Energy Consumption
3.5.2. Building Thermal Comfort Analysis
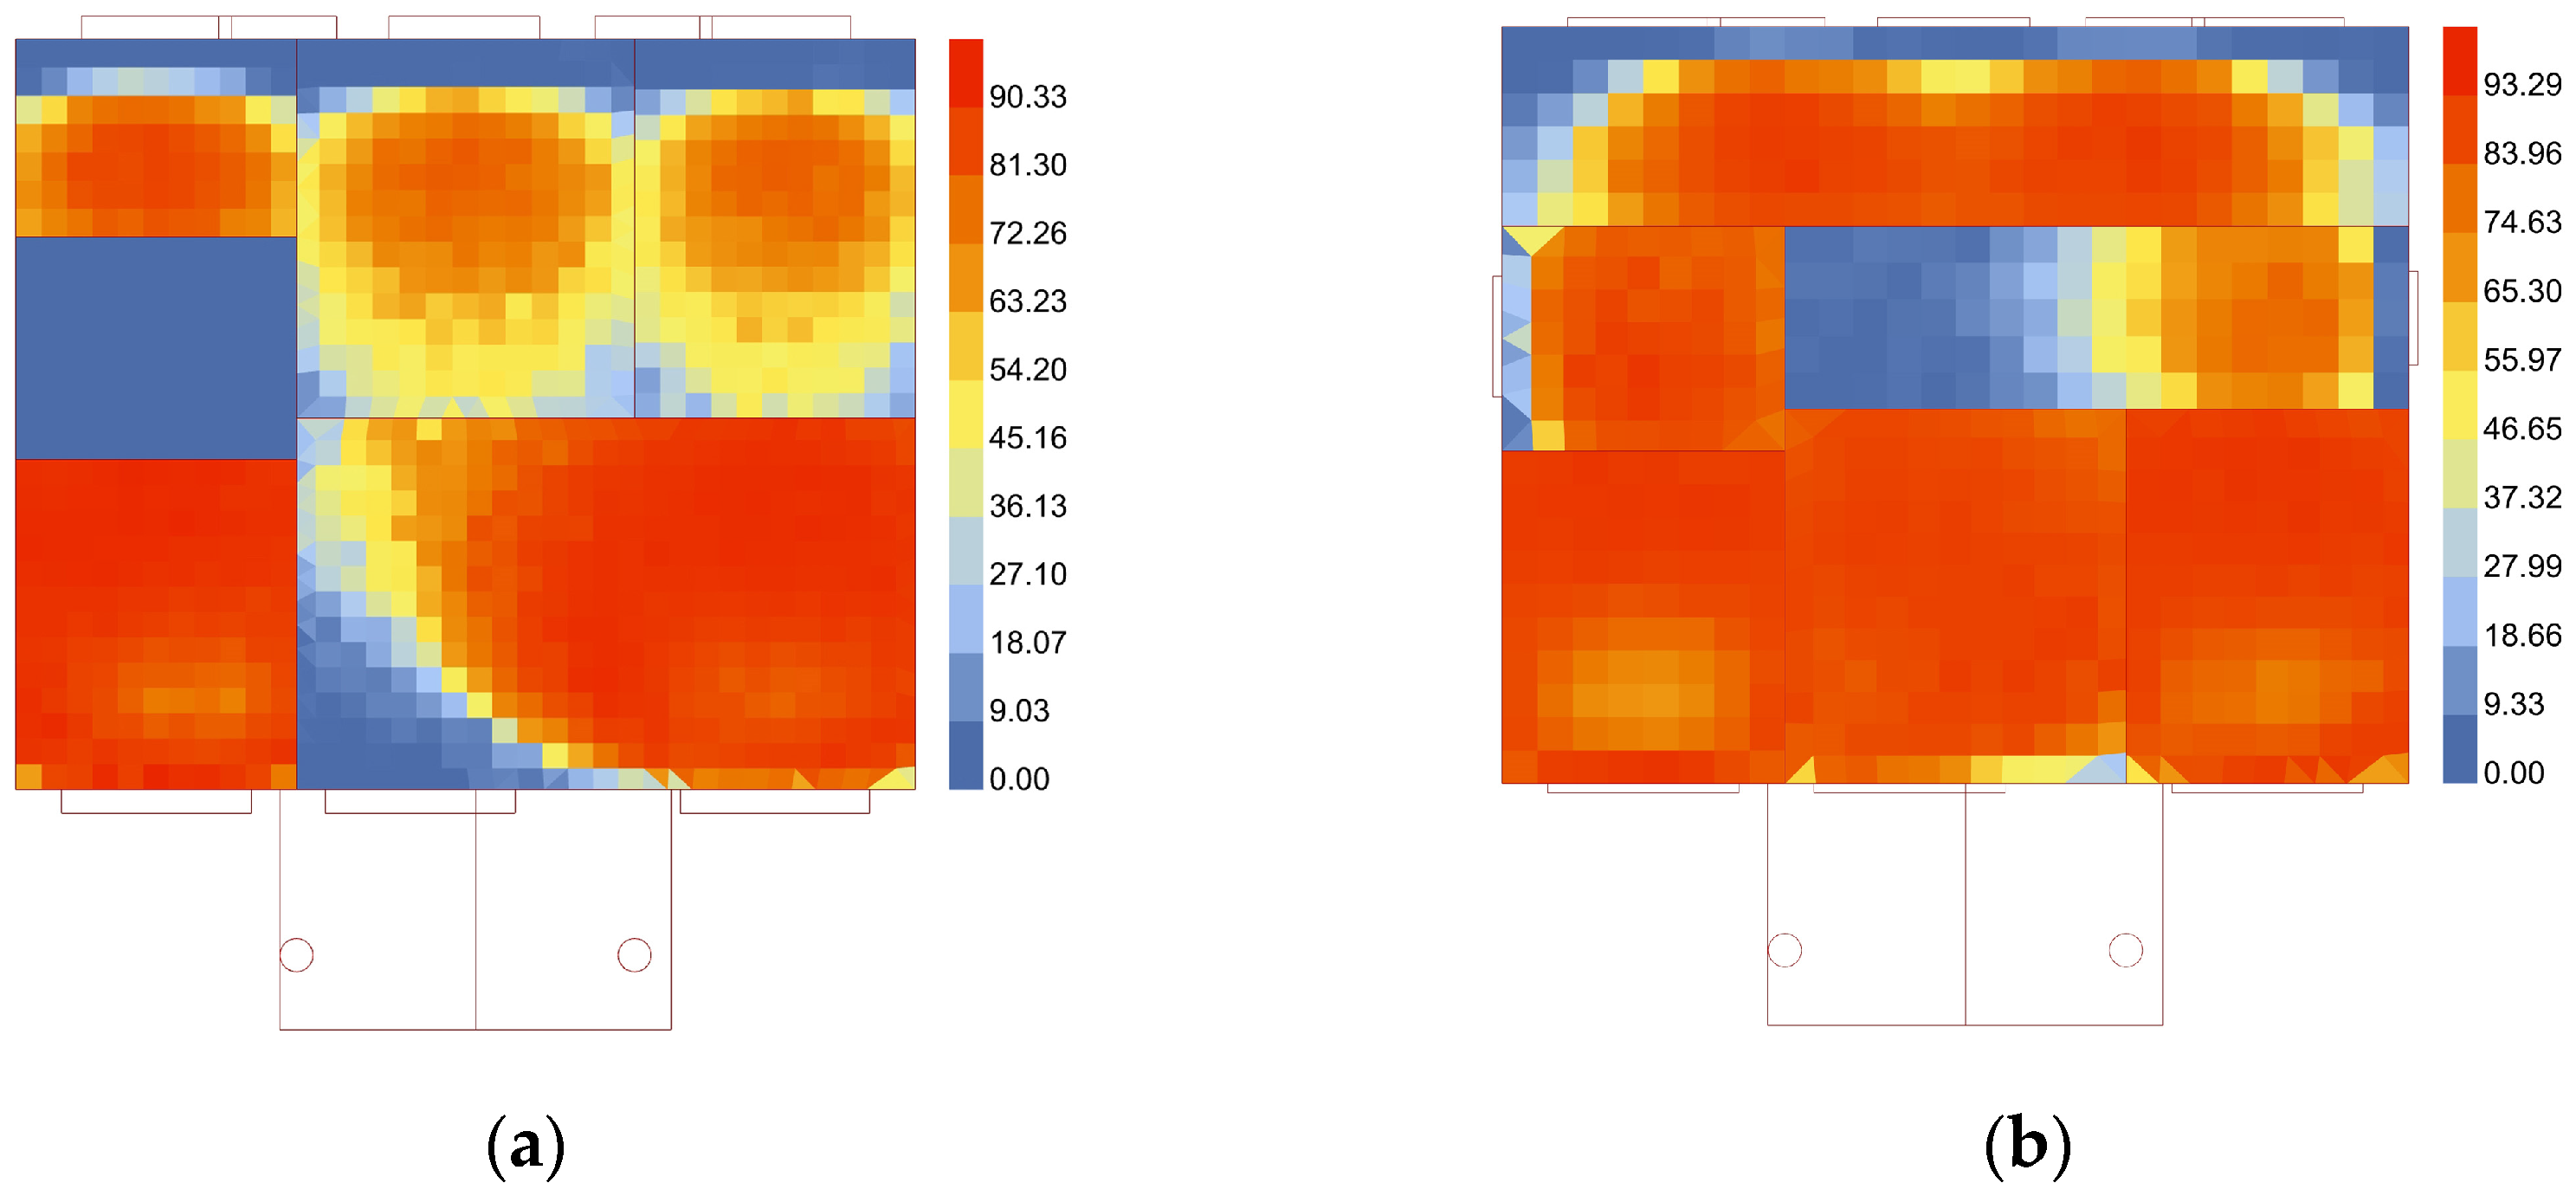
3.5.3. Building Interior Lighting Analysis
4. Results and Discussion
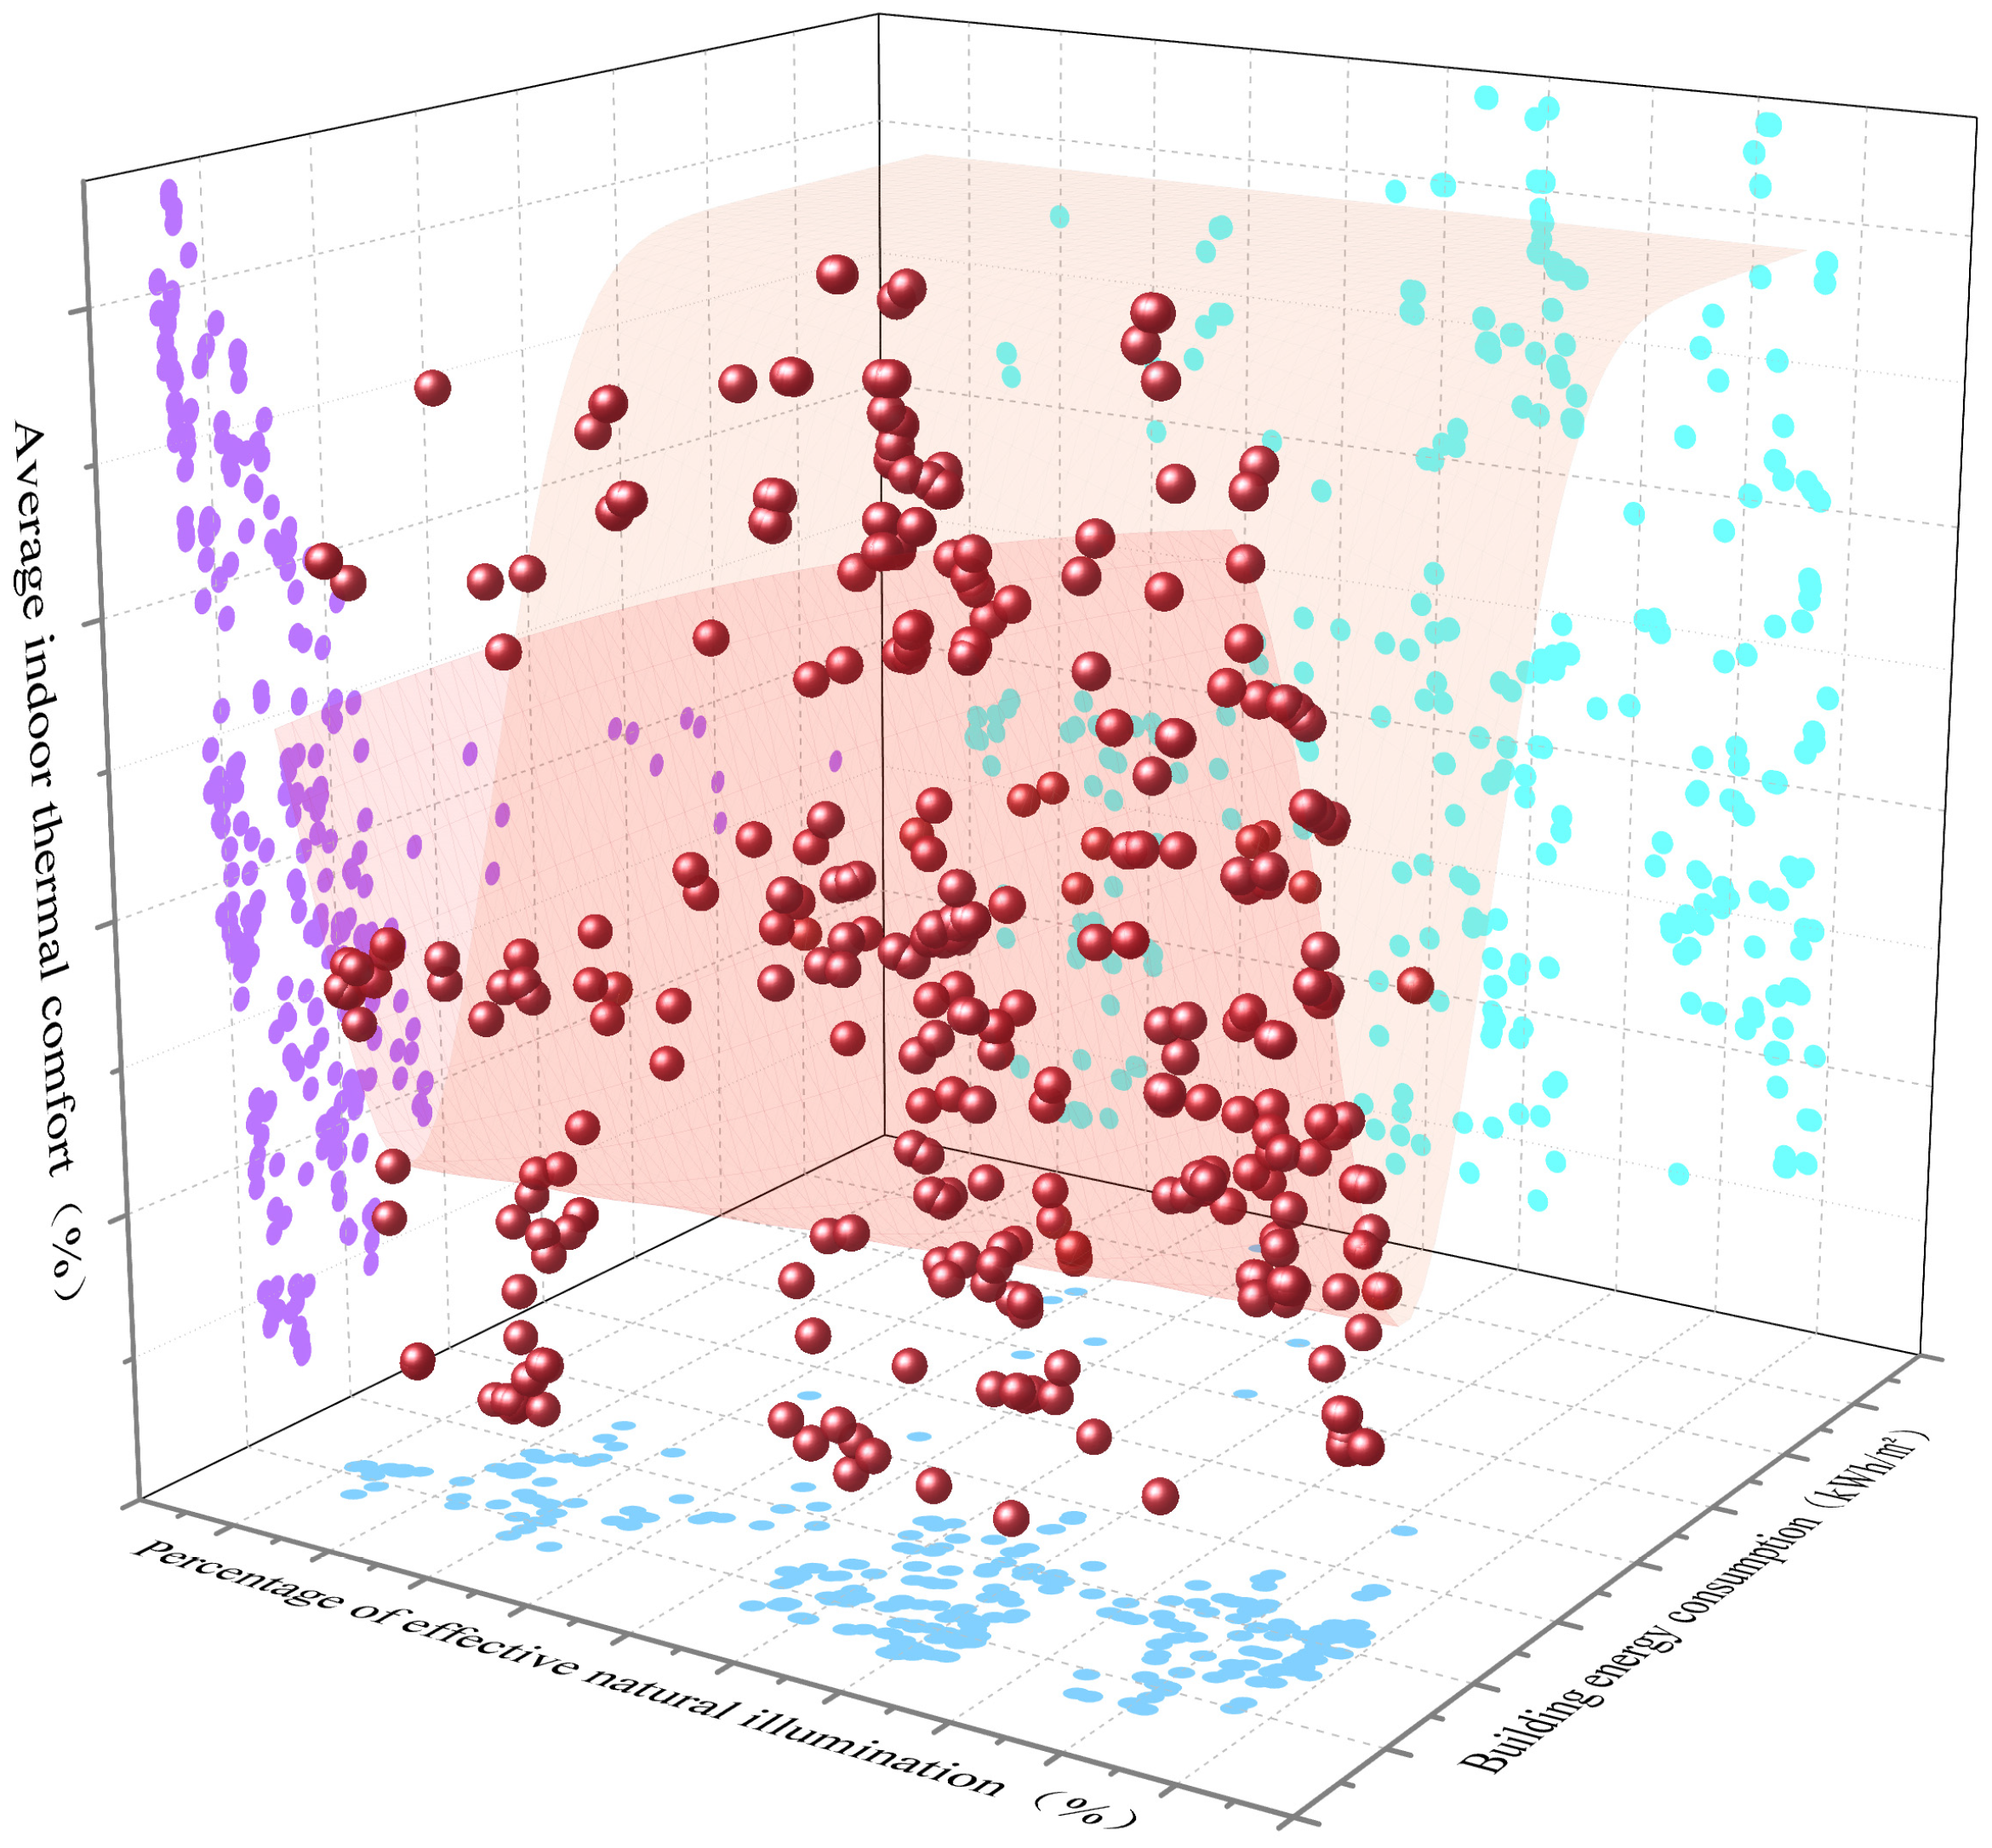
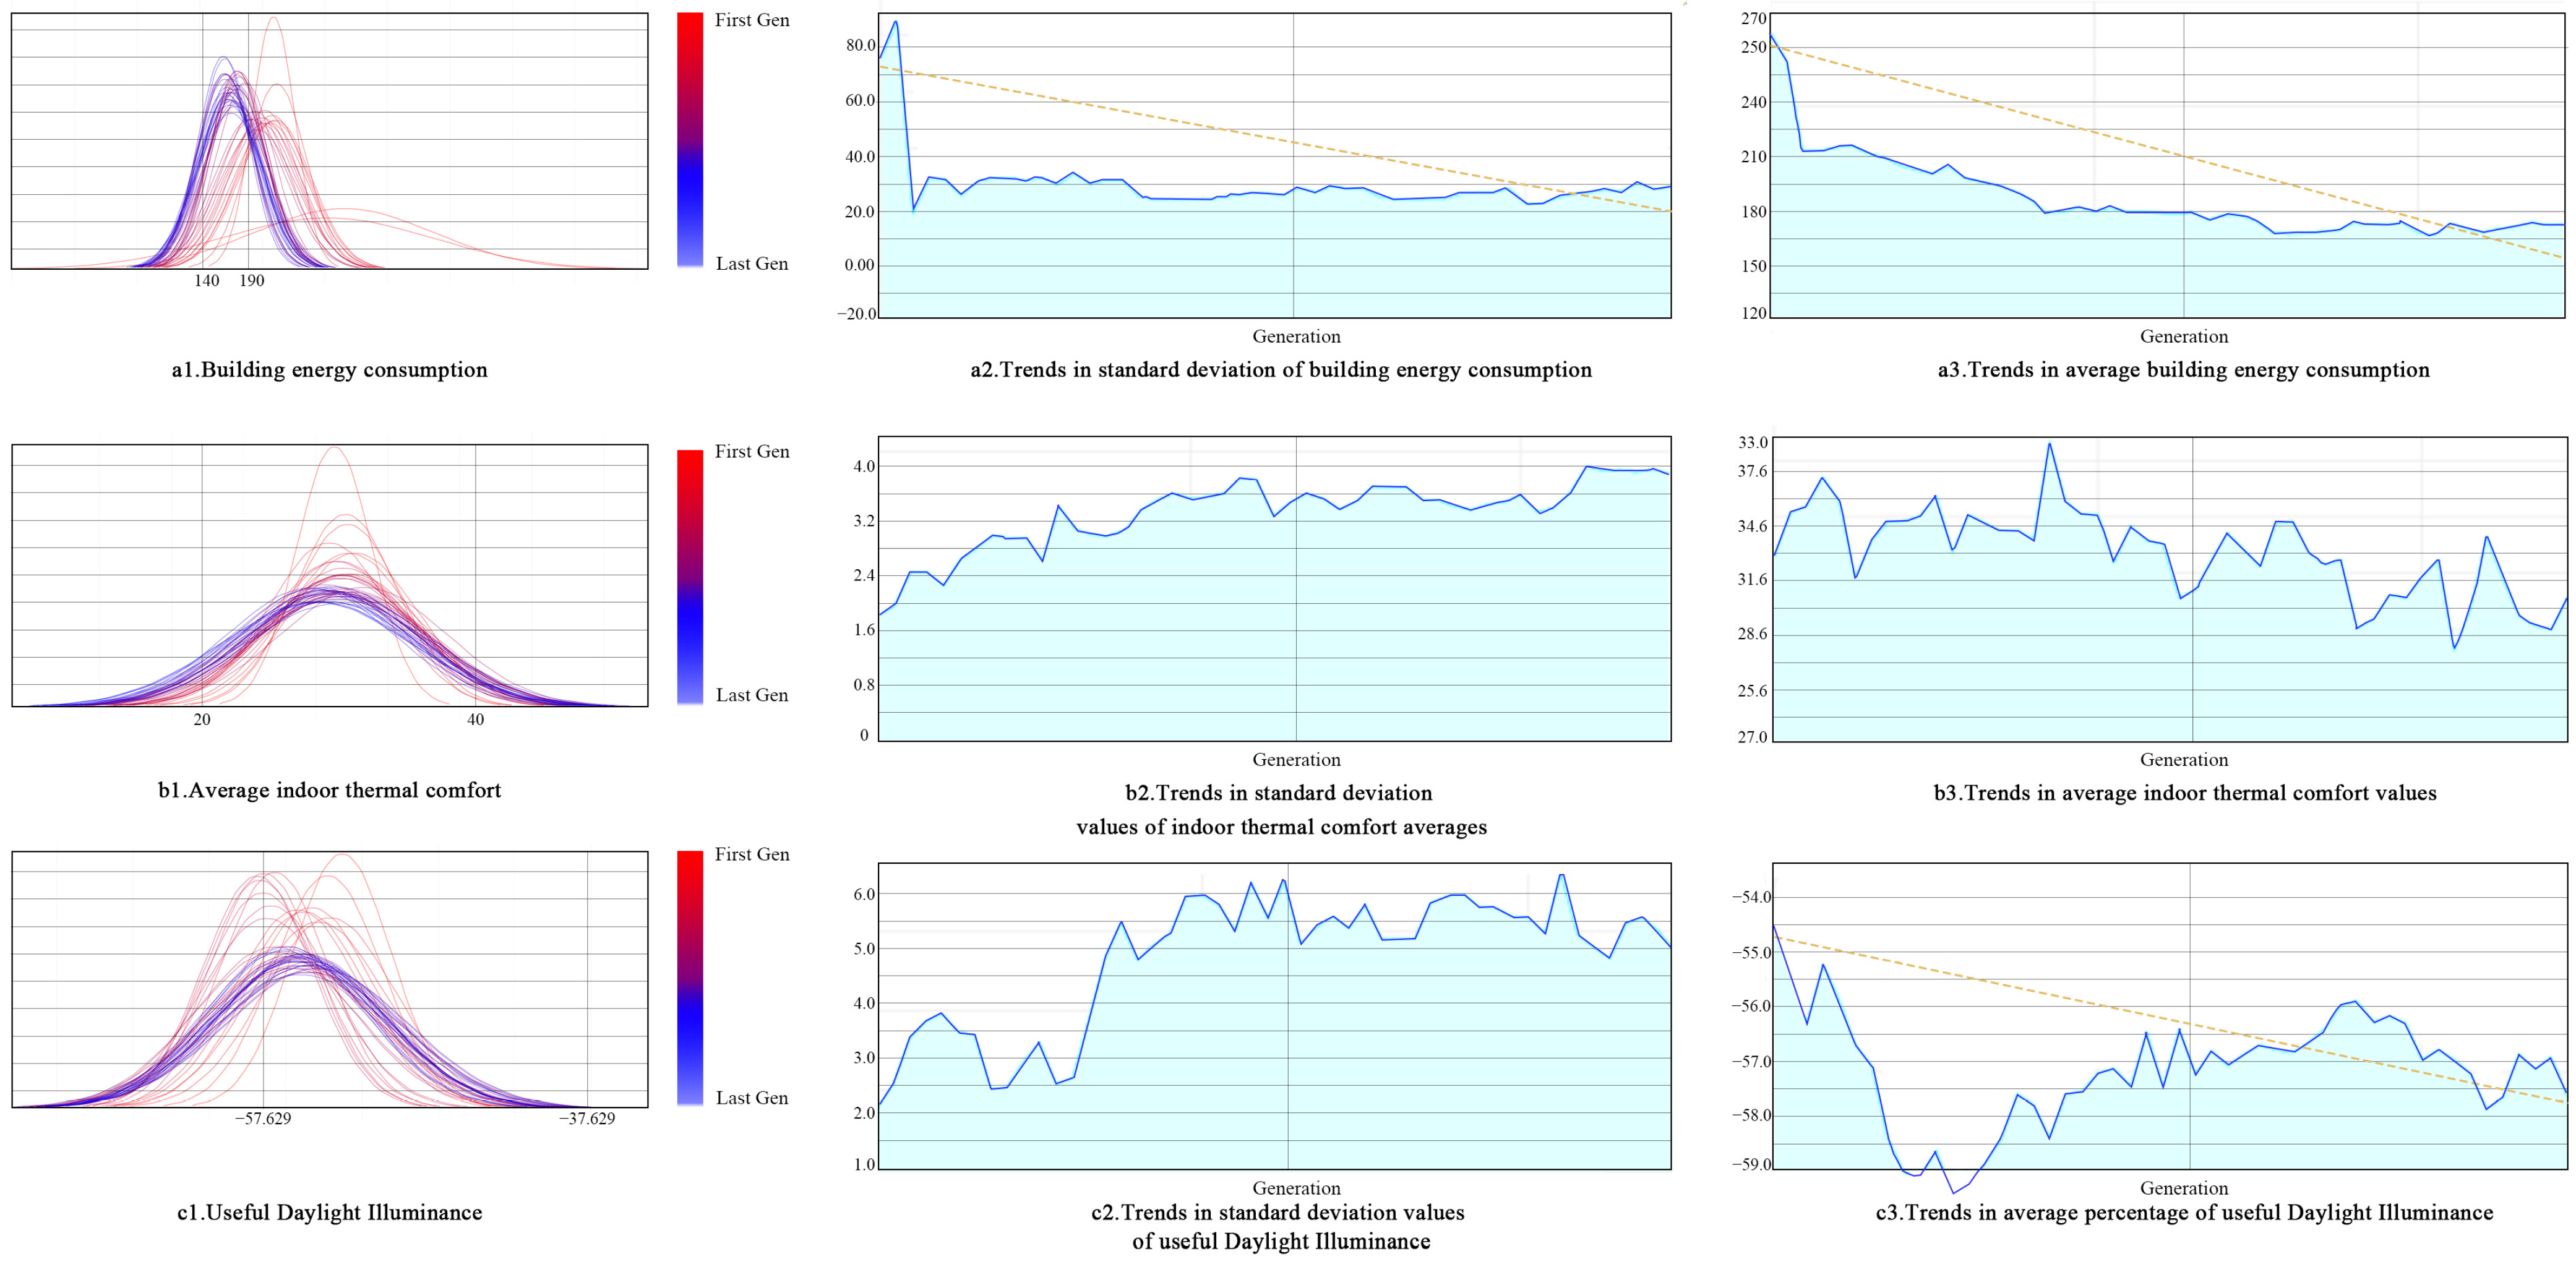
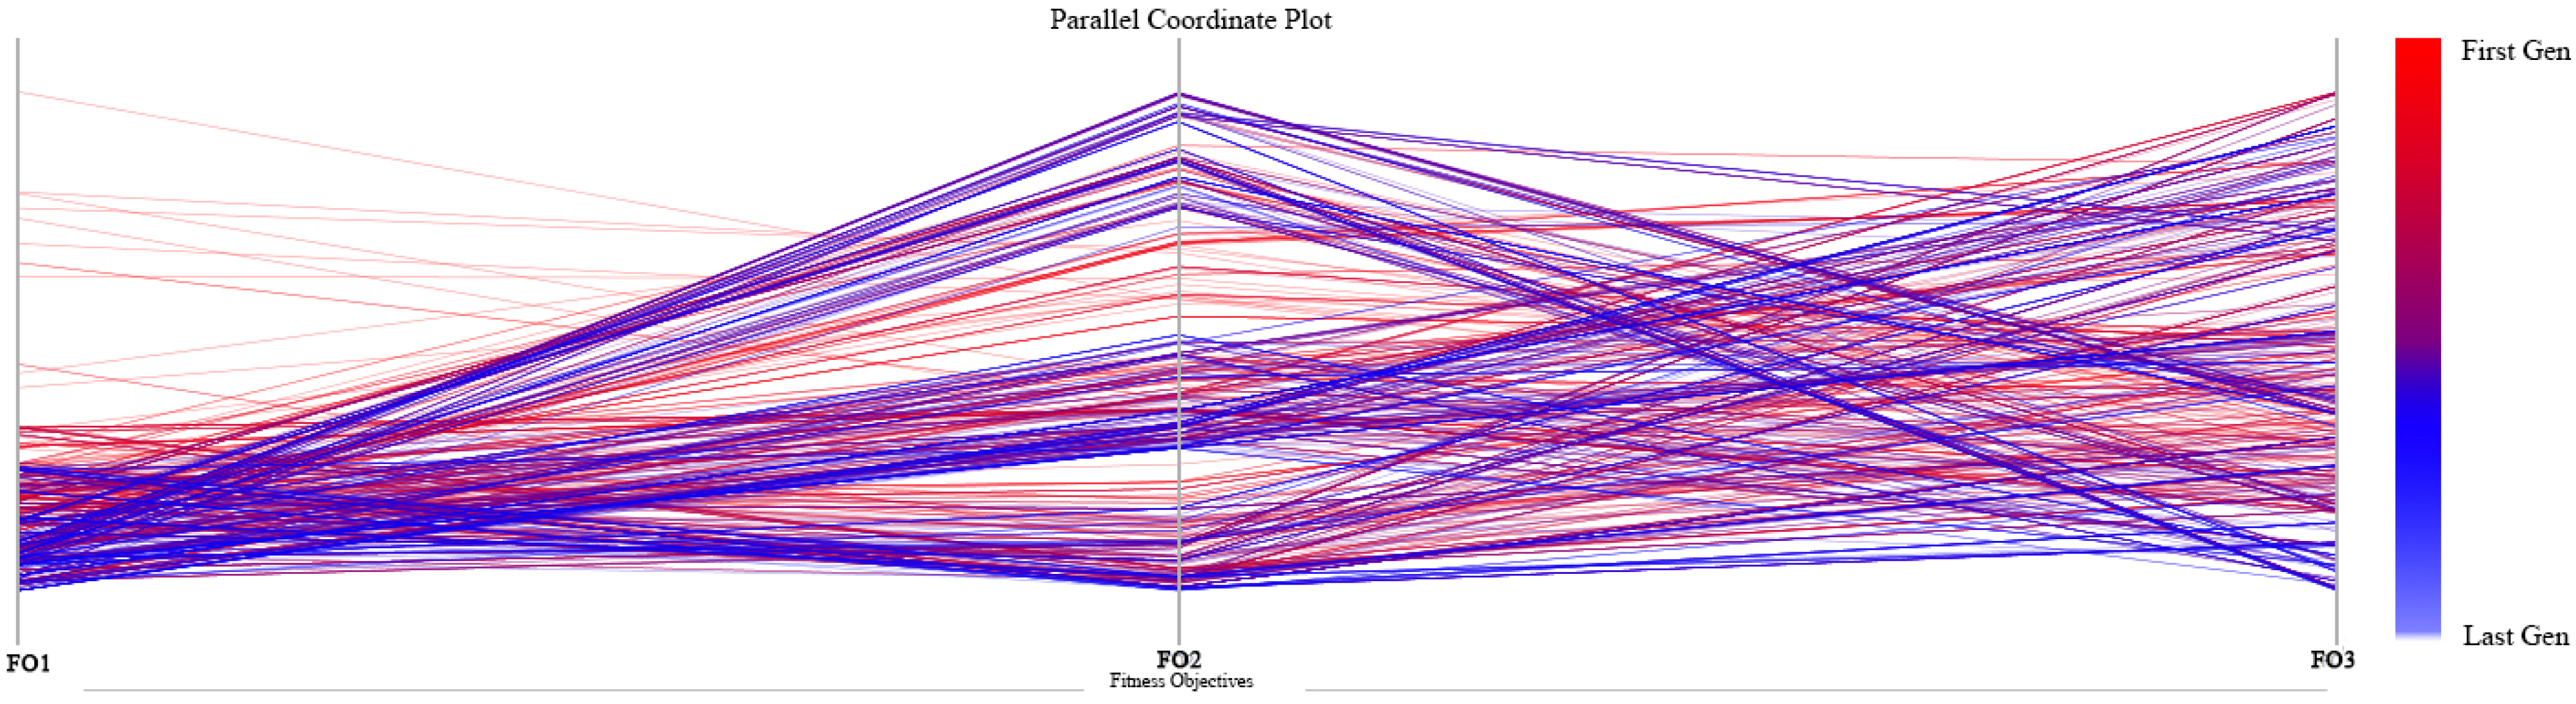
4.1. Analysis of Pareto Solution Set Distribution
4.2. Solution Set Options
4.3. Design Parameter Optimisation Solution Set
4.4. Comparison of Cases and Exploration of Universality
5. Limitations and Future Research Directions
5.1. Limitations
5.2. Future Research Directions
6. Conclusions
Author Contributions
Funding
Data Availability Statement
Conflicts of Interest
References
- Building Energy Efficiency Research Centre, Tsinghua University. China Building Energy Efficiency Annual Development Research Report 2023; Topics in Urban Energy Systems; China Building Industry Press: Beijing, China, 2023; ISBN 978-7-112-28552-5. [Google Scholar]
- Shao, T.; Zheng, W.; Zhang, K. Study on the construction of optimal design model for rural residence in cold northwest China under multi-objective conditions. Therm. Sci. Technol. 2024, 23, 300–310. [Google Scholar] [CrossRef]
- Wu, C.; Pan, H.; Luo, Z.; Liu, C.; Huang, H. Multi-objective optimization of residential building energy consumption, daylighting, and thermal comfort based on BO-XGBoost-NSGA-II. Build. Environ. 2024, 254, 111386. [Google Scholar] [CrossRef]
- Pan, Y.; Shen, Y.; Qin, J.; Zhang, L. Deep reinforcement learning for multi-objective optimization in BIM-based green building design. Autom. Constr. 2024, 166, 105598. [Google Scholar] [CrossRef]
- Liu, M.; Que, Y.; Yang, N.; Yan, C.; Liu, Q. Research on Multi-Objective Optimization Design of University Student Center in China Based on Low Energy Consumption and Thermal Comfort. Energies 2024, 17, 2082. [Google Scholar] [CrossRef]
- Zhang, Z.; Yao, J.; Zheng, R. Multi-Objective Optimization of Building Energy Saving Based on the Randomness of Energy-Related Occupant Behavior. Sustainability 2024, 16, 1935. [Google Scholar] [CrossRef]
- Lyu, H.; Herring, D.; Wang, L.; Ninic, J.; Andrews, J.; Li, M.; Kočvara, M.; Spill, F.; Wang, S. Multi-Objective Optimization for Flexible Building Space Usage. In Proceedings of the 2024 IEEE Conference on Artificial Intelligence (CAI), Singapore, 25–27 June 2024; pp. 932–939. [Google Scholar]
- Ding, Z.; Li, J.; Wang, Z.; Xiong, Z. Multi-Objective Optimization of Building Envelope Retrofits Considering Future Climate Scenarios: An Integrated Approach Using Machine Learning and Climate Models. Sustainability 2024, 16, 8217. [Google Scholar] [CrossRef]
- Yao, B.; Salehi, A.; Baghoolizadeh, M.; Khairy, Y.; Baghaei, S. Multi-objective optimization of office egg shadings using NSGA-II to save energy consumption and enhance thermal and visual comfort. Int. Commun. Heat Mass Transf. 2024, 157, 107697. [Google Scholar] [CrossRef]
- Ascione, F.; Bianco, N.; Mauro, G.M.; Vanoli, G.P. A new comprehensive framework for the multi-objective optimization of building energy design: Harlequin. Appl. Energy 2019, 241, 331–361. [Google Scholar] [CrossRef]
- Ouanes, S.; Sriti, L. Regression-based sensitivity analysis and multi-objective optimisation of energy performance and thermal comfort: Building envelope design in hot arid urban context. Build. Environ. 2024, 248, 111099. [Google Scholar] [CrossRef]
- Makhloufi, A.W.; Louafi, S. Optimising building performance for a resilient Future: A Multi-Objective approach to Net Zero energy strategies. Energy Build. 2024, 324, 114869. [Google Scholar] [CrossRef]
- Khani, A.; Khakzand, M.; Faizi, M. Multi-objective optimization for energy consumption, visual and thermal comfort performance of educational building (case study: Qeshm Island, Iran). Sustain. Energy Technol. Assess. 2022, 54, 102872. [Google Scholar] [CrossRef]
- Vukadinović, A.; Radosavljević, J.; Đorđević, A.; Protić, M.; Petrović, N. Multi-objective optimization of energy performance for a detached residential building with a sunspace using the NSGA-II genetic algorithm. Sol. Energy 2021, 224, 1426–1444. [Google Scholar] [CrossRef]
- Canbolat, A.S.; Albak, E.İ. Multi-Objective Optimization of Building Design Parameters for Cost Reduction and CO2 Emission Control Using Four Different Algorithms. Appl. Sci. 2024, 14, 7668. [Google Scholar] [CrossRef]
- Chegari, B.; Tabaa, M.; Simeu, E.; Moutaouakkil, F.; Medromi, H. Multi-objective optimization of building energy performance and indoor thermal comfort by combining artificial neural networks and metaheuristic algorithms. Energy Build. 2021, 239, 110839. [Google Scholar] [CrossRef]
- Zhou, Y.; Wang, Y.; Li, C.; Ding, L.; Yang, Z. Health and comfort oriented automatic generative design and optimization of residence space layout: An integrated data-driven and knowledge-based approach. Dev. Built Environ. 2024, 17, 100318. [Google Scholar] [CrossRef]
- Yao, S.; Jiang, Z.Z.; Yuan, J.Y.; Wang, Z.K.; Sun, R. Optimisation of rural residential performance based on global sensitivity analysis. J. Jinan Univ. (Nat. Sci. Ed.) 2023, 37, 339–348+361. [Google Scholar] [CrossRef]
- Shao, T.; Zhang, N.; Zhang, K.; Zheng, W.; Wang, J. Research on high-dimensional multi-performance collaborative optimisation design of rural houses in Xi’an based on SVM and NSGA-II algorithms. Build. Sci. 2024, 40, 232–243. [Google Scholar] [CrossRef]
- Hepple, R.; Zhao, Y.; Yang, R.; Zhang, Q.; Yang, S. Investigating the Effects of PCM-Integrated Walls on Thermal Performance for UK Residential Buildings of Different Typologies. Buildings 2024, 14, 3382. [Google Scholar] [CrossRef]
- Xi, H.; Wang, B.; Hou, W. Machine learning-based prediction of indoor thermal comfort in traditional Chinese dwellings: A case study of Hankou Lifen. Case Stud. Therm. Eng. 2024, 61, 105048. [Google Scholar] [CrossRef]
- Carratt, A.; Kokogiannakis, G.; Daly, D. Using calibrated minimum input models to predict retrofit performance on residential dwellings. J. Build. Perform. Simul. 2025, 18, 39–55. [Google Scholar] [CrossRef]
- Schaefer, A.; Scolaro, T.P.; Ghisi, E. Finding Patterns of Construction Systems in Low-Income Housing for Thermal and Energy Performance Evaluation through Cluster Analysis. Sustainability 2023, 15, 12793. [Google Scholar] [CrossRef]
- Luo, X.; Du, L. Energy consumption simulations of rural residential buildings considering differences in energy use behavior among family members. Build. Simul. 2024, 17, 1335–1358. [Google Scholar] [CrossRef]
- Fu, Y.; Wang, C.C. Optimisation of Embodied Carbon and Thermal Performance of Roof Material Selections for Australian Residential Housing. Buildings 2025, 15, 268. [Google Scholar] [CrossRef]
- Boumlik, K.; Belarbi, R.; Ahachad, M.; Mahdaoui, M.; Radoine, H.; Krarti, M. Design Optimization of Energy-Efficient Residential Buildings in Morocco. Buildings 2024, 14, 3915. [Google Scholar] [CrossRef]
- Shen, X.; Ye, X. Environmental performance driven optimization of urban modular housing layout in Singapore. J. Asian Archit. Build. Eng. 2025, 24, 910–923. [Google Scholar] [CrossRef]
- Al-Absi, Z.A.; Asif, M.; Hafizal, M.I.M. Optimization study for PCM application in residential buildings under desert climatic conditions. J. Energy Storage 2024, 104, 114399. [Google Scholar] [CrossRef]
- Gessert, F.; Wingerath, W.; Friedrich, S.; Ritter, N. NoSQL database systems: A survey and decision guidance. Comput. Sci.-Res. Dev. 2017, 32, 353–365. [Google Scholar] [CrossRef]
- Taipalus, T. Database management system performance comparisons: A systematic literature review. J. Syst. Softw. 2024, 208, 111872. [Google Scholar] [CrossRef]
- Liu, K.; Xu, X.; Huang, W.; Zhang, R.; Kong, L.; Wang, X. A multi-objective optimization framework for designing urban block forms considering daylight, energy consumption, and photovoltaic energy potential. Build. Environ. 2023, 242, 110585. [Google Scholar] [CrossRef]
- Royston, J.P. Shapiro-Wilk Normality Test and P-Value. Appl. Stat. 1995, 44, 445. [Google Scholar]
- JGJ 26-2018; Design Standard for Energy Efficiency of Residential Buildings in Severe Cold and Cold Zones. China Architecture & Building Press: Beijing, China, 2018.
- Jin, H.; Shao, T. Multi-Objective Optimization for Passive Low-Energy Residential Building Design in Severe Cold Rural Areas. Contemp. Archit. 2021, 51–54. [Google Scholar]
- Gao, Y.; Chi, J.Y.; Luo, S.L.; Hu, K.; Yuan, J.Y.; Yue, X.P. Octopus+Honeybee-Based Multi-Objective Optimization Framework for Passive Energy-Saving Design of Rural Buildings in Tianjin. J. Xi’an Univ. Technol. 2021, 37, 488–497. [Google Scholar] [CrossRef]
- Xie, C.; Yao, G.; Han, C.F. Multi-Objective Optimization Strategy for Energy Retrofit of Rural Houses in Xuzhou: Integrated Evaluation of Carbon Emissions, Cost, and Thermal Comfort. Chin. Overseas Archit. 2021, 1–14. Available online: http://kns.cnki.net/kcms/detail/43.1255.tu.20250113.1140.002.html (accessed on 4 April 2025).


| Name of Material | Thermal Conductivity W/(m·K) | Vapour Permeability Coefficient G/(m·h.Pa) | Densities Kg/m³ | Heat Storage Capacity W/(m2·K) | |
|---|---|---|---|---|---|
| Insulation material | Extruded polystyrene sheet | 0.030 | — | 35 | 0.34 |
| Moulded Polystyrene Sheet | 0.039 | — | 30 | 0.36 | |
| Moulded Polystyrene Sheet | 0.041 | — | 20 | 0.36 | |
| Rock wool | 0.040 | 4.880 | 180 | 0.70 | |
| Aerogel | 0.016 | — | 3.55 | — | |
| Concrete | Shale ceramsite concrete | 0.500 | 0.435 | 1100 | 6.70 |
| Haydite concrete | 0.84 | 0.315 | 1600 | 10.36 | |
| Volcanic ash, sand, cement concrete | 0.57 | 0.395 | 1700 | 6.30 | |
| Fly ash ceramsite concrete | 0.44 | 1.350 | 1100 | 6.30 | |
| Finishing materials | Marble | 2.91 | 0.113 | 2800 | 23.27 |
| Granite | 3.49 | 0.113 | 2800 | 25.49 | |
| Woodwork | 0.35 | 3.000 | 700 | 6.93 | |
| Mortar | Vitrified microsphere insulation slurry | 0.080 | — | 350 | — |
| Rubber powder polystyrene particle thermal insulation mortar | 0.070 | — | 300 | — |
| Field Name | Data Type | Null Value | Clarification | |
|---|---|---|---|---|
| No. | id | Int | N | |
| Wall Name | w-name | varchar | N | Record the name of the wall |
| Wall Number | w-num | varchar | N | Numbering the walls |
| Image Name | img-name | varchar | N | Recording of wall construction images |
| Image Data | img-path | mediumblob | N | Data path for recording images |
| Image Number | img-num | varchar | N | Numbering the images |
| Material Number | m-num | varchar | N | For wall construction materials |
| Material Content | material | tinytext | Y | Description of wall construction materials, remarks text |
| Comparison Dimension | Grasshopper + Wallacei | Other Multi-Objective Optimisation Tools |
|---|---|---|
| User Interface and Interactivity | Based on a visual programming environment (Grasshopper), it supports node-based parametric operations and is suitable for users with a non-programming background. | Mostly traditional GUIs or code-driven interfaces (e.g., jMetal requires programming), with a steeper learning curve. |
| Optimisation algorithm flexibility | Based on NSGA-II algorithm, supports customised fitness functions; suitable for small to medium sized problems. | Provide a broader library of algorithms (e.g., MOEA/D, SPEA2) and support large-scale multidisciplinary optimisation (e.g., ModeFRONTIER). |
| Visualisation and post-processing | Built-in interactive 3D visualisation and dynamic Pareto Frontier analysis supports simultaneous exploration of design space and target space. | Reliance on external tools (e.g., MATLAB R2023a, ParaView 5.12) for advanced visualisation and process fragmentation. |
| Domain Applicability | For building and engineering design optimisation, it supports the coupled analysis of morphology generation and environmental performance simulation. | More versatile and suitable for traditional engineering fields such as mechanical and aerospace, but needs to be customised to suit construction needs. |
| Time | Bedroom | Living Room | Kitchen | Toilet | Ancillary Rooms |
|---|---|---|---|---|---|
| 00:00 | 1.0 | 0.0 | 0.0 | 0.0 | 0.0 |
| 01:00 | 1.0 | 0.0 | 0.0 | 0.0 | 0.0 |
| 02:00 | 1.0 | 0.0 | 0.0 | 0.0 | 0.0 |
| 03:00 | 1.0 | 0.0 | 0.0 | 0.0 | 0.0 |
| …… | …… | …… | …… | …… | …… |
| 21:00 | 0.5 | 0.5 | 0.0 | 0.5 | 0.1 |
| 22:00 | 1.0 | 0.0 | 0.0 | 0.1 | 0.1 |
| 23:00 | 1.0 | 0.0 | 0.0 | 0.0 | 0.0 |
| 24:00 | 1.0 | 0.0 | 0.0 | 0.0 | 0.0 |
| Optimisation Platforms | Rhino-Grasshopper and Wallacei | ||
|---|---|---|---|
| Optimisation goals | Building energy consumption | Indoor thermal comfort | Indoor Lighting |
| Optimisation of target indicators | EUI | PPD | UDI |
| No. | Parametric | Starting Value | Range of Values |
|---|---|---|---|
| 1 | Shading overhang dimensions | 0.11 m | 0.3–1.5 m |
| 2 | Shading element light transmittance | 0.62 | 0–1 |
| 3 | Reflectivity of internal walls | 0.10 | 0–1 |
| Ceiling reflectivity | 0.5 | 0–1 | |
| Ground reflectivity | 0.8 | 0–1 | |
| 4 | Internal wall thickness | 0.17 m | 0.1–0.4 m |
| 5 | Floor thermal resistance | 3.0 m2·K/W | 0.7–6 m2·K/W |
| 6 | Window thermal transmittance coefficient | 0.9 (W/m2·K) | 0–2.5 (W/m2·K) |
| 7 | Glazing solar heat gain coefficient | 1.0 | 0–1 |
| 8 | Wall database | - | - |
| Parameter Name | Set Value |
|---|---|
| Population Size | 20 |
| Generation count | 50 |
| Crossover probability | 0.8 |
| Mutation probability | 1/r |
| Crossover distribution index | 20 |
| Mutation distribution index | 20 |
| Random seed | 1 |
| Parametric | p-Value | Parametric | p-Value |
|---|---|---|---|
| Shading overhang dimensions | 1.74 × 10⁻¹⁴ | Internal wall thickness | 5.56 × 10⁻¹⁰ |
| Shading element light transmittance | 2.28 × 10⁻²⁴ | Floor thermal resistance | 5.32 × 10⁻¹⁹ |
| Reflectivity of internal walls | 2.08 × 10⁻¹⁵ | Window thermal transmittance coefficient | 1.23 × 10⁻¹⁴ |
| Ceiling reflectivity | 1.92 × 10⁻¹³ | Glazing solar heat gain coefficient | 2.53 × 10⁻¹⁴ |
| Ground reflectivity | 6.1 × 10⁻¹⁹ | - | - |
| Parametric | Permutation Importance Method | Gradient Boosting Trees |
|---|---|---|
| Shading overhang dimensions | 0.313 (± 0.164) | 0.2569 |
| Shading element light transmittance | 0.056 (± 0.024) | 0.0782 |
| Reflectivity of internal walls | 0.126 (± 0.047) | 0.1018 |
| Ceiling reflectivity | −0.026 (± 0.020) | 0.0182 |
| Ground reflectivity | 0.026 (± 0.013) | 0.0243 |
| Internal wall thickness | 0.280 (± 0.045) | 0.2249 |
| Floor thermal resistance | 0.339 (± 0.101) | 0.3253 |
| Window thermal transmittance coefficient | 0.025 (± 0.015) | 0.0284 |
| Glazing solar heat gain coefficient | 0.013 (± 0.009) | 0.0112 |
| Parametric | Permutation Importance Method | Gradient Boosting Trees |
|---|---|---|
| Shading overhang dimensions | 0.192 (±0.087) | 0.1908 |
| Shading element light transmittance | 0.120 (±0.044) | 0.0120 |
| Reflectivity of internal walls | 0.041 (±0.039) | 0.0773 |
| Ceiling reflectivity | 0.003 (±0.023) | 0.0255 |
| Ground reflectivity | 0.078 (±0.018) | 0.0792 |
| Internal wall thickness | 0.135 (±0.039) | 0.0788 |
| Floor thermal resistance | 0.216 (±0.111) | 0.2154 |
| Window thermal transmittance coefficient | 0.383 (±0.023) | 0.4071 |
| Glazing solar heat gain coefficient | 0.030 (±0.020) | 0.0334 |
| Parametric | Permutation Importance Method | Gradient Boosting Trees |
|---|---|---|
| Shading overhang dimensions | 0.125 (±0.0023) | 0.1073 |
| Shading element light transmittance | 0.235 (±0.018) | 0.1453 |
| Reflectivity of internal walls | 1.120 (±0.011) | 0.8708 |
| Ceiling reflectivity | 0.033 (±0.001) | 0.0013 |
| Ground reflectivity | 0.0002 (±0) | 0.00006 |
| Internal wall thickness | 0.045 (±0.003) | 0.0026 |
| Floor thermal resistance | 0.001 (±0.001) | 0.0010 |
| Window thermal transmittance coefficient | 0.0005 (±0) | 0.0002 |
| Glazing solar heat gain coefficient | 0.0008 (±0) | 0.0005 |
| Classification | Composition | Thermal Conductivity Thermal Resistance (m2·K/W) | Thermal Inertness Index | Heat Transfer Coefficient [W/(m2·K)] |
|---|---|---|---|---|
| Roof | Cement mortar 2 mm + asphalt felt 6 mm + cement mortar 40 mm + extruded polystyrene board 75 mm + clay ceramsite concrete 200 mm | 2.727 | 4.068 | 0.347 |
| Floor | Cement mortar 25 mm + reinforced concrete 80 mm + cement mortar 20 mm | 0.098 | 1.262 | 3.054 |
| External wall | Cement mortar 10 mm + extruded polystyrene board 60 mm + shale multi-hollow brick 240 mm + lime cement mortar 20 mm | 2.332 | 0.402 | 4.245 |
| Classification | Name | Heat Transfer Coefficient [W/ (m2·K)] | Visible Light Transmittance |
|---|---|---|---|
| Window | Aluminium alloy-70 series flat window (5 + 12A + 5Low-E) | 1.9 | 0.8 |
| Gate | Single-layer solid wooden outer door | 1.972 | - |
| Type of Energy Consumption | Heating Load | Cooling Load | Lighting Load | Equipment Load |
|---|---|---|---|---|
| EUI (kWh/m2) | 186.622 | 7.086 | 14.672 | 18.07 |
| Percentage | 82.41% | 3.13% | 6.48% | 7.98% |
| Months | January | February | March | April | May | June |
| Percentage | 20.70% | 15.59% | 11.45% | 4.72% | 2.44% | 2.28% |
| Months | July | August | September | October | November | December |
| Percentage | 2.39% | 1.20% | 1.59% | 6.10% | 12.85% | 18.69% |
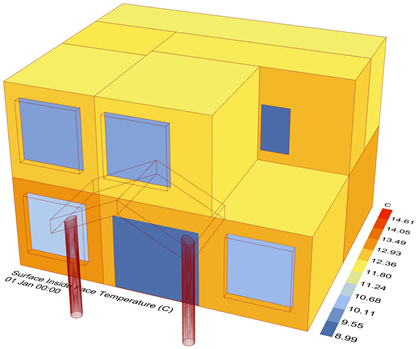
| Indoor Space Temperature | Outer Surface Temperature of Building | PPD |
|---|---|---|
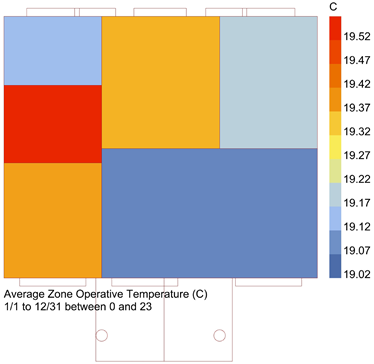 | 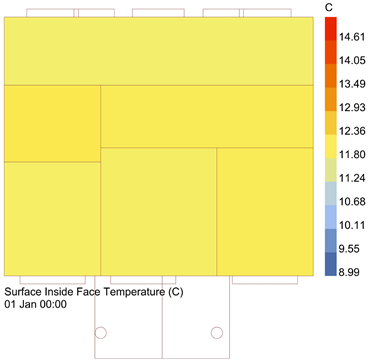 | 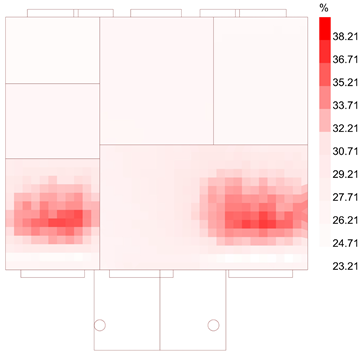 |
 |  | 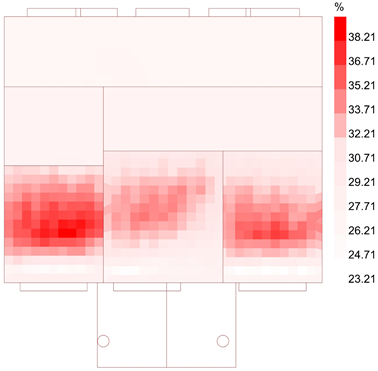 |
| Objectives | Starting Value | Single Best Value | Optimisation Rate |
|---|---|---|---|
| EUI (kWh/m2) | 226.449 | 129.406 | 42.85 |
| PPD (%) | 27.828 | 21.178 | 23.90 |
| UDI (%) | 48.770 | 63.747 | 30.71 |
| Performance Ranking Optimum | EUI (kWh/m2) | PPD (%) | UDI (%) | Diamond Radar Chart |
|---|---|---|---|---|
| Optimal building energy consumption | 129.406 | 39.659 | 57.884 | 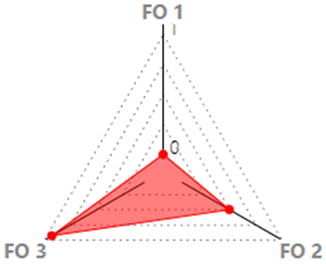 |
| Optimal indoor thermal comfort | 206.831 | 25.152 | 63.747 |  |
| Optimal Useful Daylight Illuminance | 177.913 | 21.178 | 48.504 | 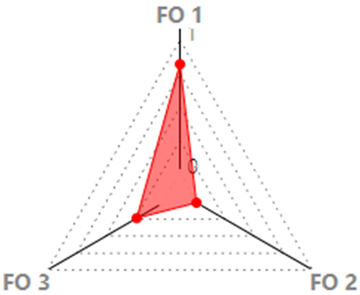 |
| Programmes with the highest average ranking | 175.348 | 22.467 | 61.178 |  |
| Objectives | Starting Value | Integrated Optimal Value | Optimisation Rate |
|---|---|---|---|
| EUI (kWh/m2) | 226.449 | 175.348 | 22.56 |
| PPD (%) | 27.828 | 22.467 | 19.26 |
| UDI (%) | 48.770 | 61.178 | 25.44 |
| Objectives | Starting Value | Integrated Optimal Value | Optimisation Rate |
|---|---|---|---|
| Heating | 186.622 | 138.95 | 25.54% |
| Air Conditioning | 7.086 | 3.657 | 48.39% |
| Lighting | 14.672 | 14.669 | 0 |
| Equipment | 18.07 | 18.07 | 0 |
| No. | Parametric | Optimal Value |
|---|---|---|
| 1 | Shading overhang dimensions | 0.10 |
| 2 | Shading element light transmittance | 0.90 |
| 3 | Reflectivity of internal walls | 0.10 |
| Ceiling reflectivity | 0.20 | |
| Ground reflectivity | 0.20 | |
| 4 | Internal wall thickness | 0.19 |
| 5 | Floor thermal resistance | 0.7 |
| 6 | Window thermal transmittance coefficient | 1.3 |
| 7 | Glazing solar heat gain coefficient | 0.6 |
| 8 | Wall database | 254 |
| No. | Composition | Heat Transfer Coefficient [W/ (m2·K)] |
|---|---|---|
| No. 254 | 1.10 mm exterior finish 2.90 mm extruded polystyrene sheet 3.240 mm shale ceramic concrete 4.20 mm internal plaster on external wall | 0.326 |
| Comparison Dimension | This Study in Inner Mongolia | Zalantun Case [34] | Northwest Territories Cases [2] | TianJin Case [35] | Xuzhou Case [36] |
|---|---|---|---|---|---|
| Climate zone | Severely Cold Zone | Severely Cold Zone | Cold Zone | Cold Zone | Summer Hot and Winter Cold Zone |
| Optimisation goals | Energy consumption, Indoor thermal comfort, Indoor Lighting | Energy consumption, Costs | Energy consumption, Indoor thermal comfort, Costs | Energy consumption, Indoor thermal comfort | Indoor thermal comfort, Carbon emission, Costs |
| Core algorithm | NSGA-II (Wallacei) | NSGA-II (MOBO) | NSGA-II (MOBO) | SPEA-2, HypE | Krill Herd Algorithm |
| Core variables | Enclosure, Form | Enclosure insulation | Orientation, External windows, Insulation | Architectural form | Window–wall ratio, Heat transfer coefficient |
| Energy saving rate increase | 22.56% | 34.1~72.0% | 54% | 22.8% | Reduced by 55.84 kWh/m2 |
| Range of cost increments | Small increase | 92.3–645.5 CNY/m2 | 182.4 CNY/m2 | - | - |
| Thermal comfort improvement | PPD decreased by 19.26% | - | APDD increased by 57.6% | Reduction in the number of hours of thermal discomfort by 8.8% | APD decreased by 25% |
Disclaimer/Publisher’s Note: The statements, opinions and data contained in all publications are solely those of the individual author(s) and contributor(s) and not of MDPI and/or the editor(s). MDPI and/or the editor(s) disclaim responsibility for any injury to people or property resulting from any ideas, methods, instructions or products referred to in the content. |
© 2025 by the authors. Licensee MDPI, Basel, Switzerland. This article is an open access article distributed under the terms and conditions of the Creative Commons Attribution (CC BY) license (https://creativecommons.org/licenses/by/4.0/).
Share and Cite
Zou, D.; Sun, C.; Gao, D. Multi-Objective Optimization-Driven Research on Rural Residential Building Design in Inner Mongolia Region. Energies 2025, 18, 1867. https://doi.org/10.3390/en18071867
Zou D, Sun C, Gao D. Multi-Objective Optimization-Driven Research on Rural Residential Building Design in Inner Mongolia Region. Energies. 2025; 18(7):1867. https://doi.org/10.3390/en18071867
Chicago/Turabian StyleZou, Dezhi, Cheng Sun, and Denghui Gao. 2025. "Multi-Objective Optimization-Driven Research on Rural Residential Building Design in Inner Mongolia Region" Energies 18, no. 7: 1867. https://doi.org/10.3390/en18071867
APA StyleZou, D., Sun, C., & Gao, D. (2025). Multi-Objective Optimization-Driven Research on Rural Residential Building Design in Inner Mongolia Region. Energies, 18(7), 1867. https://doi.org/10.3390/en18071867